speaking clearly for children with learning disabilities ... · speaking clearly for children with...
TRANSCRIPT
80 Journal of Speech, Language, and Hearing Research • Vol. 46 • 80–97 • February 2003Journal of Speech, Language, and Hearing Research • Vol. 46 • 80–97 • February 2003 • ©American Speech-Language-Hearing Association1092-4388/03/4601-0080
Ann R. BradlowNina KrausErin Hayes
Northwestern UniversityEvanston, IL
Speaking Clearly for ChildrenWith Learning Disabilities:Sentence Perception in Noise
This study compared the speech-in-noise perception abilities of children with andwithout diagnosed learning disabilities (LDs) and investigated whether naturallyproduced clear speech yields perception benefits for these children. A group ofchildren with LDs (n = 63) and a control group of children without LDs (n = 36)were presented with simple English sentences embedded in noise. Factors thatvaried within participants were speaking style (conversational vs. clear) andsignal-to-noise ratio (–4 dB vs. –8 dB); talker (male vs. female) varied betweenparticipants. Results indicated that the group of children with LDs had pooreroverall sentence-in-noise perception than the control group. Furthermore, bothgroups had poorer speech perception with decreasing signal-to-noise ratio;however, the children with LDs were more adversely affected by a decreasingsignal-to-noise ratio than the control group. Both groups benefited substantiallyfrom naturally produced clear speech, and for both groups, the female talkerevoked a larger clear speech benefit than the male talker. The clear speech benefitwas consistent across groups; required no listener training; and, for a largeproportion of the children with LDs, was sufficient to bring their performancewithin the range of the control group with conversational speech. Moreover, anacoustic comparison of conversational-to-clear speech modifications across thetwo talkers provided insight into the acoustic–phonetic features of naturallyproduced clear speech that are most important for promoting intelligibility for thispopulation.
KEY WORDS: clear speech production, clear speech perception, children withlearning disabilities, speech perception in noise, speech intelligibility
In order to improve speech intelligibility under adverse conditions, itmay be more effective to modify the talker’s speech production thanto modify either the listener’s speech perception or the acoustic proper-
ties of the speech signal (Picheny, Durlach, & Braida, 1985). This talker-based approach to speech intelligibility improvement may be particularlyeffective when multiple performance degrading factors are present, suchas when the listening environment is noisy and the listener has a speechperception deficit. The overall goal of the present study was to pursuethis approach to speech intelligibility enhancement for a broadly definedgroup of school-age children who were experiencing difficulties with theiracademic performance. In addition to providing basic information aboutthe efficacy of this talker-based approach to speech perception enhance-ment for this population, a further goal of this study was to identify thespecific acoustic–phonetic enhancements that were most beneficial forspeech perception in this population. This information has the potential
Bradlow et al.: Speaking Clearly for Children With Learning Disabilities 81
to contribute to the ongoing characterization of thespeech perception deficits that may be related to theproblems that interfere with the academic performanceof some individuals in this population.
The literature on the speech perception abilities ofchildren with language, learning, and reading disordersis diffuse in terms of the specific participant inclusioncriteria applied across studies; however, a common find-ing of this research is that a subset of the children withimpairments, regardless of the specific diagnostic cat-egory, show speech perception deficits relative to theirpeers without impairments (e.g., Bradlow et al., 1999;Elliott, Hammer, & Scholl, 1989; Kraus et al., 1996;Mody, Studdert-Kennedy, & Brady, 1997; Reed, 1989;Stark & Heinz, 1996; Sussman, 1993; Tallal & Piercy,1974). Thus, a speech perception deficit seems to be acommon characteristic across a wide range of diagnoses,even though the overall profiles of the various partici-pant populations may be quite different. In particular,individuals in this broadly defined group of children withlearning disabilities (LDs) often exhibit particular diffi-culty discriminating between speech sounds whoseacoustic–phonetic properties are very similar (seeBradlow et al., 1999, for a summary). Nevertheless, themechanism that underlies the observed perceptual defi-cit and the consequences of this deficit for continuousspeech perception have yet to be fully described.
A separate line of research has demonstrated thatlisteners with speech perception deficits are dispropor-tionately affected by degraded speech signals relativeto listeners without speech perception deficits. For ex-ample, Kenyon, Leidenheim, and Zwillenberg (1998)compared performance on a speech discrimination testin noise and in quiet for listeners without hearing im-pairments and listeners with at least a 50-dB loss above3000 Hz. They found a 33% and 5% decrease in percep-tion in noise (relative to quiet) for the listeners with andwithout hearing impairments, respectively. Similarly,several studies have shown that non-native listenersshow a sharper decline than native listeners in perfor-mance on speech perception tasks with increasing lev-els of signal distortion, either through the addition ofmore background noise or reverberation (e.g., Mayo,Florentine, & Buus, 1997; Meador, Flege, & MacKay,2000; Nábèlek & Donahue, 1984). These studies provideevidence that various signal distortions, including back-ground noise and reverberation, present particular dif-ficulty for listeners with speech perception problems,including listeners with impaired hearing and from dif-ferent language backgrounds. On the basis of these find-ings, we may expect that children with LDs who exhibitspeech perception difficulties relative to their peers with-out LDs will show patterns of speech perception in quietand in noise similar to those of other populations withspeech perception difficulties. Indeed, it is commonly
believed—and there is much supporting anecdotal evi-dence—that children with problems that interfere withacademic achievement in mainstream school settings(including language, learning, or reading disorders) haveparticular difficulty with speech perception under thenoisy listening conditions that are often encountered ina typical classroom. However, few studies have directlyaddressed this issue, and studies using sentence-lengthutterances and school-age participants are especiallyrare.
Chermak, Vonhof, and Bendel (1989) found thatadults with LDs had poorer word identification in noisethan a control group of adults without LDs. These au-thors also found that both the control group and thegroup of listeners with LDs had greater difficulty whenthe target words were masked by speech spectrum noisethan when they were masked by competing linguisticstrings; however, this masker-dependent decline in per-formance was greater for the adults with LDs than forthe controls.
In a study with Dutch-speaking participants usingmeaningful Dutch sentences, Stollman, Kapteyn, andSleeswijk (1994) found that the speech recognitionthresholds in noise for children with impaired hearingand for children with impaired language abilities weresignificantly higher than for children and adults with-out hearing or language impairments. These authorsalso manipulated the time scale of their stimuli by ex-panding or compressing the recorded speech materials.They found that as the time-scale factor increased (i.e.,as the speech was more compressed in time) the differ-ence in speech reception threshold in noise between theparticipant groups increased; most notably, the perfor-mance of the children with either hearing or languageimpairments declined more sharply than that of theadults and children in the control group.
Finally, Elliot et al. (1979) found that children withLDs generally required a higher signal intensity thanchildren without LDs in order to reach equivalent lev-els of performance on a monosyllabic word identifica-tion task. Furthermore, although both the control anddisabled groups in this study showed greater difficultyfor word recognition with an open-set response formatrelative to a closed-set response format, this decline inperformance across response formats was greater for thechildren with LDs than for the children in the controlgroup. However, contrary to the patterns shown in otherstudies (e.g., Chermak et al., 1989; Stollman et al., 1994),Elliot and colleagues did not find that the children withlanguage and learning impairments were more ad-versely affected by noise than the children in the con-trol group; rather, both groups showed similar perfor-mance decrements in noise relative to in quiet. Takentogether, the findings from these studies indicate that
82 Journal of Speech, Language, and Hearing Research • Vol. 46 • 80–97 • February 2003
factors that introduce difficulty into speech perceptiontasks, such as background noise, time compression, orresponse set size, generally have a greater effect on par-ticipants with impairments than on control participantswithout impairments.
The first specific goal of the present study was todirectly investigate the abilities of children with LDsand of a control group of children without LDs to per-ceive sentence-length utterances when presented in dif-fering levels of noise. The rationale behind the focus onsentence-length materials was based on the fact thatthe cognitive and linguistic processes involved in theperception of words in sentence context are quite differ-ent from those involved in the perception of isolatedwords, because of the availability of syntactic, seman-tic, and pragmatic information, which is not availablefrom isolated syllables or words. The intelligibility ad-vantage of words in sentences over words in isolationwhen presented in a noisy environment was originallydemonstrated by Miller, Heise, and Lichten (1951) whointerpreted this result as arising from the fact that ac-cess to the contextual information provided by the sen-tence helps the listener by narrowing the response al-ternatives. This finding was replicated by O’Neill (1957)using different test materials and a larger group of lis-teners and has since been widely acknowledged in theliterature on speech intelligibility for both humans (withor without speech and hearing impairments) and ma-chines (cf. Pisoni, 1997; Pisoni, Nusbaum, & Greene,1985; Weismer & Martin, 1992).
Furthermore, there is some evidence that childrenwith reading disabilities rely on contextual informationmore than do peers without impaired reading abilities.For example, using the experimental paradigm devel-oped by Ganong (1980), which assesses a listener’s biastoward a real-word rather than a nonsense-word re-sponse in a phoneme identification task, Reed (1989)showed that children with a reading disability allowedtheir knowledge of English words to influence their pho-neme identification functions to a greater extent thanchildren without reading disabilities. This result sug-gests that children with reading disabilities may developspoken language processing strategies that compensatefor their perceptual difficulties. Therefore, one mightsuspect that the speech perception difficulties in re-sponse to syllable- or word-sized stimuli exhibited bysome children with language, learning, or reading dis-abilities may be attenuated when the children are testedwith longer utterances where more contextual informa-tion is available. The results of Stollman et al. (1994)indicate that, contrary to this prediction, the sentence-in-noise perception abilities of Dutch-speaking childrenwith either hearing or language impairments were poorrelative to controls, suggesting that perhaps the chil-dren with impairments had greater difficulty with the
memory-intensive task of sentence perception than theirpeers without impairments. We sought to replicate thisfinding with English-speaking children and to extend itby investigating whether some of the speech perceptiondifficulties experienced by children with LDs could beovercome by naturally produced “clear” speech.
Several previous studies have shown that speechproduced with an intentionally clear speaking styleyields significant intelligibility improvements relativeto conversational speech perception for adult listenerswith impaired hearing and for adults without hearingimpairments in quiet (Picheny, Durlach, & Braida, 1985),as well as in noise and reverberation (Payton, Uchanski,& Braida, 1994; Uchanski, 1988). The “clear speech ef-fect” (i.e., the intelligibility advantage of clear speechover conversational speech as measured in percentageof key words correctly recognized) for these listeners isstable across studies at approximately 17–20 percent-age points. These researchers have also identified sev-eral acoustic–phonetic markers of clear speech, includ-ing decreased speaking rate, vowel space expansion,increased frequency of word final stop releasing, andincreased obstruent root mean square intensities(Picheney, Durlach, & Braida, 1986). Importantly, thesestudies have shown that it is the combination of mul-tiple clear speech modifications that is responsible forthe large clear speech intelligibility benefit. In particu-lar, a series of studies on the individual contribution ofthe decreased speaking rate to the enhanced intelligi-bility of clear speech production has shown that the ratemanipulation on its own is not sufficient to provide theintelligibility gain of clear speech (Krause, 2001;Picheney, Durlach, & Braida, 1989; Uchanski et al.,1996). Moreover, related work on lexical learning in chil-dren with specific language impairments has shown thatinput manipulations, such as naturally produced varia-tions in speaking rate and prosody, which typically in-volve modifications to multiple acoustic–phonetic param-eters, can have a positive influence on the ability ofchildren with specific language impairments to producenovel words (Ellis Weismer & Hesketh, 1996, 1998).Given recent interest in the use of digital enhancementtechniques in speech and language training proceduresfor children with LDs (e.g., Merzenich et al., 1996; Tallalet al., 1996), we wanted to investigate whether natu-rally produced clear speech with its multitude of acous-tic–phonetic modifications that extend across an entireutterance would yield significant perception benefits forthis population.
If children with LDs do perform better with clearthan conversational speech, then detailed acousticanalyses of the naturally produced conversational-to-clear speech transformation could provide valuable in-formation about the underlying perceptual deficit byhighlighting specific acoustic–phonetic features of the
Bradlow et al.: Speaking Clearly for Children With Learning Disabilities 83
signal that are spontaneously enhanced by this listener-oriented, stylistic variation in speech production. Sub-sequent parametric studies that investigate the percep-tual benefit of individual enhancement strategies couldhelp isolate acoustic characteristics that are problem-atic for connected speech perception by this population,and that should be the target of intervention strate-gies. Moreover, if naturally produced clear speech is aneffective means of improving the speech perception bythis population, then it may be worthwhile for teach-ers, parents, clinicians, and other caregivers who comeinto frequent contact with children with LDs to moni-tor their own speech in an effort to adopt a clear speak-ing style on a routine basis. A necessary first step to-ward achieving these goals is to establish that theintelligibility advantage of clear speech is robust forthese listeners.
With these goals in mind, the present study wasdesigned to test two specific hypotheses. First, we hy-pothesized that children with clinically diagnosed LDswould perform worse than children without LDs on asentence-in-noise perception task. We wanted to per-form a carefully controlled laboratory study that spe-cifically looked at the perception of naturally produced,English sentence-length stimuli in noise so that wecould assess whether the speech perception deficits thatthese children often exhibit with syllable- and word-sized stimuli extends to longer utterances where morecontextual information is available to the listener. Wealso expected that children with LDs would be moreadversely affected by a decreasing signal-to-noise ratiothan children without LDs. Second, we hypothesizedthat children with and without LDs would all derivesubstantial benefit from the acoustic–phonetic cue en-hancements that characterize naturally produced clearspeech. Although we had no specific predictions regard-ing the relative sizes of the clear speech effects acrossthe two groups of children, our hope was that any sen-tence-in-noise deficit for the children with LDs whenpresented with conversational speech stimuli could beovercome when presented with clear speech stimuli, atleast to the extent that there would be no difference inperformance between the group of children with LDswith clear speech and the group of children without LDswith conversational speech. Such a result would indi-cate that the overt manifestations of the underlyingperceptual deficit can be overcome by the spontaneousarticulatory adjustments that talkers naturally makein response to compromised communicative settings.Although this result on its own would not provide con-clusive information regarding the nature of the under-lying deficit, it would provide information about thecommunication conditions that can promote more ac-curate spoken language processing by listeners withspeech perception deficits.
MethodParticipants
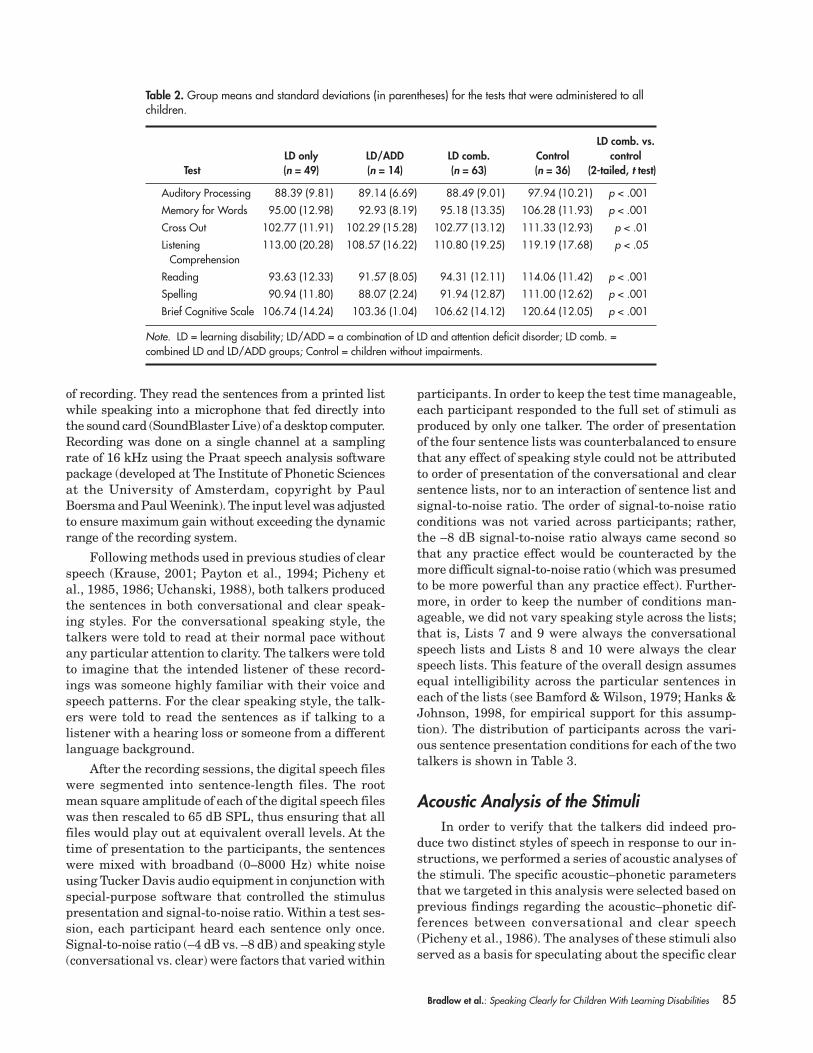
A group of 99 school-age children served as studyparticipants: 36 (15 girls and 21 boys) were classified ashaving normal development, and 63 (18 girls and 45boys) were classified as having an LD. All these chil-dren were enrolled in a comprehensive study of speechsound discrimination abilities, academic achievement,and neurophysiologic responses to speech stimuli in chil-dren with and without LDs—the “Listening, Learning,and the Brain” project—that is currently under way inthe Auditory Neuroscience Laboratory in the Depart-ment of Communication Sciences and Disorders atNorthwestern University. As part of this larger study, apsychoeducational test battery that focused on verbalabilities was administered to each child. This test bat-tery included portions of the Woodcock–Johnson Psycho-Educational Battery (Woodcock & Johnson, 1977), theWoodcock-Johnson Psycho-Educational Battery–Revised(Woodcock & Johnson, 1989), and the Wide RangeAchievement Test, 3rd edition (Wilkinson, 1993). Table1 lists the specific tests included in this study-internaltest battery. In addition, the children’s language devel-opment and academic achievement were assessed via adetailed parent questionnaire. For a child to be includedin the group of children without LDs—the controlgroup—there had to be no history of language, learn-ing, or attention problems, as indicated by responses onthe parent questionnaire, and the child had to scorewithin or above normal limits on the psychoeducationaltest battery. Prior to entry into the study, the childrenwith LDs had been formally clinically diagnosed as hav-ing an LD (n = 49) or a combination of LD and attentiondeficit disorder (n = 14). Furthermore, these participantsperformed worse than the control participants on thestudy-internal psychoeducational test battery. We referto the children in this group as “children with LDs,” orLD. Table 2 lists the group mean scores and standarddeviations for the psychoeducational tests that wereadministered to all children. As shown in this table, thescores from the group of children with LDs were all sig-nificantly lower (at the p < .05 level) than the scoresfrom the control group.
In addition to the tests shown in Table 1, the stan-dard test battery for all participants in the “Listening,Learning and the Brain” project includes a test of theparticipant’s ability to discriminate synthetic CV syl-lables along three /da/-/ga/ continua: the first consists ofa 40-ms formant transition period followed by a 60-mssteady state period; the second has a 10-ms release burstsuperimposed on the 40-ms transition period; and thethird is identical to the second but presented to the par-ticipants embedded in broad-band, white noise (for ad-ditional details, see Bradlow et al., 1999; Cunningham,
84 Journal of Speech, Language, and Hearing Research • Vol. 46 • 80–97 • February 2003
Nicol, Zecker, Bradlow, & Kraus, 2001; Kraus et al.,1996). Of the 99 participants in the present study, thegroup of children with LDs exhibited significantly higherdiscrimination thresholds than the control group whentested on all three continua,“burst-less” /da/-/ga/: t(97) =1.687, p = .047 (1-tailed); /da/-/ga/ with 10-ms burst inthe quiet: t(96) = 3.005, p < .005 (1-tailed); /da/-/ga/ with10-ms burst in noise: t(95) = 3.002, p < .005 (1-tailed).For the test with the enhanced continuum (with the 10-ms burst), 1 child from the control group was not avail-able for testing; for the test in noise, 1 child from each ofthe two groups was not available for testing.
The children were all also tested on their ability todiscriminate synthetic CV syllables along a stop-glidecontinuum going from /ba/ to /wa/. Stimuli in this con-tinuum consisted of a formant transition period followedby a steady state period, with no release burst. The du-ration of the formant transition period varied from 10to 40 ms. (For additional details, see Bradlow et al., 1999;Kraus et al., 1996.) Discrimination thresholds along thiscontinuum did not differ across the two groups of chil-dren, t(97) = .724, p = .155 (1-tailed), indicating that thegroup of children with LDs exhibited a selective speechperception deficit such that they had difficulty with aspectral contrast (i.e., /da/-/ga/) but not with a temporalcontrast (i.e., /ba/-/wa/). This establishes that the chil-dren with LDs had a stimulus-dependent speech per-ception deficit that was independent of a general cogni-tive deficit relative to the control group.
Across both groups, the age range was limited to8.1–12.5 years. For the group of children with LDs, themean age was 10.29 years (SD = 1.16 years); for the
control group the mean age was 10.43 years (SD = 1.32years.) All children had normal hearing (thresholds bet-ter than 20 dB HL for 500–8000 Hz) and intelligence(Brief Cognitive Scale scores no less than 85). Of the 63children with LDs, 21 had a history of a speech or lan-guage delay reported by the parent questionnaire, and9 were on medication for their learning problem at thetime of testing.
StimuliStimuli consisted of four sets of sentences from the
Revised Bamford-Kowal-Bench Standard Sentence Test.These sentences are slightly modified versions of theoriginal Bamford-Kowal-Bench (BKB) sentences thatwere developed for use with British children (Bench &Bamford, 1979). The revised set was developed by theCochlear Corporation for use with American children.The sentences are all simple declaratives with eitherthree or four key words. Each list of 16 sentences in-cludes 50 key words. For this study, 4 of the original 21sentence lists (Lists 7, 8, 9, and 10) were selected basedon their equivalent intelligibility scores for children with-out hearing impairments (Bamford & Wilson, 1979).These lists, with the key words underlined, are given inthe Appendix.
Two talkers (one man, age 33 years, and one woman,age 40 years) were recorded producing these sentences ina sound-treated booth in the phonetics laboratory in theDepartment of Linguistics at Northwestern University.Both were native talkers of General American Englishwith no known speech or hearing impairment at the time
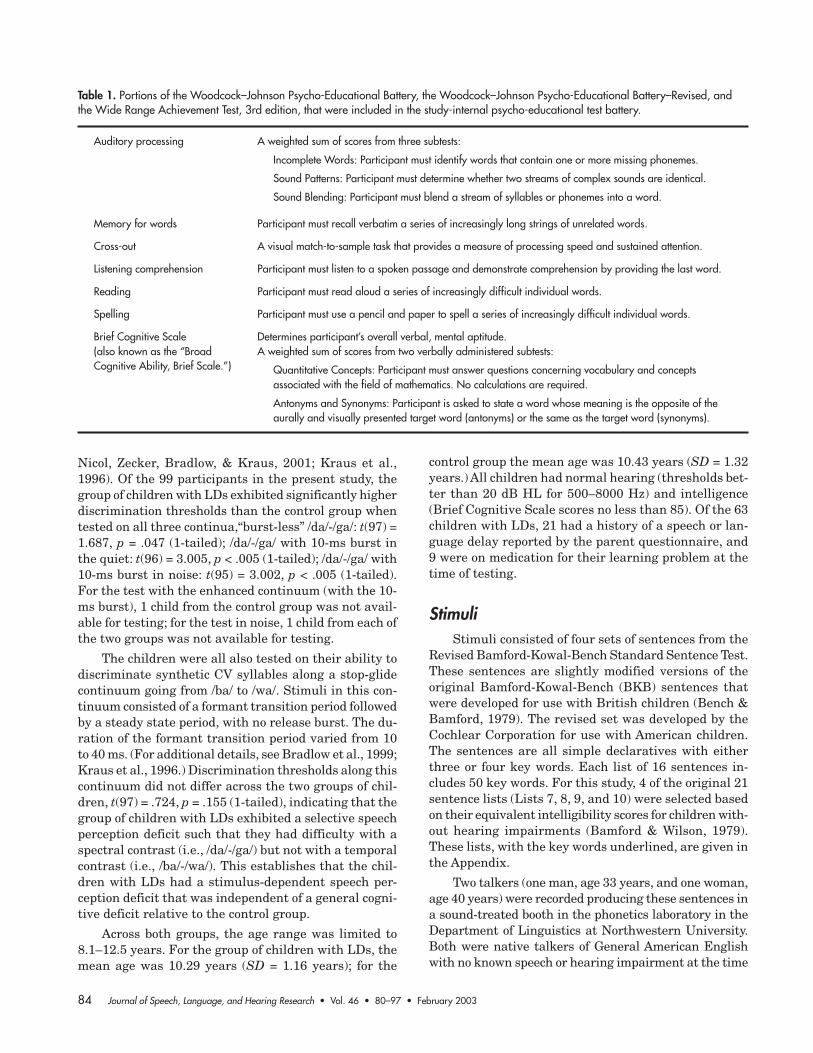
Table 1. Portions of the Woodcock–Johnson Psycho-Educational Battery, the Woodcock–Johnson Psycho-Educational Battery–Revised, andthe Wide Range Achievement Test, 3rd edition, that were included in the study-internal psycho-educational test battery.
Auditory processing A weighted sum of scores from three subtests:
Incomplete Words: Participant must identify words that contain one or more missing phonemes.
Sound Patterns: Participant must determine whether two streams of complex sounds are identical.
Sound Blending: Participant must blend a stream of syllables or phonemes into a word.
Memory for words Participant must recall verbatim a series of increasingly long strings of unrelated words.
Cross-out A visual match-to-sample task that provides a measure of processing speed and sustained attention.
Listening comprehension Participant must listen to a spoken passage and demonstrate comprehension by providing the last word.
Reading Participant must read aloud a series of increasingly difficult individual words.
Spelling Participant must use a pencil and paper to spell a series of increasingly difficult individual words.
Brief Cognitive Scale Determines participant’s overall verbal, mental aptitude.(also known as the “Broad A weighted sum of scores from two verbally administered subtests:Cognitive Ability, Brief Scale.”) Quantitative Concepts: Participant must answer questions concerning vocabulary and concepts
associated with the field of mathematics. No calculations are required.
Antonyms and Synonyms: Participant is asked to state a word whose meaning is the opposite of theaurally and visually presented target word (antonyms) or the same as the target word (synonyms).
Bradlow et al.: Speaking Clearly for Children With Learning Disabilities 85
of recording. They read the sentences from a printed listwhile speaking into a microphone that fed directly intothe sound card (SoundBlaster Live) of a desktop computer.Recording was done on a single channel at a samplingrate of 16 kHz using the Praat speech analysis softwarepackage (developed at The Institute of Phonetic Sciencesat the University of Amsterdam, copyright by PaulBoersma and Paul Weenink). The input level was adjustedto ensure maximum gain without exceeding the dynamicrange of the recording system.
Following methods used in previous studies of clearspeech (Krause, 2001; Payton et al., 1994; Picheny etal., 1985, 1986; Uchanski, 1988), both talkers producedthe sentences in both conversational and clear speak-ing styles. For the conversational speaking style, thetalkers were told to read at their normal pace withoutany particular attention to clarity. The talkers were toldto imagine that the intended listener of these record-ings was someone highly familiar with their voice andspeech patterns. For the clear speaking style, the talk-ers were told to read the sentences as if talking to alistener with a hearing loss or someone from a differentlanguage background.
After the recording sessions, the digital speech fileswere segmented into sentence-length files. The rootmean square amplitude of each of the digital speech fileswas then rescaled to 65 dB SPL, thus ensuring that allfiles would play out at equivalent overall levels. At thetime of presentation to the participants, the sentenceswere mixed with broadband (0–8000 Hz) white noiseusing Tucker Davis audio equipment in conjunction withspecial-purpose software that controlled the stimuluspresentation and signal-to-noise ratio. Within a test ses-sion, each participant heard each sentence only once.Signal-to-noise ratio (–4 dB vs. –8 dB) and speaking style(conversational vs. clear) were factors that varied within
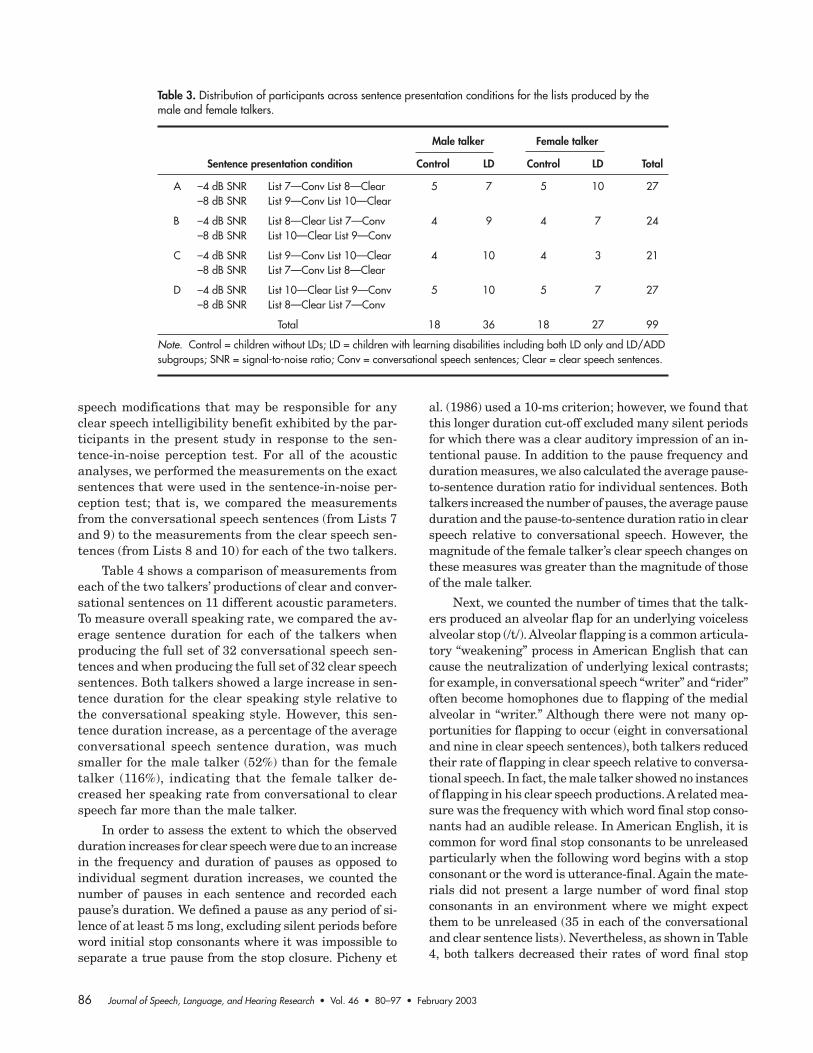
participants. In order to keep the test time manageable,each participant responded to the full set of stimuli asproduced by only one talker. The order of presentationof the four sentence lists was counterbalanced to ensurethat any effect of speaking style could not be attributedto order of presentation of the conversational and clearsentence lists, nor to an interaction of sentence list andsignal-to-noise ratio. The order of signal-to-noise ratioconditions was not varied across participants; rather,the –8 dB signal-to-noise ratio always came second sothat any practice effect would be counteracted by themore difficult signal-to-noise ratio (which was presumedto be more powerful than any practice effect). Further-more, in order to keep the number of conditions man-ageable, we did not vary speaking style across the lists;that is, Lists 7 and 9 were always the conversationalspeech lists and Lists 8 and 10 were always the clearspeech lists. This feature of the overall design assumesequal intelligibility across the particular sentences ineach of the lists (see Bamford & Wilson, 1979; Hanks &Johnson, 1998, for empirical support for this assump-tion). The distribution of participants across the vari-ous sentence presentation conditions for each of the twotalkers is shown in Table 3.
Acoustic Analysis of the StimuliIn order to verify that the talkers did indeed pro-
duce two distinct styles of speech in response to our in-structions, we performed a series of acoustic analyses ofthe stimuli. The specific acoustic–phonetic parametersthat we targeted in this analysis were selected based onprevious findings regarding the acoustic–phonetic dif-ferences between conversational and clear speech(Picheny et al., 1986). The analyses of these stimuli alsoserved as a basis for speculating about the specific clear
Table 2. Group means and standard deviations (in parentheses) for the tests that were administered to allchildren.
LD comb. vs.LD only LD/ADD LD comb. Control control
Test (n = 49) (n = 14) (n = 63) (n = 36) (2-tailed, t test)
Auditory Processing 88.39 (9.81) 89.14 (6.69) 88.49 (9.01) 97.94 (10.21) p < .001
Memory for Words 95.00 (12.98) 92.93 (8.19) 95.18 (13.35) 106.28 (11.93) p < .001
Cross Out 102.77 (11.91) 102.29 (15.28) 102.77 (13.12) 111.33 (12.93) p < .01
Listening 113.00 (20.28) 108.57 (16.22) 110.80 (19.25) 119.19 (17.68) p < .05Comprehension
Reading 93.63 (12.33) 91.57 (8.05) 94.31 (12.11) 114.06 (11.42) p < .001
Spelling 90.94 (11.80) 88.07 (2.24) 91.94 (12.87) 111.00 (12.62) p < .001
Brief Cognitive Scale 106.74 (14.24) 103.36 (1.04) 106.62 (14.12) 120.64 (12.05) p < .001
Note. LD = learning disability; LD/ADD = a combination of LD and attention deficit disorder; LD comb. =combined LD and LD/ADD groups; Control = children without impairments.
86 Journal of Speech, Language, and Hearing Research • Vol. 46 • 80–97 • February 2003
speech modifications that may be responsible for anyclear speech intelligibility benefit exhibited by the par-ticipants in the present study in response to the sen-tence-in-noise perception test. For all of the acousticanalyses, we performed the measurements on the exactsentences that were used in the sentence-in-noise per-ception test; that is, we compared the measurementsfrom the conversational speech sentences (from Lists 7and 9) to the measurements from the clear speech sen-tences (from Lists 8 and 10) for each of the two talkers.
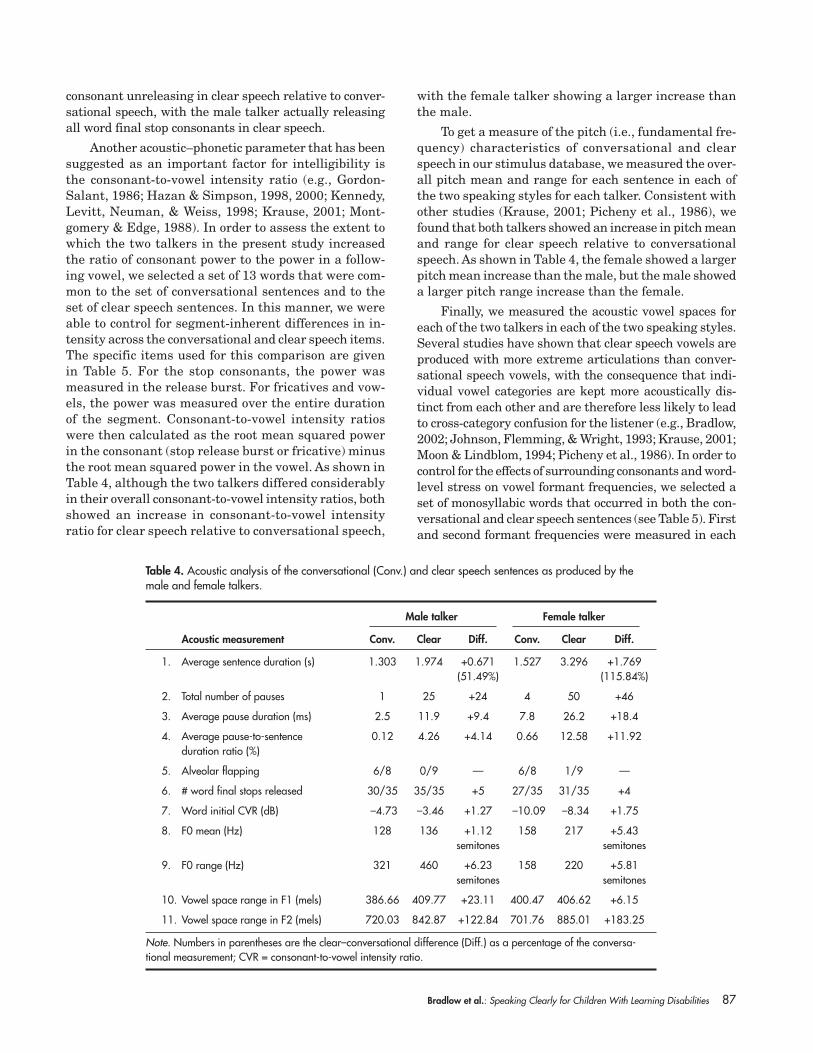
Table 4 shows a comparison of measurements fromeach of the two talkers’ productions of clear and conver-sational sentences on 11 different acoustic parameters.To measure overall speaking rate, we compared the av-erage sentence duration for each of the talkers whenproducing the full set of 32 conversational speech sen-tences and when producing the full set of 32 clear speechsentences. Both talkers showed a large increase in sen-tence duration for the clear speaking style relative tothe conversational speaking style. However, this sen-tence duration increase, as a percentage of the averageconversational speech sentence duration, was muchsmaller for the male talker (52%) than for the femaletalker (116%), indicating that the female talker de-creased her speaking rate from conversational to clearspeech far more than the male talker.
In order to assess the extent to which the observedduration increases for clear speech were due to an increasein the frequency and duration of pauses as opposed toindividual segment duration increases, we counted thenumber of pauses in each sentence and recorded eachpause’s duration. We defined a pause as any period of si-lence of at least 5 ms long, excluding silent periods beforeword initial stop consonants where it was impossible toseparate a true pause from the stop closure. Picheny et
al. (1986) used a 10-ms criterion; however, we found thatthis longer duration cut-off excluded many silent periodsfor which there was a clear auditory impression of an in-tentional pause. In addition to the pause frequency andduration measures, we also calculated the average pause-to-sentence duration ratio for individual sentences. Bothtalkers increased the number of pauses, the average pauseduration and the pause-to-sentence duration ratio in clearspeech relative to conversational speech. However, themagnitude of the female talker’s clear speech changes onthese measures was greater than the magnitude of thoseof the male talker.
Next, we counted the number of times that the talk-ers produced an alveolar flap for an underlying voicelessalveolar stop (/t/). Alveolar flapping is a common articula-tory “weakening” process in American English that cancause the neutralization of underlying lexical contrasts;for example, in conversational speech “writer” and “rider”often become homophones due to flapping of the medialalveolar in “writer.” Although there were not many op-portunities for flapping to occur (eight in conversationaland nine in clear speech sentences), both talkers reducedtheir rate of flapping in clear speech relative to conversa-tional speech. In fact, the male talker showed no instancesof flapping in his clear speech productions. A related mea-sure was the frequency with which word final stop conso-nants had an audible release. In American English, it iscommon for word final stop consonants to be unreleasedparticularly when the following word begins with a stopconsonant or the word is utterance-final. Again the mate-rials did not present a large number of word final stopconsonants in an environment where we might expectthem to be unreleased (35 in each of the conversationaland clear sentence lists). Nevertheless, as shown in Table4, both talkers decreased their rates of word final stop
Table 3. Distribution of participants across sentence presentation conditions for the lists produced by themale and female talkers.
Male talker Female talker
Sentence presentation condition Control LD Control LD Total
A –4 dB SNR List 7—Conv List 8—Clear 5 7 5 10 27–8 dB SNR List 9—Conv List 10—Clear
B –4 dB SNR List 8—Clear List 7—Conv 4 9 4 7 24–8 dB SNR List 10—Clear List 9—Conv
C –4 dB SNR List 9—Conv List 10—Clear 4 10 4 3 21–8 dB SNR List 7—Conv List 8—Clear
D –4 dB SNR List 10—Clear List 9—Conv 5 10 5 7 27–8 dB SNR List 8—Clear List 7—Conv
Total 18 36 18 27 99
Note. Control = children without LDs; LD = children with learning disabilities including both LD only and LD/ADDsubgroups; SNR = signal-to-noise ratio; Conv = conversational speech sentences; Clear = clear speech sentences.
Bradlow et al.: Speaking Clearly for Children With Learning Disabilities 87
consonant unreleasing in clear speech relative to conver-sational speech, with the male talker actually releasingall word final stop consonants in clear speech.
Another acoustic–phonetic parameter that has beensuggested as an important factor for intelligibility isthe consonant-to-vowel intensity ratio (e.g., Gordon-Salant, 1986; Hazan & Simpson, 1998, 2000; Kennedy,Levitt, Neuman, & Weiss, 1998; Krause, 2001; Mont-gomery & Edge, 1988). In order to assess the extent towhich the two talkers in the present study increasedthe ratio of consonant power to the power in a follow-ing vowel, we selected a set of 13 words that were com-mon to the set of conversational sentences and to theset of clear speech sentences. In this manner, we wereable to control for segment-inherent differences in in-tensity across the conversational and clear speech items.The specific items used for this comparison are givenin Table 5. For the stop consonants, the power wasmeasured in the release burst. For fricatives and vow-els, the power was measured over the entire durationof the segment. Consonant-to-vowel intensity ratioswere then calculated as the root mean squared powerin the consonant (stop release burst or fricative) minusthe root mean squared power in the vowel. As shown inTable 4, although the two talkers differed considerablyin their overall consonant-to-vowel intensity ratios, bothshowed an increase in consonant-to-vowel intensityratio for clear speech relative to conversational speech,
with the female talker showing a larger increase thanthe male.
To get a measure of the pitch (i.e., fundamental fre-quency) characteristics of conversational and clearspeech in our stimulus database, we measured the over-all pitch mean and range for each sentence in each ofthe two speaking styles for each talker. Consistent withother studies (Krause, 2001; Picheny et al., 1986), wefound that both talkers showed an increase in pitch meanand range for clear speech relative to conversationalspeech. As shown in Table 4, the female showed a largerpitch mean increase than the male, but the male showeda larger pitch range increase than the female.
Finally, we measured the acoustic vowel spaces foreach of the two talkers in each of the two speaking styles.Several studies have shown that clear speech vowels areproduced with more extreme articulations than conver-sational speech vowels, with the consequence that indi-vidual vowel categories are kept more acoustically dis-tinct from each other and are therefore less likely to leadto cross-category confusion for the listener (e.g., Bradlow,2002; Johnson, Flemming, & Wright, 1993; Krause, 2001;Moon & Lindblom, 1994; Picheny et al., 1986). In order tocontrol for the effects of surrounding consonants and word-level stress on vowel formant frequencies, we selected aset of monosyllabic words that occurred in both the con-versational and clear speech sentences (see Table 5). Firstand second formant frequencies were measured in each
Table 4. Acoustic analysis of the conversational (Conv.) and clear speech sentences as produced by themale and female talkers.
Male talker Female talker
Acoustic measurement Conv. Clear Diff. Conv. Clear Diff.
1. Average sentence duration (s) 1.303 1.974 +0.671 1.527 3.296 +1.769(51.49%) (115.84%)
2. Total number of pauses 1 25 +24 4 50 +46
3. Average pause duration (ms) 2.5 11.9 +9.4 7.8 26.2 +18.4
4. Average pause-to-sentence 0.12 4.26 +4.14 0.66 12.58 +11.92duration ratio (%)
5. Alveolar flapping 6/8 0/9 — 6/8 1/9 —
6. # word final stops released 30/35 35/35 +5 27/35 31/35 +4
7. Word initial CVR (dB) –4.73 –3.46 +1.27 –10.09 –8.34 +1.75
8. F0 mean (Hz) 128 136 +1.12 158 217 +5.43semitones semitones
9. F0 range (Hz) 321 460 +6.23 158 220 +5.81semitones semitones
10. Vowel space range in F1 (mels) 386.66 409.77 +23.11 400.47 406.62 +6.15
11. Vowel space range in F2 (mels) 720.03 842.87 +122.84 701.76 885.01 +183.25
Note. Numbers in parentheses are the clear–conversational difference (Diff.) as a percentage of the conversa-tional measurement; CVR = consonant-to-vowel intensity ratio.
88 Journal of Speech, Language, and Hearing Research • Vol. 46 • 80–97 • February 2003
of these words. These measurements were converted fromthe Hertz scale to the perceptually motivated mel scale(Fant, 1973) according to the following equation: M =(1000/log 2)log[(F/1000) + 1], where M and F are the fre-quencies in mels and Hertz, respectively. We then calcu-lated the range in F1 and F2 covered by these vowels foreach talker in each style. As shown in Table 4, both talk-ers increased both F1 and F2 range for the clear relativeto the conversational speech vowel spaces. Both talkersalso showed larger proportional increases in F2 range thanin F1 range. Although the female talker showed a largerclear speech increase in F2 range than the male talker,the opposite pattern was observed for the increase in F1range (the male’s clear speech increase in the F1 dimen-sion was larger than the female’s). Nevertheless, giventhe greater clear speech vowel space expansion in the F2dimension relative to the F1 dimension for both talkers,the overall clear speech vowel space expansion for the fe-male talker was greater than for the male talker.
In summary, the acoustic–phonetic analysis of theconversational and clear speech sentences in this studyshowed qualitatively similar patterns of clear speechproduction across the two talkers. For both talkers, theconversational-to-clear speech modification involved adecrease in speaking rate, an increase in the numberand duration of pauses, less alveolar flapping, more fi-nal stop releasing, a greater consonant-to-vowel inten-sity ratio, a higher mean pitch, a wider pitch range,and an expanded vowel space. Nevertheless, there weresome differences between the degree to which each ofthe two talker’s clear speech productions exhibited these
specific acoustic–phonetic features. The female talkermodified her speaking rate and increased the frequencyand duration of interword pauses to a greater extentthan the male talker. The female talker also showed agreater increase in F0 mean for clear speech than themale, and the female talker’s overall clear speech vowelspace expansion was greater than the male’s. However,the male talker was more likely than the female talkerto avoid reduction processes such as alveolar flappingand unreleased final stop consonants, and the maletalker showed a greater increase in pitch range for clearspeech than the female talker. These intertalker differ-ences in clear speech production provided the basis forinterpreting any talker-dependent intelligibility differ-ences in the sentence-in-noise perception test.
ProcedureParticipants were seated in a sound-treated booth
directly facing a loudspeaker (Baby Advent II) that waspositioned 4.5 feet from the participant’s chair on a tablewith a height of 43 inches. An experimenter was seated inthe booth with the participant. The sentences were pre-sented to the participant via the loudspeaker, and theparticipant’s task was to repeat orally what she or heheard. The stimulus presentation level—measured at theparticipant’s chair—was on average 62 dB SPL. The ex-perimenter recorded the number of key words that werecorrectly reported by the participant on prepared answersheets. Participants could take as long as they needed torespond; however, each sentence was presented only once.
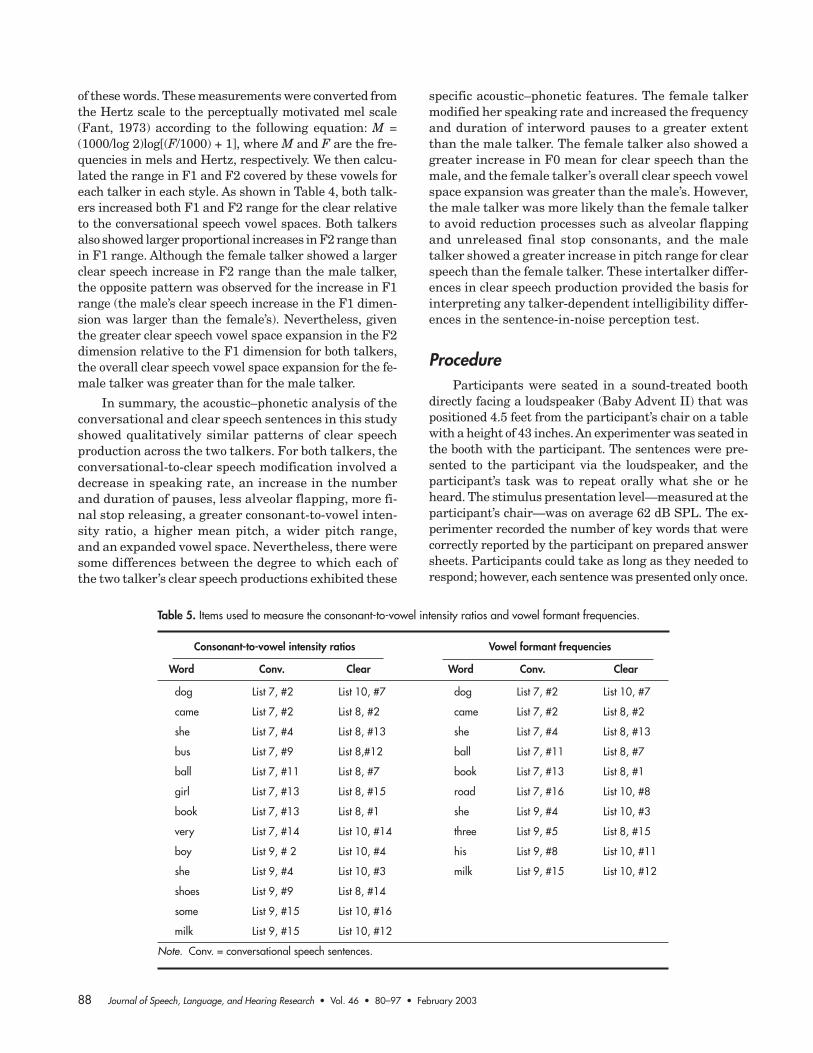
Table 5. Items used to measure the consonant-to-vowel intensity ratios and vowel formant frequencies.
Consonant-to-vowel intensity ratios Vowel formant frequencies
Word Conv. Clear Word Conv. Clear
dog List 7, #2 List 10, #7 dog List 7, #2 List 10, #7
came List 7, #2 List 8, #2 came List 7, #2 List 8, #2
she List 7, #4 List 8, #13 she List 7, #4 List 8, #13
bus List 7, #9 List 8,#12 ball List 7, #11 List 8, #7
ball List 7, #11 List 8, #7 book List 7, #13 List 8, #1
girl List 7, #13 List 8, #15 road List 7, #16 List 10, #8
book List 7, #13 List 8, #1 she List 9, #4 List 10, #3
very List 7, #14 List 10, #14 three List 9, #5 List 8, #15
boy List 9, # 2 List 10, #4 his List 9, #8 List 10, #11
she List 9, #4 List 10, #3 milk List 9, #15 List 10, #12
shoes List 9, #9 List 8, #14
some List 9, #15 List 10, #16
milk List 9, #15 List 10, #12
Note. Conv. = conversational speech sentences.
Bradlow et al.: Speaking Clearly for Children With Learning Disabilities 89
After each trial, the experimenter pushed a button on acustom-made button box to elicit the next trial.
ResultsEach participant received a key word correct score
out of a possible total of 50 for each of the four sentencelists. The scores were converted to percentage correctscores and then converted to rationalized arcsine trans-form units (rau; Studebaker, 1985). This transformationplaces the scores on a linear and additive scale, thusfacilitating meaningful statistical comparisons acrossthe entire range of the scale. The transformed scores foreach participant were then coded as rau scores for eachof the four conditions: –4 dB signal-to-noise ratio con-versational style, –4 dB signal-to-noise ratio clear style,–8 dB signal-to-noise ratio conversational style, and –8dB signal-to-noise ratio clear style.
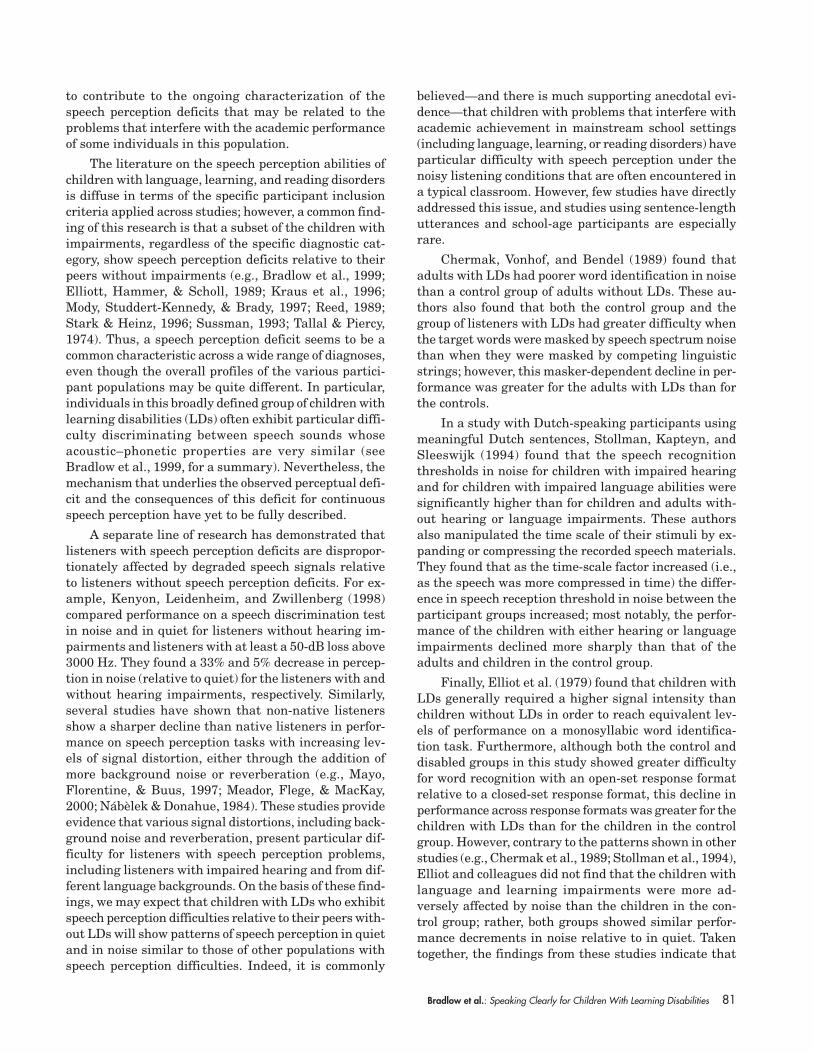
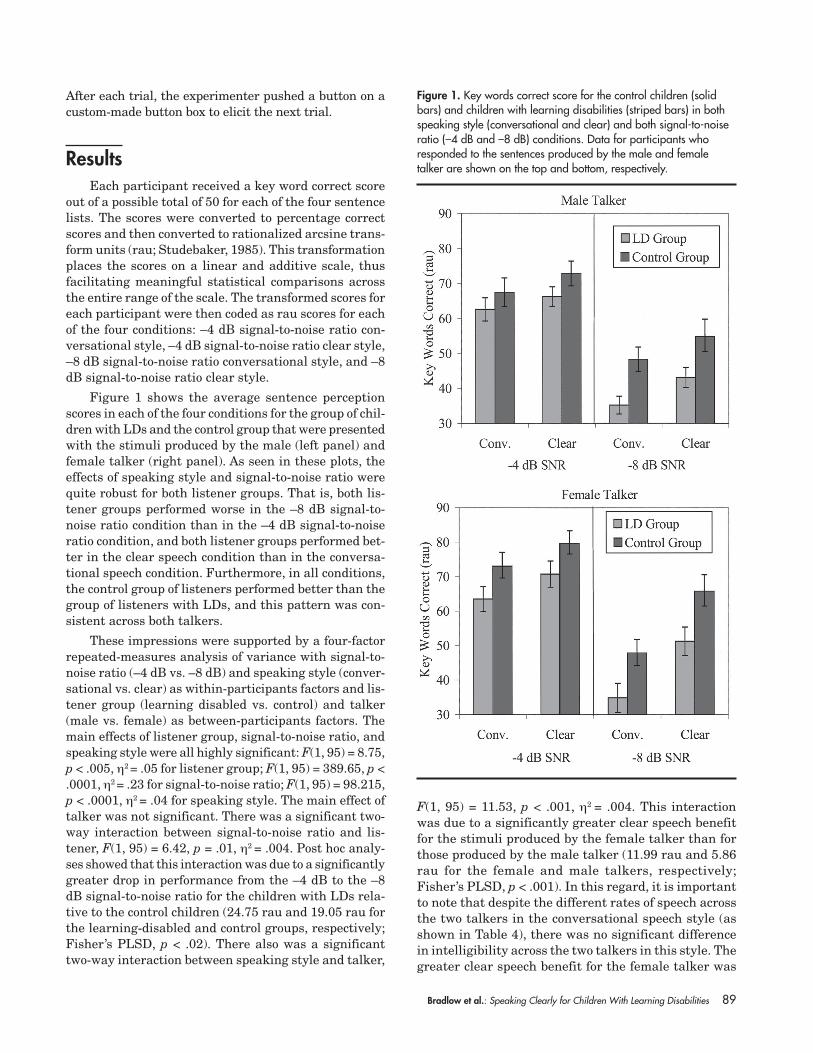
Figure 1 shows the average sentence perceptionscores in each of the four conditions for the group of chil-dren with LDs and the control group that were presentedwith the stimuli produced by the male (left panel) andfemale talker (right panel). As seen in these plots, theeffects of speaking style and signal-to-noise ratio werequite robust for both listener groups. That is, both lis-tener groups performed worse in the –8 dB signal-to-noise ratio condition than in the –4 dB signal-to-noiseratio condition, and both listener groups performed bet-ter in the clear speech condition than in the conversa-tional speech condition. Furthermore, in all conditions,the control group of listeners performed better than thegroup of listeners with LDs, and this pattern was con-sistent across both talkers.
These impressions were supported by a four-factorrepeated-measures analysis of variance with signal-to-noise ratio (–4 dB vs. –8 dB) and speaking style (conver-sational vs. clear) as within-participants factors and lis-tener group (learning disabled vs. control) and talker(male vs. female) as between-participants factors. Themain effects of listener group, signal-to-noise ratio, andspeaking style were all highly significant: F(1, 95) = 8.75,p < .005, η2 = .05 for listener group; F(1, 95) = 389.65, p <.0001, η2 = .23 for signal-to-noise ratio; F(1, 95) = 98.215,p < .0001, η2 = .04 for speaking style. The main effect oftalker was not significant. There was a significant two-way interaction between signal-to-noise ratio and lis-tener, F(1, 95) = 6.42, p = .01, η2 = .004. Post hoc analy-ses showed that this interaction was due to a significantlygreater drop in performance from the –4 dB to the –8dB signal-to-noise ratio for the children with LDs rela-tive to the control children (24.75 rau and 19.05 rau forthe learning-disabled and control groups, respectively;Fisher’s PLSD, p < .02). There also was a significanttwo-way interaction between speaking style and talker,
F(1, 95) = 11.53, p < .001, η2 = .004. This interactionwas due to a significantly greater clear speech benefitfor the stimuli produced by the female talker than forthose produced by the male talker (11.99 rau and 5.86rau for the female and male talkers, respectively;Fisher’s PLSD, p < .001). In this regard, it is importantto note that despite the different rates of speech acrossthe two talkers in the conversational speech style (asshown in Table 4), there was no significant differencein intelligibility across the two talkers in this style. Thegreater clear speech benefit for the female talker was
Figure 1. Key words correct score for the control children (solidbars) and children with learning disabilities (striped bars) in bothspeaking style (conversational and clear) and both signal-to-noiseratio (–4 dB and –8 dB) conditions. Data for participants whoresponded to the sentences produced by the male and femaletalker are shown on the top and bottom, respectively.
90 Journal of Speech, Language, and Hearing Research • Vol. 46 • 80–97 • February 2003
due entirely to a significant difference between the clearspeech intelligibility scores for the two talkers, t(97) =2.816, p < .05. The two-way interaction between speak-ing style and signal-to-noise ratio also was significant,F(1, 95) = 14.50, p < .0001, η2 = .005, due to a greaterclear speech benefit for the –8 dB than for the–4 dB signal-to-noise ratio (11.83 rau and 5.46 rau forthe –8 dB and –4 dB signal-to-noise ratios, respectively;F(1, 98) = 14.76, p < .001, η2 = .064. The three-way inter-action between signal-to-noise ratio, speaking style, andtalker also was significant, F(1, 95) = 4.75, p < .05, η2 =.002. Pairwise comparisons showed that for the femaletalker, the clear speech effect was significantly greaterin the –8 dB than in the –4 dB signal-to-noise ratio con-dition (mean difference = 10.06 rau), t(44) = 4.82, p <.001 (2-tailed), whereas for the male talker the clearspeech effect did not differ significantly across signal-to-noise ratio conditions. None of the other interactionswas significant.
In summary, these data showed that the group of chil-dren with LDs had greater difficulty perceiving sentencesin noise than the control group. This sentence-in-noiseperception deficit was consistent across the two talkers.However, the group of children with LDs was more ad-versely affected by a decrease in signal-to-noise ratio thanwas the control group. Furthermore, both groups deriveda significant perceptual benefit from the acoustic–phoneticenhancements afforded by naturally produced clearspeech. The magnitude of this clear speech effect for thecontrol group and the group of children with LDs was 8.8%and 9.2% on the rau scale, respectively. For both groups,
this clear speech effect was dependent on the talker(greater for the female than for the male talker) and thesignal-to-noise ratio (greater for the –8 dB than for the–4 db signal-to-noise ratio). Finally, pairwise comparisonsshowed no significant differences between the averageclear speech perception score for the group of children withLDs and the average conversational speech perceptionscore for the control group. This pattern was observedacross both the –4 dB and –8 dB signal-to-noise ratio con-ditions and across both talker conditions. In other words,when presented with sentences in naturally produced clearspeech, performance on the sentence-in-noise perceptiontask by the group of children with LDs was at the samelevel of performance as the control group when presentedwith the conversational speech sentences.
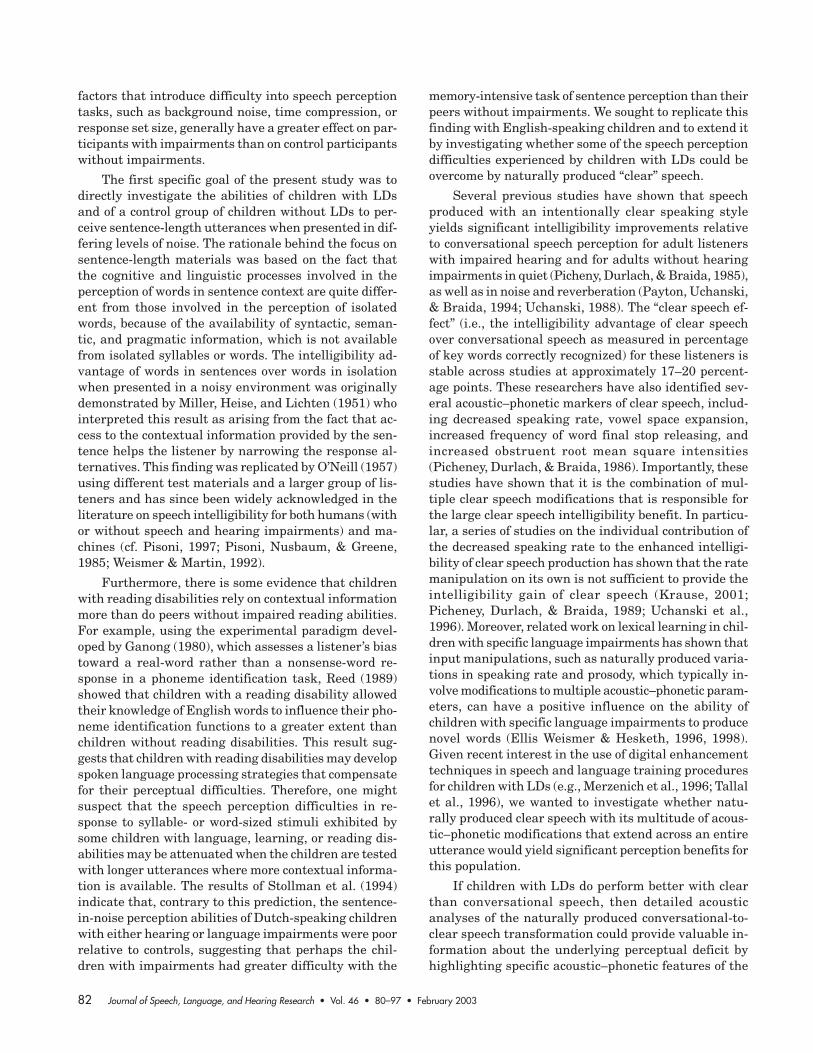
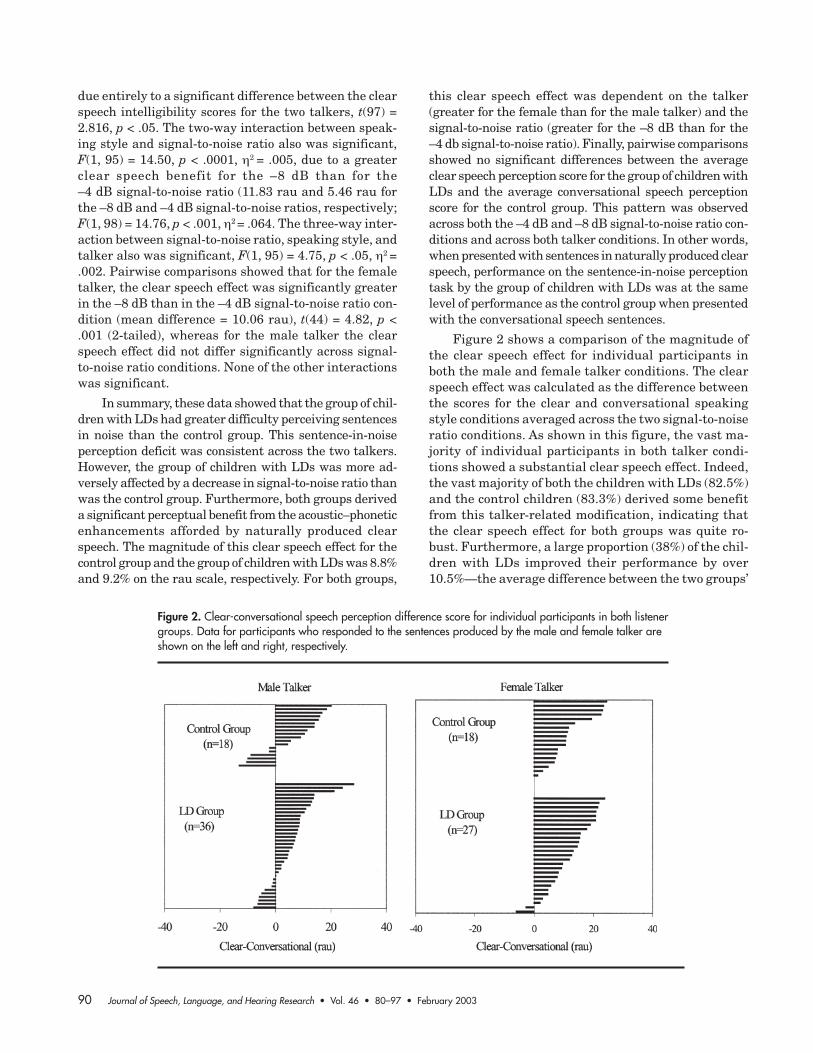
Figure 2 shows a comparison of the magnitude ofthe clear speech effect for individual participants inboth the male and female talker conditions. The clearspeech effect was calculated as the difference betweenthe scores for the clear and conversational speakingstyle conditions averaged across the two signal-to-noiseratio conditions. As shown in this figure, the vast ma-jority of individual participants in both talker condi-tions showed a substantial clear speech effect. Indeed,the vast majority of both the children with LDs (82.5%)and the control children (83.3%) derived some benefitfrom this talker-related modification, indicating thatthe clear speech effect for both groups was quite ro-bust. Furthermore, a large proportion (38%) of the chil-dren with LDs improved their performance by over10.5%—the average difference between the two groups’
Figure 2. Clear-conversational speech perception difference score for individual participants in both listenergroups. Data for participants who responded to the sentences produced by the male and female talker areshown on the left and right, respectively.
Bradlow et al.: Speaking Clearly for Children With Learning Disabilities 91
performance levels on this task—indicating that for manyof the participants with LDs, the magnitude of the clearspeech benefit is sufficient to bring their performancewithin the range of performance of the control group.
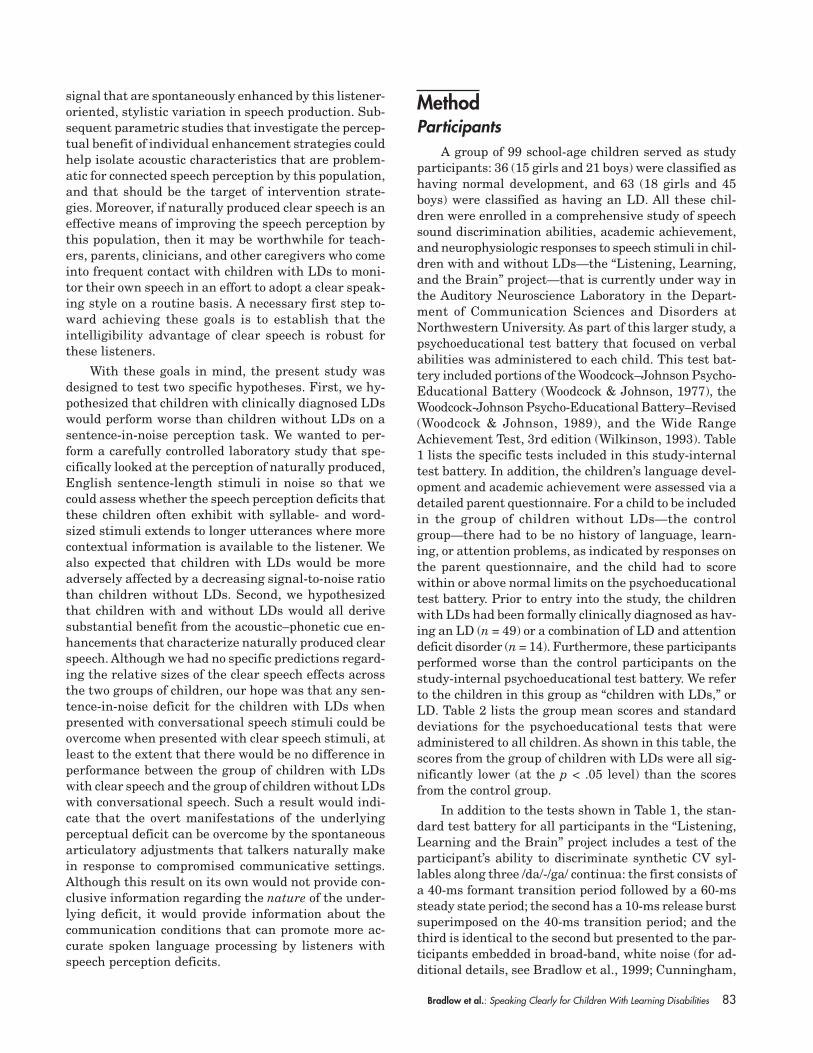
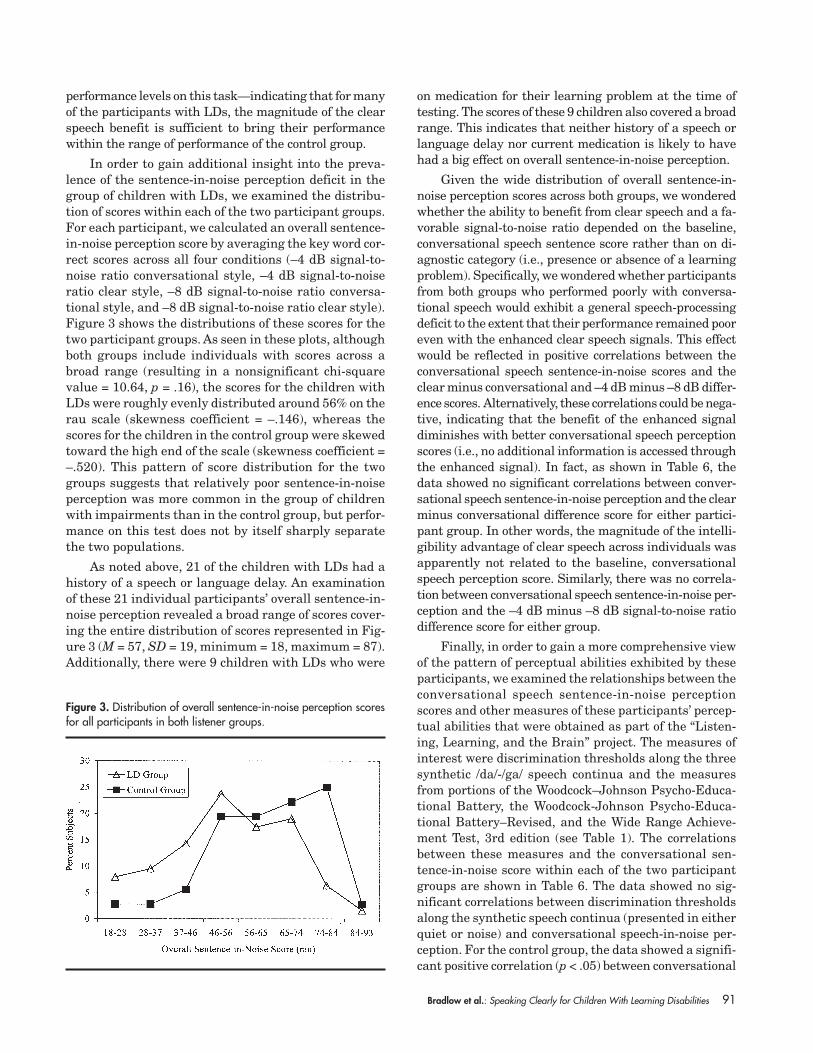
In order to gain additional insight into the preva-lence of the sentence-in-noise perception deficit in thegroup of children with LDs, we examined the distribu-tion of scores within each of the two participant groups.For each participant, we calculated an overall sentence-in-noise perception score by averaging the key word cor-rect scores across all four conditions (–4 dB signal-to-noise ratio conversational style, –4 dB signal-to-noiseratio clear style, –8 dB signal-to-noise ratio conversa-tional style, and –8 dB signal-to-noise ratio clear style).Figure 3 shows the distributions of these scores for thetwo participant groups. As seen in these plots, althoughboth groups include individuals with scores across abroad range (resulting in a nonsignificant chi-squarevalue = 10.64, p = .16), the scores for the children withLDs were roughly evenly distributed around 56% on therau scale (skewness coefficient = –.146), whereas thescores for the children in the control group were skewedtoward the high end of the scale (skewness coefficient =–.520). This pattern of score distribution for the twogroups suggests that relatively poor sentence-in-noiseperception was more common in the group of childrenwith impairments than in the control group, but perfor-mance on this test does not by itself sharply separatethe two populations.
As noted above, 21 of the children with LDs had ahistory of a speech or language delay. An examinationof these 21 individual participants’ overall sentence-in-noise perception revealed a broad range of scores cover-ing the entire distribution of scores represented in Fig-ure 3 (M = 57, SD = 19, minimum = 18, maximum = 87).Additionally, there were 9 children with LDs who were
on medication for their learning problem at the time oftesting. The scores of these 9 children also covered a broadrange. This indicates that neither history of a speech orlanguage delay nor current medication is likely to havehad a big effect on overall sentence-in-noise perception.
Given the wide distribution of overall sentence-in-noise perception scores across both groups, we wonderedwhether the ability to benefit from clear speech and a fa-vorable signal-to-noise ratio depended on the baseline,conversational speech sentence score rather than on di-agnostic category (i.e., presence or absence of a learningproblem). Specifically, we wondered whether participantsfrom both groups who performed poorly with conversa-tional speech would exhibit a general speech-processingdeficit to the extent that their performance remained pooreven with the enhanced clear speech signals. This effectwould be reflected in positive correlations between theconversational speech sentence-in-noise scores and theclear minus conversational and –4 dB minus –8 dB differ-ence scores. Alternatively, these correlations could be nega-tive, indicating that the benefit of the enhanced signaldiminishes with better conversational speech perceptionscores (i.e., no additional information is accessed throughthe enhanced signal). In fact, as shown in Table 6, thedata showed no significant correlations between conver-sational speech sentence-in-noise perception and the clearminus conversational difference score for either partici-pant group. In other words, the magnitude of the intelli-gibility advantage of clear speech across individuals wasapparently not related to the baseline, conversationalspeech perception score. Similarly, there was no correla-tion between conversational speech sentence-in-noise per-ception and the –4 dB minus –8 dB signal-to-noise ratiodifference score for either group.
Finally, in order to gain a more comprehensive viewof the pattern of perceptual abilities exhibited by theseparticipants, we examined the relationships between theconversational speech sentence-in-noise perceptionscores and other measures of these participants’ percep-tual abilities that were obtained as part of the “Listen-ing, Learning, and the Brain” project. The measures ofinterest were discrimination thresholds along the threesynthetic /da/-/ga/ speech continua and the measuresfrom portions of the Woodcock–Johnson Psycho-Educa-tional Battery, the Woodcock-Johnson Psycho-Educa-tional Battery–Revised, and the Wide Range Achieve-ment Test, 3rd edition (see Table 1). The correlationsbetween these measures and the conversational sen-tence-in-noise score within each of the two participantgroups are shown in Table 6. The data showed no sig-nificant correlations between discrimination thresholdsalong the synthetic speech continua (presented in eitherquiet or noise) and conversational speech-in-noise per-ception. For the control group, the data showed a signifi-cant positive correlation (p < .05) between conversational
Figure 3. Distribution of overall sentence-in-noise perception scoresfor all participants in both listener groups.
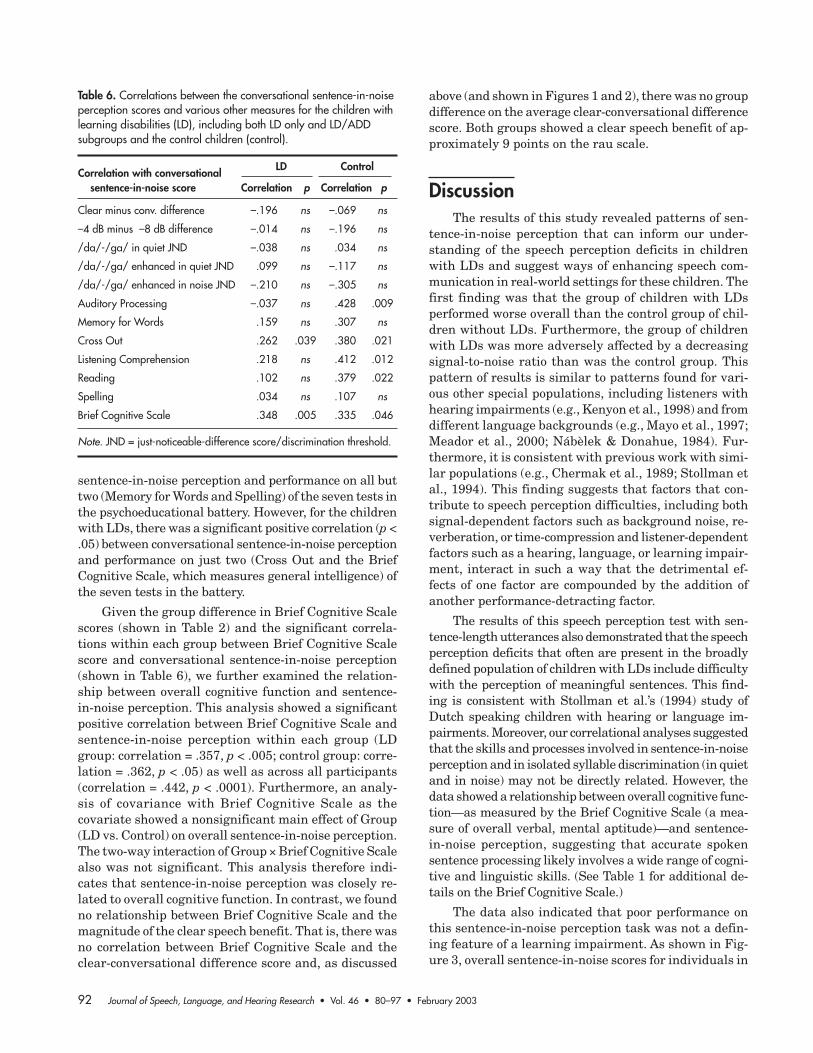
92 Journal of Speech, Language, and Hearing Research • Vol. 46 • 80–97 • February 2003
sentence-in-noise perception and performance on all buttwo (Memory for Words and Spelling) of the seven tests inthe psychoeducational battery. However, for the childrenwith LDs, there was a significant positive correlation (p <.05) between conversational sentence-in-noise perceptionand performance on just two (Cross Out and the BriefCognitive Scale, which measures general intelligence) ofthe seven tests in the battery.
Given the group difference in Brief Cognitive Scalescores (shown in Table 2) and the significant correla-tions within each group between Brief Cognitive Scalescore and conversational sentence-in-noise perception(shown in Table 6), we further examined the relation-ship between overall cognitive function and sentence-in-noise perception. This analysis showed a significantpositive correlation between Brief Cognitive Scale andsentence-in-noise perception within each group (LDgroup: correlation = .357, p < .005; control group: corre-lation = .362, p < .05) as well as across all participants(correlation = .442, p < .0001). Furthermore, an analy-sis of covariance with Brief Cognitive Scale as thecovariate showed a nonsignificant main effect of Group(LD vs. Control) on overall sentence-in-noise perception.The two-way interaction of Group × Brief Cognitive Scalealso was not significant. This analysis therefore indi-cates that sentence-in-noise perception was closely re-lated to overall cognitive function. In contrast, we foundno relationship between Brief Cognitive Scale and themagnitude of the clear speech benefit. That is, there wasno correlation between Brief Cognitive Scale and theclear-conversational difference score and, as discussed
above (and shown in Figures 1 and 2), there was no groupdifference on the average clear-conversational differencescore. Both groups showed a clear speech benefit of ap-proximately 9 points on the rau scale.
DiscussionThe results of this study revealed patterns of sen-
tence-in-noise perception that can inform our under-standing of the speech perception deficits in childrenwith LDs and suggest ways of enhancing speech com-munication in real-world settings for these children. Thefirst finding was that the group of children with LDsperformed worse overall than the control group of chil-dren without LDs. Furthermore, the group of childrenwith LDs was more adversely affected by a decreasingsignal-to-noise ratio than was the control group. Thispattern of results is similar to patterns found for vari-ous other special populations, including listeners withhearing impairments (e.g., Kenyon et al., 1998) and fromdifferent language backgrounds (e.g., Mayo et al., 1997;Meador et al., 2000; Nábèlek & Donahue, 1984). Fur-thermore, it is consistent with previous work with simi-lar populations (e.g., Chermak et al., 1989; Stollman etal., 1994). This finding suggests that factors that con-tribute to speech perception difficulties, including bothsignal-dependent factors such as background noise, re-verberation, or time-compression and listener-dependentfactors such as a hearing, language, or learning impair-ment, interact in such a way that the detrimental ef-fects of one factor are compounded by the addition ofanother performance-detracting factor.
The results of this speech perception test with sen-tence-length utterances also demonstrated that the speechperception deficits that often are present in the broadlydefined population of children with LDs include difficultywith the perception of meaningful sentences. This find-ing is consistent with Stollman et al.’s (1994) study ofDutch speaking children with hearing or language im-pairments. Moreover, our correlational analyses suggestedthat the skills and processes involved in sentence-in-noiseperception and in isolated syllable discrimination (in quietand in noise) may not be directly related. However, thedata showed a relationship between overall cognitive func-tion—as measured by the Brief Cognitive Scale (a mea-sure of overall verbal, mental aptitude)—and sentence-in-noise perception, suggesting that accurate spokensentence processing likely involves a wide range of cogni-tive and linguistic skills. (See Table 1 for additional de-tails on the Brief Cognitive Scale.)
The data also indicated that poor performance onthis sentence-in-noise perception task was not a defin-ing feature of a learning impairment. As shown in Fig-ure 3, overall sentence-in-noise scores for individuals in
Table 6. Correlations between the conversational sentence-in-noiseperception scores and various other measures for the children withlearning disabilities (LD), including both LD only and LD/ADDsubgroups and the control children (control).
Correlation with conversational LD Control
sentence-in-noise score Correlation p Correlation p
Clear minus conv. difference –.196 ns –.069 ns
–4 dB minus –8 dB difference –.014 ns –.196 ns
/da/-/ga/ in quiet JND –.038 ns .034 ns
/da/-/ga/ enhanced in quiet JND .099 ns –.117 ns
/da/-/ga/ enhanced in noise JND –.210 ns –.305 ns
Auditory Processing –.037 ns .428 .009
Memory for Words .159 ns .307 ns
Cross Out .262 .039 .380 .021
Listening Comprehension .218 ns .412 .012
Reading .102 ns .379 .022
Spelling .034 ns .107 ns
Brief Cognitive Scale .348 .005 .335 .046
Note. JND = just-noticeable-difference score/discrimination threshold.
Bradlow et al.: Speaking Clearly for Children With Learning Disabilities 93
both groups covered a broad range, demonstrating thatsome children with LDs perform (unexpectedly) well onthis task, and some children without LDs perform (un-expectedly) poorly on this task. Thus, rather than serv-ing as a diagnostic for identifying a child with a learn-ing problem, poor sentence-in-noise perception shouldbe viewed as part of a constellation of auditory percep-tual deficits that may or may not be present in an indi-vidual. This pattern of group mean differences despitesubstantially overlapping distributions is consistentwith numerous other studies that have revealedgroupwise differences across a wide range of auditoryperception tasks with this population (e.g., Bradlow etal., 1999; Elliot et al., 1979; Kraus et al., 1996; Tallal,1980) and should be taken as a note of caution regard-ing unjustifiable conclusions about the nature of theunderlying deficit (for additional discussion of this point,see Farmer & Klein, 1995; Klein & Farmer, 1995; Mar-tin, 1995; Rosen, van der Lely, & Adlard, 2000).
Although these data do not identify the precisemechanism that underlies the speech perception prob-lems of the population of interest in this study, they pro-vide information regarding the real-world communica-tion situations that are most likely to impede accuratespeech perception. Specifically, these data provide em-pirical evidence that the speech perception difficultiesthat are often experienced by children with LDs may beespecially problematic in noisy listening environments,such as are often encountered in a typical classroom.
The second major finding of the present study wasthe beneficial effect of clear speech for both groups. A largeproportion of individuals in both groups derived a sub-stantial speech perception benefit from naturally producedclear speech, and for many of the children with LDs thisclear speech benefit was sufficient to bring them withinthe range of performance of the control group with con-versational speech. Furthermore, the magnitude of theclear speech benefit was stable at approximately 9 rauunits for all children regardless of group (LD or control)or overall cognitive function (Brief Cognitive Scale score).The data also showed that the clear speech effect wasgreater for the –8 dB signal-to-noise ratio than for the –4dB signal-to-noise ratio. This speaking style by signal-to-noise ratio interaction suggests that the strength of theperformance-enhancing effect of clear speech may be suf-ficient to counteract the compounding effects of multipleperformance-detracting factors, such as a learning-impair-ment and the presence of background noise. The findingof a substantial clear speech effect for this population isparticularly encouraging because it identifies a relativelysimple, cost-free, and immediately effective method forenhancing speech perception for these children.
In addition to the speaking style by signal-to-noiseratio interaction, the data in this study also showed a
speaking style by talker interaction. Both of the talkerswho produced the conversational and clear sentencesused in the test of sentence-in-noise perception evokeda significant clear speech effect for both groups of lis-teners, suggesting that the clear speech effect does notnecessarily require any training on the part of eitherthe talker or the listener. Nevertheless, the magnitudeof the clear speech effect in response to the femaletalker’s productions was significantly greater than theclear speech effect in response to the male talker’s pro-ductions. Furthermore, this difference in clear speechintelligibility was observed despite the fact that therewas no difference between the talkers in terms of theirconversational speech intelligibility. That is, the maleand female talkers’ conversational speech intelligibilityscores were not significantly different. In other words,despite that fact that the female talker had a slowerrate of conversational speech than the male (see Table4), the listeners found each of the two talkers to haveequivalent baseline, conversational speech intelligibil-ity. In contrast, the female talker’s clear speech intelli-gibility was significantly greater than that of the maletalker, resulting in an overall greater clear speech ben-efit for the female talker than for the male talker. Onthe basis of the acoustic analyses of the conversationaland clear speech sentences across the two talkers, wecan infer which of the specific acoustic–phonetic en-hancement features of clear speech were particularlyeffective in promoting speech perception accuracy forthe population of interest in this study. In so doing, wecan also suggest guidelines for clear speech productionby talkers who have frequent contact with children inthis population.
The acoustic analysis of the conversational and clearspeech sentences produced by each of the talkers (sum-marized in Table 4) indicated that probably the most sa-lient difference between clear speech production by thefemale and male talkers was with respect to overall speak-ing rate. The female talker slowed down her speaking rateto a far greater degree than did the male talker (52% vs.116% lengthening in overall sentence duration for clearspeech relative to conversational speech), and her strat-egy for achieving this decrease in speaking rate involveda substantial increase in the frequency and duration ofinterword pauses. The acoustic measurements also indi-cated that the female and male talker differed noticeablyin the magnitude of the increase in pitch mean, in theextent to which they expanded their vowel spaces, and inthe degree to which the consonant-to-vowel intensity ra-tio increased for clear speech relative to conversationalspeech. On all three of these parameters, the femaletalker’s clear speech modification was greater in magni-tude than the male talker’s, although the intertalker dif-ferences on these parameters were not quite as large asthe intertalker differences in the conversational-to-clear
94 Journal of Speech, Language, and Hearing Research • Vol. 46 • 80–97 • February 2003
speech rate and pausing modifications. For the remain-ing parameters (pitch range, alveolar flapping, and finalconsonant releasing; see Table 4) there was less differ-ence between the talkers.
This pattern of intertalker differences in the pro-duction of clear speech in conjunction with theintertalker difference in the size of the evoked clearspeech effect for the listeners—despite equivalent con-versational speech intelligibility—suggests that modi-fications to the temporal characteristics of the signalplay a particularly important role in enhancing its over-all intelligibility. Other important intelligibility enhanc-ing features appear to be articulatory precision and ef-fort, as indicated by the expanded vowel space; raisedaverage pitch; and increased consonant-to-vowel inten-sity ratio of the female talker’s clear speech production.In contrast, certain other features of clear speech, in-cluding the increase in pitch range and the eliminationof reduction processes such as alveolar flapping and fi-nal consonant releasing, appear to be less important forenhancing its overall intelligibility for children with andwithout LDs. With respect to providing guidelines foreffective clear speech production for parents, teachers,clinicians, and others who have frequent occasions totalk with children in noisy environments, it seems thatit is well worth the effort to simply “speak clearly,” pay-ing particularly careful attention to reducing overallspeaking rate.
In order to identify with certainty those acoustic–phonetic features of clear speech that are responsiblefor its enhanced intelligibility and those signal-relatedfeatures that are most vulnerable to perceptual disrup-tion in the population of children with LDs, we needcarefully controlled, parametric studies in which eachindividual feature is manipulated in isolation from theothers. Several studies have adopted this approach andhave investigated the perceptual effects of digitallymodified speech (Gordon-Salant, 1986; Hazan &Simpson, 1998, 2000; Krause, 2001; Merzenich et al.,1996; Picheny et al., 1989; Tallal et al., 1996; Uchanskiet al., 1996) for a variety of listener populations, in-cluding adults with and without impaired hearing, non-native listeners, and children with language and learn-ing impairments. These studies have investigated theseparate and combined effects of manipulating the tem-poral characteristics of the speech signal in a mannerthat resembles the temporal modifications of naturallyproduced clear speech and the intensity relationshipbetween consonants and following vowels in a mannerthat resembles the increased consonant-to-vowel inten-sity ratio of naturally produced clear speech. Althoughthis approach has achieved some success in enhancingintelligibility, it has not yet been quite as effective asnaturally produced clear speech, suggesting that a key
feature of naturally produced clear speech is the combi-nation of individual enhancement strategies.
On the basis of the findings from the present study,we can conclude that a particularly effective means ofenhancing speech perception under adverse listeningconditions for children with and without LDs is to modifythe talker’s speech production. Although this approachhas the disadvantage of treating the symptom ratherthan the underlying cause, its major advantages arethreefold: it is cost free, it requires no listener or talkertraining, and it is almost universally effective.
AcknowledgmentsWe gratefully acknowledge the assistance of Trent
Nicol, Bradley Wible, and Pamela Horstmann. We are alsograteful to Rosalie Uchanski for helpful discussions regard-ing the clear speech test design. This work was supported byNational Institute on Deafness and Other CommunicationDisorders Grants DC 03762 and DC 01510.
ReferencesBamford, J., & Wilson, I. (1979). Methodological consider-
ations and practical aspects of the BKB sentence lists. InJ. Bench & J. Bamford (Eds.), Speech-hearing tests and thespoken language of hearing-impaired children (pp. 148–187). London: Academic Press.
Bench, J., & Bamford, J. (Eds.). (1979). Speech-hearingtests and the spoken language of hearing-impairedchildren. London: Academic Press.
Bradlow, A. R. (2002). Confluent talker- and listener-relatedforces in clear speech production. In C. Gussenhoven & N.Warner (Eds.), Laboratory phonology 7 (pp. 241–273).Berlin and New York: Mouton de Gruyter.
Bradlow, A. R., Kraus, N., Nicol, T. G., McGee, T. J.,Cunningham, J., & Zecker, S. G. (1999). Effects oflengthened formant transition duration on discriminationand neural representation of synthetic CV syllables bynormal and learning-disabled children. Journal of theAcoustical Society of America, 106, 2086–2096.
Chermak, G. D., Vonhof, M. R., & Bendel, R. B. (1989).Word identification performance in the presence ofcompeting speech and noise in learning disabled adults.Ear & Hearing, 10, 90–93.
Cunningham, J., Nicol, T. G., Zecker, S. G., Bradlow,A. R., & Kraus, N. (2001). Neurobiologic responses tospeech in noise in children with learning problems:Deficits and strategies for improvement. ClinicalNeurophysiology, 112, 758–767.
Elliot, L. L., Connors, S., Kille, E., Levin, S., Ball, K., &Katz, D. (1979). Children’s understanding of monosyllabicnouns in quiet and in noise. Journal of the AcousticalSociety of America, 66, 12–21.
Elliot, L. L., Hammer, M. A., & Scholl, M. E. (1989). Fine-grained auditory discrimination in normal children andchildren with language-learning problems. Journal ofSpeech and Hearing Research, 32, 112–119.
Bradlow et al.: Speaking Clearly for Children With Learning Disabilities 95
Ellis Weismer, S., & Hesketh, L. J. (1996). Lexicallearning by children with specific language impairment:Effects of linguistic input presented at varying speakingrates. Journal of Speech and Hearing Research, 39,177–190.
Ellis Weismer, S., & Hesketh, L. J. (1998). The impact ofemphatic stress on novel word learning by children withspecific language impairment. Journal of Speech, Lan-guage, and Hearing Research, 41, 1444–1458.
Fant, G. (1973). Speech sounds and features. Cambridge,MA: MIT Press.
Farmer, M. E. & Klein, R. M. (1995). The evidence for atemporal processing deficit linked to dyslexia: A review.Psychonomic Bulletin and Review, 2, 460–493.
Ganong, W. (1980). Phonetic categorization in auditoryword perception. Journal of Experimental Psychology:Human Perception and Performance, 6, 110–125.
Gordon-Salant, S. (1986). Recognition of natural and time/intensity altered CVs by young and elderly subjects withnormal hearing. Journal of the Acoustical Society ofAmerica, 80, 1599–1607.
Hanks, W. D., & Johnson, G. D. (1998). HINT list equiva-lency using older listeners. Journal of Speech, Language,and Hearing Research, 41, 1335–1340.
Hazan, V., & Simpson, A. (1998). The effect of cue-enhancement on the intelligibility of nonsense word andsentence materials presented in noise. Speech Communi-cation, 24, 211–226.
Hazan, V., & Simpson, A. (2000). The effect of cue-enhancement on consonant intelligibility in noise: Speakerand listener effects. Language and Speech, 43, 273–294.
Johnson, K., Flemming, E., & Wright, R. (1993). Thehyperspace effect: Phonetic targets are hyperarticulated.Language, 69, 505–528.
Kennedy, E., Levitt, H., Neuman, A. C., & Weiss, M.(1998). Consonant-vowel intensity ratios for maximizingconsonant recognition by hearing-impaired listeners.Journal of the Acoustical Society of America, 103,1098–1114.
Kenyon, E. L., Leidenheim, S. E., & Zwillenberg, S.(1998). Speech discrimination in the sensorineural hearingloss patients: How is it affected by background noise?Military Medicine, 163, 647–650.
Klein, R. M., & Farmer, M. (1995). Dyslexia and a tempo-ral processing deficit: A reply to the commentaries.Psychonomic Bulletin and Review 2, 515–526.
Kraus, N., McGee, T. J., Carrell, T. D., Zecker, S. G.,Nicol, T. G., & Koch, D. B. (1996). Auditory neurophysi-ologic responses and discrimination deficits in childrenwith learning problems. Science, 273, 971–973.
Krause, J. C. (2001). Properties of naturally produced clearspeech at normal rates and implications for intelligibilityenhancement. Unpublished doctoral dissertation, Depart-ment of Electrical Engineering and Computer Science,Massachusetts Institute of Technology.
Martin, R. C. (1995). Heterogeneity of deficits in develop-mental dyslexia and implications for methodology.Psychonomic Bulletin and Review, 2, 494–500.
Mayo, L. H., Florentine, M., & Buus, S. (1997). Age ofsecond-language acquisition and perception of speech in
noise. Journal of Speech and Hearing Research, 40,686–693.
Meador, D., Flege, J. E., & MacKay, I. R. (2000). Factorsaffecting the recognition of words in a second language.Bilingualism, 3(1), 55–67.
Merzenich, M. M., Jenkins, W. M., Johnston, P.,Schreiner, C., Miller, S. L., & Tallal, P. (1996). Tempo-ral processing deficits of language-learning impairedchildren ameliorated by training. Science, 271, 77–81.
Miller, G. A., Heise, G. A., & Lichten, W. (1951). Theintelligibility of speech as a function of the context of thetest materials. Journal of Experimental Psychology, 41,329–335.
Mody, M., Studdert-Kennedy, M., & Brady, S. (1997).Speech perception deficits in poor readers: Auditoryprocessing or phonological coding? Journal of Experimen-tal Child Psychology, 64, 199–231.
Montgomery, A. A., & Edge, R. A. (1988). Evaluation oftwo speech enhancement techniques to improve intelligi-bility for hearing-impaired adults. Journal of Speech andHearing Research, 31, 386–393.
Moon, S.-J., & Lindblom, B. (1994). Interaction betweenduration, context, and speaking style in English stressedvowels. Journal of the Acoustical Society of America, 96,40–55.
Nábèlek, A. K., & Donahue, A. M. (1984). Perception ofconsonants in reverberation by native and non-nativelisteners. Journal of the Acoustical Society of America,75, 632–634.
O’Neill, J. J. (1957). Recognition of intelligibility testmaterials in context and isolation. Journal of Speech andHearing Disorders, 22(1), 87–90.
Payton, K. L., Uchanski, R. M., & Braida, L. D. (1994).Intelligibility of conversational and clear speech in noiseand reverberation for listeners with normal and impairedhearing. Journal of the Acoustical Society of America, 95,1581–1592.
Picheny, M. A., Durlach, N. I., & Braida, L. D. (1985).Speaking clearly for the hard of hearing: I. Intelligibilitydifferences between clear and conversational speech.Journal of Speech and Hearing Research, 28, 96–103.
Picheny, M. A., Durlach, N. I., & Braida, L. D. (1986).Speaking clearly for the hard of hearing: II. Acousticcharacteristics of clear and conversational speech. Journalof Speech and Hearing Research, 29, 434–446.
Picheny, M. A., Durlach, N. I., & Braida, L. D. (1989).Speaking clearly for the hard of hearing: III. An attempt todetermine the contribution of speaking rate to differences inintelligibility between clear and conversational speech.Journal of Speech and Hearing Research, 32, 600–603.
Pisoni, D. B. (1997). Perception of synthetic speech. In J. P.H. van Santen, R. W. Sproat, J. P. Olive, & J. Hirschberg(Eds.), Progress in speech synthesis (pp. 541–560). NewYork: Springer-Verlag,
Pisoni, D. B., Nusbaum, H. C., & Greene, B. G. (1985).Perception of synthetic speech generated by rule. Proceed-ings of the IEEE, 73, 1665–1676.
Reed, M. A. (1989). Speech perception and the discrimina-tion of brief auditory cues in reading disabled children.Journal of Experimental Child Psychology, 48, 270–292.
96 Journal of Speech, Language, and Hearing Research • Vol. 46 • 80–97 • February 2003
Rosen, S., van der Lely, H., & Adlard, A. (2000). Noconsistent nonspeech auditory deficits in specific languageimpairment (SLI). Paper presented at the Workshop on TheNature of Speech Perception, Utrecht, The Netherlands.
Stark, R. E., & Heinz, J. M. (1996). Perception of stopconsonants in children with expressive and receptive-expressive language impairments. Journal of Speech andHearing Research, 39, 676–686.
Stollman, M. H. P., Kapteyn, T. S., & Sleeswijk, B. W.(1994). Effect of time-scaled modification of speech on thespeech recognition threshold in noise for hearing-impairedand language-impaired children. Scandinavian Audiology,23, 39–46.
Studebaker, G. A. (1985). A “rationalized” arcsine transform.Journal of Speech and Hearing Research, 28, 455–462.
Sussman, J. E. (1993). Perception of formant transitioncues to place of articulation in children with languageimpairments. Journal of Speech and Hearing Research,36, 1286–1299.
Tallal, P. (1980). Auditory temporal perception, phonics,and reading disabilities in children. Brain and Language,9, 182–198.
Tallal, P., Miller, S. L., Bedi, G., Byma, G., Wang, X.,Nagarajan, S. S., Schreiner, C., Jenkins, W. M., &Merzenich, M. M. (1996). Language comprehension inlanguage-learning impaired children improved withacoustically modified speech. Science, 271, 81–84.
Tallal, P., & Piercy, M. (1974). Developmental aphasia:Rate of auditory processing and selective impairment ofconsonant perception. Neuropsychologia, 12, 83–93.
Uchanski, R. M. (1988). Spectral and temporal contribu-tions to speech clarity for hearing impaired listeners.Unpublished doctoral dissertation, Department ofElectrical Engineering and Computer Science, Massachu-setts Institute of Technology.
Uchanski, R. M., Choi, S. S., Braida, L. D., Reed, C. M.,& Durlach, N. I. (1996). Speaking clearly for the hard ofhearing: IV. Further studies of the role of speaking rate.Journal of Speech and Hearing Research, 39, 494–509.
Weismer, G., & Martin, R. E. (1992). Acoustic and percep-tual approaches to the study of intelligibility. In R. D.Kent (Ed.), Intelligibility in speech disorders: Theory,measurement and management (pp. 67–118). Amsterdam,the Netherlands: Benjamins.
Wilkinson, G. (1993). Wide Range Achievement Test (3rded.). Wilmington, DE: Jastak Associates.
Woodcock, R., & Johnson, M. (1977). Woodcock-JohnsonPsycho-Educational Battery: Tests of Cognitive Ability.Allen, TX: DLM Teaching Resources.
Woodcock, R., & Johnson, M. (1989). Woodcock-JohnsonPsycho-Educational Battery: Tests of Cognitive Ability,Standard and Supplemental Batteries (rev. ed.). Allen, TX:DLM Teaching Resources.
Received September 4, 2001
Accepted August 5, 2002
DOI: 10.1044/1092-4388(2003/007)
Contact author: Ann Bradlow, Northwstern University,Department of Linguistics, 2016 Sheridan Road, Evanston,IL 60208-4090. E-mail: [email protected]
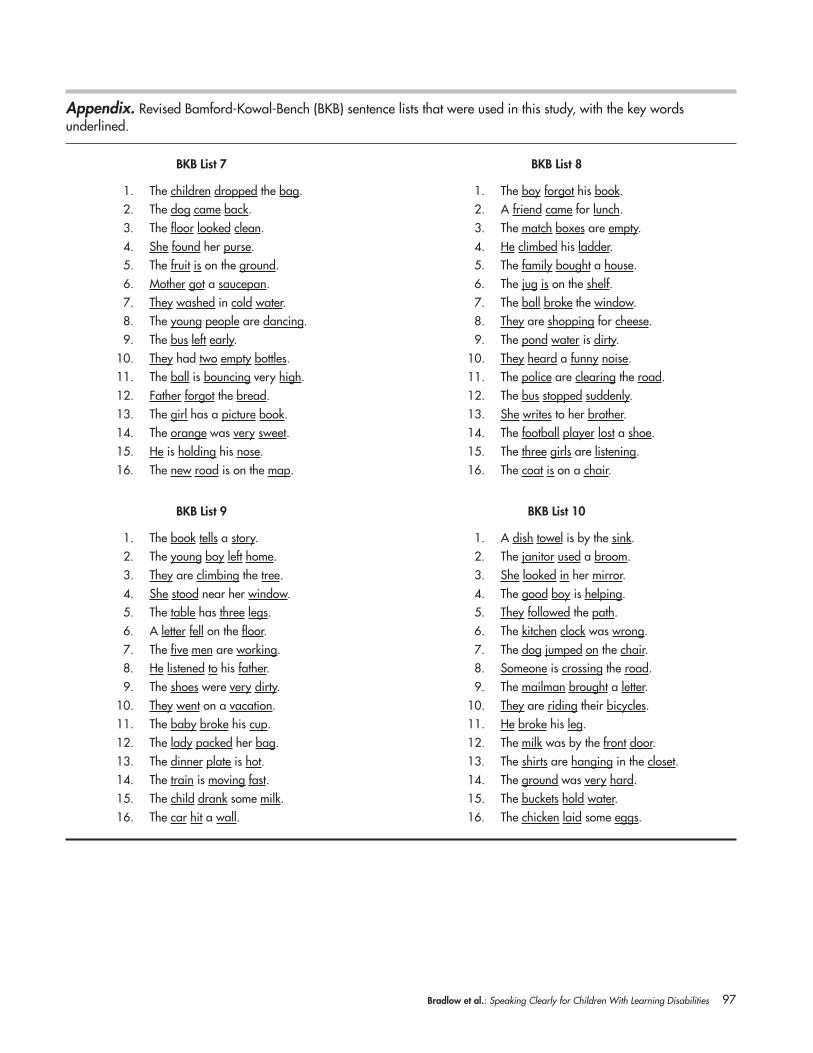
Bradlow et al.: Speaking Clearly for Children With Learning Disabilities 97
Appendix. Revised Bamford-Kowal-Bench (BKB) sentence lists that were used in this study, with the key wordsunderlined.
BKB List 7 BKB List 8
1. The children dropped the bag. 1. The boy forgot his book.2. The dog came back. 2. A friend came for lunch.3. The floor looked clean. 3. The match boxes are empty.4. She found her purse. 4. He climbed his ladder.5. The fruit is on the ground. 5. The family bought a house.6. Mother got a saucepan. 6. The jug is on the shelf.7. They washed in cold water. 7. The ball broke the window.8. The young people are dancing. 8. They are shopping for cheese.9. The bus left early. 9. The pond water is dirty.
10. They had two empty bottles. 10. They heard a funny noise.11. The ball is bouncing very high. 11. The police are clearing the road.12. Father forgot the bread. 12. The bus stopped suddenly.13. The girl has a picture book. 13. She writes to her brother.14. The orange was very sweet. 14. The football player lost a shoe.15. He is holding his nose. 15. The three girls are listening.16. The new road is on the map. 16. The coat is on a chair.
BKB List 9 BKB List 10
1. The book tells a story. 1. A dish towel is by the sink.2. The young boy left home. 2. The janitor used a broom.3. They are climbing the tree. 3. She looked in her mirror.4. She stood near her window. 4. The good boy is helping.5. The table has three legs. 5. They followed the path.6. A letter fell on the floor. 6. The kitchen clock was wrong.7. The five men are working. 7. The dog jumped on the chair.8. He listened to his father. 8. Someone is crossing the road.9. The shoes were very dirty. 9. The mailman brought a letter.
10. They went on a vacation. 10. They are riding their bicycles.11. The baby broke his cup. 11. He broke his leg.12. The lady packed her bag. 12. The milk was by the front door.13. The dinner plate is hot. 13. The shirts are hanging in the closet.14. The train is moving fast. 14. The ground was very hard.15. The child drank some milk. 15. The buckets hold water.16. The car hit a wall. 16. The chicken laid some eggs.