special educational needs and disabilities trend report… · special educational needs and...
TRANSCRIPT

1
Special Educational Needs and Disabilities Trend Report Inclusion Summit April 2018

1
SEND Trend Report, Inclusion Summit, April 2018, Version 1
Local Context

2
SEND Trend Report, Inclusion Summit, April 2018, Version 1
Health Information - Source CCG Locality Profile 2017
General Population – Registered GP Population
Age Group Male Female People
0-4 4,358 4,153 8,511
5-9 4,902 4,689 9,591
10-14 4,850 4,165 9,015
15-19 4,984 4,380 9,364
20-24 4,558 5,638 10,196
Total: 23,652 23,025 46,677
Twenty three percent of the CCGs’ total registered population are under 19.
There were 1,501 live births in the CCG in 2015.
In 2016/17, there were 482 admissions per 100,000 population for lower respiratory tract infection in the CCG, which was similar to the national figure.
There were 212 unplanned admissions per 100,000 population for asthma, diabetes and epilepsy in the CCG, which was a lower rate than the national figure.
1,021 pre-school children (aged 2 to 5) and 1,655 children school-age children (aged 5 to 16) are estimated to have a mental health disorder.
1,000 young people (aged 16 to 19) are estimated to have a neurotic disorder.
The infant mortality rate in the borough during 2014/16 was 3.8 per 1,000 live births, which was similar to the national rate of 3.9.

3
SEND Trend Report, Inclusion Summit, April 2018, Version 1
Mental Health and Wellbeing
Estimated number of children with specific mental health disorders in Windsor, Ascot and Maidenhead CCG by age group and sex
Estimated number of young people aged 16-19 with neurotic disorders in Windsor, Ascot and Maidenhead CCG

4
SEND Trend Report, Inclusion Summit, April 2018, Version 1
Wellbeing – 2014/ 15 survey of 15 year olds
CAMHS
National RBWM
Wellbeing Score 47.6 48.7
% low life satisfaction 13.70% 10.80%
Been bullied 55.00% 53.90%
Perpetrated bullying 10.10% 11.60%

5
SEND Trend Report, Inclusion Summit, April 2018, Version 1
Hospital admissions for mental ill-health in children and young people In 2015/16, children aged 0 to 17 had 30 hospital admissions for mental health disorders in Windsor, Ascot & Maidenhead CCG. This was a rate of 46 per 100,000 population, which is significantly lower than the national rate of 85 per 100,000 population. Self-harming is much more common in children and young people who have mental health disorders, with approximately 10% of 15 to 16 year olds having self-harmed. In 2015/16, there were 81 hospital admissions for self-harm in Windsor, Ascot & Maidenhead CCG at a rate of 283 per 100,000 population. This was significantly better than the England rate of 423 per 100,000 population. It is important to note that hospital admissions do not show the full extent of self-harm. The majority of young people who do self-harm will either not harm themselves in a way that needs medical treatment or they will deal with it themselves. Trend data is not available at a CCG level for both of these indicators, as they were first published in 2014/15.

6
SEND Trend Report, Inclusion Summit, April 2018, Version 1
Hospital admissions for mental health conditions per 100,000 population aged 0 to 17
(2010/11 to 2015/16)
Hospital admissions as a result of self-harm per 100,000 population aged 10 to 24 – directly standardised rate
(2012/13 to 2015/16)

7
SEND Trend Report, Inclusion Summit, April 2018, Version 1
Early Help Services
The total number of referrals in the periods March 2017 – March 2018 was 789.
For more information, please go to the Local Offer and search Early Help Services.
0
50
100
150
200
250
300
350
400
Health Social Care Schools Other
Targeted Referrals and Interventions March 2017 - March 2018
8
SEND Trend Report, Inclusion Summit, April 2018, Version 1
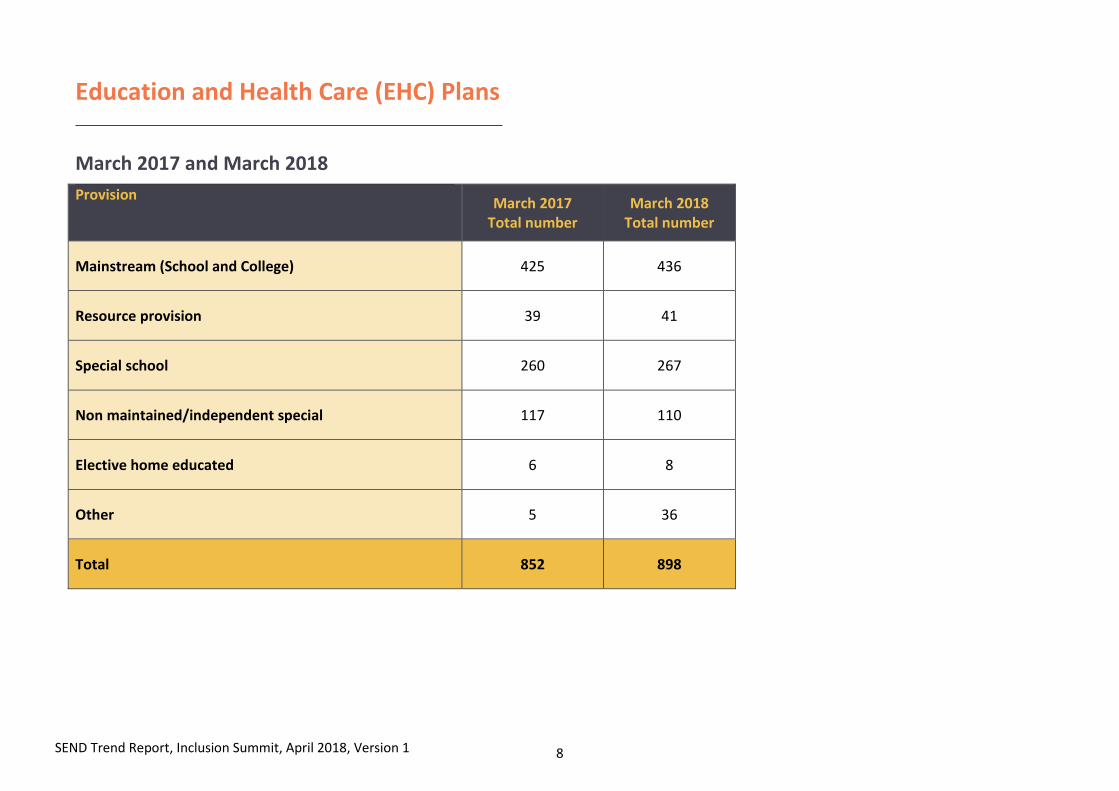
Education and Health Care (EHC) Plans
March 2017 and March 2018
Provision March 2017
Total number March 2018
Total number
Mainstream (School and College) 425 436
Resource provision 39 41
Special school 260 267
Non maintained/independent special 117 110
Elective home educated 6 8
Other 5 36
Total 852 898

9
SEND Trend Report, Inclusion Summit, April 2018, Version 1
Primary Need Table
Primary Need 2017 2018
Autistic spectrum disorder 291 303
Social emotional and mental health 104 106
Hearing impairment 17 21
Moderate learning difficulty 92 93
Multi-sensory impairment 0 0
Physical disability 48 46
Visual impairment 12 12
Profound and multiple learning difficulty 18 18
Speech, language and communication needs 166 185
Severe learning difficulty 9 12
Specific learning difficulty 67 70
Other 28 32
Total 852 898

10
SEND Trend Report, Inclusion Summit, April 2018, Version 1
Primary Need Graph 2017 and 2018
0
50
100
150
200
250
300
350
Primary Need 2017
Primary Need 2018

11
SEND Trend Report, Inclusion Summit, April 2018, Version 1
March 2017
Placed within borough - 596
Placed out of borough - 256
Education Placements by location
March 2018
Placed within borough - 622
Placed out of borough - 276
12
SEND Trend Report, Inclusion Summit, April 2018, Version 1
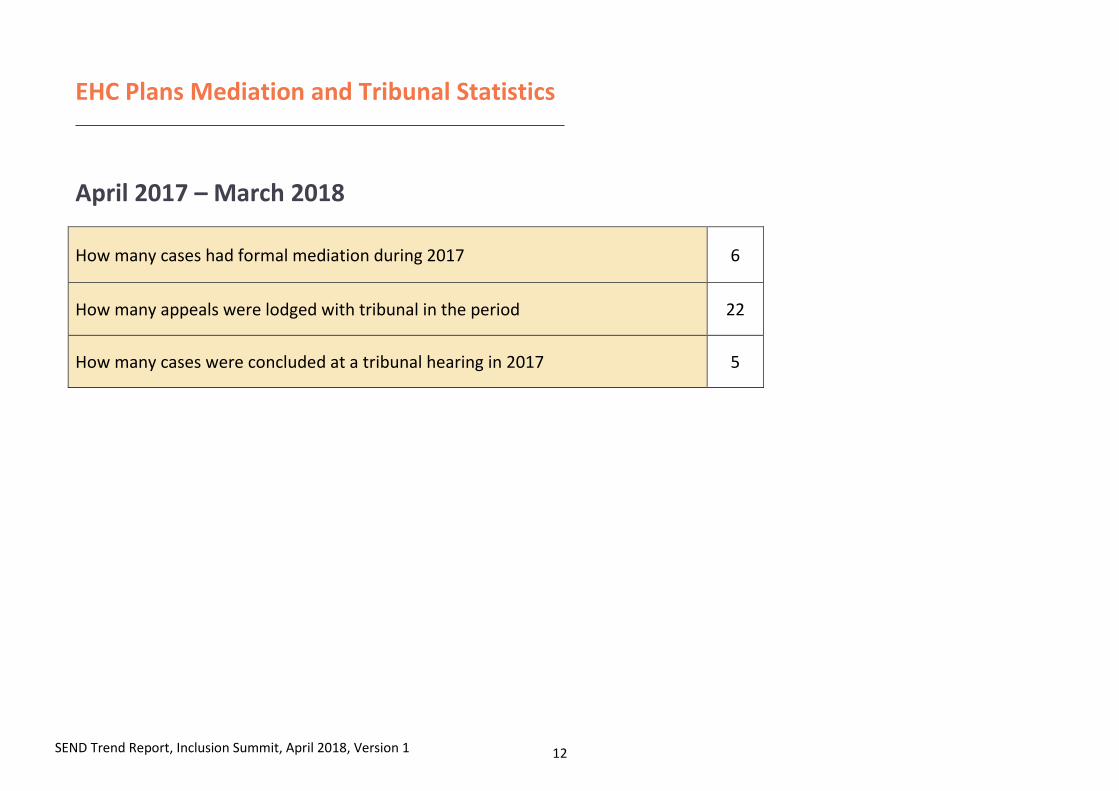
EHC Plans Mediation and Tribunal Statistics
April 2017 – March 2018
How many cases had formal mediation during 2017 6
How many appeals were lodged with tribunal in the period 22
How many cases were concluded at a tribunal hearing in 2017 5
13
SEND Trend Report, Inclusion Summit, April 2018, Version 1
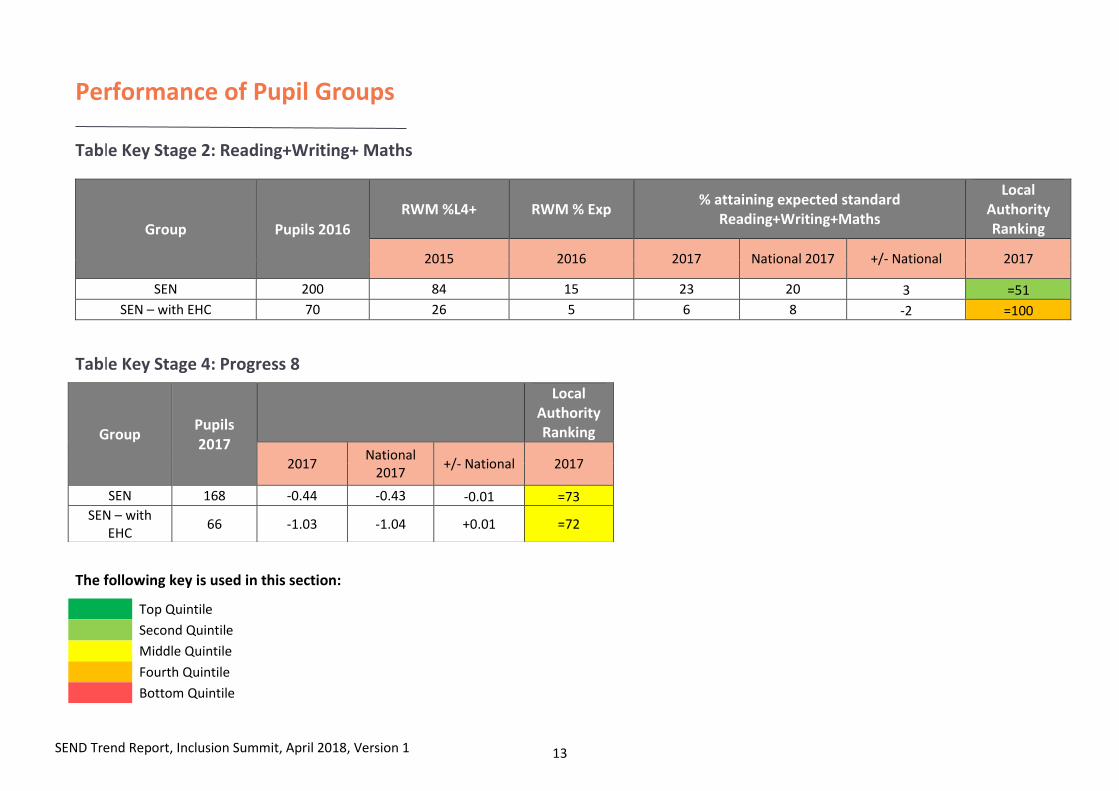
Performance of Pupil Groups
Table Key Stage 2: Reading+Writing+ Maths
Group Pupils 2016
RWM %L4+ RWM % Exp % attaining expected standard
Reading+Writing+Maths
Local Authority Ranking
2015 2016 2017 National 2017 +/- National 2017
SEN 200 84 15 23 20 3 =51
SEN – with EHC 70 26 5 6 8 -2 =100
Table Key Stage 4: Progress 8
The following key is used in this section:
Group Pupils 2017
Local Authority Ranking
2017 National
2017 +/- National 2017
SEN 168 -0.44 -0.43 -0.01 =73
SEN – with EHC
66 -1.03 -1.04 +0.01 =72
Top Quintile
Second Quintile
Middle Quintile
Fourth Quintile
Bottom Quintile

14
SEND Trend Report, Inclusion Summit, April 2018, Version 1
SEND K vs EHCP October 2017

15
SEND Trend Report, Inclusion Summit, April 2018, Version 1
This Trend Report can be found on the Local Offer. Please follow the below link:
http://directory.rbwm.gov.uk/kb5/rbwm/directory/site.page?id=3u8vDR0FHSc&familieschannel=3
Or type: Local Area SEND Inspection July 2017 in the Local Offer Keywords section