special projects studies and research projects pdf version of this publication is available on the...
TRANSCRIPT

Studies and Research Projects
REPORT R-787
Martin LebeauPatrice Duguay
The Costs of Occupational InjuriesA Review of the Literature
Special Projects

The Institut de recherche Robert-Sauvé en santé et en sécurité du travail (IRSST),established in Québec since 1980, is a scientific research organization well-known for the quality of its work and the expertise of its personnel.
MissionTo contribute, through research, to the prevention of industrial accidents and occupational diseases and to the rehabilitation of affected workers;
To disseminate knowledge and serve as a scientific reference centre and expert;
To provide the laboratory services and expertise required to support the public occupational health and safety network.
Funded by the Commission de la santé et de la sécuritédu travail, the IRSST has a board of directors made upof an equal number of employer and worker representatives.
To find out moreVisit our Web site for complete up-to-date informationabout the IRSST. All our publicationscan be downloaded at no charge.www.irsst.qc.ca
To obtain the latest information on the research carriedout or funded by the IRSST, subscribe to Prévention autravail, the free magazine published jointly by theIRSST and the CSST.Subscription: www.csst.qc.ca/AbonnementPAT
Legal DepositBibliothèque et Archives nationales du Québec2013ISBN: 978-2-89631-682-3 (PDF)ISSN: 0820-8395
IRSST – Communications and Knowledge Transfer Division505 De Maisonneuve Blvd. West Montréal, QuébecH3A 3C2Phone: 514 288-1551Fax: 514 [email protected]© Institut de recherche Robert-Sauvéen santé et en sécurité du travail,July 2013
OUR RESEARCHis working for you !

A PDF version of this publication is available on the IRSST Web site.
Studies andResearch Projects
The Costs of Occupational InjuriesA Review of the Literature
Special Projects
This study was funded by the IRSST. The conclusions and recommendations are solely those of the authors.This publication is a translation of the French original; only the original version (R-676) is authoritative.
REPORT R-787
Disclaimer
The IRSST makes no guarantee as to the accuracy, reliability or completeness of the information in this document. Under no circumstances may the IRSST be held liable for any physical or psychological injury or material damage resulting from the use of this information.
Document content is protected by Canadian intellectual property legislation.
Martin Lebeau, Patrice Duguay
Scientific Division, IRSST

In compliance with IRSST policy, the research results published in this document have been peer-reviewed.
PEER REVIEW
IRSST – The Costs of Occupational Injuries - A Review of the Literature i
ABSTRACT This literature review is part of the IRSST’s effort to develop economic indicators in the occupational health and safety field on which, in combination with the indicators and other information already in use at the IRSST, decisions regarding research priorities can be based. More specifically, this report attempts to indentify, define, and classify the cost components of occupational injuries and to catalogue the various economic approaches used to estimate the related costs. It does not, however, attempt to catalogue the actual or estimated amounts of the costs of occupational injuries as found in the literature. The costs of occupational injuries can be grouped into three categories: direct costs, indirect costs, and human costs. There is no consensus regarding what each category comprises. Generally speaking, direct costs consist of components associated with the treatment and “repair” of the injury, such as medical costs. Direct cost data are usually quite easy to obtain and do not require the use of special estimation methods. Indirect costs are considered to be costs related to the lost opportunities for the injured employee, the employer, the co-workers, and the community. They consist mainly of salary costs, administrative costs, and productivity losses. Compared with direct costs, indirect costs are usually more difficult to measure and are rarely insured. Human costs relate to the value of the change in the quality of life of the worker and the people around him1. In the literature, human capital is by far the most widely used method for estimating indirect costs. It takes remuneration as the basis for measuring the worker’s contribution to society and has the advantage of using reliable data and of being relatively easy to apply and understand. For estimating human costs, the willingness-to-pay method is the method preferred by economists. It consists of estimating the amount that an individual or society is prepared to pay in order to reduce the exposure to risk. The estimates obtained using this method include both indirect and human cost components. Studies that favour this method obtain amounts much higher than those obtained using the human capital method, which implies that the human costs are quite high. However, the willingness-to-pay method is based on very restrictive assumptions and is difficult to apply. Data availability and the reason why the costs of occupational injuries and data availability are being estimated are both factors that will influence the choice of the method to be used and of the cost components to be considered. Moreover, a complete estimate of the cost of occupational injuries is not necessary in every situation. What is important is to use a cost estimation method that will provide results reliable enough to serve as a basis for decision-making.
1 The systematic use of the masculine gender in this document is intended solely to facilitate reading and has no discriminatory intent.


IRSST – The Costs of Occupational Injuries - A Review of the Literature iii
CONTENTS
ABSTRACT ..................................................................................................................... I
CONTENTS ................................................................................................................... III
TABLES .......................................................................................................................... V
FIGURES ........................................................................................................................ V
1. INTRODUCTION ...................................................................................................... 1
2. OBJECTIVES .......................................................................................................... 3
3. BIBLIOGRAPHIC RESEARCH ............................................................................... 5
3.1 Bibliographic research methodology............................................................................... 5
3.2 Methodological aspects of the studies ............................................................................. 6 3.2.1 Perspectives..................................................................................................................... 6 3.2.2 Data sources .................................................................................................................... 7 3.2.3 The approaches ............................................................................................................... 7 3.2.4 Time dimension .............................................................................................................. 8 3.2.5 Discounting ..................................................................................................................... 9
4. IDENTIFYING THE COSTS OF OCCUPATIONAL INJURIES .............................. 11
4.1 Direct costs ....................................................................................................................... 11
4.2 Indirect costs.................................................................................................................... 13
4.3 Human costs .................................................................................................................... 19
5. METHODS FOR ESTIMATING THE COSTS OF OCCUPATIONAL INJURIES ... 21
5.1 Human capital ................................................................................................................. 21
5.2 Friction costs.................................................................................................................... 23
5.3 Willingness to pay ........................................................................................................... 25
5.4 Health status index methods .......................................................................................... 31
5.5 Jury awards ..................................................................................................................... 33

iv The Costs of Occupational Injuries - A Review of the Literature – IRSST
6. SPECIAL CHARACTERISTICS OF COMPANY CASE STUDIES ........................ 37
6.1 The shared methodological approach ........................................................................... 37
6.2 The first studies ............................................................................................................... 37
6.3 Québec studies ................................................................................................................. 39
7. CAVEATS AND LIMITATIONS OF THE SURVEYED STUDIES .......................... 43
7.1 Who actually pays? ......................................................................................................... 43
7.2 Double-counting .............................................................................................................. 43
7.3 Human costs .................................................................................................................... 45
7.4 Underreporting ............................................................................................................... 46
7.5 Data accessibility ............................................................................................................. 47
7.6 Occupational diseases ..................................................................................................... 47
7.7 Generalization ................................................................................................................. 48
8. CONCLUSION ....................................................................................................... 49
9. AVENUES FOR FURTHER REFLECTION ........................................................... 51
10. BIBLIOGRAPHY .................................................................................................... 55
APPENDIX 1: BIBLIOGRAPHIC RETRIEVAL FORMULAS ........................................ 65
APPENDIX 2: SUMMARY OF THE APPLIED STUDIES ............................................. 67
APPENDIX 3: DISCOUNT RATE CALCULATION....................................................... 69
APPENDIX 4: COST COMPONENTS OF OCCUPATIONAL INJURIES ..................... 71
APPENDIX 5: HEALTH STATUS INDICES ................................................................. 73
APPENDIX 6: OCCUPATIONAL INJURY COST COMPONENTS IN THE QUÉBEC STUDIES ............................................................................................... 75

IRSST – The Costs of Occupational Injuries - A Review of the Literature v
TABLES Table 1 – Analysis of incidence and prevalence ......................................................................... 8
Table 2 – Hiring and training costs ........................................................................................... 17
Table 3 – Numbers and costs of work accidents and occupational diseases .......................... 23
Table 4 – Injury- and disease-related disability weights ......................................................... 29
Table 5 – Relative disutility factors by injury severity level ................................................... 30
Table 6 – Amounts awarded for human costs by severity of injury ....................................... 34
Table 7 – Multivariate regression analysis of the variables with an impact on the indirect costs of work accidents ............................................................................................... 40
Table 8 – Life values used by the agencies of various countries ............................................. 46
Table 9 – Health Utilities Index Mark 3 (HUI3) ...................................................................... 73
Table 10 – EuroQol EQ-5D ........................................................................................................ 74
FIGURES Figure 1 – Accident cost iceberg ................................................................................................ 38
Figure 2 – Situation with no occupational injury ..................................................................... 44
Figure 3 – Situation with an occupational injury ..................................................................... 44


IRSST – The Costs of Occupational Injuries - A Review of the Literature 1
1. INTRODUCTION
In his work The Wealth of Nations (1776), Adam Smith states that workers’ wages vary according to the work conditions that the workers experience. This assertion indicates that there is a market for risk. In accepting a job, workers also accept its characteristics, including the associated risk. A risk premium is therefore included in the equilibrium wage. One could suppose that, in a perfect market, where workers had access to complete information about the work-related risks and enjoyed total mobility, such a premium would be sufficiently high to compensate them in the event of an accident. In such a scenario, it would be in employers’ interest to make optimal investments in occupational health and safety (OHS) in order to reduce the premium and obtain an edge over their competitors. In the real world, however, the hazards encountered at work are not systematically known and workers’ mobility is limited by several factors (linguistic, cultural, social, geographic). Government intervention, in the form of a mandatory insurance plan, is consequently justifiable. In recent years, around 100,000 applications for compensation for occupational injuries have been accepted annually by the Commission de la santé et de la sécurité du travail (CSST), the Québec workers’ compensation board. Although these occupational injuries entail significant costs for society as a whole, they can be reduced through prevention activities. However, to optimize decision-making, it is important that reliable estimates of the costs of occupational injuries be available. With the mission of contributing, through research, to the prevention of occupational injuries and occupational disease, the IRSST intends to develop economic indicators in the OHS field on which, among other things, decisions regarding research priorities can be based. These indicators are to be developed using available data and one or more reliable methods that are applicable to Québec’s specific context. To assist the IRSST in choosing the most appropriate methods, this report provides a detailed overview of the state of knowledge regarding the evaluation of the costs of occupational injuries. This literature review will be used to determine which methodology to apply and which types of costs to consider when developing economic indicators useful for establishing directions in OHS research. This report is divided into nine chapters. Following the induction, the second chapter presents the study’s specific objectives. The bibliographic research methodology and methodological aspects of the surveyed studies are presented in the third chapter. The fourth chapter defines the three main cost categories (direct, indirect, and human). The fifth chapter presents the five methods for estimating the costs of occupational injuries most widely used in the literature. The sixth chapter describes the special aspects of studies carried out in companies. The seventh chapter examines various limitations and caveats regarding estimation of the costs of occupational injuries. Lastly, chapters eight and nine bring the report to a close with a conclusion and avenues for future reflection regarding the development of economic indicators at the IRSST.


IRSST – The Costs of Occupational Injuries - A Review of the Literature 3
2. OBJECTIVES This research report aims to provide an overview of the current state of knowledge regarding the evaluation of the direct and indirect costs of occupational injuries. This overview will be used in developing economic indicators relevant to OHS research directions. This report also has two specific objectives: 1. Identify, define, and classify the cost components of occupational injuries;
2. Present the various methods that can be used to estimate the costs of occupational injuries.


IRSST – The Costs of Occupational Injuries - A Review of the Literature 5
3. BIBLIOGRAPHIC RESEARCH In this section, we present in detail of the steps followed to indentify and select the various studies from the literature. Then we define several basic aspects that characterize the studies. 3.1 Bibliographic research methodology
A bibliographic key word search of various databases was carried out in March 2009 using the IRSST information library. The following databases were searched: ABI/Inform, Canadiana, INRS, EconLit, OSH Update, PAIS International, Proquest European Business, PubMed, ScienceDirect, Social Sciences Full Text, and the CSST network catalogue. Several key words and combinations of key words were used in both French (e.g. accidents du travail, coûts directs, coûts indirects) and English (e.g. direct costs, indirect costs, illness, injury, occupational injuries, workplace injuries). The exact bibliographic research retrieval formulas are listed in Appendix 1. This bibliographic research identified 935 documents. To make managing them easier, all the references were complied in Reference Manager, a database management program. Initially, nearly 700 documents irrelevant to the research topic were rejected after a first pass. The large number of rejected documents was due to the fact that we used broad selection criteria in order to be as exhaustive as possible. Then, after reading each of the abstracts, the number of relevant references was reduced to 42. We excluded all works that did not consider the indirect costs of occupational injuries.2 The full versions of 41 of these documents were obtained; one document could not be found. The research was then completed using various Internet-accessible search engines and the references found in various documents. This added 36 more documents, giving a total of 77. Each of the 77 documents was read and sorted into two categories: theoretical studies and applied studies. By theoretical studies, we mean studies that develop models or theories, that define concepts, or that present a state of knowledge. By applied studies, we mean studies that aim to evaluate the costs of occupational injuries using empirical data. Ten documents were not retained due to the insignificance of their contribution. Of the 67 remaining documents, 27 were theoretical studies and 40 applied studies. The characteristics of the 40 applied studies were summarized in an Excel file. A summary of that file, which includes the main characteristics of the 40 documents, will be found in the table in Appendix 2. The table shows that 65% of the collected applied studies originated from the United States and that 38% were carried out by the United States researchers Paul Leigh and Ted Millar, six of them jointly.
In addition, an impact factor was used to measure the importance of the journals in which the studies were published.3 However, it should be noted that this impact factor is available only for the scientific journals tracked by the Institute for Scientific Information.
2 For example, some of the rejected studies dealt only with evaluating the direct costs of occupational injuries. Our research criteria also excluded any studies that dealt with the cost of non-occupational injuries (e.g. traffic accidents, AIDS, etc.). 3 The impact factor is calculated by dividing the number of citations by the number of articles published over a specified time period.

6 The Costs of Occupational Injuries - A Review of the Literature – IRSST
3.2 Methodological aspects of the studies
On reading the surveyed studies, we noted that estimating the costs of occupational injuries may be approached from various angles. In this section of the report, we present the methodological choices that are available to researchers and can have an impact on cost estimation. These are basic methodological aspects that characterize the studies and allow them to be classified. In Appendix 2, the applied studies that we retained are classified according to these various methodological aspects. 3.2.1 Perspectives
The perspective corresponds to the level of analysis or point of view that is chosen in order to estimate the costs. Choosing a perspective is directly related to the objective of the study and will naturally influence the estimates. The company perspective
The first studies on estimating the costs of occupational injuries were mainly interested in the costs for a company. This type of study focuses on all the financial consequences that the injuries will have on the company’s bottom line. Among the components considered are the stopping or slowing down of production, recruitment and training costs, property damage, insurance contributions, and the loss of contracts, to name only those. The government perspective
The government perspective considers only the costs assumed by the government, such as those of the health care and justice systems (Choi and Pak, 2002). No study surveyed in the bibliographic search dealt exclusively with the costs borne by government. The worker perspective
In addition to the financial consequences, the worker perspective takes into account intangible costs that result from occupational injuries, such as pain, suffering, anxiety, and loss of enjoyment of life. However, these types of cost are very difficult to estimate. The worker perspective can also take into account the impacts of the injuries on the victim’s family. The societal perspective
The most recent studies are interested more in the injuries’ impact on society as a whole.4 Generally speaking, the costs are estimated for the various economic agents of a society and then totalled.
4 As seen in Appendix 2, 63% of the applied studies we retained analyzed the costs from the societal perspective.

IRSST – The Costs of Occupational Injuries - A Review of the Literature 7
To avoid double-counting, transfer payments should not be considered in this perspective, because these payments only transfer the burden from the individual to society and do not alter society’s total resources (Choi and Pak, 2002). 3.2.2 Data sources
The data sources are usually related to the perspective. When estimating the costs in a specific company (e.g. Lanoie and Tavenas, 1995; Lavoie, 2000), the source will be the company concerned. Estimating the costs for society as a whole (e.g. Leigh et al., 2000; Whaehrer et al., 2007) usually requires several national data sources. For example, U.S. studies often use data from a variety of agencies, such as the Bureau of Labor Statistics (BLS), the National Council on Compensation Insurance (NCCI), and the Centers for Disease Control and Prevention (CDC). 3.2.3 The approaches
In the studies on estimating the costs of occupational injuries, we note two main approaches: the top-down approach and the bottom-up approach. No precise definition of these two approaches exists. Generally speaking, the top-down approach uses aggregated cost data to obtain more detailed estimates, while the top-down approach uses relatively detailed data to obtain a more generalized picture. An example of the top-down approach that is often found in the literature consists of initially estimating the costs, from a national standpoint, of all the injuries that occurred during a specific period. The costs are then sorted by type of outcome (injury, disease, death). Lastly, a percentage of the costs is assigned to the occupational injuries. This last step is very important and often requires estimates from a large number of studies. The top-down approach has the advantage of requiring less detailed data than the bottom-up approach. However, the large number of assumptions necessary to make the cost estimates is a source of inaccuracy.
An example of a bottom-up approach consists of initially obtaining the number of actual or estimated occupational injuries for each injury category during a predetermined period. The average cost of these injuries is then estimated. Lastly, the number of injuries is multiplied by their average cost for each of the occupational injury categories.
This latter approach is usually preferred by researchers, as it involves fewer assumptions (Leigh et al., 2000). However, it does require a large amount of data for, among other things, estimating the average costs of the various injuries and diseases. The majority of the surveyed studies use a bottom-up approach. Some researchers use both approaches in the same analysis (see Appendix 2).

8 The Costs of Occupational Injuries - A Review of the Literature – IRSST
3.2.4 Time dimension
The time dimension is important in analyzing the costs of occupational injuries, as an injury can have financial consequences that extend over several years. Researchers generally approach the problem via an analysis of incidence or prevalence. Estimating the incidence of the costs of occupational injuries involves taking the new injuries that occur during a specific year and estimating the total costs of the injuries irrespective of whether they are spread over one or more years. This type of analysis has the advantage of measuring the actual impact of prevention (Biddle, 2004). However, since all the costs associated with the injury do not occur in the same year, the future costs have to be predicted and discounted, which introduces a degree of inaccuracy into the estimates.5 A prevalence-based analysis focuses solely on the costs incurred in a specific year, irrespective of the date on which the injury occurred. This approach is much simpler to apply, as it requires fewer data and makes no assumptions regarding future costs. The approach is widely used at the government level because it facilitates year-to-year budgeting of expenditures (Freeman et al., 2001).
Table 1 – Analysis of incidence and prevalence
t-2 t-1 t0 t1 t2 Injury A A-2 A-1 A0 Injury B B-1 B0 B1 Injury C C0 C1 C2
Table 1 illustrates the difference between the two approaches. It lists three injuries (A, B, and C). The injuries occurred in years t-2, t-1, and t0 respectively and each generated costs for three consecutive years. The objective is to measure the costs in year t0. With an incidence-based analysis, the costs are calculated by totalling C0 and the discounted values of C1 and C2. Thus, only injury C is considered, as it is the only injury that occurred in year t0.
Incidence: 22
11
0 )1()1( rC
rCCCosts
++
++= (1)
where r is the discount rate. With a prevalence-based analysis, the costs are calculated by totalling the A0, B0 and C0 figures. In other words, it is all the costs paid in year t0. Prevalence: 000 CBACosts ++= (2) Generally speaking, for injuries that generate costs over only a short period, both approaches produce similar results. For injuries that generate costs over a long term, the incidence-based approach produces lower results due to discounting. Moreover, if it is assumed that medical
5 Discounting consists of expressing future cash flows in current dollars (see section 3.2.5).

IRSST – The Costs of Occupational Injuries - A Review of the Literature 9
practice and technology do not evolve, the two methods will produce similar results, all other things being equal. However, if changes in medical practices and technology are foreseen, the incidence-based cost estimates will reflect these changes (Moore et al., 1997). According to Hartunian et al. (1980), neither incidence nor prevalence is superior in every situation. The choice between them usually depends on data availability. In the literature, several researchers recommend a combination of the two cost measurement approaches. 3.2.5 Discounting
In the surveyed studies, the time dimension inherent in the consequences of occupational injuries sometimes involves the use of discounting. Discounting is a mathematical operation that makes it possible to compare economic values over time. It consists of expressing the future value of a property or expenditure as a current value (Montmarquette and Scott, 2007). Discounting is based on the concept of the value of time, which is reflected in our preference for instant gratification. We prefer to have a dollar today instead of a dollar tomorrow. The same attitude, albeit inverted, applies to costs. We prefer to pay later instead of now Generally speaking, the discounting of a cash flow F can be expressed as:
nr
FF)1(
*+
= (3)
where - F* is the discounted value of the cash flow; - F it the cash flow; - r is the discount rate; - n is time, usually expressed as years, from the discounting date to the cash flow date.
Choosing the appropriate discount rate is both very important and very tricky. For example, imagine a company that wants to invest in prevention. The investment concerned requires immediate expenditures while the benefits, in terms of avoided costs, will be obtained only in the medium to long term. If the discount rate used is too high, the discounted value of the benefits will be too small and the company may decide not to invest in the project. In this example, it would be as though the company attached too high a value to the present to the detriment of the future. In the literature, the consensus is to use a discount rate that reflects the time preference of the group concerned. This means there is no single discount rate that applies in every situation. For companies, the appropriate discount rate is the weighted average cost of capital (WACC). At the societal level, the social opportunity cost of capital (SOCC) is used. These two measures are discussed in detail in Appendix 3. Based on the work of Jenkins and Kuo (2007), the Treasury Board of Canada Secretariat (2007) recommends using a public discount rate of 8%. However, when the benefits are in the distant

10 The Costs of Occupational Injuries - A Review of the Literature – IRSST
future, as is the case for environment and health care benefits, a lower rate is suggested.6 One of the recommended approaches consists of estimating the time preference rate based on the rate at which society discounts future consumption and on the forecast consumption growth rate. For Canada, the time preference rate has been estimated as being around 3% (Treasury Board of Canada Secretariat, 2007). In the 40 applied studies listed in Appendix 2, the discount rates vary from 2.5% to 6%, with an average of 3.6% and a mean of 3.4%. Hodgson and Meiners (1982) recommend that researchers always test two or three discount rates, ranging from 2.5% to 10%, in order to determine the rate’s impact on the size of the costs of the various injuries.
6 In addition, for this type of investment, there are no or minimal resources involving opportunity costs (Treasury Board of Canada Secretariat, 2007).

IRSST – The Costs of Occupational Injuries - A Review of the Literature 11
4. IDENTIFYING THE COSTS OF OCCUPATIONAL INJURIES
This section presents the various cost components likely to result from occupational injuries. It is not a detailed presentation of all possible and imaginable costs but rather a presentation of the main cost categories found in the literature. A table summarizing the various cost categories will be found in Appendix 4. Each category is also broken down by the main economic agents.7 Most studies separate the costs into two categories: direct costs and indirect costs. Sometimes the terms insured and uninsured costs, tangible and intangible costs, or visible and invisible costs are used. These terms are usually interchangeable, even if they do not always comprise the same cost components. In this study, we use the terms direct and indirect costs, as we consider these by far to be the terms most widely used in the literature. On reading the documents obtained through the bibliographic research, we note that there appears to be no consensus regarding the components that belong to the two cost categories. A component may be considered a direct cost in one study and an indirect cost in another. This situation becomes problematic when one wants to compare studies.8 That is why it is not necessarily useful to distinguish between direct and indirect costs (Access Economics, 2006). In fact, several studies do not make the distinction. Recent studies increasingly include a third cost category, human costs (also called pain and suffering costs). Some authors classify these as indirect costs; others include some components in direct costs (e.g. compensation for bodily harm and permanent disability). We opted to create a third cost category because of the intangible aspect related to these costs and the difficulty in estimating them. Moreover, recent studies increasingly use this way of classifying human costs. 4.1 Direct costs
Some authors define direct costs as those directly related to the injury, others as those directly related to the accident. Although similar, the two definitions do not refer to the same costs. The first definition is limited to the components associated with treatment and “repair” of the injury, while the second definition also includes other cost components directly related to the accident, such as property damage. Generally speaking, direct costs are insured and easily measureable. Medical costs
Nearly all the studies include medical, hospitalization, and rehabilitation costs among the direct costs. These costs correspond to all the incurred and projected expenses for providing medical care to an injured or sick worker. In addition to the amounts spent on medical personnel, medical equipment, and medications, transportation and administrative (hospital) expenses are often included under this heading.
7 The costs for the worker also include the costs for those near to him (family and friends). 8 Especially if one is interested in the indirect/direct cost ratios that are sometimes estimated in these studies.

12 The Costs of Occupational Injuries - A Review of the Literature – IRSST
This information can be obtained from a government agency that provides work accident insurance or gathers information on the subject, such as the National Council on Compensation Insurance (NCCI) in the United States. In Québec, it is the Commission de la santé et de la sécurité du travail (CSST) that acts as the public insurer. The mandatory plan put in place by the CSST is funded entirely by employers’ annual contributions. Thus, it is they who assume these costs for compensated injuries. The accident victim may be responsible for some medical expenses that are usually covered by the occupational health and safety plan if they have not been prescribed by a physician and the injury has not been declared an occupational injury. These medical expenses may consist of medication, medical equipment, or even health care (chiropractic, osteopathy, psychology, etc.). Private insurers may be responsible for some expenses. This may happen when the worker is fearful of the consequences of declaring an occupational injury. For example, a worker who suffers a back injury at his workplace, may decide to go to a chiropractor and claim that the accident occurred at home. These fees are nonetheless assumed indirectly by the employer and the worker through their health insurance premiums. At the societal level, there is a cost for the public health care system, specifically regarding the availability of limited resources.9 Property damage
Property damage is defined as being all the damage caused to the company’s machines, tools, and other property (Access Economics, 2006). This includes equipment replacement and repair costs, the value of damage caused to goods, and any clean-up costs. These costs are very difficult to estimate without conducting a survey in the company via a questionnaire. In the studies that use national data, an average obtained from the literature is typically used. Among the 40 selected studies, 19 included property damage costs. However, there is no consensus on how to classify these costs. Around half of the studies consider the costs to be direct costs while the other half considers them indirect costs. Major damage is usually covered by the insurance policies that the companies take out. The cost of such damage is thus indirectly assumed by the companies through their insurance premiums. Emergency services
Some studies (around 25%) include police and/or firefighter services among the direct costs. These costs are assumed by the community. Most of the time, estimates obtained from other studies are used to calculate these costs. Ambulance transportation, which may be considered part of the medical costs, is usually the responsibility of the employer when an accident occurs at the workplace.
9 In addition, the medical costs resulting from an injury to a worker not covered by an occupational health and safety plan are assumed by the community.

IRSST – The Costs of Occupational Injuries - A Review of the Literature 13
Funeral costs
Some work accidents and occupational diseases may result in death. These deaths entail funeral costs, which would normally have been paid for at a later date. The actual cost is the cost of having to organize the funeral earlier than expected. These funeral costs can be estimated using the following equation (Access Economics, 2006):
nrFCFCFC
)1(* 1
1 +−= (4)
where
- FC* are the premature funeral costs; - FC1 are the funeral costs at date 1 (date of death); - r is the real interest rate (nominal interest rate corrected for inflation); - n is the number of years of life lost, based on the worker’s life expectancy.
These costs are assumed by the family of the deceased. However, the person who pays them may receive partial reimbursement for them in the form of a death benefit.10 4.2 Indirect costs
Indirect costs are costs that are not directly related to the treatment and repair of the injury but rather to the lost opportunities of the injured employee, his family, the employer, the co-workers, and the community (Leigh et al., 2000). In contrast to direct costs, indirect costs do not usually involve out-of-pocket expenses and are not usually insured. This means they are much more difficult to measure. Productivity
Productivity losses are a very large cost component of occupational injuries. They stem from the stopping or slowing down of production due to property damage or accidents that affect employees’ physical integrity (Gosselin, 2004). Such productivity losses may take various forms:
- Productivity of the worker injured on the day of the accident; - Productivity of the other employees who came to the assistance of the injured worker; - Reduced productivity due to property damage; - Productivity of the worker absent from the labour market; - Productivity of the injured worker on returning to work (at his usual job); - Productivity of the injured worker on temporary assignment; - Productivity of the replacement worker.
It should be noted that the impact on the company’s overall productivity will be influenced by the company’s production structure. For example, the productivity losses resulting from a work
10 In 2010, the CSST reimburses, to the person who paid for them, funeral costs of up to $4,617 plus the cost of transporting the deceased’s body (CSST, 2010a).

14 The Costs of Occupational Injuries - A Review of the Literature – IRSST
accident would be greater in a company whose operations are based on an assembly line, where a problem in one part of the line creates delays in all subsequent parts of the line than in a company whose operations are based on production units. It is not easy to accurately estimate productivity losses without conducting a survey in the company. In that type of study, the productivity losses can be measured directly by determining the value of the decrease in production during the period concerned.11 In most cases, however, it is not possible to actually measure the productivity losses. To overcome this problem, most authors use the human capital method. The method uses workers’ pay to estimate the productivity losses. The human cost method is discussed in detail in section 5.1. Salary costs
As we have just seen, the worker’s wages can be used to estimate the productivity that is lost after an occupational injury. Some authors also consider other salary costs. However, care must be taken not to double-count when these two cost components are included in a given analysis. For the employer, in addition to the income indemnity paid by a compensation plan, salary costs can take two forms. First, pay increases related to the increase in risk. If a company or industry faces an increase in its risk of occupational injuries, the pay demanded by the workers, which incorporates a risk premium, may also increase. For the employer, this would correspond to a higher payroll expense in order to reach the same productivity level.12 Second, in an effort to return productivity to the level it was at before the accident, the co-workers may do overtime. The overtime would be another salary cost for the employer. For the injured worker, salary costs may arise during and after the injury. First, during the injury, the difference between the income replacement indemnity received by the injured worker and his net income is an earnings shortfall that is borne by the worker (Access Economics, 2006).13 Second, an occupational injury may lead to a change in the worker’s career path. If the change results in a lower pay cheque and the difference in pay is not fully covered by the compensation received, the worker has to absorb the difference. Salary costs can also have an impact on the community. First, they can decrease the government’s tax revenues. The pay decrease that an injured employee may incur can result in lower income tax receipts and to lower consumer tax receipts due to a decrease in purchases (Gosselin, 2004).14 Second, government financial assistance to workers who are unable to support
11 See Lavoie (2000) for an example of a productivity loss calculation in a mining company. 12 This wage increase can also have an impact on the contributions paid by the employer. 13 In 2010, the CSST’s income replacement indemnities are 90% of the net earnings or of the maximum insurable salary of $62,500. 14 It should be noted that the drop in corporate profits can also have an impact on the government’s tax revenues.

IRSST – The Costs of Occupational Injuries - A Review of the Literature 15
themselves financially may be necessary. This financial assistance can take the form of an assistance allowance or employment insurance benefits.15 Generally speaking, the above-mentioned salary costs are rarely considered in the applied studies, except for studies in companies, where this type of information is more readily available. Employee benefits
Hensler et al. (1991) maintain that an individual’s pay does not fully reflect the remuneration he receives from work. Some workers receive employee benefits, which are paid by the employer and may be considered part of the workers’ income. The employer that pays for these employee benefits expects to recover the expenditures through its employees’ productivity. Several authors consider employee benefits as a measure of the productivity losses that result from occupational injuries. They use the value of the employee benefits that are normally paid to the worker (before the accident). To calculate the value of these employee benefits, a percentage of the worker’s pay is typically used. For example, Miller and Galbraith (1995) use 20% and Leigh et al. (2000) use 23.3%. It should be noted that several authors do not consider the employee benefits already included in the workers’ pay, such as vacations, holidays, and bonuses. Thus, employee benefits basically consist of employers’ contributions to pension plans and group insurance. Some studies are more interested in the employee benefits paid by the employer when the worker is on leave. These are not identical to the employee benefits paid before the accident. Take, for example, a Québec civil service employee. In cases of occupational injury, the employer is required to continue contributing to the worker’s pension plan (RREGOP) during his disability for up to three years. On the other hand, the employer does not have to contribute to the Québec Pension Plan (QPP) during the entire period during which the employee receives an income replacement indemnity from the CSST. A worker who suffers an occupational injury is usually exempted from having to contribute to his pension plans (e.g. QPP, RREGOP). In the literature, it is often noted that the worker may lose some employee benefits, such as training and career development. Some costs are assumed by the community when the worker is exempted from having to contribute or when the employer stops contributing to a pension plan (e.g. after three years of disability). Household work
Occupational injuries can have an impact on workers’ ability to perform household work. Hawrylyshyn (1978) defines household work as “those economic services produced in the household and outside the market, but which could be produced by a third person hired on the market without changing their utility to members of the household.” Examples include lawn
15 The recipients of this financial assistance are mainly workers who are not covered by an occupational health and safety plan.

16 The Costs of Occupational Injuries - A Review of the Literature – IRSST
maintenance, house cleaning, and meal preparation. In some cases, these expenses are covered by the occupational health and safety plan. To estimate the value of the time devoted to household work, Chandler (1994) suggests two approaches: the opportunity cost approach and the replacement cost approach. In the opportunity cost approach, the value corresponds to what is given up in order to perform the household work. The approach assumes that only paid work is given up. Accordingly, the value of one hour of household work is based on the pre-tax hourly earnings of the individual concerned. Although the approach has the advantage of being easy to apply, according to Douglass et al. (1990) it tends to produce excessively high estimates, since most of the tasks that make up household work can be done by lower paid workers. Moreover, individuals’ productivity when performing household work is probably lower than for their paid work (Graham and Green, 1984). The replacement costs approach estimates what it would cost on the market to have the household work performed. To do this, the hourly pay of workers who perform similar tasks (plumber, cleaning lady, cook, etc.) is obtained. This approach is difficult to apply because it requires assigning a value to each of the various household work tasks. To estimate the average time devoted to household work, researchers typically use the results of national surveys.16 For short-term disabilities, an average hourly wage is usually multiplied by the duration of the disability. For occupational injuries that result in long-term disabilities, the value of the household work is estimated using a discounting formula. Nearly half the applied studies surveyed in our review of the literature take account of household work that cannot be performed after the injury. While the two approaches defined above are the ones most commonly used to evaluate the costs, there does not appear to be a consensus regarding which is the better. Administrative costs
The administrative costs arising from a work accident are several and are borne mainly by companies. It is difficult to accurately measure the size of these costs because they are not usually accounted for in the financial statements. In this cost category are found the:
- Investigation costs resulting from an accident; - Administrative costs of the compensation board; - Administrative costs of the private insurers; - Cost of recruiting a new employee; - Cost of training a new employee.
The costs related to the investigation of an accident are difficult to evaluate unless as a survey is conducted in the company. In that case, the salary of the supervisor and other persons responsible
16 For example, in the U.S., there are the Panel Study of Income Dynamics (PSID), National Human Activity Pattern Survey (NHAPS), and Current Population Survey (CPS). In Canada, there is the General Social Survey (GSS).

IRSST – The Costs of Occupational Injuries - A Review of the Literature 17
are simply multiplied by the time devoted to the investigation. Otherwise, the estimate has to be based on data from other studies. Managing an occupational health and safety plan like the CSST necessarily comes with administrative costs (salaries and benefits, hardware and supplies, office leases, etc.). In the literature, a percentage of the premium paid by the employer is usually used. Miller and Galbraith (1995) maintain that, in the United States, these administrative costs amount to 13% of the premium.17 They are assumed entirely by companies through their insurance premiums. Companies can also take out several types of insurance policies from private insurers (property and casualty, third-party liability, etc.). Some work accidents can result in claims being submitted to these insurers. These claims come with administrative costs, which are included in the insurance premium and therefore assumed by employers. When an employer has to replace an employee, it necessarily incurs recruitment and training costs. These costs are hard to quantify, as they vary depending on the industry, administrative region (or city), status of the position to be filled, and point in the business cycle. Basing themselves on the work of Tangri (2003), Brun, and Lamarche (2006) provide a detailed description of what makes up the hiring and training costs (see table 2).
Table 2 – Hiring and training costs
Hiring costs • Costs to attract candidates (advertisements, agencies, etc.) • Costs to select candidates • Costs for interviews • Costs for psychometric assessments • Administrative, accounting, and legal costs • Travel and lodging expenses • Costs for medical examinations Training costs • Training costs • Other employees’ time for on-the-job training • Pay during training18 • Training of temporary and replacement personnel • Costs for the team of integrating a new member
Source: Brun and Lamarche (2006)
17 In the CSST’s 2008 annual report, administration costs are shown as totalling around $331 million, which corresponds to 14.5% of the total employer contributions. 18 This component may also be included in the productivity losses.

18 The Costs of Occupational Injuries - A Review of the Literature – IRSST
Once again, for company case studies, these costs can be evaluated by multiplying the time devoted to hiring and training by the wages of the persons responsible. For national studies, the costs have to be estimated using methods obtained from other studies. For example, Leigh et al. (2000) base themselves a study by Barron, Black and Lowenstein (1989) which estimates that an average 161 hours are required to hire and train a new employee during the first three months after his hiring. Assuming a wage of $15.24 (1992 US$), the authors assign a cost of $2,454 (1992 US$) to all deaths and injuries with permanent disability.19 However, as companies have a pre-accident employee turnover rate, any replacement of personnel due to occupational injuries would still have been required at some later point in time (e.g. retirements, dismissals, and resignations). Accordingly, several authors opt for estimating the cost for companies of recruiting now instead of later. Legal costs
Occupational injuries give rise to legal costs in several ways. First, decisions made by the CSST may be contested by workers or employers. Second, the CSST may take legal action against employers over the application of laws and regulations. Lastly, an employer may be sued on third-party liability grounds or under the Criminal Code.20 In all these cases, legal costs are incurred by the various parties involved. In addition, the use of public services (courts, legal staff, etc.) entails a cost for the community. Legal costs constitute a special case among cost components insofar as few accidents result in an investigation, a complaint, or legal action. In such cases, however, the costs may be quite high. In the literature, an average figure for legal costs is usually applied to all injuries. Brody et al. (1990a), using a survey of several companies, obtain average legal costs $68.17 (1990 C$) per injury and average costs of $956.69 per injury that resulted in legal costs.21 In 2007 and 2008, the CSST paid around $53 million to fund administrative tribunals (CSST, 2009). The funding of the Commission des lésions professionnelles (CLP), which is mandated to hear and decide on challenges to decisions made by the CSST, is responsible for nearly all these costs. All these costs are assumed by employers through their contributions. Reputation
Work accidents with occupational injuries can have a negative impact on the reputation of both parties involved. For the employer, an work accident, especially one covered by the media, can
19 Based on other assumptions, they determine an average recruitment and training cost of $149 (1992 US$) for temporary disabilities and $12 (1992 US$) for the other injuries with loss of time. 20 Civil proceedings against an employer following an occupational injury are generally not allowed under the Act respecting industrial accidents and occupational disease. 21 In the Brody et al. (1990a) study, the legal costs were obtained by adding together the costs for judicial proceedings and medical challenges.

IRSST – The Costs of Occupational Injuries - A Review of the Literature 19
affect its ability to recruit new employees and obtain new contracts. A worker who has suffered one or more severe occupational injuries may have trouble finding a new job. As these costs are very difficult to estimate, they are usually not considered in the applied studies. 4.3 Human costs
Human costs (also called pain and suffering costs), which are sometimes called intangible costs, are increasingly considered in estimates of the costs of occupational injuries.22 Of course, these costs are difficult to measure and easy to challenge. However, several authors agree that they are probably quite large and should not be ignored in studies.23 Essentially, human costs are based on the value of the change in the quality of life of the injured worker and those in his circle (family, friends, co-workers, and other members of the community). A definition of these costs, found in a study by professor David Weil, neatly summarizes the problem:
Quality of life is a difficult concept to define, but here refers to diminishment of health, psychological well-being, and family and social interactions arising from the injury. In some senses quality of life losses overlap with changes in household and other non-work time allocation described above. But they also go beyond this realm to include the burden imposed on the disabled by feelings of depression, anger, and pain arising from limitations in all realms of activity. (Weil, 2001)
In the surveyed studies, we noted three methods used to estimate human costs: willingness to pay, health status indices, and jury awards. These methods are discussed in detail in the next section.
22 In Appendix 2, we note that 33% of the applied studies collected estimate the human costs related to occupational injuries. As of the year 2000, 47% of the studies estimate these costs. 23 Hodgson and Meiners (1982) hold that human costs should be considered, even if they are not expressed in monetary terms.


IRSST – The Costs of Occupational Injuries - A Review of the Literature 21
5. METHODS FOR ESTIMATING THE COSTS OF OCCUPATIONAL INJURIES
In this section, we present the main methods available for estimating the costs of occupational injuries. Some of these methods are useful for estimating quite specific cost components, while others can be used to obtain a more general estimate of the costs. For each of the applied studies listed in Appendix 2, we have specified the method or methods used by the authors. However, it should be noted that these methods are not always used in their full theoretical expression. 5.1 Human capital
The human capital (HC) method is sometimes referred to as the direct/indirect method. This is because it is the method most frequently used in studies dealing with the direct and indirect costs of injuries.24 In reality, it is a method for estimating short- and long-term productivity losses. As we saw earlier, occupational injuries are often followed by a productivity loss. The loss corresponds to the value of what would have been produced had there been no accident. However, without conducting a survey in the company, it is usually impossible to measure the actual loss. To circumvent this problem, the human capital method is used to estimate the productivity loss based on the workers’ earnings. Theoretical underpinnings of the human capital method
The human capital method views an individual’s contribution to society as being his contribution to the gross domestic product (GDP).25 In other words, the decrease in productivity corresponds to the decrease in GDP. From this standpoint, it is society’s capacity for producing goods and services that is of primary interest. Neoclassical economic theory holds that companies will hire as long as their profits rise, i.e. as long as the cost of the last worker hired is less than the amount of revenue he generates. The cost for the company corresponds to the worker’s pay and that pay corresponds to the worker’s marginal productivity. Thus, the worker’s contribution to the GDP can be estimated by his gross income (before income tax), which corresponds to the marginal productivity of labour.26 To this should be added all other forms of remuneration, such as bonuses, allowances, commissions, overtime hours and so on. For short-term absences, the number of hours of absence can simply be multiplied by the hourly wage. For long absences, in which the productivity loss extends over several years, the human
24 As seen in Appendix 2, 56% of the surveyed applied studies use the human capital method. 25 Statistics Canada defines GDP as an aggregate measure of economic activity that corresponds to the unduplicated value of the goods and services produced in the economic territory of a country or region during a given period. 26 If the accident victim’s pay figure is not available, it can be estimated using the average pay of the organization or industry.

22 The Costs of Occupational Injuries - A Review of the Literature – IRSST
capital method uses an estimate of the present value of the future earnings. For example, for a death, the future earnings are discounted from the year of death until the expected year of retirement (e.g. 65 years). Inspired by Rice et al. (1989), the overall model is:
∑=
−
−
++
××=65
,,,, )1()1(
ynyn
yn
njsnsy rgYPPV (5)
where - PV is the present value of future earnings; - nsyP ,, is the probability that a person of sex s and age y will survive until age n; - njsY ,, is the annual pay of a worker of sex s, job j and age n; - g is the rate of increase of labour productivity; - r is the real discount rate. To this basic model can be added other components, such as employee benefits and household work, in order to arrive at a more complete definition of productivity.27 In addition, some authors introduce an employment rate variable into equation (5) to account for the probability of the worker of sex s and age y being employed during the years concerned. Thus the human capital method views workers as production factors. When an occupational injury occurs, the method claims that the quantity of human capital available in the economy is reduced and that this has an impact on society’s capacity for producing goods and services over the short- and long-term (Goodchild et al., 2002). Leigh et al. (2000) use the human capital method to estimate the productivity losses. Their study is considered one of the most important and complete to date, mainly due the scale of the estimates made by the authors. The authors first estimated the number of injuries, deaths, and occupational injuries for the entire United States in 1992. Then, the costs were grouped according to a direct and indirect cost classification. The direct costs were defined as being the medical costs (hospital, medical personnel, medications, etc.) and the administrative costs related to the care provided and compensation paid. The indirect costs were measured by the potential productivity losses (lost pay), the lost employee benefits, the non-participation in household work, and the disruptions in the company in terms of recruitment and training. In making the costs estimates, the authors drew on an impressive number of sources. As determined by data availability, they adopted an incidence- or prevalence-based approach. The cost of the productivity losses, calculated using the human capital method, totalled approximately $74 billion (1992 US$), i.e. about 48% of all the costs estimated by the authors. Table 3 presents the authors’ results in detail.
27 Some authors simply add the value of the household work and the employee benefits to the annual earnings equation (5).

IRSST – The Costs of Occupational Injuries - A Review of the Literature 23
Table 3 – Numbers and costs of work accidents and occupational diseases
Costs (1992 US$B) Category Number Total Direct Indirect Accidents 13,343,000 132.8 38.4 94.3 Deaths 6,371 3.9 0.2 3.7 Non-fatal 13,337,000 128.9 38.2 90.6 Diseases 22.8 13.4 9.4 Deaths 60,290 15.1 8.8 6.3 Morbidity 1,184,000 7.7 4.6 3.1 Total 155.5 51.8 103.7
Source: (Leigh et al., 2000) Advantages and limitations of the human capital method
The human capital method normally uses reliable data and is easy to apply and understand. That is mainly why it is the method most widely used in medical and legal research (Leigh and Miller, 1998). However, the human capital method is criticized for several reasons. First, by viewing the worker as a simple production factor, the method, when used in isolation, does not account for workers’ pain, suffering, or loss of enjoyment of life. To put it another way, the worker’s viewpoint is not considered by this method. Moreover, the method assigns a low value to individuals who do not work, who perform unpaid work, or who are about to retire. Lastly, due to imperfections in the labour market, it is possible that workers’ pay does not truly reflect their actual productivity. These imperfections may arise from, among other things, discrimination in the labour market (age, ethnicity, race, sex, etc.) (Hodgson and Meiners, 1982). 5.2 Friction costs
The friction cost method is in some ways a critique of how the human capital method measures the long-term impact of absenteeism on productivity. Advocates of the friction cost method claim that the human capital method overestimates productivity losses because it evaluates the “potential” productivity loss instead of the “actual” loss (Koopmanschap et al., 1995). As we saw earlier, the human capital method views the worker as a production factor. In cases of death, for example, the method considers there to be a productivity loss for each of the years of work lost up to the expected retirement age. Over the long term, the economy’s productive capacity is therefore said to be reduced, an assumption that can be made only in full employment situations.28 However, while such a situation may exist in some areas of the economy, it probably does not do so for the entire economy.
28 A full employment situation occurs when unemployment is reduced to frictional unemployment, i.e. unemployment of short duration between the end of one job and the beginning of another.
24 The Costs of Occupational Injuries - A Review of the Literature – IRSST
Theoretical underpinnings of the friction cost method
The friction cost method holds that there are several mechanisms within companies and the labour market that allow one to believe that the “actual” productivity loss is much less than that obtained using the human capital method. More specifically, in the short term, it is claimed that the work usually performed by the accident victim may be done by another worker in the company, that some less urgent jobs can be dropped, and that the injured worker can partly make up for his absence upon returning to his job. For extended absences, it is claimed that the work may be performed by an individual who is not on the labour market (e.g. unemployed) or by a worker from another company (Koopmanschap et al., 1995).29 The full employment assumption advanced by the human capital method is therefore rejected. The friction cost method limits productivity losses to the friction period, which is the time necessary to return productivity to the level it was at prior to the accident. However, this friction period is difficult to estimate.30 Although the friction cost method was developed to estimate productivity losses at the societal level, it is used indirectly in company studies. As these studies focus exclusively on the consequences for the employer, the productivity loss is limited to the friction period.31 However, in other types of study, the method is used very little. The few studies surveyed that estimated indirect costs using the friction cost method obtain estimates much lower than those obtained using the human capital method. For example, using the friction cost method, Van Beeck et al. (1997) obtain estimates that are equivalent to 20% of those obtained using the human capital method. Advantages and limitations of the friction cost method
The friction cost method views the labour market as not being in a full employment situation, which is not a far-fetched assumption. An unemployed person may well enter the labour market to replace an injured worker. The method also produces estimates that are more tangible for employers. It is unlikely that a company’s productivity will drop off indefinitely after an employee goes on leave. The employee will be replaced by another worker, from inside or outside the company, to bring productivity back to the level it was at prior to the accident. The friction cost method is open to several criticisms. First, Johanneson and Karlsson (1997) maintain that limiting the productivity loss to the friction period corresponds to assigning a null
29 In each of these cases however, the hiring and training costs should be considered. 30 Koopmanschap et al. (1995) use a method for estimating the friction period that discriminates according to the education level of the worker to be replaced. 31 It should also be noted that, even under a full employment scenario, there may be a friction period at the level of each company individually.

IRSST – The Costs of Occupational Injuries - A Review of the Literature 25
value to the opportunity cost of the work after this period.32 According to the authors, it is an assumption that cannot be supported by neoclassical economic theory.33 Johanneson and Karlsson (1997) also note there is no assurance that an injured worker will be replaced by an unemployed person. The replacement worker may come from another employer, thereby creating another friction period at his former company. Neither is it certain that this domino effect, going from one employer to another, will end with an unemployed person entering the labour market. Another criticism concerns the difficulty in precisely estimating the length of the friction period. First, the period may vary depending on the company’s job structure. Some companies may not replace injured workers but have the work done by co-workers or, in some cases, simply not done (Brun and Lamarche, 2006). Second, the time necessary to recruit a new employee may vary depending on the economic cycle. In recessions, with high unemployment rates, the recruitment time will likely be shorter than during periods of sustained economic growth. Lastly, the type of industry may have an impact on the length of the friction period. Industries experiencing labour shortages may have to devote more time to recruiting new employees. 5.3 Willingness to pay
The willingness-to-pay method (WTP) consists of estimating the amount that an individual or society is willing to pay or receive in exchange for a marginal change in risk (injury, disease, or death). Willingness to pay is a method used mainly for estimating the value of a statistical life (VSL).34 Take, for example, a society composed of a million persons. If each of these persons is willing to pay $100 to reduce the probability of death from 3/100,000 to 1/100,000, which corresponds to 20 lives for that society, the willingness to pay to save the 20 lives would be $100 million, equivalent to $5 million for each life saved. The model is as follows: pdpdwVSL ∆= /)/( (6) where
- dpdw / is the amount paid or received in exchange for the change in risk; - p∆ is the change in risk.
Continuing with the previous example, Δp here corresponds to 2/100,000 and dw/dp corresponds to $100. The value of a life can thus be estimated by 100/(2/100,000) or $5 million.
32 In other words, the authors claim that the friction cost method assigns a value very near zero to unemployed persons’ free time. 33 In response to the criticism, Brouwer and Koopmanschap (2005) reply that the friction cost method does not assign a null value to unemployed persons’ free time but focuses only on the productivity loss, just as the human capital method does. According to them, the value of free time and recreation should be calculated separately using a QALY measurement. 34 It should be noted that these estimates do not concern the value of a specific life but rather of an anonymous individual in society.

26 The Costs of Occupational Injuries - A Review of the Literature – IRSST
Several researchers, including Strand (2001), hold that the estimates obtained using WTP do not correspond only to the value of the harm for the individual concerned. Indeed, it appears that a significant part of the willingness to pay stems from individuals’ concerns for the members of their families and for other persons in society. Moreover, the amounts obtained using this method do not correspond to the value of the human costs alone but rather to all the consequences of the occupational injuries for the worker.35 The majority of the studies that attempt to estimate the willingness to pay use the revealed preference approach. This approach holds that individuals reveal their preferences through their behaviour in the market (Dionne and Lanoie, 2004). Their preferences relating to risk are reflected in decisions involving a trade-off between a certain amount and a risk.36 The majority of works that use this approach are of the wage-risk type, which means they measure the value of a change in risk in a work environment. The workers offer their services on the labour market in exchange for wages and the employers offer wages for their performing work. The equilibrium wage that results from the interaction between the two parties is the amount that is required to get the work done. By accepting the job, the worker also accepts its characteristics, including the associated risk. This method attempts to use this balance point to evaluate the risk premium paid to workers. In practice, to perform this type of analysis, the researchers start by constructing a database using a sample of workers from various industries. The average pay for these jobs is then obtained and the risk levels associated with the work and other variables that may influence pay. Then an average pay regression is run on the various independent variables. The risk variable coefficient, which is obtained using the regression, corresponds to the risk premium.37 This is the coefficient that makes it possible to calculate the VSL. Theoretical underpinnings of the willingness-to-pay method
The general model for estimating the WTP takes the following form (Lebeau, 2006): φβ iii pXw += (7) where
- wi is the wage of individual i; - Xi is in independent variable vector; - pi represents the job risk; - β and φ are the equation parameters to be estimated by regression.
35 Insofar as these consequences may be foreseen by the worker. 36 Another approach, contingent valuation, consists of building a questionnaire that can be used to reveal respondents’ willingness to pay when confronted by hypothetical market situations. 37 In this case, a willingness to accept (or to receive).

IRSST – The Costs of Occupational Injuries - A Review of the Literature 27
However, according to Mincer (1974), an individual’s wage is obtained by:
)( φβ ii pX
i ew += (8) That is why most researchers instead use the semi-logarithmic form of equation (7): φβ iii pXw +=)ln( (9) Deriving equation (9) with respect to pi, we obtain
φ=i
i
dpwd )ln(
(10)
where φ is the percentage variation of iw for a change of one unit of ip . In other words, it is the risk premium demanded by individual i to accept a marginal variation in his risk. To obtain the willingness to pay (or receive), we instead require ii dpdw / . Breaking down equation (10), we obtain: φ=⋅=
i
i
ii
i
dpdw
wdpwd 1)ln( (11)
φ⋅== ii
i wdpdw
DAP (12)
The willingness to pay of individual i is thus obtained by multiplying parameter φ by the wage of i. Depending on the dependant variable wi, the willingness to pay will be expressed in hourly, weekly, monthly, or annual terms. The econometric specification is obtained simply by adding a random error term to equation (9), which reflects the unobservable factors influencing i’s wage: iiii upXw ++= φβ)ln( (13) Using linear regression to estimate the parameters of equation (13), we obtain φ̂ , which is the average risk premium for a marginal increase in the probability of death or injury. Based on equation (12), we note that the sample’s average willingness to ply is obtained by multiplying φ̂ by the average wage. However, to avoid introducing a bias, using the average wage in the willingness-to-pay calculation requires using a rather homogenous and large sample. Lastly, if the goal is to calculate the value of a statistical life, the willingness to pay, expressed in annual dollars, has be to divided by the change in the probability of death, which, in the

28 The Costs of Occupational Injuries - A Review of the Literature – IRSST
regression analysis, corresponds to a unit of variable pi.38 We can then express the value of a statistical life as follows:
)(
)(ˆ
deathofyprobabilitofunitpayannualaverageVSL ⋅
=φ (14)
where the numerator is the willingness to pay in annual dollars and the denominator is the change in the probability of death. If the goal is to calculate the value of an injury, a risk variable associated with the probability of injury is used instead. Application of the willingness-to-pay method in the literature
In the literature on the costs of occupational injuries, some authors use the willingness-to-pay method to estimate the costs of deaths and injuries. These studies typically use estimates (e.g. VSL) obtained from the scientific literature. For example, Leigh et al. (2004) take $2.7 million (1993 US$) as the value of a statistical life.39 The authors then subtract the indirect costs to separate out the costs related to pain, suffering, and loss of enjoyment of life.40 These human costs amount to an average $1.9 million (1993 US$) per death, varying according to the worker’s age at death. The cost of injuries can also be estimated using the willingness-to-pay method. However, the literature does not include many studies that estimate the value of injuries. Nonetheless, three different approaches are to be found. First, an estimate can be based directly on the study sample. French (1990) estimates the willingness to pay of a sample consisting of 460 workers in the U.S. railroad industry. Using a database that comprised detailed information about each of the workers (age, gender, education, occupation, etc.), French ran several linear and log-linear regressions, which included a risk variable associated with the probability of injury. He obtained an average cost of between $19,500 and $22,500 (1980 US$), which is thus the average cost of injuries for U.S. railroad workers. The amounts are large because they include the cost of pain, suffering, and loss of enjoyment of life.41 However, this method is difficult to apply, as it requires a lot of data.
38 In most of the studies, the variable measuring the probability of death is expressed in deaths per 10,000 workers. In these cases, the unit of variable pi is 1/10,000. 39 This amount comes from Miller (1990), who averages values obtained from 30 different studies. 40 According to the National Occupational Health and Safety Advisory Committee (Access Economics, 2006), only the indirect cost components assumed by the worker should be subtracted from the VSL in order to obtain the costs related to pain, suffering, and loss of enjoyment of life. 41 Using a similar methodology, Viscusi and Moore (1987) obtain results similar to those of French (1990). Based on a survey of 485 U.S. workers from various industries, the authors estimate the average value of injuries to be between $17,000 and $26,000 (1977 US$).
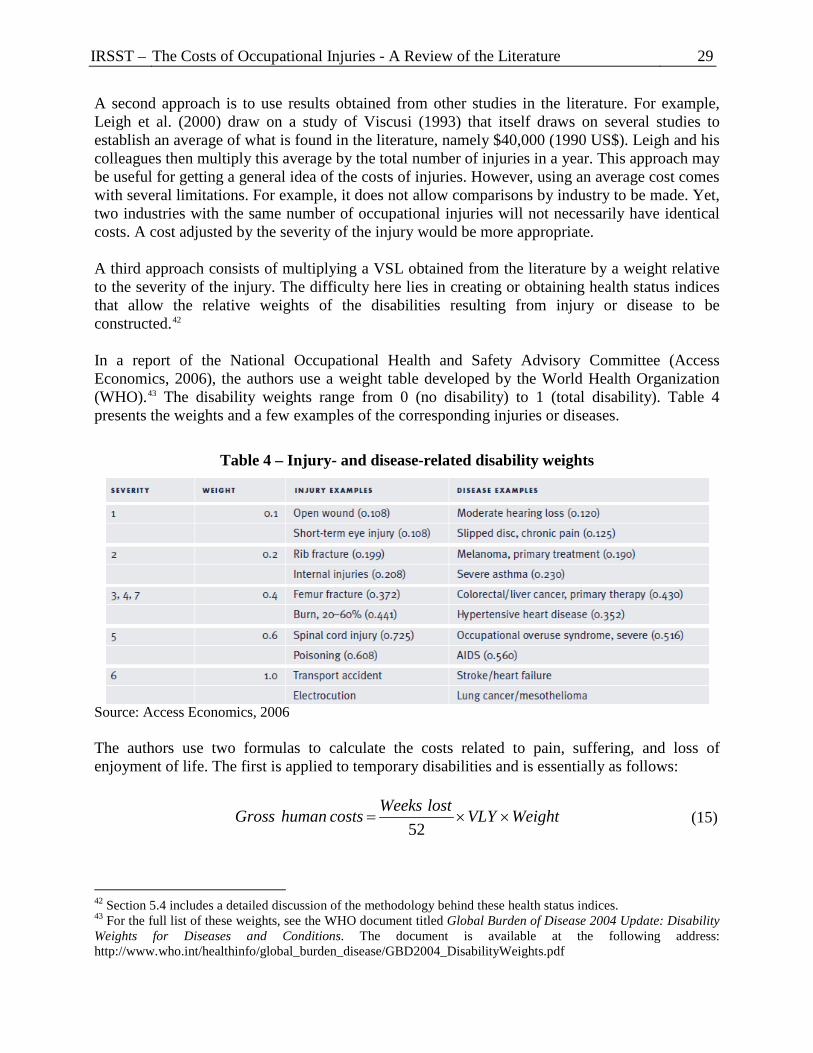
IRSST – The Costs of Occupational Injuries - A Review of the Literature 29
A second approach is to use results obtained from other studies in the literature. For example, Leigh et al. (2000) draw on a study of Viscusi (1993) that itself draws on several studies to establish an average of what is found in the literature, namely $40,000 (1990 US$). Leigh and his colleagues then multiply this average by the total number of injuries in a year. This approach may be useful for getting a general idea of the costs of injuries. However, using an average cost comes with several limitations. For example, it does not allow comparisons by industry to be made. Yet, two industries with the same number of occupational injuries will not necessarily have identical costs. A cost adjusted by the severity of the injury would be more appropriate. A third approach consists of multiplying a VSL obtained from the literature by a weight relative to the severity of the injury. The difficulty here lies in creating or obtaining health status indices that allow the relative weights of the disabilities resulting from injury or disease to be constructed.42 In a report of the National Occupational Health and Safety Advisory Committee (Access Economics, 2006), the authors use a weight table developed by the World Health Organization (WHO).43 The disability weights range from 0 (no disability) to 1 (total disability). Table 4 presents the weights and a few examples of the corresponding injuries or diseases.
Table 4 – Injury- and disease-related disability weights
Source: Access Economics, 2006 The authors use two formulas to calculate the costs related to pain, suffering, and loss of enjoyment of life. The first is applied to temporary disabilities and is essentially as follows:
WeightVLYlostWeeks costs humanGross ××=52
(15)
42 Section 5.4 includes a detailed discussion of the methodology behind these health status indices. 43 For the full list of these weights, see the WHO document titled Global Burden of Disease 2004 Update: Disability Weights for Diseases and Conditions. The document is available at the following address: http://www.who.int/healthinfo/global_burden_disease/GBD2004_DisabilityWeights.pdf

30 The Costs of Occupational Injuries - A Review of the Literature – IRSST
where VLY is the value of a life year, which can be calculated by isolating VLY in the following equation:
402 )1(...
)1()1( rVLY
rVLY
rVLYVSL
+++
+= (16)
In this type of calculation, discounting is usually performed over 40 years because that is the approximate difference in workers’ average (or mean) age and life expectancy.44 For more severe disabilities with consequences up to the worker’s death, the authors use the sum of the discounted values of the disabilities from the accident date to the expected date of death:
∑= +
×=
n
iir
WeightVLYcostshumanGross1 )1(
(17)
The authors then subtract the indirect costs to obtain the net human costs, i.e. only the costs related to pain, suffering, and loss of enjoyment of life. The U.S. Department of Transportation (2009) also suggests using a weight table to calculate the cost of injuries. Specifically, it recommends that its analysts use a VSL of $5.8 million (2009 US$) and base themselves on the weight table published in Miller et al. (1988). That table is here reproduced as table 5.
Table 5 – Relative disutility factors by injury severity level
MAIS Level1 Severity Fraction of VSL2
MAIS 1 Minor 0.0020
MAIS 2 Moderate 0.0155
MAIS 3 Serious 0.0575
MAIS 4 Severe 0.1875
MAIS 5 Critical 0.7625
MAIS 6 Fatal 1.0000 1 Maximum Abbreviated Injury Scale (MAI S) 2 Value of a statistical life (VSL)
Source: U.S. Department of Transportation (2009) Advantages and limitations of the willingness-to-pay method
The theoretical underpinnings of the willingness-to-pay method are more widely accepted by economists than are those of the human capital method. This is because, among other things,
44 The authors use a VSL of $3.9 million and a discount rate of 3.8%, which implies a VLY of $184,216 (2006 NZ$).

IRSST – The Costs of Occupational Injuries - A Review of the Literature 31
WTP is a method that takes into account the individual’s desire to live longer (Arthur, 1981),45 meaning that intangibles such as pain, suffering, and loss of enjoyment of life are considered. These intangibles allow for a more complete evaluation of the costs of occupational injuries. However, the willingness-to-pay method is criticized for several reasons. First, it is based on very restrictive assumptions. Dionne and Lanoie (2004) stress that, in the wage-risk approach, using WTP can work only if the following two assumptions are valid:
1. The workers are in possession of all information on the risks involved in the various jobs; 2. Each worker can freely choose his job and can change it whenever he wants.
In reality, workers have very little information about the risks involved in their work. Moreover, workers’ mobility is reduced by several factors (linguistic, cultural, social and geographic). It is therefore possible that the risk premium included in the pay does not reflect the actual risk involved. One consequence of this may be to lower the WTP estimates. Second, several authors maintain that willingness to pay is inextricably linked to capacity to pay. As the affluent are more able to pay than the less affluent, the WTP of the affluent is higher than that of the less affluent (Bellavance et al., 2009), which raises the issue of equity. Third, the willingness-to-pay method is often defined as being a cost measurement for society. However, several authors maintain that the method cannot in and of itself produce a complete evaluation of the costs of occupational injuries. For example, it probably does not include direct cost components such as medical costs. As most people do not pay these costs or, if they do, only indirectly (through taxes), it is unlikely that an individual will require higher wages because of them. Moreover, aside from hospital administrators, few people are aware of the medical costs generated by the various interventions and therapies (Leigh et al., 2000). Lastly, it can be argued that non-economists may find the willingness-to-pay method harder to understand due to its theoretical and methodological complexity. 5.4 Health status index methods
Although they are tools recently developed by researchers, health status indices are rapidly gaining in popularity. They constitute a method that allows various health statuses to be evaluated using a single unit of measurement (Goodchild et al., 2002). In the preceding section, we showed that it is possible to use a health status index in combination with the WTP method. In this section, we present in greater detail the methodology behind health status indices. Theoretical underpinnings of health status index methods
The quality-adjusted life year (QALY) method is among the most important for evaluating the change in an individual’s health status. It is used mainly in the medical and public health fields (Lebeau, 2006).
45 Thus this concept places value on life itself and not only on the consequences of death (Le Pen, 1993).

32 The Costs of Occupational Injuries - A Review of the Literature – IRSST
The value assigned to an individual’s health corresponds to the arithmetic product of the life expectancy (T) (or lifespan) and a certain quality-of-life measure (q). As an individual experiences various health statuses during his life, death being the last, each of the remaining years of life is weighted according to an index that corresponds to his health status:
∑=
=N
iiiTqQ
1
(18)
Equation (18) divides the individual’s life into N periods, each with a different health status. A QALY, which corresponds to a full year with optimal health status, is the unit of the result obtained using this equation. In equation (18), the difficulty lies in accurately evaluating measure q, which is located between 0 (death) and 1 (perfect health). Several instruments have been built to evaluate measure q. Appendix 5 presents two of the: Health Utilities Index Mark 3 (Feeny et al., 1995 and 1996) and the EuroQol EQ-5D (Kind, 1996).46 These instruments are typically used by putting questions directly to the individuals concerned. When personalized interviews are not possible, weight tables derived from population surveys can be used (see table 4). The QALY measurement allows a society’s aggregate health to be maximized. Health is measured in terms of QALYs and aggregate health by totalling QALYs (Wagstaff, 1991). A measure replacing the QALY is the disability-adjusted life year (DALY). It evaluates the level of disability instead of the level of quality of life. As a result, the weights are essentially inverted. The disability-related weights range from 0 (no disability) to 1 (total disability). Moreover, in contrast to the QALY measure, which assigns the same value to each life year with the same health status (irrespective of age), the DALY measure assigns greater weight to the mid-life years and lower weight to the early (childhood) and late (retirement) years. In other words, the individual’s working years are more highly valued. The DALY measure is the only one used in the surveyed studies (see Appendix 2). It should be noted that weights located outside the 0-to-1 interval can be used. This is usually done when the health statuses are considered worse than death. However, very few researchers use weights outside the 0-to-1 interval. Among the retained works, only the study by Concha-Barrientos et al. (2005) uses this approach to estimate the consequences of occupational injuries in terms of DALYs. The authors estimate that the occupational injuries that occurred in 2000 among the 2.9 billion workers worldwide, including death and injuries, are responsible for 10.5 million lost DALYs. This means that these injuries “cost” 10.5 million years of life in perfect health or 3.5 life years per 1,000 workers. Advantages and limitations of health status index methods
The QALY (or DALY) method has the advantage of evaluating the quality of life based on individuals’ revealed preferences (Goodchild et al., 2002). When the individuals concerned can
46 We discuss these two instruments because they are well documented and are found in several clinical studies.
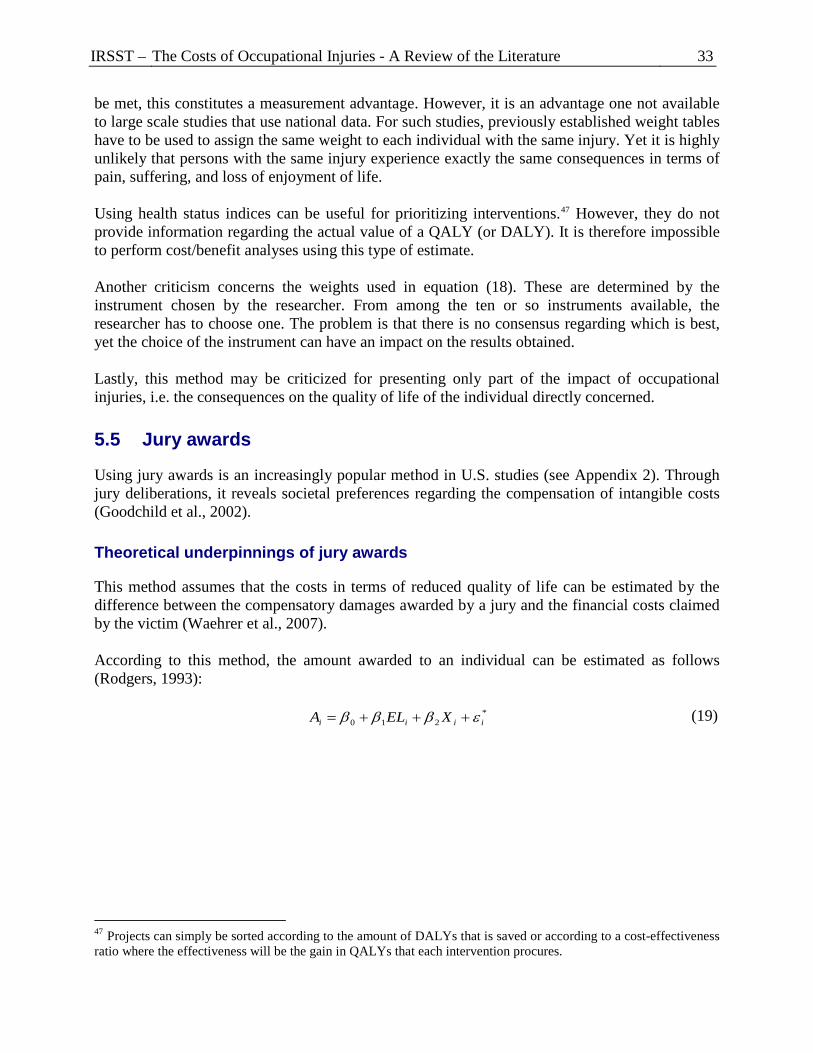
IRSST – The Costs of Occupational Injuries - A Review of the Literature 33
be met, this constitutes a measurement advantage. However, it is an advantage one not available to large scale studies that use national data. For such studies, previously established weight tables have to be used to assign the same weight to each individual with the same injury. Yet it is highly unlikely that persons with the same injury experience exactly the same consequences in terms of pain, suffering, and loss of enjoyment of life. Using health status indices can be useful for prioritizing interventions.47 However, they do not provide information regarding the actual value of a QALY (or DALY). It is therefore impossible to perform cost/benefit analyses using this type of estimate. Another criticism concerns the weights used in equation (18). These are determined by the instrument chosen by the researcher. From among the ten or so instruments available, the researcher has to choose one. The problem is that there is no consensus regarding which is best, yet the choice of the instrument can have an impact on the results obtained. Lastly, this method may be criticized for presenting only part of the impact of occupational injuries, i.e. the consequences on the quality of life of the individual directly concerned. 5.5 Jury awards
Using jury awards is an increasingly popular method in U.S. studies (see Appendix 2). Through jury deliberations, it reveals societal preferences regarding the compensation of intangible costs (Goodchild et al., 2002). Theoretical underpinnings of jury awards
This method assumes that the costs in terms of reduced quality of life can be estimated by the difference between the compensatory damages awarded by a jury and the financial costs claimed by the victim (Waehrer et al., 2007). According to this method, the amount awarded to an individual can be estimated as follows (Rodgers, 1993): *
210 iiii XELA εβββ +++= (19)
47 Projects can simply be sorted according to the amount of DALYs that is saved or according to a cost-effectiveness ratio where the effectiveness will be the gain in QALYs that each intervention procures.

34 The Costs of Occupational Injuries - A Review of the Literature – IRSST
where - iA is the total amount awarded to individual i; - iEL are the economic losses of individual i that are associated with the accident
(medical costs, loss of pay, etc.); - iX is a vector of other independent variables that can influence the level of
compensation (gender, age, severity of the injury, etc.); - 0β , 1β and 2β are the equation’s parameters to be estimated by regression; - *
iε is a normally distributed error term. By defining the total amount awarded to the individual as being the sum of the economic losses and pain and suffering costs, iii PSELA += (20) It is possible to reformulate equation (19) and to separate out the pain and suffering costs: *
210 )1( iiii XELEL εβββ ++−+= (21) Rodgers (1993) uses 843 jury awards from product liability cases that involved bodily harm. He first separated the cases into four injury categories, based on the level of severity. Then he estimated the pain and suffering costs by isolating iPS in equation (20): iii ELAPS −= (22) The results obtained by the author are presented in table 6. Examining this table, it is possible to note that the pain and suffering costs form a significant share of the total amounts awarded in these cases.
Table 6 – Amounts awarded for human costs by severity of injury
Injury category
Mean economic
loss
Mean human cost
% awarded for pain and
suffering costs % of cases % of awards
Category 1 $7,048 $35,678 84% 16% 8% Category 2 $17,709 $49,889 74% 43% 35% Category 3 $20,747 $76,939 79% 37% 43% Category 4 $39,437 $315,410 89% 3% 14% Average $17,782 $66,158 79% – – Amounts in 1998 US dollars.
Source: Rodgers (1993)

IRSST – The Costs of Occupational Injuries - A Review of the Literature 35
The following step consists of estimating equation (21) using linear regression.48 The coefficients associated with the independent variables can be used to set up an equation that may in turn be used to estimate the pain and suffering costs of an outside sample. In the studies that interest us, this outside sample consists of workers who have suffered occupational injuries.
Advantages and limitations of jury awards
This method uses the compensation awarded by juries as indicators of community preferences regarding the value of human costs. Because the jury members are randomly selected from the community, they can be considered as representative of the population. Although this approach to evaluating human costs is increasingly used in U.S. studies, it is not really applicable in Canada. First, the awards made for an individual’s physical and mental suffering (pretium doloris) in Canada are determined by a judge and not a jury. It therefore falls to the judge to use his experience and Canadian jurisprudence to determine the amount of the award. Such an approach does not reveal the community’s preferences. In addition, in 1978 the Supreme Court of Canada set a maximum amount that can be awarded for this type of harm.49 At the time, the amount was $100,000; today it is approximately $300,000. However, this amount is awarded only in extreme cases (paraplegia, quadriplegia, etc.).
48 Rodgers (1993) uses the natural logarithm of dependent variable iPS and independent variable iEL . 49 The maximum limit that may be awarded for pretium doloris was established in a Supreme Court of Canada decision (Arnold v. Teno, [1978] 2 SCR 287).


IRSST – The Costs of Occupational Injuries - A Review of the Literature 37
6. SPECIAL CHARACTERISTICS OF COMPANY CASE STUDIES
A few studies that do not directly use any of the methods discussed in section 5 of this report stand out from the other studies in the literature. These are company case studies, which focus solely on the costs of occupational injuries for the company concerned and use only actual company data. In Appendix 2, in the Method column, these studies are identified as being company case studies (CCS).
6.1 The shared methodological approach
In these company case studies, the insured costs are usually considered to be direct costs, with the indirect costs being all the other costs assumed by the employer.
The usual data collection method consists of developing a questionnaire, which is distributed to the company or participating companies. The questions allow the financial consequences of the occupational injuries to be identified. Here are the subjects usually addressed by these questions:
- General information (gender, age, pay, number of compensated days, number of temporary assignment days, etc.);
- Salary costs (time lost by the injured worker, other workers, supervisor, emergency responders, etc.);
- Property damage (replacement, repair, cleaning, etc.); - Production costs (production delays, overtime, the injured worker’s decreased
productivity on his return, etc.); - Administrative costs (time devoted to the investigation and other accident-related
administrative tasks, training, recruitment, etc.); - Other costs (transportation, legal costs, employee benefits, etc.).
Adding together these costs provides a fairly accurate estimate of the indirect costs for the employee. The authors can then estimate a indirect-direct cost ratio using the compensations paid to the injured workers. 6.2 The first studies
Company case studies were the approach favoured by the first studies aimed at estimating the costs of occupational injuries. Heinrich (1931) was one of the first researchers to take an interest in the costs of work accidents. He defined the direct costs as being the sum of the income replacement indemnities and the medical costs. The indirect costs were those found in the company’s accounting records but not directly related to the accident (e.g. production interruptions, property damage, lost time of the various parties involved). Based on 5,000 accident records, he obtained an indirect/direct cost ratio of 4 to 1. This ratio was used for many years by OHS managers for estimating indirect costs. However, the ratio is open to several criticisms. First, Heinrich used only the records of accidents that involved property damage, including accidents that did not entail any time losses. This partly
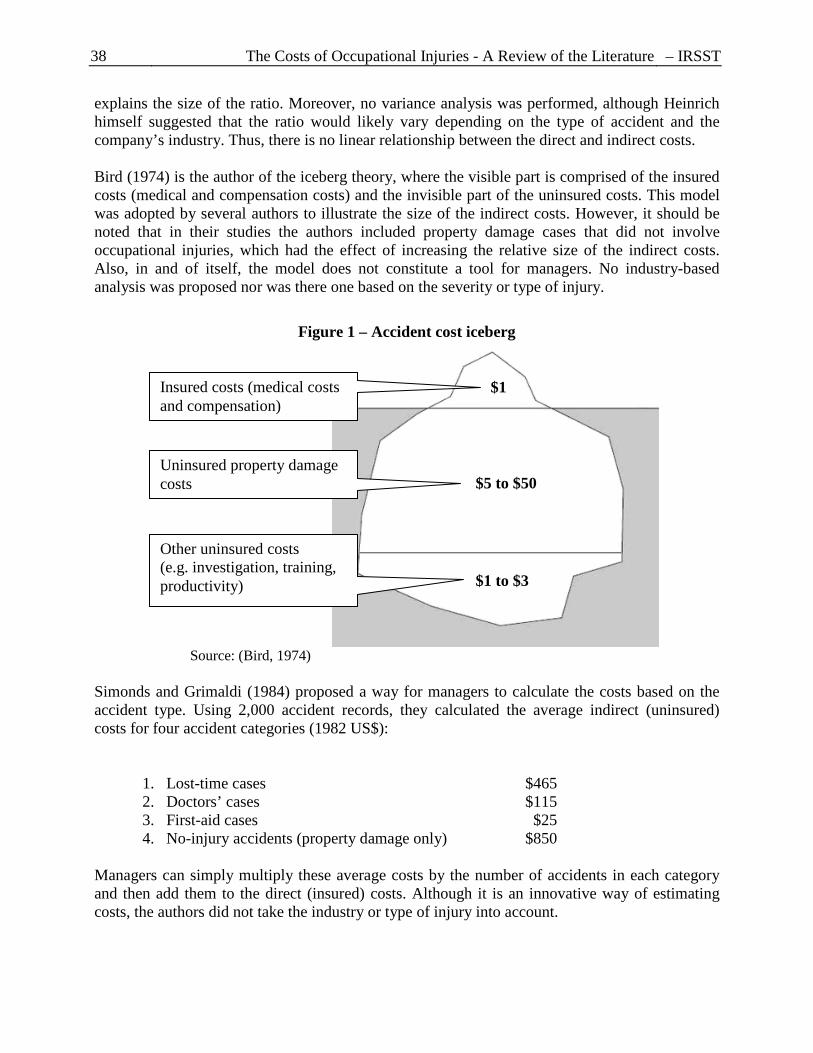
38 The Costs of Occupational Injuries - A Review of the Literature – IRSST
explains the size of the ratio. Moreover, no variance analysis was performed, although Heinrich himself suggested that the ratio would likely vary depending on the type of accident and the company’s industry. Thus, there is no linear relationship between the direct and indirect costs. Bird (1974) is the author of the iceberg theory, where the visible part is comprised of the insured costs (medical and compensation costs) and the invisible part of the uninsured costs. This model was adopted by several authors to illustrate the size of the indirect costs. However, it should be noted that in their studies the authors included property damage cases that did not involve occupational injuries, which had the effect of increasing the relative size of the indirect costs. Also, in and of itself, the model does not constitute a tool for managers. No industry-based analysis was proposed nor was there one based on the severity or type of injury.
Figure 1 – Accident cost iceberg
Source: (Bird, 1974) Simonds and Grimaldi (1984) proposed a way for managers to calculate the costs based on the accident type. Using 2,000 accident records, they calculated the average indirect (uninsured) costs for four accident categories (1982 US$):
1. Lost-time cases $465 2. Doctors’ cases $115 3. First-aid cases $25 4. No-injury accidents (property damage only) $850
Managers can simply multiply these average costs by the number of accidents in each category and then add them to the direct (insured) costs. Although it is an innovative way of estimating costs, the authors did not take the industry or type of injury into account.
Uninsured property damage costs $5 to $50
Insured costs (medical costs and compensation)
Other uninsured costs (e.g. investigation, training, productivity)
$1
$1 to $3

IRSST – The Costs of Occupational Injuries - A Review of the Literature 39
6.3 Québec studies
The bibliographic survey identified only five works from Québec (see Appendix 2). It is important to analyze these works because they share a rather distinct methodological approach and because the IRSST is required to take Québec’s distinctiveness into account in its analysis of the costs of occupational injuries. First, it should be noted that the five retained Québec studies are company case studies. The studies therefore carry out a micro-economic analysis, that is, an analysis applicable to the company, of the costs of occupational injuries. The direct costs are the costs insured by the CSST and the indirect costs are all other costs assumed by the employer. In the Québec studies, the direct costs are sometimes measured by adding together the medical costs, rehabilitation costs, and income replacement indemnity paid to the accident victim during the disability period (e.g. Brody et al., 1990a, 1990b; Senécal, 1998). This is similar to what is done in some foreign studies (e.g. Heinrich, 1931; Bird, 1974). However, in Québec, in the theoretical and empirical studies alike, the direct costs are usually associated with the contributions paid to the CSST (e.g. Lanoie and Tavenas, 1998; Lavoie, 2000). These are more inclusive and, in addition to the above-mentioned components, include other compensation as well as the CSST’s administrative costs. Grouping these other forms of compensation (income replacement indemnities, death benefits, compensation for bodily injury, permanent disability benefits) with the direct costs is unique to Québec studies, which makes them difficult to compare with other studies in the literature. Classifying costs in this way may be prompted by several reasons. First, as the focus is limited to the costs for the company, it is natural to classify costs in a manner that is more understandable for companies. Also, the amount of the CSST contributions is information that is readily available, meaning there is an incentive to define the direct costs as being the easily identifiable costs and the indirect costs as those that require a little more investigative footwork. Thus, the Québec studies have the double advantage of presenting the costs in a way that is more tangible for employers and of using very accurate and detailed information. The resulting estimates are therefore of high quality. On the other hand, the results—in particular the indirect/direct costs ratio—are difficult to compare with those found in the rest of the literature, especially as this way of classifying costs tends to exaggerate direct costs’ proportion among total costs. Furthermore, the Québec studies considered only the costs for the companies concerned and so did not examine the human costs or costs for society. Appendix 6 contains an summary table that classifies the occupational injury cost components based on what is generally found in the Québec studies.50 Some of the cost components discussed in Appendix 4 are not found in the table. This does not mean that the costs are non-existent in Québec but rather that they were not considered in the studies surveyed. Moreover, it should be noted that some definitions of costs differ from those presented in Appendix 4 (e.g. salary costs).
50 The table is based mainly on the studies by Brody et al. (1990a, 1990b) and Lavoie (2000).

40 The Costs of Occupational Injuries - A Review of the Literature – IRSST
Brody et al. (1990a) developed an innovative method for estimating indirect costs that is intended for managers of Québec companies. Based on a sample of 311 work accidents with time loss that occurred in 151 establishments with 100 or more employees in 13 Québec industries,51 the authors innovated through their use of a multivariate econometric model for estimating the indirect costs. Among the model’s dependant variables are the industry, severity of the injury (number of days lost), and the worker’s age. The indirect costs were obtained using a questionnaire sent to the employers concerned. The regression results are presented in table 7.
Table 7 – Multivariate regression analysis of the variables with an impact on the indirect costs of work accidents
Variables Coefficients t Constant -167.01 -0.53 Size 0.32 2.18 Industry:
Buildings and public works -707.17 -3.02 Mining and quarrying -314.27 -1.24 Sawmill -876.95 -4.05 Metal products -114.40 -0.52 Wood and furniture -874.63 -3.57 Rubber and plastics -532.11 -1.87 Transportation equipment -758.98 -2.84 Primary metal transformation -601.31 -2.23 Non-metallic mineral products -436.35 -1.53 Food and beverage -550.19 -2.56 Pulp and paper -304.14 -1.58
Production capacity 4.83 1.74 Worker’s age 9.62 1.88 Days lost 66.45 6.88 (Days lost)2 -0.84 -2.94 R2 50.1 Adjusted-R2 47.13 F 16.82
Source: (Brody et al., 1990a) As can be seen, the establishment’s size, the percentage of production capacity used, the worker’s age, and the severity of the accident have a positive and significant impact on the indirect costs. Several industries regularly obtain significant coefficients.52 The table illustrates an equation that can be used by companies to estimate the indirect costs of an accident. Take, for example, a mining company that has 200 employees and has operated at 90% of its production capacity in recent years. If a 40-year-old employee is injured at work and goes on leave for 20 days, the accident’s indirect costs for the employer can be estimated as:
51 These are mainly primary and secondary sector industries. 52 Negative coefficients correspond to lower indirect costs in these industries in contrast to the omitted forest products industry.

IRSST – The Costs of Occupational Injuries - A Review of the Literature 41 Indirect costs = –167.01 + 0.32(200) – 314.27 + 4.83(90) + 9.62(40) + 66.45(20) – 0.84(20)2 = 1,395.22 (1988 C$) Although this model has never been validated using an external sample, it is nonetheless an interesting tool for managers seeking an approximation of the indirect costs in their company. The model also has the advantage of considering several variables when estimating indirect costs instead of simply applying an indirect/direct costs ratio. The authors also calculate an industry-specific average indirect/direct costs ratio in which the direct costs consist of the medical and hospitalization costs as well as the income replacement indemnities paid to the injured workers. The ratios obtained vary from 0.59 to 1.3, with an overall average of 0.83. This means that the average indirect costs correspond to 83% of the direct costs. These results differ greatly from those of Heinrich (1931), the difference stemming from, among other things, the fact that Heinrich uses only accident cases that involve property damage while Brody et al. (1990a) use only accidents with time loss. Moreover, the compensation provided to accident victims was much lower at the time of Heinrich’s study (1931) than that provided under modern day plans.

IRSST – The Costs of Occupational Injuries - A Review of the Literature 43
7. CAVEATS AND LIMITATIONS OF THE SURVEYED STUDIES
In this section of the report, we present several caveats and limitations regarding estimates of the costs of occupational injuries. 7.1 Who actually pays?
In the studies, the costs of occupational injuries are sometimes broken down by economic agent (e.g. employers, workers, and society). This cost assignment is usually done at the top level, that is, based on the agent that directly pays the costs resulting from the injuries. However, the costs may subsequently be transferred to other economic agents. For example, companies do not necessarily absorb all the costs resulting from occupational injuries. Instead, they can transfer part of the costs to consumers (customers) by raising the price of the goods and services sold and/or to their employees through pay cuts and freezes. Such cost transfers do not happen quickly and may, in fact, take months or even years (Leigh et al., 2000). Of course, the portion of the costs to be transferred will depend on the company’s leeway to act accordingly. A company doing business in a highly competitive environment will find it impossible to raise its product prices without negatively impacting sales. Conversely, a monopoly or oligopoly with no or few competitors can more easily transfer part of its costs to consumers. The same logic applies to pay cuts and freezes. The labour market in which the company operates will determine the company’s ability to transfer the costs to its employees. For example, a company that is experiencing difficult in recruiting new employees, for whatever reason, will probably not risk cutting or freezing its employees’ pay. On the other hand, a company that hires an easily replaceable workforce can more easily transfer part of its costs to its employees’ pay. What the company cannot transfer it has to absorb in the form of lower profits. However, the option of transferring the costs is not available to all economic agents. The community has no one to which it can shift the costs and, as a result, must assume them in their entirety (Andreoni, 1985). That said, it is extremely difficult if not impossible to estimate the portion of the costs that will be transferred to the community. 7.2 Double-counting
Estimates of the costs of occupational injuries must pay special attention to the possibility of double-counting. This happens when two identical but seemingly different cost components are included in the same analysis. Double-counting naturally creates a bias by producing estimates that are too high. This risk of double-counting is present in several situations.

44 The Costs of Occupational Injuries - A Review of the Literature – IRSST
Productivity
Compensation Contribution
Pay
Transfers
First, double-counting can occur when transfer payments are included in the estimate. These costs are merely transfers between economic agents. For example, take the relationship between a worker and his employer (figure 2). The worker provides a certain level of productivity in exchange for pay.
Figure 2 – Situation with no occupational injury
Now, assume that, following an occupational injury, the employer is required to pay a contribution to the CSST and that the CSST compensates the injured worker (figure 3).
Figure 3 – Situation with an occupational injury For some economic agents, these transfers do indeed constitute costs. From society’s point of view, however, the transfers merely shift sums of money from one agent to another (Hodgson and Meiners, 1982). As figure 3 clearly shows, an outflow of money for one is an inflow of money for the other. In this example, the true cost of the injury for society corresponds to a productivity loss.53 If the transfer payments were included, the same costs would be counted twice: first when the individual’s productivity loss is calculated and then when society’s resources were redistributed to compensate the individual (Moore et al., 1997). Salary/productivity losses
Following an occupational injury, the employer will probably have to pay non-productive wages. Take, for example, a worker who is injured on the job. At the time of the accident, co-workers provide assistance to the injured worker and the worker leaves for the emergency room. In such situations, the employer has to pay the injured worker for the full workday, even if the worker is no longer on the job. In addition, the wages of the other workers who left their usual tasks during the accident will also be paid. When estimating the costs of the injury in this company, the productivity losses related to the accident and the workers’ non-productive wages should not be included, as doing so would entail double-counting.
53 According to some authors, the administrative costs of these transfer payments can, however, be considered a cost.
Employer
Employer
CSST
CSST
Worker
Worker
IRSST – The Costs of Occupational Injuries - A Review of the Literature 45
This type of error can also occur for companies that use temporary assignment.54 In Lavoie (2000), the author includes a table that estimates the non-productive share of wages for various temporary assignment tasks in a Québec mining company. The enables the author to estimate the salary costs resulting from the non-productive time on temporary assignment. Although this approach is relevant and innovative, it is important to avoid also including in the same analysis the productivity loss that the company experiences due to these temporary assignment workers. The non-productive salary costs should therefore be considered an estimate of the productivity loss and not another cost component. Use of two calculation methods
A cost estimate that uses two methods, such as the human capital and willingness-to-pay methods, risks counting the same costs twice. To avoid double-counting the costs, the various cost components included in each of the methods should be clearly defined. 7.3 Human costs
As we have shown in this report, there are several methods for estimating the human costs that result from occupational injuries. However, the estimates obtained with these methods will always be challenged and challengeable.
For example, take the willingness-to-pay (WTP) method, which can be used to estimate the value of a statistical life (VSL). Although it is the method most widely embraced by economists and policy-makers, the results obtained in the literature vary enormously. Specifically, the VSLs found in the literature range between $0.5 million and $50 million (2000 US$). Thus it becomes very difficult for policy-makers to choose the “right” value.55
Table 8 presents the various life values used in the government studies from several countries.
54 Temporary assignment allows the employer to assign work to this person while waiting for him to become capable of returning to his former job or of performing another suitable job (CSST, 2002). When a worker is on temporary assignment, he is paid his full salary despite not being as productive as he was before the injury. Such workers are often assigned to tasks that take his reduced work capacity into account or to training. 55 Bellavance et al. (2009) maintain that his variability in the values obtained arises in large part from methodological differences. The authors also inform policy-makers regarding the importance of the representativeness of the samples used.

46 The Costs of Occupational Injuries - A Review of the Literature – IRSST
Table 8 – Life values used by the agencies of various countries
Country Year of assessment Agency VSL (2002 C$M)
Australia 1999–2000 Department of Transport and Regional Services
0.306; 1.47; 1.170
Australia 2000 Commonwealth Bureau of Transport Economics
1.27
Australia 2002 NSW Roads and Traffic Authority 1.109 Belgium 1996 SSTC, Services Fédéraux des Affaires
Scientifiques, Techniques et Culturelles 6.426
Canada 1991 Transport Canada 1.762 Canada 1996 Environment Canada 4.461 Canada 1999 Health Canada 4.565
United States 1996 Federal Aviation Administration (FAA) 3.71 United States 1996 Food and Drug Administration 3.34; 6.81 United States 1999 Environmental Protection Agency 4.83; 7.8 United States 2000 Consumer Product Safety Commission 6.19 United States 2002 U.S. Department of Transportation 3.63
France 1995 Commissariat General du Plan 1.182 Great Britain 1996 Department of Transport – Aviation 1.788 Great Britain 2001 Department of Transport – Road Safety 1.49
Norway 1999 Public Roads Administration 2.184 New Zealand 1990 Land Transport Division, Ministry of
Transport 2
Sweden 1999 SIKA – Swedish National Road Administration
1.759
Source: Zhang et al. (2004)
As this table shows, even among the agencies of a given country, there appears to be no consensus regarding the “right” VSL to use. Recently, the Treasury Board of Canada Secretariat (2007) recommended using a VSL of $6.11 million (2004 C$), the Ministère du Transport du Québec (2007) a VSL of $3.2 million (2006 C$), and the U.S. Department of Transportation (2009) a VSL of $5.8 million (2009 US$). Despite these laudable efforts to assign a monetary value to life and individuals’ quality of life, this type of estimate will always remain debatable. However, omitting them would result in a significant underestimation of the costs of occupational injuries. 7.4 Underreporting
Several researchers use data from insurers such as the CSST or from organizations that collect data from such insurers. The main limitation on these data is that they concern only the injuries reported to the insurer (CSST) and not all the injuries that occur in the workplace (Duguay et al., 2003). A Canadian study (Shannon and Lowe, 2002) estimates the underreporting of eligible injuries to provincial workers’ compensation boards to be 40%.

IRSST – The Costs of Occupational Injuries - A Review of the Literature 47
There are several possible reasons for such underreporting. First, the increasing use of temporary assignment implies that a portion of occupational injuries is not reported and that the compensation period is shorter (Duguay et al., 2003). Second, injured workers may be pressured by their supervisor, management, and/or co-workers not to report an occupational injury (Shannon and Lowe, 2002 in Roy et al., 2004). Third, it is possible that some occupational diseases are underreported due to their appearance only several years after exposure and even, in some cases, several years after retirement (Waehrer et al., 2005). Fourth, some workers are simply not covered by workers’ compensation insurance, in particular self-employed workers and domestic workers.56 Fifth, it may be advantageous for some high-salary workers to report an accident on a personal as opposed to occupational basis.57 Lastly, it is possible that job insecurity may lead to underreporting (Quinlan and Mayhew, 1999). One result of the underreporting of work accidents is to transfer part of the cost burden to society. This is because the cost of the medical treatment of those injured in a work accident is then absorbed not by employers but by the contributor-funded health care system (Shannon and Lowe, 2002).58 7.5 Data accessibility
In theory, it is relatively easy to draw up a list of costs that could result from occupational injuries. It is, however, more difficult to obtain data on some of those costs. For example, the lack of reliable national data means that costs related to loss of reputation, loss of contracts, and lawsuits are often set aside in studies that are not company case studies. Human costs are often ignored for the same reasons. Thus, which costs are included in studies depends to a large degree on data availability. 7.6 Occupational diseases
No analysis of the costs of occupational injuries is complete without considering occupational diseases. However, including such diseases sometimes creates confusion in the interpretation of results. Some occupational diseases become apparent only several years after exposure. Thus the costs related to these new reports do not reflect current risk levels at the workplace. On the other hand, omitting occupational diseases makes it impossible to obtain a complete picture of the costs. This dilemma leads some authors to voluntarily omit the costs of occupational diseases or to present them in separate tables. Some authors go so far as to use a different calculation method
56 If self-employed workers and domestic workers want to be insured by the CSST, they have to register themselves. 57 At the CSST, the maximum annual insurable earnings for 2010 is $62,500. In situations where the private wage loss insurance provides more compensation to the worker than the CSST’s compensation, there may be an incentive to underreport an occupational injury. 58 There may also be fraud with respect to the reporting of occupational injuries. This fraud will have the opposite effect of underreporting. However, in all likelihood, cases of underreporting greatly exceed those of fraud in terms both of number and cost (Leigh et al., 2000).

48 The Costs of Occupational Injuries - A Review of the Literature – IRSST
for each type of injury. For example, in their study on the incidence of the costs of occupational injuries, Leigh et al. (2000) opted to calculate the direct costs of diseases based on a prevalence approach. 7.7 Generalization
Company case studies have the advantage of being able to use very detailed data on the costs of occupational injuries. Studies that opt for the societal perspective do not have access to such detailed information at the national level. This latter type of study sometimes uses estimates obtained from the literature and generalizes them to apply to all injuries. Each industry, each company, and each occupational category has its own special characteristics that will ensure any generalization of costs results in inaccurate estimates. For example, consider the recruitment and training costs for different industries. It is likely that these costs are higher in the mining industry than in service industries. Thus, assigning an average cost to each occupational injury irrespective of industry will probably result in a bias.59 Before using estimates from other studies, it is important to determine the ways in which the results can be generalized (Hodgson and Meiners, 1982). In addition, a study’s objective will have an impact on the decision whether to use this type of data. For example, if the objective is to produce an approximate estimate of all the costs of injuries for a society, it may be appropriate to generalize some costs. On the other hand, if the objective is to determine an order, that is, to arrange the costs by size, depending on the industry, occupational category, or type of injury, it may be more appropriate to use only the cost components that allow these different categories to be compared.
59 For example, Leigh et al. (2000) assign recruitment and training costs of $2,453.64 per death, irrespective of industry.

IRSST – The Costs of Occupational Injuries - A Review of the Literature 49
8. CONCLUSION
According to the International Labour Organization (ILO), it is estimated that around 4% of annual worldwide GDP, or $1,250 billion, is absorbed by the direct and indirect costs of work accidents and occupational diseases (ILO, 2002). This astronomically high figure partly explains why the costs of occupational injuries are a focus of current research. This study identified the various methods for estimating the costs of occupational injuries as well as the various cost components that can be considered. It showed that there is no true consensus in the literature regarding either the cost components to be included in such estimates or how they should be classified. Indeed, there are nearly as many ways to classify costs as there are studies on the subject. Some cost components are even considered direct costs in some studies and indirect costs in other studies. The literature review also showed that there are several methods for estimating the costs of occupational injuries. The human capital method is the most widely used for estimating indirect costs. It has the advantage of using reliable data and being easy to apply and understand. However, it measures only a portion of the costs resulting from occupational injuries, namely the productivity losses; it does not take into account the costs, including the human costs, for the injured worker. Ignoring these costs may result in an underestimate of the impact of occupational injuries and thus bias the decision-making process (Hodson and Meiners, 1982). However, recent studies increasingly consider human costs (see Appendix 2). Those studies recommend using hybrid methods, which combine several methods for estimating occupational injuries in the same analysis. For example, it is possible to combine a method for estimating human costs, such as the willingness-to-pay method, with a more traditional method, such as the human capital method. These hybrid methods probably represent the future of research in injury cost estimation. Study of the costs for society as a whole also appears to be the perspective recommended in the most recent works. However, this perspective is susceptible to double-counting. The costs for society are not simply the sum of the costs of the various economic agents. It must be borne in mind that these costs are transfers between agents; what is a cash outflow for some may be a cash inflow for others.60 It is clear that choosing the method and cost components to consider will have a significant impact on the results obtained. The IRSST must establish a method for estimating the costs of occupational injuries that is aligned with its objectives and uses data that are available to it. A complete and accurate estimate of the costs of occupational injuries is not necessary in every situation. As Simonds and Grimaldi (1984) note, what is important is to use a cost estimation method that will provide results that are reliable enough to serve as a basis for decision-making.
60 For example, the income replacement indemnity (IRI) is a cost for the employer but is only a transfer payment for society.


IRSST – The Costs of Occupational Injuries - A Review of the Literature 51
9. AVENUES FOR FURTHER REFLECTION
This report ends by proposing several avenues for further reflection on the development of economic indicators at the IRSST. The role of economic indicators at the IRSST
The IRSST, whose mission is to contribute, through research, to the prevention of work accidents and occupational diseases, intends to develop economic indicators in the occupational health and safety field on which, among other things, decisions regarding research priorities can be based. More specifically, the IRSST wants first to compare the economic indicators obtained with the indicators currently used at the Institute to direct its research priorities. The goal is to verify whether taking these economic indicators into account can have an impact on its research priorities. Then, if these economic indicators are determined to have value for decision-making, the Institute will have to develop ways of using them in combination with its other indicators. The available data
The IRSST has access to an occupational injury database drawn from the CSST’s administrative records. As mentioned in section 7.4, these data concern only the injuries that are reported to the CSST, which is a subset of all the injuries that occur. Nonetheless, they have a representative validity. The available financial data include: - Medical aid costs; - Rehabilitation costs; - Death benefits; - Compensation for bodily harm; - Compensation for permanent disability; - Income replacement indemnities. These costs are assumed in their entirety by employers through their CSST contributions. Other cost data can be obtained from the literature. However, using those data usually has a detrimental effect on the quality of the estimates. The cost components to consider
The IRSST plans to use these indicators to prioritize costs, that is, to arrange the costs in order of size based on various characteristics, including the industry. For such purposes, it is probably not

52 The Costs of Occupational Injuries - A Review of the Literature – IRSST
necessary to estimate all possible cost.61 It would be better to use the cost components that allowed the specificity of the various industries for which reliable data are available to be taken into account.62 In the literature, the most significant cost components are: - Medical costs; - Productivity losses; - Human costs.
A study of the costs of occupational injuries should, as far as possible, take all three components into account. Classifying the costs of occupational injuries
As was seen in the literature review, the costs of occupational injuries can be grouped into three categories: direct costs, indirect costs, and human costs. However, there is no consensus regarding which components belong in which categories. Moreover, when it comes to classifying direct and indirect costs, Québec studies were found to be different from most of the other surveyed studies in the literature (see section 6.3). The Institute can choose between a cost classification method similar to what is done in Québec or to what is usually done in the literature. Of course, the classification will depend on the perspective or viewpoint chosen to estimate the costs. Choosing a perspective
As we saw in section 3.2.1., the perspective corresponds to the level of analysis or the point of view that is chosen to estimate the costs. Should a study on occupational injuries done at the IRSST be limited to the costs for companies or should it be more inclusive and consider the costs for society as a whole? Since the IRSST works on behalf of workers as well as employers, the consequences of occupational injuries on both economic agents deserve consideration. Choosing a method
First, estimating the main direct costs does not require any particular method. For example, the costs insured by the CSST can be determined simply by adding together the relevant components obtained from the CSST’s administrative data. For estimating the indirect costs and human costs, hybrid methods, which combine elements of several cost estimation methods, appear to be the most promising path. For example, some
61 It should be noted that the costs presented in Appendix 4 do not necessarily correspond to all possible costs but to the most documented costs. 62 For example, assigning an average cost of $100 for lawsuits to all compensated occupational injuries would not help the Institute achieve its objectives regarding the use of economic indicators.

IRSST – The Costs of Occupational Injuries - A Review of the Literature 53
authors recommend combining the human capital and willingness-to-pay methods (e.g. Leigh et al., 2004; Access Economics, 2006).63 The human capital method is by far the most widely used method for estimating the indirect costs of occupational injuries. The method takes pay as the measure of productivity or a worker’s contribution to society. However, the friction costs method appears to be an alternative that should also be considered (see section 5.2). For indirect cost components other than productivity losses using estimates taken from other studies, such as the study of Brody et al. (1990a), may be useful. For its part, willingness to pay is the most widely accepted and used method for estimating the human costs resulting from occupational injuries. In section 5.3, we showed that the willingness-to-pay method could be used to estimate the human costs related to deaths as well as injuries. However, any estimate of the value of a statistical life should be based on studies done in Canada (or, better yet, Québec).64 As for the weights used in the equation 17 (p. 30), they can be based on a datum included in the CSST’s administrative records, permanent physical and mental impairment (PPMI). The PPMI corresponds to the sum of the percentages determined using the scale of bodily injuries for anatomicophysiological deficits, disfigurement, and the suffering or loss of enjoyment of life that results from the deficit or disfigurement (CSST, 2010b).
63 Neither of these methods provides a complete evaluation of the costs but each can contribute to that goal (Institute of Medicine, 1981, in Hodson and Meiners, 1982). 64 Due to the representative validity of the samples used.


IRSST – The Costs of Occupational Injuries - A Review of the Literature 55
10. BIBLIOGRAPHY Access Economics (2006). The economic and social costs of occupational disease and injury in New Zealand, NOHSAC, Technical Report 4, Wellington.
Agence européenne pour la sécurité et la santé au travail (2002). Inventory of socioeconomic costs of work accidents. Luxembourg, Office for Official Publications of the European Communities, 46 p.
Andreoni, D. (1985). Le coût des accidents du travail et des maladies professionnelles, 1ere ed., Geneve, BIT, 161 p.
Andreoni, D. (1985). The cost of occupational accidents and diseases, International Labour Office, 1211 Genève 22, Switzerland, 161 p.
Arthur, W.B. (1981). The Economics of Risks to Life, American Economic Review, 71(1), p. 54-64. Australian Safety and Compensation Council (2009). The Cost of Work-related injury and illness for Australian Employers, Workers and the Community:2005-06. Barron, J.M., Black, D.A., Lowenstein, M.A. (1989). Job Matching and on-the-job Training, Journal of Labor Economics, 7 (1), p. 5-20.
Bellavance, F., Dionne, G., Lebeau, M. (2009). The Value of a Statistical Life: A Meta-Analysis with a Mixed Effects Regression Model, Journal of Health Economics, 28(2), 444-464.
Berger, M.L., Murray, J.F., Xu, J., Pauly, M. (2001). Alternative valuations of work loss and productivity, Journal of occupational and environmental medicine / American College of Occupational and Environmental Medicine, 43(1), p. 18-24.
Bernard, C.P. (1988). Évaluation économique de la sécurité au travail : (contribution à l'étude des coûts indirects et du coût réel des accidents). Marseille, France, Editions d’ergonomie, 23 p.
Biddle, E., Hartley, D., Starkey, S., Febrega, V., Richardson, S. (2005). Deriving occupational fatal injury costs: a state pilot study, Compensation and Working Conditions Online, p. 1-7.
Biddle, E.A. (2004). The Economic Cost of Fatal Occupational Injuries in the United States, 1980-97. Contemporary Economic Policy, 22, p. 370-381.
Bird, F. (1974). Le guide du contrôle des pertes à l’intention de la direction, Institute Press, Atlanta, Georgia, traduit de l’anglais par l’Association de prévention des accidents industriels du Québec, 220 p.
Boden, L.I., Biddle, E.A., Spieler, E.A. (2001). Social and economic impacts of workplace illness and injury: current and future directions for research, American Journal of Industrial Medicine, 40(4), p. 398-402.
56 The Costs of Occupational Injuries - A Review of the Literature – IRSST
Brody, B., Jalette, P., Létourneau, Y., Poirier, A. (1990b). Rapport final sur les coûts indirects des accidents du travail dans le secteur public et péripublic canadien, Montréal, [s.n.], 53 p.
Brody, B., Letourneau, Y., Poirier, A. (1987). Approche conceptuelle du phénomène des coûts des lésions professionnelles, Montréal, Université de Montréal, École de relations industrielles.
Brody, B., Letourneau, Y., Poirier, A. (1987). Revue de la littérature sur les coûts indirects des accidents du travail, Montréal, École des Relations Industrielles, Université de Montréal.
Brody B., Letourneau, Y., Poirier, A. (1990). An indirect cost theory of work acccident prevention, Journal of Occupational Accidents, Pays-Bas, 13(4), p. 255-270.
Brody, B., Létourneau, Y., Poirier, A. (1990). Le coût des accidents du travail : état des connaissances, Relations industrielles, 45(1), p. 94-117.
Brody, B., Létourneau, Y., Poirier, A. (1990a). Les coûts indirects des accidents du travail, Études et recherches / Rapport R-044, Montréal, IRSST, 121 p.
Brouwer, W., Koopmanschap, M. (2005). The Friction-Cost Method - Replacement for Nothing and Leisure for Free?, Pharmacoeconomics, 23(2) , p. 105-111.
Brun, J.-P., Lamarche, C. (2006). Évaluation des coûts du stress au travail. Québec, Chaire en gestion de la santé et de la sécurité du travail dans les organisations, 116 p. Chandler, W. (1994). La valeur du travail ménager au Canada, 1992, L’observateur économique canadien, Ottawa, Statistique Canada. Choi, B.C.K., Pak, A.W.P. (2002). A method for comparing and combining cost-of-illness studies: an example from cardiovascular disease, Chronic Diseases in Canada, 23(2), p. 47-57. Commission de la santé et de la sécurité du travail du Québec (1985). Combien coûte réellement un accident du travail?, [S.l.], 8 p.
Commission de la santé et de la sécurité du travail du Québec (2002). L’assignation temporaire : pour un prompt retour au travail, 10 p. Commission de la santé et de la sécurité du travail du Québec (2009). Rapport annuel de gestion 2008, 162 p.
Commission de la santé et de la sécurité du travail du Québec (2010a). Indemnités et remboursement de frais – Données de 2010, 6 p.
Commission de la santé et de la sécurité du travail du Québec (2010b). Règlement annoté sur le barème des dommages corporels, 348 p.
Concha-Barrientos, M., Nelson, D., Fingerhut, M., Discoll, T. et Leigh, J. (2005). The global burden due to occupational injury, American Journal of Industrial Medicine, 48, p. 470-481.

IRSST – The Costs of Occupational Injuries - A Review of the Literature 57
Corcoran, D. (2002). The hidden value of safety. Are accident costs really like icebergs?, Occupational health & safety (Waco, Tex.), 71(6), p. 20-24.
Cousin, J. (1982). La grille d'évaluation des coûts indirects d'accidents du travail : guide d'utilisation. [S.l.], CSST, 23 p.
Das, A., Ng, M. (1990). Report on the preliminary estimates for the annual cost of occupational illnesses and injuries in Alberta, Alberta Occupational Health and Safety, Policy and Professional Services Division, Technical and Professional Services, Canada, 92 p.
De Greef, M., Broek, K.V.d. (2006). PreventMatrix ou comment déterminer le coût d'un accident du travail, Prevent focus, p. 4-8.
Dembe, A.E. (2001). The social consequences of occupational injuries and illnesses, American Journal of Industrial Medicine, 40(4), p. 403-417. Dionne, G., Lanoie, P. (2004). Public Choice about the Value of a Statistical Life: The Case of Road Safety, Journal of Transport Economics and Policy, 38(2), p. 247-274. Dolan, P. (1997). Modeling Valuations for EuroQol Health States, Medical Care, 35, p. 1095–1108. Douglass J, Kenney, G., Miller, T. (1990). Which estimates of household production are best?, Journal of Forensic Economics, 4, p. 25–46. Duguay, P., Hébert, F., Massicotte, P. (2003). Les indicateurs de lésions indemnisées en santé et en sécurité du travail au Québec : analyse par profession en 1995-1997, Études et recherches / Rapport R-332, Montréal, IRSST, 227 p. Duguay, P., Massicotte, P., Prud’homme, P. (2008). Lésions professionnelles indemnisées au Québec en 2000-2002 : I - profil statistique par activité économique, Études et recherches / Rapport R-547, Montréal, IRSST, 165 p. Fahs, M.C., Markowitz, S.B., Fischer, E., Shapiro, J., Landrigan, P.J. (1989). Health costs of occupational disease in New York State, American Journal of Industrial Medicine, 16(4), p. 437-449. Fahs, M.C., Markowitz, S.B., Leigh, J.P., Shin, C.G., Landrigan, P.J. (1997). A National Estimate of the Cost of Occupationally Related Disease in 1992, Annals of the New York Academy of Sciences, Vol. 837, Cooperative Agreement No. U60-CCU-902886, p. 440-455.
Feeny, D.H., Furlong, W.J., Boyle, M., Torrance, G.W. (1995). Multi-Attribute Health Status Classification Systems: Health Utilities Index, Pharmacoeconomics, 7(6), p. 490-502. Feeny, D.H., Torrance, G.W., Furlong, W. J. (1996). Health Utilities Index, dans Bert Spilker, editor, Quality of Life and Pharmacoeconomics in Clinical Trials. Second Edition. Philadelphia: Lippincott-Raven Press, p. 239-252.

58 The Costs of Occupational Injuries - A Review of the Literature – IRSST
Freeman, K., LaFleur, B.J., Booth, J., Doyle, E.J., Pugh, W.M. (2001). Why Federal Agencies should Estimate their Long-Term Occupational Injury and Illness Costs, Journal of Safety Research, 32, p. 277-287.
French, M.T. (1990). Estimating the full cost of workplace injuries. American Journal of Public Health, 80(9), p. 1118-1119.
Furlong, W., Feeny, D., Torrance, G.W., Goldsmith, C., Depauw, S., Boyle, M., Denton, M., Zhu, Z. (1998). Multiplicative Multi-Attribute Utility Function for the Health Utilities Index Mark 3 (HUI3) System: A Technical Report, McMaster University Centre for Health Economics and Policy Analysis Working Paper, n° 98-11, Hamilton, Ontario: McMaster University.
Goodchild, M., Sanderson, K., Nana, G. (2002). Measuring the total cost of injury in New Zealand: a review of alternative cost methodologies Report to The Department of Labour: BERL#4171. Business and Economic Research Limited.
Gosselin, M. (2004). Analyse des avantages et des coûts de la santé et de la sécurité au travail en entreprise - Développement de l'outil d'analyse, Études et recherches / Rapport R-375, Montréal, IRSST, 68 p. Graham, J.W., Green, C.A. (1984). Estimating the Parameters of a Household Production Function with Joint Products, The Review of Economics and Statistics, 66 (2), p. 277-282. Gustafson, D.H., Helstad, C.P., Hung, C.F., Nelson, G., Batalden, P. (1995). The total costs of illness: a metric for health care reform, Hospital and Health Services Administration, 40(1), p. 154-171.
Hartley, D., Biddle, E.A., Jenkins, E.L. (2005). Societal cost of workplace homicides in the United States, 1992-2001. American Journal of Industrial Medicine, 47(6), p. 518-527.
Hartunian, N.S., Smart, C.N., Thompson, M.S. (1980). The incidence and economic costs of cancer, motor vehicle injuries, coronary heart disease and stroke: a comparative analysis, American Journal of Public Health, 70, p. 1249-1260.
Hawrylyshyn, O. (1978). Estimating the Value of Household Work in Canada, 1971, Catalogue No. 13-558. Heinrich, H.W. (1959) (1931 for 1st ed.). Industrial Accident Prevention: a Scientific Approach, McGraw-Hill, N.Y., 4th ed., 479 p.
Hensler, D.R., Marquis, M.S., Abrahams, A.F., Berry, S.H., Ebener, P.A., Lewis, E.G., Ling, E.A., MacCoun, R.J., Manning, W.G., Rogowski, J.A., Vaiana, M.E. (1991). Compensation For Accidental Injuries In The United States, Report R-3999-HHS/ICJ, RAND: Santa Monica, CA. Hodgson, T.A., Meiners, M. (1982). Cost-of-illness methodology: a guide to current practices and procedures, Milbank Memorial Fund Quarterly Journal, 60(3), p. 429-62.

IRSST – The Costs of Occupational Injuries - A Review of the Literature 59
Institute of Medicine (1981). Cost of Environment-Related Health Effects: A Plan for Continuing Study, Washington, D.C.: National Academy Press.
Jenkins, G., Kuo, C.-Y. (2007). The Economic Opportunity Cost of Capital for Canada—An Empirical Update, document de travail no 1133, Department of Economics, Queen’s University, Kingston, Canada. Johannesson, M., Karlsson, G. (1997). The friction cost method: A Comment, Journal of Health Economics, 16, p. 249-255.
Kind, P. (1996). The EuroQol Instrument: An Index of Health-Related Quality of Life, dans Spilker B, editor, Quality of life and pharmacoeconomics in clinical trials, 2nd ed. Philadelphia (PA): Lippincott-Raven Press, p. 191-201.
Koopmanschap, M.A., Rutten, F.F., van Ineveld, B.M., van Roijen, L. (1995). The friction cost method for measuring indirect costs of disease, Journal of Health Economics, 14(2), p. 171-189.
LaBelle, J.E. (2000). What do accidents truly cost?, Professional Safety, 45(4), p. 38-42.
Lacharité, J. (1986). La charge socio-économique des accidents du travail et des maladies professionnelles au Québec, Travail et santé, p. 22-26.
Lanoie, P., Pedro, C., Latour, R. (1995). The Value of a Statistical Life: A Comparison of two Approaches, Journal of Risk and Uncertainty, 10, p. 235-257. Lanoie, P., Tavenas, S. (1995). Costs and Benefits of Preventing Workplace Accidents: The Case of Participatory Ergonomics, CIRANO, 95s-38, 33 p.
Larsson, T.J., Betts, N.J. (1996). The Variation of Occupational Injury Cost in Australia; Estimates Based on A Small Empirical Study, Safety Science, 24(2), p. 143-155.
Lavoie, R. (2000). Les coûts indirects des accidents de travail dans une entreprise du secteur minier, Mémoire de maîtrise, HEC Montréal, 85 p. Lax, M.B., Klein, R. (2008). More than meets the eye: social, economic, and emotional impacts of work-related injury and illness, New solutions: a journal of environmental and occupational health policy: NS, 18(3), p. 343-360.
Le Pen, C. (1993). Capital humain et la santé (valeur et qualité de la vie humaine), Paris, Dauphine, miméo. Lebeau, M. (2006). La valeur statistique d’une vie humaine : une méta-analyse, Mémoire de maîtrise, HEC Montréal, 106 p.
Legault-Faucher, M. (1990). Accidents du travail : les coûts derrière les coûts, Prévention au travail, 3(4), p. 8-10.

60 The Costs of Occupational Injuries - A Review of the Literature – IRSST
Leigh, J.P., Cone, J.E., Harrison, R. (2001). Costs of occupational injuries and illnesses in California, Preventive Medicine, 32(5), p. 393-406.
Leigh, P.J., Markowitz, S.B., Fahs, M., Landrigan, P. (2000). Costs of occupational injuries and illnesses, Ann Arbor, MI: University of Michigan Press, 310 p.
Leigh, J.P., Markowitz, S.B., Fahs, M., Shin, C., Landrigan, P.J. (1997). Occupational injury and illness in the United States. Estimates of costs, morbidity, and mortality, Archives of Internal Medicine, 157(14), p. 1557-1568.
Leigh, J.P., Miller, T.R. (1997). Ranking occupations based upon the costs of job-related injuries and diseases, Journal of occupational and environmental medicine / American College of Occupational and Environmental Medicine, 39(12), p. 1170-1182.
Leigh, J.P., Miller, T.R. (1998). Ranking Industries Based upon the Costs of Job-Related Injuries and Diseases, in Research in Human Capital and Development, vol. 12. Stamford, Conn. and London, JAI Press, p. 47-72.
Leigh, J.P., Robbins, J.A. (2004). Occupational disease and workers' compensation: coverage, costs, and consequences, The Milbank quarterly, 82(4), p. 689-721.
Leigh, J.P., Waehrer, G., Miller, T.R., Keenan, C. (2004). Costs of occupational injury and illness across industries, Scandinavian Journal of Work, Environment and Health, 30(3), p. 199-205.
Leigh, J.P., Waehrer, G., Miller, T.R., McCurdy, S.A. (2006). Costs differences across demographic groups and types of occupational injuries and illnesses, American Journal of Industrial Medicine, 49(10), p. 845-853.
McDowell, I., Newell, C. (1996). Measuring Health: A Guide to Rating Scales and Questionnaires, 2nd ed., Oxford University Press, p. 446-456. Miller, T. (1991). Track the True Costs of Accidents, Safety and Health, 144(5), p. 65-66.
Miller, T.R. (1997). Estimating the Costs of Injury to U.S. Employers, Journal of Safety Research, 28(1), p. 1-13.
Miller, T.R., Brinkman, C.P., Luchter, S. (1988). Crash Costs and Safety Investment, Proceedings of the 32nd Annual Conference, Association for the Advancement of Automotive Medicine, Des Plaines, IL.
Miller, T.R., Galbraith, M. (1995). Estimating the costs of occupational injury in the United States, Accident Analysis and Prevention, 27(6), p. 741-747.
Miller, T.R., Waehrer, G.M. (1998). Costs of occupational injuries to teenagers, United States. Injury prevention: journal of the International Society for Child and Adolescent Injury Prevention, 4(3), p. 211-217.

IRSST – The Costs of Occupational Injuries - A Review of the Literature 61
Mincer, J. (1974). Schooling, Experience, and Earnings, Columbia University Press, New York, 1974. Ministère des Transports du Québec (2007). Guide de l’analyse avantages-coûts des projets publics en transport; Partie 3 - Paramètres (valeurs de 2006), 13 p. Montmarquette, C., Scott, I. (2007). Le taux d’actualisation pour l’évaluation des investissements publics au Québec, Centre interuniversitaire de recherche en analyse des organisations.
Moore, R., Mao, Y., Zhang, J., Clarke, K. (1997). Le fardeau économique de la maladie au Canada, 1993, Ottawa : Association canadienne de santé publique. Organisation International du Travail (2002). Rapport de la Commission des accidents du travail et des maladies professionnelles, Conférence internationale du Travail, 90e session. Rice, D.P., MacKenzie, E.J. and Associates (1989). Cost of Injury in the United States: A Report to Congress, 1989, San Francisco, CA: Institute for Health & Aging, University of California and Injury Prevention Center, The Johns Hopkins University.
Rikhardsson, P.M. (2004). Accounting for the cost of occupational accidents, Corporate Social - Responsibility and Environmental Management, 11(2), p. 63.
Rikhardsson, P.M., Impgaard, M. (2004). Corporate cost of occupational accidents: An activity-based analysis, Accident Analysis and Prevention, 36(2), p.173-182.
Rodgers, G.B. (1993). Estimating jury compensation for pain and suffering in product liability cases involving nonfatal personal injury, Journal of Forensic Economics, 6(3), p.251–262.
Rognstad, K. (1994). Costs of occupational accidents and diseases in Norway, European Journal of Operational Research, 75(3), p. 553.
Roy, M., Bergeron, S., Fortier, L. (2004). Développement d'instruments de mesure de performance en santé et sécurité du travail à l'intention des entreprises manufacturières organisées en équipes semi-autonomes de travail, Études et recherches / Rapport R-357, Montréal, IRSST, 56 p. Schulte, P.A. (2005). Characterizing the burden of occupational injury and disease, Journal of occupational and environmental medicine / American College of Occupational and Environmental Medicine, 47(6), p. 607-622.
Secrétariat du Conseil du Trésor du Canada (2007). Guide d’analyse coûts-avantages pour le Canada : Propositions de règlementation, Ottawa.
Segel, E.J. (2006). Cost-of-Illness Studies — A Primer, RTI International, RTI-UNC Center of Excellence in Health Promotion Economics. Senécal, C. (1998). Les coûts indirects des accidents du travail au Québec dans les secteurs primaires et secondaires à risque élevé, Mémoire de maîtrise, Université de Montréal, 77 p.

62 The Costs of Occupational Injuries - A Review of the Literature – IRSST
Simonds, R.H., Grimaldi, J.V. (1984). Safety Management, Richard D. Irwin Inc., Howewood, Illinois, 638 p.
Shalini, R.T. (2009). Economic cost of occupational accidents: Evidence from a small island economy, Safety Science, 47(7), p. 973-979.
Shannon, H.S., Lowe, G.S. (2002). How many injured workers do not file claims for workers' compensation benefits?, American journal of industrial medicine, 42, p. 467-473. Smith, A. (1776). The Wealth of Nations, Chicago: University of Chicago Press. Strand, J. (2001). Public and Private Good Values of Statistical Lives: Results from a Combined Choice Experiment and Contingent Valuation Survey, Department of Economics, University of Oslo. Tangri, R.P. (2003). What stress costs. Halifax: Chrysalis Performance Strategies Inc. U.S. Department of Transportation (2009). Revision of Departmental Guidance on Treatment of the Value of Life and Injuries, Office of the Assistant Secretary for Transportation Policy. van Beeck, E.F., van Roijen, L., Mackenbach, J.P. (1997). Medical costs and economic production losses due to injuries in the Netherlands, The Journal of trauma, 42(6), p. 1116-1123.
Viscusi, W.K. (1993). The Value of Risks to life and Health, Journal of Economic Literature, 31, p. 1912-1946. Viscusi, W.K., Moore, M.J. (1987). Workers' Compensation: Wage Effects, Benefit Inadequacies, and the Value of Health Losses, The Review of Economics and Statistics, MIT Press, 69(2), p. 249-61.
Waehrer, G.M., Dong, X.S., Millera, T., Haile, E., Men, Y. (2007). Costs of occupational injuries in construction in the United States, Accident Analysis & Prevention, 39(6), p. 1258-1266. Waehrer, G., Leigh, J.P., Cassady, D., Miller, T.R. (2004). Costs of occupational injury and illness across states, Journal of occupational and environmental medicine / American College of Occupational and Environmental Medicine, 46(10), p. 1084-1095.
Waehrer, G., Leigh, J.P., Miller, T.R. (2005). Costs of occupational injury and illness within the health services sector, International Journal of Health Services, 35(2), p. 343-359.
Wagstaff, A. (1991). QALYs and the Equity-Efficiency Trade-Off, Journal of Health Economics, 10, p. 21-41. Weil, D. (2001). Valuing the economic consequences of work injury and illness: a comparison of methods and findings, American Journal of Industrial Medicine, 40(4), p. 418-437.
Zaloshnja, E., Miller, T.R., Waehrer, G. (2006). The impact of occupational injury reduction on the U.S. economy, American Journal of Industrial Medicine, 49, p. 719-727.

IRSST – The Costs of Occupational Injuries - A Review of the Literature 63
Zhang, A., Boardman, A.E., Gillen, D., Waters II, W.G. (2004). Towards Estimating the Social and Environmental Costs of Transportation in Canada, a Report for Transport Canada, UBC Centre for Transportation Studies, 450 p.


IRSST – The Costs of Occupational Injuries - A Review of the Literature 65
APPENDIX 1: BIBLIOGRAPHIC RETRIEVAL FORMULAS PubMed Cost of Illness [MeSH Terms] OR Cost-Benefit Analysis[MeSH Terms] OR Cost and cost analysis[MeSH Terms] OR Costs and Cost Analysis[MeSH Terms] OR Cost*[Title] OR Coût*[Title] AND Accidents, Occupational[MeSH Terms] OR Occupational Diseases[MeSH Terms] OR Occupational Health[MeSH Terms] OR Occupational health services[MeSH Terms] OR Workers' Compensation[MeSH Terms] OR Occupation*[Title] NOT Rehabilitation[MeSH Subheading] OR prevention & control[MeSH Subheading] OR rehabilitation[Title] OR prevention[Title] Limits: Humans, English, French ABI / Inform Cost* OR Coût* / Titre AND occupational safety OR occupational accidents OR occupational health / Sujet AND injur* OR accident* OR compensation / Titre Social Science full text Cost* OR Coût* / Titre AND Occupation* / Titre AND injur* OR accident* OR compensation OR ill* OR disease* / Titre OSH Update Cost* OR Coût* / Titre AND Occupation* / Titre AND injur* OR accident* OR compensation OR ill* OR disease* / Titre

66 The Costs of Occupational Injuries - A Review of the Literature – IRSST
CCHST (Cost* OR Coût*) <AND> (Occupation*) <AND> (injur* OR accident* OR compensation OR ill* OR disease*) CSST Titre ((Cost* OR Coût*) AND (Occupation*) AND (injur* OR accident* OR compensation OR ill* OR disease*)) Sujet : (Coût des accidents OR Coût des maladies professionnelles) ET Titre : (Cost* OR Coût*) ScienceDirect Titre ((Cost* OR Coût*) AND (Occupation*)) PAIS International (Cost* OR Coût*) AND (Occupation*) AND (injur* OR accident* OR disease*) Tous les champs Proquest (Cost* OR Coût*) AND (Occupation*) AND (injur* OR accident* OR compensation OR ill* OR disease*) / SUBJECT EconLit B139 S Cost? / Titre AND S Occupation? / Titre AND S injur? OR accident? OR compensation OR ill? OR disease? / Titre

IRSST – The Costs of Occupational Injuries - A Review of the Literature 67
APPENDIX 2: SUMMARY OF THE APPLIED STUDIES
Year Authors Source IF1 Country Perspective Data Approach2 I/P3 DC4 IC4 HC4 Method5 Rte6
1 1931 Heinrich McGraw-Hill - USA Company Company BU I x x - CCS -
2 1974 Bird Institute Press - USA Company Company BU I x x - CCS -
3 1984 Simonds and Grimaldi Richard D. Irwin - USA Company Company BU I x x - CCS -
4 1987 Viscusi and Moore The Review of Economics and Statistics 1.724 USA Worker National BU I - x x WTP -
5 1989 Fahs American Journal of Industrial Medicine 1.597 USA Society National BU/TD I/P x x - HC 6%
6 1990 Das and Ng Alberta Occupational Health and Safety - Canada Society National BU P x x x HC, WTP -
7 1990a Brody et al. IRSST - Canada (Québec) Company Company BU I x x - CCS -
8 1990b Brody et al. IRSST - Canada (Québec) Company Company BU I x x - CCS -
9 1990 French American Journal of public health 3.612 USA Worker National BU I - x x WTP -
10 1994 Rognstad Journal of Operational Research 1.467 Norway Society National TD I x x - HC 7%
11 1995 Gustafson Hospital and health services Administration - USA Company Company BU I x x - CCS -
12 1995 Koopmanschap et al. Journal of Health Economics 1.521
Nether-lands Society National TD I - x - FC -
13 1995 Lanoie and Tavenas CIRANO -
Canada (Québec) Company Company BU I x x - CCS -
14 1995 Miller and Galbraith Accident Analysis and Prevention 1.586 USA Society National TD P x x x HC, WTP 4%
15 1996 Larsson and Betts Safety Science 0.427 Australia Company Company BU I x x - CCS -
16 1997 Fahs et al. Annals of the New York Academy of Sciences 1.731 USA Society National TD I/P x x - HC -
17 1997 Leigh et Miller Journal of Occupational and Environmental Medicine 2.817 USA Society National BU I x x - HC 4%
18 1997 Leigh et al. Archives of Internal Medicine 8.391 USA Society National BU/TD I/P x x - HC 4%
19 1997 Miller Jour Safety Research 0.835 USA Company National TD P x x - FC -
20 1997 van Beeck et al. The Journal of Trauma 2.334 Nether-lands Society National TD I/ P x x - HC, FC 5%
21 1998 Leigh and Miller Research in Human Capital and Development - USA Society National BU I x x - HC 4%

68 The Costs of Occupational Injuries - A Review of the Literature – IRSST
Year Authors Source IF1 Country Perspective Data Approach2 I/P3 DC4 IC4 HC4 Method5 Rte6
22 1998 Miller and Waehrer Injury Prevention 1.401 USA Society National BU I x x x HC, WTP 2.5%
23 1998 Sénécal Université de Montréal - Canada (Québec) Company Company BU I x x - CCS -
24 2000 Lavoie HEC Montréal - Canada (Québec) Company Company BU I x x - CCS -
25 2000 Leigh et al. University of Michigan Press - USA Society National BU/TD I/P x x x HC, WTP 4%
26 2001 Leigh et al. Preventive Medicine 2.314 USA Society National BU/TD I/P x x - HC -
27 2004 Biddle Contemporary Economic Policy 0.521 USA Society National BU I x x - HC 3%
28 2004 Leigh et al. Scandinavian Journal of Work, Environment & Health 1.387 USA Society National BU I/P x x x
HC, WTP, JURY 2.5%
29 2004 Leigh and Robbins The Milbank Quarterly 3.5 USA Society National TD P x x - HC 3%
30 2004 Rikhardsson and Impgaard Accident Analysis and Prevention 1.586 USA Company Company BU I - x - CCS -
31 2004 Waehrer et al. Journal of Occupational and Environmental Medicine 2.817 USA Society National BU I/P x x x
HC, WTP, JURY 2.5%
32 2005 Concha-Barrientos et al. American Journal of Industrial Medicine 1.597
Several countries Worker National TD I - - x DALY 3%
33 2005 Hartley et al. American Journal of Industrial Medicine 1.597 USA Society National BU I x x - HC 2.5%
34 2005 Waehrer et al. International Journal of Health Services 0.885 USA Society National BU I/P x x x HC, JURY 2.5%
35 2006 Access Economics NOHSC -
New Zealand Society National BU I x x x
HC, WTP, DALY 3.8%
36 2006 Leigh et al. American Journal of Industrial Medicine 1.597 USA Society National BU I/P x x x HC, JURY 2.5%
37 2006 Zaloshnja et al. American Journal of Industrial Medicine 1.597 USA Society National BU I/P x x
FC 2.5%
38 2007 Waehrer et al. Accident Analysis and Prevention 1.586 USA Society National BU I/P x x x HC, WTP, JURY 2.5%
39 2008 Shalini Safety Science 0.427 Mauritius Society National BU I x x - HC 5%
40 2009 Australian Government
Australian Safety and Compensation Council - Australia Society National BU I x x - HC, FC 4%
1 Impact factor (2007) 2 Bottom-up approach (BU); top-down approach (TD) 3 Prevalence (P) or incidence (I) analysis
4 An “x” means that the study measures the direct costs (DC) and/or indirect costs (IC) and/or the human costs (HC) 5 Methods used: human capital (HC), friction costs (FC), willingness to pay (WTP), jury verdicts (JURY), health status indices (DALY), company case study (CCS) 6 Discount rate used
IRSST – The Costs of Occupational Injuries - A Review of the Literature 69
APPENDIX 3: DISCOUNT RATE CALCULATION Private discount rate
The appropriate discount rate for a company is the weighted average cost of capital (WACC), which corresponds to what the company owes, in terms of return, to all who have provided capital to it.65 A company’s capital structure generally consists of equity and debt. Equity is the amounts invested by the shareholders as well as the undistributed earnings. Debts are the debts contracted by the company with creditors (banks, financial institutions, etc.). WACC is calculated using the following formula:
)1()()( tkDDE
DkEDE
ECMPC −××+
+×+
= (23)
where
- E is the equity; - D is the debt; - kE is the cost of equity; - kD is the cost of debt; - t is the tax rate.
For example, take a company whose capital is 70% equity and 30% debt. If the shareholders require a return of 8%, the interest rate on the debt is 6%, and the tax rate is 40%, then the cost of capital will be (8% × 70%) + (6% × 30%) × (1 – 0.4) = 6.68%. If the cash flows are corrected for inflation, the nominal discount rate is appropriate. Conversely, if the flows are expressed in current dollars, a real discount rate should be used, which can be obtained by subtracting the expected rate of inflation from the discount rate. The Bank of Canada is aiming to keep inflation at 2%. Thus, in our example, the real discount rate would be 6.68% – 2% = 4.68%. Social discount rate
For the public sector, it is agreed to use a social discount rate that takes into account society’s preferences regarding the relative value of cash flows over time and various macroeconomic factors (Montmarquette and Scott, 2007). However, the method to use in order to determine a social discount rate has long been a subject of debate among economists. The literature contains several points of view regarding the interpretation and choice of which social discount rate to adopt. Among other things, some favour a discount rate equal to zero, others a rate that decreases gradually over time. However, a fixed rate greater than zero is what is most widely used. As the goal of this study is not to conduct a review of the literature on the subject, we will basically outline what is done in Canada and what is applied in government cost-benefit analyses.
65 In other words, the minimum return that investments must yield in order to meet the requirements of the shareholders and creditors that invested in the company.

70 The Costs of Occupational Injuries - A Review of the Literature – IRSST
The most widely used method in Canada is similar to the one used to obtain a company’s WACC. The funds necessary to carry out government projects comes from three sources. First, some funds, which could have been used for other investment activities, are now directed to the project concerned. The cost of using these funds corresponds to the project’s opportunity cost (ρ), i.e. that society gives up a return on investments that could have been made elsewhere. Second, there are funds that come from economic agents that reside in the country and invest in government bonds and Treasury bills in order to grow their savings. This cost of this type of financing corresponds to the interest rate, net of income tax, granted to these investors (r). Lastly, some funds come for foreign lenders. The cost of using these funds corresponds to the marginal costs of foreign borrowing, which, according to Jenkins and Kuo (2008), can be expressed as follows: }{ )/1(1)1( f
sxff tiMC εφ ×+×−×= (24)
where - fi is the real interest rate on foreign borrowing;
- xt is the rate of withholding taxes charged on interest payments made abroad; - φ is the portion of the foreign borrowing negotiated at variable interest rates; - f
sε is the supply elasticity of foreign funds. The social discount rate, which corresponds to the social capital opportunity cost of capital (SOCC), is equal to the weighted average of the costs of the funds coming from the three above-mentioned sources: fMCfrffSOCC 321 ++ρ= (25)
where the weightings are equivalent to the proportions of the funds from the supplanted investment (f1), domestic savings (f2), and foreign funds (f3).

IRSST – The Costs of Occupational Injuries - A Review of the Literature 71
APPENDIX 4: COST COMPONENTS OF OCCUPATIONAL INJURIES Society
Costs Definition Employer2 Worker3 Others4
Direct costs Medical costs Expenses incurred (or
projected) to treat the injury
First aid Medical costs (hospitals, medication, rehabilitation, transportation, administrative costs, etc.)
Uncompensated medical expenses Private insurance premiums
Spending on the government health care system (resource availability)
Property damage
All property damage that occurred at the time of the injury
Property damage (machinery, clean-up, etc.) Private insurance premiums
Uncompensated property damage (clothing, prostheses, etc.) -
Emergency services
All emergency services that may be used during a work accident
Ambulance -
Police Firefighters
Funeral costs All costs incurred to bury a deceased worker
Compensated funeral costs
Funeral costs (net of compensation) -
Indirect costs Productivity Productivity loss related to
a stop or slowdown in production due to property damage or accidents that affected the employees’ physical integrity
Productivity loss (short term)5
-
Drop in production capacity (long term)
Salary costs6 Financial consequences resulting from the change in pay of the accident victim and/or other workers
Overtime pay Pay increases due to increased risk Income replacement indemnity
Loss of pay (net of compensation)7
Decrease in pay due to a change in career path (net of compensation)
Uncollected income tax Government aid in the form of an income supplement
Employee benefits
All the benefits that the employee receives in addition to his pay
Employee benefits assumed by the employer for a non-productive employee
Lost employee benefits Employee benefits assumed by the community
Household work
The economic services lost in the household that are outside the market, but that could be produced by a third party hired on the market without changing their utility to the members of the household
Compensated household work
Inability to perform household work (net of compensation Extra work for the other members of the household
-
Administrative costs
General and administrative costs related to the accident and to hiring a replacement
Recruitment Training Investigation Administrate costs of the private and public insurers
- -

72 The Costs of Occupational Injuries - A Review of the Literature – IRSST
1 The division of the costs between the employer, the worker, and the rest of society can vary depending on the characteristics of the compensation plans in effect in each country. 2 Costs assumed directly by the employer or via its contributions to the compensation plan. 3 The costs for the workers also include the costs for those in their circle (family and friends). 4 These are specific costs assumed by other economic agents in society and the general costs assumed by all of society, including employers and workers. 5 See section 4.2 for a list of situations that can result in productivity losses. 6 Some of the presented salary costs may already be include in the productivity loss calculation, depending on the method used. Thus there exists a risk of double-counting. 7 In Québec, this corresponds to 10% of net income (up to the yearly maximum insurable earnings) and the net income of the amount over the maximum insurable earnings.
Costs Definition Employer2 Worker3 Others4
Legal costs Costs resulting from legal proceedings
Medical disputes Legal defence Lawsuits
Medical disputes Legal defence Lawsuits
Use of government services (courts, legal staff, etc.)
Reputation Financial losses related to the negative image that a work accident can create
Loss of contracts Recruitment problems
Difficulty finding other work due to the occupational injury record
-
Human costs
Human costs Costs related to the change in the quality of life (e.g. bodily harm, pain, suffering, loss of enjoyment of life)
Possible tensions in labour relations Stress and anxiety in the other workers Compensated human costs
Pain, anxiety, stress, and loss of enjoyment of life of the accident victim, family members, and friends (net of compensation) Family problems
Reduction of the accident victim’s participation in economic, social, and political life

IRSST – The Costs of Occupational Injuries - A Review of the Literature 73
APPENDIX 5: HEALTH STATUS INDICES Utilities Index Mark 3 (HUI3)
The Health Utilities Index Mark 3 (HUI3) is a health status index that classifies the various possible
states using a system of eight attributes or characteristics: vision, hearing, speech, ambulation,
dexterity, emotion, cognition, and pain. Each of the attributes is evaluated on a five- or six-level
scale. From the state where there is no restriction to the state with severe restrictions, a total of
972,000 possible health states are defined. To obtain an individual measure of the quality of life q, a
simple multi-attribute function is applied,66
371.0)(371.1 87654321 −×××××××= bbbbbbbbq (26) where the b’s are the values obtained in table 9.
Table 9 – Health Utilities Index Mark 3 (HUI3)
Level Vision Hearing Speech Ambulation Dexterity Emotion Cognition Pain
1 1.00 1.00 1.00 1.00 1.00 1.00 1.00 1.00
2 0.98 0.95 0.94 0.93 0.95 0.95 0.92 0.96
3 0.89 0.89 0.89 0.86 0.88 0.85 0.95 0.90
4 0.84 0.80 0.81 0.73 0.76 0.64 0.83 0.77
5 0.75 0.74 0.68 0.65 0.65 0.46 0.60 0.55
6 0.61 0.61 0.58 0.56 0.42
For example, take an individual with no restriction in any of the attributes in the above table except
for hearing (level 2) and dexterity (level 3). The value assigned to this individual’s heath status
would be 0.775.67
66 For more details about this function, see Furlong et al. (1998). 67 775.0371.0)11188.01195.01(371.1 =−×××××××=q

74 The Costs of Occupational Injuries - A Review of the Literature – IRSST
EuroQol EQ-5D
The EuroQol EQ-5D evaluates an individual’s health using only five dimensions: mobility, self-
care, usual activities, pain/discomfort, and anxiety/depression. Each dimension has three possible
levels (1: no problems; 2: some problems; 3: extreme problems). This scale provides a total of 243
unique heath statuses. The heath statuses are expressed as five digits. For example, a score of 1-1-1-
3-2 corresponds to a person with extreme pain but only some anxiety/depression, with the other
three dimensions not being affected. To obtain the value associated with each health status, we use
the following table, which lists the loss of value associated with each reply obtained.
Table 10 – EuroQol EQ-5D
Level Dimensions 1 2 3 Mobility 0 –0.069 –0.314 Self-care 0 –0.104 –0.214 Usual activities 0 –0.036 –0.094 Pain/discomfort 0 –0.123 –0.386 Anxiety/depression 0 –0.071 –0.236
The sum of the various losses of value obtained from the table is then subtracted from the optimal
state (q = 1).68 In addition, if at least one result is in level 2, the constant 0.081 is subtracted from
the result; similarly, if a result in level 3, the constant 0.269 is subtracted (McDowell and Newell,
1996).69
For example, the value assigned to the health status of the individual with the score of 1-1-1-3-2
would be 0.193.70
68 q = 1 – (sum of the losses of value) 69
The figures in table 10 were derived empirically using regression analyses. However, two distinct “step” functions are noted when respondents choose at least one level 2 or 3 (Lebeau, 2006). It is as if the ordinate were moved back to the start. This is why the constants need to be subtracted. For a more detailed explanation, see Dolan (1997). 70 193.0269.0081.0071.0386.01 =−−−−=q

IRSST – The Costs of Occupational Injuries - A Review of the Literature 75
APPENDIX 6: OCCUPATIONAL INJURY COST COMPONENTS IN THE QUÉBEC STUDIES
Costs Definition Employer
Direct costs CSST contributions All the cost components included in the
insurance contributions to the CSST
Medical aid and rehabilitation costs Income replacement indemnities
Death benefits
Compensation for bodily harm Compensation for permanent disability
The CSST’s administrative costs
Indirect costs Salary costs Time lost by the employees Time lost by the injured worker
Time lost by the workers assisting the injured worker Time lost by workers whose work depends on the injured worker’s work Time lost by the emergency responders Time lost by the supervisors
Property damage Property damage that occurred during the accident
Medications and medical equipment Repairs to machinery and equipment Replacement of equipment Damage caused to merchandise Clean-up costs
Administrative costs Hours devoted to performing administrative tasks related to the accident
Training of the replacement worker Investigation of the accident Administration of CSST files
Productivity Decreased productivity resulting from the stopping or slowing down of production due to property damage and accidents affecting employees’ physical integrity
Lower productivity of the returning injured worker Lower productivity of the other workers Lower productivity of the replacement worker Overtime
Other costs Other costs resulting from the occupational injuries
Medical transportation Medical costs (medical opinion) Legal costs Employee benefits