special report on the nuclear accident at the … · inpo 11-005 1 1.0 introduction this report...
TRANSCRIPT

Special Report
OPEN DISTRIBUTION
INPO 11-005 November 2011
Special Report on the Nuclear Accident at the Fukushima Daiichi Nuclear Power Station
Revision 0

Open Distribution: Copyright © 2011 by the Institute of Nuclear Power Operations. Not for sale or commercial use. All other rights reserved.
NOTICE: This information was prepared in connection with work sponsored by the Institute of Nuclear Power Operations (INPO). Neither INPO, INPO members, INPO participants, nor any person acting on behalf of them (a) makes any warranty or representation, expressed or implied, with respect to the accuracy, completeness, or usefulness of the information contained in this document, or that the use of any information, apparatus, method, or process disclosed in this document may not infringe on privately owned rights, or (b) assumes any liabilities with respect to the use of, or for damages resulting from the use of any information, apparatus, method, or process disclosed in this document.

INPO 11-005
i
Table of Contents
Section Page
1.0 Introduction .........................................................................................................................1 1.1 Site Description ............................................................................................................2
2.0 Executive Summary ............................................................................................................3 3.0 Overview of Event ...............................................................................................................5
3.1 Status of Units Just Before the Earthquake..................................................................5 3.2 Earthquake ...................................................................................................................5 3.3 Tsunami........................................................................................................................7 3.4 Loss of Power ..............................................................................................................8 3.5 Core Cooling ................................................................................................................9 3.6 Containment Pressure Control ...................................................................................10 3.7 Spent Fuel Pools and Dry Cask Storage ....................................................................12 3.8 Alternative Injection Sources .....................................................................................12 3.9 Working Conditions ...................................................................................................13
4.0 Unit-Specific Event Narrative ..........................................................................................14 4.1 Unit 1 Narrative .........................................................................................................14 4.2 Unit 2 Narrative .........................................................................................................21 4.3 Unit 3 Narrative .........................................................................................................28 4.4 Unit 4 Narrative .........................................................................................................33 4.5 Spent Fuel Pools and Dry Cask Storage ....................................................................35
5.0 Radiological Overview ......................................................................................................38 5.1 On-Site Capabilities ...................................................................................................38 5.2 Site Boundary and Off-Site Capabilities ....................................................................39 5.3 On-Site Dose Rates and Protective Measures ............................................................39 5.4 Site Boundary and Off-Site Dose Rates and Protective Measures ............................41
6.0 References ..........................................................................................................................44 7.0 Additional Information ....................................................................................................45
7.1 Earthquake Design Basis ...........................................................................................45 7.2 Tsunami Design Basis................................................................................................47 7.3 Station Specifications.................................................................................................48 7.4 Fukushima Daiichi Simplified System Drawings/Descriptions ................................54 7.5 Organizational Structure and Staffing .......................................................................62 7.6 Operator Training.......................................................................................................63 7.7 Regulatory Structure ..................................................................................................65 7.8 Acronyms and Abbreviations ....................................................................................70

INPO 11-005
ii
8.0 Event Progression and T imeline ......................................................................................71 8.1 Unit 1 .........................................................................................................................71 8.2 Unit 2 .........................................................................................................................81 8.3 Unit 3 .........................................................................................................................91
LIST OF FIGURES Figure 3.3-1 General Elevations and Inundation Level Figure 4.4-1 Unit 4 Standby Gas Treatment System Hydrogen Flow Path Figure 4.4-2 Unit 4 Standby Gas Treatment System Filter Survey Results Figure 5.3-1 Site Dose Rates Figure 5.4-1 Initial Off-Site Survey Results Figure 7.1-1 Preliminary Seismic Data Figure 7.4-1 Isolation Condensers on Unit 1 Figure 7.4-2 High Pressure Coolant Injection (HPCI) Typical Arrangement, Units 1 3 Figure 7.4-3 Reactor Core Isolation Cooling (RCIC) Typical Arrangement, Units 2 and 3 Figure 7.4-4 Overview of Unit 1 Containment Vent System Figure 7.4-5 Overview of Units 2 and 3 Containment Vent System Figure 7.4-6 Simplified Electrical System Figure 7.4-7 Fukushima Daiichi Electrical Distribution Damage Figure 7.4-8: Generic cross-section of a BWR4 with a Mark I containment (similar to
Fukushima Daiichi) Figure 7.6-1 Operator Progression and Training Requirements Figure 7.7-1 Nuclear Emergency Response Organization Relationships LIST OF TABLES Table 3.2-1 Observed and Design Basis Seismic Data Table 4.5-1 Spent Fuel Pool Data Table 7.3-1: Fukushima Daiichi Unit Information (U.S. units) converted from source
document provided in Table 7.3-2 Table 7.3-2: Fukushima Daiichi Unit Information (metric units) Table 7.3-3: Fukushima Daiichi System Information (U.S. units) converted from source
document provided in Table 7.3-4 Table 7.3-4: Fukushima Daiichi System Information (metric units)
INPO 11-005
1
1.0 Introduction This report provides a narrative overview and timeline for the earthquake, tsunami, and subsequent nuclear accident Daiichi Nuclear Power Station on March 11, 2011. The purpose of this report is to provide an accurate, consolidated source of information regarding the sequence of events that occurred in the first days of the accident. The information contained in this report may be used for determining future U.S. and international industry corrective actions. Although INPO describes certain events and actions taken, those descriptions are not intended to reflect any analysis or assessment of the decisions made by any individual or entity. This report does not assess or analyze the effectiveness of plant workers or others involved in response to the event. This report reflects the best available information, most of which was obtained from direct and ongoing interaction with TEPCO. It focuses on the first days of the event for units 1, 2, and 3 and includes some information on units 4, 5, and 6 as well as the spent fuel pools. Because of the extensive damage at the site, some details of the event remain unknown or have not been confirmed. All times are provided as Japan Standard Time (JST). This report includes the following sections:
Executive Summary high-level description of event milestones Overview of Event short description of key event factors Event Progression unit-specific narrative of event progression Radiological Effects radiological information, including radiological releases Additional Information station design information, drawings, and supporting data
This report was created from information provided by TEPCO, the Japanese government, the International Atomic Energy Agency (IAEA), and several Japanese nuclear and safety organizations. Some of the data included logs from the TEPCO Emergency Response Center, unit-specific parameter values and chart recorder indications, and personal accounts of the accident and plant conditions. In some cases, specific questions were addressed through INPO employees working in the INPO Emergency Response Center in Atlanta or in the TEPCO offices in Tokyo. Specific sources used to gather information are provided in the reference section of this report. TEPCO personnel have reviewed the content of this report for accuracy, based on their current understanding of the event. Furthermore, TEPCO assisted in developing the unit-specific timelines, provided in Section 8.0, as well as the design basis information in sections 7.1 and 7.2. TEPCO openly shared information with INPO, responded to questions in a timely manner, and provided resources when available to support the generation of this report.
INPO 11-005
2
The utility is working to share the facts of this event with the industry and with the Japanese public. Without , this report would not have been possible. This report is based on information available to INPO as of November 1, 2011. INPO has verified as much information as possible, but it makes no warranties as to the accuracy or reliability of the information. The information in this report has not been verified through independent or on-site observations. The values provided, such as reactor parameters and seismic intensity, are preliminary and may be revised as more information becomes available. The effects containment conditions may have had on these indications have not been validated. Numerical values that include tenths of a unit are not intended to imply accuracy or precision, but rather are a result of the conversion from metric to U.S. units. This report has been designated as available to the general public. The information contained herein was provided to INPO without the expectation of confidentiality, and the report does not contain INPO proprietary information. INPO members and participants may reproduce this document for business use. This report is copyrighted, and written permission is needed for organizations other than INPO members and participants to reproduce the information. Copies of this report have been provided to TEPCO, the World Association of Nuclear Operators (WANO), and the United States Nuclear Regulatory Commission.
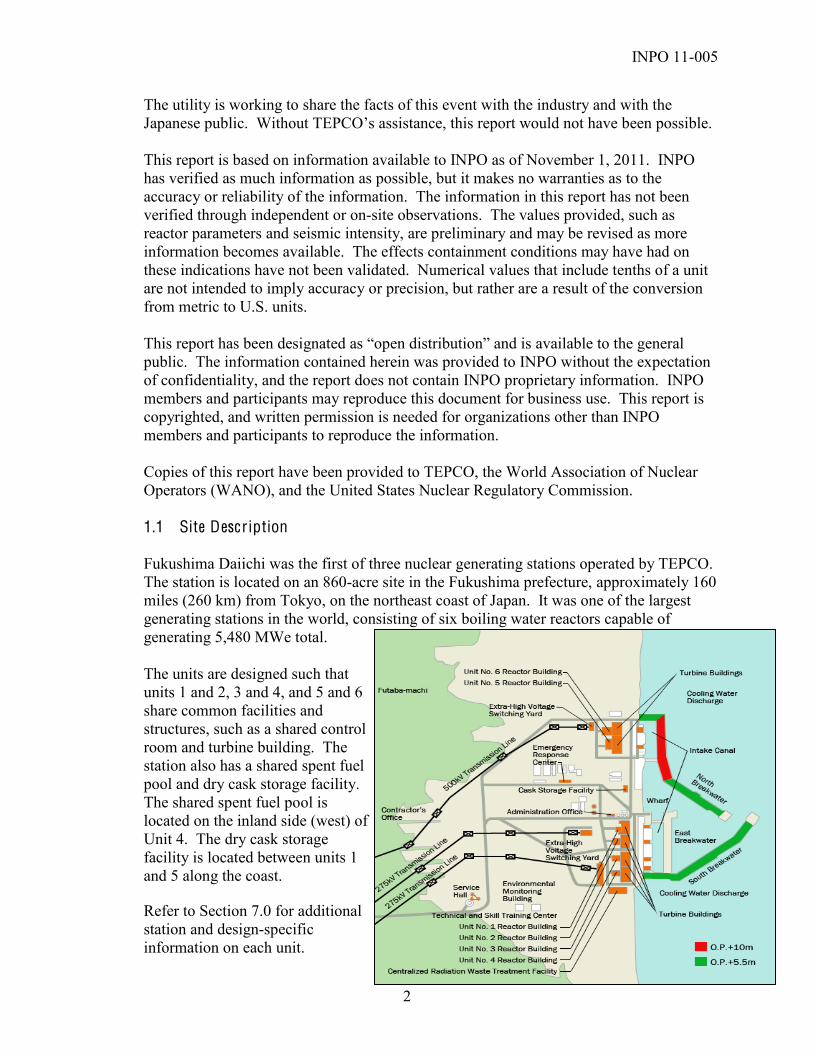
1.1 Site Description Fukushima Daiichi was the first of three nuclear generating stations operated by TEPCO. The station is located on an 860-acre site in the Fukushima prefecture, approximately 160 miles (260 km) from Tokyo, on the northeast coast of Japan. It was one of the largest generating stations in the world, consisting of six boiling water reactors capable of generating 5,480 MWe total. The units are designed such that units 1 and 2, 3 and 4, and 5 and 6 share common facilities and structures, such as a shared control room and turbine building. The station also has a shared spent fuel pool and dry cask storage facility. The shared spent fuel pool is located on the inland side (west) of Unit 4. The dry cask storage facility is located between units 1 and 5 along the coast. Refer to Section 7.0 for additional station and design-specific information on each unit.

INPO 11-005
3
2.0 Executive Summary On March 11, 2011, at 1446 (JST), a severe earthquake measuring 9.0 on the Richter Scale occurred 112 miles (180 km) off the coast of the Fukushima Daiichi Nuclear Power Station. The earthquake was the largest Japan has ever experienced. It caused all of the operating units (units 1, 2, and 3) to automatically scram on seismic reactor protection system trips. The earthquake damaged breakers and distribution towers, causing a loss of all off-site electrical power sources to the site. The emergency diesel generators automatically started and provided AC power to emergency systems. Three minutes after the earthquake, the Japan Meteorological Association issued a major tsunami warning, indicating the potential for a tsunami at least 3 meters high. Station workers were notified of the warning and evacuated to higher ground. Forty-one minutes after the earthquake, at 1527, the first of a series of seven tsunamis arrived at the site. The maximum tsunami height impacting the site was estimated to be 46 to 49 feet (14 to 15 meters). This exceeded the design basis tsunami height of 18.7 feet (5.7 meters) and was above the site grade levels of 32.8 feet (10 meters) at units 1 4. All AC power was lost to units 1 4 by 1541 when a tsunami overwhelmed the site and flooded some of the emergency diesel generators and switchgear rooms. The seawater intake structure was severely damaged and was rendered nonfunctional. All DC power was lost on units 1 and 2, while some DC power from batteries remained available on Unit 3. Four of the five emergency diesel generators on units 5 and 6 were inoperable after the tsunami. One air-cooled emergency diesel generator on Unit 6 continued to function and supplied electrical power to Unit 6, and later to Unit 5, to maintain cooling to the reactor and spent fuel pool. With no core cooling to remove decay heat, core damage may have begun on Unit 1 on the day of the event. Steam-driven injection pumps were used to provide cooling water to the reactors on units 2 and 3, but these pumps eventually stopped working; and all cooling water to the reactors was lost until fire engines were used to restore water injection. As a result of inadequate core cooling, fuel damage also occurred in units 2 and 3. Challenges in venting containments contributed to containment pressures exceeding design pressure, which may have caused containment damage and leakage. Hydrogen generated from the damaged fuel in the reactors accumulated in the reactor buildings either during venting operations or from other leaks and ignited, producing explosions in the Unit 1 and Unit 3 reactor buildings and significantly complicating the response. The hydrogen generated in Unit 3 may have migrated into the Unit 4 reactor building, resulting in a subsequent explosion and damage. The loss of primary and secondary containment integrity resulted in ground-level releases of radioactive material. Following the explosion in Unit 4 and the abnormal indications on Unit 2 on the fourth day of the event, the site superintendent directed that all nonessential personnel temporarily evacuate, leaving approximately 70 people on site to manage the event. During releases, dose rates as high as 1,193 millirem per hour (mrem/hr) (11.93 mSv/hr) were measured at the site boundary, approximately 0.6 miles (1 km) from units 1 4. The
INPO 11-005
4
windows for the emergency response center had to be covered with lead shielding to reduce dose rates in the center. Organized off-site radiation surveys began on March 16. Radiation levels off site at that time ranged from 0.1 mrem/hr (1 µSv/hr) to 20 mrem/hr (200 µSv/hr). Thirty-seven miles (60 km) northwest of the station, the dose rate was 0.8 mrem/hr (8 µSv/hr). Water and soil samples indicated the presence of strontium, iodine, and cesium. Food and water restrictions were implemented in some areas as a result of radioactivity. People within the 12.4 miles (20 km) surrounding the station were evacuated, and those living up to 18.6 miles (30 km) away were directed to shelter inside their homes as the releases of radioactive gases and materials increased as the event progressed and more fuel damage occurred. Potassium iodide tablets and powder were distributed to local governments beginning March 21. Because the evacuations had already been completed, however, the potassium iodide was not issued to the population. Radiation surveys of the on-site areas surrounding units 1 3 showed dose rates as high as 13 rem/hr (0.13 Sv/hr) in areas around units 2 and 3. More detailed surveys performed over the following weeks discovered localized dose rates greater than 1,000 rem/hr (10 Sv/hr) around equipment and debris outside units 1 and 3. Some personnel who responded to the event received high doses of radiation. Two control room operators received the highest doses a calculated internal and external dose of 67.8 rem (0.678 Sv) and 64.3 rem (0.643 Sv). The majority of dose received by these workers was internal (85-87 percent). Potassium iodide was provided to some station personnel on March 13. As of the end of March, approximately 100 workers had received doses of greater than 10 rem (0.1 Sv). The Fukushima event was rated as a level 7 event on the International Nuclear and Radiological Event (INES) scale. The Nuclear Safety Commission of Japan estimated approximately 17 million curies (6.3 E17 Bq) of iodine-131 equivalent radioactive material was released into the air and 0.127 million curies (4.7 E15 Bq) into the sea between March 11 and April 5. The 1986 accident at Unit 4 of the Chernobyl nuclear power plant was the only other nuclear accident to have a level 7 INES rating. According to the IAEA, the Chernobyl accident resulted in approximately 378.4 million curies (14 E18 Bq) of radioactive material being released into the environment.1 The combination of the earthquake and tsunami caused considerable damage to the Japanese coast. According to the g500,000 residential buildings were damaged or destroyed. There was considerable damage to roads, railways, and public and industrial utilities. Approximately 4 million homes lost electricity. The total area inundated by the tsunami was approximately 217 square miles (561 square km). As of October 7, 2011, the Japanese Red Cross reports that almost 16,000 people are confirmed dead, and almost 4,000 remain missing. Approximately 90 percent of the deaths were reported to be caused by drowning.
1 -Economic Impacts. The Chernobyl Forum 2003-2005 Second Revision

INPO 11-005
5
3.0 Overview of Event
3.1 Status of Units Just Before the Earthquake
Unit 1 was in operation at rated power output before the event, with all safety systems and both emergency diesel generators operable. High pressure coolant injection (HPCI) and both isolation condensers were available and in standby. Reactor water level and pressure were normal for power operations. Unit 1 had been in operation since September 27, 2010. Unit 2 was in operation at rated power output before the event, with all safety systems and both emergency diesel generators operable. High pressure coolant injection and reactor core isolation cooling (RCIC) were available and in standby. Reactor water level and pressure were normal for power operations. Unit 2 had been in operation since September 23, 2010. Unit 3 was in operation at rated power output before the event, with all safety systems and both emergency diesel generators operable. Both high pressure coolant injection and RCIC were available and in standby. Reactor water level and pressure were normal for power operations. The startup transformer was out of service for planned modification work. Unit 3 had been in operation since November 18, 2010. Unit 4 was shut down and had been in an outage since November 30, 2010. All the fuel was in the spent fuel pool to facilitate reactor pressure vessel shroud work. The cavity gate was installed, isolating the spent fuel pool from the upper pools. The 4A emergency diesel generator was out of service for planned maintenance, with the 4B emergency diesel generator operable and in standby. Unit 5 had been shut down and in an outage since January 3, 2011. Fuel had been loaded into the reactor and the reactor pressure vessel (RPV) reassembled. Reactor water level was high, reactor coolant system temperature was 192.2°F (89°C), and reactor pressure was 1,037 psig (7.15MPa gauge) to support RPV leak testing. Decay heat removal was secured at 0744 in preparation for the leak testing. Both emergency diesel generators were operable. Unit 6 had been shut down and in an outage since August 14, 2010. Fuel had been loaded into the reactor and the RPV reassembled. Reactor water level was normal, and reactor coolant system temperature was 78.8°F (26°C) with the reactor coolant system depressurized. Residual heat removal (RHR) system B was being used as needed for decay heat removal. All three emergency diesel generators were operable. 3.2 Earthquake On March 11, 2011 at 1446, a 9.0 magnitude earthquake occurred off the eastern coast of Japan. The epicenter of the earthquake was 112 miles (180 km) from the Fukushima Daiichi site and the hypocenter was 15 miles (24 km) under the Pacific Ocean. The
INPO 11-005
6
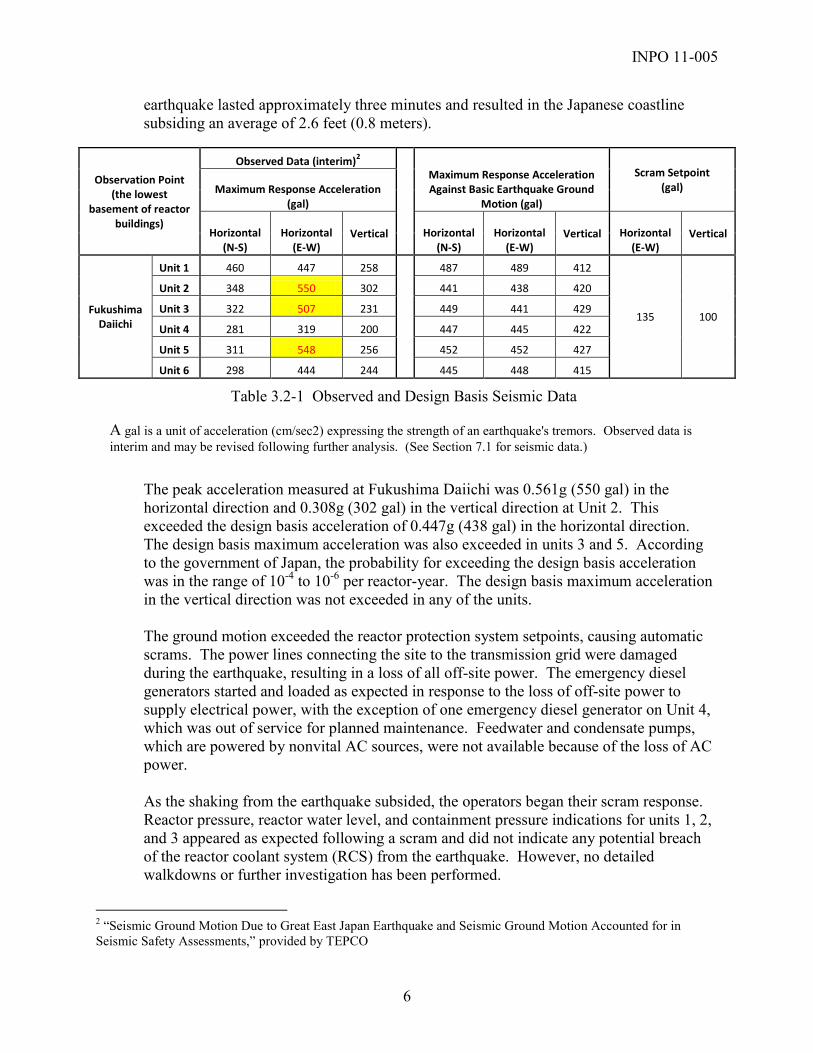
Table 3.2-1 Observed and Design Basis Seismic Data
A gal is a unit of acceleration (cm/sec2) expressing the strength of an earthquake's tremors. Observed data is interim and may be revised following further analysis. (See Section 7.1 for seismic data.)
earthquake lasted approximately three minutes and resulted in the Japanese coastline subsiding an average of 2.6 feet (0.8 meters).
The peak acceleration measured at Fukushima Daiichi was 0.561g (550 gal) in the horizontal direction and 0.308g (302 gal) in the vertical direction at Unit 2. This exceeded the design basis acceleration of 0.447g (438 gal) in the horizontal direction. The design basis maximum acceleration was also exceeded in units 3 and 5. According to the government of Japan, the probability for exceeding the design basis acceleration was in the range of 10-4 to 10-6 per reactor-year. The design basis maximum acceleration in the vertical direction was not exceeded in any of the units. The ground motion exceeded the reactor protection system setpoints, causing automatic scrams. The power lines connecting the site to the transmission grid were damaged during the earthquake, resulting in a loss of all off-site power. The emergency diesel generators started and loaded as expected in response to the loss of off-site power to supply electrical power, with the exception of one emergency diesel generator on Unit 4, which was out of service for planned maintenance. Feedwater and condensate pumps, which are powered by nonvital AC sources, were not available because of the loss of AC power. As the shaking from the earthquake subsided, the operators began their scram response. Reactor pressure, reactor water level, and containment pressure indications for units 1, 2, and 3 appeared as expected following a scram and did not indicate any potential breach of the reactor coolant system (RCS) from the earthquake. However, no detailed walkdowns or further investigation has been performed.
2
Observation Point (the lowest
basement of reactor buildings)
Observed Data (interim)2
Maximum Response Acceleration Against Basic Earthquake Ground
Motion (gal)
Scram Setpoint (gal) Maximum Response Acceleration
(gal)
Horizontal (N-‐S)
Horizontal (E-‐W)
Vertical Horizontal (N-‐S)
Horizontal (E-‐W)
Vertical Horizontal (E-‐W)
Vertical
Fukushima Daiichi
Unit 1 460 447 258
487 489 412
135 100
Unit 2 348 550 302 441 438 420
Unit 3 322 507 231 449 441 429
Unit 4 281 319 200 447 445 422
Unit 5 311 548 256 452 452 427
Unit 6 298 444 244 445 448 415
INPO 11-005
7 Figure 3.3-1 General Elevations and Inundation Level
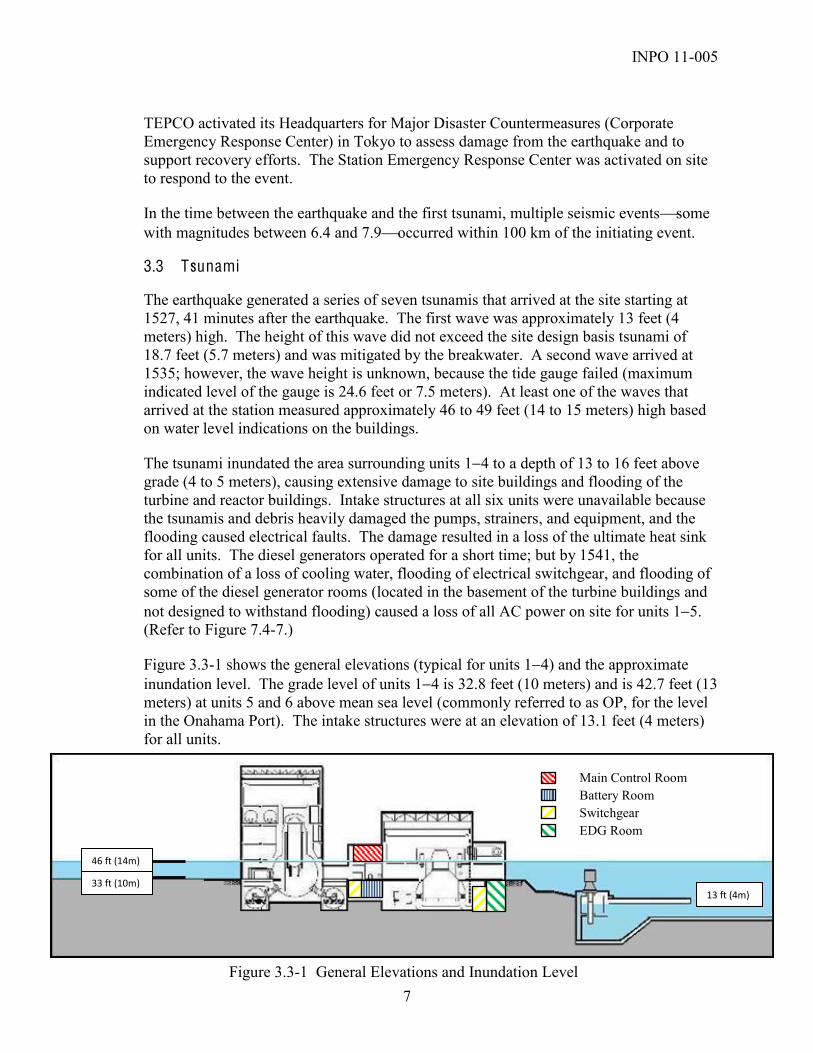
TEPCO activated its Headquarters for Major Disaster Countermeasures (Corporate Emergency Response Center) in Tokyo to assess damage from the earthquake and to support recovery efforts. The Station Emergency Response Center was activated on site to respond to the event. In the time between the earthquake and the first tsunami, multiple seismic events some with magnitudes between 6.4 and 7.9 occurred within 100 km of the initiating event. 3.3 Tsunami The earthquake generated a series of seven tsunamis that arrived at the site starting at 1527, 41 minutes after the earthquake. The first wave was approximately 13 feet (4 meters) high. The height of this wave did not exceed the site design basis tsunami of 18.7 feet (5.7 meters) and was mitigated by the breakwater. A second wave arrived at 1535; however, the wave height is unknown, because the tide gauge failed (maximum indicated level of the gauge is 24.6 feet or 7.5 meters). At least one of the waves that arrived at the station measured approximately 46 to 49 feet (14 to 15 meters) high based on water level indications on the buildings. The tsunami inundated the area surrounding units 1 4 to a depth of 13 to 16 feet above grade (4 to 5 meters), causing extensive damage to site buildings and flooding of the turbine and reactor buildings. Intake structures at all six units were unavailable because the tsunamis and debris heavily damaged the pumps, strainers, and equipment, and the flooding caused electrical faults. The damage resulted in a loss of the ultimate heat sink for all units. The diesel generators operated for a short time; but by 1541, the combination of a loss of cooling water, flooding of electrical switchgear, and flooding of some of the diesel generator rooms (located in the basement of the turbine buildings and not designed to withstand flooding) caused a loss of all AC power on site for units 1 5. (Refer to Figure 7.4-7.) Figure 3.3-1 shows the general elevations (typical for units 1 4) and the approximate inundation level. The grade level of units 1 4 is 32.8 feet (10 meters) and is 42.7 feet (13 meters) at units 5 and 6 above mean sea level (commonly referred to as OP, for the level in the Onahama Port). The intake structures were at an elevation of 13.1 feet (4 meters) for all units.
46 ft (14m)
33 ft (10m) 13 ft (4m)
Main Control Room Battery Room Switchgear EDG Room
INPO 11-005
8
3.4 Loss of Power In the control rooms, as plant equipment and distribution panels flooded, lighting gradually faded and instruments began to fail. Station batteries, which were designed to last for 8 hours, were lost when the flooding grounded or damaged DC distribution systems. The loss of DC power resulted in a loss of all lighting in the units 1-2 control room within 51 minutes after the scram. (Note: Units 1 and 2 share a common control room, as do units 3 and 4.) Normal lighting in the units 3-4 control room was lost, and only emergency lighting remained. Control room operators began checking to see which indications were still available. Three air-cooled emergency diesel generators (EDGs) had previously been installed at the station as a modification (2B, 4B, and 6B EDGs). These EDGs had independent fuel systems and were capable of providing power to vital AC systems following a complete loss of the seawater ultimate heat sink. Furthermore, AC distribution system cross-ties had been installed between units, which allowed power to be transferred among units 1-2 and 3-4 or between units 5-6 for both the 6.9-kV and 480-V distribution systems. The air-cooled EDGs were located above grade, and some of them survived the tsunami. The distribution systems for the Unit 2 and the Unit 4 air-cooled EDGs, which were located below grade, flooded and failed during the tsunami. The Unit 6 air-cooled EDG and portions of the electrical distribution system survived the tsunami and were used to reestablish cold shutdown on units 5 and 6. Figure 7.4-7 illustrates the damage to the electrical distribution system caused by the tsunami. When all AC power was lost, TEPCO personnel notified the government that an emergency condition existed. TEPCO corporate offices and the Japanese government arranged for delivery of portable electric generators to the Daiichi site. The generators were located; however, damaged roads and congested traffic prevented the generators from reaching the site quickly. Helicopters were considered, but the generators were too large and heavy to carry. Ultimately, TEPCO was able to secure some mobile generators from the Tohoku Electric Power Company. These generators, along with some TEPCO generators, began to arrive at the site late in the evening of March 11 and continued to arrive into the next morning. The portable generators were limited in their effectiveness because they could not be connected to the station electrical distribution system as a result of the extensive damage the tsunami and flooding caused. Workers checked motors and switchgear in an attempt to find usable equipment to support cooling the reactors. The testing revealed that the Unit 2 standby liquid control (SLC) pumps were not flooded or damaged. Based on the inspection results, the first mobile generator was placed adjacent to Unit 2, and workers began to lay temporary cables from the generator to the associated distribution panel for the SLC pumps. The temporary power cables were approximately 4 inches (10 cm) in diameter and 656 feet (200 meters) long and weighed more than 1 ton. Forty employees began to run the cables through the debris and flooded areas. The force of the tsunami had blown manhole covers off, resulting in unmarked openings in the ground. Aftershocks and subsequent tsunami warnings further slowed progress. In

INPO 11-005
9
spite of the challenges, the workers completed the task on Unit 2 and terminated the temporary cable to the associated power panel on March 12 at 1530. At 1536, an explosion occurred in the Unit 1 reactor building. This explosion was most likely caused by the buildup of hydrogen that had been generated in the Unit 1 reactor core and leaked into the reactor building. The explosion injured five workers, and debris from the explosion struck and damaged the cables and mobile generator that had been installed to provide power to the standby liquid control pumps. The debris also damaged the hoses that had been staged to inject seawater into Unit 1 and Unit 2. Fieldwork was suspended as workers were evacuated to the Emergency Response Center for accountability. Some of the debris was also highly contaminated, resulting in elevated dose rates and contamination levels around the site. As a result, workers were now required to wear additional protective clothing, and stay times in the field were limited. The explosion significantly altered the response to the event and contributed to complications in stabilizing the units. 3.5 Core Cooling Following the tsunami, Unit 1 lost all AC and DC power, control room lighting, control board instrumentation, and all cooling and high-pressure makeup water to the reactor. Operators had been cycling the A isolation condenser as needed to control reactor pressure and had just removed the condenser from service when the flooding began. Neither HPCI nor the isolation condensers were in service when DC power was lost. Unit 1 had no injection or core cooling in service. While indicated reactor water level did not lower below the top of active fuel until the morning of March 12, calculations based on conservative estimates later revealed that the core may have uncovered as early as three hours after the earthquake, and fuel damage might have commenced approximately 1.5 hours later. TEPCO estimates that there was no injection into the Unit 1 reactor for 14 hours and 9 minutes after the isolation condenser was secured, approximately one hour after the reactor shut down. Conservative calculations indicate that most of the core may have been damaged, and some of the fuel may have relocated to the bottom head of the reactor vessel, although this has not been confirmed. Core cooling was eventually established when reactor pressure lowered sufficiently and a fire engine was used to inject fresh water, followed by seawater. Units 2 and 3 were relatively stable, with RCIC in operation after the tsunami. However, injection was eventually lost on these units, resulting in core damage. TEPCO estimates that there was no injection into the Unit 2 reactor for 6 hours and 29 minutes following the loss of RCIC, approximately 70 hours after shutdown. The core began to uncover at approximately 1630 on March 14, three days after the tsunami. Inadequate core cooling resulted in subsequent fuel damage. Conservative calculations indicate that some of the fuel may have relocated to the bottom head of the reactor vessel, although this has not been confirmed. Core cooling was eventually established when a fire engine was used to inject seawater.
INPO 11-005
10
On Unit 3, following the loss of high pressure coolant injection at 0242 on March 13, approximately 36 hours after shutdown, TEPCO estimates that there was no injection into the reactor for 6 hours and 43 minutes. The core began to uncover at approximately 0400 the second day after the tsunami. Inadequate core cooling resulted in subsequent fuel damage. Conservative calculations indicate that some of the core may have relocated to the bottom head of the reactor vessel, although this has not been confirmed. Core cooling was eventually established when a fire engine was used to inject seawater. Based on the given plant conditions, it is expected that boiling occurred in the reference legs of the reactor water level instruments, resulting in nonconservative water level indications. After the event, TEPCO confirmed that adverse conditions in the drywell may have resulted in boiling of the reference legs, causing indicated water levels to be higher than actual levels for all three units. In each of the three units, it is postulated that there is extensive damage with limited and localized melting of the fuel and internals and limited vessel damage. The lack of core cooling to compensate for decay heat resulted in excessive fuel temperatures and oxidation of the zirconium cladding. The oxidation of zirconium in a steam environment will create significant additional heat from the exothermic reaction and large quantities of hydrogen. This hydrogen contributed to the increases in containment pressure and to the subsequent hydrogen explosions on units 1, 3, and 4. 3.6 Containment Pressure Control During a severe accident, containment pressure must be controlled to prevent damage to the containment and to help remove energy to facilitate injecting water into the reactor with low-pressure systems. Without heat removal systems (no AC power and a loss of ultimate heat sink), containment pressure and temperature will increase as energy from the reactor is transferred to the containment via safety relief valves or systems such as RCIC and HPCI. The TEPCO severe accident procedures provide guidance for venting containment. The guidance directs venting when containment pressure reaches the maximum operating pressure if core damage has not occurred. If core damage has occurred, venting the containment will result in a radioactive release, so containment is not vented until pressure approaches twice the maximum operating pressure. In this case, the Emergency Response Center personnel could not verify the integrity of the core, and the associated guidance was applied in the decision to vent Unit 1. The severe accident procedures specify that the chief of the Emergency Response Center (site superintendent) shall determine if containment venting should be performed. The site superintendent may solicit input and advice from station management when making this decision. Although government permission is not specifically required before containment is vented, government concurrence is desired.
INPO 11-005
11
In the case of Unit 1, the site superintendent informed the government of his intention to vent the containment. Following this, he received concurrence from government agencies to vent containment following a press conference, which was planned for 0300 on March 12. The associated evacuations were reported as complete at 0903, and the operators were directed to vent containment at 0904. A review of the applicable procedures revealed that the accident management guidelines do not specifically require evacuations to be completed before venting. The procedures do, however, require management to be knowledgeable about the status of evacuations and to coordinate venting containment with local authorities. The procedure wording has typically been interpreted as encouraging the operators to verify evacuations are completed before venting. The first indication of increasing containment pressure was not available until 2350 on the night of the event, when workers connected the temporary generator which was being used to provide some control room lighting to the containment pressure instrument. The indication read 87 psi (600 kPa). By this point, access to the reactor building had already been restricted because of high dose rates. The lack of available containment pressure indications early in the event may have prevented the operators from recognizing the increasing pressure trend and taking action earlier in the event. Unit 1 containment was not vented successfully until approximately 1430 on March 12. Additional challenges occurred because of high dose rates and a lack of contingency procedures for operating the vent system without power, as well as the lack of prestaged equipment, such as an engine-driven air compressor. The decision to complete evacuations before venting containment, and the subsequent equipment and radiological challenges encountered as operators attempted to establish a vent path, delayed injection of water into the Unit 1 reactor. At approximately 0230 on March 12, as Unit 1 depressurized, pressure in the reactor and in containment equalized at approximately 122 psia (0.84 MPa abs). This pressure is above the discharge pressure of the station fire pumps and fire engines. Once pressure had equalized, further reductions in reactor pressure were not possible until containment pressure had lowered. As a result, little to no injection was achieved until after the containment was vented successfully, which occurred at approximately 1430 on March 12. High containment pressures in Unit 1 contributed to the amount of time Unit 1 did not have adequate core cooling. In units 1, 2, and 3, the extended duration of high temperature and pressure conditions inside containment may have damaged the drywell head seals, contributing to hydrogen leaks and the subsequent explosions. Containment leakage also contributed to ground-level radiation releases from units 1, 2, and 3. See figures 7.4-4 and 7.4-5 for simplified drawings of the containment vent systems.
INPO 11-005
12
3.7 Spent Fuel Pools and Dry Cask Storage Fukushima Daiichi had spent fuel stored in pools at each unit, in a common spent fuel pool, and in on-site dry cask storage. Spent fuel pool cooling flow was lost for all spent fuel pools following the loss of off-site power and was not immediately restored when the emergency diesel generators started. Unconfirmed reports were that sloshing of the water in the spent fuel pools resulted in a loss of some water during the earthquake. The explosion in the Unit 4 reactor building caused structural damage to the Unit 4 spent fuel pool, but it is not clear if the integrity of the pool liner was compromised. Subsequent analysis and inspections performed by TEPCO personnel determined that the spent fuel pool water levels did not drop below the top of fuel in any spent fuel pool and that no significant fuel damage had occurred. Current investigation results indicate that any potential fuel damage was likely caused by debris from the reactor building explosions. The dry cask storage building was damaged by the tsunami, and some of the casks were wetted. An inspection confirmed that the casks were not damaged by the event. 3.8 Alternative Injection Sources Fukushima Daiichi had three fire engines available that had been added to improve fire-fighting capabilities following the 2007 Niigata-Chuetsu-oki earthquake that had affected the Kashiwazaki-Kariwa nuclear power station. These fire engines could also be used as an alternative low-pressure water source for injecting into the reactors; however, one was damaged by the tsunami and a second could not reach units 1 4 because of earthquake damage to the road. Only one fire engine was immediately available to support the emergency response on units 1 4. This fire engine was blocked from accessing Unit 1 by a fuel oil tank that had been displaced into one road by the tsunami and by the inability of workers to open a deenergized security gate on the other road. Workers broke through a gate between units 2 and 3, allowing the truck to access Unit 1. Although modifications had been made previously to allow fire engines to inject water into the core spray system, establishing injection was still difficult. The fire engine did not have sufficient discharge pressure to overcome the elevation differences and reactor pressure. To compensate for this, the truck loaded water at the fire protection tank, then drove to the Unit 1 reactor building to inject into the fire protection system. This operation was slowed by debris and because the route took the fire engine under a building that had partially collapsed. After some trial and error, workers established continuous injection by routing a suction hose from a fire protection tank to the truck, then discharging to the fire protection system piping and into the reactor via an installed modification to the low pressure coolant injection system. The fire protection tank, however, only had one hose connection. As a result, injection into the reactor had to be stopped each time the tank needed to be refilled so another fire engine, now available, could attach a hose and fill the

INPO 11-005
13
tank. Seawater injection was eventually switched to a flooded pit, then to the harbor itself. 3.9 Working Conditions In the days after the earthquake and tsunami, a group of TEPCO employees, members of the Japan Self-Defense Force, and other volunteers worked to stabilize the damaged reactors. This group worked through extremely adverse conditions to complete their assigned tasks. The workers faced multiple challenges and hazards. The tsunami had caused considerable damage. Large areas of the site were flooded or littered with debris. The force of the tsunami coming ashore had blown manhole covers off, leaving unguarded openings. Without power available, much of the work was performed in complete darkness. Passageways or rooms in some areas of the plant were dark and flooded. Elevated dose rates challenged worker ability to perform tasks in the plant and in the field. For some of the higher dose jobs, such as the attempt to open the suppression chamber vent valve on Unit 1, operators volunteered to perform the task regardless of the potential hazards. Operators worked to restore or maintain cooling to the reactors, sometimes using unconventional or unique methods. Some of the tasks that were accomplished were not based on existing procedure guidance or formal training. The workers were placed in conditions that were beyond the design basis for the station and had to rely on their fundamental knowledge and creativity to recover indications or operate systems. While these efforts were not always successful on the first attempt, workers continued their efforts until the desired results were achieved. Ongoing aftershocks and tsunami warnings further challenged the workers. As expected following a major earthquake, hundreds of aftershocks occurred in the days after the initial event. Two of the aftershocks on March 11 were larger than magnitude 7.0. After the explosion in Unit 1, radiological conditions continued to degrade, and workers were subjected to elevated and continuously changing dose rates and contamination levels. Under the threat of subsequent explosions in other units, they continued their efforts to stabilize the reactors. Because of the tsunami and earthquake damage to the surrounding communities, little outside assistance was initially available. Some workers lost their homes and families to the earthquake and tsunami, yet continued to work. Many workers slept at the station usually on the floor. Because of food shortages, workers were commonly only provided with a biscuit for breakfast and a bowl of noodles for dinner. Some of these workers remain on site today, still working to keep the reactors cool and prevent the spread of contamination. Two operators were killed when they became trapped while performing inspections in the Unit 4 turbine building when the tsunami inundated the site and flooded the building.

INPO 11-005
14
4.0 Unit-Specific Event Narrative 4.1 Unit 1 Narrative On March 11 at 1446 (T=0), an earthquake caused a loss of off-site power and an automatic reactor scram. All control rods inserted; and several actions occurred, including a loss of feedwater and condensate and main steam isolation valve closures, as expected because of the loss of off-site AC power. The emergency diesel generators started and loaded in response to the loss of off-site power and supplied power to the safety systems. While reactor water level initially dropped because of the collapsing steam voids, reactor water level was within the normal band and the operators did not need to initiate high pressure coolant injection (HPCI). Six minutes after the scram (1452), the isolation condensers (ICs) automatically initiated on increasing pressure in the reactor pressure vessel (RPV), resulting in a decrease in reactor pressure as cooler water circulated through the reactor core from the ICs. At 1503 (T plus 17 minutes), operators recognized that Unit 1 was exceeding cooldown rate limitations and manually removed the isolation condensers from service by closing the cold leg return containment outboard isolation motor-operated valves (MO-3A and B) (see Figure 7.4-1). These actions were consistent with procedure limitations of not exceeding a 100oF/hr (55oC/hr) cooldown rate. Operators determined that only one IC was needed to control reactor pressure between 870 and 1,015 psig (6 to 7 MPa gauge). Operators cycled the A IC system by opening and closing the motor-operated valve (MO-3A) to control reactor pressure. Chart recorders indicate that the operators manually started and stopped the IC system three times between 1510 and 1534 as RPV pressure cycled and that the A IC was removed from service at approximately 1534, just minutes before the loss of all AC and DC power. At 1527 (T plus 41 minutes), the first tsunami arrived at the station. The subsequent tsunamis flooded and damaged the intake structure; and by 1537 (T plus 51 minutes), the tsunami had begun to flood the turbine building basement. The flooding wetted or submerged the emergency diesel generators and the AC and DC distribution systems, resulting in a gradual loss of all AC and DC power. Between 1537 and 1550, the loss of power caused a loss of normal control room lighting, indications, and controls. The indications for HPCI and the IC systems faded and went out. TEPCO made an emergency declaration because of the loss of all AC power and notified the government and associated authorities. The isolation condenser was the only system available to cool the reactor; and without DC power, this system needed to be operated locally. The IC also required a source of makeup water to the condenser to continue to function beyond 8 hours. Without power, this makeup water would have to be provided using a diesel-driven fire pump. However, the operators did not immediately place the IC in service. As a result, Unit 1 had no injection or core cooling in service.

INPO 11-005
15
At 1636, another emergency was declared because of the inability to determine reactor water level and the status of injection into the core. Batteries and cables were taken to the control room in an attempt to restore control board instruments, with work focused on restoring reactor water level indication. With no core cooling and extensive damage to the site, workers began to investigate methods for venting containment without power and reviewing methods for injecting water into the reactor using the fire protection system or fire engines. The diesel-driven fire pump was started and allowed to idle in standby, ready to provide injection into the reactor when needed. In complete darkness, operators began to align the alternative water injection valves from the fire protection system to the core spray system by manually opening the valves in the reactor building. Injection could not be achieved, however, until after the RPV was depressurized below 100 psig (0.69 MPa gauge). Instruments and indications periodically appeared to function but would soon lose power and fail again. On one occasion, the valve position indications for the IC MO-2A and MO-3A motor-operated valves began working. The operator noticed that the valves both indicated closed. At 1818, the operator opened both valves using their main control room switches in an attempt to place the isolation condenser in service. While some steam was initially seen coming from the condenser, the steam faded. At 1825, the operator closed the MO-3A valve to remove the system from service. The reason for this action has not been determined. As a result, there was no cooling method aligned to remove decay heat from the reactor. Because the control room had no working indications, operators checked reactor pressure locally in the reactor building. At 2007, reactor pressure indicated 1,000 psig (6.9 MPa gauge). Reactor water level was still unknown. At 2049 (T plus 6.1 hours), workers restored some temporary control room lighting in the units 1-2 control room when a small portable generator was installed. At 2050 (T plus 6.1 hours), the Fukushima prefecture began to direct residents living within 1.2 miles (2km) of the station to evacuate. Water level indication was restored in the control room at 2119 (T plus 6.5 hours). Indicated reactor water level was approximately 8 inches (200 mm) above the top of active fuel (TAF). At 2123 (T plus 6.6 hours), the Prime Minister expanded the evacuation zone to 1.9 miles (3 km), with residents living within a 6.2 mile radius (10 km) directed to take shelter. Operators placed the A IC back in service at about 2130 (T plus 6.7 hours), when once again the indications began to work. By this point, no cooling or injection had been provided to the reactor for almost 6 hours, and core damage was most likely occurring. While steam was observed coming from the condenser vent, it is not clear that the IC went into service as expected. Inspections performed in September 2011 revealed that

INPO 11-005
16
the A IC valves did open but the water level in the secondary side remained at 65 percent, indicating that the system may not have functioned as designed. Dose rates in the reactor building increased to such a level that, by 2151 (T plus 7.1 hours), access to the building was restricted. By 2300 (T plus 8.2 hours), dose rates as high as 120 mrem/hr (1.2 mSv/hr) were detected outside the north reactor building personnel air lock door. Dose rates in the control room also increased. Just after midnight on March 12 (T plus 9.3 hours), the site superintendent directed the operators to prepare to vent the primary containment vessel. In the control room, operators assembled piping and instrumentation drawings, the accident management procedures, valve drawings, and a white board. Because there was no procedure to operate the vent valves without power, the operators began to develop a plan for venting, including how to operate the valves manually. They determined that both the motor-operated containment vent valve (MO-210) and the small suppression chamber air-operated vent valve (AO-90) could be operated manually (see Figure 7.4-4). At 2350 (T plus 9.1 hours), containment pressure indicated 87 psia (0.6MPa abs), exceeding the containment design pressure of 62.1 psig (0.428 MPa gauge). At 0130 (T plus 10.7 hours), TEPCO officials informed the Prime Minister, the Minister of Economy, Trade and Industry, and the Nuclear and Industrial Safety Agency of plans to vent containment. All concurred with the venting of units 1 and 2 containments. The government planned a 0300 press conference to announce the venting. The TEPCO corporate Emergency Response Center instructed the station to vent the containments following the press conference. The operators continued preparations to vent the containments. At 0148 (T plus 11 hours), the installed diesel-driven fire pump that had been running in standby to inject into the reactor stopped operating. To restart the fire pump, workers carried diesel fuel to the pump and refilled the fuel tank, but attempts to start the engine depleted the batteries. Workers then retrieved spare batteries that were stored in an office and attached them, but the engine still would not start. In parallel, efforts to use a station fire engine as an injection source to the reactor were ongoing. The damage from the earthquake and tsunami made this task difficult. The earthquake and tsunami also damaged fire hydrants and caused fire system leaks. While workers were able to close valves and isolate the leaks, the damage made it impossible to use filtered water as a water source. Fire protection tanks remained available for use as a water source. The station had three fire engines, but only one was available to support injecting water into the Unit 1 reactor. One fire engine was damaged by the tsunami and was not functional. The second was parked adjacent to units 5 and 6 but could not be driven to Unit 1 because of earthquake damage to the road and debris from the tsunami. The remaining fire engine, which was located near units 3 and 4, was functional. Workers had to clear obstacles and debris to move the fire engine to Unit 1. A heavy fuel oil tank,

INPO 11-005
17
which had been displaced by the tsunami, made one access road impassable. A security gate that had lost power and would not open blocked another road that provided access to Unit 1. Workers broke a lock on the gate between units 2 and 3, allowing the fire engine to arrive at Unit 1. Alternatives for injecting water via fire protection lines were reviewed, and additional fire engines and water transportation by the Japanese Self-Defense Force were also considered. By 0230 (T plus 11.7 hours), indicated containment pressure had increased to 122 psia (0.84MPa abs), which is approximately twice design pressure. Indicated reactor pressure decreased to 116 psig (0.8 MPa gauge), and reactor water level indicated 19.7 inches (500 mm) above TAF by the lowest indication. At this pressure, the containment had equalized with reactor pressure and was still greater than the discharge pressure of the diesel-driven fire pump lined up to inject water into the reactor. There was no steam flow from the reactor to cool the fuel, and there was no source of injection into the reactor. TEPCO is not sure how the Unit 1 reactor depressurized. Because reactor and containment pressure equalized, it appears the reactor depressurized because of either a stuck-open relief valve or a breach of the reactor coolant system or reactor pressure vessel. The isolation condenser may have helped with the pressure reduction; however, had the isolation condenser caused the depressurization, reactor pressure likely would have continued to decrease until the shell-side boiled dry. Then the reactor coolant system would have repressurized and would not have equalized with containment pressure. At approximately 0300, a press conference was held to announce the venting of the containments. At the station, however, workers were not directed to perform the evolution, and indicated primary containment pressure remained well above the 62.1 psig (0.428 MPa gauge) design pressure. Allowing the containment to be exposed to pressures above design pressure may have caused containment penetrations and seals to degrade and leak, but this has not been verified. Indicated containment pressure began to decrease unexpectedly and stabilized near 113 psia (0.78 MPa abs) without venting. As the morning progressed, plant conditions continued to degrade. In preparation for venting the containment, workers attempted to enter the reactor building to perform surveys. When the reactor building air lock door was opened, the workers saw steam and closed the door. No surveys were performed. The first indications of an off-site release were detected at 0450 (T plus 14.1 hours) when a dose rate of 0.1 mrem/hr (1µSv/hr) was measured at the site boundary. The source of this release has not been confirmed, but the timing correlates with an unexplained slow reduction in containment pressure without venting. By 0500 (T plus 14.2 hours), workers were directed to wear full face masks with charcoal filters and coveralls in both the control room and in the field. Increasing dose rates in the Unit 1 control room caused operators to periodically move to the Unit 2 side of the room where dose rates were

INPO 11-005
18
lower. At 0514 (T plus 14.5 hours), workers noted an increase in radiation dose rates in the plant concurrent with the decrease in containment pressure. Workers believed this may have indicated a leak from the containment. This was reported to the government. Over the next 30 minutes, radiation levels at the site boundary increased. At 0544 (T plus 15 hours), the Prime Minister expanded the evacuation zone to 6.2 miles (10 km). As reactor pressure and containment pressure slowly decreased, a fire engine began injecting fresh water from a fire protection water storage tank into the reactor via the core spray system. Although reactor pressure was not recorded, containment pressure was approximately 107 psia (0.74 MPa abs). The low discharge pressure of the fire pump was only slightly higher than reactor pressure, so the injection flow rate was low. Complications in maintaining the injection lineup further reduced injection rates. Initially, the fire engine refilled with water at the fire protection water storage tank, then drove close to the reactor building and injected water through a fire protection line connected to a core spray line. This was because the fire protection water storage tank was at a low elevation, and the workers were concerned about the discharge pressure of the fire engine being insufficient to overcome reactor pressure and inject into the core. Further complications, such as driving the fire engine under damaged buildings located between the tank and the unit, exacerbated these delays. During these first few hours, the calculated fire engine injection rate was low, averaging less than 10 gpm (38 lpm). After some trial and error, workers established continuous water injection from the fire engine. A hose was run from the suction of the fire engine to the fire protection water storage tank, allowing the fire engine to discharge water directly into the fire protection line system and into the reactor. An additional fire engine arrived on site and was used to repeatedly transport fresh water from the fire protection tank at Unit 3 to the fire protection tank at Unit 1. The Unit 1 fire protection tank had only one hose connection; so to refill the tank, the fire engine that was injecting water into the reactor had to be disconnected from the tank. As a result, water injection into the reactor was stopped each time the second fire engine needed to replenish the Unit 1 fire protection tank. At 0650 (T plus 16.1 hours), the Minister of Economy, Trade and Industry ordered TEPCO to vent the Unit 1 containment. TEPCO personnel, however, had just learned that some residents inside the evacuation zone were not sure which direction to evacuate, so they had not left yet. The Prime Minister arrived at the station at 0711. After some discussion, TEPCO confirmed its plans to vent containment at 0900 after evacuations were completed; and at 0804, the Prime Minister left the station. By this time, indicated reactor water level had dropped below the top of active fuel by the lowest indicated reading. TEPCO informed the local governments that venting would start at approximately 0900. Venting was being coordinated with the local governments in an attempt to ensure evacuations were completed before venting commenced. Station procedures for venting containment did not specifically state that evacuations be completed before venting. The

INPO 11-005
19
procedures stated that venting containment should be coordinated with local governments and that the station should be knowledgeable about the status of evacuations. These statements had been interpreted as providing guidance to verify evacuations were completed before venting. The control room operators formed three teams to perform the venting, with two operators on each team (one to perform actions and the other to assist by holding flashlights and monitoring dose rates, as well as for other safety concerns, such as ongoing aftershocks). Because there were no means of communicating with the field teams, they were dispatched one at a time, with the next team leaving only after the preceding team returned. In preparation for manual venting of the containment, a radiological evaluation of working conditions in the torus room was provided to the Emergency Response Center. Based on radiation levels of 30 rem/hr (300 mSv/hr), workers were limited to 17 minutes stay time to remain below the emergency response radiation exposure limit of 10 rem (100 mSv). Workers were required to wear a self-contained breathing apparatus with a 20-minute air supply and were given potassium iodide tablets. At 0903 (T plus 18.2 hours), evacuations south of the plant were confirmed as being completed, and the first team was dispatched to open the motor-operated containment vent valve (MO-210) (see Figure 7.4-4). The team opened the valve the desired amount. The operators received approximately 2.5 rem (25 mSv) each while performing the task. The team returned to the control room; and by 0930, the second team had been dispatched to open the air-operated suppression chamber vent valve in the torus room (AO-90). To open this valve, the team would have to enter the torus room at one location and travel to the other side of the room to manipulate the valve. The team was unsuccessful, as dose rates in the torus room quickly exceeded their limits; and the operators turned back. One of the operators received 10.6 rem (106 mSv), exceeding his emergency dose limit of 10 rem (100 mSv). The control room operators decided not to dispatch the third team because of the doses received. They notified the Emergency Response Center (ERC) of the inability to open the air-operated vent valve (AO-90). As a result, TEPCO personnel had to devise a new method to open the air-operated valve. The ERC began working on methods to open the large suppression chamber air-operated vent valve (AO-72). This would require DC power and a temporary air source. ERC personnel instructed the control room to attempt to operate the small air-operated suppression chamber vent valve remotely, assuming there would be sufficient residual air pressure in the system to operate the valve. Workers continued their efforts to vent containment, while other groups worked to install mobile generators and stage fire hoses to allow seawater injection into the reactor. Workers continued to inject fresh water using a fire engine. At 1017 (T plus 19.5 hours), workers had installed temporary batteries to provide DC power to the small air-operated suppression chamber vent valve (AO-90). Operators
INPO 11-005
20
attempted to open the valve from the control room, relying on residual air pressure in the instrumentation air system. Operators made three attempts to open the small air-operated valve (at 1017, 1023, and 1024). At 1040 (T plus 19.9 hours), radiation levels increased at the main gate and the monitoring post. Workers initially believed the radiation levels indicated the small air-operated suppression chamber vent valve (AO-90) had opened. However, by 1115 the radiation levels were decreasing and indicated containment pressure remained high, indicating that the venting was not fully effective. While this has not been confirmed, the trend in radiation levels indicates that the small air-operated vent valve may have opened intermittently, and this may have resulted in some of the downstream system pressurizing and gases leaking from the system. However, it is postulated that the valve did not remain open long enough to allow the pressure to blow the rupture disk and vent the containment through the ventilation stack. The ERC was informed that a small air compressor was available in a suoffice. Workers retrieved drawings and took pictures of the connection point and planned how to install the compressor to enable remote operation of the large air-operated suppression chamber vent valve (AO-72) from the control room. The temporary air compressor was located and transferred to the reactor building equipment bay. By 1400 (T plus 23.2 hours), the compressor was installed and started. At 1430 almost 24 hours after the event had begun the rupture disk opened and containment venting commenced. Containment pressure began to decrease, and the injection flow rate of water into the reactor subsequently increased. Calculations, based on the total volume of water injected into the reactor, demonstrate that the injection rate was approximately 50 gpm (189.3 lpm). By 1453, the Unit 1 fire protection tank was running out of water, so the site superintendent directed the injection of seawater into the reactor. Water transfers from other sources continued, while workers staged hoses and prepared to inject seawater into the reactor. Work to install a temporary generator, which would provide power to the Unit 2 standby liquid control and control rod drive pumps, was nearing completion. This power could be cross-tied to the Unit 1 systems, providing injection sources in Unit 1 as well. At the same time, hydrogen generated from the high-temperature interaction of zirconium and steam was being released from the reactor into the containment. Some of these gases found their way into the reactor building through leaks, most probably in the primary containment vessel penetrations because of the excessive pressure. Other potential leak paths included possible damage to the hardened vent or backflow through the unit standby gas treatment system into the reactor building; however, the exact leak path has not been determined. As the gases accumulated in the reactor building, an explosive concentration of hydrogen developed, resulting in an explosion at 1536 on March 12. The explosion breached the reactor building and allowed radioactive materials to be released to the environment; it also damaged temporary power cables, generators, fire engines, and the fire hoses that had been staged to inject seawater. The five workers who were injured by the blast were carried to safety. The remaining workers evacuated to the

INPO 11-005
21
ERC for accountability. Additionally, the debris spread by the explosion was highly radioactive, further complicating the event response. The explosion also damaged the door to the control room, which had been opened to allow workers to install temporary power cables. The open door allowed airborne radioactive material to enter the control room. All injection into the core was lost. Less than an hour after the explosion, radiation dose rates at a station monitoring post along the site boundary had reached 101.5 mrem/hr (1,015 µSv/hr). By 1825, the Prime Minister had expanded the evacuation zone to 12.4 miles (20 km). The operators lined up a fire engine to inject seawater into the reactor through the core spray system and commenced injecting seawater at 1904 on March 12. Boron was then added to the water source to address criticality concerns. This situation continued over the next several days as site personnel attempted to restore electrical power to the unit. Off-site power was restored to Unit 1 on March 20, nine days after the event. 4.2 Unit 2 Narrative On March 11, 2011 at 1446 (T=0), an earthquake caused a loss of off-site power and an automatic reactor scram. All control rods inserted and several actions occurred, including a loss of feedwater and condensate and main steam isolation valve closures, as expected because of the loss of off-site AC power. The emergency diesel generators started and loaded in response to the loss of off-site power and supplied power to the safety systems. Reactor water level initially dropped because of the collapsing steam voids, as expected; and operators initiated reactor core isolation cooling (RCIC) to maintain reactor water level after the scram. One minute later, RCIC automatically shut down because of a high reactor water level. The operators waited approximately 10 minutes for level to lower and then restarted RCIC. Torus cooling and spray were started to cool the suppression chamber pool, removing the heat introduced by the RCIC turbine exhaust. At 1527 (T plus 41 minutes), the first of a series of seven tsunamis generated by the earthquake arrived at the station. One minute later, RCIC again shut down because of a high reactor water level. Operators waited for reactor water level to lower, then restarted RCIC. The subsequent tsunamis flooded and damaged the intake structure; and by 1541 (T plus 55 minutes), the tsunami had begun to cause flooding in the turbine building basement. The flooding wetted or submerged the Unit 2A emergency diesel generator and the AC and DC distribution systems, resulting in a gradual loss of all AC and most DC power. The 2B emergency diesel generator (EDG), which is air-cooled and located away from the ocean in the common spent fuel pool building, did not flood and continued to operate. The electrical switchgear for the 2B EDG, however, is located below grade in the building, was wetted by the tsunami, and subsequently failed. Lighting and indications were lost as AC and DC power systems failed, including all indications for HPCI and

INPO 11-005
22
RCIC. Control room lighting, including emergency lighting, failed completely, leaving the control room dark. TEPCO management made an emergency declaration because of the loss of all AC power and notified the government and associated authorities. The operators were not sure if RCIC was still operating because the indicating lights had gone out. High pressure coolant injection, which requires DC power to operate, became unavailable when flooding inundated the DC distribution system. At 1636, another emergency was declared because of the inability to determine reactor water level and the status of injection into the core. With the possibility of no core cooling and extensive damage to the site, workers began to investigate methods for venting containment without power and reviewing methods for injecting water into the reactor using the fire protection system or fire engines. Batteries and cables were taken to the control room. After confirming the wiring using drawings, workers planned to connect batteries directly to instrument panels in the control room. A top priority was to ascertain the status of water injection into the reactor pressure vessel. Restoration work focused on connecting batteries to the reactor water level indicator, which uses DC power. Workers confirmed the submergence and damage of power panels (high-voltage switchgear) by measuring the insulation resistance. They also confirmed two power centers were not damaged and could be energized. They identified the possibility of high-pressure water injection using the control rod drive system and standby liquid control systems if portable generators could restore power. At 1712 (T plus 2.4 hours), the site superintendent directed workers to investigate methods for injecting water into the reactor using the fire protection system. Emergency Response Center personnel discussed using alternative water injection, which was implemented as an accident management measure. This included the use of fire protection tanks and fire engines, which had been deployed after the Niigata-Chuetsu-oki earthquake in 2007. The operators established an alternative water injection flow path via the residual heat removal system by manually opening valves in the turbine and reactor building to establish an injection path after the reactor pressure decreased to 100 psig (0.69 MPa gauge). This pressure is sufficiently low to allow the fire pump to inject. At 2049 (T plus 6.1 hours), workers restored some temporary control room lighting in the units 1-2 control room when a small portable generator was installed. Critical indications, such as reactor water level and the status of RCIC, remained out of service. Without functional indications, operators reported that reactor water level may lower below the top of active fuel (TAF). TEPCO informed the government that the estimated time for Unit 2 reactor water level to lower to TAF was 2140. Immediately following this report, the Prime Minister expanded the evacuation zone to a 1.9 mile (3 km) radius of the station and directed inhabitants within a 1.9 to 6.2 mile (3 to 10 km) radius to take shelter.

INPO 11-005
23
At 2150 (T plus 7.1 hours), workers restored multiple indications, including reactor water level indication, in the control room. Indicated reactor water level was 134 inches (3,400 mm) above TAF. Both the restoration of indication and the indicated reactor water level were reported to the government. Workers next restored one channel of reactor pressure indication and containment pressure indication. Unit 2 reactor pressure indicated 914 psig (6.3 MPa gauge) and containment pressure indicated 20 psia (0.14 MPa abs) at 2325 (T plus 8.7 hours). Dose rates in the control room (shared with Unit 1) started increasing, most likely as a result of ongoing core damage and releases from Unit 1. Operators continued to work on restoring indications while lining up a fire engine to supply another injection source. Just before midnight, the first of several power supply vehicles (mobile generators) began to arrive on site. The generators were limited in their effectiveness because they could not be connected to the station electrical distribution system as a result of the extensive physical damage caused by the tsunami and flooding. The first mobile generator was placed adjacent to Unit 2, and workers began to lay temporary cables from the generator to the associated distribution panel for the standby liquid control pumps. Operators reviewed drawings to determine if they could open the valves required for venting. Based on their reviews of piping and instrumentation diagrams, accident management procedures, and the venting procedure, operators developed a method for venting containment. They prepared a venting plan and began to review the locations of the vent valves. To confirm the operation of RCIC, operators were sent to locally inspect the system. Wearing breathing protection and boots, workers attempted to verify the condition of RCIC, but field conditions made this very difficult. Work that would normally take approximately 10 minutes required more than one hour to complete. The RCIC room was dark, and the water level in the room came nearly to the top of the worker's boots, so they turned back without getting close enough to check system operation. While the workers could not get close to the system, they could hear faint metallic sounds, which they interpreted as indicating the system was operating. Because of the lack of communication methods, the workers had to return to the control room to report their findings. At about 0200 on March 12, workers made another attempt to verify RCIC operation. On this attempt, the workers discovered that the water level in the RCIC room had increased, and they could not enter the room. They checked reactor pressure and RCIC pump discharge pressure on an instrument rack in the reactor building. The RCIC pump discharge pressure was high, so the workers concluded RCIC was operating. The workers returned to the control room to report that RCIC was in operation on Unit 2. With this information, opening the Unit 1 containment vent valves was made a priority. Operators proceeded with the lineup to vent Unit 1 and, at the same time, monitored parameters on Unit 2.

INPO 11-005
24
By 0500 (T plus 14.2 hours), workers were directed to wear full face masks with charcoal filters and coveralls in both the control room and in the field. Increasing dose rates in the Unit 1 control room caused operators to periodically move to the Unit 2 side of the room. By this point, the level in the condensate storage tank was likely to be low and the suppression chamber level high, so the RCIC water supply switched from the condensate storage tank to the suppression chamber. At 1530 (T plus 24.7 hours), the temporary cable connection between Unit 2 and the power supply vehicle was completed. Operators were only moments away from energizing the Unit 2 standby liquid control system when, at 1536, an explosion occurred in the Unit 1 reactor building. Debris struck and damaged the cable and the power supply vehicle, and the generator stopped. A review of satellite pictures revealed that the explosion also caused a blowout panel in the Unit 2 reactor building to open, which resulted in a loss of secondary containment integrity. Fieldwork was suspended and workers evacuated to the Emergency Response Center (ERC). The next day, workers attempted to start the power supply vehicle; however, the current surge relay actuated and the generator failed. At 1730 (T plus 26.7 hours), the site superintendent ordered preparations to proceed for venting the Unit 2 containment. Injection with RCIC continued and indicated containment pressure remained relatively stable at 29 44 psia (200-300 kPa abs). Concurrent preparations started for lining up to vent both the units 2 and 3 containments. Considering the complications on Unit 1, operators planned to manually open the vent valves while the dose in the field was low, aligning the suppression chamber vent to the rupture disk. The motor-operated containment vent valve (MO-271) was opened at 0810 on March 13 (T plus 41.4 hours). At the time, containment pressure indicated approximately 50.8 psia (0.35 MPa abs). At 0855, indicated containment pressure reached 52.9 psia (0.365 MPa abs), below the design pressure of 55.1 psig (0.38 MPa gauge), then began to lower. The venting lineup was not yet complete. At 1015 (T plus 43.5 hours), the site superintendent directed operators to vent the Unit 2 containment (see Figure 7.4-5). Workers used the small generator in the control room, which had been installed to restore some lighting, to energize the solenoid for the large air-operated suppression chamber vent valve (AO-205). At 1100 (T plus 44.2 hours), the vent lineup was completed but indicated containment pressure was lower than the 62 psig (427 kPa gauge) pressure necessary to open the rupture disk and allow venting, and the rupture disk remained intact. The site superintendent then ordered workers to prepare for seawater injection into the reactor. Reactor water level continued to be maintained by RCIC, but conditions were degrading and operators monitored reactor water level for indications of a RCIC failure. At the direction of the site superintendent, workers began staging hoses and equipment to support injecting into the Unit 2 reactor using fire engines when needed. Plans were made to depressurize the reactor quickly when needed, allowing operators to switch core cooling to seawater via the fire protection system rapidly.

INPO 11-005
25
On March 14 at 1101 (T plus 68.3 hours), a hydrogen explosion occurred in the Unit 3 reactor building. The explosion damaged the temporary power supply used to open the Unit 2 suppression chamber vent valve (AO-205), causing the valve to fail closed. Indicated containment pressure was stable around 66.7 psia (460 kPa abs), just below the rupture disk pressure. Debris damaged the fire engine and hoses that had been staged to inject seawater into the reactor. All field work was stopped and workers evacuated to the ERC for accountability. In the ERC, workers became concerned about the ability to depressurize the reactor to inject water with fire engines. The suppression chamber was saturated, indicating 301oF (149.3oC) and 70.5 psia (486 kPa abs). With the suppression chamber saturated, the safety relief valves (SRVs) may not provide a quick reduction in reactor pressure needed to switch core cooling to the fire protection system. Based on this concern, TEPCO decided to vent Unit 2 containment first to remove energy, then open a safety relief valve (SRV) to reduce reactor pressure and switch from RCIC to seawater injection. Work to prepare fire engines and hoses recommenced at 1305 (T plus 70.3 hours). Because of scattered radioactive debris, workers shifted the seawater source to the shallow draft quay (harbor) instead of the main condenser backwash valve pit of Unit 3. In the high radiation environment surrounded by scattered rubble, workers prepared a new water injection line using available fire engines and hoses. At 1318 (T plus 70.5 hours), reactor water level began to trend downward. By 1325, operators concluded that RCIC had failed and core injection was lost. Attempts to restart RCIC were unsuccessful. At the time of the trip, indicated reactor water level was approximately 95 inches (2,400 mm) above the top of active fuel (TAF) and containment pressure was 67 psia (465 kPa abs). Calculations revealed that reactor water level would reach the top of active fuel at approximately 1630. Workers continued to focus on venting containment, but ongoing aftershocks and evacuations delayed the work. Because of delays in opening the suppression chamber vent valve (AO-205), TEPCO changed the priority from venting containment to depressurizing the reactor. At approximately 1600 (T plus 73.2 hours), an evacuation order was lifted, which allowed field work to recommence; and the site superintendent directed that the efforts to vent containment be performed in parallel with reactor depressurization. Indicated reactor water level had now decreased to 12 inches (300 mm) above TAF. By 1620, workers realized that a temporary air compressor was not providing sufficient air pressure and that the large air-operated suppression chamber vent valve was not opening. At 1630, indicated reactor water level had decreased below the top of active fuel, and operators began work to open an SRV and align seawater injection into the reactor. High radiation levels on site, caused by the radioactive debris from the units 1 and 3 reactor building hydrogen explosions, precluded continuous manning of the fire engines. Workers started a fire engine and lined up injection so water would flow when reactor pressure was low enough. Periodic tours were conducted to check fire engine operation.

INPO 11-005
26
Because of a lack of power, temporary batteries were necessary to open the SRV. Batteries were gathered from cars, carried to the control room, and connected. However, the voltage was insufficient, so additional batteries were scavenged and added. Operators attempted to operate several SRVs without success. With no injection, reactor water level decreased. The lack of core cooling likely resulted in core damage and the generation of hydrogen from the high-temperature interaction of steam and zirconium inside the reactor. Efforts to depressurize the reactor continued to about 1800 (T plus 75.2 hours), when enough batteries had been installed and sufficient power existed to open the SRV. The high suppression chamber temperature resulted in reactor pressure lowering more slowly than desired. Reactor pressure indicated 1,015 psig (6.998 MPa gauge) at 1634 and 881 psig (6.075 MPa gauge) at 1803 and lowering; but the open SRV resulted in additional inventory loss from the reactor, and indicated reactor water level continued to lower. At 1822 (T plus 75.6 hours), indicated reactor water level decreased to 146 inches (3,700 mm) below TAF offscale low, indicating the core may have been completely uncovered. The open SRV resulted in an energy transfer into containment, and hydrogen and radioactive gases escaped from the reactor and accumulated inside containment. However, indicated containment pressure remained relatively constant. It is postulated that some of these gases entered the reactor building from leaks in the containment. The open blowout panel in the reactor building prevented the hydrogen from reaching an explosive level; however, it allowed the subsequent escape of radioactive materials to the environment. Workers had still not been able to establish a containment vent path. TEPCO personnel now suspected that the solenoid on the air supply valve had failed, preventing the large air-operated suppression chamber vent valve from being opened. Workers attempted to open the small air-operated suppression chamber vent valve to vent the containment. Reactor pressure continued to lower slowly; and by 1903 (T plus 76.3 hours), reactor pressure had reached 91 psig (0.63 MPa gauge), below the discharge pressure of the fire engine. The injection of seawater should have commenced; but at 1920, a worker touring the area discovered the fire engine had run out of fuel. Workers added fuel and restarted the engine at 1954, establishing seawater injection into the core. A second fire engine was started and aligned to inject at 1957, but reactor water level remained below the indicating range. At 2100 (T plus 78.2 hours), operators opened the small suppression chamber air-operated vent valve (AO-206), establishing the venting lineup (other than the rupture disk). Indicated containment pressure remained slightly lower than the 62 psig (427 kPa gauge) working pressure of the rupture disk, so venting did not occur. The vent valves remained open, and operators monitored containment pressure.
Between 2037 and 2118, reactor pressure began to increase and exceeded the discharge pressure of the fire engine. At 2120, operators opened a second SRV to increase the rate of reactor depressurization. Forty minutes later (2200), indicated reactor water level

INPO 11-005
27
recovered to 63 inches (1,600 mm) below TAF. However, containment pressure was now increasing. Near the site boundary, dose rates increased to as high as 76 mrem/hr (760 µSv/hr). At 2240, another unexpected increase in reactor pressure occurred. Reactor pressure indications increased from 62 psig (0.428MPa gauge) at 2240 to 264.4 psig (1.823MPa gauge) at 2250. At the same times, indicated reactor water level lowered from 27.6 inches (700 mm) below TAF to 63 inches (1,600 mm) below TAF. The cause of the increase in reactor pressure has not been identified. With reactor pressure above the shutoff head for the fire engines, reactor water level again began to decrease, exposing more of the fuel. At approximately 2330, indicated reactor pressure again began to trend down, but reactor water level indication remained off-scale low. As the reactor depressurized, containment pressure increased, indicating a peak value of 108.8 psia (0.75 MPa abs) at 2344. Operators began to recognize some abnormalities in their indications. Containment pressure was well above the rupture disk pressure but the rupture disk had not failed. Additionally, indicated drywell pressure was trending upward and had increased above 102 psia (0.7 MPa abs), whereas indicated suppression chamber pressure was stable at about 43.5 to 58 psia (300-400 kPa abs), below the rupture disk pressure. The non-unified pressures indicated a problem. As indicated suppression chamber pressure was lower than the working pressure of the rupture disk and indicated drywell pressure increased above the design pressure, the operators decided to open the small air-operated drywell vent valve (AO-208) to vent directly from the drywell to reduce pressure. Two minutes after midnight on March 15, the operators opened the small air-operated drywell vent valve (AO-208). The vent line lineup was complete, except for the rupture disk that remained closed. Containment pressure remained stable at approximately 109 psia (750 kPa abs). The operators rechecked their lineup and found that the small air-operated drywell vent valve had already failed closed. They continued to work toward establishing a containment vent path for Unit 2; but at about 0600 (T plus 87.2 hours), a loud noise was heard in the area around the torus and suppression chamber pressure indication failed low. At approximately the same time, a hydrogen explosion occurred in the Unit 4 reactor building. The loud noise in Unit 2 was widely reported as another explosion, which was accompanied by torus pressure lowering to atmospheric pressure but this was later determined to be incorrect. A review of the seismic instrumentation revealed that, if something did fail in Unit 2, the failure did not generate the same shock wave or force as an explosion. Additionally, the suppression chamber pressure reading 0.0 psia (0.0 MPa abs) is an indication of a failed instrument, not an indication of atmospheric pressure. Indicated drywell pressure remained stable at approximately 106 psia (0.73 MPa abs) and reactor water level indicated 110 inches (2,800 mm) below TAF. The Unit 2 containment was not vented, and the cause for the containment pressure changes has not been determined. Following the explosion in the Unit 4 reactor building, dose rates at the main gate increased to 58.4 mrem/hr (583.7 µSv/hr). All nonessential personnel (approximately

INPO 11-005
28
650 people) were evacuated to Fukushima Daini (approximately 4.3 miles, (7 km) away), leaving 70 people at the station. Shift operators periodically went to the control room to log containment pressure and other critical parameters, but no values were recorded from 0720 until 1125. When containment pressure was checked at 1125, it indicated 22.5 psia (0.155 MPa abs). With no reports of steam being discharged from the Unit 2 vent stack and no changes to the venting lineup, TEPCO suspects the loud noise, instrument failure, and subsequent containment depressurization to be indicative of a potential breach of the containment. As the day continued, the operators lined up a fire engine to inject seawater into the reactor through the core spray system and commenced injecting seawater at 1954 on March 14. Injection was occasionally challenged as reactor pressure varied. Boron was added to the water source to address criticality concerns. This situation continued over the next several days as site personnel attempted to restore electrical power to the unit. Off-site power was restored to Unit 2 on March 20, nine days after the event. 4.3 Unit 3 Narrative On March 11, 2011 at 1446 (T=0), an earthquake caused a loss of off-site power and an automatic reactor scram. All control rods inserted and several actions occurred, including a loss of feedwater and condensate and main steam isolation valve closures, as expected because of the loss of off-site AC power. The emergency diesel generators started and loaded in response to the loss of off-site power and supplied power to the safety systems. After waiting for the shaking from the earthquake to stop, the operators manually tripped the main turbine because of high vibrations and subsequently broke main condenser vacuum to help stop the main turbine. After the scram, reactor water level initially dropped as expected because of the collapsing steam voids. At 1505, operators initiated RCIC to maintain reactor pressure and water level after the scram. Twenty minutes later, RCIC automatically shut down because of a high reactor water level. With reactor water level high in the control band, the operators monitored reactor water level and waited for the level to lower before restarting RCIC. At 1527 (T plus 41 minutes), the first of a series of seven tsunamis, generated by the earthquake, arrived at the station. The second tsunami, which arrived at 1535, flooded and damaged the intake structure. By 1538 (T plus 52 minutes), the tsunami had begun to cause flooding in the turbine building basement. The flooding wetted or submerged the Unit 3A and 3B emergency diesel generators and the electrical distribution systems, resulting in a gradual loss of all AC and most DC power. Lighting and indications were lost as AC and DC power systems failed. Normal control room lighting failed completely, but some DC power remained for emergency lighting and indications. TEPCO management made an emergency declaration because of the loss of all AC power and notified the government and associated authorities. Two field operators were noted

INPO 11-005
29
as missing from the units 3 and 4 operating crew. The operators were later found to have drowned after being trapped in the Unit 4 turbine building basement when the tsunami flooded the building. While the tsunami caused the loss of some DC power systems, including some of the control board instrumentation and controls, the operators had indication of reactor pressure and reactor water level. Both HPCI and RCIC remained available for injection. Operators used safety relief valves as needed to control reactor pressure. At 1603 (T plus 1.3 hours), indicated reactor water level had lowered and RCIC was restarted to restore reactor water level. With RCIC in service, reactor water level was maintained approximately 157 inches (4,000 mm) above TAF by narrow range indication. At 2158, a small portable generator was used to restore lighting in the units 3-4 control room. These conditions were maintained through the evening. The next day (March 12) at 1136, RCIC shut down unexpectedly and could not be restarted. At this time, no water was being injected into the reactor. Operators requested that a fire engine be dispatched to prepare for injecting water into Unit 3, but all fire engines were being used to mitigate the ongoing accident in Unit 1. Requests for off-site fire engines were initially unsuccessful because the roads were impassable. Primary containment pressure indication slowly increased, peaking at 57 psia (0.39 MPa abs), below the design pressure of 55 psig (0.38 MPa gauge). At 1235 (T plus 21.8 hours ), an hour after RCIC tripped, HPCI automatically started on a low-low reactor water level signal and began to restore reactor water level. Operators throttled open full-flow test valves to return some of the HPCI flow to the suppression chamber, possibly in an attempt to prevent a high-level trip. By 1635, indicated reactor water level had recovered to 15.7 inches (400 mm) by wide range indication, or approximately 180 inches (4,570 mm) above TAF. The HPCI system was drawing a considerable amount of steam off the reactor, and reactor pressure had begun to decrease significantly. At 1700 (T plus 26.2 hours), reactor pressure indicated 421 psig (2.9 MPa gauge) and lowering. The site superintendent ordered preparations to proceed for venting the containment. Knowing that venting would be required eventually, operators commenced preparations for lining up to vent the Unit 2 and Unit 3 containments. Operators planned to manually open the vent valves while the dose rates in the reactor building were currently low. As the evening continued, station batteries depleted, and DC-powered instruments began to degrade and fail. At 2027, the accident management indications for drywell pressure, suppression chamber pressure, and suppression chamber water level failed. Nine minutes later, at 2036, reactor water level indication was lost. The last indicated reactor water level before the failure was 53 inches (1,350 mm) by wide range instrument (217 inches or 5,520 mm above TAF) , but only 16 inches (400 mm) above TAF by fuel zone instruments.

INPO 11-005
30
After 2100 (T plus 30.2 hours), operators started a review of the vent procedures to identify the sequence and location of vent valves, which were written on a whiteboard. Emergency response workers reviewed the vent procedure for Unit 1. Based on the review and the accident management procedure for Unit 3, they developed a plan to manually vent Unit 3 and provided the plan to the control room operators. At 0242 on March 13 (T plus 35.9 hours), the HPCI system tripped. At the time of the trip, DC power was failing and reactor pressure was low, indicating approximately 84 psig (0.58 MPa gauge). Operators attempted to restart HPCI but were unsuccessful because the batteries were exhausted. Operators were unable to restart RCIC locally. They next attempted water injection by diesel-driven fire pump, but reactor pressure was too high. With HPCI isolated and with no safety relief valves (SRVs) available because of the loss of DC, reactor pressure quickly increased well above the discharge pressure of the fire pump, preventing water injection. Injection into the reactor was lost, and at approximately 0415 on March 13 the reactor core started to uncover. As the core uncovered, core damage commenced, and the high-temperature interaction of steam and zirconium began, generating large amounts of hydrogen in the reactor. The operators understood they needed to depressurize the reactor but had no method of opening an SRV. All of the available batteries had already been used, so workers were sent to scavenge batteries from cars and bring them to the control room in an attempt to open an SRV. At 0450 (T plus 38.1 hours), workers attempted to open the large air-operated suppression chamber containment vent valve (AO-205). To open the valve, workers used the small generator to provide power to the valve solenoid. An operator checked the valve indication locally in the torus room, but the valve indicated closed. The torus room was very hot because of the previous use of RCIC, HPCI, and SRVs; and the room was completely dark, which made a difficult working environment. By 0500, reactor pressure had exceeded 1,070 psig (7.38 MPa gauge), reactor water level indicated 79 inches (2,000 mm) below TAF and lowering, and containment pressure indicated 52.2 psia (0.36 MPa abs). At 0515 (T plus 38.5 hours), the site superintendent instructed operators to complete the lineup for venting the containment (see Figure 7.4-5). The operators energized the solenoid for the large air-operated suppression chamber vent valve (AO-205), but the vent valve remained closed. Operators determined that there was insufficient air pressure to operate that valve. The operators replaced the temporary air bottle, and the valve opened. The motor-operated vent valve, however, had not yet been opened, so the vent lineup was not complete. With no ability to inject into the reactor, and containment pressure indicating 66.7 psia (0.46 MPa abs) and increasing, operators aligned a fire engine to the containment spray system in an attempt to reduce containment pressure. Containment pressure, however,
INPO 11-005
31
continued to increase. While not confirmed, the high containment temperature and pressure may have caused the drywell head seal and containment penetrations to degrade and begin to leak. By 0735 (T plus 40.8 hours), indicated reactor water level had lowered to the bottom of the fuel zone indication, indicating the core may have been completely uncovered. At 0835 (T plus 41.8 hours), operators opened the motor-operated containment vent valve. At 0841, they opened the large air-operated suppression chamber vent valve, completing the vent lineup except for the rupture disk. A short time later, steam was observed discharging from the vent stack and dose rates at the site boundary increased to 88.2 mrem/hr (882 µSv/h). The containment vent rupture disk had opened, and pressure began to decrease. The maximum indicated containment pressure was 92.4 psia (0.637 MPa abs) at 0910. At approximately the same time, workers had scavenged enough batteries to power the SRVs, and the operators opened an SRV to depressurize the reactor. By 0925, reactor pressure had decreased sufficiently to start borated fresh water injection. Reactor water level recovered and increased above the top of active fuel. By 1030 (T plus 43.7 hours), knowing that the site was low on fresh water, the site superintendent ordered workers to be ready to commence injection using seawater. Workers staged equipment in preparation for a quick transition to seawater injection. They looked for seawater sources, including accumulated water in the basement of the Unit 4 turbine building. Workers broke through the truck bay doors and attempted to move a fire engine into place, but this plan was unsuccessful. They also considered taking water from the discharge channel of Unit 4 or the training center pool, but this also did not work. Workers elected to use a Unit 3 circulating water reversing valve pit, which had been flooded by the tsunami, as the water source for the fire engines. A short time later, at 1117, the air-operated suppression chamber vent valve (AO-205) was found closed. The air cylinder being used to provide air was depleted because of leakage. The workers attempted to lock open the valve locally, but they were not successful because of the adverse conditions in the torus room. The room was dark and hot, and the torus was shaking because of the open SRV. Workers eventually replaced the air bottle, and the air-operated valve was reopened. Similar problems challenged the containment vent lineup over the next few days. An engine-driven air compressor was later installed to resolve these issues. The fresh water supply was depleted at 1220 (T plus 45.6 hours), and injection into the reactor stopped. Workers had prepared to make a swift change to seawater injection, but an aftershock and subsequent evacuation order occurred while the work was being carried out, so the swap was delayed. By 1300, indicated reactor pressure had decreased to 28 psig (0.19 MPa gauge), and reactor water level indicated approximately 79 inches (2,000 mm) below TAF by the lowest indication.

INPO 11-005
32
Seawater injection was established at 1312. However, indicated reactor water level remained below the top of active fuel. The dose rates measured at the air lock to Unit 3 increased to 30 rem/hr (300 mSv/hr). By 1530, indicated reactor water level was 74.8 inches (1,900 mm) below TAF. Dose rates in the Unit 3 side of the control room reached 1.2 rem/hr (12 mSv/hr), and operators moved to the Unit 4 side of the room in an attempt to minimize their exposure. At 0110 on March 14 (T plus 58.4 hours), injection was stopped when the water level in the reversing valve pit became low. Workers began refilling the pit using other fire engines. Reactor water level indicated 88.6 inches (2,250 mm) below TAF. At 0200 (T plus 59.2 hours), operators noticed that containment pressure was trending upward, indicating at 38.4 psia (0.265 MPa abs) and increasing. Because of ongoing problems with the large air-operated suppression chamber vent valve (AO-205), workers decided to open the small air-operated suppression chamber vent valve (AO-206). Containment pressure continued to increase. The workers could not maintain the valve open because of a loss of air pressure and a loss of DC power to the solenoid. To restore injection into the reactor, workers moved the fire engine around, allowing the suction hose to drop deeper into the valve pit. At 0320 (T plus 60.6 hours), seawater injection into the reactor was restored. The injection rate was not sufficient, and indicated reactor water level continued to lower. By 0430, reactor water level was below the indicating range of the fuel zone instrument, indicating the core may have been completely uncovered. Additional fire engines, which had been requested previously, began to arrive around sunrise. The fire engines were delayed because the drivers needed to be changed to station workers off site because of the contamination and radiation levels at the site. Workers began using two fire engines that had arrived from off site to pump seawater from the shallow-draft quay (harbor) into the reversing valve pit. At 1053 (T plus 68.1 hours), seven 5-ton Self-Defense Force water supply vehicles arrived and began to refill the reversing valve pit. However, continued problems with the containment vent lineup had resulted in indicated containment pressure increasing and stabilizing at approximately 75.4 psia (0.52 MPa abs). A large hydrogen explosion occurred in the Unit 3 reactor building at 1101 on March 14. The explosion destroyed the secondary containment and injured 11 workers. The large amount of flying debris from the explosion damaged multiple portable generators and the temporary power supply cables. Damage to the fire engines and hoses from the debris resulted in a loss of seawater injection. Debris on the ground near the unit was extremely radioactive, preventing further use of the main condenser backwash valve pit as a source of water. With the exception of the control room operators, all work stopped and workers evacuated to the Emergency Response Center for accountability.

INPO 11-005
33
An undamaged fire engine was moved to the shallow-draft quay, and at 1630 a new injection lineup was completed. Fire engines and hoses were rearranged to inject seawater directly from the quay into both units 2 and 3 reactors. This situation continued over the next several days as site personnel attempted to restore electrical power to the unit. Off-site power was restored to Unit 3 on March 22, 11 days after the event. 4.4 Unit 4 Narrative Unit 4 was shut down and had been in a refueling outage since November 30, 2010. All of the fuel had been removed from the reactor and placed in the spent fuel pool to facilitate shroud work. The reactor was disassembled with the head off at the time of the earthquake. The cavity gates were installed, isolating the spent fuel pool from the upper pools. Spent fuel pool temperature was approximately 80.6oF (27oC). Following the earthquake and tsunami, the operators in the units 3-4 control room focused the majority of their efforts on stabilizing Unit 3. Because of the low decay heat load in the Unit 4 spent fuel pool, operators may not have been immediately concerned with taking action to fill or cool the spent fuel pool. On March 15, however, a hydrogen explosion occurred in the Unit 4 reactor building. This was unexpected, as workers did not believe there was enough decay heat in the pool to result in overheating and the subsequent high-temperature interaction of zirconium and water to produce hydrogen gas. After the explosion, however, some people suspected that the spent fuel was overheating, and they became concerned about subsequent hydrogen explosions caused by the fuel in the spent fuel pools on other units. Some resources may have been diverted from attempts to stabilize the reactors, as extensive actions such as helicopter water drops and the use of water cannons were taken in an attempt to refill the pools. Subsequent analysis and inspections determined that the water level in the Unit 4 spent fuel pool never dropped below the top of fuel and that no significant fuel damage had occurred. There are various theories regarding the cause of the hydrogen explosion in Unit 4. Hydrogen water chemistry was used at Fukushima Daiichi, and hydrogen was also used to cool the main generators. Both of these sources of hydrogen were reviewed, and it appears that neither source caused the Unit 4 explosion. The most widely accepted theory is associated with the backflow of gases from Unit 3 during venting. The containment vent exhaust piping from Unit 3 is connected to the Unit 4 exhaust piping. The dampers on the Unit 4 standby gas treatment system (SGTS) are air-operated and fail open on a loss of power or air (except the cross-connect between SGTS filter trains). Additionally, the system does not have a backflow damper installed in the piping that connects to Unit 3. With no power or air, and no fans in service to direct the gases from Unit 3 up the exhaust stack, the exhaust gases from Unit 3 would be directly aligned to the Unit 4 SGTS filters. This piping arrangement may have allowed

INPO 11-005
34
gases from the Unit 3 containment to be vented to the Unit 4 reactor building via reverse flow through the Unit 4 standby gas treatment system.
Figure 4.4-1 Unit 4 Standby Gas Treatment System Hydrogen Flow Path To confirm this theory, on August 25 TEPCO personnel performed radiation surveys on the Unit 4 SGTS filters. The survey results, shown in Figure 4.4-2, revealed higher radiation levels at the locations closer to Unit 3. These survey results support the conclusion that there was backflow from Unit 3 to Unit 4. Further inspections are needed to confirm this theory; but based on this information, it is postulated that the hydrogen explosion in the Unit 4 reactor building was caused by hydrogen from Unit 3.

INPO 11-005
35
Figure 4.4-2 Unit 4 Standby Gas Treatment System Filter Survey Results
4.5 Spent Fuel Pools and Dry Cask Storage
Unit 1 2 3 4 5 6
Number of fuel assemblies
In the reactor 400 548 548 0 548 764
Spent fuel assemblies in the spent fuel pool 292 587 514 1,331 946 876
New fuel assemblies in the spent fuel pool
100 28 52 204 48 64
Water volume (ft3) 36,021 50,323 50,323 50,323 50,323 52,866 Table 4.5-1 Spent Fuel Pool Data
Background As shown, the spent fuel pools (SFPs) for units 1 4 contained different amounts of spent fuel at the time of the event, generating different heat loads. The Unit 4 SFP had the greatest heat load because the entire core had been offloaded into the SFP to support ongoing outage work. Approximately 60 percent of the spent fuel on site is stored in a separate building in a common spent fuel pool. This pool contained 6,375 fuel assemblies (about 80 percent of pool capacity), but the heat load was very low because the assemblies were stored in their respective units SFPs for 19 months or longer before being set in the common pool. Calculations determined that cooling can be lost to this pool for 30 days before it

INPO 11-005
36
becomes a concern. The common spent fuel pool uses fans and air for cooling, so cooling is maintained if the seawater ultimate heat sink is lost; however, AC power is required to power the fan motors and circulating pumps. Dry cask storage is also used for spent fuel. At the time of the event, the station had nine casks containing 408 spent fuel assemblies. There are no mixed-oxide fuel assemblies in any of the spent fuel pools or in the dry cask storage facility. Event Progression Spent fuel pool cooling flow was lost for all pools because of the loss of off-site power and was not restored after the emergency diesel generators started. The existing water inventory in the spent fuel pools provided sufficient cooling to remove decay heat, as long as the fuel remained covered. Unconfirmed reports were that sloshing of the water in the SFPs during the earthquake resulted in a loss of some inventory; however, this has not been verified. After the tsunami impacted the site, operators were able to use the 6B emergency diesel generator (EDG) to provide power to cooling systems for the Unit 6 spent fuel pool. After installing temporary cables, the 6B EDG provided power to Unit 5 spent fuel pool cooling. Hydrogen explosions in the units 1, 3, and 4 reactor buildings, coupled with the loss of the blowout panel in Unit 2, resulted in the SFPs of all units being exposed to atmosphere. The explosions may have also caused additional inventory to be lost from the pools. After the explosion on Unit 4, a concern arose that the SFP may have boiled dry and resulted in fuel damage and hydrogen generation. In response to this concern, station personnel took numerous actions to ensure the spent fuel had sufficient cooling. Fire engines from the surrounding area, including water cannons from the Japan Self-Defense Force, were brought to the site to spray water into the SFPs to keep the fuel assemblies covered. The water cannons could only reach the floor surrounding the SFP, so little water got into the pool. On March 17, helicopters attempted to drop large loads of water into the SFPs. Because of high radiation levels, the helicopters needed to maintain a high altitude; and that, coupled with the prevailing winds, resulted in this effort not being successful. Concrete pumping trucks were flown to Japan for use in pumping water into the SFPs. These trucks, which have long, articulated booms normally used for transferring concrete, were lined up to pump water into the spent fuel pools on March 18. This operation was successful; however, the trucks did not start refilling the SFPs until several days after the event began. The delay in refilling the SFPs may have contributed to increased radiation levels in the area around the spent fuel pools because less shielding was provided with the reduced water level. The exact impact, however, was not known because radiation levels were not monitored as the pools were refilled.

INPO 11-005
37
Subsequent analyses and inspections determined that the spent fuel pool water levels never dropped below the top of fuel in any spent fuel pool and that no significant fuel damage had occurred. Current investigation results indicate that any potential fuel damage may have been caused by debris from the reactor building explosions. An inspection of the dry cask storage facility revealed that, while the building was damaged by the tsunami, the dry storage casks do not appear to be damaged. The casks were wetted by the tsunami, but they were not moved from their storage locations by the force of the waves or debris. The fuel stored inside the dry casks has not yet been inspected.

INPO 11-005
38
5.0 Radiological Overview Capabilities for monitoring radiological conditions effectively both on site and off site were severely hampered by the effects of the earthquakes and tsunamis. The earthquake did not damage on-site monitoring systems, but few remained following the tsunamis. For example, most electronic personnel dosimeters, computer systems for activating and recording dose from these devices, installed contamination monitors, and many portable survey instruments were lost to the flooding. Installed radiation monitors essential for monitoring core, containment, and spent fuel pool conditions were lost when the tsunamis wetted the electrical distribution equipment. In addition, radiological effluent, environmental, and meteorological monitors were lost. During the event, Fukushima Prefecture officials directed several evacuations. Evacuees were screened for contamination upon reporting to shelters. The screening criterion for evacuees reporting to shelters was originally 100,000 counts per minute (cpm). The screening criterion was revised on March 20 to 0.1 mrem/hr at 4 inches (10 cm) to align with IAEA standards. Between March and June, 195,354 people were screened, with 102 persons being decontaminated below the limits. Following the event, Japanese government officials estimated the amount of radioactivity discharged into the air between March 11 and April 5 was equivalent to 1.7 E7 curies (6.3 E17 Bq). On April 2, very high concentrations of radioactivity were identified in the harbor of the station. The source was water accumulating in the turbine building, flowing through a trench, and leaking into the harbor. The magnitude of this release was estimated at 1.3 E5 curies (4.81 E15 Bq). This source was stopped after a couple of days. The ocean around the plant was sampled daily following this discovery, and the maximum concentration in late July was approximately 1 E3 pCi/l (3.7 E1 Bq/l) of cesium-137. 5.1 On-Site Capabilities The loss of personnel monitoring capabilities resulted in the need for initial emergency responders to share dosimeters, with only one worker on a team wearing dosimetry for many missions. The limited number of electronic dosimeters made measuring worker dose difficult because individual passive dosimeters, such as thermoluminescent dosimeters, are normally not worn at the station. With no process radiation monitoring indications available, operators were not aware of changes in radiological conditions until personnel in the field noted them. For example, when returning the Unit 1 isolation condenser to service at 2130 on March 11, dose rates in the reactor building increased more than expected. This is an indication that fuel damage may have already begun and likely created the first radiological release to the environment. However, operators were not aware of this condition until workers in the plant reported increases in their dose and elevated dose rates were measured outside the reactor building personnel air lock. Later on March 12, operators were unsure if attempts

INPO 11-005
39
to vent Unit 1 were successful because the radiological monitor on the plant vent stack was inoperable. The loss of installed radiological monitoring equipment and meteorological instrumentation also contributed to TEPCO and off-site agencies relying on postulated core damage scenarios to perform off-site dose projections. 5.2 Site Boundary and Off-Site Capabilities Radiological monitors installed off site and at the site boundary (approximately 0.62 miles (1 km) from the plant) were also lost from either the widespread loss of power that resulted from the earthquake or from the tsunamis. Twenty-three of 24 off-site monitoring posts, the off-site central monitoring facility, and all 8 site boundary monitoring posts were out of service. Additionally, local government personnel who were responsible for collecting off-site radiological data either could not be located following the earthquake and tsunami or were supporting other disaster duties. This resulted in no organized off-site radiological monitoring until March 16, when Ministry of Education, Culture, Sports, Science and Technology personnel, the ministry responsible for environmental radiation monitoring, assumed this responsibility. To compensate for the loss of installed monitors at the site boundary, station personnel had a vehicle equipped with radiological and meteorological instruments. Monitoring began at the site boundary on the inland side of the plant at 1700 on March 11. This monitoring was normally limited to a single location. Although valuable data was obtained, air samples were not taken; and, as the event progressed, the data was often not collected in close proximity to the plume. 5.3 On-Site Dose Rates and Protective M easures After off-site evacuations had been reported as complete at 0903 on March 12, operators entered the Unit 1 reactor building in an attempt to vent containment. The reactor building had elevated dose rates and a steam-filled environment. The operators wore fire-fighting turnout gear and self-contained breathing apparatus and were provided with electronic dosimeters set to alarm at 10,000 mrem (100 mSv) and potassium iodide for thyroid protection. The first team opened a valve on the second floor of the reactor building, but elevated dose rates in the torus room required the second team to turn back before completing its mission. One of the operators received a dose of 10,630 mrem (106.30 mSv) while in the torus room. This was reported to the authorities as an overexposure because it was above the 10,000 mrem emergency exposure limit. The explosion on Unit 1 at 1536 on March 12 spread highly radioactive debris around the site. The door to the units 1-2 control room, which had been opened to allow workers to run temporary power cables, was damaged by the explosion, allowing radioactive material into the control room. The elevated dose rates and high levels of surface and airborne radioactivity around the site hampered efforts to stabilize units 2 and 3 and resulted in substantial dose to site workers. Operators in the units 3-4 control room were

INPO 11-005
40
directed to wear charcoal respirators after the Unit 1 explosion. However, to continuously staff their posts, they needed to remove their respiratory protection on occasion, such as to eat. In addition, a few of the operators wore conventional eyeglasses (spectacles kits were not a requirement), which prevented their respirators from sealing properly. As a result, two operators in the units 3-4 control room received doses in excess of the initial 10,000 mrem (100 mSv) and later 25,000 mrem (250 mSv) emergency dose limit. One received 67,808 mrem (678.08 mSv), of which 59,000 mrem (590 mSv) was internal. The other received 64,307 mrem (643.07 mSv), with a total internal dose of 54,000 mrem (540 mSv). On March 13 at 1300, pressure in the Unit 3 drywell and torus began to decrease rapidly, indicating a release from the containment. On-site dose rates as high as 30,000 mrem/hr (300 mSv/hr) were measured outside the Unit 3 personnel air lock. Operators in the units 3-4 control room had to move to the Unit 4 side because dose rates on the Unit 3 side reached 1,200 mrem/hr (12 mSv/hr). The TEPCO medical chief directed site personnel under 40 years of age to take potassium iodide, while older workers were given the option. On March 14, at 0700, Unit 3 containment was vented. Indication on a Unit 3 drywell radiation monitor had been recovered briefly just before the venting, and a dose rate of 16,700 rem/hr (167 Sv/hr) was recorded. The Unit 3 explosion severely impacted work within the plant. Debris on the ground had dose rates exceeding 1,000 rem/hr (10 Sv/hr), and workers establishing water injection for Unit 2 could no longer continuously monitor fire engines because of the elevated dose rates. On March 15, elevated dose rates around the site led TEPCO officials to evacuate nonessential personnel at the site to Fukushima Daini. Seventy workers remained on site and 650 evacuated to Fukushima Daini. The high surface and airborne contamination levels around the site also resulted in the Emergency Response Center becoming contaminated early in the accident. The buildup of contamination was not recognized until radiological surveys in the building were first performed on March 24. As a result, controls were not in place to prevent uptakes, and some workers received substantial internal doses. For example, a female worker in the building exceeded the 500 mrem (5 mSv) quarterly dose limit when she was determined to have received 1,350 mrem (13.50 mSv) of internal dose. On March 22 and 23, surveys of the airborne radioactivity and dose rates around the site began to be collected and documented. The dose rates are documented on Figure 5.3-1. Localized dose rates as high as 1,000 rem/hr (10 Sv/hr) were later discovered.

INPO 11-005
41
Figure 5.3-1 Site Dose Rates
Dose rates inside the reactor and turbine buildings were taken in April and May. Dose rates 3.3 feet (1 m) above water that had accumulated in the turbine buildings ranged from 0.3 rem/hr (0.003 Sv/hr) in Unit 4 to 100 rem/hr (1 Sv/hr) in Unit 2. The general area dose rates in the reactor buildings ranged from slightly below 1 rem/hr (0.01 Sv/hr) to approximately 43 rem/hr (0.43 Sv/hr) in Unit 2. A localized area around a steam leak on Unit 1 had dose rates as high as 400 rem/hr (4 Sv/hr). Air samples collected in the reactor buildings measured iodine-131 concentrations equivalent to as high as 3 rem/hr (0.03 Sv/hr) of thyroid dose if breathed by an unprotected worker. Although high concentrations of strontium isotopes, a strong beta emitter, have been discovered off site, measurements of beta dose rates have not been documented in available plant surveys. As a result of the high beta contamination levels, two workers received beta burns when they stepped in turbine building water. 5.4 Site Boundary and Off-Site Dose Rates and Protective Measures Evacuations in the area surrounding the plant were first ordered at 2050 on March 11 for the people living within 1.2 miles (2 km) of the site. The evacuation was extended to a 1.9 mile (3 km) radius at 2123, and those within 6.2 mile (10 km) were directed to shelter within their homes. The first increase in dose rates at the site boundary was detected at 0404 on March 12. Dose rates near the main gate increased from the normal background of 0.007 mrem/hr (0.07 Sv/hr) to 0.1 mrem/hr (1.0 Sv/hr). This data, along with a decrease in drywell pressure, prompted Unit 1 control room personnel to conclude that a release had occurred. At 0544, the Prime Minister extended the evacuation radius to 6.2 miles (10 km), and a TEPCO press release at 0600 reported elevated dose rates around the site. At 1020 on March 12, while Unit 1 operators were attempting to open the containment vent valve, dose rates at the site boundary briefly reached as high as 38.5 mrem/hr (0.385 mSv/hr). Dose rates later spiked as high as 101.5 mrem/hr (1.015 mSv/hr) at the site boundary, and steam was seen leaving the plant stack after operators vented Unit 1 torus

INPO 11-005
42
using a temporary air supply at 1410. Dose rates at the site boundary remained elevated and had no discernable increase after the explosion that occurred on Unit 1 at 1536. The evacuation radius was extended to 12.4 miles (20 km) at 1825. Over the next day, dose rates remained elevated well above normal background with periodic increases, which indicated that radiological releases continued to occur. On March 13 at 1300, pressure in the Unit 3 drywell and torus began to decrease rapidly, indicating a release from the containment. Dose rates at the site boundary increased to 155.7 mrem/hr (1.557 mSv/hr). There were no appreciable changes in site boundary dose rates on March 14 following venting of the Unit 3 containment because the wind direction was blowing the plume toward the ocean. However, the release was likely very large given that a Unit 3 drywell radiation monitor recovered briefly just before the venting indicated a dose rate of 16,700 rem/hr (167 Sv/hr). The wind continued to blow toward the ocean, and site boundary dose rates did not increase when a hydrogen explosion occurred on Unit 3 at 1101. Dose rates at the site boundary did increase to as high as 313 mrem/hr (3.13 mSv/hr) later in the evening, and elevated dose rates were measured 62 miles (100 km) south of the plant. On March 15 at 0820, site boundary dose rates began to increase rapidly to 821 mrem/hr (8.21 mSv/hr). This increase occurred approximately two hours after the pressure in the Unit 2 drywell began to decrease. This release is likely responsible for much of the elevated dose rates later discovered off site because of deposition that occurred from the rainfall in many areas during this release. Government officials directed that inhabitants between 12.4 miles (20 km) and 18.6 miles (30 km) of the site remain sheltered. The highest dose rates recorded at the site boundary were measured on March 16, when dose rates reached 1,085 mrem/hr (10.85 mSv/hr). Routine dose rate surveys began to be collected in the area outside the 12.4 mile (20 km) radius of the plant on March 16. The highest dose rate of 17 mrem/hr (0.17 mSv) was measured 19 miles (30.5 km) northwest of the station. The first air samples from the site boundary, on March 22 and 23, had iodine-131 concentrations that were equivalent to approximately 80 mrem (0.8 mSv) of thyroid dose each hour if inhaled by an unprotected individual. The concentration remained between 25 and 200 percent of this value until April 18, 2011. Surveys inside 12.4 miles (20 km) began on March 30. The map shown in Figure 5.4-1, which was created based on survey results, is representative of these initial surveys.

INPO 11-005
43
Figure 5.4-1 Initial Off-Site Survey Results
Government officials issued the first directive for the public to take potassium iodide and restrictions on consumption of food and water on March 21. The directive for the mandatory issuance of potassium iodide included the inhabitants of several villages and towns within the affected area. Enough potassium iodide for 900,000 people was distributed within a 31-mile (50 km) radius of the plant. Because the evacuations had already been completed, however, the potassium iodide was not issued to the population. Food restrictions included the distribution of such items as spinach and raw milk from Fukushima and a few nearby prefectures. While food restrictions have continued to be added and lifted since the event, all water restrictions that had gone into effect were lifted by April 1, 2011, except in one small village where they remained until May 10, 2011 for infants.
INPO 11-005
44
6.0 References 1. Report of the Japanese Government to the IAEA Ministerial Conference on Nuclear
Safety .
2. IAEA International Fact-Finding Expert Mission of the Fukushima Dai-Ichi NPP Accident following the Great East Japan Earthquake and Tsunami, 24 May 2 June 2011.
3. TEPCO Report to NISA (in Japanese).
4. Effects of the Earthquake and Tsunami on the Fukushima Daiichi and Daini Nuclear Power Stations, May 24, 2011.
5. TEPCO Plant Data.
6. Various TEPCO, NISA, JNES and official press releases.
7. Japan Nuclear Technology Institute (JANTI). 24 March 2011. What happened in the TEPCO Fukushima Daiichi Nuclear Power Station?
8. TEPCO Official Timeline.
9. Results of Monitoring at Fukushima Daiichi Nuclear Power Station. O ther Resources Researched During This Investigation: Japan Atomic Industrial Forum, Inc. April 2011. Information on Status of Nuclear Power Plants in Fukushima. Japan Nuclear Energy Safety Organization (JNES). 19 April 2011. Assessment of the Spent Fuel Pool of Fukushima Daiichi Unit 4. Nuclear and Industrial Safety Agency (NISA) and Japan Nuclear Energy Safety Organization (JNES). 4 April 2011. The 2011 off the Pacific coast of Tohoku Pacific Earthquake and the seismic damage to the NPPs. Tokyo Electric Power Company. 9 April 2011. Investigation Results of Tsunami at Fukushima Daiichi and Daini Nuclear Power Stations. Tokyo Electric Power Company. 17 April 2011. Roadmap towards Restoration from the Accident at Fukushima Daiichi Nuclear Power Station. Tokyo Electric Power Company. 18 April 2011. The Great East Japan Earthquake and Current Status of Nuclear Power Stations.
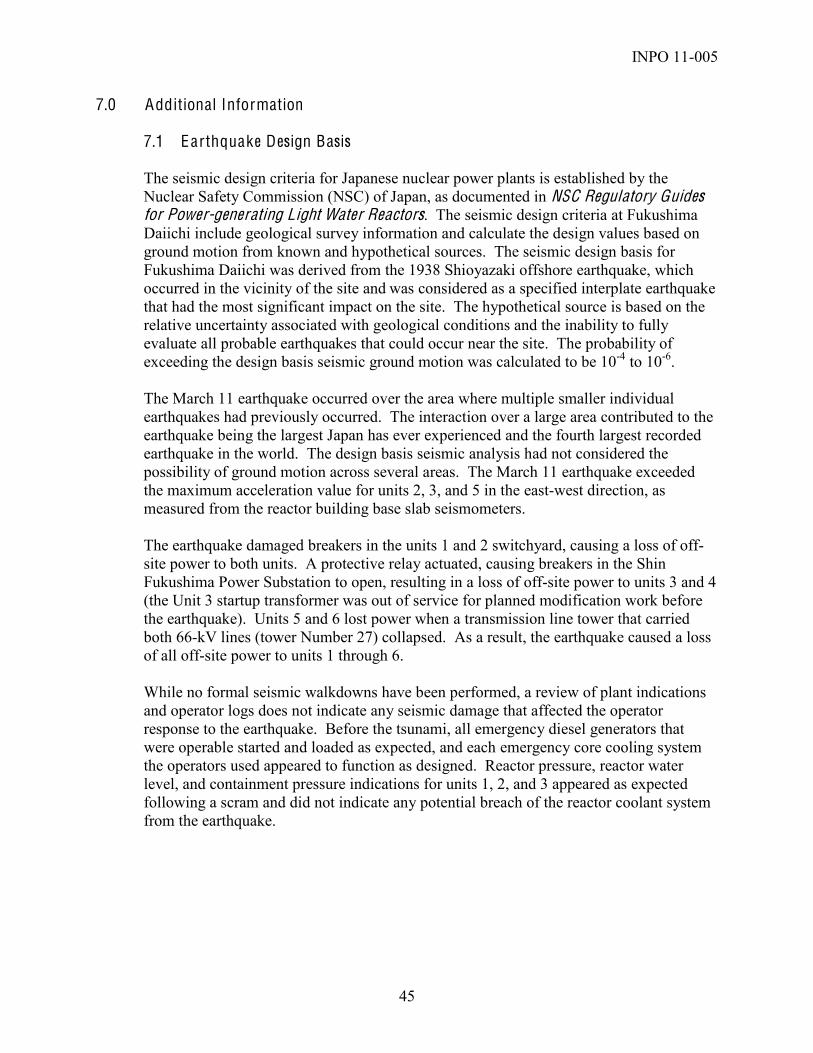
INPO 11-005
45
7.0 Additional Information
7.1 Earthquake Design Basis
The seismic design criteria for Japanese nuclear power plants is established by the Nuclear Safety Commission (NSC) of Japan, as documented in NSC Regulatory Guides for Power-generating Light Water Reactors. The seismic design criteria at Fukushima Daiichi include geological survey information and calculate the design values based on ground motion from known and hypothetical sources. The seismic design basis for Fukushima Daiichi was derived from the 1938 Shioyazaki offshore earthquake, which occurred in the vicinity of the site and was considered as a specified interplate earthquake that had the most significant impact on the site. The hypothetical source is based on the relative uncertainty associated with geological conditions and the inability to fully evaluate all probable earthquakes that could occur near the site. The probability of exceeding the design basis seismic ground motion was calculated to be 10-4 to 10-6. The March 11 earthquake occurred over the area where multiple smaller individual earthquakes had previously occurred. The interaction over a large area contributed to the earthquake being the largest Japan has ever experienced and the fourth largest recorded earthquake in the world. The design basis seismic analysis had not considered the possibility of ground motion across several areas. The March 11 earthquake exceeded the maximum acceleration value for units 2, 3, and 5 in the east-west direction, as measured from the reactor building base slab seismometers. The earthquake damaged breakers in the units 1 and 2 switchyard, causing a loss of off-site power to both units. A protective relay actuated, causing breakers in the Shin Fukushima Power Substation to open, resulting in a loss of off-site power to units 3 and 4 (the Unit 3 startup transformer was out of service for planned modification work before the earthquake). Units 5 and 6 lost power when a transmission line tower that carried both 66-kV lines (tower Number 27) collapsed. As a result, the earthquake caused a loss of all off-site power to units 1 through 6. While no formal seismic walkdowns have been performed, a review of plant indications and operator logs does not indicate any seismic damage that affected the operator response to the earthquake. Before the tsunami, all emergency diesel generators that were operable started and loaded as expected, and each emergency core cooling system the operators used appeared to function as designed. Reactor pressure, reactor water level, and containment pressure indications for units 1, 2, and 3 appeared as expected following a scram and did not indicate any potential breach of the reactor coolant system from the earthquake.

INPO 11-005
46
Preliminary Seismic Data Fukushima Daiichi reactor building slab seismic instrument3
Figure 7.1-1 Preliminary Seismic Data
Graphs indicate the observed values as compared to the design basis seismic criteria. Ss-1: Design basis for inland crustal earthquakes and interplate earthquakes Ss-2: Design basis for oceanic intraplate earthquakes Ss-3: Design basis for hypothetical (unspecified) sources 3

INPO 11-005
47
7.2 Tsunami Design Basis In the 1960s, when TEPCO applied for the construction permit at Fukushima Daiichi, it was common practice to adopt historical tsunami records as the design basis tsunami height. Numerical simulation of tsunamis based on tsunami generation methods (earthquakes) did not begin until the mid-1970s. The original design basis tsunami for Fukushima Daiichi was based on the Chilean tsunami of 1960, which resulted in a historic high water level of 10.2 ft (3.122 m) at the Onahama port, just north of the plant. Based on this, 10.2 ft (3.122 m) was the design basis for Fukushima Daiichi when the construction permit was issued. The tsunami design basis for Fukushima Daiichi considered only the inundation and static water pressures, and not the impact force of the wave or the impact of debris associated with the wave. The design included a breakwater, which ranged in height from 18 ft (5.5 m) to as high as 32.8 ft (10 m), as shown in Section 1.1. Following the publishing of Tsunami Assessment Methods for Nuclear Power Plants in Japan by the Japan Society of Civil Engineers (JSCE) in 2002, TEPCO voluntarily reassessed its tsunami design basis. Using these new deterministic evaluation techniques, however, TEPCO determined the design basis tsunami would result in a maximum water level of 18.7 ft (5.7 m). Because these changes were done voluntarily and not at the direction of the regulator, the licensing basis did not change. According to the evaluation, the elevation of the Unit 6 seawater pump motor for the emergency diesel generator was raised 7.9 in (20 cm), and the seawater pump motor for high pressure core spray was raised 8.7 in (22 cm). These changes ensured all vital seawater motors were installed higher than the new inundation level of 18.7 ft (5.7m). The new analysis did not consider or require the station design to mitigate hydrodynamic impact forces. The breakwater was not modified when the new tsunami height was implemented because it was not intended to provide tsunami protection, but rather to minimize wave action in the harbor. The 2002 analysis considered tsunamis generated from eight different near-field sources off the coast of Japan. The March 11 earthquake was a rupture across several of these areas, resulting in a larger-than-expected tsunami. Tsunamis caused by ruptures across several areas had not been considered as credible in the analysis. The tsunami was the largest in the history of Japan. In 2006, TEPCO performed a study on the development of probabilistic tsunami hazard analysis, which used the Fukushima coast as an example. The study estimated the probability of the Fukushima coast experiencing a tsunami greater than 19.7 ft (6 m) to be less than 1.0 E-2 in the next 50 years.

INPO 11-005
48
7.3 Station Specifications
Table 7.3-1: Fukushima Daiichi Unit Information (U.S. units) converted from source document provided in Table 7.3-2
Unit 1 Unit 2 Unit 3 Unit 4 Unit 5 Unit 6
Main Specifications
Electric Output (MW) 460 784 784 784 784 1,100
Start of Construction Sep-‐67 May-‐69 Oct-‐70 Sep-‐72 Dec-‐71 May-‐73
Start of Commercial Operation Mar-‐71 Jul-‐74 Mar-‐76 Oct-‐78 Apr-‐78 Oct-‐79
Reactor Type BWR3 BWR4 BWR4 BWR4 BWR4 BWR5
Containment Type Mark I Mark II
Main Contractor GE GE/Toshiba Toshiba Hitachi Toshiba GE/Toshiba
Nuclear Reactor
Heat Output (MW) 1,380 2,381 3,293
Number of Fuel Assemblies 400 548 764
Full Length of Fuel Assemblies (in) 171 176 176
Number of Control Rods 97 137 185
Reactor Pressure Vessel
(RPV)
Inner Diameter (in) 189 220 252
Height (in) 787 866 906
Total Weight (short ton) 485 551 827
Design Pressure (psi) 1194.8 1249.9
Design Temperature (F) 572 576
Primary Containment Vessel (PCV)
Height (ft.) 105.0 108.3 111.5 157.5
Diameter of Cylindrical Portion (ft.) 32.8 36.1 32.8 (top)
Diameter of Spherical Portion (ft.) 59.1 65.6 82.0 (bottom)
Suppression Pool Water Amount (kgal) 462.3 787.2 845.4
Design Pressure (psig) 62.4 55.1 40.6
Design Temperature (F) 284 280 340 (DW) 221 (SC)
Steam Turbine
Number of Revolutions (rpm) 1,500
Steam Temperature (F) 540
Steam Pressure (psig) 950
Fuel Type uranium dioxide (Unit 3 contains MOX)
Uranium (ton) 69 94 132
AC Distribution Emergency Diesel Generators (* indicates air-‐cooled EDG) 2 1/1* 2 1/1* 2 2/1*
Electrical Grid 4 -‐ 275-‐kV lines 2 -‐ 500-‐kV lines
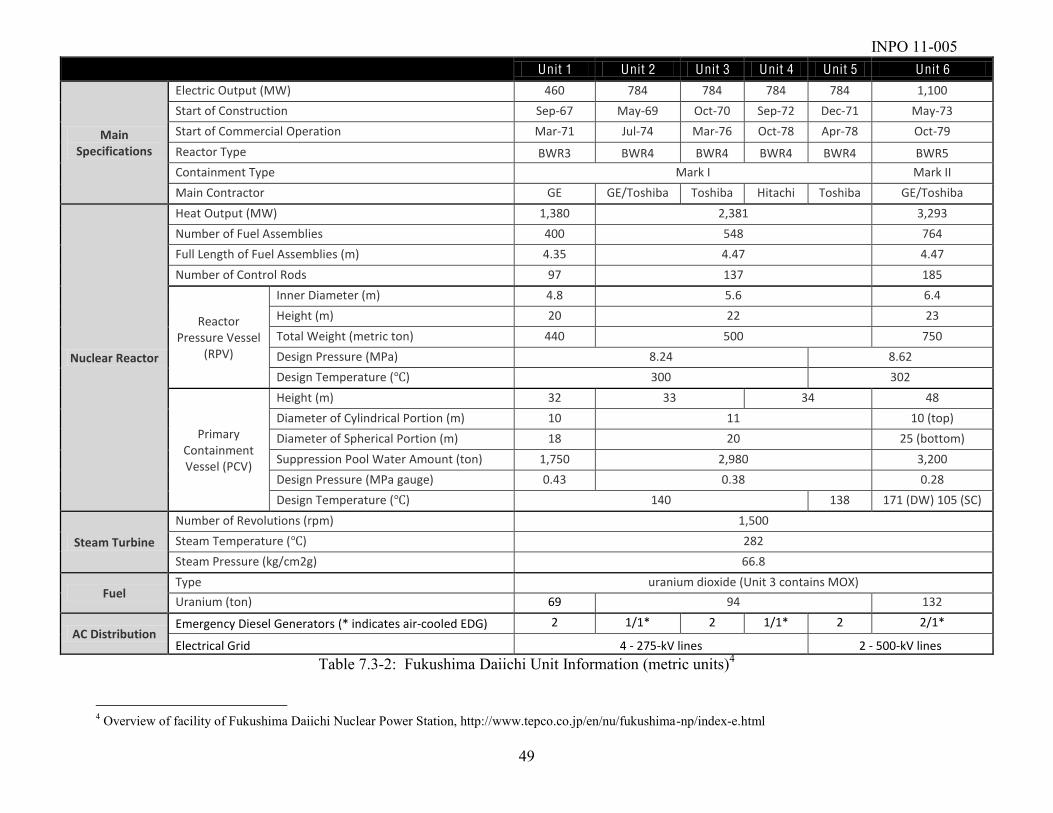
INPO 11-005
49
Table 7.3-2: Fukushima Daiichi Unit Information (metric units)4
4 Overview of facility of Fukushima Daiichi Nuclear Power Station, http://www.tepco.co.jp/en/nu/fukushima-np/index-e.html
Unit 1 Unit 2 Unit 3 Unit 4 Unit 5 Unit 6
Main Specifications
Electric Output (MW) 460 784 784 784 784 1,100
Start of Construction Sep-‐67 May-‐69 Oct-‐70 Sep-‐72 Dec-‐71 May-‐73
Start of Commercial Operation Mar-‐71 Jul-‐74 Mar-‐76 Oct-‐78 Apr-‐78 Oct-‐79
Reactor Type BWR3 BWR4 BWR4 BWR4 BWR4 BWR5
Containment Type Mark I Mark II
Main Contractor GE GE/Toshiba Toshiba Hitachi Toshiba GE/Toshiba
Nuclear Reactor
Heat Output (MW) 1,380 2,381 3,293
Number of Fuel Assemblies 400 548 764
Full Length of Fuel Assemblies (m) 4.35 4.47 4.47
Number of Control Rods 97 137 185
Reactor Pressure Vessel
(RPV)
Inner Diameter (m) 4.8 5.6 6.4
Height (m) 20 22 23
Total Weight (metric ton) 440 500 750
Design Pressure (MPa) 8.24 8.62
Design Temperature ( ) 300 302
Primary Containment Vessel (PCV)
Height (m) 32 33 34 48
Diameter of Cylindrical Portion (m) 10 11 10 (top)
Diameter of Spherical Portion (m) 18 20 25 (bottom)
Suppression Pool Water Amount (ton) 1,750 2,980 3,200
Design Pressure (MPa gauge) 0.43 0.38 0.28
Design Temperature ( ) 140 138 171 (DW) 105 (SC)
Steam Turbine
Number of Revolutions (rpm) 1,500
Steam Temperature ( ) 282
Steam Pressure (kg/cm2g) 66.8
Fuel Type uranium dioxide (Unit 3 contains MOX)
Uranium (ton) 69 94 132
AC Distribution Emergency Diesel Generators (* indicates air-‐cooled EDG) 2 1/1* 2 1/1* 2 2/1*
Electrical Grid 4 -‐ 275-‐kV lines 2 -‐ 500-‐kV lines
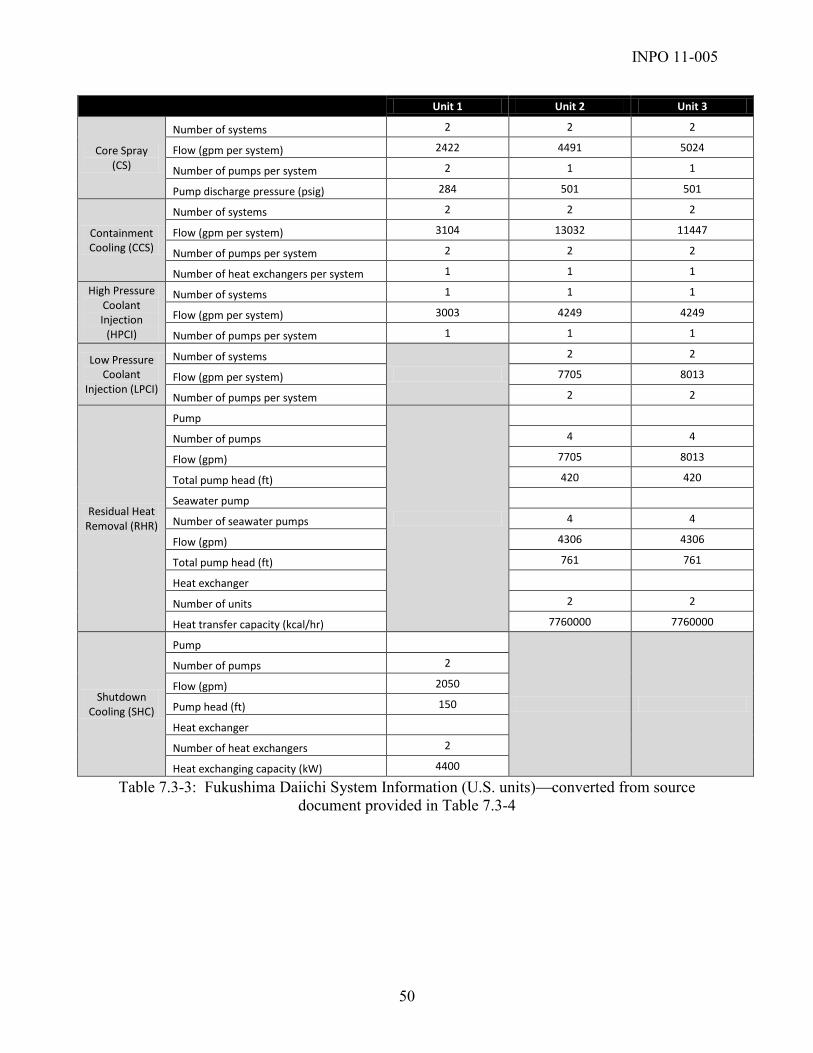
INPO 11-005
50
Unit 1 Unit 2 Unit 3
Core Spray (CS)
Number of systems 2 2 2
Flow (gpm per system) 2422 4491 5024
Number of pumps per system 2 1 1
Pump discharge pressure (psig) 284 501 501
Containment Cooling (CCS)
Number of systems 2 2 2
Flow (gpm per system) 3104 13032 11447
Number of pumps per system 2 2 2
Number of heat exchangers per system 1 1 1
High Pressure Coolant Injection (HPCI)
Number of systems 1 1 1
Flow (gpm per system) 3003 4249 4249
Number of pumps per system 1 1 1
Low Pressure Coolant
Injection (LPCI)
Number of systems
2 2
Flow (gpm per system) 7705 8013
Number of pumps per system 2 2
Residual Heat Removal (RHR)
Pump
Number of pumps 4 4
Flow (gpm) 7705 8013
Total pump head (ft) 420 420
Seawater pump
Number of seawater pumps 4 4
Flow (gpm) 4306 4306
Total pump head (ft) 761 761
Heat exchanger
Number of units 2 2
Heat transfer capacity (kcal/hr) 7760000 7760000
Shutdown Cooling (SHC)
Pump
Number of pumps 2
Flow (gpm) 2050
Pump head (ft) 150
Heat exchanger
Number of heat exchangers 2
Heat exchanging capacity (kW) 4400
Table 7.3-3: Fukushima Daiichi System Information (U.S. units) converted from source document provided in Table 7.3-4

INPO 11-005
51
Unit 1 Unit 2 Unit 3
Reactor Core Isolation
Cooling (RCIC)
Steam turbine
Number of steam turbines 1 1
Reactor pressure (psig) 1045-‐150 1045-‐150
Output (HP) 500-‐80 500-‐80
Speed (rpm) 5000-‐2000 5000-‐2000
Pump
Number of pumps 1 1
Flow (gpm) 418 427
Total pump head (ft) 2788-‐525 2788-‐525
Speed (rpm) Variable Variable
Isolation Condenser (IC)
Number of systems 2
Tank water retention capacity (gal/tank) 28002
Steam flow (short ton/hr per tank) 116
Standby Gas Treatment (SGTS)
Number of systems 2 2 2
Number of fans per system 1 1 1
Exhaust capacity (cfm per unit) 1101 1589 1589
Iodine filtration efficiency (%) >97 >99.9 >99.9
Safety Valves
Number of valves 3 3 3
Total capacity (short ton/hr) 992 992 992
Blowout pressure (psig) 1235.4 1251.1
(2 valves) (1 valve)
1241.1 1241.1
Blowoff area Drywell Drywell Drywell
Main Steam Safety Relief
Valves
Number of valves 4 8 8
Total capacity (short ton/hr) 1202 3197 3197
Pressure Valves Pressure Valves Pressure Valves
Relief valve function (psig)
1056.1 1 1080.3 1 1080.3 1
1066.1 2 1090.2 3 1090.2 3
1076.0 1 1100.2 4 1100.2 4
Safety valve function (psig)
1110.2 2 1110.2 2
1120.1 2 1120.1 3
1130.1 3
Blowoff area Suppression Chamber Suppression Chamber Suppression Chamber
Table 7.3-3 (continued)

INPO 11-005
52
Unit 1 Unit 2 Unit 3
Core Spray (CS)
Number of systems 2 2 2
Flow (T/hr per system) 550 1020 1141
Number of pumps per system 2 1 1
Pump discharge pressure (kg/cm2g) 20 35.2 35.2
Containment Cooling (CCS)
Number of systems 2 2 2
Flow (T/hr per system) 705 2960 2600
Number of pumps per system 2 2 2
Number of heat exchangers per system 1 1 1
High Pressure Coolant Injection
(HPCI)
Number of systems 1 1 1
Flow (T/hr per system) 682 965 965
Number of pumps per system 1 1 1
Low Pressure Coolant Injection
(LPCI)
Number of systems
2 2
Flow (T/hr per system) 1750 1820
Number of pumps per system 2 2
Residual Heat Removal (RHR)
Pump
Number of pumps 4 4
Flow (T/hr) 1750 1820
Total pump head (m) 128 128
Seawater pump
Number of seawater pumps 4 4
Flow (m3/hr) 978 978
Total pump head (m) 232 232
Heat exchanger
Number of units 2 2
Heat transfer capacity (kcal/hr) 7760000 7760000
Shutdown Cooling (SHC)
Pump
Number of pumps 2
Flow (m3/hr) 465.5
Pump head (m) 45.7
Heat exchanger
Number of heat exchangers 2
Heat exchanging capacity (kcal/h) 3800000
Table 7.3-4: Fukushima Daiichi System Information (metric units)5
5 Report of the Japanese Government to the IAEA Ministerial Conference on Nuclear Safety, June 2011
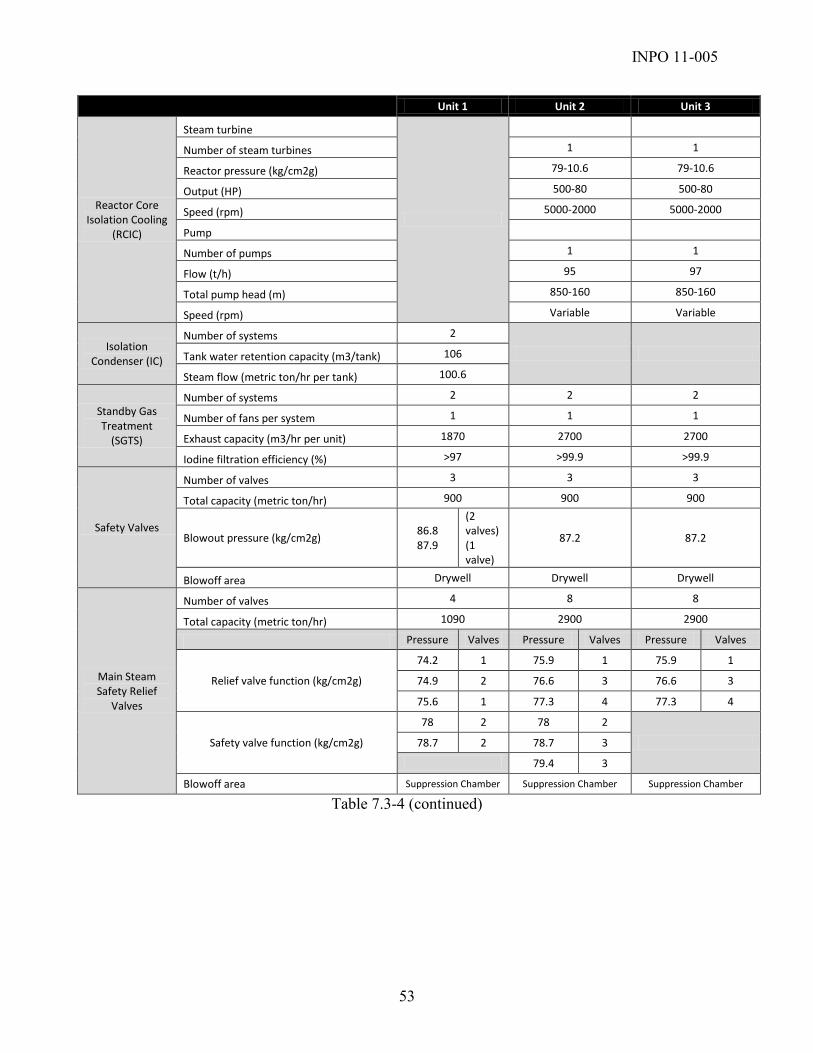
INPO 11-005
53
Unit 1 Unit 2 Unit 3
Reactor Core Isolation Cooling
(RCIC)
Steam turbine
Number of steam turbines 1 1
Reactor pressure (kg/cm2g) 79-‐10.6 79-‐10.6
Output (HP) 500-‐80 500-‐80
Speed (rpm) 5000-‐2000 5000-‐2000
Pump
Number of pumps 1 1
Flow (t/h) 95 97
Total pump head (m) 850-‐160 850-‐160
Speed (rpm) Variable Variable
Isolation Condenser (IC)
Number of systems 2
Tank water retention capacity (m3/tank) 106
Steam flow (metric ton/hr per tank) 100.6
Standby Gas Treatment (SGTS)
Number of systems 2 2 2
Number of fans per system 1 1 1
Exhaust capacity (m3/hr per unit) 1870 2700 2700
Iodine filtration efficiency (%) >97 >99.9 >99.9
Safety Valves
Number of valves 3 3 3
Total capacity (metric ton/hr) 900 900 900
Blowout pressure (kg/cm2g) 86.8 87.9
(2 valves) (1 valve)
87.2 87.2
Blowoff area Drywell Drywell Drywell
Main Steam Safety Relief
Valves
Number of valves 4 8 8
Total capacity (metric ton/hr) 1090 2900 2900
Pressure Valves Pressure Valves Pressure Valves
Relief valve function (kg/cm2g)
74.2 1 75.9 1 75.9 1
74.9 2 76.6 3 76.6 3
75.6 1 77.3 4 77.3 4
Safety valve function (kg/cm2g)
78 2 78 2
78.7 2 78.7 3
79.4 3
Blowoff area Suppression Chamber Suppression Chamber Suppression Chamber
Table 7.3-4 (continued)

INPO 11-005
54
7.4 Fukushima Daiichi Simplified System Drawings/Descriptions
Figure 7.4-1 Isolation Condensers on Unit 16
6 Report of the Japanese Government to the IAEA Ministerial Conference on Nuclear Safety, June 2011
Primary Containment Vessel
RR Pump (B)
RP
V
MO2
A
MO2
B
MO1
A
MO11
A1
A B
MO4
B
MO4
A
MO3
B
MO3
A
IsolationCondenser B
IsolationCondenser A

INPO 11-005
55
Figure 7.4-2 High Pressure Coolant Injection (HPCI) Typical Arrangement, Units 1 37
7 Report of the Japanese Government to the IAEA Ministerial Conference on Nuclear Safety, June 2011
Primary Containment Vessel
RPV
Unit 1 is 4 Unit 1 is 5
MS(C) MO15
MO16
FDW(B) Unit 1 is Z8 Unit 1 is Z9 Unit 1 is 3
Governing Valve Stop Valve
HO
*
HO
*
MO14
Unit 1 is 7
Unit 1 is 8
Unit 1 is 9
EGR
HPCIControl System
AO18
MO19
MO20
HPCIBooster Pump
HPCIMain Pump
HPCI Turbine
Exhaust (To Suppression Chamber)
S/C
Unit 1 is 35
Unit 1 is 6
CST
MO57
MO17

INPO 11-005
56
Figure 7.4-3 Reactor Core Isolation Cooling (RCIC) Typical Arrangement, Units 2 and 38
8 Report of the Japanese Government to the IAEA Ministerial Conference on Nuclear Safety, June 2011
Primary Containment Vessel
RPV
MS(B) MO15
MO16
FDW(A) Unit 3 is Z1 Unit 3 is 10-8
HOZ14
HOZ14
MO131
EGR
RCICControl System
AO22
MO21
MO20
RCIC Turbine
Exhaust (To Suppression Chamber)
S/C
CST
MO39
MO18
RCIC Pump

INPO 11-005
57
Primary Containment Vessel Vent System Description
Between 1999 and 2001, TEPCO modified the design of the containment vent system by adding new vent pipes extending from the suppression chamber and drywell to the stacks. These vent pipes were added to provide a method of venting containment during severe accidents. The modified ventilation piping bypassed the standby gas treatment system (SGTS) to allow operators a method of venting containment even when the pressure is high. The piping connection with the ventilation stack is provided with a rupture disk. (See figures 7.4-4 and 7.4-5.)
Figure 7.4-4 Overview of Unit 1 Containment Vent System9
9 Report of the Japanese Government to the IAEA Ministerial Conference on Nuclear Safety, June 2011

INPO 11-005
58
Figure 7.4-5 Overview of Units 2 and 3 Containment Vent System10
10 Report of the Japanese Government to the IAEA Ministerial Conference on Nuclear Safety, June 2011

INPO 11-005
59
Fukushima Daiichi Units 1 through 4 before the event
Figure 7.4-6 Simplified Electrical System11 Systems highlighted in green were in service (energized). The 4A EDG and Unit 3 startup transformer were out of service for planned maintenance at the time of the event. 11

INPO 11-005
60
Fukushima Daiichi
Unit 1 Unit 2 Unit 3 Unit 4 Unit 5 Unit 6
Equipment Name
Status Equipment
Name Status
Equipment Name
Status Equipment
Name Status
Equipment Name
Status Equipment
Name Status
EDG
(ac) = air cooled
EDG 1A x EDG 2A x EDG 3A x EDG 4A x EDG 5A (2) EDG 6A (2)
EDG 1B x EDG 2B (ac)
(1) EDG 3B x EDG 4B (ac)
(1) EDG 5B (2) EDG 6B (ac)
o
-‐-‐ -‐-‐ -‐-‐ -‐-‐ -‐-‐ -‐-‐ -‐-‐ -‐-‐ -‐-‐ -‐-‐ HPCS EDG (2)
6.9 kV
Electrical Distribution Vi
tal M/C 1C x M/C 2C x M/C 3C x M/C 4C x M/C 5C x M/C 6C o
M/C 1D x M/C 2D x M/C 3D x M/C 4D x M/C 5D x M/C 6D o
-‐-‐ -‐-‐ M/C 2E x -‐-‐ -‐-‐ M/C 4E x -‐-‐ -‐-‐ HPCS M/C o
Non
-‐Vita
l
M/C 1A x M/C 2A x M/C 3A x M/C 4A x M/C 5A x M/C 6A-‐1 x
M/C 6A-‐2 x
M/C 1B x M/C 2B x M/C 3B x M/C 4B x M/C 5B x M/C 6B-‐1 x
M/C 6B-‐2 x
M/C 1S x
M/C 2SA x M/C 3SA x
-‐-‐
M/C 5SA-‐1 x
-‐-‐ M/C 5SA-‐2 x
M/C 2SB x M/C 3SB x M/C 5SB-‐1 x
M/C 5SB-‐2 x
480V
Pow
er Cen
ters (P
/C) Vital P/C 1C x P/C 2C P/C 3C x P/C 4C o P/C 5C x P/C 6C o
P/C 1D x P/C 2D P/C 3D x P/C 4D o P/C 5D x P/C 6D o
-‐-‐ -‐-‐ P/C 2E x -‐-‐ -‐-‐ P/C 4E x -‐-‐ -‐-‐ P/C 6E o
Non
-‐Vita
l
P/C 1A x P/C 2A P/C 3A x P/C 4A o P/C 5A x P/C 6A-‐1 x
P/C 2A-‐1 x -‐-‐ -‐-‐ -‐-‐ -‐-‐ P/C 5A-‐1 o P/C 6A-‐2 x
P/C 1B x P/C 2B P/C 3B x P/C 4B o P/C 5B x P/C 6B-‐1 x
-‐-‐ -‐-‐ -‐-‐ -‐-‐ -‐-‐ -‐-‐ -‐-‐ -‐-‐ P/C 5B-‐1 o P/C 6B-‐2 x
P/C 1S x -‐-‐ -‐-‐ P/C 3SA x -‐-‐ -‐-‐ P/C 5SA x -‐-‐ -‐-‐
-‐-‐ -‐-‐ -‐-‐ -‐-‐ -‐-‐ -‐-‐ P/C 5SA-‐1 x -‐-‐ -‐-‐
-‐-‐ -‐-‐ P/C 2SB x P/C 3SB x -‐-‐ -‐-‐ P/C 5SB x -‐-‐ -‐-‐
DC Po
wer
125V
DC 125V main bus
A x
DC 125V P/C 2A
x DC 125V main bus
3A o
DC 125V main bus
4A x
DC 125V P/C 5A
o DC 125V
6A o
DC 125V main bus
B x
DC 125V P/C 2B
x DC 125V main bus
3B o
DC 125V main bus
4B x
DC 125V P/C 5B
o DC 125V
6B o
UHS
SW x RHR-‐S A x RHR-‐S A x RHR-‐S A x RHR-‐S A x RHR-‐S A x
RHR-‐S B x RHR-‐S B x RHR-‐S B x RHR-‐S B x RHR-‐S B x
Status: x: damaged o: available Key: White background: Not damaged by the earthquake or tsunami
Blue background: Damaged or flooded by tsunami Gray background: Support systems damaged or flooded by tsunami
(1): electrical distribution damaged or flooded (2): ultimate hat sink damaged or flooded
Figure 7.4-7 Fukushima Daiichi Electrical Distribution Damage12 12 - Tokyo Electric Power Company Co.

INPO 11-005
61
Figure 7.4-8: Generic cross-section of a BWR4 with a Mark I containment (similar to
Fukushima Daiichi)

INPO 11-005
62
7.5 O rganizational Structure and Staffing
Fukushima Daiichi uses one shared control room for each two units on site (three control rooms; five shift crews per control room). One operating crew is responsible for each control room and the two associated units. The crew rotation is a standard five-crew, 12-hour shift rotation with 10 days of training after every fifth rotation. The chain of command is configured in the following manner (units 1-2 shown).
Operations Department General Manager (Units 5-6)
Unit Superintendent (Units 5-6)
Site Superintendent
Operations Department General Manager (Units 1-4)
Unit Superintendent (Units 1-4)
Shift Supervisor
Assistant Shift Supervisor
Unit 1 Senior Operator
Unit 2 Senior Operator
Unit 1 Main Shift Operator
Assistant Senior Operator
Unit 2 Main Shift Operator
Auxiliary Operator Auxiliary Operator Auxiliary Operator Auxiliary Operator

INPO 11-005
63
Approximate equivalent positions for U.S. nuclear units (not exact equivalent):
Japan U.S. shift supervisor shift manager assistant shift supervisor control room supervisor unit senior operator at-the-controls operator (similar to senior reactor
operator level in Japan) unit main shift operator balance-of-plant reactor operator (reports to unit
senior operator) assistant senior operator field supervisor auxiliary operator nonlicensed operator
During severe accident conditions, the site supervisor is in charge of site Emergency Response Center supervision. The shift supervisors will report directly to the site superintendent during these conditions. Operations Staffing at the T ime of the Event The operating crews consisted of the following:
Units 1 and 2 had 11 operators and 1 trainee.
Units 3 and 4 had 8 operators and 1 trainee. (Unit 4 minimum shift staffing was reduced because of the refueling outage.)
The normal operating shift organization for each of the two unit crews includes one shift supervisor, one assistant shift supervisor, two senior operators, one assistant senior operator, two main shift operators, and four auxiliary operators.
One crew in training reported to the station to assist in the response.
Station Staffing at the T ime of the Event Immediately after the tsunami, approximately 400 people (about 130 operators
and 270 maintenance personnel) were available for the recovery process.
About 70 TEPCO employees (maintenance workers) and about 40 people from affiliated companies were engaged in the initial field work to recover units 1 through 3. Most of the work was recovery of instrumentation and power supplies.
7.6 Operator T raining Initial operator training programs for reactor operators and above are provided by BWR Training Center Corporation (BTC), which is located close to Fukushima Daiichi. TEPCO is one of the shareholders of the company. The site superintendent certifies initial qualifications for senior operators, main shift operators, and auxiliary operators on site. By law, shift supervisors are required to be licensed. The licensing process includes
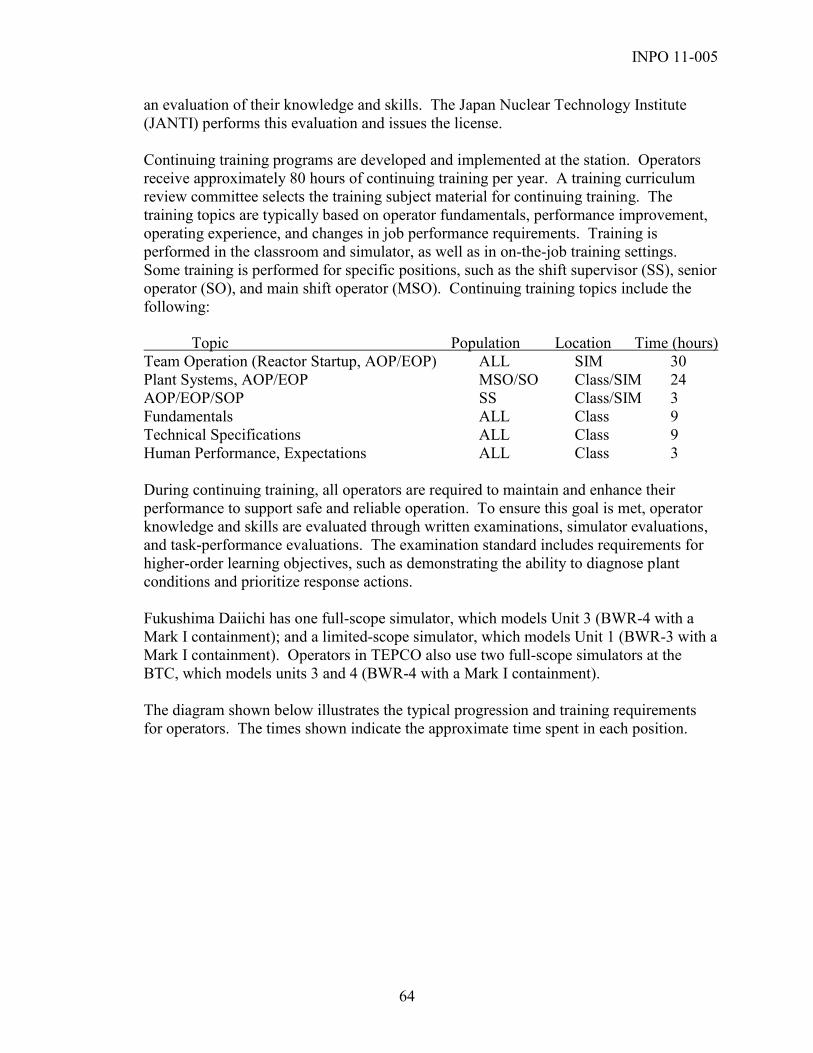
INPO 11-005
64
an evaluation of their knowledge and skills. The Japan Nuclear Technology Institute (JANTI) performs this evaluation and issues the license. Continuing training programs are developed and implemented at the station. Operators receive approximately 80 hours of continuing training per year. A training curriculum review committee selects the training subject material for continuing training. The training topics are typically based on operator fundamentals, performance improvement, operating experience, and changes in job performance requirements. Training is performed in the classroom and simulator, as well as in on-the-job training settings. Some training is performed for specific positions, such as the shift supervisor (SS), senior operator (SO), and main shift operator (MSO). Continuing training topics include the following:
Topic Population Location Time (hours) Team Operation (Reactor Startup, AOP/EOP) ALL SIM 30 Plant Systems, AOP/EOP MSO/SO Class/SIM 24 AOP/EOP/SOP SS Class/SIM 3 Fundamentals ALL Class 9 Technical Specifications ALL Class 9 Human Performance, Expectations ALL Class 3 During continuing training, all operators are required to maintain and enhance their performance to support safe and reliable operation. To ensure this goal is met, operator knowledge and skills are evaluated through written examinations, simulator evaluations, and task-performance evaluations. The examination standard includes requirements for higher-order learning objectives, such as demonstrating the ability to diagnose plant conditions and prioritize response actions. Fukushima Daiichi has one full-scope simulator, which models Unit 3 (BWR-4 with a Mark I containment); and a limited-scope simulator, which models Unit 1 (BWR-3 with a Mark I containment). Operators in TEPCO also use two full-scope simulators at the BTC, which models units 3 and 4 (BWR-4 with a Mark I containment). The diagram shown below illustrates the typical progression and training requirements for operators. The times shown indicate the approximate time spent in each position.
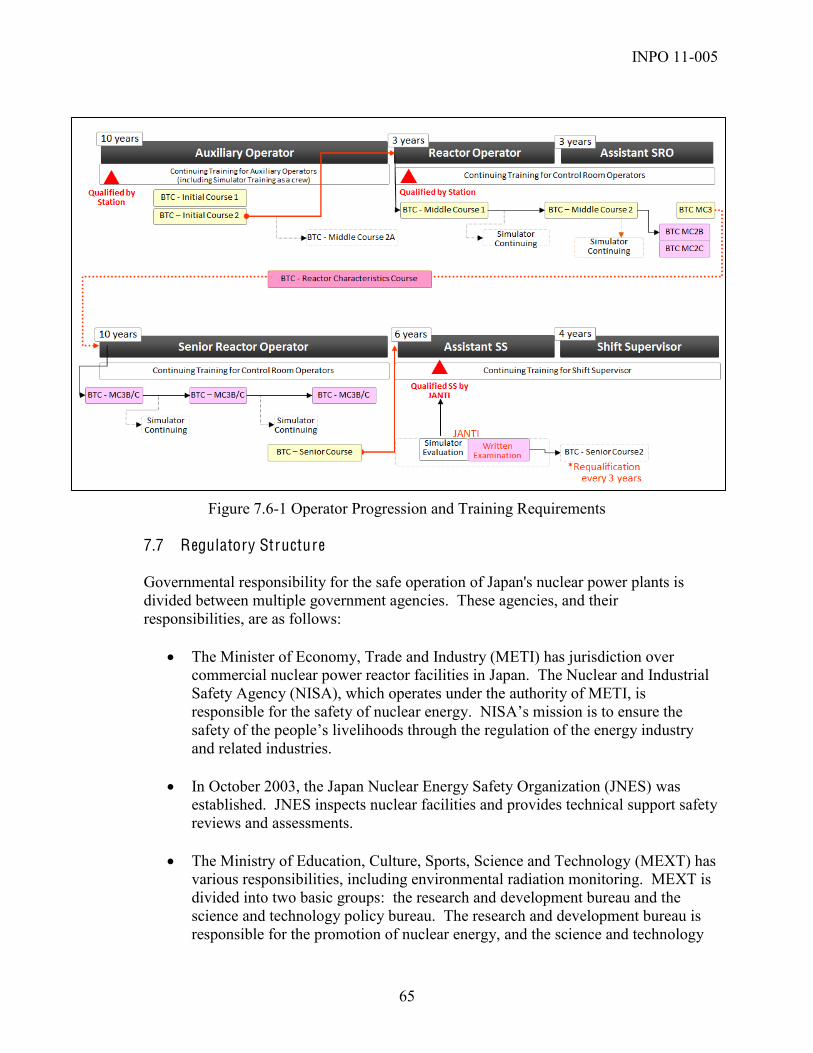
INPO 11-005
65
Figure 7.6-1 Operator Progression and Training Requirements
7.7 Regulatory Structure
Governmental responsibility for the safe operation of Japan's nuclear power plants is divided between multiple government agencies. These agencies, and their responsibilities, are as follows:
The Minister of Economy, Trade and Industry (METI) has jurisdiction over commercial nuclear power reactor facilities in Japan. The Nuclear and Industrial Safety Agency (NISA), which operates under the authority of METI, is responsible for the safety of nuclear energy. is to ensure the
and related industries.
In October 2003, the Japan Nuclear Energy Safety Organization (JNES) was established. JNES inspects nuclear facilities and provides technical support safety reviews and assessments.
The Ministry of Education, Culture, Sports, Science and Technology (MEXT) has
various responsibilities, including environmental radiation monitoring. MEXT is divided into two basic groups: the research and development bureau and the science and technology policy bureau. The research and development bureau is responsible for the promotion of nuclear energy, and the science and technology

INPO 11-005
66
policy bureau is responsible for nuclear safety regulation. MEXT is also responsible for dose limits for occupational exposure and helps local governments perform environmental surveys following an accident.
The Nuclear Safety Commission (NSC) is an independent agency that operates
under the cabinet office. The NSC is an administrative organization that provides supervision and audits the safety regulation by the MEXT and METI, thus providing independent verification over the administration of nuclear regulations in Japan. The NSC has a range of missions, including planning, deliberation, and making decisions on regulations and policies related to nuclear safety as well as prevention of radiation hazards, based on expert knowledge on nuclear technologies and radiological protection. The NSC has the authority to make recommendations to the regulatory bodies via the Prime Minister. The NSC also promotes communications with the public for enhancing the credibility of nuclear safety.
NISA occupies an off-site center, which must be located within 10 km of the station. Each nuclear station is required to have its own center, even when stations are in close proximity. These centers are equipped to monitor plant and meteorological conditions. The JNES analyzes the data and makes recommendations on sheltering or evacuation. JNES makes the recommendation to NISA, which takes that recommendation and passes it along to the various government organizations. Emergency Plan
Emergency preparedness and implementation in Japan involve many organizations, including on site, off site, national government, local government(s), regulators, and contractors. Processes, organizations, and activities include responses to reportable events and nonreportable emergencies, as defined below. A drawing is provided to demonstrate some of these relationships. One large-scale national emergency response drill is conducted each year to exercise the associated organizations and ensure the emergency plan is capable of fulfilling its intended function.
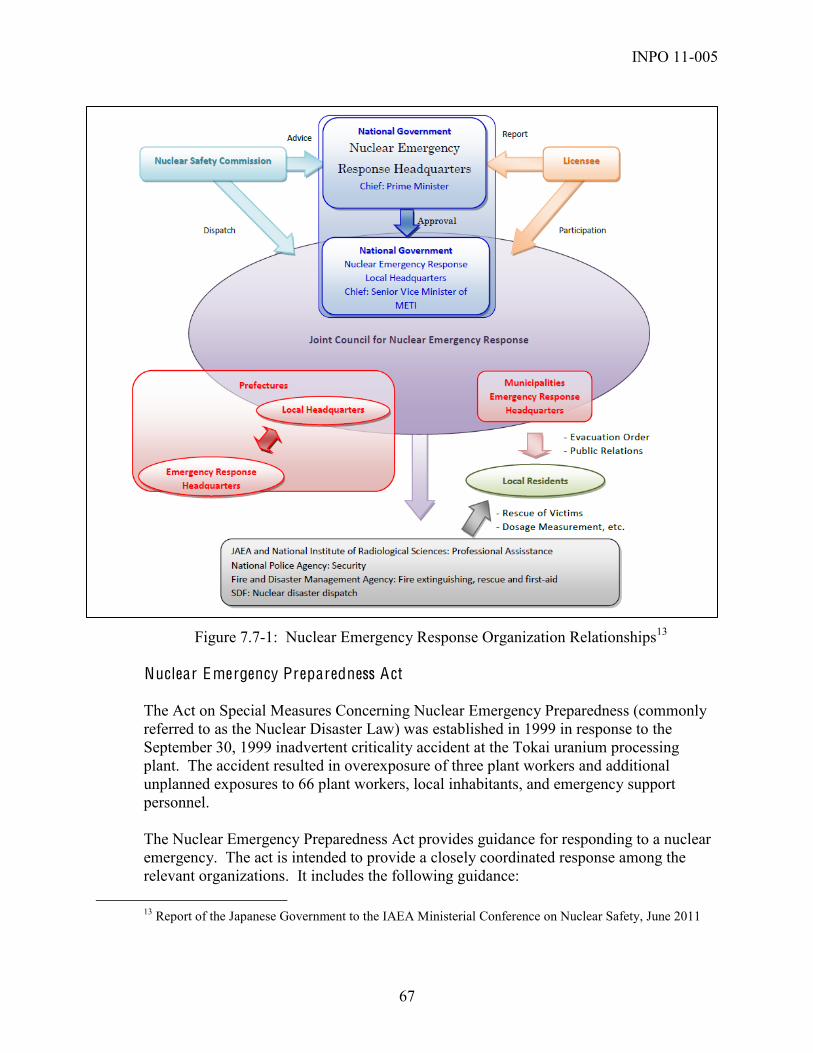
INPO 11-005
67
Figure 7.7-1: Nuclear Emergency Response Organization Relationships13 Nuclear Emergency Preparedness Act The Act on Special Measures Concerning Nuclear Emergency Preparedness (commonly referred to as the Nuclear Disaster Law) was established in 1999 in response to the September 30, 1999 inadvertent criticality accident at the Tokai uranium processing plant. The accident resulted in overexposure of three plant workers and additional unplanned exposures to 66 plant workers, local inhabitants, and emergency support personnel. The Nuclear Emergency Preparedness Act provides guidance for responding to a nuclear emergency. The act is intended to provide a closely coordinated response among the relevant organizations. It includes the following guidance:
13 Report of the Japanese Government to the IAEA Ministerial Conference on Nuclear Safety, June 2011
INPO 11-005
68
1) Licensee notification to the Minister of METI is required following declaration of a stipulated in Article 10 of the Nuclear Emergency Preparedness Act.
2) Upon receiving notification, the Minister shall initiate required actions and support local governments to prevent further escalation of a disaster.
3) If the Minister exceed predetermined thresholds associated with a nuclear emergency situation, the Minister shall immediately notify the Prime Minister.
4) The Prime Minister and directing local governments to take protective measures, such as evacuation, sheltering, and the administering of potassium iodide.
5) The Prime Minister shall establish and head the Nuclear Emergency Response Headquarters (NERHQ) in Tokyo and establish the local NERHQ at the associated off-site location.
6) The NSC shall convene an organization composed of commissioners and advisors, known as the Technical Advisory Organization in an Emergency, which will provide technical advice to the Prime Minister.
7) Local governments shall establish their own emergency response headquarters.
8) The Joint Council for Nuclear Emergency Response shall be established to share information between national and local governments and related organizations.
TEPCO also has a corporate emergency response manual. This manual defines three alert conditions for when a disaster occurs or is likely to occur. The station emergency response organization is temporarily activated when these alert conditions are declared. The three levels of alert are as follows:
Alert level 1 is declared when a disaster is predicted or has occurred. Alert level 2 is declared when a large-scale disaster is predicted or has occurred. Alert level 3 is declared when a large-scale disaster has occurred that may require
a lengthy recovery. The emergency response organization works out of a station Emergency Response Center. This is a new building that was added following the Niigata-Chuetsu-oki earthquake in 2007. The building was seismically designed, is at an elevated location, and has backup generators to provide power, so it withstood both the earthquake and the tsunami. This is the work location for the site superintendent when fulfilling the role of emergency director.

INPO 11-005
69
Following an emergency declaration, the corporate office will activate the corporate emergency response center in Tokyo. The corporate emergency response center is staffed to advise and instruct the station as needed and to support with media relations. The media release briefing room is located just outside the TEPCO Head Office Nuclear Emergency Headquarters. Station Emergency Response O rganization T raining According to TEPCO, the station emergency response organization conducts several integrated exercises each year. The number of scenarios is sufficient to ensure that every member of the emergency response organization participates in at least one drill per year. Lower-level or specific drills, such as emergency medical treatment, evacuations, and communications exercises, are also performed throughout the year. The operators will also participate in at least one emergency response organization emergency preparedness drill each year in the simulator.
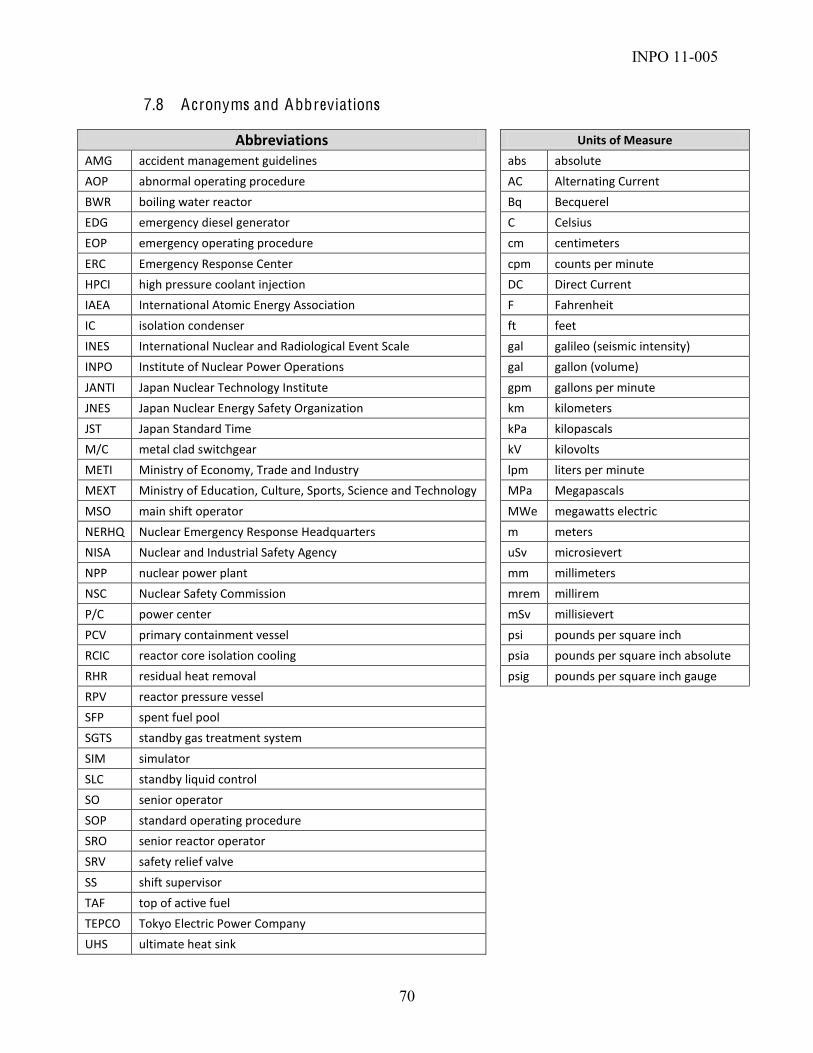
INPO 11-005
70
7.8 Acronyms and Abbreviations
Abbreviations Units of Measure
AMG accident management guidelines
abs absolute
AOP abnormal operating procedure
AC Alternating Current
BWR boiling water reactor
Bq Becquerel
EDG emergency diesel generator
C Celsius
EOP emergency operating procedure
cm centimeters
ERC Emergency Response Center
cpm counts per minute
HPCI high pressure coolant injection
DC Direct Current
IAEA International Atomic Energy Association
F Fahrenheit
IC isolation condenser
ft feet
INES International Nuclear and Radiological Event Scale
gal galileo (seismic intensity)
INPO Institute of Nuclear Power Operations
gal gallon (volume)
JANTI Japan Nuclear Technology Institute
gpm gallons per minute
JNES Japan Nuclear Energy Safety Organization
km kilometers
JST Japan Standard Time
kPa kilopascals
M/C metal clad switchgear
kV kilovolts
METI Ministry of Economy, Trade and Industry
lpm liters per minute
MEXT Ministry of Education, Culture, Sports, Science and Technology
MPa Megapascals
MSO main shift operator MWe megawatts electric
NERHQ Nuclear Emergency Response Headquarters
m meters
NISA Nuclear and Industrial Safety Agency
uSv microsievert
NPP nuclear power plant
mm millimeters
NSC Nuclear Safety Commission
mrem millirem
P/C power center
mSv millisievert
PCV primary containment vessel
psi pounds per square inch
RCIC reactor core isolation cooling
psia pounds per square inch absolute
RHR residual heat removal
psig pounds per square inch gauge
RPV reactor pressure vessel
SFP spent fuel pool
SGTS standby gas treatment system
SIM simulator
SLC standby liquid control
SO senior operator SOP standard operating procedure
SRO senior reactor operator
SRV safety relief valve
SS shift supervisor TAF top of active fuel
TEPCO Tokyo Electric Power Company
UHS ultimate heat sink

Unit 1 Validated Event T imeline INPO 11-005
71
8.0 Event Progression and T imeline
8.1 Unit 1 Date Time Unit 1 Actions
11-‐Mar 1446 Ground motion exceeds the setpoint of seismic sensor C. 11-‐Mar 1446 Ground motion exceeds the setpoint of seismic sensor B. 11-‐Mar 1446 Automatic reactor scram signal on seismic trip 11-‐Mar 1447 Plant computer indicates all control rods have fully inserted. 11-‐Mar 1447 Inboard and outboard main steam isolation valves close because of loss of off-‐site power. 11-‐Mar 1447 Automatic turbine trip on high vibration 11-‐Mar 1447 6.9-‐kV bus 1D power loss 11-‐Mar 1447 6.9-‐kV bus 1C power loss 11-‐Mar 1447 EDG 1B starts and loads, energizing the 6.9-‐kV bus 1D; 6.9-‐kV bus 1D power loss clears. 11-‐Mar 1447 EDG 1A starts and loads, energizing the 6.9-‐kV bus 1C; 6.9-‐kV bus 1C power loss clears.
11-‐Mar 1447 Reactor water level initially dropped because of the collapsing steam voids. Reactor water level was within the normal band and the operators did not need to initiate high pressure coolant injection.
11-‐Mar 1452 The reactor mode switch was in shutdown.
11-‐Mar 1452 Both isolation condensers (ICs) started automatically. Reactor pressure vessel (RPV) pressure begins to decrease as cooler water is recirculated through the reactor core from the IC. Reactor water level was in the normal level range, and high pressure coolant injection (HPCI) was not required to control level.
11-‐Mar 1502 The reactor was confirmed subcritical. 11-‐Mar 1503 The operators manually removed the isolation condensers from service.
11-‐Mar 1503 Workers removed the IC from service by closing the cold leg return drywell outboard isolation motor-‐operated valves (MO-‐3A and B). These actions were taken because cooldown rate was exceeding the 100oF/hr (55oC/hr) limit specified in technical specifications.
11-‐Mar 1506 The Headquarters for Major Disaster Countermeasures was established in the TEPCO office in Tokyo to assess damages from the earthquake and recover from the electric outage in TEPCO's service area.
11-‐Mar 1507 Torus cooling and spray were reported in service (1507-‐1510).

Unit 1 Validated Event T imeline INPO 11-005
72
Date Time Unit 1 Actions
11-‐Mar 1510 Operators determined that only one train of IC was needed to control reactor pressure in the 870 and 1,015 psi (6 to 7 MPa). The A IC system was operated by the opening and closing of the motor-‐operated valve (MO-‐3A) to control reactor pressure.
11-‐Mar 1527 The first wave of a series of tsunamis, generated by the earthquake, arrived at the station. 11-‐Mar 1535 The second tsunami hit the station. 11-‐Mar 1537 Loss of all AC power occurs. Instrumentation and emergency systems gradually fail between 1537 and 1550. 11-‐Mar -‐-‐ The loss of DC distribution systems results in the loss of control room indications and alarms. 11-‐Mar -‐-‐ The control room lighting was lost and only emergency lighting remained.
11-‐Mar -‐-‐ The control panel indications for HPCI were barely lit but slowly faded to black. The operators determined HPCI was not operable because indicators on the control panel had gone out.
11-‐Mar -‐-‐ Valve status of IC was lost on the control panel.
11-‐Mar 1542 TEPCO entered its emergency plan because of the loss of all AC power, in accordance with Article 10, paragraph 1 of the Nuclear Disaster Law. Government offices were notified. The corporate Emergency Response Center was established.
11-‐Mar -‐-‐ Flooding caused a loss of the instrumentation power system, resulting in a major loss of control room indications, including the reactor water level indication
11-‐Mar 1636 Operators could not determine reactor water level or the status of injection into the reactor. An emergency was declared because of the loss of emergency core cooling system injection sources, in accordance with Article 15, paragraph 1 of the Nuclear Disaster Law. The appropriate government agencies were notified at 1645.
11-‐Mar -‐-‐
Temporary batteries and cables were gathered and carried to the units 1 and 2 control room. After confirming the wiring layout using drawings, batteries were connected to instrument panels. The top priority was to verify the status of water injection into the RPV, so efforts were focused on connecting batteries to the DC-‐powered reactor water level indicator.
11-‐Mar -‐-‐ The Emergency Response Center (ERC) began reviewing the accident management procedures and checking the vent procedures to determine how to open the containment vent valves without power. Workers in the ERC went through the administration building and retrieved drawings and manuals needed to develop the procedure.
11-‐Mar 1645 Operators were able to determine reactor water level. The emergency associated with the inability to determine reactor water level was cancelled, and the appropriate government agencies were notified at 1655.
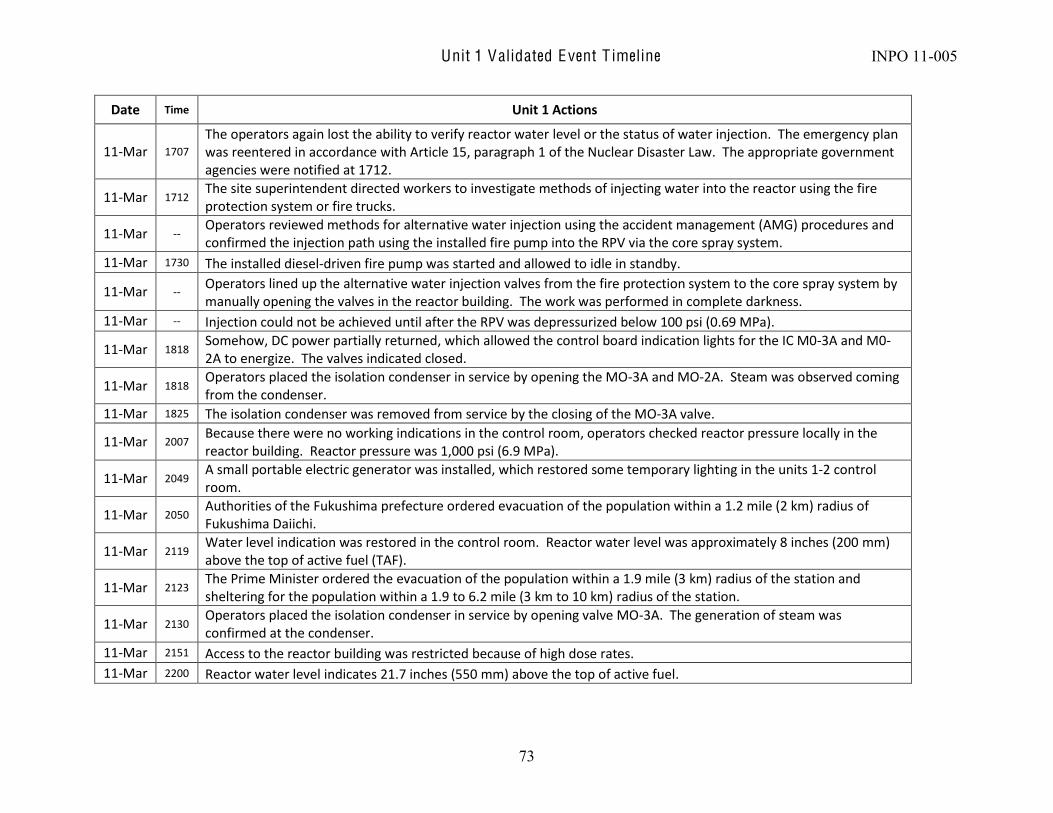
Unit 1 Validated Event T imeline INPO 11-005
73
Date Time Unit 1 Actions
11-‐Mar 1707 The operators again lost the ability to verify reactor water level or the status of water injection. The emergency plan was reentered in accordance with Article 15, paragraph 1 of the Nuclear Disaster Law. The appropriate government agencies were notified at 1712.
11-‐Mar 1712 The site superintendent directed workers to investigate methods of injecting water into the reactor using the fire protection system or fire trucks.
11-‐Mar -‐-‐ Operators reviewed methods for alternative water injection using the accident management (AMG) procedures and confirmed the injection path using the installed fire pump into the RPV via the core spray system.
11-‐Mar 1730 The installed diesel-‐driven fire pump was started and allowed to idle in standby.
11-‐Mar -‐-‐ Operators lined up the alternative water injection valves from the fire protection system to the core spray system by manually opening the valves in the reactor building. The work was performed in complete darkness.
11-‐Mar -‐-‐ Injection could not be achieved until after the RPV was depressurized below 100 psi (0.69 MPa).
11-‐Mar 1818 Somehow, DC power partially returned, which allowed the control board indication lights for the IC M0-‐3A and M0-‐2A to energize. The valves indicated closed.
11-‐Mar 1818 Operators placed the isolation condenser in service by opening the MO-‐3A and MO-‐2A. Steam was observed coming from the condenser.
11-‐Mar 1825 The isolation condenser was removed from service by the closing of the MO-‐3A valve.
11-‐Mar 2007 Because there were no working indications in the control room, operators checked reactor pressure locally in the reactor building. Reactor pressure was 1,000 psi (6.9 MPa).
11-‐Mar 2049 A small portable electric generator was installed, which restored some temporary lighting in the units 1-‐2 control room.
11-‐Mar 2050 Authorities of the Fukushima prefecture ordered evacuation of the population within a 1.2 mile (2 km) radius of Fukushima Daiichi.
11-‐Mar 2119 Water level indication was restored in the control room. Reactor water level was approximately 8 inches (200 mm) above the top of active fuel (TAF).
11-‐Mar 2123 The Prime Minister ordered the evacuation of the population within a 1.9 mile (3 km) radius of the station and sheltering for the population within a 1.9 to 6.2 mile (3 km to 10 km) radius of the station.
11-‐Mar 2130 Operators placed the isolation condenser in service by opening valve MO-‐3A. The generation of steam was confirmed at the condenser.
11-‐Mar 2151 Access to the reactor building was restricted because of high dose rates. 11-‐Mar 2200 Reactor water level indicates 21.7 inches (550 mm) above the top of active fuel.

Unit 1 Validated Event T imeline INPO 11-005
74
Date Time Unit 1 Actions
11-‐Mar 2300 A radiation survey identified dose rates of 120 mrem/hr (1,200 µSv/hr) in front of the reactor building north door on the first floor of the turbine building and 50 mrem/hr (500 µSv/hr) in front of the door to the south. The government authorities were notified at 2340.
11-‐Mar 2350 A restoration team from the ERC connected the temporary generator, used to provide some control room lighting, to the drywell pressure instrument. The indication read 87 psi (600kPa).
12-‐Mar -‐-‐ Late in the evening on March 11 and into the early morning of March 12, power supply vehicles from Tohoku Electric Power Company and TEPCO arrived at the site.
12-‐Mar 0006 The site superintendent directed preparations to vent the primary containment vessel (PCV) because drywell pressure was likely to exceed 87 psi (0.6 MPa).
12-‐Mar -‐-‐ In the control room, operators assembled piping and instrumentation drawings, the accident management procedures, valve drawings, and a white board. The operators began to develop a procedure for venting, including how to manually operate the valves, and the associated sequence.
12-‐Mar 0030 The government confirmed the evacuation of the population within 1.9 miles (3 km) of the station.
12-‐Mar 0049 An emergency declaration was made for an abnormal increase in drywell pressure because drywell pressure was likely to exceed 87 psi (0.6 MPa). The appropriate government agencies were notified at 0055.
12-‐Mar 0130
At approximately 0130, TEPCO officials informed the Prime Minister, Minister of METI, and NISA of their proposal to vent the containment. The Prime Minister, Minister of METI, and the NISA concurred. The TEPCO corporate ERC told the station that at 0300, the Minister of METI and other associations would announce the venting; and that after the announcement, the station should vent.
12-‐Mar 0145 The government reconfirmed the evacuation of the population within 1.9 miles (3 km) of the station.
12-‐Mar 0148
At some point, the installed diesel-‐driven fire pump that was standing by to pump water into the reactor malfunctioned. In an attempt to restart the fire pump, diesel fuel was carried to the pump and the fuel tank was refilled, and batteries stored in an office were carried to the room and installed; but the pump would not start. Workers began considering using fire trucks to supply water to the plant fire protection system.
12-‐Mar -‐-‐ Damage to fire hydrants and leaks from the fire system made it impossible to use filtered water as a water source for the fire engines to supply the RPV. Isolation valves were closed to stop the leaks and maintain water level in the filtered water tanks. The fire protection tank was confirmed available for use as a water source.
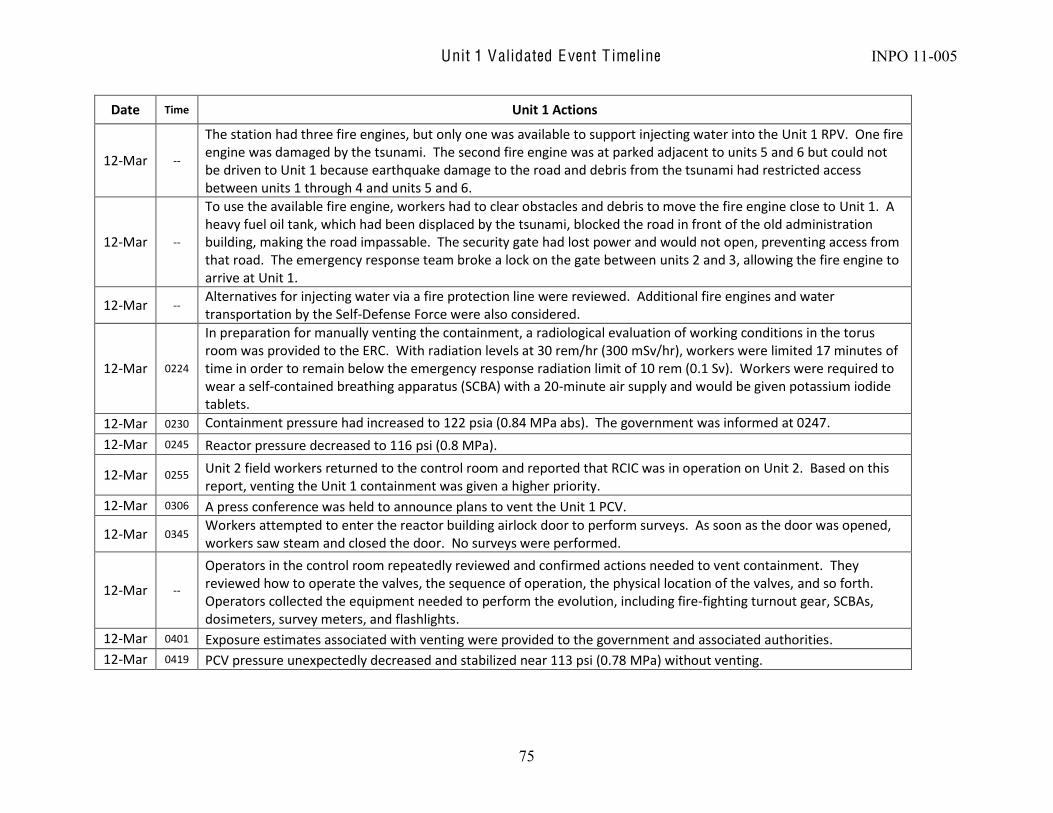
Unit 1 Validated Event T imeline INPO 11-005
75
Date Time Unit 1 Actions
12-‐Mar -‐-‐
The station had three fire engines, but only one was available to support injecting water into the Unit 1 RPV. One fire engine was damaged by the tsunami. The second fire engine was at parked adjacent to units 5 and 6 but could not be driven to Unit 1 because earthquake damage to the road and debris from the tsunami had restricted access between units 1 through 4 and units 5 and 6.
12-‐Mar -‐-‐
To use the available fire engine, workers had to clear obstacles and debris to move the fire engine close to Unit 1. A heavy fuel oil tank, which had been displaced by the tsunami, blocked the road in front of the old administration building, making the road impassable. The security gate had lost power and would not open, preventing access from that road. The emergency response team broke a lock on the gate between units 2 and 3, allowing the fire engine to arrive at Unit 1.
12-‐Mar -‐-‐ Alternatives for injecting water via a fire protection line were reviewed. Additional fire engines and water transportation by the Self-‐Defense Force were also considered.
12-‐Mar 0224
In preparation for manually venting the containment, a radiological evaluation of working conditions in the torus room was provided to the ERC. With radiation levels at 30 rem/hr (300 mSv/hr), workers were limited 17 minutes of time in order to remain below the emergency response radiation limit of 10 rem (0.1 Sv). Workers were required to wear a self-‐contained breathing apparatus (SCBA) with a 20-‐minute air supply and would be given potassium iodide tablets.
12-‐Mar 0230 Containment pressure had increased to 122 psia (0.84 MPa abs). The government was informed at 0247.
12-‐Mar 0245 Reactor pressure decreased to 116 psi (0.8 MPa).
12-‐Mar 0255 Unit 2 field workers returned to the control room and reported that RCIC was in operation on Unit 2. Based on this report, venting the Unit 1 containment was given a higher priority.
12-‐Mar 0306 A press conference was held to announce plans to vent the Unit 1 PCV.
12-‐Mar 0345 Workers attempted to enter the reactor building airlock door to perform surveys. As soon as the door was opened, workers saw steam and closed the door. No surveys were performed.
12-‐Mar -‐-‐
Operators in the control room repeatedly reviewed and confirmed actions needed to vent containment. They reviewed how to operate the valves, the sequence of operation, the physical location of the valves, and so forth. Operators collected the equipment needed to perform the evolution, including fire-‐fighting turnout gear, SCBAs, dosimeters, survey meters, and flashlights.
12-‐Mar 0401 Exposure estimates associated with venting were provided to the government and associated authorities. 12-‐Mar 0419 PCV pressure unexpectedly decreased and stabilized near 113 psi (0.78 MPa) without venting.
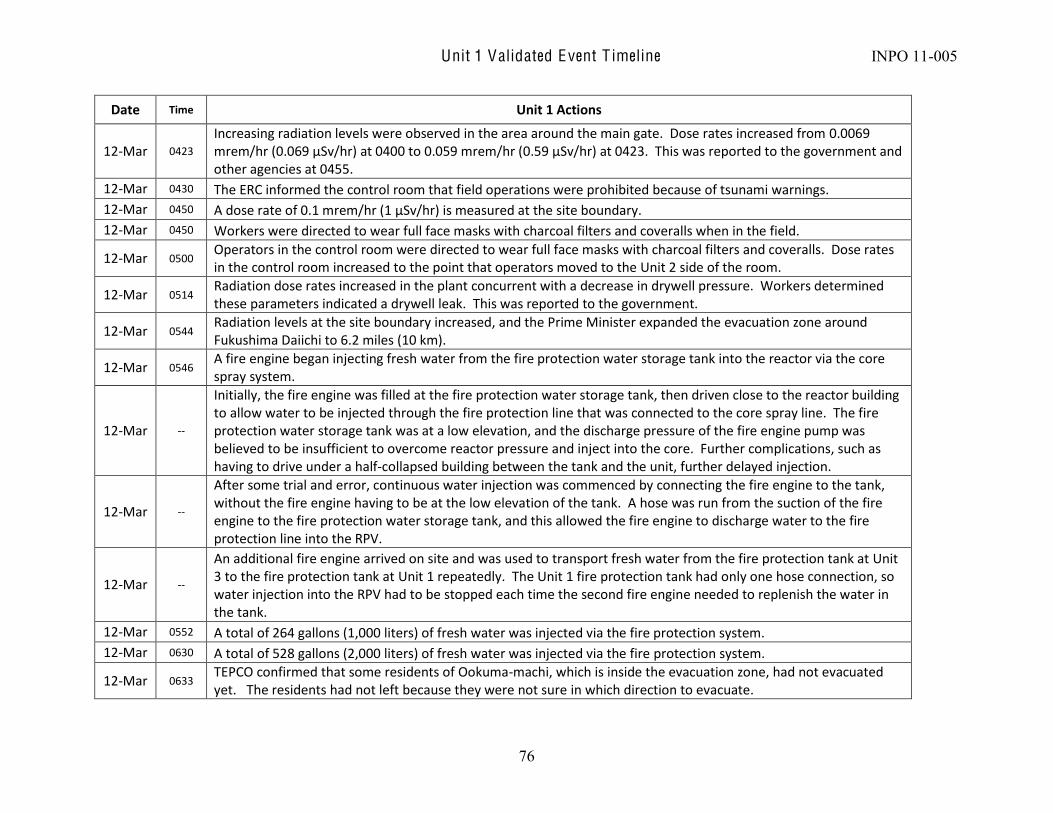
Unit 1 Validated Event T imeline INPO 11-005
76
Date Time Unit 1 Actions
12-‐Mar 0423 Increasing radiation levels were observed in the area around the main gate. Dose rates increased from 0.0069 mrem/hr (0.069 µSv/hr) at 0400 to 0.059 mrem/hr (0.59 µSv/hr) at 0423. This was reported to the government and other agencies at 0455.
12-‐Mar 0430 The ERC informed the control room that field operations were prohibited because of tsunami warnings. 12-‐Mar 0450 A dose rate of 0.1 mrem/hr (1 µSv/hr) is measured at the site boundary. 12-‐Mar 0450 Workers were directed to wear full face masks with charcoal filters and coveralls when in the field.
12-‐Mar 0500 Operators in the control room were directed to wear full face masks with charcoal filters and coveralls. Dose rates in the control room increased to the point that operators moved to the Unit 2 side of the room.
12-‐Mar 0514 Radiation dose rates increased in the plant concurrent with a decrease in drywell pressure. Workers determined these parameters indicated a drywell leak. This was reported to the government.
12-‐Mar 0544 Radiation levels at the site boundary increased, and the Prime Minister expanded the evacuation zone around Fukushima Daiichi to 6.2 miles (10 km).
12-‐Mar 0546 A fire engine began injecting fresh water from the fire protection water storage tank into the reactor via the core spray system.
12-‐Mar -‐-‐
Initially, the fire engine was filled at the fire protection water storage tank, then driven close to the reactor building to allow water to be injected through the fire protection line that was connected to the core spray line. The fire protection water storage tank was at a low elevation, and the discharge pressure of the fire engine pump was believed to be insufficient to overcome reactor pressure and inject into the core. Further complications, such as having to drive under a half-‐collapsed building between the tank and the unit, further delayed injection.
12-‐Mar -‐-‐
After some trial and error, continuous water injection was commenced by connecting the fire engine to the tank, without the fire engine having to be at the low elevation of the tank. A hose was run from the suction of the fire engine to the fire protection water storage tank, and this allowed the fire engine to discharge water to the fire protection line into the RPV.
12-‐Mar -‐-‐
An additional fire engine arrived on site and was used to transport fresh water from the fire protection tank at Unit 3 to the fire protection tank at Unit 1 repeatedly. The Unit 1 fire protection tank had only one hose connection, so water injection into the RPV had to be stopped each time the second fire engine needed to replenish the water in the tank.
12-‐Mar 0552 A total of 264 gallons (1,000 liters) of fresh water was injected via the fire protection system. 12-‐Mar 0630 A total of 528 gallons (2,000 liters) of fresh water was injected via the fire protection system.
12-‐Mar 0633 TEPCO confirmed that some residents of Ookuma-‐machi, which is inside the evacuation zone, had not evacuated yet. The residents had not left because they were not sure in which direction to evacuate.

Unit 1 Validated Event T imeline INPO 11-005
77
Date Time Unit 1 Actions
12-‐Mar 0650 The Minister of Economy, Trade and Industry ordered venting of units 1 and 2 containment in accordance with the Act on Special Measures Concerning Nuclear Emergency Preparedness.
12-‐Mar 0711 The Prime Minister arrived at the station. 12-‐Mar 0755 A total of 793 gallons (3,000 liters) of fresh water was injected via the fire protection system.
12-‐Mar 0755 The lowest indicated reactor water level decreased to the top of active fuel (TAF) (indicating level was higher than actual level).
12-‐Mar 0803 The site superintendent directed venting to start at 0900. 12-‐Mar 0804 The Prime Minister left the station. 12-‐Mar 0815 A total of 1,057 gallons (4,000 liters) of fresh water was injected via the fire protection system.
12-‐Mar 0827 A TEPCO employee who had been dispatched to check the status of evacuations reported that the evacuation of Ookuma-‐machi was not yet completed.
12-‐Mar 0830 A total of 1,321 gallons (5,000 liters) of fresh water was injected via the fire protection system.
12-‐Mar 0837 The Fukushima Prefectural government was informed that venting would start at approximately 0900. Venting was being coordinated to ensure the evacuation was completed prior to venting commencing.
12-‐Mar 0903 Evacuations south of the plant (Ookuma-‐machii) were confirmed as completed.
12-‐Mar -‐-‐
The control room operators formed three teams to perform the venting, with two operators on each team (one to perform actions and the other to assist by holding flashlights and monitoring dose rates and for other safety concerns, such as ongoing aftershocks). Because there was no means of communicating with the field teams, the decision was made to dispatch one team at a time, with the next team leaving only after the preceding team returned.
12-‐Mar 0904 The first team of operators was dispatched to open the motor-‐operated containment vent valve. 12-‐Mar 0905 Venting of Unit 1 containment was announced to the press. 12-‐Mar 0915 A total of 1,585 gallons (6,000 liters) of fresh water was injected via the fire protection system.
12-‐Mar 0915 At approximately 0915, operators opened the motor-‐operated containment vent valve approximately 25 percent, as directed by the procedure. The two operators involved each received a dose of 2.5 rem (25 mSv).
12-‐Mar 0924 The second team of operators left the control room to open the torus vent valve.
12-‐Mar 0930
The second team of operators was unsuccessful in the attempt to manually open the suppression chamber air-‐operated vent valve. The operators entered the torus room but had to turn back because they expected they would exceed their 10 rem (100 mSv) dose limit.
12-‐Mar 0940 A total of 5,548 gallons (21,000 liters) of fresh water was injected via the fire protection system.
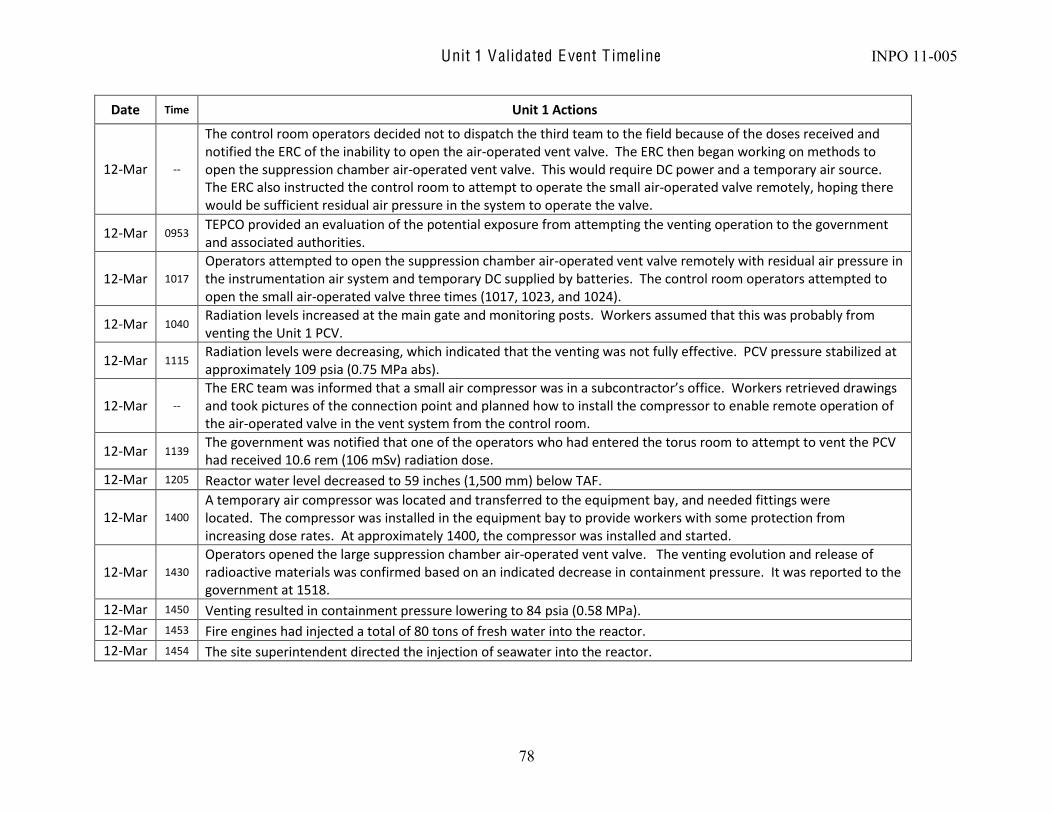
Unit 1 Validated Event T imeline INPO 11-005
78
Date Time Unit 1 Actions
12-‐Mar -‐-‐
The control room operators decided not to dispatch the third team to the field because of the doses received and notified the ERC of the inability to open the air-‐operated vent valve. The ERC then began working on methods to open the suppression chamber air-‐operated vent valve. This would require DC power and a temporary air source. The ERC also instructed the control room to attempt to operate the small air-‐operated valve remotely, hoping there would be sufficient residual air pressure in the system to operate the valve.
12-‐Mar 0953 TEPCO provided an evaluation of the potential exposure from attempting the venting operation to the government and associated authorities.
12-‐Mar 1017 Operators attempted to open the suppression chamber air-‐operated vent valve remotely with residual air pressure in the instrumentation air system and temporary DC supplied by batteries. The control room operators attempted to open the small air-‐operated valve three times (1017, 1023, and 1024).
12-‐Mar 1040 Radiation levels increased at the main gate and monitoring posts. Workers assumed that this was probably from venting the Unit 1 PCV.
12-‐Mar 1115 Radiation levels were decreasing, which indicated that the venting was not fully effective. PCV pressure stabilized at approximately 109 psia (0.75 MPa abs).
12-‐Mar -‐-‐ and took pictures of the connection point and planned how to install the compressor to enable remote operation of the air-‐operated valve in the vent system from the control room.
12-‐Mar 1139 The government was notified that one of the operators who had entered the torus room to attempt to vent the PCV had received 10.6 rem (106 mSv) radiation dose.
12-‐Mar 1205 Reactor water level decreased to 59 inches (1,500 mm) below TAF.
12-‐Mar 1400 A temporary air compressor was located and transferred to the equipment bay, and needed fittings were located. The compressor was installed in the equipment bay to provide workers with some protection from increasing dose rates. At approximately 1400, the compressor was installed and started.
12-‐Mar 1430 Operators opened the large suppression chamber air-‐operated vent valve. The venting evolution and release of radioactive materials was confirmed based on an indicated decrease in containment pressure. It was reported to the government at 1518.
12-‐Mar 1450 Venting resulted in containment pressure lowering to 84 psia (0.58 MPa). 12-‐Mar 1453 Fire engines had injected a total of 80 tons of fresh water into the reactor. 12-‐Mar 1454 The site superintendent directed the injection of seawater into the reactor.

Unit 1 Validated Event T imeline INPO 11-005
79
Date Time Unit 1 Actions
12-‐Mar -‐-‐ The Unit 1 fire protection tank was running out of water. Water transfers from other tanks continued, and work to pump seawater into the reactors commenced.
12-‐Mar -‐-‐ Workers began using a main condenser backwash valve pit, which flooded during the tsunami, as a water source to supply the fire pumps. The pit was closer to the units and at a higher elevation than the sea, making injection easier. Three fire engines were connected in series to increase the discharge pressure.
12-‐Mar 1518 The government was informed that the standby liquid control system was being recovered to allow borated water to be injected into the reactor as soon as the system was operable. Seawater injection into the reactor through the fire protection piping was also planned to start as soon as the lineup was competed and power was available.
12-‐Mar apx 1530
Work to provide temporary power from a mobile generator to the Unit 2 standby liquid control system was completed.
12-‐Mar 1536 A hydrogen explosion occurred in the reactor building (secondary containment).
12-‐Mar 1536
The explosion caused extensive damage to the reactor building and injured five workers. Debris ejected by the explosion damaged the temporary power cables, along with one of the large portable generators. The temporary power supply for the standby liquid control system and the hoses that had been staged for seawater injection were damaged beyond use. Although the fire engines were damaged, they were still usable. The injured workers were carried to safety. Station workers, including the personnel working on the standby liquid control system and laying temporary power cables, had to evacuate for an accountability. The area surrounding Unit 1 was strewn with highly radioactive debris, so cleanup required support from radiation protection personnel.
12-‐Mar 1627 Radiation dose rates at the monitoring post reached 101.5 mrem/hr (1,015 µSv/hr), which exceeded the 50 mrem/hr (500 µSv/hr) limit specified in Article 15, clause 1 of the Act on Special Measures Concerning Nuclear Emergency Preparedness (abnormal increase in radiation dose at the site boundary). This was reported to the authorities.
12-‐Mar 1720 Workers began inspecting the condition of fire trucks, buildings, and other facilities following the explosion.
12-‐Mar 1825 The Prime Minister ordered the population within 12.4 mile (20 km) radius of Fukushima Daiichi Nuclear Power Station to evacuate.
12-‐Mar 1830 Field inspections revealed the area around the units was littered with debris, and the equipment that had been staged to provide power to the standby liquid control system and hoses staged to inject seawater had been damaged and were no longer usable.
12-‐Mar 1904 The injection of nonborated seawater into the reactor commenced using the fire engines.
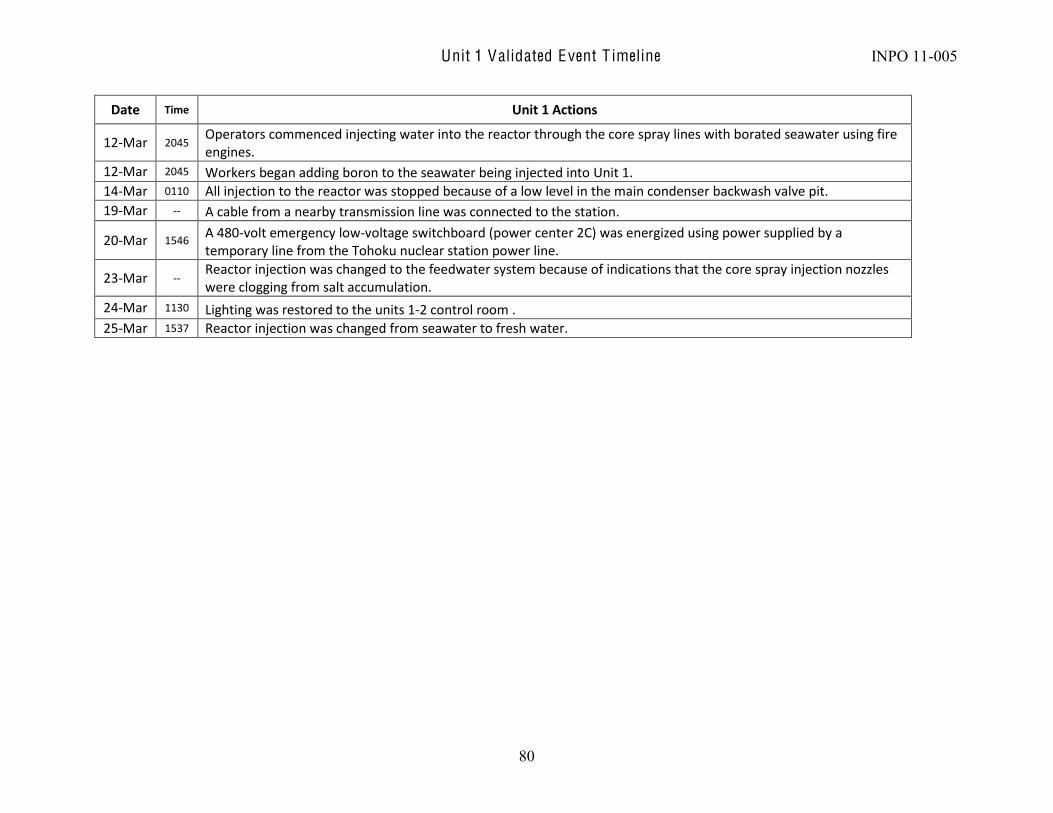
Unit 1 Validated Event T imeline INPO 11-005
80
Date Time Unit 1 Actions
12-‐Mar 2045 Operators commenced injecting water into the reactor through the core spray lines with borated seawater using fire engines.
12-‐Mar 2045 Workers began adding boron to the seawater being injected into Unit 1. 14-‐Mar 0110 All injection to the reactor was stopped because of a low level in the main condenser backwash valve pit. 19-‐Mar -‐-‐ A cable from a nearby transmission line was connected to the station.
20-‐Mar 1546 A 480-‐volt emergency low-‐voltage switchboard (power center 2C) was energized using power supplied by a temporary line from the Tohoku nuclear station power line.
23-‐Mar -‐-‐ Reactor injection was changed to the feedwater system because of indications that the core spray injection nozzles were clogging from salt accumulation.
24-‐Mar 1130 Lighting was restored to the units 1-‐2 control room . 25-‐Mar 1537 Reactor injection was changed from seawater to fresh water.

Unit 2 Validated Event T imeline INPO 11-005
81
8.2 Unit 2 Date Time Unit 2 Actions
11-‐Mar 1446 Earthquake causes seismic motion in excess of the reactor protection system scram setpoints. A level 3 state of emergency was automatically declared for the earthquake.
11-‐Mar 1447 Automatic reactor scram signal on seismic trip 11-‐Mar 1447 The main turbine automatically tripped. 11-‐Mar 1447 Emergency diesel generators started and loaded. 11-‐Mar 1450 Operators start reactor core isolation cooling (RCIC) to control reactor water level and pressure. 11-‐Mar 1451 RCIC automatically tripped due to high reactor water level. 11-‐Mar 1501 Operators confirmed the reactor was subcritical. 11-‐Mar 1502 Operators manually started RCIC.
11-‐Mar 1506 The Headquarters for Major Disaster Countermeasures was established in the TEPCO office in Tokyo to assess damages from the earthquake and recover from the electric outage in TEPCO's service area.
11-‐Mar 1507 Torus cooling was placed in service.
11-‐Mar 1525 Torus spray was placed in service. 11-‐Mar 1527 The first wave of a series of tsunamis, generated by the earthquake, arrived at the station. 11-‐Mar 1528 RCIC automatically tripped on high reactor water level. 11-‐Mar 1535 The second tsunami hit the station. 11-‐Mar 1539 Operators manually restarted RCIC. 11-‐Mar 1541 A loss of all AC power occurs.
11-‐Mar -‐-‐ Lighting and indications were lost as AC and DC power systems failed. Control room lighting, including emergency lighting, failed, leaving the control room completely dark.
11-‐Mar 1542 TEPCO entered its emergency plan because of the loss of all AC power, in accordance with Article 10, paragraph 1 of the Nuclear Disaster Law. Government offices were notified. The corporate Emergency Response Center was established.
11-‐Mar -‐-‐ Flooding caused a loss of the instrumentation power system, resulting in a major loss of control board instrumentation, including reactor water level. The operating status of RCIC was unknown because of the control board instrumentation loss.

Unit 2 Validated Event T imeline INPO 11-005
82
Date Time Unit 2 Actions
11-‐Mar -‐-‐ Inspections revealed that switchyard breaker damage would prevent off-‐site power from being restored soon. Diesel generators were not operable and restoration was difficult because either the engines or the associated switchgear were submerged. It was concluded that power restoration using power supply vehicles was necessary.
11-‐Mar -‐-‐
Although high-‐ and low-‐voltage power supply vehicles headed to Fukushima Daiichi, they were not able to drive to the site quickly because of traffic and damaged roads. TEPCO considered transporting the power supply vehicles using helicopters, but the power supply vehicles weighed too much. TEPCO requested that the Tohoku Electric Power Company dispatch power supply vehicles to Fukushima Daiichi.
11-‐Mar -‐-‐
Visual inspections and insulation resistance tests were performed on metal clad switchgear (M/C) and power centers (P/Cs) to determine the extent of the damage from the tsunami. All of the Unit 1 and Unit 3 M/C and P/Cs were inoperable. At Unit 2, all of the M/C and some of the P/Cs at were inoperable. Later, it was confirmed four of seven P/Cs were operable.
11-‐Mar -‐-‐ TEPCO decided to connect a power supply vehicle to the primary side of a Unit 2 power transformer (6.9-‐kV/480V) to provide 480 volts to energize the control rod drive and standby liquid control pumps. Considering the distance to the P/C of Unit 2 and the ability to run cables, the power supply vehicle was driven to the side of the Unit 2 turbine building.
11-‐Mar 1636 TEPCO again entered the emergency plan in accordance with Article 15, paragraph 1 of the Nuclear Disaster Law because operators concluded they could not determine reactor water level and the status of injection into the reactor. The government was notified at 1645.
11-‐Mar -‐-‐ Temporary batteries and cables were gathered and carried to the units 1-‐2 control room. After confirming the wiring layout using drawings, batteries were connected to instrument panels. The top priority was to verify the status of water injection into the RPV, so efforts were focused on connecting batteries to the DC-‐powered reactor water level indicator.
11-‐Mar 1712 The site superintendent directed workers to investigate methods of injecting water into the reactor using the fire protection system or fire trucks.
11-‐Mar -‐-‐ Operators reviewed methods for alternative water injection using the accident management (AMG) procedures and confirmed the injection path using the installed fire pump into the RPV via the core spray system.
11-‐Mar -‐-‐
Operators established an alternative water injection flow path via the residual heat removal system by manually opening valves in the turbine and reactor building to establish an injection path after the reactor pressure decreased to 100 psi (0.69 MPa). This was done before the reactor was depressurized so the valves would be in the proper position should dose rates increase and access become difficult.
11-‐Mar 2049 A small portable electric generator was installed, which restored some temporary lighting in the units 1-‐2 control room.

Unit 2 Validated Event T imeline INPO 11-005
83
Date Time Unit 2 Actions
11-‐Mar 2050 The Fukushima Prefecture ordered evacuation of the population within 1.2 mile (2 km) radius of the station.
11-‐Mar 2102 Operators did not have reactor water level indication in the control room and were unable to verify the injection of water into the reactor using RCIC. The operators notified the government of the potential for water level to lower to the top of active fuel (TAF).
11-‐Mar 2113 The government was notified that reactor water level was estimated to reach TAF at 2140.
11-‐Mar 2123 The Prime Minister ordered the evacuation of inhabitants within a 1.9 mile (3 km) radius of the station and sheltering for those within a 1.9 to 6.2 mile (3 to 10 km) radius.
11-‐Mar 2150 Water level indication was restored in the control room; level indicated 134 inches (3,400 mm) above TAF.
11-‐Mar -‐-‐ Late in the evening of March 11 and into the early morning of March 12, power supply vehicles from Tohoku Electric Power Company and TEPCO arrived at the site.
11-‐Mar -‐-‐ TEPCO's power supply vehicles were given priority for connecting cables. 11-‐Mar 2325 Drywell pressure indication was restored, and indicated pressure was 20 psia (0.141 MPa).
12-‐Mar -‐-‐
Operators reviewed valve drawings to determine if they could open the valves required for venting manually, or whether they would need to attach some type of actuator to force the valve open. Based on their reviews of the piping and instrumentation diagrams, accident management procedures, and the vent operating procedure, the operators developed a method for venting Unit 2. The motor-‐operated valve could be opened manually, but the suppression chamber air-‐operated vent valve could not. The operators prepared a venting procedure and reviewed the locations of the vent valves.
12-‐Mar 0030 The government confirmed the evacuation of the population within 1.9 miles (3 km) was completed.
12-‐Mar -‐-‐
Wearing breathing protection and boots, workers attempted to verify the condition of RCIC, but field conditions made this very difficult. Work that would normally take approximately 10 minutes required more than one hour to complete. At around 0100, operators went to the RCIC room. The room was dark, and the water level in the room came nearly to the top of the workers boots , so they turned back without getting close enough to check system operation. However, they could hear faint metallic sounds, indicating the system was operating. Because of the lack of communications methods, the workers had to return to the control room to report their findings.
12-‐Mar 0130 At approximately 0130, TEPCO officials informed the Prime Minister, Minister of METI, and NISA of their proposal to vent the containment. Concurrence was received from the agencies.
12-‐Mar 0145 The government confirmed the evacuation of the population within 1.9 miles (3 km) was completed.

Unit 2 Validated Event T imeline INPO 11-005
84
Date Time Unit 2 Actions
12-‐Mar 0200
At around 0200, workers made another attempt to verify RCIC operation. This time, water flooding in the RCIC room had increased, and workers could not enter the room. On this attempt, workers checked reactor pressure and RCIC pump discharge pressure on an instrument rack in the reactor building. RCIC pump discharge pressure was high, so workers concluded RCIC was operating.
12-‐Mar 0255
Field workers returned to the control room to report that RCIC was in operation on Unit 2. The control room operators forwarded this information to the Emergency Response Center. Based on this report, venting of the Unit 1 containment was given a higher priority. The operators proceeded with the lineup to vent Unit 1 and, at the same time, monitored parameters on Unit 2.
12-‐Mar 0306 A press conference was held to announce plans to vent the PCV. 12-‐Mar 0333 An evaluation of the potential off-‐site exposure from venting was provided to the government.
12-‐Mar 0423 Increasing radiation levels were observed in the area around the main gate. Dose rates increased from 0.0069 mrem/hr (0.069 µSv/hr) at 0400 to 0.059 mrem/hr (0.59 µSv/hr) at 0423. The government and associated authorities were notified at 0455.
12-‐Mar apx. 0500
Operators in the control room were directed to wear full face masks with charcoal filters and coveralls. Dose rates in the control room increased to the point that Unit 1 operators moved to the Unit 2 side of the control room.
12-‐Mar 0544 The Prime Minister ordered evacuation of the population out to 6.2 miles (10 km) from the station.
12-‐Mar 0650 The Minister of Economy, Trade and Industry ordered venting of units 1 and 2 containment in accordance with the Act on Special Measures Concerning Nuclear Emergency Preparedness.
12-‐Mar 0711 The Prime Minister arrived at Fukushima Daiichi Nuclear Power Station. 12-‐Mar 0804 The Prime Minister departed Fukushima Daiichi Nuclear Power Station.
12-‐Mar -‐-‐
The cable was more than 4 inches (10 cm) in diameter; about 656 feet (200 meters) long, and weighed more than 1 ton. Laying this kind of cable usually takes days using machinery, but 40 TEPCO personnel laid the cable in four to five hours by hand. It was very difficult work because of extremely bad working conditions, such as darkness, flooding from the tsunami, debris, and lost manhole covers. It was challenging to locate cable penetrations in the dark, and some doors needed to be destroyed to route the cable. Earthquake aftershocks and recurring tsunami warnings caused work to be interrupted periodically.
12-‐Mar -‐-‐ Work to connect the cable to the power center was performed by several engineers, and the job took several hours.
12-‐Mar -‐-‐ The lack of power challenged communications, causing workers to have to walk to communicate, which was very time-‐consuming.

Unit 2 Validated Event T imeline INPO 11-005
85
Date Time Unit 2 Actions
12-‐Mar 1530 The primary side of the power cabinet was connected to the temporary cable, completing the lineup for temporary power to standby liquid control.
12-‐Mar 1536 An explosion occurred inside the Unit 1 reactor building, resulting in a large amount of flying debris. The temporary cables, generators, and hoses that had been staged for injecting seawater were damaged. Workers had to evacuate to the Emergency Response Center.
12-‐Mar 1627 The radiation dose rate at the monitoring post reached 101.5 mrem/hr (1.015 mSv/hr), which exceeded the 50 mrem/hr (500 µSv/hr) limit specified in Article 15, paragraph 1 of the Nuclear Disaster Law, indicating an abnormal increase in radiation dose at the site boundary. This was reported to the authorities.
12-‐Mar 1730 The site superintendent ordered preparations to begin for venting the containment.
12-‐Mar -‐-‐
RCIC injection continued, and drywell pressure was stable at 29 44 psia (200-‐300 kPa abs.). Knowing that venting would be required eventually, operators commenced preparations for lining up to vent the Unit 2 and Unit 3 containments. Operators planned to manually open the vent valves (other than the rupture disk) because the dose in the field was currently low.
12-‐Mar 1825 The Prime Minister ordered the evacuation of the population within a 12.4 mile (20 km) radius of Fukushima Daiichi.
13-‐Mar 0810 The shift supervisor, wearing a self-‐contained breathing apparatus (SCBA) and protective equipment, opened the motor-‐operated containment vent valve 25 percent in accordance with the procedure. Containment pressure was 50.8 psia (0.35 MPa abs).
13-‐Mar 0856 The dose rate measured 88.2 mrem/hr (882 µSv/h) at the monitoring post, exceeding the 50 mrem/hr (500 µSv/hr) limit specified in Article 15, paragraph 1 of the Nuclear Disaster Law, indicating an abnormal increase in radiation dose at the site boundary. This was reported to the authorities at 0901.
13-‐Mar 1015 The site superintendent ordered operators to vent the containment. 13-‐Mar 1035 Drywell pressure indicated 1.45 psia (0.010 MPa abs).
13-‐Mar 1100 Using the small generator installed for the temporary lighting in the control room as a power source, operators opened the large suppression chamber air-‐operated vent valve. The vent lineup was completed, but the rupture disk remained intact because drywell pressure remained below the 62 psig (427 kPa gauge) rupture pressure of the disk.
13-‐Mar 1120 A press release was made to announce venting the Unit 2 containment. 13-‐Mar 1205 The site superintendent ordered preparations for injecting seawater into the reactor.

Unit 2 Validated Event T imeline INPO 11-005
86
Date Time Unit 2 Actions
13-‐Mar 1415 The dose rate measured 90.5 mrem/hr (905 µSv/h) at the monitoring post, exceeding the 50 mrem/hr (500 µSv/hr) limit specified in Article 15, paragraph 1 of the Nuclear Disaster Law, indicating an abnormal increase in radiation dose at the site boundary. This was reported to the authorities at 1423.
13-‐Mar 1518 The projected off-‐site dose associated with venting was reported to the authorities.
14-‐Mar 0220 The dose rate measured 75.1 mrem/hr (751 µSv/hr) at the monitoring post, exceeding the 50 mrem/hr (500 µSv/hr) limit specified in Article 15, paragraph 1 of Nuclear Disaster Law, indicating an abnormal increase in radiation dose at the site boundary. This was reported to the authorities at 0424.
14-‐Mar 0240 The dose rate measured 65 mrem/hr (650 µSv/hr) at the monitoring post, exceeding the 50 mrem/hr (500 µSv/hr) limit specified in Article 15, paragraph 1 of the Nuclear Disaster Law, indicating an abnormal increase in radiation dose at the site boundary. This was reported to the authorities at 0537.
14-‐Mar 0400 The dose rate measured 82 mrem/hr (820 µSv/hr) at the monitoring post, exceeding the 50 mrem/hr (500 µSv/hr) limit specified in Article 15, paragraph 1 of the Nuclear Disaster Law, indicating an abnormal increase in radiation dose at the site boundary. This was reported to the authorities at 0800.
14-‐Mar 0912 The dose rate measured 51.9 mrem/hr (518.7 µSv/hr) at the monitoring post, exceeding the 50 mrem/hr (500 µSv/hr) limit specified in Article 15, paragraph 1 of the Nuclear Disaster Law, indicating an abnormal increase in radiation dose at the site boundary. This was reported to the authorities at 0934.
14-‐Mar 1101 The Unit 3 reactor building exploded. 14-‐Mar -‐-‐ The explosion damaged the fire engine and hoses that had been staged to inject seawater into the reactor.
14-‐Mar -‐-‐ The explosion knocked the power supply loose from the solenoid for the control air valve to the suppression chamber large air-‐operated vent valve, and the valve closed. The venting lineup had to be performed again.
14-‐Mar -‐-‐ After the explosion, all workers except the shift workers in the control room were evacuated to the Emergency Response Center. The status of the work in the field had to be confirmed and resumption of work was delayed.
14-‐Mar 1130 Containment pressure was stable around 65.3 psia (450 kPa abs) to 66.7 psia (460 kPa abs), stable below the pressure needed to open the rupture disk.
14-‐Mar -‐-‐
Shortly after 1200, a site survey confirmed scattered contaminated rubble and equipment damage caused by the Unit 3 explosion. A decision was made to change the water supply and draw a suction directly from the shallow draft quay (harbor) instead of the main condenser backwash valve pit of Unit 3, which was now covered with contaminated debris. In the high radiation environment surrounded by scattered rubble, personnel prepared a new water injection line by using available fire engines and hose pipes.
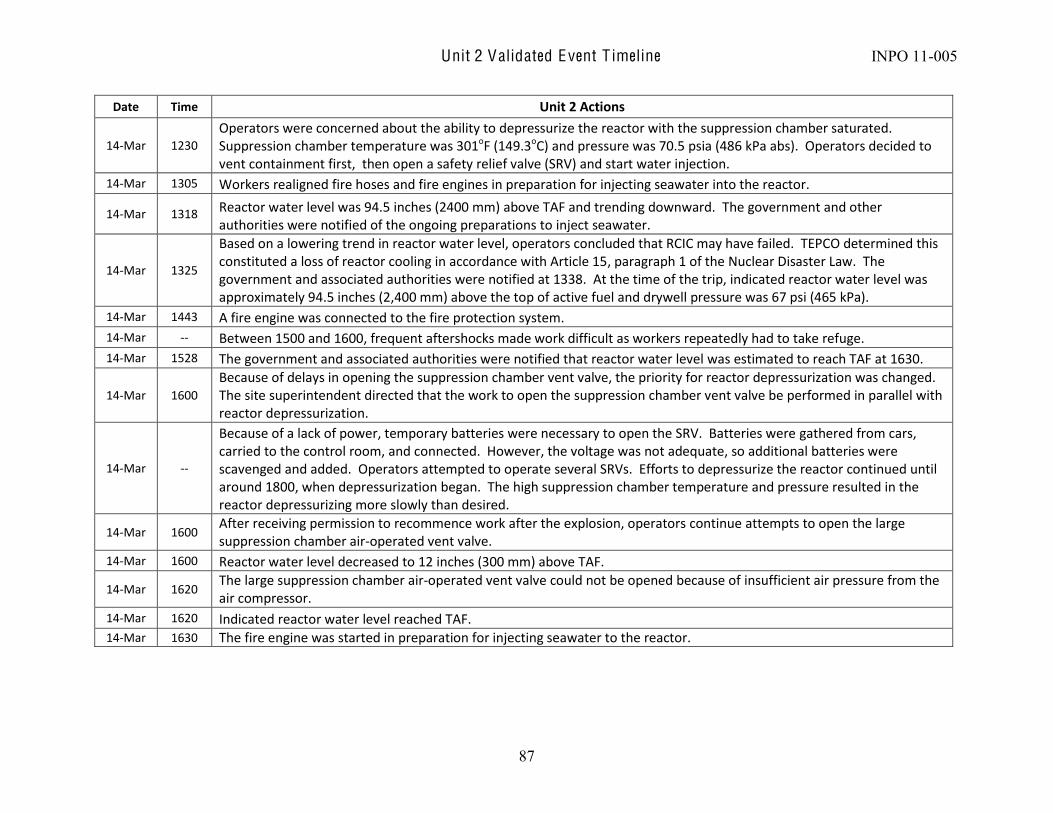
Unit 2 Validated Event T imeline INPO 11-005
87
Date Time Unit 2 Actions
14-‐Mar 1230 Operators were concerned about the ability to depressurize the reactor with the suppression chamber saturated. Suppression chamber temperature was 301oF (149.3oC) and pressure was 70.5 psia (486 kPa abs). Operators decided to vent containment first, then open a safety relief valve (SRV) and start water injection.
14-‐Mar 1305 Workers realigned fire hoses and fire engines in preparation for injecting seawater into the reactor.
14-‐Mar 1318 Reactor water level was 94.5 inches (2400 mm) above TAF and trending downward. The government and other authorities were notified of the ongoing preparations to inject seawater.
14-‐Mar 1325
Based on a lowering trend in reactor water level, operators concluded that RCIC may have failed. TEPCO determined this constituted a loss of reactor cooling in accordance with Article 15, paragraph 1 of the Nuclear Disaster Law. The government and associated authorities were notified at 1338. At the time of the trip, indicated reactor water level was approximately 94.5 inches (2,400 mm) above the top of active fuel and drywell pressure was 67 psi (465 kPa).
14-‐Mar 1443 A fire engine was connected to the fire protection system. 14-‐Mar -‐-‐ Between 1500 and 1600, frequent aftershocks made work difficult as workers repeatedly had to take refuge. 14-‐Mar 1528 The government and associated authorities were notified that reactor water level was estimated to reach TAF at 1630.
14-‐Mar 1600 Because of delays in opening the suppression chamber vent valve, the priority for reactor depressurization was changed. The site superintendent directed that the work to open the suppression chamber vent valve be performed in parallel with reactor depressurization.
14-‐Mar -‐-‐
Because of a lack of power, temporary batteries were necessary to open the SRV. Batteries were gathered from cars, carried to the control room, and connected. However, the voltage was not adequate, so additional batteries were scavenged and added. Operators attempted to operate several SRVs. Efforts to depressurize the reactor continued until around 1800, when depressurization began. The high suppression chamber temperature and pressure resulted in the reactor depressurizing more slowly than desired.
14-‐Mar 1600 After receiving permission to recommence work after the explosion, operators continue attempts to open the large suppression chamber air-‐operated vent valve.
14-‐Mar 1600 Reactor water level decreased to 12 inches (300 mm) above TAF.
14-‐Mar 1620 The large suppression chamber air-‐operated vent valve could not be opened because of insufficient air pressure from the air compressor.
14-‐Mar 1620 Indicated reactor water level reached TAF. 14-‐Mar 1630 The fire engine was started in preparation for injecting seawater to the reactor.

Unit 2 Validated Event T imeline INPO 11-005
88
Date Time Unit 2 Actions
14-‐Mar 1634 The government and associated authorities were notified that in addition to the start of reactor depressurization, seawater injection would commence using the fire protection system. Reactor pressure was 1,015 psi (6.998 MPa).
14-‐Mar 1717 Reactor water level decreased to TAF. This was reported to the authorities at 1725. 14-‐Mar 1800 Reactor pressure was 1,035 psig (7.133 MPa gauge).
14-‐Mar apx. 1800 At approximately 1800, operators opened an SRV and began depressurizing the reactor.
14-‐Mar 1803 Reactor pressure was 881 psig (6.075 MPa gauge).
14-‐Mar 1822 Reactor water level lowered to 146 inches (3,700 mm) below TAF, the bottom of the indicating range, indicating the core was completely uncovered. This was reported to the authorities at 1932.
14-‐Mar -‐-‐
Despite attempts to vent containment, pressure remained stable. Operators began work to open the small suppression chamber air-‐operated vent valve in addition to the large suppression chamber air-‐operated vent valve to reopen the vent path. However, the large suppression chamber air-‐operated vent valve would not open. Workers believed the solenoid on the control air valve had malfunctioned.
14-‐Mar 1903 Reactor pressure stabilizes at approximately 91.4 psig (0.63 MPa gauge). 14-‐Mar The radiation on site was high, forcing workers to make rounds to check the operating status of the fire engines.
14-‐Mar 1920 While touring to check the status of the fire engines, workers discovered that an engine had run out of fuel and no seawater was being injected into the reactor.
14-‐Mar 1954 After a fire engine was refueled and started, seawater injection commenced into the reactor via the fire protection system.
14-‐Mar 1957 A second fire engine was started to augment seawater injection into the reactor.
14-‐Mar apx. 2100
Operators opened the small suppression chamber air-‐operated vent valve. This established the venting lineup except the rupture disk. Containment pressure was lower than the working pressure of the rupture disk at 62 psig (427 kPa gauge), so venting did not occur. The vent valves remained open and operators continued to monitor containment pressure. Indicated containment pressure was 60.8 psia (0.419 MPa abs).
14-‐Mar 2120 A second SRV was opened, and reactor water level trended up. This was reported to the government and associated authorities at 2134.
14-‐Mar 2130 Reactor water level was 118 inches (3,000 mm) below TAF.
14-‐Mar 2135 The dose rate measured by a monitoring car was 76 mrem/hr (760 µSv/hr), exceeding the 50 mrem/hr (500 µSv/hr) limit specified in Article 15, paragraph 1 of the Nuclear Disaster Law, indicating an abnormal increase in radiation dose at the site boundary. This was reported to the authorities at 2235.

Unit 2 Validated Event T imeline INPO 11-005
89
Date Time Unit 2 Actions 14-‐Mar 2200 Reactor water level recovered to 63 inches (1,600 mm) below TAF, trending up.
14-‐Mar 2250 Containment pressure increased to 78 psia (0.54 MPa abs), which exceeded the maximum design pressure of 62 psig (427 kPa gauge). This represented an abnormal increase in containment pressure as specified in Article15, paragraph 1 of the Nuclear Disaster Law. This was reported to the authorities at 2339.
14-‐Mar 2250 Reactor pressure increased unexpectedly, accompanied by a drop in reactor water level. Reactor pressure increased from 62 psig (0.428 MPa gauge) at 2240 to 264.4 psig (1.823 MPa gauge) at 2250. At the same times, reactor water level lowered from 27.6 inches (700 mm) below TAF to 63 inches (1,600 mm) below TAF.
14-‐Mar 2325 Containment pressure increased above 101.5 psia (0.7 MPa abs). 14-‐Mar 2330 Reactor pressure again began to drop. The highest reactor pressure was 456.9 psig (3.15 MPa gauge).
14-‐Mar -‐-‐ Drywell pressure was trending up and reached 101.5 psia (0.7 MPa abs); but in contrast, suppression chamber pressure remained stable around 43.5 to 58 psia (300 to 400 kPa abs). The pressure was not equalizing between the containment and the suppression chamber.
14-‐Mar -‐-‐ Pressure in the suppression chamber was lower than rupture disk pressure and drywell pressure was increasing, so operators decided to open the small drywell air-‐operated vent valve.
15-‐Mar 0002 Operators opened the small drywell air-‐operated vent valve. The vent line lineup was completed to vent from the drywell, except for the rupture disk, which remained closed. Containment pressure remained stable at approximately 109 psia (750 kPa abs). A few minutes later, operators checked and noted that the small air-‐operated valve had closed.
15-‐Mar 0128 Reactor pressure decreased to 91 psig (0.63 MPa gauge).
15-‐Mar 0300 Containment pressure exceeded maximum design pressure, and operators again attempted to vent the containment to reduce pressure but were unsuccessful. This was reported to the government and associated authorities at 0417.
15-‐Mar 0600 At around 0600, a loud noise was heard in the area around the torus. While suppression chamber pressure dropped to 0 psia (0 Mpa abs), indicating a potential instrument failure, drywell pressure remained high, indicating 105.9 psia (0.73 MPa abs). At that time, reactor water level was 110 inches (2,800 mm) below TAF.
15-‐Mar 0650 The radiation dose at the main gate was 58.4 mrem/hr (583.7 µSv/hr), exceeding the 50 mrem/hr (500 µSv/hr) limit specified in Article 15, paragraph 1 of the Nuclear Disaster Law, indicating an abnormal increase in radiation dose at the site boundary. This was reported to the authorities at 0700.

Unit 2 Validated Event T imeline INPO 11-005
90
Date Time Unit 2 Actions
15-‐Mar 0700 The government was notified that all nonessential personnel (650 people) were evacuated to Fukushima Daini, leaving 70 people at the station. The shift operators periodically went to the control room to log containment pressure and other critical parameters.
15-‐Mar 0811 The radiation dose at the main gate was 80.7 mrem/hr (807 µSv/hr), exceeding the 50 mrem/hr (500 µSv/hr) limit specified in Article 15, paragraph 1 of the Nuclear Disaster Law, indicating an abnormal emission of radioactive materials from a fire or explosion. This was reported to the authorities at 0836.
15-‐Mar 0825 Workers observed steam rising from the area around the fifth floor of the reactor building. This was reported to the authorities at 0918.
15-‐Mar 1100 The Prime Minister directed that residents living between 12.4 and 18.6 miles (20 and 30 km) of the station take shelter.
15-‐Mar 1125 Containment pressure decreased from 106 psia (730 kPa abs) at 0720 shortly after a loud noise was heard around the torus to 22.5 psia (155 kPa abs) at 1125. No information is available regarding containment pressure between the two times.
15-‐Mar 1600 The radiation dose at the main gate was 53.2 mrem/hr (531.6 µSv/hr), exceeding the 50 mrem/hr (500 µSv/hr) limit specified in Article 15, paragraph 1 of the Nuclear Disaster Law, indicating an abnormal increase in radiation dose at the site boundary. This was reported to the authorities at 1622.
15-‐Mar 2305 The radiation dose at the main gate was 454.8 mrem/hr (4548 µSv/hr), exceeding the 50 mrem/hr (500 µSv/hr) limit specified in Article 15, paragraph 1 of the Nuclear Disaster Law, indicating an abnormal increase in radiation dose at the site boundary. This was reported to the authorities at 2320.

Unit 3 Validated Event T imeline INPO 11-005
91
8.3 Unit 3
Date Time Unit 3 Actions
11-‐Mar 1446 An earthquake caused seismic motion in excess of the reactor protection system scram setpoints. A level 3 state of emergency was automatically declared for the earthquake.
11-‐Mar 1447 Automatic reactor scram signal on seismic trip 11-‐Mar 1447 Operators manually tripped the main turbine.
11-‐Mar apx. 1448 Emergency diesel generators started and loaded.
11-‐Mar 1451 Operators commenced breaking main condenser vacuum. 11-‐Mar 1454 Operators confirmed the reactor was subcritical. 11-‐Mar 1505 The operators manually initiated reactor core isolation cooling (RCIC).
11-‐Mar 1506 The Headquarters for Major Disaster Countermeasures was established in the TEPCO office in Tokyo to assess damages from the earthquake and recover from the electric outage in TEPCO's service area.
11-‐Mar 1515 Operators completed breaking main condenser vacuum. 11-‐Mar 1525 RCIC tripped on high reactor water level. 11-‐Mar 1527 The first wave of a series of tsunamis, generated by the earthquake, arrived at the station. 11-‐Mar 1535 The second tsunami hit the station. 11-‐Mar -‐-‐ Unnecessary DC loads were shed to extend battery life. 11-‐Mar 1538 All AC power was lost.
11-‐Mar 1542 TEPCO entered its emergency plan because of the loss of all AC power, in accordance with Article 10, paragraph 1 of the Nuclear Disaster Law. Government offices were notified. The corporate Emergency Response Center was established.
11-‐Mar 1603 Operators manually restarted RCIC and prepared HPCI for startup. 11-‐Mar 1636 The second emergency level was announced. 11-‐Mar 2050 Fukushima Prefecture ordered evacuation of the population within a 1.2 mile (2 km) radius of the station.
11-‐Mar 2123 The Prime Minister ordered the evacuation of the population within a 1.9 mile (3 km) radius of the station and sheltering for the population within a 1.9 to 6.2 mile (3 km to 10 km) radius of the station.
11-‐Mar 2158 A small portable electric generator was installed, which restored some temporary lighting in the units 3-‐4 control room. 12-‐Mar 0030 The government confirmed the evacuation of the population within 1.9 miles (3 km) was completed. 12-‐Mar 0145 The government reconfirmed the evacuation of the population within 1.9 miles (3 km) was completed.

Unit 3 Validated Event T imeline INPO 11-005
92
Date Time Unit 3 Actions
12-‐Mar 0423 Increasing radiation levels were observed in the area around the main gate. Dose rates increased from 0.0069 mrem/hr (0.069 µSv/hr) at 0400 to 0.059 mrem/hr (0.59 µSv/hr) at 0423. The government and associated authorities were notified at 0455.
12-‐Mar 0544 The Prime Minister ordered the evacuation of the population out to a 6.2 mile (10 km) radius. 12-‐Mar 0711 The Prime Minister arrived. 12-‐Mar 0804 The Prime Minister departed. 12-‐Mar 1136 RCIC tripped.
12-‐Mar -‐-‐ Station fire engines were being used to inject water into Unit 1. Additional fire engines were requested but were not available.
12-‐Mar 1210 Primary containment pressure had slowly increased, peaking at 57 psia (0.39 MPa abs). 12-‐Mar 1235 HPCI automatically started on low reactor water level. 12-‐Mar 1730 The site superintendent ordered preparations for venting the containment to proceed.
12-‐Mar -‐-‐ HPCI injection continued. Knowing that venting would be required eventually, operators commenced preparations for lining up to vent the Unit 2 and Unit 3 containments. Operators planned to manually open the vent valves (other than the rupture disk) because the dose in the field was currently low.
12-‐Mar 1825 The Prime Minister ordered the evacuation of the population within a 12.4 mile (20 km) radius of the station.
12-‐Mar -‐-‐
After 2100, operators started a review of the vent procedures to identify the sequence and location of vent valves, which were written on a whiteboard. Emergency response workers reviewed the vent procedure for Unit 1. Based on that review and the accident management procedure for Unit 3, they developed a procedure to manually vent Unit 3 and provided it to the control room operators.
13-‐Mar 0242 The HPCI system automatically tripped, which resulted in a loss of all water injection sources.
13-‐Mar -‐-‐
Operators attempted to restart water injection by installed equipment but were unsuccessful. HPCI could not be started because the batteries were exhausted. Operators attempted to start RCIC locally, but it would not start. They next attempted water injection by diesel-‐driven fire pump but could not because reactor pressure had increased as high as approximately 580 psi (4 MPa). Attempts to restore power to the standby liquid control system were unsuccessful because the poor working conditions (darkness, debris, flooding) prevented temporary power installation from being completed.

Unit 3 Validated Event T imeline INPO 11-005
93
Date Time Unit 3 Actions
13-‐Mar -‐-‐
To inject water by fire engines, it was necessary to decrease the reactor pressure by operating SRVs, but no SRVs were available because the batteries were depleted. All of the available batteries had already been used, so workers scavenged batteries from cars and connected them to instrumentation in the control room and used them to power an SRV.
13-‐Mar apx. 0450
To open the large suppression chamber air-‐operated vent valve, workers used the small generator that was installed to provide temporary lighting in the control room to provide power to the valve solenoid. An operator checked the valve indication locally at the torus room, but the valve indicated closed. The torus room was very hot and the room was completely dark, which made for a difficult working environment.
13-‐Mar 0500 Reactor pressure increased to greater than 1,070 psi (7.38 MPa). 13-‐Mar 0500 Reactor water level was 79 inches (2000 mm) below TAF and lowering.
13-‐Mar 0510 Because the RCIC could not be restarted, TEPCO determined that a loss of reactor cooling had occurred in accordance with Article 15, paragraph 1 of the Nuclear Disaster Law. Government offices were notified at 0558.
13-‐Mar 0515 The site superintendent instructed operators to complete the lineup for venting the containment.
13-‐Mar 0523 The solenoid for the large suppression chamber air-‐operated vent valve was energized, but the vent valve remained closed. Operators determined that there was insufficient air pressure to operate the valve. The operators replaced a temporary air bottle that had been installed to provide air pressure, and the valve opened.
13-‐Mar 0550 A press release was made to announce venting.
13-‐Mar 0619 TEPCO determined reactor water level reached the top of active fuel (TAF) at 0415, and a notification was made to the government offices.
13-‐Mar 0735 The government offices were notified of the dose expected to be received during venting. 13-‐Mar 0739 Containment spray was initiated in the containment using a fire engine. The government was notified at 0756.
13-‐Mar 0745 Reactor water level decreased to 118 inches (3,000 mm) below TAF, reactor pressure was 1,060 psig (7.310 Mpa gauge), and primary containment pressure increased to 67 psia (0.46 MPa abs).
13-‐Mar 0835 Operators opened the motor-‐operated containment vent valve 15 percent, as directed by the procedure.
13-‐Mar 0841 The operators opened the large air-‐operated torus vent valve, completing the vent lineup except the rupture disk. The government was notified at 0846.
13-‐Mar 0856 The dose rate measured 88.2 mrem/hr (882 µSv/h) at the monitoring post, exceeding the 50 mrem/hr (500 µSv/hr) limit specified in Article 15, paragraph 1 of the Nuclear Disaster Law, indicating an abnormal increase in radiation dose at the site boundary. This was reported to the authorities at 0901.

Unit 3 Validated Event T imeline INPO 11-005
94
Date Time Unit 3 Actions
13-‐Mar 0908 Workers had scavenged enough batteries to power the SRVs, and the operators opened an SRV to depressurize the reactor. At 0920, the government was notified that water injection would be started through a fire protection line.
13-‐Mar 0924 Containment pressure lowered from 92 psia (0.637 MPa abs) at 0910 to 78 psia (0.540 MPa abs). The Emergency Response Center determined that venting had successfully started at about 0920.
13-‐Mar 0925 Reactor pressure lowered to 50.8 psig (0.35 MPa gauge), and injection of borated fresh water into the reactor using the fire system began.
13-‐Mar apx. 0928
The air cylinder providing air to the large air-‐operated vent valve was losing pressure. Workers investigated and found a leak on one fitting, which they repaired.
13-‐Mar 0936 Operators verified that containment pressure was decreasing and that the injection of water into the reactor had started. The government was notified.
13-‐Mar 1030 The site superintendent ordered workers to be ready to commence injection using seawater.
13-‐Mar 1117 The air-‐operated torus vent valve was found closed. The pressure in the air cylinder being used to provide air was decreasing.
13-‐Mar -‐-‐ Attempts to lock open the valve were not successful because of the extreme adverse conditions in the torus room. The room was dark and hot, and the torus was shaking because of the open SRV.
13-‐Mar 1220 Injection of fresh water was stopped as the water ran out. Workers had prepared to make a swift change to seawater injection, but an aftershock and subsequent evacuation order occurred while the work was being carried out, so the swap was delayed. Work was also ongoing to replenish the fresh water supply.
13-‐Mar 1230 Workers replaced the air bottle, and the large air-‐operated torus vent valve was opened.
13-‐Mar 1300 Reactor pressure decreased to 28 psi (0.19 MPa), and reactor water level was approximately 79 inches (2,000 mm) below TAF by the lowest indication.
13-‐Mar 1312 Workers commenced injecting seawater into the reactor using fire trucks and the fire protection system.
13-‐Mar -‐-‐ Requests for off-‐site fire engines were made, but it was difficult for those fire engines to reach the plant, because the roads were impassable and dose rates on the site were increasing. When they finally were able to come, it took longer for the fire engines to come on station because the drivers needed to be changed to site workers off site.
13-‐Mar -‐-‐
Other sources for seawater were considered, including accumulated water in the basement of the Unit 4 turbine building, which was accessed by breaking the entrance shutters of truck bay doors and moving fire engines into place. However, this was unsuccessful. Workers also considered taking water from the discharge channel of Unit 4 or the training center pool, but this also did not work.

Unit 3 Validated Event T imeline INPO 11-005
95
Date Time Unit 3 Actions
13-‐Mar 1415 The dose rate measured 90.5 mrem/hr (905 µSv/h) at the monitoring post, exceeding the 50 mrem/hr (500 µSv/hr) limit specified in Article 15, paragraph 1 of the Nuclear Disaster Law, indicating an abnormal increase in radiation dose at the site boundary. This was reported to the authorities at 1423.
13-‐Mar 1431 Radiation dose rates over 30 rem/hr (300 mSv/hr) were measured at the north side reactor building air lock, with visible steam and 10 rem/hr (100 mSv/hr) at the south side air lock.
13-‐Mar 1500 Containment pressure began to increase from 11.6 psia (0.08 MPa abs) to 13 psia (0.09 MPa abs).
13-‐Mar 1528 The dose rate in the Unit 3 side of the control room reached 1.2 rem/hr (12 mSv/hr), and operators moved to the Unit 4 side.
13-‐Mar 1752 A temporary compressor became available for use. Workers then began to attach the compressor to the instrument air system to keep the suppression chamber air-‐operated vent valve open.
13-‐Mar 2010 A reduction in containment pressure indicated that the suppression chamber air-‐operated vent valve was open. Over the next five days, losses of air pressure or DC power to the solenoid caused the valve to periodically close.
14-‐Mar 0110 Injection into the reactor was stopped because of a low level in the main condenser backwash valve pit being used as a water source.
14-‐Mar 0200 Containment pressure was trending upward at 38.4 psia (0.265 MPa abs). Personnel decided to open the small suppression chamber air-‐operated vent valve.
14-‐Mar 0220 The dose rate measured 75.1 mrem/hr (751 µSv/hr) at the monitoring post, exceeding the 50 mrem/hr (500 µSv/hr) limit specified in Article 15, paragraph 1 of the Nuclear Disaster Law, indicating an abnormal increase in radiation dose at the site boundary. This was reported to the authorities at 0424.
14-‐Mar 0240 The dose rate measured 65 mrem/hr (650 µSv/hr) at the monitoring post, exceeding the 50 mrem/hr (500 µSv/hr) limit specified in Article 15, paragraph 1 of the Nuclear Disaster Law, indicating an abnormal increase in radiation dose at the site boundary. This was reported to the authorities at 0537.
14-‐Mar 0300 Containment pressure increased from 38.4 psia (0.265 MPa abs) at 0200, to 45.7 psia (0.315 MPa abs) at 0300. 14-‐Mar 0310 Reactor water level decreased to 91 inches (2,300 mm) below TAF by the lowest indication.
14-‐Mar 0320 Workers moved the fire engine around, allowing the hose to drop deeper into the valve pit; and seawater injection into the reactor was restored using a fire engine.
14-‐Mar 0340 The solenoid valve for the small suppression chamber air-‐operated valve was energized in an attempt to lower PCV pressure. Containment pressure was approximately 47.9 psia (0.33 MPa abs) and continued to trend up.

Unit 3 Validated Event T imeline INPO 11-005
96
Date Time Unit 3 Actions
14-‐Mar 0400 The dose rate measured 82 mrem/hr (820 µSv/hr) at the monitoring post, exceeding the 50 mrem/hr (500 µSv/hr) limit specified in Article 15, paragraph 1 of the Nuclear Disaster Law, indicating an abnormal increase in radiation dose at the site boundary. This was reported to the authorities at 0800.
14-‐Mar 0520 Work began to open the small air-‐operated valve for the suppression chamber. By 0530, containment pressure was 56.6 psia (0.39 MPa abs) and increasing.
14-‐Mar 0610 The small air-‐operated suppression chamber vent valve was confirmed open.
14-‐Mar 0610 After confirming that the small suppression chamber air-‐operated valve was open, the operators could not maintain the valve open because of a loss of air pressure and a loss of DC power to the solenoid.
14-‐Mar 0912 The dose rate measured 51.9 mrem/hr (518.7 µSv/hr) at the monitoring post, exceeding the 50 mrem/hr (500 µSv/hr) limit specified in Article 15, paragraph 1 of the Nuclear Disaster Law, indicating an abnormal increase in radiation dose at the site boundary. This was reported to the authorities at 0934.
14-‐Mar 0920 Additional fire engines arrived around sunrise, and workers began using two fire engines that had arrived from off site to pump seawater from the shallow draft quay (harbor) into the main condenser backwash valve pit.
14-‐Mar 1053 Seven 5-‐ton Self-‐Defense Force water supply vehicles arrived at the site and started to supply fresh water to the main condenser backwash valve pit.
14-‐Mar 1101 The Unit 3 reactor building exploded. The explosion damaged fire trucks and hoses. Seawater injection into the reactor was lost.
14-‐Mar 1101
All workers except shift personnel in the control room stopped work and evacuated to the Emergency Response Center. Four TEPCO employees, 3 contractors, and 4 self-‐defense personnel were injured (11 total). The explosion scattered highly radioactive debris around the site. Because of the debris and radiation levels, the backwash valve pit was no longer usable as a water source.
14-‐Mar 1200 Containment pressure began to increase from 52.2 psia (0.36 MPa abs) to 53.7 psia (0.37 MPa abs).
14-‐Mar 1630 The undamaged fire engine was moved to the shallow draft quay, and a new injection lineup was completed. Fire engines and hoses were rearranged to inject seawater directly from the shallow draft quay into the reactor. Connecting two fire engines in series allowed seawater to supply both units 2 and 3.
14-‐Mar 1640 Containment pressure began to lower from 69.6 psia (0.48 MPa abs).
14-‐Mar 2230 Containment pressure began to increase from 52.2 psia (0.36 MPa abs), and reactor pressure vessel pressure was 26.1 psi (0.18 MPa) and increasing.

Unit 3 Validated Event T imeline INPO 11-005
97
Date Time Unit 3 Actions
14-‐Mar 2135 The dose rate measured by a monitoring car is 76 mrem/hr (760 µSv/hr), exceeding the 50 mrem/hr (500 µSv/hr) limit specified in Article 15, paragraph 1 of the Nuclear Disaster Law, indicating an abnormal increase in radiation dose at the site boundary. This was reported to the authorities at 2235.
15-‐Mar 0650 The radiation dose at the main gate was 58.4 mrem/hr (583.7 µSv/hr), exceeding the 50 mrem/hr (500 µSv/hr) limit specified in Article 15, paragraph 1 of the Nuclear Disaster Law, indicating an abnormal increase in radiation dose at the site boundary. This was reported to the authorities at 0700.
15-‐Mar 0700 Nonessential personnel were temporarily evacuated to Fukushima Daini. Government offices were informed. 15-‐Mar 0755 Steam was observed issuing from the upper part of the reactor building. Government offices were informed.
15-‐Mar 0811 The radiation dose at the main gate was 80.7 mrem/hr (807 µSv/hr), exceeding the 50 mrem/hr (500 µSv/hr) limit specified in Article 15, paragraph 1 of the Nuclear Disaster Law, indicating an abnormal emission of radioactive materials from a fire or explosion. This was reported to the authorities at 0836.
15-‐Mar 1100 The Prime Minister directed that residents living between 12.4 and 18.6 miles (20 and 30 km) of the station take shelter.
15-‐Mar 1600 The radiation dose at the main gate was 53.2 mrem/hr (531.6 µSv/hr), exceeding the 50 mrem/hr (500 µSv/hr) limit specified in Article 15, paragraph 1 of the Nuclear Disaster Law, indicating an abnormal increase in radiation dose at the site boundary. This was reported to the authorities at 1622.
15-‐Mar 1600 Workers noted that the suppression chamber vent valve had closed. 15-‐Mar 1605 The suppression chamber vent valve was opened.
15-‐Mar 2305 The radiation dose at the main gate was 454.8 mrem/hr (4548 µSv/hr), exceeding the 50 mrem/hr (500 µSv/hr) limit specified in Article 15, paragraph 1 of the Nuclear Disaster Law, indicating an abnormal increase in radiation dose at the site boundary. This was reported to the authorities at 2320.
16-‐Mar 0155 The bypass valve for the suppression chamber air-‐operated vent valve was opened.