special review assessment (sra) high school … 2004 special review assessment (sra) high school...
TRANSCRIPT

Special Review Assessment (SRA)
High School Proficiency Assessment
(HSPA)
Mathematics:
A Rubric Scoring Handbook
May 2004PTM# 1504.30
Copyright © 2004 by New Jersey Department of EducationAll rights reserved.

STATE BOARD OF EDUCATION
ARNOLD G. HYNDMAN ............................................................................................... BelvederePresident
DEBRA CASHA................................................................................................................ KinnelonVice President
MARGARET F. BARTLETT......................................................................................... Pine Beach
RONALD K. BUTCHER.......................................................................................................Pitman
MAUD DAHME..............................................................................................................Annandale
KATHLEEN A. DIETZ ............................................................................................... Hillsborough
ANNE S. DILLMAN ...................................................................................................Perth Amboy
ORLANDO EDREIRA...................................................................................................... Elizabeth
JOHN A. GRIFFITH......................................................................................................... Montclair
THELMA NAPOLEON-SMITH..........................................................................................Trenton
SAMUEL J. PODIETZ ................................................................................................... Lumberton
EDWARD TAYLOR. ...................................................................................................... Somerdale
ROBERTA H. VAN ANDA ................................................................................................Rumson
Dr. William L. Librera, CommissionerSecretary, State Board of Education
It is a policy of the New Jersey State Board of Education and the StateDepartment of Education that no person, on the basis of race, creed, nationalorigin, age, sex, handicap, or marital status, shall be subjected to discrimination inemployment or be excluded from or denied benefits in any activity, program, orservice for which the department has responsibility. The department will complywith all state and federal laws and regulations concerning nondiscrimination.

May 2004SPECIAL REVIEW ASSESSMENT (SRA)
High School Proficiency Assessment (HSPA)
MATHEMATICS:A RUBRIC SCORING HANDBOOK
William L. Librera, Ed. D.Commissioner of Education
Richard Ten EyckAssistant Commissioner
Division of Educational Programs and Assessment
Brian D. Robinson, Ed. D.Director
Office of Evaluation and Assessment
Timothy J. GiordanoMathematics Coordinator
Office of Evaluation and [email protected]
(609)633-8015
www.nj.gov/njded/stass
www.njpep.org/assessment/index.html
New Jersey Department of EducationPO Box 500
Trenton, New Jersey 08625-0500
May 2004PTM# 1504.30

TABLE OF CONTENTS
INTRODUCTION.................................................................................................................. 1The Special Review Assessment (SRA) ............................................................................. 1
SCORING STUDENT RESPONSES.................................................................................... 3Generic Mathematics Scoring Rubric ................................................................................. 3Scoring Student Responses in a Language Other than English .......................................... 4Recommendations for Scoring Student Responses............................................................. 4
HSPA/SRA MATHEMATICS: SAMPLE PATs AND STUDENT RESPONSES .............. 5Sample Performance Assessment Task (PAT) #1............................................................... 6Sample Performance Assessment Task (PAT) #2............................................................. 23Sample Performance Assessment Task (PAT) #3............................................................. 32Sample Performance Assessment Task (PAT) #4............................................................. 40Sample Performance Assessment Task (PAT) #5............................................................. 51Sample Performance Assessment Task (PAT) #6............................................................. 61Sample Performance Assessment Task (PAT) #7............................................................. 74Sample Performance Assessment Task (PAT) #8............................................................. 88

1
INTRODUCTION
We want ALL students to achieve the standards.
The vision of the mathematics standards is focused on achieving one crucial goal:
To enable ALL of New Jersey’s children to acquire the mathematical skills, understandings, andattitudes that they will need to be successful in their careers and daily lives.
The vision of success for all students in mathematics depends on:1. Establishing learning environments that facilitate student learning of mathematics.2. A commitment to equity and to excellence.3. Defining the critical goals of mathematics education today – what students should know and be
able to do (i.e., content and processes).
New Jersey’s mathematics standards rest on the notion that an appropriate mathematics curriculumresults from a series of critical decisions about three inseparably linked components: content,instruction, and assessment.
The Special Review Assessment (SRA)
New Jersey Statute (N.J.S.A. 18A:7c-3) and Administrative Code (N.J.A.C. 6A:8-4.1) provide for analternate assessment of students who have met all graduation requirements except for demonstratingproficiency in all content areas of the High School Proficiency Assessment (HSPA). The SpecialReview Assessment (SRA) process is the designated alternate assessment for the HSPA. The SRAprovides students with the opportunity to show their proficiency of the HSPA knowledge and skills in afamiliar setting.
The SRA is aligned to the HSPA test specifications to ensure that students who demonstrate proficiencythrough the SRA have demonstrated the same knowledge, skills, and performance levels as students whoare proficient on the HSPA itself. The process used for the development of the SRA is designed toensure that the SRA is fair, reliable, and comparable for all eligible SRA candidates, including studentsfrom special populations.
The Special Review Assessment consists of mathematics and language arts literacy PerformanceAssessment Tasks (PATs) that are administered to individual students.
High school students have 3 chances to demonstrate proficiency on the HSPA – the spring of their junioryear, the fall of their senior year, and the spring of their senior year. For every administration of theHSPA, each school district receives Individual Student Reports (ISRs) for their students. These reportsgive specific information about proficiency results for each student who took the HSPA.
A student whose scaled score is below 200 (partially proficient) in one or more HSPA content areas andis expected to complete all state and local graduation requirements in the twelfth grade is eligible for theSRA process.

2
Each SRA question, known as a Performance Assessment Task (PAT), consists of one to five open-ended parts derived from a common stem. Each PAT is aligned to the HSPA content specifications byclusters. The clusters for mathematics with associated macros are:
I. Number Sense, Concepts, and ApplicationsA. Understand types of numbers, our numeration system, and the ways they are used and
applied in real-world situations.B. Apply ratios, proportions, and percents to a variety of situations.
II. Spatial Sense and GeometryA. Recognize, visualize, analyze, and apply geometric properties, relationships, and
patterns in real-world and/or problem-solving contexts using models, manipulatives,and technology.
B. Use coordinate geometry in problem-solving situations and apply the principles ofcongruence, similarity, and transformations.
C. Apply the principles of measurement and geometry to solve problems involving directand indirect measurement.
III. Data analysis, Probability, Statistics, and Discrete MathematicsA. Determine, interpret, and use probabilities of simple and compound events.B. Understand and interpret statistical distributions and apply to real-world situations.C. Collect, organize, represent, analyze, and interpret data.D. Apply the concepts and methods of discrete mathematics to model and explore a
variety of practical situations.E. Use iterative and recursive patterns and processes to model a variety of practical
situations and solve problems.
IV. Patterns, Functions, and AlgebraA. Recognize, create, and extend a variety of patterns and use inductive reasoning to
understand and represent mathematical and other real-world phenomena.B. Use various types of functions to represent mathematical or real-world situations.C. Use algebraic concepts and processes to concisely express, analyze, and model real-
world situations.

3
SCORING STUDENT RESPONSES
Scoring rubrics provide the criteria for evaluating and scoring student performance. Item-specificrubrics, which are individual scoring guides, are supplied for each SRA PAT for mathematics. Theseitem specific rubrics are based upon the generic mathematics rubric and are developed by a committeeof mathematicians and teachers. Rubrics ensure that there is consistency, fairness, and accuracy inscoring open-ended questions.
GENERIC MATHEMATICS SCORING RUBRIC
3-Point ResponseThe response shows complete understanding of the problem’s essential mathematical concepts.
The student executes procedures completely and gives relevant responses to all parts of the task. Theresponse contains few minor errors, if any. The response contains a clear, effective explanationdetailing how the problem was solved so that the reader does not need to infer how and why decisionswere made.
2-Point ResponseThe response shows nearly complete understanding of the problem’s essential mathematical
concepts. The student executes nearly all procedures and gives relevant responses to most parts of thetask. The response may have minor errors. The explanation detailing how the problem was solved maynot be clear, causing the reader to make some inferences.
1-Point ResponseThe response shows limited understanding of the problem’s essential mathematical concepts.
The response and procedures may be incomplete and/or may contain major errors. An incompleteexplanation of how the problem was solved may contribute to questions as to how and why decisionswere made.
0-Point ResponseThe response shows insufficient understanding of the problem’s essential mathematical concepts.
The procedures, if any, contain major errors. There may be no explanation of the solution or the readermay not be able to understand the explanation. The reader may not be able to understand why and howdecisions were made.
Two content-certified mathematics panel members must independently score each SRA PAT. The twoindependent ratings must be equal (agreeing) or within one point of each other (contiguous/adjacent).The final score for the mathematics PAT is the mean score of the two independent scores. Mathematicsproficient score is a mean score of 2 on each PAT which means that the two SRA panel members eachscored the student’s response a 2 or better.
However, if the two SRA panel members’ scores disagree by more than one point, a third content-certified panel member must score the response. The new PAT score is derived by taking the mean ofthe two highest contiguous scores. If no two of the three scores are in agreement, the student mustcomplete another PAT.

4
Scoring Student Responses in a Language Other than English
For SRA mathematics PATs, students’ responses in their native language can only be scored by twoindependent certificated secondary mathematics teachers. If the certificated secondary mathematicsteachers are not fluent in the native language, certificated world language teachers, certificated ESLteachers or certificated bilingual teachers may orally translate the student responses for the SRA panelmembers. The teacher involved in the oral translation will be considered a non-scoring member of theSRA Mathematics Panel and should be indicated as such on the HSPA SRA Student Profile Form.
Recommendations for Scoring Student Responses
In order for all students to receive fair, accurate, and consistent scores, there are some recommendedprocedures for the SRA Mathematics Scorers to consider.
1) Take time to answer the PAT during/after the administration of the PAT to the student. Thiswill allow the scorer to obtain insight as to which questions are more challenging to the studentor where a student may misinterpret one of the questions.
2) Compare your answer to that given as a sample response. Note that the sample response is justone way of answering the PAT. There may be many acceptable responses.
3) Become familiar with the scoring rubric. The item specific rubric cannot identify all theparameters for every student response. It is important for the scorer to also keep the genericrubric in mind when scoring the student’s PAT. Does the student response demonstrateinsufficient understanding (0 points), a limited understanding (1 point), nearly completeunderstanding (2 points), or complete understanding (3 points) of the PAT’s essentialmathematical concepts?
4) Before scoring a student’s PAT, it is important that both scorers fully understand the rubric.When one scorer gives the student a score of 1, and the other scorer gives the student a score of2, a misinterpretation of either the student response or the scoring rubric has arisen.
5) A student’s explanation (justification) for a question may be in the form of an algebraicexpression, a table, diagrams, charts, sentences/paragraphs, mathematical equations, etc.
6) A student may take 2 PATs from the same macro if he/she has exhausted all of the PATs fromthe other Macros within that Cluster. For example, if a student is taking 2 PATs from Cluster 1,that student should successfully pass a PAT from Macro A and Macro B. However, if a studentpassed a PAT from Macro A and could not pass any of the PATs from Macro B, that studentcan take another PAT from Macro A to successfully pass that Cluster.
7) Please familiarize yourself with the SRA Administration Manual.
8) If you have a question about a PAT or have found an error, please get in touch with TimothyGiordano, Mathematics Coordinator at the NJ Department of Education (609/633-8015 [email protected]).
5
HSPA/SRA MATHEMATICS
SAMPLE PATs and STUDENT RESPONSES
The mathematic PATs and responses selected to appear in this handbook were completed by twelfth-grade students who participated in the October 2002 HSPA/SRA Pilot Test. The responses appear as thestudents wrote them; no corrections have been made other than the deletion of specific names ofteachers, administrators, students, schools, and districts.
The score point for each student response is noted. Please feel free to use these materials as practicematerials for students as well as practice materials for scorers.
6
HSPA/SRA MATHEMATICSSample PAT #1
Cluster 1/Macro BPAT-B0705-001S
“Dorothy is running for president.”
7
CLUSTER 1/MACRO B Page 1 of 1PAT-B0705-001S STUDENT ID No:
2002-2003 PRACTICE MATERIALSNew Jersey Department of EducationHSPA/SRA MATHEMATICSPerformance Assessment Task (PAT)
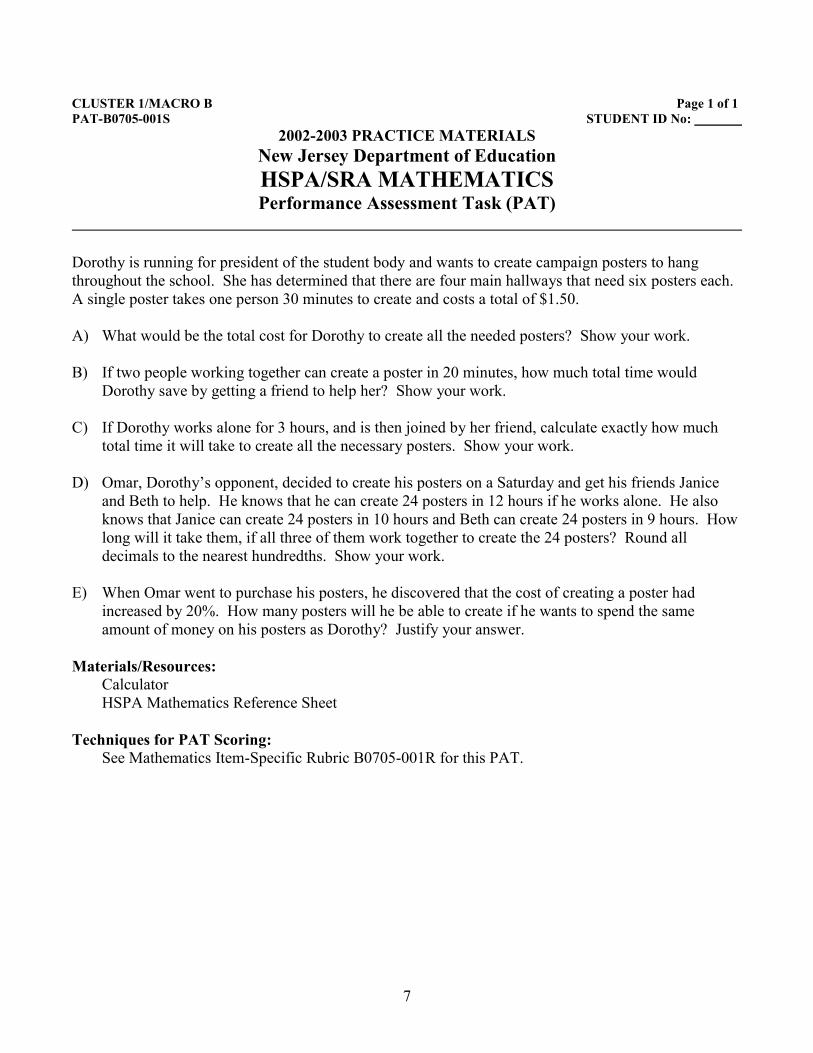
Dorothy is running for president of the student body and wants to create campaign posters to hangthroughout the school. She has determined that there are four main hallways that need six posters each.A single poster takes one person 30 minutes to create and costs a total of $1.50.
A) What would be the total cost for Dorothy to create all the needed posters? Show your work.
B) If two people working together can create a poster in 20 minutes, how much total time wouldDorothy save by getting a friend to help her? Show your work.
C) If Dorothy works alone for 3 hours, and is then joined by her friend, calculate exactly how muchtotal time it will take to create all the necessary posters. Show your work.
D) Omar, Dorothy’s opponent, decided to create his posters on a Saturday and get his friends Janiceand Beth to help. He knows that he can create 24 posters in 12 hours if he works alone. He alsoknows that Janice can create 24 posters in 10 hours and Beth can create 24 posters in 9 hours. Howlong will it take them, if all three of them work together to create the 24 posters? Round alldecimals to the nearest hundredths. Show your work.
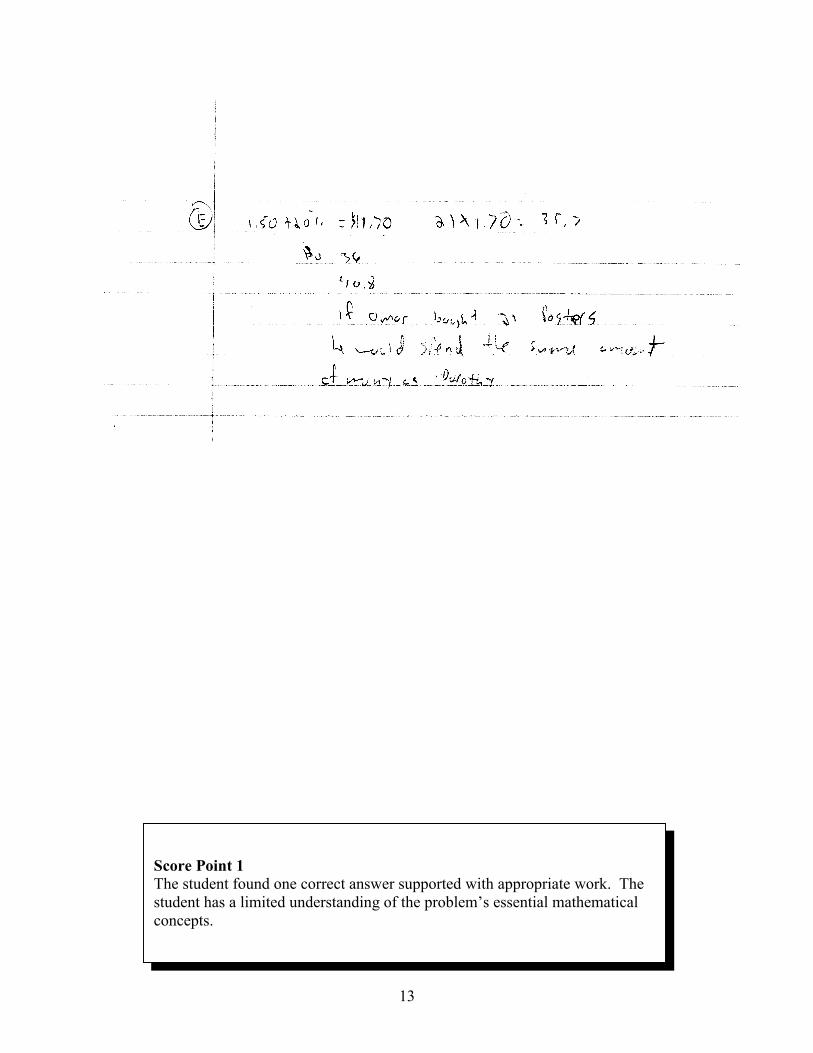
E) When Omar went to purchase his posters, he discovered that the cost of creating a poster hadincreased by 20%. How many posters will he be able to create if he wants to spend the sameamount of money on his posters as Dorothy? Justify your answer.
Materials/Resources:CalculatorHSPA Mathematics Reference Sheet
Techniques for PAT Scoring:See Mathematics Item-Specific Rubric B0705-001R for this PAT.

8
CLUSTER 1/MACRO B Page 1 of 2RUBRIC-B0705-001R
2002-2003 PRACTICE MATERIALSNew Jersey Department of EducationHSPA/SRA MATHEMATICSSample Response & Scoring Rubric
Sample Response:
A) ($1.50) × (4 × 6) = $36
B) (30 × 24) – (20 × 24) = 240 minutes = 4 hoursor 24 × 10 (time saved per poster) = 240 minutes(3)(4) – 2(4) = 12 – 8 = 4 hours
C) One person can make 6 posters in 3 hours. The remaining 18 posters take 2 people 360 minutes or6 hours. 3 hours + 6 hours = 9 hours total.
D) 12h +
10h +
9h = 1
.29h = 1h = 3.45 hours (note: used rounding process twice)h = 3.40 hours (note: used rounding process only once)
OR
180 12 10 9h h h� �
� �� �
+ + = (180)
15h + 18h + 20h = 18053h = 180
h = 18053
hours = 3 2153
hours
or 3.40 hours
E) (1.20)(1.50) = $1.80 per poster$36 ÷ 1.80 = 20 postersOmar can create 20 posters.

9
New Jersey Department of Education Page 2 of 2HSPA/SRA Mathematics
3 Points The student found the correct total cost for creating the posters, the amount of time saved if afriend helps, and the correct total time needed to create all posters in part C. The total timefor Omar to create 24 posters is correctly calculated in part D, and “20” is the correct answerfor part E. Work was shown for all parts.
2 Points The student found three or four correct answers out of five, and supported those answers withappropriate work. The other answers were either omitted, incorrect due to a process error, ornot supported by work.
1 Point The student found one or two correct answers out of five, supported with appropriate work.ORThe student found at least three correct answers, but no work was shown.
0 Points The response shows an insufficient understanding of the problem’s essential mathematicalconcepts. The procedures, if any, contain major errors. There may be no explanation of thesolution or the reader may not be able to understand the explanation. The reader may not beable to understand how and why decisions were made.

10
Score Point 2The student found three correct answers, and supported those answers withappropriate work.
11
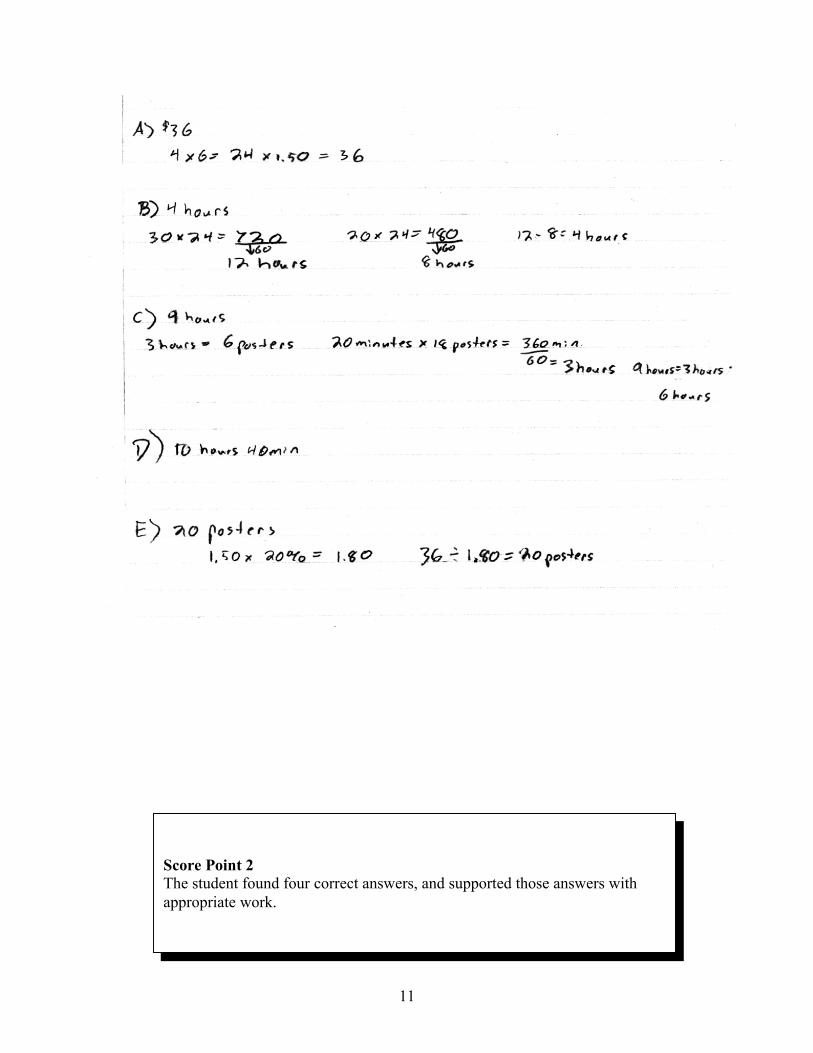
Score Point 2The student found four correct answers, and supported those answers withappropriate work.

12
13
Score Point 1The student found one correct answer supported with appropriate work. Thestudent has a limited understanding of the problem’s essential mathematicalconcepts.

14
Score Point 0The response shows an insufficient understanding of the problem’s essentialmathematical concepts. The procedures contain major errors.

15

16
Score Point 1The student found two correct answers supported with appropriate work.

17

18
Score Point 2The student found three correct answers, and supported those answers withappropriate work.

19

20
Score Point 2The student found four correct answers, and supported those answers withappropriate work.

21

22
Score Point 2The student found four correct answers, and supported those answers withappropriate work.

23
HSPA/SRA MATHEMATICSSample PAT #2
Cluster1/MacroBPAT-B0706-002S
Interest rate
24
CLUSTER 1/MACRO B Page 1 of 1PAT-B0706-002S STUDENT ID No:
2002-2003 PRACTICE MATERIALSNew Jersey Department of EducationHSPA/SRA MATHEMATICSPerformance Assessment Task (PAT)
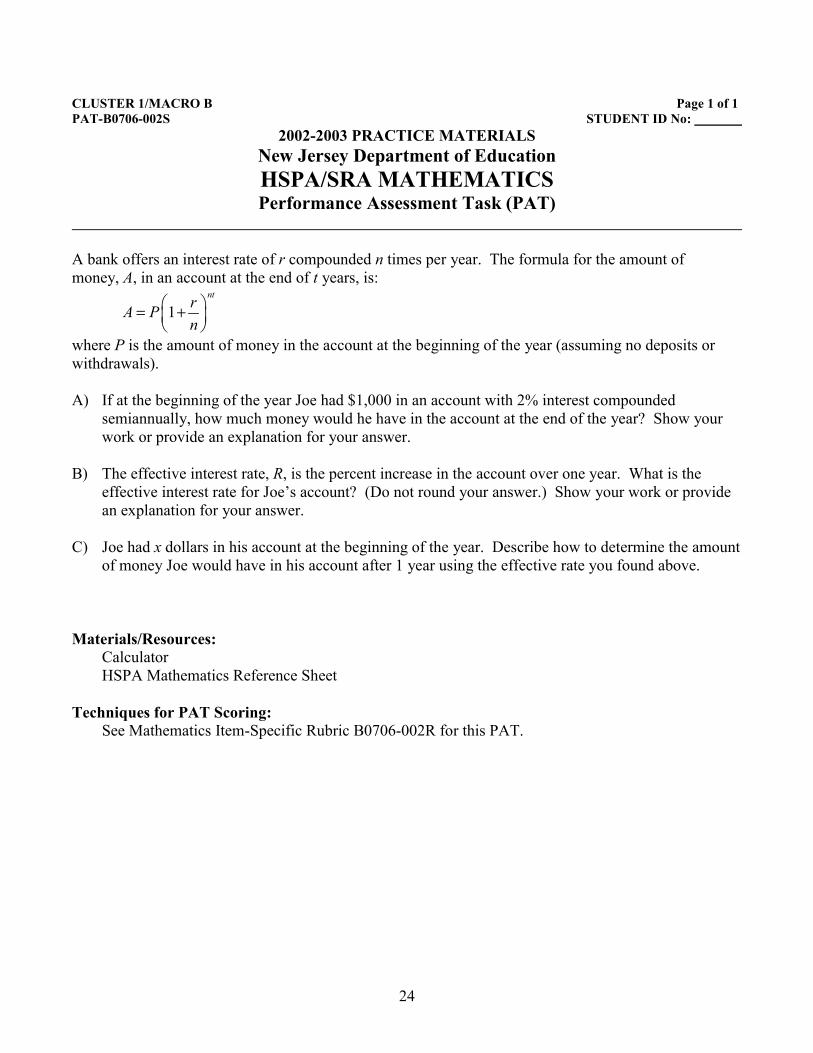
A bank offers an interest rate of r compounded n times per year. The formula for the amount ofmoney, A, in an account at the end of t years, is:
1ntrA P
n� �= +� �� �
where P is the amount of money in the account at the beginning of the year (assuming no deposits orwithdrawals).
A) If at the beginning of the year Joe had $1,000 in an account with 2% interest compoundedsemiannually, how much money would he have in the account at the end of the year? Show yourwork or provide an explanation for your answer.
B) The effective interest rate, R, is the percent increase in the account over one year. What is theeffective interest rate for Joe’s account? (Do not round your answer.) Show your work or providean explanation for your answer.
C) Joe had x dollars in his account at the beginning of the year. Describe how to determine the amountof money Joe would have in his account after 1 year using the effective rate you found above.
Materials/Resources:CalculatorHSPA Mathematics Reference Sheet
Techniques for PAT Scoring:See Mathematics Item-Specific Rubric B0706-002R for this PAT.

25
CLUSTER 1/MACRO B Page 1 of 2RUBRIC-B0706-002R
2002-2003 PRACTICE MATERIALSNew Jersey Department of EducationHSPA/SRA MATHEMATICSSample Response & Scoring Rubric
Sample Response
A) $1,020.1020.021,000 1 1,020.10
2� �+ =� �� �
B) 0.0201 OR 2.01% 20.10 0.02011,000
=
C) x × 1.0201
OR
x + x × 0.0201
OR
Multiply the amount of money he has at the beginning of the year by 1.0201.

26
CLUSTER 1/MACRO B Page 2 of 2HSPA/SRA Mathematics
3 Points The response contains correct values for parts A and B (showing work) and a cleardescription, using either words or an expression, of the method that would yield a correctvalue for part C. Since the numbers used are simple to work with, there should be nocomputation errors.
2 Points The response contains correct answers for two of the three parts of the problem, includingwork or explanations as called for in the problem.ORThere is a computation or copying error, not a process error, that leads to logical, butincorrect responses in other parts of the problem.
1 Point One part of the problem is correctly done with work shown or explanations as required.ORThe response contains two correct answers without work or explanation.ORThe response contains correct answers for all three parts, but shows no work or explanationsfor parts A and B.
0 Points The response shows insufficient understanding of the problem’s essential mathematicalconcepts. The procedures, if any, contain major errors. There may be no explanation of thesolution or the reader may not be able to understand the explanation. The reader may not beable to understand how and why decisions were made.

27
Score Point 0The response shows insufficient understanding of the problem’s essentialmathematical concepts. The procedures contain major errors.

28

29
Score Point 0The response shows insufficient understanding of the problem’s essentialmathematical concepts. The procedures contain major errors.

30
Score Point 2The response contains correct answers for two of the three parts of theproblem with work provided. Part C) contains a flaw and therefore does notwarrant a score point of 3.

31
Score Point 1One part of the problem is correctly done with work shown. The responseshows limited understanding of the problem’s essential mathematicalconcepts.

32
HSPA/SRA MATHEMATICSSample PAT #3
Cluster 2/Macro APAT-A1307-004S
Quadrilaterals and slopes

33
CLUSTER 2/MACRO A Page 1 of 1PAT-A1307-004S STUDENT ID No:
2002-2003 PRACTICE MATERIALSNew Jersey Department of EducationHSPA/SRA MATHEMATICS
Performance Assessment Task
Quadrilateral ABCD is graphed below with A(–3, 2), B(0, –2), C(8, 4), and D(5, 8).
A) Calculate the slopes of each side of ABCD and of the two diagonals. Show your work andlabel your responses.
B) Explain mathematically how you know that the quadrilateral is or is not each of thefollowing types of quadrilaterals:
1. parallelogram2. rectangle3. rhombus4. square
Materials/Resources:CalculatorHSPA Mathematics Reference Sheet
Techniques for PAT Scoring:See Mathematics Item-Specific Rubric A1103-004R for this PAT.

34
CLUSTER 2/MACRO A Page 1 of 2RUBRIC-A1307-004R
2002-2003 PRACTICE MATERIALSNew Jersey Department of EducationHSPA/SRA MATHEMATICSSample Response & Scoring Rubric
Sample Response:
A) slope of AB = 2 ( 2) 43 0 3
− − = =− − − −
43
slope of DC = 4 8 48 5 3
− −= =− −
43
slope of BC = 2 4 60 8 8
− − −= =− −
34
slope of AD = 2 8 63 5 8− −= =
− − −34
slope of AC = 2 4 23 8 11− −= =
− − −2
11
slope of BD = 2 8 100 5 5
− − −= =− −
2
B) 1) ABCD is a parallelogram.AB and DC have equal slopes so AB is parallel to DC.BC and AD have equal slopes so BC is parallel to AD.ABCD is a parallelogram because if a quadrilateral has both pairs of opposite sides parallel, then itis a parallelogram.
2) ABCD is a rectangle.The slopes of AB and BC are opposite reciprocals, so AB is perpendicular to BC.(note: any pair of consecutive sides can be used here.)ABCD is a rectangle because if a parallelogram has one right angle, then it is a rectangle.
3) ABCD is NOT a rhombus.The slopes of AC and BD are not opposite reciprocals so AC is not perpendicular to BD. Since thediagonals of the parallelogram are not perpendicular, it is NOT a rhombus.
4) ABCD is NOT a square.Since ABCD is not a rhombus it cannot be a square because to be a square a figure must be both arectangle and a rhombus.

35
New Jersey Department of Education Page 2 of 2HSPA/SRA Mathematics
3 Points The response contains correct answers to both parts with explanation provided forpart B. In part A, the response determines that the slopes of AB and DC are both43−
, the slopes of BC and AD are both 34
, the slope of AC is 211
, and the slope of
BD is 2. In part B, the response determines that ABCD is a rectangle and aparallelogram, but is not a rhombus or a square, and includes acceptableexplanations for each case.
Note: Among others, the response might show mathematical justifications usingthe following theorems:• If one pair of opposite sides of a quadrilateral is both congruent and parallel,
then the quadrilateral is a parallelogram.• If both pairs of opposite angles of a quadrilateral are congruent, then the
quadrilateral is a parallelogram.• If the diagonals of a quadrilateral bisect each other, then the quadrilateral is a
parallelogram.• If both pairs of opposite sides of a quadrilateral are congruent, then the
quadrilateral is a parallelogram.• If each diagonal of a quadrilateral bisects opposite angles of a quadrilateral,
then the quadrilateral is a rhombus.• If the diagonals of a quadrilateral bisect each other, then the quadrilateral is a
rhombus.• If the diagonals of a quadrilateral are congruent, then the quadrilateral is a
rectangle or a square.
2 Points There is evidence of work shown for both parts. For part A, at least four slopesare correctly calculated, and for part B, at least two sections are correctlyanswered.ORPart A has six correct answers calcualted and the student correctly explainsmathematically the classifications of at least two of the quadrilaterals.ORPart B has four correctly answered sections and the student made an attempt toanswer part A with some valid work shown.
1 Point At least one correct slope is provided or one correct answer for part B isidentified.
0 Points The response shows insufficient understanding of the problem’s essentialmathematical concepts. The procedures, if any, contain major errors. There maybe no explanation of the solution or the reader may not be able to understand theexplanation. The reader may not be able to understand how and why decisionswere made. A1307-004R

36
Score Point 1The response shows limited understanding of the problem’s essentialmathematical concepts. The response and procedures are incomplete.

37

38
Score Point 2Part A has six correct answers calculated and the student correctly explainsmathematically the classifications of at least two of the quadrilaterals.

39
Score Point 0The student rewrote the problem as his/her response. The response showsinsufficient understanding of the problem’s essential mathematical concepts.

40
HSPA/SRA MATHEMATICSSample PAT #4
Cluster 2/Macro APAT-A1106-003S
“A rectangular board and its shadow.”

41
CLUSTER 2/MACRO A Page 1 of 2PAT-A1106-003S
2002-2003 PRACTICE MATERIALSNew Jersey Department of EducationHSPA/SRA MATHEMATICSPerformance Assessment Task (PAT)
A rectangular board that measures 2 m wide and 10 m long is leaning against a wall, as shown below.The sun is shining directly above the board.

42
New Jersey Department of Education Page 2 of 2HSPA/SRA MathematicsCLUSTER 2/MACRO A
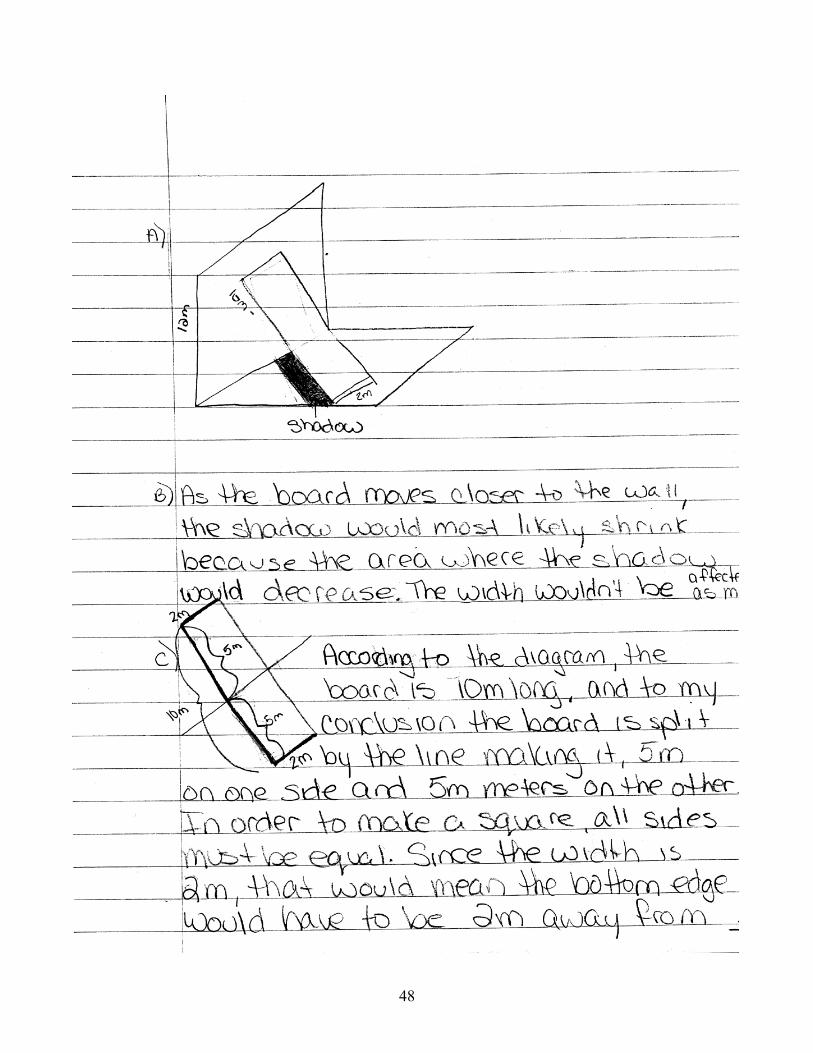
A) Sketch the shape of the shadow that the board makes on the ground.
B) If the sun’s rays are vertical, describe how moving the bottom edge of the board closer to the wallwould affect the width and the length of the shadow on the ground.
C) How close to the wall should the bottom edge of the board be positioned so that the shadow of theboard forms a square? Explain.
D) Find the height at which the top of the board touches the wall when the shadow on the ground is asquare. Explain how you found your answer.
Materials/Resources:CalculatorHSPA Mathematics Reference Sheet
Techniques for PAT Scoring:See Mathematics Item-Specific Rubric A1106-003R for this PAT.
A1106-003S

43
CLUSTER 2/MACRO A Page 1 of 2RUBRIC-A1106-003R
2002-2003 PRACTICE MATERIALSNew Jersey Department of EducationHSPA/SRA MATHEMATICSSample Response & Scoring Rubric
Sample Response:
A) Shadow will be a rectangle.
B) This would shorten the shadow’s length, but this would not affect the shadow’s width at all.
C) The shadow of the board will be in the shape of a square when the distance between the ramp’sbase and the wall is the same as the ramp’s width of 2 meters.
D) 9.79 or 9.8 meters
2 2 210 2 x− =100 4 96− =
96 x=9.79x = or 9.8

44
New Jersey Department of Education Page 2 of 2HSPA/SRA Mathematics
3 Points The response contains four correct responses with appropriate sketches,descriptions, and explanations as required.
2 Points The response addresses all four parts of the questions correctly, but for one or twocases the explanations are incomplete or missing.ORThree parts of the questions are answered correctly with explanations as required.The fourth part may be missing or incorrect.ORPart D and one other part are answered completely and correctly.
1 Point Either part A, B, or C of the question is addressed and answered completely andcorrectly.ORTwo parts of the question are addressed with correct or partially correctexplanations.
0 Points The response shows insufficient understanding of the problem’s essentialmathematical concepts. The procedures, if any, contain major errors. There maybe no explanation of the solution or the reader may not be able to understand theexplanation. The reader may not be able to understand how and why decisionswere made.
A1106-003R

45

46
Score Point 1Part C of the question is addressed and answered completely and correctly.

47
Score Point 0The response shows insufficient understanding of the problem’s essentialmathematical concepts. The procedures, if any, contain major errors.
48

49
Score Point 1The student demonstrated a limited understanding of the problem’s essentialmathematical concepts. The student’s response to part C is correct (thebottom edge would have to be 2m away from the wall since the width is 2m).Part B is somewhat correct, “the shadow would most likely shrink”; however,the student then states that the “width wouldn’t be affected as much.”

50
Score Point 2The response shows nearly complete understanding of the problem’s essentialmathematical concepts. The student executes nearly all procedures and givesrelevant responses to most parts of the task. The response has minor errors(the width is not mentioned in part B) and the explanations detailing how theproblem was solved are unclear (part D).

51
HSPA/SRA MATHEMATICSSample PAT #5
Cluster 3/Macro BPAT-B1312-005S
“Mr. Johnson’s science classroom’s fish tanks.”

52
CLUSTER 3/MACRO B Page 1 of 1PAT-B1312-005S STUDENT ID No:
2002-2003 PRACTICE MATERIALSNew Jersey Department of EducationHSPA/SRA MATHEMATICSPerformance Assessment Task (PAT)
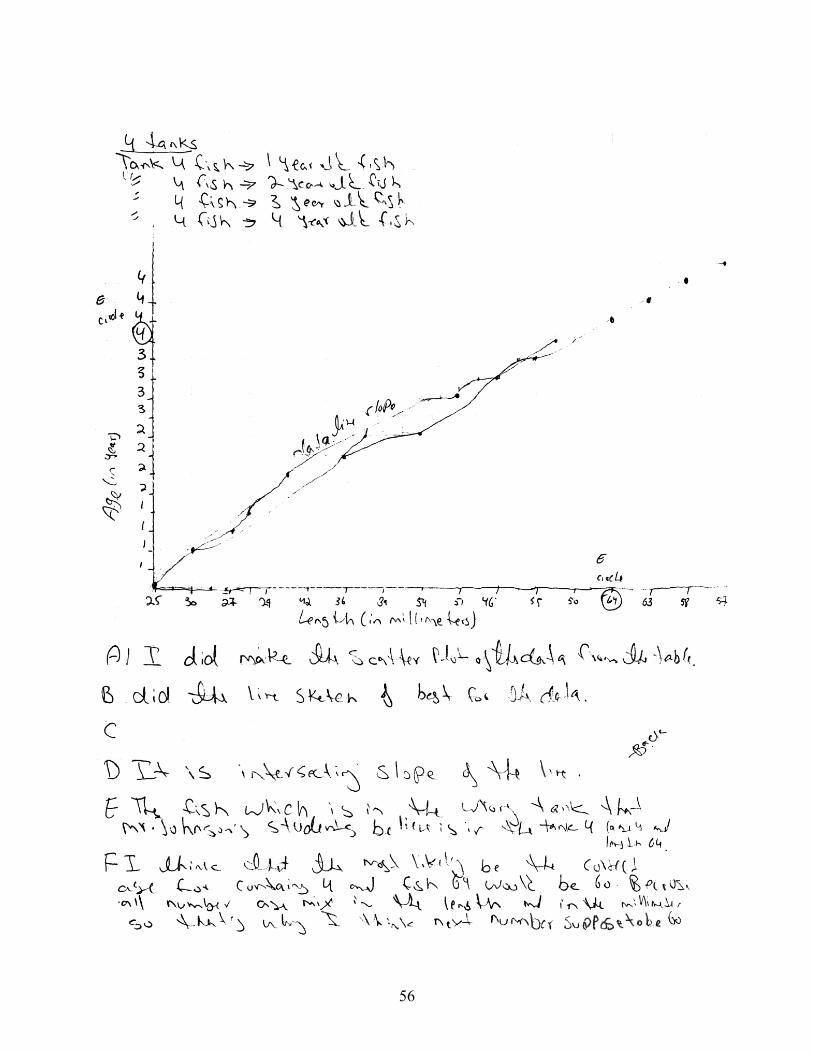
Mr. Johnson’s science classroom has 4 fish tanks filled with the same type of fish. Each tank contains4 fish that are the same age. One tank contains one-year-old fish, another tank contains two-year-oldfish, another tank contains three-year-old fish, and the last tank contains four-year-old fish. Thestudents measured the length of each fish and made the following chart comparing the age of each fishto the length of the fish in millimeters.
AGE (in years) 1 1 1 1 2 2 2 2 3 3 3 3 4 4 4 4
LENGTH (in millimeters) 25 30 27 29 42 36 39 54 51 46 55 50 64 63 58 57
A) Make a scatter plot of the data from the table.
B) Sketch a line of best fit for the data.
C) Find the slope of the line of best fit for the data.
D) What meaning does the slope of the line of best fit have for this particular application?
E) Mr. Johnson’s students believe that one of the fish is in the wrong tank and therefore has the wrongage recorded. Circle the point on your scatter plot that represents this fish.
F) What would most likely be the correct age for this fish? Explain how you found your answer.
Materials/Resources:CalculatorHSPA Mathematics Reference SheetGraph Paper
Techniques for PAT Scoring:See Mathematics Item-Specific Rubric B1312-005R for this PAT.

53
CLUSTER 3/MACRO B Page 1 of 3RUBRIC-B1312-005R
2002-2003 PRACTICE MATERIALSNew Jersey Department of EducationHSPA/SRA MATHEMATICSSample Response & Scoring Rubric
Sample Response:
A), B)
C) 10, I had the points (1, 27) and (2, 37) on my line of best fit. The slope is 37 27 102 1
− =−
D) the number of millimeters the fish grow each year
OR
the yearly average growth rate of the fish
OR
the amount of growth per year
x
y
(IN YEARS)

54
New Jersey Department of Education Page 2 of 3HSPA/SRA MathematicsCLUSTER 3/MACRO B
E) See graph above.
F) 3 years old. I sketched a line of best fit and the x-value for the y-value of 54 is 3.
OR
I noticed that the 3-year-old fish measured in the 50s.
B1312-005R

55
New Jersey Department of Education Page 3 of 3HSPA/SRA Mathematics
3 Points The student correctly answers all of the question’s six parts, though there maybe one or more minor errors. For part A, the scatter plot includes all 16 points(complete graphical precision is not necessary) and supports a positiverelationship between age and length of the fish. In part B, the line ispositively sloped and looks like it reasonably approximates the best fit line.In part C, the correct slope is found for the student’s line of best fit. In part D,the response states that the slope shows the average annual growth of fish, inmillimeters, even though it may not include the word “average.” In part E, thecircled point corresponds to the outlier, (2, 54). In part F, age 3 is correctlyidentified and an adequate explanation is given.
2 Points Either an attempt is made to answer all six parts of the problem, or correctsolutions to four parts are presented. The scatter plot may be sloppily drawn, theslope is incorrectly found despite an attempt to do so, or there may be otherminor errors in the response.
1 Point An attempt is made to answer at least four parts of the problem, and a correctsolution to two parts is presented. There are major errors in the response, suchas failing to correctly identify the relationship between length and age in partD, and/or drawing a best fit line that is flat or has a negative slope.
0 Points The response shows insufficient understanding of the problem’s essentialmathematical concepts. The procedures, if any, contain several serious errors.The student has difficulty understanding the directions, there may be noexplanation of the solution, or the explanation may not be understandable.
B1312-005R
56

57
Score Point 0The response shows insufficient understanding of the problem’s essentialmathematical concepts. The procedures contain major errors.

58
Score Point 1The student has a limited understanding of the problem’s essentialmathematical concepts. The student correctly drew the scatter plot, could notdraw a line of best fit, did not attempt to find the slope of the line of best fit,could not identify the meaning of the slope of the line of best fit, correctlycircled the point that represented the fish in the wrong tank, and correctlyidentified the correct age of that fish.

59
Score Point 2Correct solutions to four parts are presented (A, B, E, and F). The slope wasincorrectly found but there was an attempt to do so.

60
Score Point 2An attempt is made to answer all six parts of the problem. The studentdemonstrated a nearly complete understanding of the essential mathematicalconcepts presented. There were minor errors in the response.
61
HSPA/SRA MATHEMATICSSample PAT #6
Cluster 3/Macro DPAT-D1606-006S
“Classroom networks”

62
CLUSTER 3/MACRO D Page 1 of 2PAT-D1606-006S STUDENT ID No:
2002-2003 PRACTICE MATERIALSNew Jersey Department of EducationHSPA/SRA MATHEMATICSPerformance Assessment Task (PAT)
Classroom A
Classroom B MediaCenter
Classroom C
The technology teacher would like to network 3 different classrooms (A, B, and C) and the mediacenter, so that each classroom is connected to the media center and to each other. One connection runsboth ways between classrooms, so once classroom A is connected to classroom B, B is also connectedto A.
A) Altogether, how many connections will need to be made for the computer network to be completedbetween the 3 classrooms and the media center? List all the possible connections and draw adiagram showing all the connections.
B) After starting with 3 classrooms, more connections are added and by the end of the month there are15 connections in all. All connections are made for each classroom before adding another. What isthe total number of classrooms that are connected to each other and to the media center? List all thepossible connections, or draw a diagram showing all the connections.

63
New Jersey Department of Education Page 2 of 2HSPA/SRA Mathematics STUDENT ID No: CLUSTER 3/MACRO D
C) Study the table below and complete the duplicate table provided for your use on the following page.Write a formula or rule, in terms of n, that represents the pattern used to determine the number ofconnections needed for n classrooms to be connected to the media center and each other. Be sureto write your answers on the duplicate chart provided.
# of classrooms # of connections1 ?2 ?3 ?4 ?5 ?6 ?7 ?? ?? ?? ?n ?
D) Use your formula from Part C to show the number of connections if 10 classrooms are to benetworked.
Materials/Resources:CalculatorHSPA Mathematics Reference Sheet
Techniques for PAT Scoring:See Mathematics Item-Specific Rubric D1606-006R for this PAT.
D1606-006SNew Jersey Department of EducationHSPA/SRA Mathematics

64
CLUSTER 3/MACRO DPAT-D1606-006S
USE THIS TABLE FOR PART C.
# of classrooms # of connections1234567
n

65
CLUSTER 3/MACRO D Page 1 of 4RUBRIC-D-1606-006R
2002-2003 PRACTICE MATERIALSNew Jersey Department of EducationHSPA/SRA MATHEMATICSSample Response & Scoring Rubric
Sample Response:
A) 6 connections
AM, BM, CM, AB, AC, BC
OR
OR

66
New Jersey Department of Education Page 2 of 4HSPA/SRA MathematicsCLUSTER 3/MACRO D
B) 5 classrooms
AM, BM, CM, DM, EM, AB, AC, AD, AE, BC, BD, BE, CD, CE, DE
OR
OR
D1606-006RNew Jersey Department of Education Page 3 of 4HSPA/SRA Mathematics
67
CLUSTER 3/MACRO D
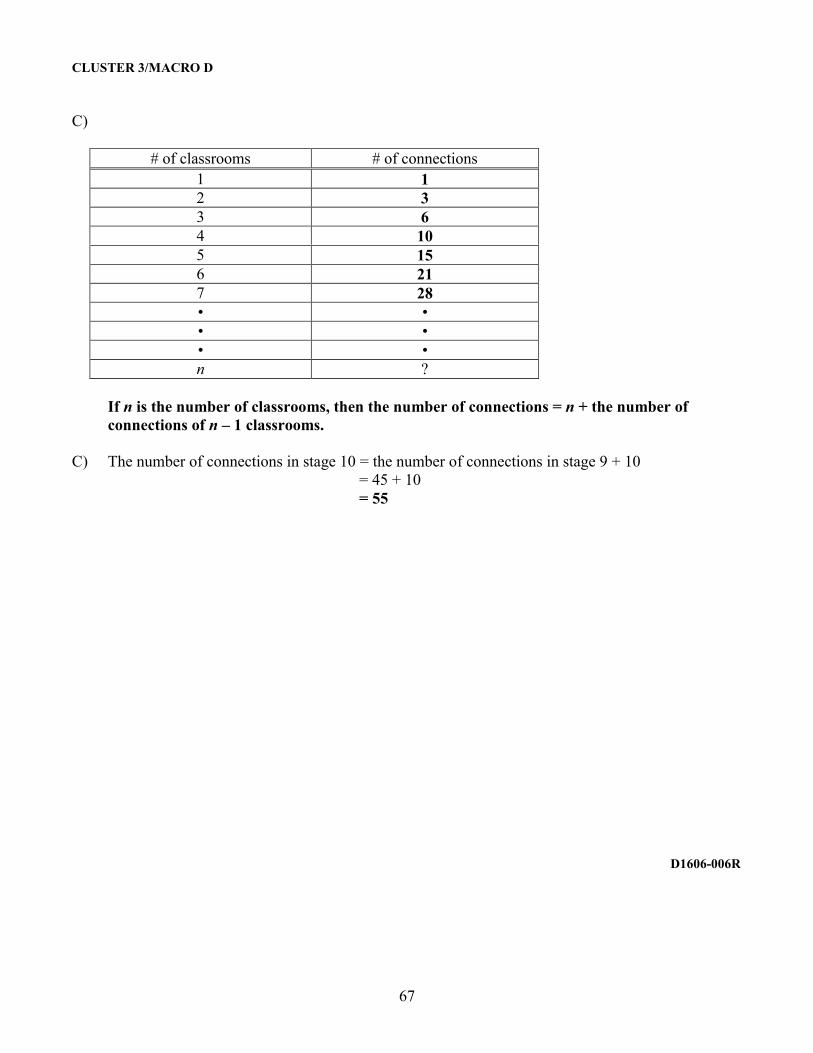
C)
# of classrooms # of connections1 12 33 64 105 156 217 28• •• •• •n ?
If n is the number of classrooms, then the number of connections = n + the number ofconnections of n – 1 classrooms.
C) The number of connections in stage 10 = the number of connections in stage 9 + 10= 45 + 10= 55
D1606-006R
68
New Jersey Department of Education Page 4 of 4HSPA/SRA Mathematics
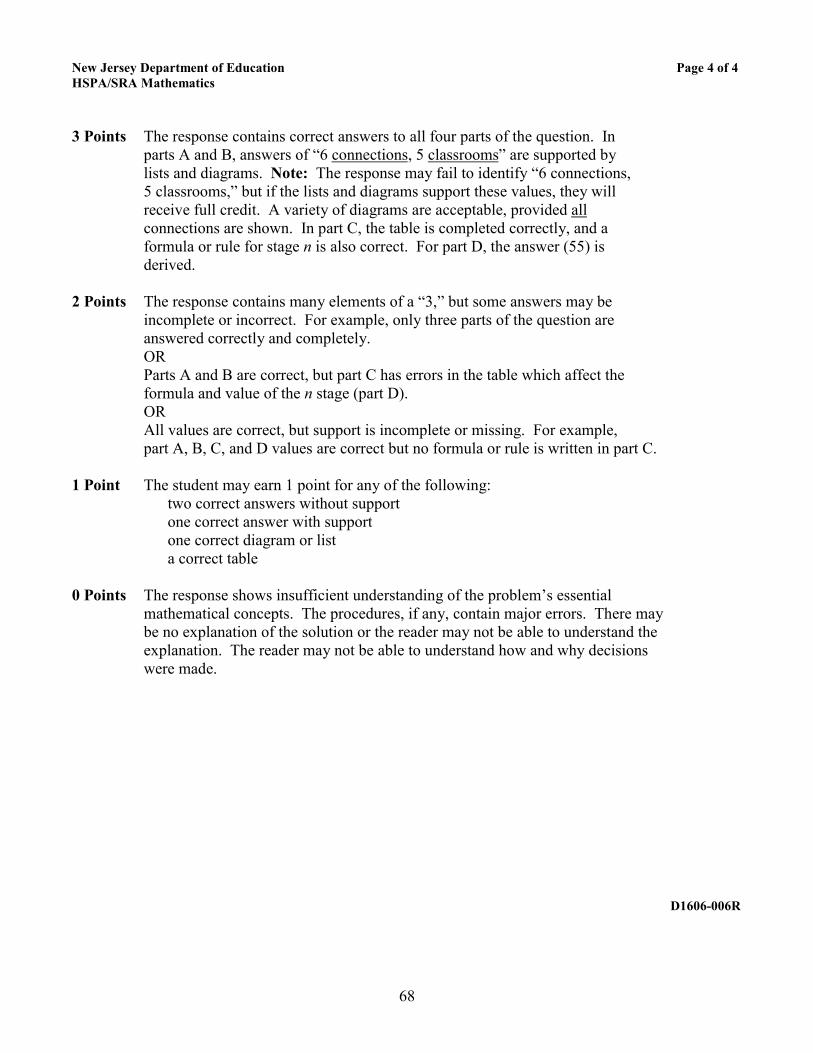
3 Points The response contains correct answers to all four parts of the question. Inparts A and B, answers of “6 connections, 5 classrooms” are supported bylists and diagrams. Note: The response may fail to identify “6 connections,5 classrooms,” but if the lists and diagrams support these values, they willreceive full credit. A variety of diagrams are acceptable, provided allconnections are shown. In part C, the table is completed correctly, and aformula or rule for stage n is also correct. For part D, the answer (55) isderived.
2 Points The response contains many elements of a “3,” but some answers may beincomplete or incorrect. For example, only three parts of the question areanswered correctly and completely.ORParts A and B are correct, but part C has errors in the table which affect theformula and value of the n stage (part D).ORAll values are correct, but support is incomplete or missing. For example,part A, B, C, and D values are correct but no formula or rule is written in part C.
1 Point The student may earn 1 point for any of the following:two correct answers without supportone correct answer with supportone correct diagram or lista correct table
0 Points The response shows insufficient understanding of the problem’s essentialmathematical concepts. The procedures, if any, contain major errors. There maybe no explanation of the solution or the reader may not be able to understand theexplanation. The reader may not be able to understand how and why decisionswere made.
D1606-006R

69

70
Score Point 2Parts A and B are correct, but part C has errors in the table which affect theformula and value of the n stage (part D).

71
Score Point 2Parts A and B are correct.

72
Score Point 1One correct diagram (A).

73
Score Point 0The response shows insufficient understanding of the problem’s essentialmathematical concepts. The procedures contain major errors.

74
HSPA/SRA MATHEMATICSSample PAT #7
Cluster 4/Macro APAT-A1108-007S
Patterns, sequences & limits

75
CLUSTER 4/MACRO A Page 1 of 1PAT-A1108-007S STUDENT ID No:
2002-2003 PRACTICE MATERIALSNew Jersey Department of EducationHSPA/SRA MATHEMATICSPerformance Assessment Task (PAT)
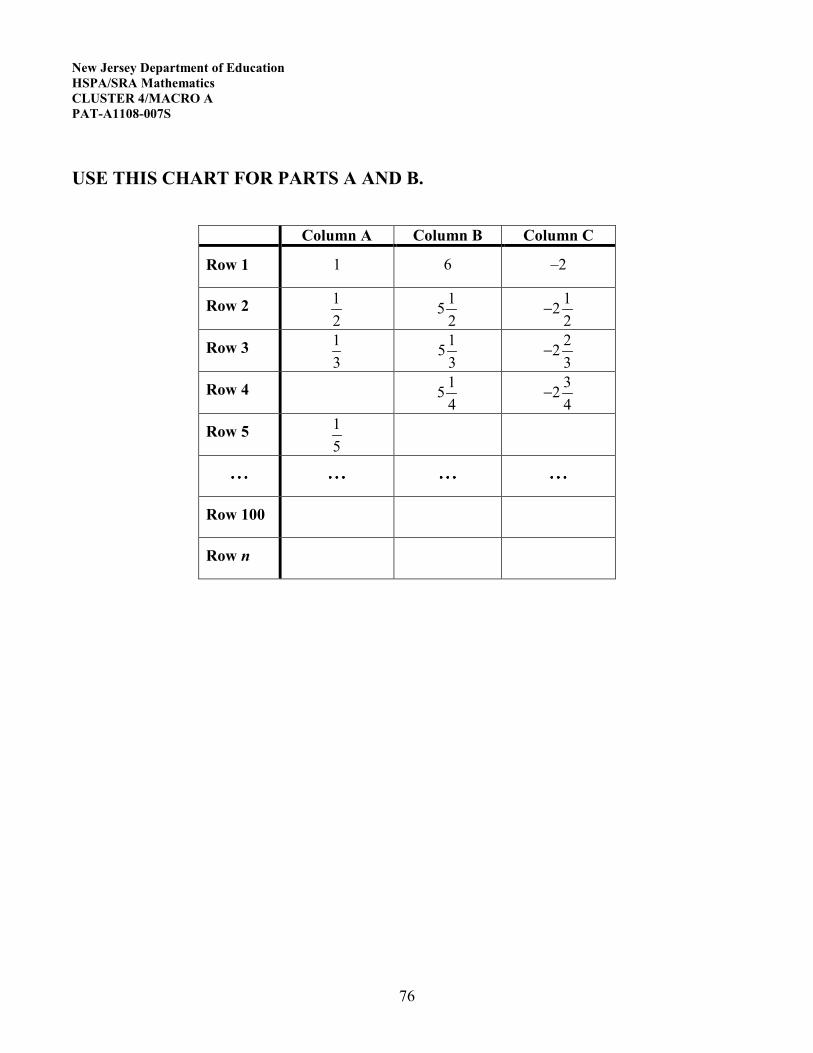
Assume that the following table continues forever, to the nth row. (Do not write in the chart below. Aduplicate chart has been provided for your use).
Column A Column B Column C
Row 1 1 6 –2
Row 2 12
152
122
−
Row 3 13
153
223
−
Row 4 ? 154
324
−
Row 5 15
? ?
………… ………… ………… …………Row 100 ? ? ?Row n ? ? ?
A) Complete rows 4 and 5 in the duplicate chart provided.
B) What numbers belong in row 100? Write your answers in the chart provided.
C) Write expressions to determine the values of the nth row, for columns A, B, and C.
D) What number do the values of column A approach? What number do the values of column Capproach? Explain your answers or show what the values approach on a number line to supportyour answer.
Materials/Resources:CalculatorHSPA Mathematics Reference Sheet
Techniques for PAT Scoring:See Mathematics Item-Specific Rubric A1108-007R for this PAT.
76
New Jersey Department of EducationHSPA/SRA MathematicsCLUSTER 4/MACRO APAT-A1108-007S
USE THIS CHART FOR PARTS A AND B.
Column A Column B Column C
Row 1 1 6 –2
Row 2 12
152
122
−
Row 3 13
153
223
−
Row 4 154
324
−
Row 5 15
………… ………… ………… …………
Row 100
Row n

77
CLUSTER 4/MACRO A Page 1 of 3RUBRIC-A1108-007R
2002-2003 PRACTICE MATERIALSNew Jersey Department of EducationHSPA/SRA MATHEMATICSSample Response & Scoring Rubric
Sample Response:
A) and B)Column A Column B Column C
Row 1 1 6 –2
Row 2 12
152
122
−
Row 3 13
153
223
−
Row 4 14
154
324
−
Row 5 15
155
− 425
………… ………… ………… …………Row 100 1
10015
100− 992
100Row n
C) Column A = 1n
Column B = +1 5n
Column C = −1 3n
OR
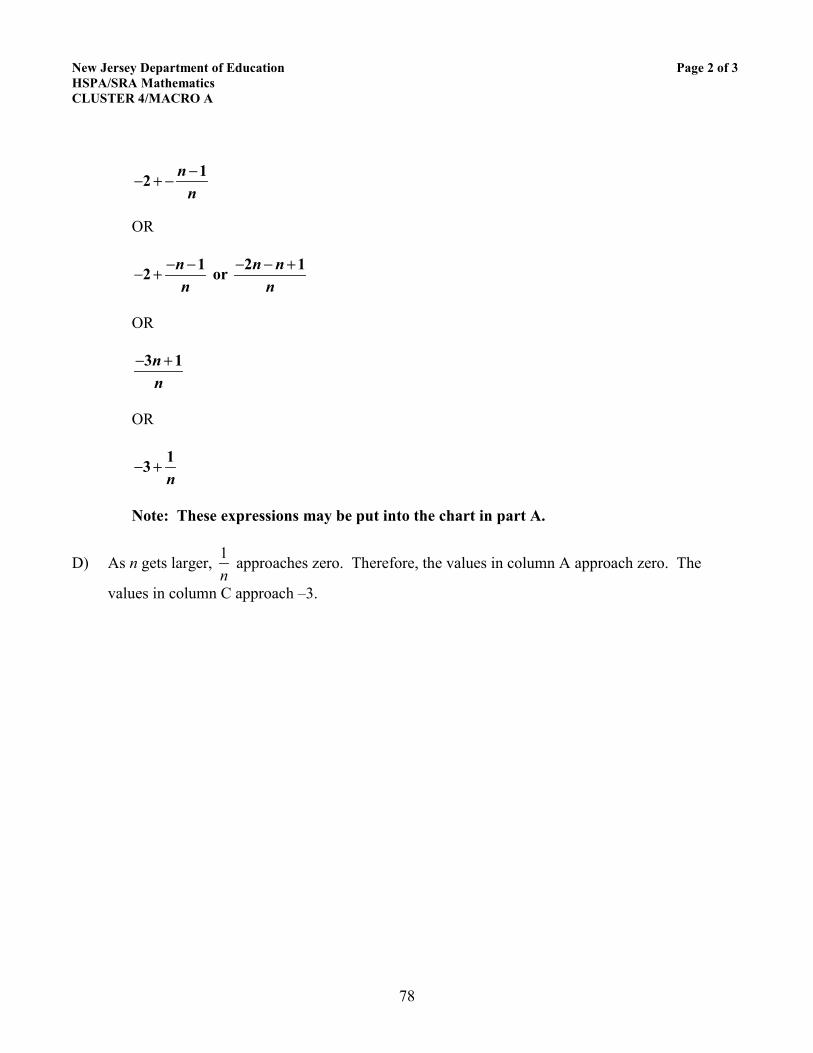
78
New Jersey Department of Education Page 2 of 3HSPA/SRA MathematicsCLUSTER 4/MACRO A
−− + − 12 nn
OR
− −− + 12 nn
or − − +2 1n nn
OR
− +3 1nn
OR
− + 13n
Note: These expressions may be put into the chart in part A.
D) As n gets larger, 1n
approaches zero. Therefore, the values in column A approach zero. The
values in column C approach –3.

79
New Jersey Department of Education Page 3 of 3HSPA/SRA Mathematics
3 Points The response addresses all four parts of the questions, arriving at correct valuesor expressions shown in the sample response. In part D, the values 0 and –3 aresupported by an explanation.
2 Points The 2-point response contains many elements of the 3-point response, butsomething is incomplete, incorrect, or missing. Any one of the followingwould lower the score to a “2”:• Two incorrect table entries in rows 4, 5, or 100 (parts A + B)• An incorrect expression for row n (part C)• An incorrect value in part D with an incomplete or missing explanation• Responding to only 3 parts of the question, i.e., omitting one part
completely
1 Point Only one part of question (A, B, C, or D) is completely correct,ORThere is some correct work in several parts, but not enough to qualify for a “2.”
0 Points The response shows insufficient understanding of the problem’s essentialmathematical concepts. The procedures, if any, contain major errors. Theremay be no explanation of the required solutions or the explanation may not beunderstandable. How decisions were made may not be readilyunderstandable.

80
Score Point 2Parts A and B are correct. Error in part C – row n, column C. One incorrectvalue in part D.

81
Score Point 1Part A has an error in row 5, column C. Part B has an error in row 100,column C. Part C has an error in row n, column C. Part D was not attempted.

82

83
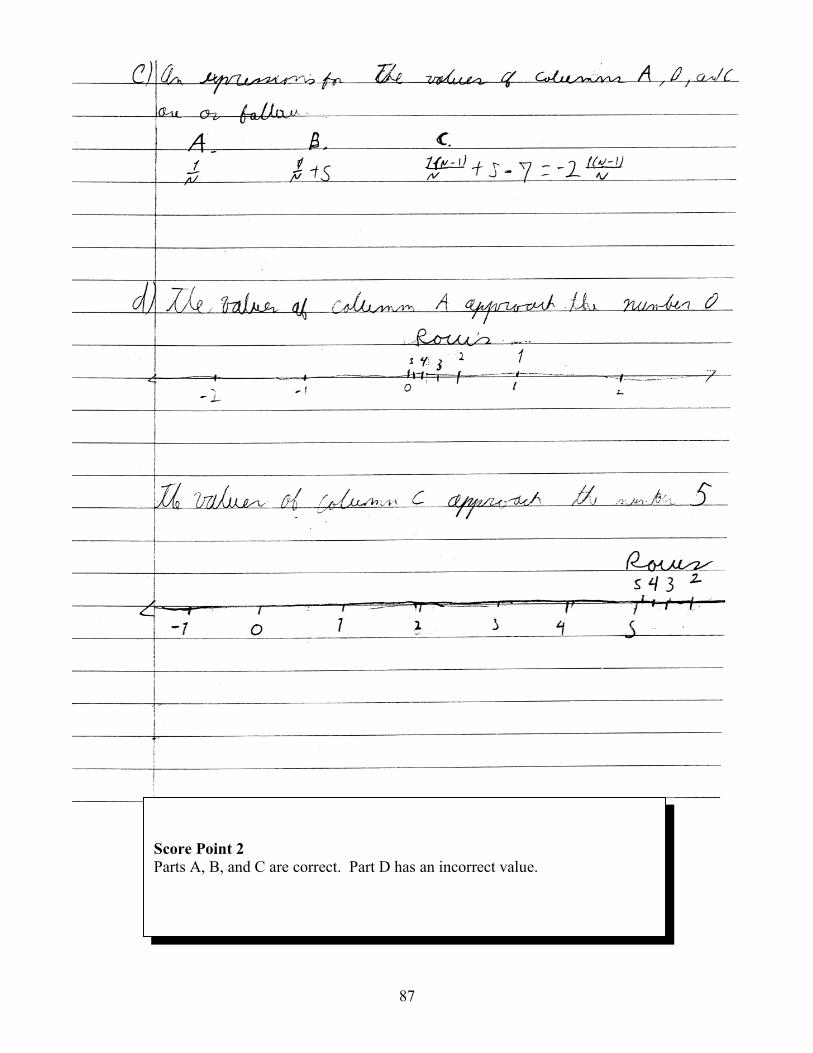
Score Point 2Parts A, B, and C are correct. Part D has an incorrect value.

84

85
Score Point 0The response shows insufficient understanding of the problem’s essentialmathematical concepts. The procedures contain major errors.

86
87
Score Point 2Parts A, B, and C are correct. Part D has an incorrect value.

88
HSPA/SRA MATHEMATICSSample PAT #8
Cluster 4/Macro CPAT-C1006-008S
“Sheila decides to wallpaper her basement.’

89
CLUSTER 4/MACRO C Page 1 of 2PAT-C1006-008S STUDENT ID No:
2002-2003 PRACTICE MATERIALSNew Jersey Department of EducationHSPA/SRA MATHEMATICSPerformance Assessment Task (PAT)
The length of the rectangular playroom in Sheila’s basement is 1 ½ times its width. The room has nowindows and has a height of 8 feet. Sheila has decided to wallpaper the entire room and put a borderover the wallpaper at the top around the room. To determine how much wallpaper is needed, she hasto add together the area of each wall to get the total surface area of the room. The door to this roommeasures 2.5 feet wide by 6.5 feet high and will not need wallpaper.
One wall of basement
Wallpaper
Border

90
New Jersey Department of Education Page 2 of 2HSPA/SRA Mathematics STUDENT ID No: CLUSTER 4/MACRO C
A) Let x be the width of the room. Write and simplify an equation in terms of x to determine the totalsurface area (S) of the playroom’s walls.
B) The playroom is 12 feet wide. Each roll of wallpaper will cover approximately 56 square feet.The wallpaper has no pattern; therefore, it is not necessary to allow for matching patterns whencalculating the amount of wallpaper to purchase. What is the least number of rolls Sheila willneed to paper her room? Show your work.
C) Sheila plans to spend no more than $350.00 (ignore tax) on the wallpaper and border. The bordercosts $19.97 per 10-yard roll. The border will be pasted onto the wallpaper at the top of each wallwith no overlap. Explain how to determine the most expensive wallpaper Sheila can buy whilestaying within her budget.
Materials/Resources:CalculatorHSPA Mathematics Reference Sheet
Techniques for PAT Scoring:See Mathematics Item-Specific Rubric C1006-008R for this PAT.
C1006-008SCLUSTER 4/MACRO C Page 1 of 2RUBRIC-C1006-008R

91
2002-2003 PRACTICE MATERIALSNew Jersey Department of EducationHSPA/SRA MATHEMATICSSample Response & Scoring Rubric
Sample Response:
A) S = 8x + 8(1.5x) + 8x + 8(1.5x) – (2.5)(6.5)S = 8x + 12x + 8x + 12x – 16.25S = 40x – 16.25
B) S = 40x – (2.5)(6.5)S = 40(12) – (2.5)(6.5)S = 480 – (2.5)(6.5) = 463.75 sq. ft.463.75 ÷ 56 ≈ 8.28 ≈ 9 rolls9 rolls Answer
C) First, Sheila has to determine how much border she needs. The perimeter of the room is12 + 18 + 12 + 18 = 60 feet, which is 20 yards. She would need 2 rolls of border which costs$39.94. Subtract $39.94 from $350.00 and that leaves $310.06 to spend on wallpaper. If she
needs 9 rolls, then 310.06 $34.45.9
≈ Sheila can spend no more than $34.45 per roll on wallpaper
and still be within her budget.

92
New Jersey Department of Education Page 2 of 2HSPA/SRA Mathematics
3 Points The student correctly answers all three parts of the question. In part A, thestudent writes and simplifies an equation, leading to S = 40x – 16.25 as theanswer.
In part B, the student uses the answer to part A, substituting the given value(12) for x and subtracting the area of the door before dividing by 56. Thestudent rounds up the answer (8.28) to 9 rolls.
In Part C, the following calculations are done correctly: finding the perimeterin feet and converting to yards, finding the number of rolls of border and itscost, subtracting the cost of the border from $350 and dividing the differenceby 9.
An error in computing one of these amounts is allowed provided the process iscorrect. Other answers based on this error will be considered correct if thecorrect procedure is used.
2 Points The response has correct answers for all three parts, but the explanations maybe incomplete or are not clearly stated, leaving the reader to make inferences.ORTwo parts of the problem have correct values and are completely explained;the third part may be missing, have an incorrect value due to a process error,or is missing an explanation.ORThe response has minor computational errors throughout, although theprocedures used are correct.
1 Point One part of the question is correctly done with an adequate explanation.ORThe response contains two correct values without explanation or with partialexplanations.ORThe response overall shows some understanding of the mathematicalconcepts, but contains major errors.ORThe response contains three correct answers, but supporting work and/orexplanations are missing or incorrect.
0 Points The response shows an insufficient understanding of the problem’s essentialmathematical concepts. The procedures, if any, contain major errors. Theremay be no explanation of the solution or the reader may not be able tounderstand the explanation. The reader may not be able to understand howand why decisions were made.

93
Score Point 0The response shows an insufficient understanding of the problem’s essentialmathematical concepts. The procedures contain major errors.

94
Score Point 0The response shows an insufficient understanding of the problem’s essentialmathematical concepts. The procedures contain major errors.

95

96
Score Point 1The response overall shows some understanding of the problem’s essentialmathematical concepts but contains major errors.

97
Score Point 1The student does not find an equation for part A; however, the student doesfind that the area of the room is 463.75 sq ft and that Sheila needs9 rolls of wallpaper.
