specialty property and casualty insurance
TRANSCRIPT

Specialty Property and Casualty InsuranceInvestor PresentationJune 8, 2021

Forward Looking StatementsCertain statements made during this presentation, as well as included in this document, are not historical facts and may be considered“forward-looking statements” and are based on estimates, assumptions and projections which management believes are reasonable butby their nature subject to risks and uncertainties. The Private Securities Litigation Reform Act of 1995 provides a safe harbor for forward-looking statements.
The reasons which could cause actual results and/or financial condition to differ materially from those suggested by such forward-lookingstatements include but are not limited to those discussed or identified from time-to-time in AFG’s filings with the Securities and ExchangeCommission, including the annual report on Form 10-K and the quarterly reports on Form 10-Q. We do not promise to update suchforward-looking statements to reflect actual results or changes in assumptions or other factors that could affect these statements.
Core net operating earnings is a non-GAAP financial measure which sets aside items that are generally not considered to be part ofongoing operations, such as net realized gains and losses, discontinued operations, as well as other significant items that are not able tobe estimated with reasonable precision, or that may not be indicative of ongoing operations. AFG believes that this non-GAAP measureis a useful tool for investors and analysts in analyzing ongoing operating trends of AFG.
2

3
We are specialists in providing P&C insurance products that help businesses manage their unique financial risks and exposures.
Approximately 50% of Specialty P&C Group gross written premium is produced by businesses
with “top 10” market rankings
A History Dating Back Nearly 150 Years
Superior UnderwritingTalent
7.6%Points of COR
outperformance vs. peers over 10 years
CombinedRatio
8 yearsConsecutive years
under 94%

4
Entrepreneurial Culture, Strategic Alignment of Interests
Market Leading P&C Insurance Specialist
Consistent Investment Outperformance
Superior Capital Management and Strong Balance Sheet
Top Tier Specialty Property & Casualty Insurer
5
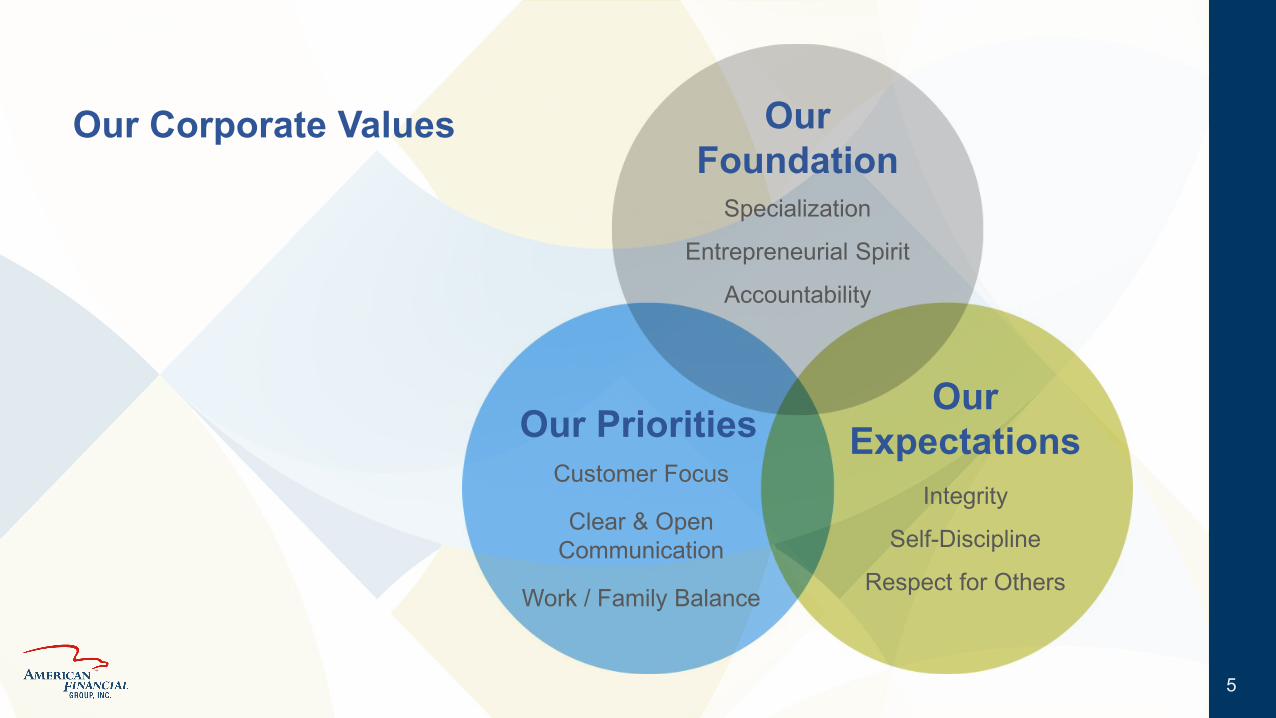
Our Foundation
Our PrioritiesOur
ExpectationsCustomer Focus
Clear & Open Communication
Work / Family Balance
Specialization
Entrepreneurial Spirit
Accountability
Integrity
Self-Discipline
Respect for Others
Our Corporate Values
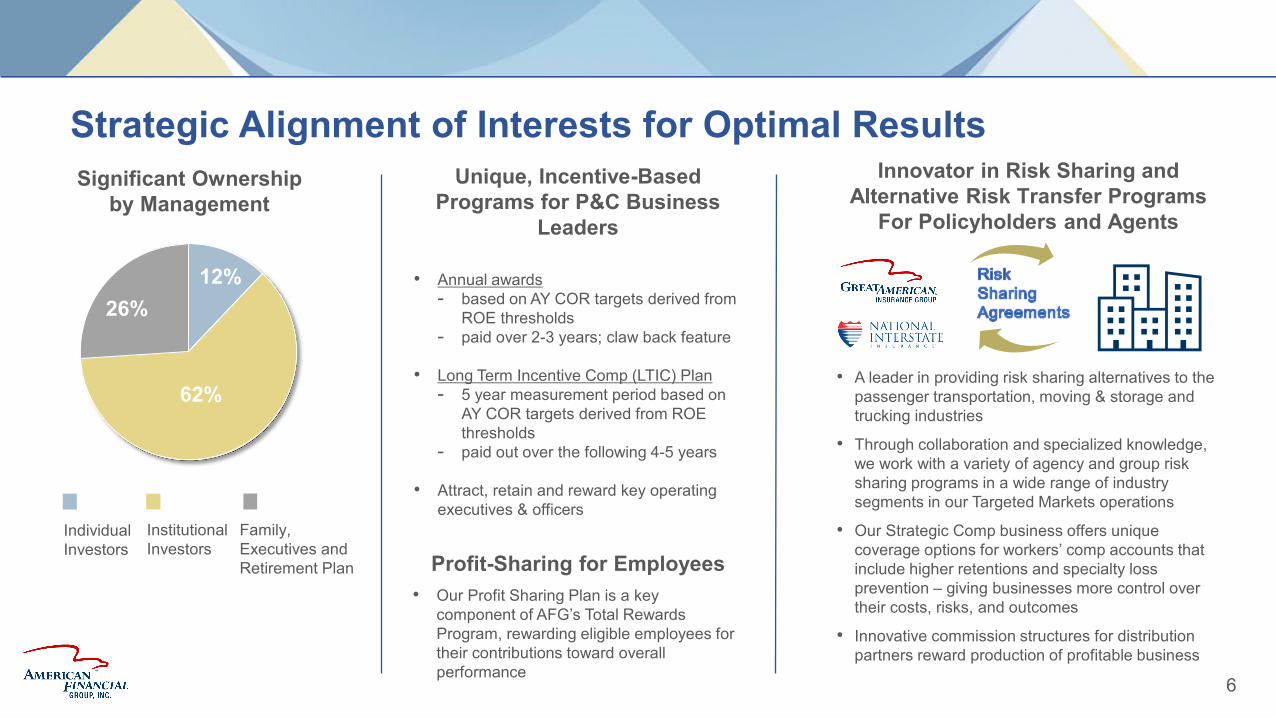
Strategic Alignment of Interests for Optimal Results
6
12%
62%
26%
Individual Investors
Institutional Investors
Family, Executives and Retirement Plan
Significant Ownership by Management
• Annual awards - based on AY COR targets derived from
ROE thresholds- paid over 2-3 years; claw back feature
• Long Term Incentive Comp (LTIC) Plan - 5 year measurement period based on
AY COR targets derived from ROE thresholds
- paid out over the following 4-5 years
• Attract, retain and reward key operating executives & officers
Unique, Incentive-Based Programs for P&C Business
Leaders
Innovator in Risk Sharing and Alternative Risk Transfer Programs
For Policyholders and Agents
• A leader in providing risk sharing alternatives to the passenger transportation, moving & storage and trucking industries
• Through collaboration and specialized knowledge, we work with a variety of agency and group risk sharing programs in a wide range of industry segments in our Targeted Markets operations
• Our Strategic Comp business offers unique coverage options for workers’ comp accounts that include higher retentions and specialty loss prevention – giving businesses more control over their costs, risks, and outcomes
• Innovative commission structures for distribution partners reward production of profitable business
• Our Profit Sharing Plan is a key component of AFG’s Total Rewards Program, rewarding eligible employees for their contributions toward overall performance
Profit-Sharing for Employees

Building Long-Term Value for AFG Shareholders
7
2011 2012 2013 2014 2015 2016 2017 2018 2019 2020
10%CAGR
Superior P&C Underwriting
Results
Superior Investment
Talent
Intelligent Deployment of
Capitol
= VALUECREATION
10 YEAR VIEW OF
TOTAL VALUE CREATION
Growth in Adjusted BVPS + Dividends
Adjusted Book Value excludes unrealized gains and losses related to fixed maturities.

Higher Returns and Lower Volatility
8
AFG ranks favorably among peers with higher returns and lower volatility
Dowling & Partners – IBNR #15, April 15, 2021. ROTE = Return on Average Tangible Equity

1998 2000 2003 2005 2007 2008 2010 2012 2013 2014 2015 2016 2018 20202019 2021
Focusing on What We Know Best
9
Acquisition of Employers Comp Associates (ECA)
Sale of Commercial Lines Division
IPO of Infinity Property and Casualty; exit personal auto business
Start-up of Financial Institution Services
Acquisition of Farmer’s Crop Insurance Alliance
IPO of National Interstate Corporation
Acquired all minority shares of Great American Financial Resources, Inc.
Start-up of EnvironmentalDivision
Acquisitions of Strategic Comp & MarketformGroup Ltd.
Acquisition of Vanliner
Start-up of Public Sector Division
Start-up of Professional Liability Division
Acquisition of Summit Holding Southeast, Inc.
Start-up of Aviation Division
Acquisition of Public Sector renewal rights
Start-up of M&A Liability Division
Acquired remaining 49% of NATL shares not owned by AFG
Start-up ofEl AguilaSpecialty P&C Division
Start-up of Great American’s Singapore branch
Acquired ABA Insurance Services Inc. (ABAIS)
Sale of Neon and exit from Lloyd’s market
Start-up of Accident & Health Business
Acquired Atlas Financial paratransit business
Sale of Annuity Business
Acquired Tank Owner Members Insurance Company (TOMIC) business
DispositionsStart-Ups Acquisitions
Sale of Medicare supplement & critical illness businesses
Sale of long-term care business

10
Agribusiness (farm & ranch)
Commercial Automobile
Commercial Property
Crop
Equine Mortality
Inland and Ocean Marine
Excess and Surplus
Executive and Professional Liability
General Liability
M&A Liability
Public Entities
Targeted Programs
Umbrella and Excess Liability
Workers’ Compensation
We are specialists in
providing property and
casualty insurance
solutions that fulfill today’s
needs and tomorrow’s
dreams. We are a trusted
partner in delivering long-
term value to our
customers, employees and
investors.
Fidelity / Crime
Financial Institution Services
Lease and Loan Services
Surety
Trade Credit
PROPERTY & TRANSPORTATION
SPECIALTYCASUALTY
SPECIALTY FINANCIAL
Specialty P&C Insurance Operations

Great American Insurance Company’s Ratings
11
A+ Stable Outlook
A+ Stable Outlook
A1 Stable Outlook
Diversified product offerings in niche marketsConsistent, solid underwriting results
Strong market positions Strong capitalization
Low catastrophe risk profile
Great American Insurance Company is 1 of only 4 companies rated “A” (Excellent)or better by A.M. Best for 110+ years

Specialty Property & Casualty Premium
12
Gross Written Premiums Full Year 2020
$7.0 Billion
Low correlation • Lower relative coastal exposure
Approximately 50% of P&C Group GWP produced by businesses with “Top 10” market rankings including:Crop • Equine • Fidelity/Crime • Financial Institution Services • FL Workers Comp • Moving & Storage •
Non-Profit/Social Services • Ocean Marine • Passenger Transportation • Trade Credit • Trucking
Net Written Premiums Full Year 2020
$5.0 Billion
40%
49%
11%
38%
46%
12%
4%
Property & Transportation
Specialty Casualty
Specialty Financial
Other Specialty1
1 Includes an internal reinsurance facility.

Diversified Product Portfolio
13
Gross Written Premiums
Agricultural
Transportation
Inland /OceanMarine
Other
Excess &Surplus
Workers’ Compensation
Targeted Markets
Executive & Professional
Liability
Surety, Fidelity &
Other
LenderServices
Specialty Casualty
49%
Property & Transportation
40%
Specialty Financial
11%
2020 GWP $7.0
Billion
Our Property & Casualty insurance operations provide a
wide variety of specialty commercial coverages to niche
industries
GAAP Gross Written Premiums, by AFG Reporting Group
GL & Other

14
Business Spotlight: Crop Insurance Helping generations of farmers manage their risks since 1915
43%
22%
6%
29%
MPCI Premium Breakdown by Crop
Corn Soybeans Wheat Other
2020 GWP MPCI $898
million
Specialized Crop Coverage Including Multiple Peril Crop Insurance (MPCI), Crop-Hail, Named Peril Insurance
One of a select few private companies authorized by the United States Department of Agriculture Risk Management Agency
(USDA RMA) to write MPCI policies.
#5 Ranked Provider of Multi-Peril Crop Insurance
9%Market Share
AFG is the largest U.S.-based parent company of an Approved Insurance Provider (AIP). Great American Insurance Company is one of the few original MPCI program participants.
May 2021 Update• While still early, the crop year is off to a good start. Plantings are ahead of five-year averages and growing conditions are average.• Commodity prices are well above spring discovery prices: Corn up ~25%; Soybeans up ~19%.• We continue to carefully monitor drought conditions in the western states and North Dakota.• Crop premiums expected to grow approximately 30% in 2021.

Superior Underwriting Talent
15
106.7%
104.4%
96.7%97.1% 97.5%
99.6%
102.1%99.7% 99.3%
101.2%
92.7%95.6%
94.1% 93.6% 92.6%
90.2%
93.1%91.8%
92.9%91.9%
80%
85%
90%
95%
100%
105%
2011 2012 2013 2014 2015 2016 2017 2018 2019 2020
14.0% 8.8% 2.6% 3.5% 4.9% 9.4% 9.0% 7.9% 6.4% 9.3%Percentage Points Better
Stat
utor
y C
ombi
ned
Rat
io CommercialLinesIndustry1
AFG2
7.6%Points Better
Over 10 Years
1 Commercial Lines Industry based on data from A.M. Best's Market Segment Report – February 25, 2021.2 American Financial Group Form 10K filings.

Pretax Property & Casualty Returns
16
21.4%17.1%
16.8%16.2%
13.0%12.5%
11.8%11.5%11.3%
8.8%5.4%
4.3%
0% 5% 10% 15% 20% 25%
AFGTravelers
The HartfordW.R. Berkley
CNARLI
Arch CapitalCincinnati Financial
FairfaxMarkel
AlleghanyArgo
23.9%20.9%
18.4%18.1%18.1%
15.5%13.5%13.4%
12.1%10.6%
8.6%6.5%
0% 5% 10% 15% 20% 25% 30%
AFGTravelers
W.R. BerkleyThe Hartford
RLICNA
Arch CapitalFairfaxMarkel
Cincinnati FinancialAlleghany
Argo
20.8%18.8%
16.2%15.8%
15.3%13.3%
11.7%11.3%
9.9%8.0%7.9%
4.8%
0% 5% 10% 15% 20% 25%
AFGTravelers
W.R. BerkleyRLI
The HartfordCNA
Arch CapitalCincinnati Financial
MarkelAlleghany
FairfaxArgo
19.4%17.5%
16.9%15.3%
12.8%10.1%
9.4%7.9%
7.5%7.3%
3.9%0.4%
0% 5% 10% 15% 20% 25%
AFGTravelers
The HartfordW.R. Berkley
RLICNA
Cincinnati FinancialArch Capital
FairfaxMarkel
AlleghanyArgo
15 Years2006 - 2020
10 Years2011 - 2020
5 Years2016 - 2020 2020
Source: Dowling & Partners

Specialty Property & Casualty Premium Growth
17
1 Excluding the impact of workers' compensation, overall Specialty P&C renewal rates are expected to increase in the range of 10% to 12%.
Overall Specialty P&C renewal rates increased approximately 12% in 1Q21. Excluding workers’ compensation, renewal rates increased approximately 16%.
Dollars in billions
$4.3 $4.4 $4.8 $5.0
$5.3 $5.0 $5.4
2015 2016 2017 2018 2019 2020 2021E
P&C Net Written Premium and Renewal Rates
Rate Increases 1% -% 1% 1% 3% 11% 8% - 10% 1

AFG Investment Portfolio
18
As of March 31, 2021
Fixed Maturities
67%
Real Estate and Other
2%
Equities7%
Investments Accounted
for by Equity Method
9%
Mortgage Loans
3%
Cash and Equivalents
12%
Fixed Maturities Portfolio – 87% investment grade; 98% NAIC 1 & 2
Asset-backed24%
Foreign Government
2%US
Government2%
States and Municipalities
24%Collateralized Loan
Obligations12%
Residential MBS9%
Commerical MBS1%
Corporates26%
Carrying Value – $13.9 Billion

Investment Portfolio Information and Outperformance
19
≈ $500 Million Total Return Outperformance
1 2008-2020 time period captures the beginning of the global financial crisis.2 Source: S&P Global Market Intelligence
Fixed IncomeAnnualized Total Return
13 Years Ended 12/31/20201
AFG P&C Group 5.3%
Benchmark: Blended Insurance Industry2 4.5%
Outperformance 0.8%
1 Annualized yield is calculated by dividing investment income for the quarter bythe average cost over the quarter. Average cost is the average of the beginningand ending quarter asset balances.
2 Adjusts the yield on tax-exempt bonds to the fully taxable equivalent yield.
Approximate Average Duration – Fixed Maturitiesas of March 31, 2021
Annualized yield on available for sale fixed maturities
Quarter ended 3/31/2021:
• Net of investment expenses1
• Tax equivalent, net of investment expenses2
AFG Consolidated
3.0 years
3.16%
3.34%

Strong Financial Position
20
Dollars in millions, except per share data
Mar 31, 2021 Dec 31, 2020Principal Amount of Long-Term Debt $ 1,993 $ 1,993Adjusted shareholders' equity1 5,695 5,493Total adjusted capital $ 7,688 $ 7,486
Ratio of debt to total adjusted capital2
Including subordinated debt 25.9% 26.6%Excluding subordinated debt 17.1% 17.6%
Common shares outstanding 85.126 86.345
Book value per share:Book value per share $ 78.53 $ 78.62Adjusted1 66.89 63.61Tangible, adjusted3 64.10 60.82
Parent Company Cash $ 200 $ 2151 Excludes net unrealized gains related to fixed maturity investments.2 The ratio is calculated by dividing the principal amount of long-term debt by total capital, which includes
long-term debt and shareholders’ equity (excl unrealized gains related to fixed maturity investments).3 Excludes unrealized gains related to fixed maturity investments, goodwill and intangibles.
March 31, 2021
Actual
March 31, 2021
Pro FormaAnnuity
Sale
March 31, 2021Pro Forma
Annuity Sale and Special
DividendParent Cash $200 million $3.8 billion $2.6 billion
Excess Capital $1.2 billion $4.5 billion $3.0 billion
Debt to Capital –Incl SubordinatedDebt
25.9% 23.8% 27.7%
Debt to Capital –Excl Subordinated Debt
17.1% 15.7% 18.3%
Pro Forma Financial Information
The pro forma information above is shown “as if” the transaction closed on March 31, 2021, and assumes an after-tax gain on the sale of the annuity business of $690 million (midpoint of estimated range).
These numbers have been adjusted for the cash proceeds received at closing, as well as other impacts of the sale, including AFG Parent acquiring approximately $100 million in directly owned real estate from GALIC and the declaration of a $14.00 per share special dividend on May 28, 2021.

Intelligent Use of Excess Capital
21
Capital Returned to ShareholdersFive Years Ended 12/31/2020
(in millions)
Dividends Paid $ 1,787Repurchases 452
Total $ 2,239
$2.2 Billion Returned to Shareholders
2020 Capital Management• Returned $649 million of capital to shareholders
• 11% increase in regular annual dividend- 15th consecutive annual dividend increase
• Paid $2.00 special dividend in December 2020
• Repurchased $313 million of AFG common shares at an average price per share of $69.02
2021 Capital Management
• Declared $14.00 per share Special Dividend on May 28, 2021
• Pro Forma excess capital at March 31, 2021 approximately $4.5 billion
• Through March 31, 2021 repurchased $192 million of AFG common shares at an average price per share of $108.98
• 3.7 million shares remaining in repurchase authorization as of March 31, 2021. Additional 5.0 million shares authorized for repurchase in May 2021.

Balanced Approach to Capital Allocation
22
Dollars in millions
$246
$104 $141
$355 $384
$506
$231
$360 $304 $320
$421 $403 $446
$649
$235
2007 2008 2009 2010 2011 2012 2013 2014 2015 2016 2017 2018 2019 2020 2021 YTDthru 3/31Regular Dividends Special Dividends Share Repurchases Total
Between years 2009 – 2012, AFG repurchased 33.7 million shares at a weighted average price of approximately 90.5% of adjusted book value (book value per share excluding appropriated retained
earnings and net unrealized gains (losses) related to fixed maturities).

Double-Digit Growth in Regular Dividends
23
($ per share)Annual Regular Dividends Paid
$0.58
$1.85
2010 2011 2012 2013 2014 2015 2016 2017 2018 2019 2020
12.4%CAGR
In addition to the $14.00 per share special dividend declared in May 2021, AFG has paid $16.05 per share in special dividends since 2012
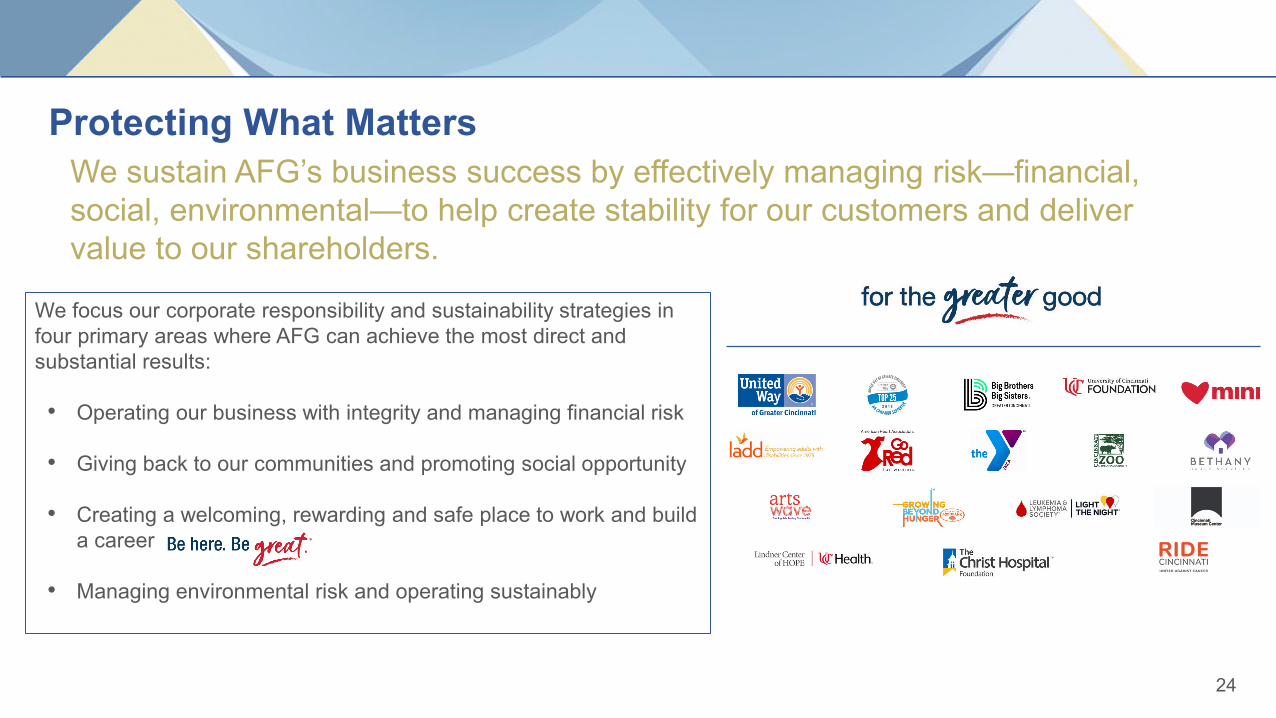
Protecting What Matters
24
We sustain AFG’s business success by effectively managing risk—financial, social, environmental—to help create stability for our customers and deliver value to our shareholders.
We focus our corporate responsibility and sustainability strategies in four primary areas where AFG can achieve the most direct and substantial results:
• Operating our business with integrity and managing financial risk
• Giving back to our communities and promoting social opportunity
• Creating a welcoming, rewarding and safe place to work and build a career
• Managing environmental risk and operating sustainably

2021 Outlook – AFG Specialty P&C Group Outlook
25
NWP Growth Combined Ratio
Specialty P&C Group Overall 7% – 10% 89% – 91%
Business Groups:Property & Transportation 13% – 17% 88% – 92%Specialty Casualty 2% – 5% 87% – 91%
Specialty Casualty Excluding Workers’ Comp 5% – 9%Specialty Financial 7% – 11% 86% – 90%
P&C average renewal rates up 8% to 10% when compared to 2020
AFG’s 2021 core net operating earnings guidance $7.00 to $8.00 per share
• Excludes earnings from the annuity subsidiaries that were sold to MassMutual, effective May 28, 2021, and which are classified as discontinued operations effective January 1, 2021.
• Assumes zero earnings on the cash proceeds from the sale of the annuity operations. Accordingly, AFG’s ultimate results for 2021 will be impacted by the deployment of this capital.

26
Appendix

Sale of Annuity Business to MassMutual
27
Transaction Summary
• Purchase Price = $3.5 billion in cash
• Proceeds based on GAAP shareholders’ equity excluding AOCI of the entities sold = $2.8 billion– GAAP shareholders’ equity excluding AOCI of the
entities to be sold was $3.0 billion at March 31, 2021
• Estimated after-tax gain on the sale of $680 million to $700 million ($7.85 to $8.10 per AFG share) to be recognized at closing
• Prior to completion of the transaction, AFG Parent acquired approximately $100 million in directly owned real estate from GALIC and the P&C Group acquired $460 million in real-estate related investments from GALIC
• On January 27, 2021, AFG announced that it had entered into a definitive agreement to sell its Annuity business to MassMutual
• MassMutual acquired Great American Life Insurance Company (GALIC) and its two insurance subsidiaries, Annuity Investors Life Insurance Company and Manhattan National Life Insurance Company
• Transaction will result in AFG’s exit from the fixed and indexed annuity market

Annuity Segment – 10 Year Value Creation for AFG(Dollars in Millions)
28
12/31/11 ($1,561) GALIC beginning GAAP Equity2012 $150 Dividend to AFG2013 $100 Dividend to AFG2014 $160 Dividend to AFG2015 $110 Dividend to AFG2016 $125 Dividend to AFG2017 $210 Dividend to AFG2018 $50 Dividend to AFG2019 $125 Dividend to AFG2020 $265 Dividend to AFG
Thru 5/31 2021 $3,828 $290mm Dividend to AFG + $3,538 sales price
15.8% IRR

Financial Highlights – First Quarter 2021
29
Dollars in millions, except per share dataThree Months Ended
March 31, • Results of Operations: 2021 20201
– Core net operating earnings $ 206 $ 125– Core net operating earnings per share $ 2.38 $ 1.36– Average number of diluted shares2 86.6 91.1
March 31, Dec. 31,• Book Value per Share: 2021 2020
– Excluding unrealized gains related to fixed maturities $ 66.89 $ 63.61– Tangible, excluding unrealized gains related to
fixed maturities $ 64.10 $ 60.82
• Capital Adequacy, Financial Condition and Liquidity:– Maintained capital at levels that support operations; in excess of amounts required for rating levels– Excess capital of approximately $1.2 billion at March 31, 2021, including parent cash of approximately $200 million
1 On January 27, 2021 AFG announced that it entered into a definitive agreement to sell its Annuity business to MassMutual. The results of AFG’s Annuity operations are reported as discontinued operations beginning with the first quarter of 2021, in accordance with GAAP, which included adjusting prior period results to reflect these operations as discontinued.
2 Because AFG had a net loss for the first quarter of 2020, the impact of potential dilutive options (weighted average of 0.84 million shares) was excluded from AFG’s fully diluted earnings per share calculation. However, for the non-GAAP measure of core net operating earnings, the Company believes it is most appropriate to use the fully diluted share data that would have been used if AFG had net earnings for the first quarter of 2020.

Financial Highlights – 2020
30
Twelve Months EndedDecember 31,
• Results of Operations: 20201 20191
– Core net operating earnings $ 481 $ 482– Core net operating earnings per share $ 5.40 $ 5.29– Average number of diluted shares 89.2 91.0
• Core Operating Return on Equity:2 20201 20191
AFG Consolidated3 9.2% 9.2%– Specialty Property & Casualty 15.0% 15.4%
Dec 31, Dec 31,• Book Value per Share: 2020 2019
– Excluding unrealized gains related to fixed maturities $ 63.61 $ 59.70– Tangible, excluding unrealized gains related to fixed maturities $ 60.82 $ 56.93
13.0%Growth in Adj
BVPS + Dividends
Dollars in millions, except per share amounts
1 On January 27, 2021 AFG announced that it entered into a definitive agreement to sell its Annuity business to MassMutual. The results of AFG’s Annuity operations are reported as discontinued operations beginning with the first quarter of 2021, in accordance with GAAP, which included adjusting prior period results to reflect these operations as discontinued.
2 Equity excludes AOCI.3 Includes the impact of holding company and other operations not reported in AFG’s operating segments.

Specialty Property & Casualty Businesses
31
Dollars in millions
Net Written Premium 2021E excl.
2019 2020 1Q 2021 2021E1 Workers’ Comp Specialty Property $ 1,876 $ 1,887 $ 403 13% – 17%& Transportation
Specialty Casualty $ 2,701 $ 2,304 $ 588 2% − 5% 5% − 9%
Specialty Financial $ 617 $ 604 $ 161 7% – 11%
Other Specialty $ 148 $ 197 $ 53 n/a
Total Specialty $ 5,342 $ 4,992 $ 1,205 7% –10% 9% − 12%
1 2021E based on guidance issued May 5, 2021.

Specialty Property & Casualty Businesses
32
GAAP Combined Ratio
2019 2020 1Q 2021 2021E1
Specialty Property 95.7% 90.4% 85.6% 88% − 92%& Transportation
Specialty Casualty 93.3% 90.0% 90.2% 87% − 91%
Specialty Financial 85.0% 91.8% 84.1% 86% − 90%
Other Specialty 113.3% 116.1% 104.6% n/a
Total Specialty 93.7% 91.3% 88.5% 89% − 91%
1 2021E based on guidance issued May 5, 2021.

33