species diversity and longitudinal succession in stream...
TRANSCRIPT

Species Diversity and Longitudinal Succession in Stream FishesAuthor(s): Andrew L. SheldonSource: Ecology, Vol. 49, No. 2 (Mar., 1968), pp. 193-198Published by: Ecological Society of AmericaStable URL: http://www.jstor.org/stable/1934447 .
Accessed: 10/06/2014 22:13
Your use of the JSTOR archive indicates your acceptance of the Terms & Conditions of Use, available at .http://www.jstor.org/page/info/about/policies/terms.jsp
.JSTOR is a not-for-profit service that helps scholars, researchers, and students discover, use, and build upon a wide range ofcontent in a trusted digital archive. We use information technology and tools to increase productivity and facilitate new formsof scholarship. For more information about JSTOR, please contact [email protected].
.
Ecological Society of America is collaborating with JSTOR to digitize, preserve and extend access to Ecology.
http://www.jstor.org
This content downloaded from 137.99.31.134 on Tue, 10 Jun 2014 22:13:41 PMAll use subject to JSTOR Terms and Conditions

Vol. 49 EARLY SPRING 1968 No. 2
SPECIES DIVERSITY AND LONGITUDINAL SUCCESSION IN STREAM FISHES
ANDREW L. SHELDON'
Section of Ecology and Systematics, Cornell University, Ithaca, New York
(Accepted for publication November 7, 1967)
Abstract. A quantitative survey was made of the distribution and abundance of fishes in Owego Creek, New York. Four of the five headwaters species occurred throughout the area and two of these species dominated the fauna in all areas. Thirty-one species were found in the area. Succession took the form of additions to the headwaters assemblage and replacement was of minor importance. Regression analyses show that the number of species in any area was correlated most strongly with stream depth although an effect of position was also sig- nificant. Species diversity (information theoretic) was independent of position and depended on depth alone. Behavioral observations support the importance of the depth factor.
The distribution of fishes in small streams is characterized by large faunal changes within rela- tively short distances (Shelford 1911) and pro- vides a convenient situation for the study of gradients in species composition and diversity. This paper presents the results of a quantitative survey of fish distributions in a New York stream from 1961 to 1963.
THE STUDY AREA
The east branch of Owego Creek (Susque- hanna watershed) lies in Tioga and Cortland counties in central New York. General physical data for the sections shown in Figure 1 are listed in Table 1. A description of the New York por- tion of the Susquehanna watershed is found in New York Conservation Dept. (1935).
METHODS
Quantitative collections were made with an electro-fishing device similar to that of Lennon and Parker (1955) used with alternating current at 230 v. Areas to be sampled were isolated with block seines of '4-in. (6 mm) mesh. Two runs were made downstream through each area. Fish were recovered with dip nets and in the down- stream seine. The two-run sequence did not cap- ture all the fish present but early trials showed that the catch from additional runs was very small. All fish except trout were preserved and later sorted in the laboratory.
The sampling design used in 1963 resulted in 'Current address: Resources for the Future, Inc. 1755
Massachusetts Ave., N.W., Washington, D.C. 20036.
N.
"N \ \,< \.^
.1* \t A-.
as_ ~~one Kml
FIG. 1. The study area showing stream sections and sample sites. Each dot represents a subsection contain- ing 2-7 samples.
more precise estimates than earlier procedures, so the 1963 data are the basis for most -of this discussion. A nested sampling design was used.
This content downloaded from 137.99.31.134 on Tue, 10 Jun 2014 22:13:41 PMAll use subject to JSTOR Terms and Conditions

i94 ANDREW L. SHELDON Ecology, Vol. 49, No. 2
TABLE 1. Physical characteristics of the study area
Section Length (km) Elevation (m) Gradient (m/km) Width (m)
I .... 7.1 525-400 36-21 1-4 II .... 7.0 505-375 27-15 1-4 VI .... 5.2 400-360 8 2-6 VII .... 1.8 360-348 7 2-8 IX .... 2.2 348-341 3 3-10 X .... 4.7 341-332 2 3-15
The stream was first divided into six sections (Fig. 1 ). Each section was then divided into 0.1-mi ( 170 m) subsections. Randomly allocated sub- sections were sounded in midstream at 10-ft (3.3 m) intervals and these soundings were used to classify each pool or riffle unit into one of four depth categories. Within each subsection, two randomly selected units were sampled within each depth category. If only one unit was available, the sample constituted a complete census and had a sampling variance of zero. This design gave good coverage of the entire stream and insured the sampling of the complete riffle-pool spectrum. Population estimates and their associated variances were calculated for each section and its subunits. The location of the 24 subsections containing 115 samples is shown in Figure 1.
Collections were made in August and early Sep- tember when stream flow was lowest and the water clear. At this time young-of-the year fish were large enough to be collected and identified. Although such fry composed 40%o of the collec- tions, they were not included in the population estimates or the diversity equations of this paper because very small fish are underrepresented in catches by electro-fishing gear. In addition, fry numbers vary substantially from year to year. Limiting population estimates to the adult popula- tion averaged fluctuations in year-class strength and, it is hoped, produced statistics which can he generalized beyond a single year.
At the time of sampling, each urit was sounded at '4, Y2 and 3/4 of the stream width in transects which were never more than 10 ft (3.3 m) apart and somewhat closer in the more variable sections. Mean depth was calculated from the formulas of Rounsefell and Everhart (1953). A qualitative description of substrate, water velocity, and cover was made for each unit. Temperature was mea- sured along the stream. Unfortunately, vandals destroyed a recording thermometer which was to have served as a base for comparison and little can be done with the variable temperature data.
RESULTS
The fish fauna and its distribution Thirty-one species (approximately half the
fauna of the entire watershed) of fish representing
eight families were collected. Names are those used by the American Fisheries Society (1960) except Etheostoma olmstedi which follows Cole (1965). Of these species, four were not taken in the 1963 quantitative collections. Noternigonus crysoleucas was found below a beaver dam in a small tributary. Notropis amoenus was collected twice just below the study area. Notropis hetero- lepis was found in a single Elodea-choked back- water in section IX. Adult Lepomis gibbosus were taken in section X in 1962 but not in 1963.
The nature of the qualitative distribution is shown in Table 2. Grouping by sections obscures
TABLE 2. Distribution of fishes by stream sections
Species I It VI VII IX X
Salvelinus fontinalis ......... * * * * * * Rhinichthys atratulus ........ * * * * * * Rhinichthys cataractae .......* * * * * * Semotilus atromaculatus ......* * * * * * Coitus bairdi ............... * * * * * * Catostomus commerson ......* * * * * Salmo trua. . * * * * Campostoma anomalum * * * * Clinostomus dongatus * * * Exoglossum mazillingua * * * * Notropis cornutus * * * * Semotilus margarita. . * * * * Ictalurus nebulosus * * Noturus insignis * * * * Etheostoma olmstedi * * * * Coitus cognatus . *. Fundulus diaphanus .*. Notropis hudsonius * * Notropis procne * * Semotilus corporals . *. Percina petata. * * Notropis analostanus . Notropis rubedus . * Pimephales notatus. Pimephales promelas . Lepomis aurius . *
the variation encountered but illustrates broad trends. The headwaters species, except Salvelinus fontinalis, ranged the length of the study area. S. fontinalis did not occur below the upstream end of section X. Clinostomus elongatus was con- fined to the middle reaches. Cottus cognatus was found only in VI and VII although it is usually a headwaters species (Koster 1936). Four indi- viduals of Ictalurus nebulosus were taken in VI and VII. Catfishes are difficult to collect and no significance is placed on its apparent restriction to these areas. With these exceptions, the pattern is one of progressive additions from upstream to downstream.
A similar trend is evident in the depth cate- gories. Table 3 shows the species composition of samples from the four depth categories in section X. In general, the occurrence of individual spe- cies in the depth sequence parallels their distribu- tion along the stream.
This content downloaded from 137.99.31.134 on Tue, 10 Jun 2014 22:13:41 PMAll use subject to JSTOR Terms and Conditions

Early Spring 1968 SPECIES DIVERSITY AND LONGITUDINAL SUCCESSION IN STREAM FISHES 195
TABLE 3. Distribution of species in section X by depth categories. This table is somewhat simplified by the omission of collections containing one or two individuals
Depth in cm
Species 0-15 15-30 30-60 > 60
Rhinichthys atratulus ..............* * * * Rhinichthys cataractae.............* * Cottus bairdi.....................* * * * Salmo trutta . .* * * Exoglossum maxillingua. * * *
Notropis cornutus ................. Semotilus atromaculatus .* * * Semotilus margarita............... Catostomus commersoni .*.*. Hypentelium nigricans . *.*. Noturus insignis.................. Fundulus diaphanus.............. Etheostoma olmstedi .* * * Campostoma anomalum . *. Notropis hudsonius .*. Notropis prone. * * Notropis rubellus. * * Pimephales notatus................ Semotilus corporalis............... Percina pelt ata . .*. Notropis analostanus . Pimephales promelas . Lepomis auritus .
The complete set of population estimates is too extensive to present here. However, two head- waters species, Rhinichthys atratulus and Cottus bairdi, dominated the fish fauna in most sections and over the entire stream. Rhinichthys cataractae was abundant in riffle areas. In deeper waters Notropis cornutus, N. hudsonius, Cam postoma anomalum, Semotilus margarita, Catostomus corn- mersoni and Etheostoma olmstedi were common.
Species diversity The addition of species rather than replacement
is the most obvious, feature of "longitudinal suc- cession" (Shelford 1911) in Owego Creek. This pattern is of more general interest than a discus- sion of the factors influencing particular species and indeed, since the succession is chiefly additive, the tw o problems become one. The factors de- termining the upstream limits of individual spe- cies also determine species diversity. This would not be the case if replacement were more impor- tant than addition.
The choice of factors to be analyzed is extremely difficult, since environmental variables in streams are typically correlated and confounded with one another (Reid 1961). Almost any variable chosen will have some predictive value, but causation must be determined from independent observations.
Tables 2 and 3 suggest that the faunal changes observed over the riffle-pool spectrum almost du- plicate those from source to downstream areas. Some rather casual observations suggest a reason
for this apparent depth effect. Sculpins, darters, adult suckers, Notturus, Campostomna and Rhinich- thys cataractae are morphologically specialized for living and feeding on the bottom. Notropis rtbellus, N. procne and Clinostomus elongatus were often observed just below the surface, where- as Notropis cornutus and N. hudsonius congre- gated in midwater. Rhinichthys atratulths was seen foraging over all depths.
The importance of depth as a determinant of species diversity was assessed with multiple linear regression techniques (Steel and Torrie 1960). The species counts for 101 individual samples were fitted to a regression on mean depth and distance from the source of the stream. The dis- tance term includes correlated variables such as temperature and stream width. Thus the regres- sion separates a local effect (depth) from factors which vary in a more systematic way along the course of the stream. Samples in section VII were omitted from this and later regressions since the stream was partially dry at the time of sam- pling and the fish were concentrated in the re- maining shallow pools. The resulting regression
S -.06 + .28z + .12d where S = number of species in the sample
Z mean depth in cm d - distance in km from a point in the head-
waters
accounts for 70%o of the variation in S. Both effects are significant (P < .01). However, com- parison of the standard partial. regression coeffi- cients shows that depth is 3g 2 times as effective as the distance term in predicting S. The residual error is surprisingly small when one considers the probability of a single erratic in a population of several hundred. From another standpoint the fit is less satisfactory. The distance term is really a residual which includes a whole array of cor- related variables.
Species diversity can be measured in a number of ways. The species count is the simplest, and for this material is quite satisfactory. However, S is not the best measure since it depends on sam- ple size (Preston 1962) and takes no account of variation in relative abundance (MacArthur and MacArthur 1961). The latter authors used H =-ps loge pi as a'measure of diversity where the pi are the proportion of the ith species in the sample. For my data the function exp H (eH) provides more realistic predictions. An alterna- tive measure of diversity, e" may be viewed as the minimum number of equally abundant species which could yield the observed diversity calcu- lated as H (MacArthur 1965). Repeating the analysis with e" as the dependent variable shows
This content downloaded from 137.99.31.134 on Tue, 10 Jun 2014 22:13:41 PMAll use subject to JSTOR Terms and Conditions
196 ANDREW L. SHELDON Ecology, Vol. 49, No. 2
that the distance term has no significant effect on species diversity (P > .05). A regression of e" on depth alone accounts for 66% of the variance.
Although stream fishes seem to form localized populations (Gerking 1959), the fish fauna of a single pool cannot be completely independent of adjoining lengths of stream. Many of the pool species spawn in riffles and the young are usually found in shallow water. Although a single pool may be suitable for individuals, a population can- not be maintained unless the population, and suit- able habitat, are above some threshold level. These considerations suggest that a mosaic approach may be better than the single sample models. The largest units for which I have depth measurements are the 170-m subsections. The population esti- mates for subsections are expansions of samples and ignore the effect of increased sample size on the species count. However, a large fraction of the more diverse habitat was sampled and prob- ably few species were overlooked. The species count is not a suitable measure of diversity for these larger areas since all the species were likely to be represented in the single deepest pool. For the subsections, eH depends on depth (P < .01, 17 df) and is independent of position (P > .05). With the distance term deleted, the regression
eH = .09 + .25Zmid,
where Zmid mean midstream depth in cm, accounts for 87% of the variation in e". In the case of single samples, Zmid was a less efficient pre- dictor than z, so more comprehensive depth mea- surements should have improved the fit.
Although el is independent of position, the species count S is not. One possible explanation lies in habitat preference and specialization. If some species are specialized for particular habitats and partially replaced by other species in other habitats, this between-habitats specialization (Mac- Arthur 1965) would increase the species counts beyond those predicted by a within-habitat mea- sure such as depth. Such specialization does not seem to be common, although the riffle-dwelling Rhinichthys cataractae does provide one example.
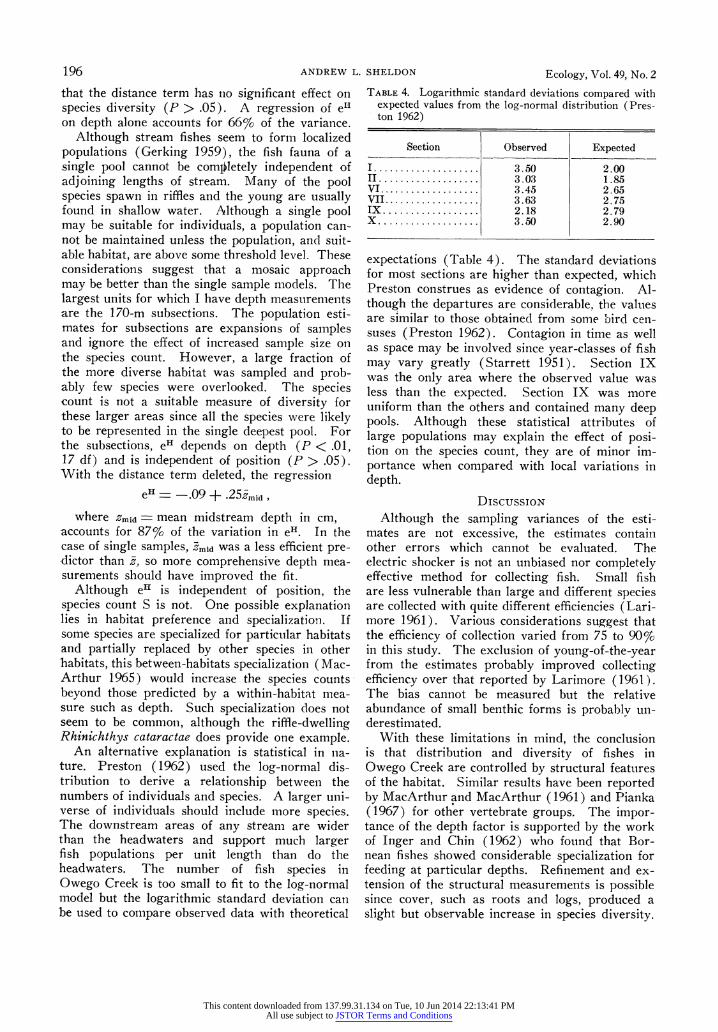
An alternative explanation is statistical in na- ture. Preston (1962) used the log-normal dis- tribution to derive a relationship between the numbers of individuals and species. A larger uni- verse of individuals should include more species. The downstream areas of any stream are wider than the headwaters and support much larger fish populations per unit length than do the headwaters. The number of fish species in Owego Creek is too small to fit to the log-normal model but the logarithmic standard deviation can be used to compare observed data with theoretical
TABLE 4. Logarithmic standard deviations compared with expected values from the log-normal distribution (Pres- ton 1962)
Section Observed Expected
I................. 3.50 2.00 II ................. 3.03 1.85 VI ................. 3.45 2.65 VII ................ 3.63 2.75 IX ................ 2.18 2.79 X ................ 3.50 2.90
expectations (Table 4). The standard deviations for most sections are higher than expected, which Preston construes as evidence of contagion. Al- though the departures are considerable, the values are similar to those obtained from some bird cen- suses (Preston 1962). Contagion in time as well as space may be involved since year-classes of fish may vary greatly (Starrett 1951). Section IX was the only area where the observed value was less than the expected. Section IX was more uniform than the others and contained many deep pools. Although these statistical attributes of large populations may explain the effect of posi- tion on the species count, they are of minor im- portance when compared with local variations in depth.
DIscussioN Although the sampling variances of the esti-
mates are not excessive, the estimates contain other errors which cannot be evaluated. The electric shocker is not an unbiased nor completely effective method for collecting fish. Small fish are less vulnerable than large and different species are collected with quite different efficiencies (Lari- more 1961). Various considerations suggest that the efficiency of collection varied from 75 to 90%o in this study. The exclusion of young-of-the-year from the estimates probably improved collecting efficiency over that reported by Larimore (1961). The bias cannot be measured but the relative abundance of small benthic forms is probably un- derestimated.
With these limitations in mind, the conclusion is that distribution and diversity of fishes in Owego Creek are controlled by structural features of the habitat. Similar results have been reported by MacArthur and MacArthur (1961) and Pianka (1967) for other vertebrate groups. The impor- tance of the depth factor is supported by the work of Singer and Chin (1962) who found that Bor- nean fishes showed considerable specialization for feeding at particular depths. Refinement and ex- tension of the structural measurements is possible since cover, such as roots and logs, produced a slight but observable increase in species diversity.
This content downloaded from 137.99.31.134 on Tue, 10 Jun 2014 22:13:41 PMAll use subject to JSTOR Terms and Conditions

Early Spring 1968 SPECIES DIVERSITY AND LONGITUDINAL SUCCESSION IN STREAM FISHES 197
High water velocities seemed to reduce the effec- tive depth, presumably because fish cannot occupy the entire water column.
MacArthur (1965) has discussed two com- ponents of species diversity. The within-habitat component is a function of structural diversity and, for simplicity, may be viewed as a vertical property such as depth or foliage profile. Be- tween-habitat diversity may be represented as a horizontal property. Different species may live in habitats of similar structure, thus increasing total species diversity without a corresponding in- crease in the diversity of localized units. The Owego Creek fauna shows changes of the within- habitat type, although the limitation of a few spe- cies to the upper or middle reaches and the spe- cialization of Rhinichthys cataractae provide evi- dence of a between-habitat component. A number of studies including those of Burton and Odum (1945). Kuehne (1962), Larimore, Pickering, and Durham (1952), Larimore and Smith (1963). Shelford (1911) and Thompson and Hunt (1930) support the importance of the within- habitat concept of diversity among stream fishes in the temperate zone. Hutchinson's (1939) study of Himalayan cobitids led him to the con- trary position. These torrent-dwelling loaches re- placed one another along the stream although addition of species occurred in a few places. The difference may lie in the fact that the loaches are closely related forms living in a rigorous environ- ment with high water velocities and a low effective depth. This study and those cited deal with rela- tively short segments of streams. Since the num- ber of species in any watershed is finite, the linear models cannot be extrapolated. Future studies could profitably be extended to larger streams where factors other than stream morphometry may become important.
Many factors have been used to predict the nature of stream faunas. Huet (1959) and Traut- man (1942) used gradient and width to define faunal regions and to predict the distribution of individual species. Kuehne (1962) utilized the ranking system of Horton (1945) to describe the fish fauna of Kentucky streams. Shelford (1911) explained the distribution of fishes in terms of the geological concept of aging of stream beds. Thompson and Hunt (1930) stated that the num- ber of fish species is proportional to the drainage area of the stream. All these systems are inter- related and all include some measure of stream size. The Horton (1945) system is applicable to the Owego Creek data but ignores much local variation. Burton and Odum (1945) emphasized the physiological effects of temperature on indi- vidual species. The temperature factor is usually
discussed in studies of this type, but there seems to have been no critical attempt to separate the effects of temperature from stream morphometry. Forbes (1907) reported a strong preference for different substrates by several species of darter which may represent between-habitat specializa- tion by related species.
Populations of stream fishes are excellent sub- jects for diversity studies. A stream is a linear system and sampling problems are reduced. Iso- lated drainages often have different numbers of fish species although they may have many species in common. In this respect they parallel island faunas. The slow invasion of glaciated areas makes it possible to compare systems with varying numbers of species and individual species with different numbers and kinds of associates. The question of saturation of habitats could be studied under these conditions or in areas where marine fishes have invaded fresh water (Inger and Chin 1962); moreover the problem of tropical diversity is as well exemplified by fishes as any other group.
ACKNOWLEDGMENTS
Support for various portions of this study was provided from NSF grants 414, G-2893 and GB-650. LaMont C. Cole provided valuable advice during the field work and preparation of the dissertation. The suggestions of E. C. Raney and W. N. MacFarland aided the work in many ways. John Nardi and James Cone served as field assis- tants in 1963.
LITERATURE CITED
American Fisheries Society. 1960. A list of common and scientific names of fishes from the United States and Canada. Special Publication No. 2: 1-102.
Burton, G. W., and E. P. Odum. 1945. The distribu- tion of stream fish in the vicinity of Mountain Lake, Virginia. Ecology 26: 182-194.
Cole, C. F. 1965. Additional evidence for separation of Etheostoma olmstedi Storer from Etheostoma nigrum Rafinesque. Copeia 1965: 8-13.
Forbes, S. A. 1907. On the local distribution of cer- tain Illinois fishes. An essay in statistical ecology. Bull. Ill. State Lab. Natur. Hist. 7: 273-303.
Gerking, S. D. 1959. The restricted movement of fish populations. Biol. Rev. 34: 221-242.
Horton, R. E. 1945. Erosional development of streams and their drainage basins; hydrophysical approach to quantitative morphology. Bull. Geol. Soc. Amer. 56: 275-370.
Huet, M. 1959. Profiles and biology of western Euro- pean streams as related to fish management. Trans. Amer. Fish. Soc. 88: 155-163.
Hutchinson, G. E. 1939. Ecological observations on the fishes of Kashmir and Indian Tibet. Ecol. Monogr. 9: 145-182.
Inger, R. F., and P. K. Chin. 1962. The freshwater fishes of North Borneo. Fieldiana (Zoology) No. 45: 3-268.
Koster, W. J. 1936. The life history and ecology of the sculpins (Cottidae) of central New York. Ph.D. thesis, Cornell Univ.
This content downloaded from 137.99.31.134 on Tue, 10 Jun 2014 22:13:41 PMAll use subject to JSTOR Terms and Conditions

198 N. H. ANDERSON AND D.M. LEHMKUHL Ecology, Vol. 49, No. 2
Kuehne, R. A. 1962. A classification of streams, illus- trated by fish distribution in an eastern Kentucky creek. Ecology 43: 608-614.
Larimore, R. W. 1961. Fish populations and electro- fishing success in a warm-water stream. J. Wildl. Mgmt. 25: 1-12.
Larimore, R. W., Q. H. Pickering, and L. Durham. 1952. An inventory of the fishes of Jordan Creek, Vermilion County, Illinois. Ill. Natur. Hist. Surv., Biol. Notes 29: 1-29.
Larrimore, R. W., and P. W. Smith. 1963. The fishes of Champaign County, Illinois, as affected by 60 years of stream changes. Bull. Ill. Natur. Hist. Surv. 28: 299-382.
Lennon, R. E., and P. S. Parker. 1955. Electric shocker development on southeastern trout waters. Trans. Amer. Fish. Soc. 85: 234-240.
MacArthur, R. H. 1965. Patterns of species diversity. Biol. Rev. 40: 510-533.
MacArthur, R. H., and J. W. MacArthur. 1961. On bird species diversity. Ecology 42: 594-598.
New York Conservation Dept. 1935. A biological sur- vey of the Delaware and Susquehanna watersheds. Biol. Surv. 10: 5-356 and maps.
Pianka, E. R. 1967. Lizard species diversity. Ecol- ogy 48: 333-351.
Preston, F. W. 1962. The canonical distribution of commonness and rarity: Part I. Ecology 43: 185-215.
Reid, G. K. 1961. The ecology of inland waters and estuaries. Reinhold, New York.
Rounsefell, G. A., and W. H. Everhart. 1953. Fishery science-its methods and applications. Wiley, New York.
Shelford, V. E. 1911. Ecological succession. I. Stream fishes and the method of physiographic analysis. Biol. Bull. 21: 9-35.
Starrett, W. C. 1951. Some factors affecting the abundance of minnows in the Des Moines River, Iowa. Ecology 32: 13-27.
Steel, R. G. D., and J. H. Torrie. 1960. Principles and procedures of statistics. McGraw-Hill, New York.
Thompson, D. H., and F. D. Hunt. 1930. The fishes of Champaign County. Ill. Natur. Hist. Surv. Bull. 19: 5-101.
Trautman, M. B. 1942. Fish distributions and abun- dance correlated with stream gradient as a con- sideration in stocking programs. Trans. 7th N. Amer. Wildl. Conf. 7: 211-224.
CATASTROPHIC DRIFT OF INSECTS IN A WOODLAND STREAM'
N. H. ANDERSON AND D. M. LEHMKUHL
Departmnentt of Enttomology, Oregon State University, Corvallis, Oregon 97331
(Accepted for publication November 17, 1967)
Abstract. The effect of early fall rains on the downstream drift or displacement of in- sects was studied for two seasons by collecting the entire streamflow at one point through a drift net. Drift rate increased within 24 hr after the start of each rainy period, with the increase approximately proportional to the increase in stream flow. Freshets due to less than 1 in. (2.5 cm) of rain caused a fourfold increase in numbers and fivefold to eightfold increase in biomass. Major components of the drift were Ephemeroptera, Plecoptera, Diptera and terrestrial insects.
Plecoptera and Ephemeroptera retained the day-night periodicity of behavioral drift during freshets, but drift of Chironomidae (Diptera) was attributed to catastrophic and constant drift. Mean weight per individual of several taxa was greater at night than day, in freshet than nonfreshet periods, and in drift compared with benthos samples.
Though catastrophic drift due to fall freshets displaced large numbers of individuals, the standing crop of the benthos increased during the fall because of hatching. The drift may be beneficial in dispersing aggregations of young larvae. Removal of allochthonous food by increased water flow could be more detrimental to benthos populations than the direct mortality caused by catastrophic drift.
INTRODUCTION
The insect fauna of lotic habitats possesses morphological and behavioral adaptations to resist displacement by the unidirectional flow. The de- nuding effects on insect populations of floods and scouring by ice have been documented by many workers (e.g., Needham 1928; Moffett 1936; Allen 1951; Muller 1954). However, the influ- ence of increased water velocity due to normal seasonal rainfall on the bottom fauna has only rarely been subjected to quantitative studies. In
1 Technical Paper No. 2369, Oregon Agricultural Ex- periment Station.
Waters' (1962) study of downstream drift in Minnesota, he noted a large increase in drift of the amphipod Gammarus limnaeus Smith and the mayfly Baetis vagans McDunnough due to a heavy rain. The most striking change, however, was a fiftvfold increase of larvae of the dipteran Dixa sp. Waters pointed out that even slight increases in depth and velocity would be expected to have a marked effect on these larvae because they are associated with the surface film and with wet areas near the water's edge. Elliott ( 1967a) showed that although more animals were collected in a drift net during a severe spate, the density of
This content downloaded from 137.99.31.134 on Tue, 10 Jun 2014 22:13:41 PMAll use subject to JSTOR Terms and Conditions