specific protein synthesis in cellular differentiation
TRANSCRIPT

SPECIFIC PROTEIN SYNTHESIS IN
CELLULAR DIFFERENTIATION
Production of Eggshell Proteins by Silkmoth Follicular Cells
M. PAUL, M . R . GOLDSMITH, J . R . HUNSLEY,and F . C . KAFATOS
From The Biological Laboratories, Harvard University, Cambridge, Massachusetts 02138
ABSTRACT
Silkmoth follicles, arranged in a precise developmental sequence within the ovariole, yieldpure and uniform populations of follicular epithelial cells highly differentiated for synthesisof the proteinaceous eggshell (chorion) . These cells can be maintained and labeled efficientlyin organ culture ; their in vitro (and cell free) protein synthetic activity reflects their activityin vivo . During differentiation the cells undergo dramatic changes in protein synthesis . For2 days the cells are devoted almost exclusively to production of distinctive chorion proteinsof low molecular weight and of unusual amino acid composition . Each protein has its owncharacteristic developmental kinetics of synthesis . Each is synthesized as a separate polypep-tide, apparently on monocistronic messenger RNA (mRNA), and thus reflects the expressionof a distinct gene . The rapid changes in this tissue do not result from corresponding changesin translational efficiency . Thus, the peptide chain elongation rate is comparable for chorionand for proteins synthesized at earlier developmental stages (1 .3-1 .9 amino acids/sec) ;moreover, the spacing of ribosomes on chorion mRNA (30-37 codons per ribosome) is sim-ilar to that encountered in other eukaryotic systems .
INTRODUCTION
The synthesis of characteristic proteins is a keyaspect of cellular differentiation . Some well-knownexamples of differentiation-specific protein syn-thesis are the production of hemoglobin byerythroblasts, of myosin, actin, and myoglobin bymuscle cells, of crystallins by the eye lens, and ofdigestive enzymes or zymogens by the pancreaticacinar epithelium. Particularly interesting arefactors controlling the synthetic rates of individualproteins during differentiation and programs forsequential elaboration of several distinct productsby a single cell type . The study of such processesin vertebrates is often complicated by unavail-ability of synchronized cells at defined develop-
THE JOURNAL OF CELL BIOLOGY . VOLUME 55, 1972 . pages 653-680
mental stages, presence of extraneous cell types,and concurrent mitotic activity or cell fusion . Inthis respect the exocrine glands of insects, whichoften consist of a single type of polyploid cell,developmentally synchronized and nondividing,have certain advantages .
The follicular epithelium of silkmoths is aparticularly favorable exocrine gland . Each follicle(Fig . 16) consists of a single layer (Fig . 1 c) ofpolyploid epithelial cells, enveloping the oocyteand its seven nurse cells . In each of eight ovarioles,the follicles are arranged in a precise develop-mental sequence (Fig . I a) ; they are generated atthe anterior end and move backward as new
653
Dow
nloaded from http://rupress.org/jcb/article-pdf/55/3/653/1070641/653.pdf by guest on 05 D
ecember 2021

follicles are added in front (King and Aggarwal,1965) . In Hyalophora cecropia, the developmentalage difference between adjacent follicles has beenestimated as 4-5 hr (Telfer and Rutberg, 1960) .Thus, temporal differentiation is represented in aspatial dimension . At an early stage of vitello-genesis the oocyte grows mainly through accumu-lation of yolk from the blood (see Telfer, 1965) .Near the end of vitellogenesis, the nurse cells de-generate (King and Aggarwal, 1965) ; the folliclethen consists of only two cell types, the oocyte(which can be destroyed easily) and the envelop-ing follicular cells . In sum, pure preparations offollicular epithelial cells (Fig . I c) can be obtainedconveniently in a developmental sequence .
During yolk accumulation the follicular epi-thelial cells play an important role, detachinglaterally so as to form voluminous channels foryolk transport (King and Aggarwal, 1965) . Inaddition, the cells synthesize and secrete into thechannels a macromolecule, probably a glycopro-tein, which finds its way into the yolk spheres ofthe oocyte (Anderson and Telfer, 1969) . Fromexperiments with trypan blue, a competitive in-hibitor of yolk uptake, it has been inferred thatthe glycoprotein facilitates selective uptake throughselective binding to yolk (Anderson and Telfer,1969; 1970 a, b) .At the end of vitellogenesis, the follicular
channels begin to collapse and blood proteins canno longer gain access to the oocyte (King andAggarwal, 1965 ; Telfer and Anderson, 1968) . A"terminal growth phase" ensues, during which theoocyte increases in volume by approximately 50 o%o ,primarily through the accumulation of water(Telfer and Anderson, 1968) . The follicular cellsapparently deposit a thickened vitelline mem-brane between the oocyte and themselves (Telferand Smith, 1970) . Finally, as the last step in theirdifferentiation, they secrete a proteinaceous egg-shell, the chorion, around the vitelline membrane .At maturity, the chorion accounts for approxi-mately 30 0/0 of the dry weight of the egg (Pollackand Telfer, 1969) .
Thus, follicular cell differentiation involvessequential elaboration of at least three products,the yolk-associated glycoprotein, the vitellinemembrane, and the chorion . In fact, the programof differentiation is even more detailed : as will beshown later, the chorion consists of several pro-teins, each produced during a characteristic de-velopmental period . The timing is apparently
6 54
THE JOURNAL OF CELL BIOLOGY . VOLUME 55, 1972
controlled endogenously, since a sequence offollicular stages can be found in a single ovariole,bathed in a common blood pool .
The present report focuses on chorion formation .We describe solubilization and partial character-ization of the chorion proteins, which are unusuallysmall and distinct from the proteins of the vitellinemembrane. We present evidence that each chorionprotein is synthesized as a distinct component ;there is no interconversion and no cleavage from alarger precursor. We document sequential andrapid transitions in protein biosynthesis : synthesisof nonsecretory proteins is markedly depressed asthe follicular cells embark on production of succes-sive classes of chorion proteins . We correlate thesechanges in protein biosynthesis with characteristicchanges in polyribosome profiles and in averagetranslation time. Finally, we demonstrate that anactive system for cell-free protein synthesis can beprepared from the follicular cells, reflecting theirin vivo biosynthetic activity .
MATERIALS AND METHODS
Reagents and Proteins
Materials were purchased and treated as follows :fast green FCF R-250, trypan blue (Allied ChemicalCorp., New York) ; glutaraldehyde (high purity, LaddResearch Industries, Inc., Burlington, Vt .) ; acryla-mide, N, N'-methylenebisacrylamide (MBA,1 recrys-tallized from acetone), N, N, N' , N'-tetramethylethyl-enediamine (TEMED), ammonium persulfate(Biorad electrophoresis grade) ; phenylmethylsulfonyl-fluoride (PMSF) (lot 901498, Calbiochem, LosAngeles, Calif.) ; Siliclad (Clay-Adams, Inc ., Parsip-pany, N . J.) ; guanidine hydrochloride (recrystallized,Nozaki and Tanford, 1967), 2-iodoacetamide (recrys-tallized from H2O), phenylthiourea (PTU) (recrystal-lized from ethanol), 2-mercaptoethanol (EastmanKodak Co ., Rochester, N. Y.) ; gelatin, sodium hepa-rin, sodium dodecyl sulfate (SDS) (recrystallized from
1 The following abbreviations are used in this paper .- ATP,adenosine triphosphate ; DOC, sodium deoxycholate ;EDTA, ethylenediaminetetraacetic acid ; GM, Grace'stissue culture medium without hemolymph ; GTP,guanosine triphosphate; MBA, N, N'-methylenebis-acrylamide; mRNA, messenger RNA ; MWS, mod-ified Weevers' saline ; PMSF, phenylmethylsulfonyl-fluoride ; PTU, phenylthiourea ; S-5, 5000 gsupernate; S-105, 105,000 g supernate ; SB I,solubilization buffer I ; SB II, solubilization bufferII ; SDS, sodium dodecyl sulfate ; TCA, trichlo-roacetic acid ; TEMED, N, N, N' , N'-tetramethyl-ethylenediamine; tRNA, transfer RNA .
Dow
nloaded from http://rupress.org/jcb/article-pdf/55/3/653/1070641/653.pdf by guest on 05 D
ecember 2021
ethanol), sodium deoxycholate (DOC) (Fisher Sci-entific Company, Pittsburgh, Pa.) ; horse heart cyto-chrome c, sperm whale myoglobin, beef pancreaschymotrypsinogen, chicken ovalbumin, human-y-globulin (protein molecular weight kit No . 20900-8109), coomassie brilliant blue (Mann Research Lab-oratories Inc., New York) ; urea (recrystallized fromethanol), 30% H202 (Merck and Co ., Inc ., Rahway,N. J .) ; Protosol, Omnifluor, Liquifluor, Aquasol(New England Nuclear Corp ., Boston, Mass .) ; yeastRNA, bovine serum albumin fraction V, hog stomachpepsin crystallized three times (Nutritional Biochem-icals Corporation, Cleveland, Ohio) ; sucrose (specialdensity gradient grade, Schwarz-Mann, Orangeburg,N. Y .) ; Na adenosine triphosphate (ATP), Na phos-phoenolpyruvate, Na guanosine triphosphate (GTP),type II rabbit muscle pyruvate kinase, dithiothreitol,yeast soluble RNA, type III spinach ferredoxin, crys-talline bovine pancreas insulin, mercaptoacetic acid(Sigma Chemical Co ., St. Louis, Mo.) ; GF/C and 3MM filter discs (Whatman) ; and bovine pancreaticribonuclease (Rase, Worthington BiochemicalCorp., Freehold, N . J .) .
All other chemicals were reagent grade. Water usedin these experiments was deionized and charcoaltreated (Millipore Corporation, Bedford, Mass.,Model Super Q) . Sources of radioisotopes appear inthe appropriate figure legends .
Animals
Antheraea polyphemus and Antheraea pernyi silkmothpupae were stored at 2 °-5 ° C until needed, and werethen allowed to initiate adult development at 25°C.Developmental stages were determined as describedby Berger and Kafatos (1971) . A. polyphemus femalesof stages 14-16, were used routinely .
Dissection of Follicles andChorion Preparation
Ovarioles were removed from developing adultsinto Grace's tissue culture medium without hemo-lymph (Grace, 1962 ; hereafter called GM), or into amedium based on Weevers' saline (Weevers, 1966 ;called Modified Weevers' Saline, MWS) containing4.0 mm NaCl, 26.3 mm KC1, 18 .0 mM MgC12, 3 .0 mssCaC12 , 253 mm sucrose, 10 mss potassium phosphate,pH 6 .6 . A crystal of PTU was routinely added to bothmedia during dissection and culture . Follicles werecut in half and the yolky ooplasm washed away withmedium. Follicular epithelium was dissected from thechorion (most easily in 7% 1-propanol) . PMSF (1 mmin 7% 1-propanol or 1 mm and 1 % 1-propanol in theindicated solutions) was often used in the preparationof samples for electrophoresis, although at no time didwe see evidence for proteolytic activity in its absence .
Organ Culture
Follicles were cultured in GM in watch glasses witha solid square base (General Biological SupplyHouse, Inc ., Chicago, Ill .) on a rotatory shaker at25°C. Pulse labeling was carried out routinely in GMwith the total concentration of any radioactive aminoacid ranging from )z to normal. Before labeling, thefollicles were maintained for 2-5 min in GM withsubnormal levels of the appropriate amino acids .Chase incubations were carried out in complete GM .Unless otherwise indicated, incorporation was termi-nated by transferring follicles to chilled MWS . Allincubation media and glassware were sterile .
Preparation of Samples for Electrophoresis
Samples were routinely prepared for electrophoresisby heating at 100 ° C for 10 min in one of two buffers .In electrophoresis Method I, the sample buffer (solu-bilization buffer I [SB I]) contained 1 % 2-mercapto-ethanol, 1 % SDS, 3 M urea, and 10 mm sodium phos-phate, pH 7.2 . For Method II, the buffer (SB II)contained 1% 2-mercaptoethanol, 1% SDS, 6 M urea,and 10 mss Tris-HCI, pH 8 .4. The maximum concen-tration of protein was 5 mg/ml . Carboxamido-methylation of solubilized protein was carried out atroom temperature with one-half volume of 1 .0 M iodo-acetamide in 1 .2 M Tris-HC1, pH 8 .4. After 30 minthe reaction was terminated with excess 2-mercapto-ethanol (3 .sl/100 Al solution) . Samples thus preparedcould be electrophoresed directly without dialysis .
SDS-Acrylamide Electrophoresis
METHOD I : Electrophoresis Method I was similarto the procedure of Weber and Osborn (1969), modi-fied to contain 15% acrylamide and 0 .4 0]0 MBA. Geltubes were treated with Siliclad for easier removal ofgels. Gels were stained overnight with coomassie bril-liant blue (0 .008% in 5 parts methanol, 1 part aceticacid, 5 parts water), destained (in 50]0 methanol,7.5% acetic acid), scanned (in 7 .5 0/0 acetic acid) witha Gilford 2400 spectrophotometer, and photographedas previously described (Berger and Kafatos, 1971) .METHOD it : During the course of this study, we
found that highly cross-linked gels containing urea(Swank and Munkres, 1971) produced superior reso-lution of chorion proteins . Gels contained 13% acryl-amide, 1 % MBA, 0.50]0 SDS, and 6 M urea . The gelsolution (25 ml) was freshly made by adding 3 .25 gacrylamide, 0 .25 g MBA, 9 g urea, 0 .125 g SDS, 9 .9 mldistilled water, and 5 ml of a stock solution of 0 .5 Macetic acid buffered to pH 8 .4 with Tris base, and wasdegassed briefly. Gels were made in siliconized, 5 mminner diameter, 8-10 cm length glass tubes. Polym-erization, induced by adding 10 mg ammonium per-sulfate and 2 µl TEMED, generally occurred in 30
M. PAUL ET AL . Specific Protein Synthesis in Cellular Differentiation
6 5 5
Dow
nloaded from http://rupress.org/jcb/article-pdf/55/3/653/1070641/653.pdf by guest on 05 D
ecember 2021

min in a water bath at room temperature. The lowerreservior buffer contained 0.1 % SDS and 0.1 M aceticacid adjusted to pH 8 .4 with Tris base, while the up-per buffer contained in addition 19 mm 2-mercapto-acetate, pH 8 .4. After preelectrophoresis of the gelsfor 30 min, samples were layered under reservior buf-fer . Electrophoresis was carried out at room tempera-ture for 18-24 hr at a constant current 2 .5 ma per gel .Gels were stained, scanned, and photographed as inMethod I .
Polysome Isolation
To ensure that the cells were actively synthesizingprotein, MWS-washed epithelium was incubated instandard GM at room temperature for a minimum of15 min before experimental manipulations. Proteinsynthesis was stopped rapidly by transferring the tissueto 2-4 ml of an ice slurry of hypotonie buffer con-taining 10 mm Tris-HCI, pH 7.4, 50 mm KCI, and10 mm MgC1 2 at 0 °C in a glass 7 ml Dounce homog-enizer. The KCI concentration was changed wherenoted in the Results . All the following operations werecarried out at 0 °C using autoclaved glassware orsterile plastic containers to reduce nuclease con-tamination . The tissue was resuspended at a con-centration of 12-18 follicles/0.5 ml, allowed to swellfor at least 5 min, and homogenized with three toseven strokes of the loosefitting pestle and one to twostrokes of the tight-fitting pestle . The homogenate wasbrought to a final concentration of 0 .5 0]0 sodiumdeoxycholate and centrifuged at 5000 g for 5 min at4 °C. For analysis of polysomes, 0 .5-1 .0 ml of super-nate was layered on 12 ml linear sucrose gradients andcentrifuged in the IEC SB 283 rotor under conditionsdescribed in Results .
Gradients were prepared from RNase-free sucrosein hypotonie buffer as noted in Results . The sucrosewas pretreated with bentonite (Petermann and Pav-lovec, 1963) at a final concentration of 0 .5 mg/mlwhere indicated . Gradients contained 100 µg/ml gel-atin (Kaempfer, 1970) and were made in IEC polyal-lomer tubes treated by a modification of the methodof Kaempfer et al . (1968) . The tubes were heated toboiling twice in 5 mm Na ethylenediaminetetraaceticacid (EDTA), pH 8 .0, and once in 100 mm magne-sium acetate, 5 mm Na EDTA, pH 8.0, followed byseveral rinses with distilled water (Kaempfer, personalcommunication) .
Continuous absorbance recordings were obtainedwith the ISCO Model UA-2 UV Analyzer (I cm flowcell) and Honeywell Electronik strip chart recorder.Gradient fractions (0.25 ml) were collected using anISCO Model 270 fraction collector and Model DDensity Gradient Fractionator .
Polysome yields were estimated by weighing "cut-outs" of the absorbance tracings . The margins of adja-
6 56 THE JOURNAL OF CELL BIOLOGY - VOLUME 56, 1971
cent peaks were extended linearly and half the over-lapping area added to each component .
Cell-Free Protein Synthesis
Halved, washed follicles (Nos. 1-5, 20/0 . 1 ml) werehomogenized with five vertical strokes in a Bolab glassmicrohomogenizer using the following medium at0°C : 50 mm Tris-HCI, pH 7.5, 10 HIM MgC1 2 , 30 mmKCI, 1 .0 mm PTU, 300 mm sucrose, 0.5 mm dithio-threitol, and 100 ug/ml sodium heparin . Phase-con-trast microscopy revealed neither whole cells norbroken nuclei . The homogenate was centrifuged for 3min at 5000 g at 4°C and the resultant opalescentsupernate was removed . Aliquots were taken for anal-ysis of total RNA content as described in Fig . 2 . Avolume of supernate containing about 20 mg of pro-tein (Warburg and Christian, 1941) was added to thefollowing mixture at 25° C (1 .00 ml) : 50 moles Tris-HCI, pH 7.5, 5 .0 umoles MgCl2, 100 ,umoles KCI,0.5 µmole dithiothreitol, 1 .0 mole Na ATP, 10µmoles sodium phosphoenolpyruvate, 0.5 µmoleNa GTP, 50 µg rabbit muscle pyruvate kinase, and amixture of cold amino acids at )io the concentrationin GM plus radioactive amino acids as described inResults. Samples removed from the reaction mixtureup to 20 min later were pipetted onto 2 .4 cm What-man 3 MM filter discs for determination of radioac-tivity. The remainder was frozen in dry ice-acetoneand stored at -90 °C .
Radioactivity MeasurementsRadioactivity was measured by liquid scintillation
in a refrigerated Beckman LS-250 Liquid ScintillationCounter.
Method I polyacrylamide gels were sliced trans-versely, processed, and counted as previously de-scribed (Berger and Kafatos, 1971) . Slices fromMethod II gels were dissolved in 50 µl 30% H202overnight at 40 ° C and counted in 3 .6 ml Aquasol. Thedata were analyzed by computer (Yund et al., 1971) .
Sucrose graident fractions plus carrier were precipi-tated with 2 ml ice-cold 7% (w/v) trichloroacetic acid(TCA) containing 5 mm of each of the amino acidsused in labeling. The samples were heated to 90°Cfor 30 min, chilled to 0° C, and filtered through 2.4 cmWhatman GF/C glass fiber filters on a glass Milliporefiltration apparatus . Filters were rinsed four timeswith 2-3 ml each 5% TCA containing 5 mm nonradio-active precursor at 0°C and once with 2 ml 95%
ethanol, air dried and transferred to glass countingvials. To each vial was added 0 .30 ml of Protosol fol-lowed after at least 2 hr by 15 ml of counting mixturecontaining 0.4% Omnifluor and 0.33% glacial aceticacid in toluene.
Samples from cell-free protein synthesis experi-ments were processed by a modification of the proce-
Dow
nloaded from http://rupress.org/jcb/article-pdf/55/3/653/1070641/653.pdf by guest on 05 D
ecember 2021

dure of Mans and Novelli (1961) . The discs weretreated for 10 min at 0 ° C in 5% TCA containing 10mm nonradioactive precursor, heated for 30 min at90°C, and then washed for 2 hr in each of six changesof 5°/o TCA containing 10 ram nonradioactive pre-cursor at 4°C with continuous stirring . The filterswere washed once with 95% ethanol, air dried, elutedwith Protosol as described above, and counted in 15ml toluene containing 4 .2% Liquifluor and 0.2%glacial acetic acid .
RESULTS
Staging of Follicles
In the ovarioles of A . polyphemus and A . pernyi,hydration at the beginning of the terminal growthphase results in a rather abrupt increase in folliclediameter (Fig . 1 a) . At this time the color of thedeep yellow (A . polyphemus) or green (A . pernyi)vitellogenic follicles changes into a more pale hue .
FIGURE 1 a Ovariole dissected from a stage 15 developing adult female A . polyphemus . Arrowheadindicates follicle 1 . Scale, 2 mm .
FIGURE 1 b Diagram of an early chorionating follicle . fe, follicular epithelium ; ch, chorion ; or, oocyte ;dnc, degenerated nurse cells (after King and Aggarwal, 1965) .
FIGURE 1 C Photomicrograph of two follicle cells and their secreted chorion . A late chorionating follicle(A . pernyi) was fixed in ice-cold fixative (3 170 glutaraldehyde, 0.1 M potassium phosphate, pH 6 .6), em-bedded in Araldite by standard procedures and sectioned at lu (Sjostrand, 1967) . Staining was withMallory's azure II-methylene blue (Richardson et al ., 1960) . Note the substructure of the chorion, in-cluding the three horizontal zones . Scale, 10 µ .
M . PAUL ET AL . Specific Protein Synthesis in Cellular D(fferentiation
657
Dow
nloaded from http://rupress.org/jcb/article-pdf/55/3/653/1070641/653.pdf by guest on 05 D
ecember 2021

We identify as follicle No . 1 the youngest palefollicle preceded by a deeply colored follicle sub-stantially smaller in size . Progressively olderfollicles are then designated as Nos . 2, 3, 4, etc .and progressively younger ones as Nos . 0, -1, -2,etc. Vital staining with the yolk analog trypan blue(Anderson and Telfer, 1970 a) reveals that the
FOLLICLE NUMBER
FIGURE 2 Dry weight, protein, and RNA content ofthe follicular epithelium (E) and chorion (C) . Halved,washed follicles were blotted dry before being placedin individual tubes . Chorion (and the attached vitellinemembrane) was separated from the follicular epi-thelium in 7J% 1-propanol . Dry weight was determinedafter drying to constant weight in vacuum over P,05 .Total protein was determined by the biuret reactionafter dissolving the sample in 1 .0 M NaOH (Rutter,1967), using dried chorion (which is about 967 pro-tein ; Kawasaki et al ., 1971 a) as the standard . Valueswere approximately 35 0/0 higher when bovine serumalbumin was used as the standard . Total RNA wasestimated by a microadaptation of the method ofFleck and Munro (1962) using yeast tRNA as stand-ard (Dawson et al., 1969) . Values expressed are themean for three follicles f1 standard deviation.
6 58
THE JOURNAL OF CELL BIOLOGY • VOLUME 55, 1972
oldest follicle staining deeply is - 1 ; follicle 0 bindsconsiderably less dye, indicating the end of thevitellogenic phase .
Generally, the youngest follicle bearing a visiblechorion (dissectable from the epithelium after re-moval of the oocyte) is No . 3. As will be shownlater, rapid chorion synthesis begins only slightlyearlier in follicle 2 . Thus, the transition fromvitellogenesis to chorion production occurs within8-10 hr .
Macromolecular Composition of
Chorionating Follicles
Chorionating follicles cut in half and washedfree of oocyte consist entirely of a homogeneouscell population, the follicular epithelium, and itssecretory products, the chorion and the muchthinner vitelline membrane (Fig . 1 c) . Fig . 2 showsthe dry weight, protein, and RNA content of thispreparation . The mature chorion has a dry weightgreater than the maximum of the epithelium itself(approximately 0.46 mg, range 0 .42-0.50 mg) ;more than 95% of this is already deposited byfollicle 10-12, i .e ., in 2 days. During this time, nogrowth occurs in the epithelium itself . The totaldry weight, protein, and RNA of the epitheliumremain essentially constant for the first two-thirdsof this period (approximately 370, 260, and 45 µg,respectively) ; thereafter, the cells regress untilthey are cast off at ovulation . No cell divisionoccurs, since the cells are polyploid .
Solubilization of Chorion Proteins
A sulfhydryl reagent plus a strong denaturingagent are necessary for solubilization of chorion(Table I) . High temperature and high pH favordissolution . After this work was completed, similarmethods for chorion solubilization were publishedby Kawasaki et al . (1971 a) and by Smith et al .(1971) .
SDS-Polyacrylamide Gel Analysis ofChorion Proteins
When solubilized chorion proteins were ana-lyzed by SDS-acrylamide gel electrophoresis, ahighly reproducible pattern of bands was observed(Fig . 3) . Nearly all the material migrated in themol wt range 7000-18,000, forming four major and11 minor bands. For easy reference, the proteinswere divided into three classes (A, B, and C, in
Dow
nloaded from http://rupress.org/jcb/article-pdf/55/3/653/1070641/653.pdf by guest on 05 D
ecember 2021

TABLE I
Methods for Solubilization of A . polyphemus Chorion
* Dissolution is not complete after 2 .5 hr at 60 °C.$ SB II .§ 2X SB I .
FIGURE 3 Electropherogram and densitometric scan of chorion proteins . The chorion from a nearlymature (No . 11) follicle was dissolved by heating at 100 °C for 10 min in SB II and carboxamidomethyl-ated . Electrophoresis was performed on a 9 cm gel by Method II. The photograph below shows theentire stained gel . The scan of the gel region containing all but the trace chorion components is displayedabove on an expanded scale . The nomenclature of the hands is explained in the text. In this and all sub-sequent figures, migration is from left to right .
M. PAUL ET AL. Specific Protein Synthesis in Cellular Dijerentiation
659
Reducingagent
(2-mercapto-Method
ethanol) Denaturant pH
Tune (notnecessarily theminimum time
required)Tempera-
ture
% °C
1
1 5-8 M guanidine 8.5 (with NaOH or 0 .01 M 1 hr 23HCl Tris-HCI) 10 min 100
2
1 6-8 M urea 8.0-8.5 (with NaOH) 10 min 100*10 (with NaOH) 2 hr 23
3
1 1% SDS 8.5 (with NaOH) 10 min 100'
4,*.
1 1% SDS, 6 M urea 8.4 (0 .01 M Tris-HCI) overnight 2several hours 23
10 min 100
5§
2 2% SDS, 6 M urea 7.2 (0 .02 M sodium phos- 45 min 60phate) 10 min 100
Dow
nloaded from http://rupress.org/jcb/article-pdf/55/3/653/1070641/653.pdf by guest on 05 D
ecember 2021

order of increasing size). Additional trace com-ponents of higher molecular weights are present :a group of several components provisionally desig-nated as class D (approximately 25,000-27,000mol wt), plus a material not studied further,migrating at mol wt approximately 90,000 . Inmature chorion, class B (average mol wt 10,000-14,000; see Table II) predominates, with approxi-mately 50% of the total protein; classes A and Btogether account for approximately 90% of thetotal . The four major proteins constitute approxi-mately 75% of the chorion at maturity (B 2 and B 345%, A 1 15 1170 , and A 4 15%). Quantitation witheither coomassie brilliant blue or fast green(Gorovsky et al., 1970) gave essentially identicalestimates.
The unusually low molecular weight of the pro-teins made it especially important to demonstratethat the banding profile does not result from partialproteolysis (Pringle, 1970) . The banding patternwas identical when the protease inhibitor PMSFwas present at all steps of sample preparation,from dissection onward . The same profile was ob-tained whether chorion was dissolved at 2 °C(overnight), 23 °C (several hours), or 100 °C (10min) in SB II .
TABLE IfApparent Molecular Weights of Chorion Proteins
Molecular weights ofchorion components were interpolated from standard curves of log molecular weightsversus relative mobility . Ranges indicate values obtained in two separate experiments . I a : Chorion pro-teins electrophoresed by Method I . Mature chorions were dissolved at 100 °C (Table 1, Method1), carboxamidomethylated, and dialyzed into 10 mm sodium phosphate containing 0 .1% SDS and 0.5%2-mercaptoethanol, pH 7 .2. Aliquots containing 12 0 of a chorion were mixed with an equal volume of2X SB I before electrophoresis . Protein molecular weight standards were dissolved in 1X SB I at 23 °C(insulin) or at 100 °C for 10 min (chymotrypsinogen, myoglobin, cytochrome c, ferredoxin) . Mobilities ofthe chorion proteins and standards were determined relative to the tracking dye on separate 10 cm gels .I b : Samples of chorion dissolved directly in SB I and analyzed by Method I as described above butwithout carboxamidomethylation. II : Carboxamidomethylated chorion proteins analyzed by electro-phoresis Method II with the protein molecular weight standards and chorion samples mixed (six gels) .Mobilities for the components of each gel were determined relative to the A1 chorion component .
It should be noted that in this size range molecular weight estimates are imprecise, probably becauseof the effects of intrinsic charge and shape (Swank and Munkres, 1971) .
660
THE JOURNAL OF CELL BIOLOGY . VOLUME 55, 1972
In a further attempt to minimize proteolysis,immediately after dissolution chorion proteinswere routinely reacted with iodoacetamide . Similarbanding profiles were obtained with or withoutcarboxamidomethylation, except for slight varia-tions in relative mobility of some components(Table II) . Carboxamidomethylation resulted in asharpening of the bands, as did electrophoresis ofunsubstituted proteins under reducing conditions,in gels freed of ammonium persulfate by brief pre-electrophoresis with mercaptoacetic acid .
Pulse-Label and Pulse-Chase Experiments
with a Mixture of Methionine- 3H and Glycine-
14C: Chorion Protein Heterogeneity, Absenceof High Molecular Weight Precursors, andKinetics of Chorion Deposition
Silkmoth chorion proteins are rich in glycineand poor in methionine (Kawasaki et al ., 1969 ;1971 a) . The methionine/glycine ratio of electro-phoretically separated proteins was used as adiagnostic tool in studies aimed at further char-acterization of chorion proteins, verification oftheir heterogeneity, evaluation of possible
Chorion proteinDeter-mination At Aa B, Ba CI +2 Ca +4
I a 7,000- 8,500- 12,000 12,000 16,000- 18,000-7,500 9,000 16,500 18,500
I b 6,500- 7,500- 10,000- 10,000- 15,500- 17,000-7,500 9,000 10,500 10,500 16,000 18,000
II 7,500 9,500 13,000 14,000 18,000 20,000
Dow
nloaded from http://rupress.org/jcb/article-pdf/55/3/653/1070641/653.pdf by guest on 05 D
ecember 2021

precursor-product relationships, and explorationof the lag time between chorion synthesis anddeposition . In general, the incorporation of twoamino acids labeled with two different isotopespermits a judgment to be made about the relativeamino acid composition of proteins even beforetheir complete purification . In the ensuing dis-cussion relative amino acid compositions are de-duced on the assumption that leucine is equallyabundant in all proteins ; in fact it is comparablein chorion and in other ovarian proteins (Kawasakiet al ., 1969) .
Follicles were incubated in a medium containinga mixture of glycine l4C and methionine 3H . Forone follicle, incorporation was stopped after 1 hrand the epithelium and chorion were immediatelydissected apart and frozen . The other follicle waslabeled for 3 hr and was then chased for 2 hr inunlabeled medium ; at the end of the chase, theepithelium and the chorion were separated as be-fore. Each of the resulting four samples was dis-solved and analyzed by electrophoresis. At thisstage, chorion production accounts for nearly allprotein synthesis (Table III, column F : 99% ofthe glycine and 81-92% of the methionine in-corporation) . As a result, incorporation in chorionproteins could be evaluated reasonably accurately .
While glycine was extensively incorporated intoboth A and B proteins, high methionine incorpora-tion was only detected in the B region (Figs . 4 a and
4 b) . Thus, A proteins are either unusually rich inglycine or unusually poor in methionine or both .Differences in amino acid composition can beevaluated more directly from the ratio of incorpor-ated amino acids (Figs . 4 c and 4 d) . Clearly,compositional heterogeneity exists within classesB and C, as well as between classes . The chorionproteins are not multimers of a fundamental unit .
The ratio profiles in extracellular chorion arevirtually identical for the pulse-label and pulse-chase experiments (data not shown) . The ratioprofiles are also similar for intracellular and extra-cellular chorion (Figs. 4 c and 4 d), despite thepresence of small amounts of labeled nonsecretoryprotein in the intracellular (epithelial) samples .
It is worth noting that no major labeled peakwith mol wt greater than 18,000 is present in thepulse-labeled epithelium (Fig . 4 a) . In particular,no high molecular weight glycine-rich peak isseen, although it would be easily detectable by itscharacteristic isotope ratio . The lack of such apeak is a first indication that chorion proteins arenot derived from a high molecular weight pre-cursor . If such a precursor exists, its half-life mustbe very much shorter than 1 hr (also see below) .
In the same experiment, separation of thelabeled follicle into epithelium and chorion per-mitted a preliminary estimate of the time neededfor chorion transport to the site of extracellulardeposition . The average protein molecule requires
TABLE IIISynthesis of Chorion and Nonchorion Proteins, and Transport of Chorion
See text and Fig . 4 for experimental details . Follicular tissue was either pulse labeled or pulse chased witha mixture of glycine- 14C and methionine- 3H. Each tissue was separated into epithelium and transportedextracellular chorion, and each of the four samples was analyzed by electrophoresis (see Fig . 4) . A : sumof the total counts in the two gels (epithelium and chorion) for each tissue . B : total counts in each choriongel . C : counts in the chorion region of the epithelium gel (slices 18-46 and 20-44 for the pulsed and pulsed-chased samples, respectively) . Correction for overlapping nonchorion proteins was made by extrapolationof the incorporation on either side of the chorion region . D : B + C . E : A - D. F : D/A X 100 . G : B/D X100 .
M. PAUL ET AL. Specific Protein Synthesis in Cellular Differentiation
661
Experiment Isotope (Amino acid)
(A)Total incor-poration
(B)Label in
xtracellularchorion
(C)Label inintra-
cellularchorion
(D)Total
incorpora-tion inchorion
(E)Total
incorpo-ration innon-
chorion
(F)Incorpo-ration inchorion as% of totalincorpo-ration
(G)% of
labeledchorion
transported
1 hr pulse 114C (Glycine)rpm
120,000rpm
57,800rpm
60,600cpm
118,000rpm
1,600 99 49 48l 3H (Methionine) 92,300 39,700 45,400 85,100 7,200 92 47
3 hr pulse fl 14C (Glycine) 318,000 294,000 21,700 316,000 2,300 99 93 912 hr chase 3Ht (Methionine) 247,000 178,000 22,600 200,000 46,400 81 89f
Dow
nloaded from http://rupress.org/jcb/article-pdf/55/3/653/1070641/653.pdf by guest on 05 D
ecember 2021

0k
m
z ~'-sUa
UN
0
C
23
ô
less than 1 hr for transport : of the chorion syn-thesized throughout the 1 hr labeling period, 48 %is already extracellular by the end of the hour(Table III) . Of the chorion synthesized during3 hr, 91 % is extracellular after two additional hrof chase. Rather similar transport kinetics are ob-served in other insect as well as vertebrate systems(Kafatos and Kiortsis, 1971). The nonsecretory,large, methionine-rich proteins are retained withinthe epithelium while chorion is being deposited(Table III ; cf. columns C and E) .
662 THE JOURNAL OF CELL BIOLOGY • VOLUME 55, 1972
b
9 --------9
é -
2y
3'sSLICE NUMBER
kA I
zO.U
InmN Ix
ô
38
33
38
43
°
0
25
30
35
40
45
5 °SLICE NUMBER
SLICE NUMBER
FIGURE 4 Incorporation of methionine and glycine in chorion proteins . Chorionating follicles (No . 5 or 6)were incubated in 0 .6 ml GM containing glycine14C (uniformly labeled, 20 Ci/mole, 20 MCi/ml, Schwarz-Mann lot 6901) and methyl-methionine 3H (2 .5 Ci/mmole, 420 ACi/ml, Schwarz-Mann lot 2165) . After1 hr of labeling, one follicle was transferred to chilled MWS, cut in half, and washed . The follicular epi-thelium was separated from the chorion in 50 Al distilled water and the samples frozen separately. Theother follicle was labeled for 3 hr and chased for 2 hr in GM, transferred to chilled MWS, and dissectedas above . The samples were dissolved in SB I (containing 1 mm PMSF) by heating at 100 °C for 10 min,and analyzed by Method I . Upper: 14C () and 3 11 (*-*) profiles of the pulsed epithelium (a) andpulse-chased extracellular chorion (b) . Higher molecular weight proteins are on the left . The locationsof the three protein classes A, B, and C are indicated . Lower : 14C profiles (-) of the pulsed epithelium(c) and pulse-chased extracellular chorion (d) together with the 311/14 C ratios (*-*) . Only the chorionregion of each gel is shown (cf . a and c or b and d) .
Further Evidence forChorion Protein Heterogeneity
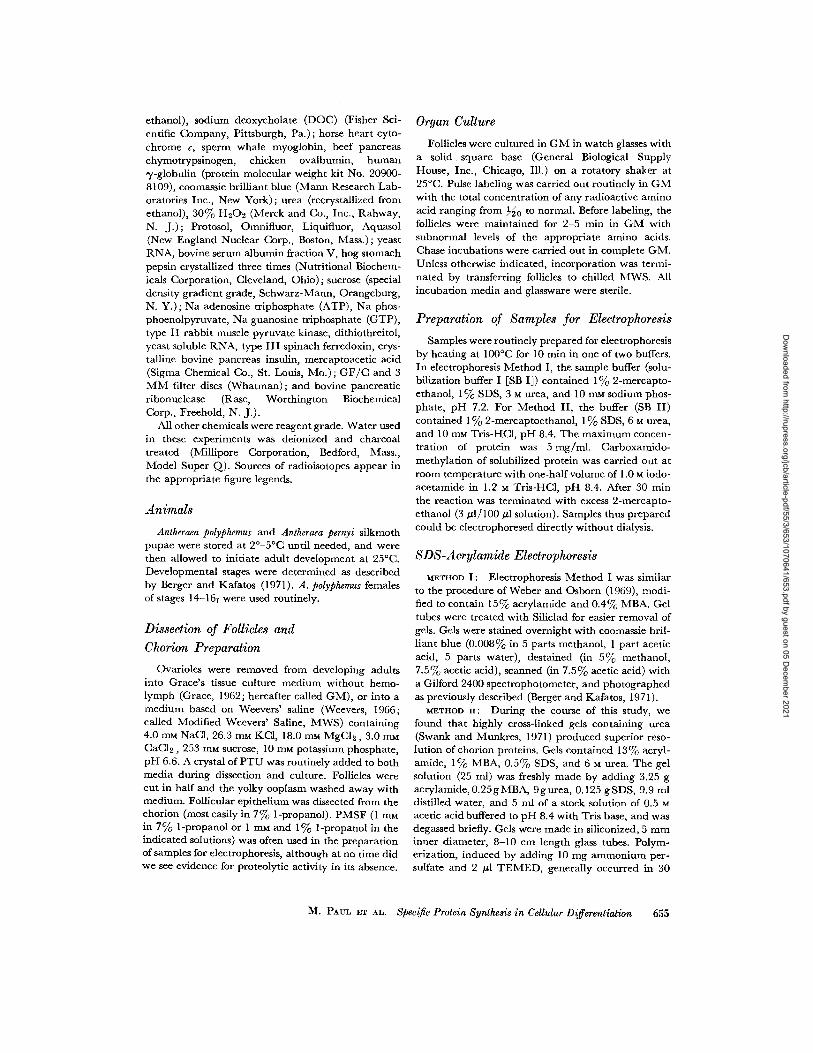
In a similar experiment, follicle 4 was labeledfor 2 hr in a mixture of leucine- 3H and cysteine- 19C .The labeled follicle was exposed to a 30 min chasein unlabeled medium and then the chorion wasfreed of epithelium . Fig . 5 a shows the incorpora-tion profiles of chorion proteins, and Fig . 5 b showsthe profile of leucine plus the leucine/cysteine ratiofor those gel slices with sufficient radioactivity .
zâ :r
UM
;Z=
Dow
nloaded from http://rupress.org/jcb/article-pdf/55/3/653/1070641/653.pdf by guest on 05 D
ecember 2021
O
x
m
m.
o,
0
Y
N=N0-U
Cl)
B
teins were much poorer in cysteine than any otherchorion component (Fig . 5 a) .
d Similar 1 experiments were performed withglycine- 14C and either lysine 3H or leucine3H. Inan experiment with lysine and glycine, a lysine-rich component was detected within class C, ap-parently corresponding to C 1 + 2 ; incorporationof lysine was too low to permit meaningful com-parisons among the other chorion proteins. How-ever, the lysine/glycine ratio was uniformly highin nonchorion proteins, being two to three timeshigher than even in the lysine-rich chorion com-ponent .
In several experiments, the ratio of glycine toleucine was two to three times lower in the non-chorion as compared to the chorion proteins . Theratios for class A, B, and C proteins were similar,though slightly higher for A and particularly forAI ; the ratio of the class D components was two-fold lower .
These experiments revealed that chorion pro-teins are distinct from each other in terms of aminoacid composition . As compared with other follic-ular cell proteins, they are unusually rich inglycine and cysteine and poor in methionine andlysine . Class A proteins are the most distinctive,and D proteins are the most similar to nonchorionproteins .
b
n
C
30
4b
°20
3b
4bSLICE
5b
A
sb
II
_N 1Ng
0-Um
0
0lorN
so
6b
70°NUMBER
FIGURE 5 a Incorporation of cysteine and leucine inchorion proteins . A follicle 4 was labeled for 2 hr in 0 .3ml GM containing L-leucine-4,5 3H (5 Ci/mmole, 133µCi/ml, Schwarz-Mann lot Wit 9.568) and cysteine 14C(uniformly labeled, 330 Ci/mole, 33 µCi/ml, New Eng-land Nuclear Corp. lot 605-185) . Labeling was followedby a chase in unlabeled GM for 30 min to permit de-position of the labeled chorion. The follicle was halvedand washed, and the chorion separated from the epithe-lium, dissolved in SB II, carboxamidomethylated, andanalyzed by Method II. (-), cysteine1 4C;leucine-311 .
FIGURE 5 b The same experiment as Fig . 5 a . (--),leucine-3H ; 3H/19C ratio, plotted with the95% confidence interval for counting error .
In this run electrophoretic separation was ade-quate for resolution of 10 labeled components. AllA proteins, and especially A3 and A4, showed avery low leucine/cysteine ratio . Proteins B1, B2,and C1-C 4 showed a relatively high ratio, whereasB 3-B6 had an intermediate value . Finally, D pro-
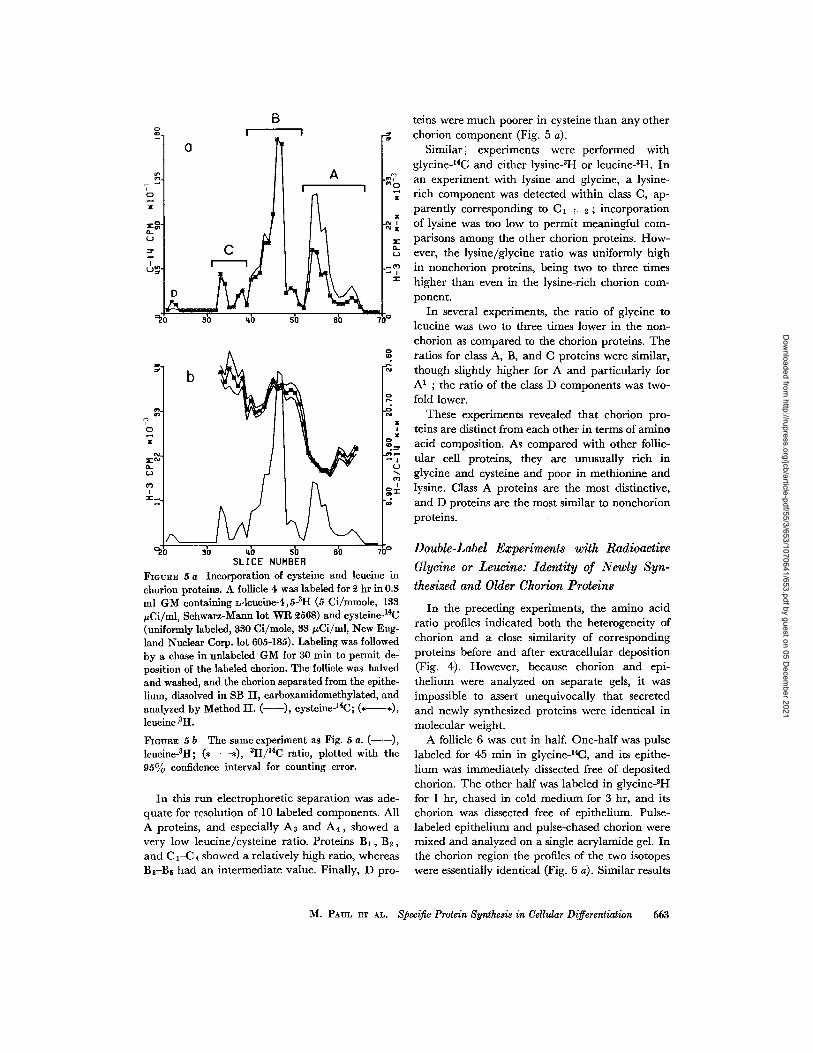
Double-Label Experiments with RadioactiveGlycine or Leucine : Identity of Newly Syn-thesized and Older Chorion Proteins
In the preceding experiments, the amino acidratio profiles indicated both the heterogeneity ofchorion and a close similarity of correspondingproteins before and after extracellular deposition(Fig. 4) . However, because chorion and epi-thelium were analyzed on separate gels, it wasimpossible to assert unequivocally that secretedand newly synthesized proteins were identical inmolecular weight .
A follicle 6 was cut in half . One-half was pulselabeled for 45 min in glycine-14C, and its epithe-lium was immediately dissected free of depositedchorion . The other half was labeled in glycine3Hfor 1 hr, chased in cold medium for 3 hr, and itschorion was dissected free of epithelium . Pulse-labeled epithelium and pulse-chased chorion weremixed and analyzed on a single acrylamide gel . Inthe chorion region the profiles of the two isotopeswere essentially identical (Fig . 6 a) . Similar results
M. PAUL ET AL. Specific Protein Synthesis in Cellular Differentiation
663
Dow
nloaded from http://rupress.org/jcb/article-pdf/55/3/653/1070641/653.pdf by guest on 05 D
ecember 2021

m
O
EN
L)U
Oa
NO
O
x
ZoCL
U
I6
27SLICE NUMBER
B
664
THE JOURNAL OF CELL BIOLOGY • VOLUME 55, 1972
A
O
XN INX
3b
45°
XCLU
NN
X
N xLa-U
ib
210
3b
4b
5Ô
6b
700SLICE NUMBER
FIGURE 6 a 14C pulse-labeled epithelium and 3 H pulse-chased extracellular chorion mixed and ana-lyzed on a single gel. A follicle 6 was dissected into MWS, cut in half, and the oocyte washed away . One-half was incubated in 0 .1 ml GM containing glycine-14 C (uniformly labeled, 36 Ci/mole, 20 pCi/ml,Schwarz-Mann lot 6901) for 45 min. At the end of the pulse the sample was chilled, and the epitheliumseparated from the chorion in 50 µl 70 0 1-propanol containing 1 mm PMSF and frozen . The other halfwas incubated in 0.1 ml GM containing glycine-2-H 3 (1.8 Ci/mmole, 1 .0 mCi/ml, New England NuclearCorp. lot 281-137) for 1 hr, and was then chased for 3 hr in normal GM . The chorion was separated andcleaned of cytoplasm in 7% 1-propanol containing 1 mm PMSF ; it was then added to the frozen 14C-labeled epithelium. The mixture was dissolved in SB I by heating at 100°C for 15 min, and was analyzedon a 10 cm gel by Method I. The region of the gel containing the chorion proteins was sliced and counted .A, B, and C indicate the respective classes ; the individual proteins are not resolved in this experiment .(
-), 19C; (*-*), Ill .
FIGURE 6 b 3H pulse-labeled and 14C pulse-chased follicular proteins . A follicle 4 was dissected intoMWS, halved, and the oocyte washed away . Both halves were incubated in 0.2 ml GM containing leucine-14C (uniformly labeled, 260 Ci/mole, 130 pCi/ml, New England Nuclear Corp . lot 605-025) for 12 min.They were then transferred into unlabeled GM with three washes, chased for 10 min, and incubated in0.2 ml GM containing L-leucine-4,5 3H (4.7 Ci/mmole, 3 mCi/ml, Schwarz-Mann lot WR 2568) for10 min . Finally, the tissue was washed in ice-cold GM and frozen (within 1 min of pulse termination)in a dry ice-acetone bath . The sample was dissolved, carboxamidomethylated, and analyzed on an 8 cmgel by Method II . Brackets indicate the A, B, and C classes of chorion protein .
Dow
nloaded from http://rupress.org/jcb/article-pdf/55/3/653/1070641/653.pdf by guest on 05 D
ecember 2021
were obtained in a second experiment involvingtwo follicles 6, from two ovarioles of the sameanimal. The results indicate that chorion proteinsdo not change molecular weight at the time ofdeposition, and that there is no interconversionbetween different chorion proteins during the 3 hrchase. Finally, this experiment reveals no majordisparities in the kinetics of transport, such as pro-longed retention of a particular protein classwithin the cytoplasm.
A second experiment was designed to detect anyinterconversions or other processing which mightoccur during the first 20 min after completion of aparticular polypeptide chain . Follicle 4 tissue wasincubated for 12 min in leucine-14C. The cellswere then chased for 10 min, labeled withleucine-3H for a further 10 min, and frozen in adry ice-acetone bath within 1 min from the end of3H-labeling. In this short pulse-label/pulse-chaseexperiment, 3H represents newly synthesized pro-teins (produced, on the average, 5 min beforefreezing) and 14C represents older proteins (pro-duced, on the average, 26 min before freezing) .When the proteins were displayed on an acryl-amide gel, the two isotope profiles were virtuallyidentical (Fig . 6 b) . In particular, it is clear thatno chorion protein accumulates (high 14C/ 3Hratio) at the expense of another (low 14C/ 3H ratio) ;in other words, no interconversion of chorion pro-teins occurs. Moreover, there is no indication of ahigh molecular weight precursor : such a precursorwould have been depleted during the chase andwould be identified as a 3H peak with low 14C/ 3Hratio. Finally, the superimposable isotope profilesin the chorion region indicate that, after theirsynthesis, chorion proteins do not "mature" eitherby removal of a peptide fragment or by covalentattachment of an oligosaccharide moiety largeenough to affect electrophoretic mobility . Fromprevious experience (Berger and Kafatos, 1971)we estimate that this experiment would haveeasily detected a change in molecular weight ofabout 200 daltons (a shift of peaks by half a slice,with one slice in the chorion region correspondingto 300-500 daltons) .
In sum, the experiments in this section and thosedescribed earlier indicate that, after synthesis,chorion proteins are packaged in the cytoplasmand deposited extracellularly without interconver-sion, cleavage from a high molecular weightprecursor, or other major maturation step . Each
chorion protein can be studied independently withreasonable confidence that its biosynthesis reflectsthe expression of a discrete gene . Any maturationstep would have to be completed in considerablyless than 5 min.
Changes in ChorionComposition during Development
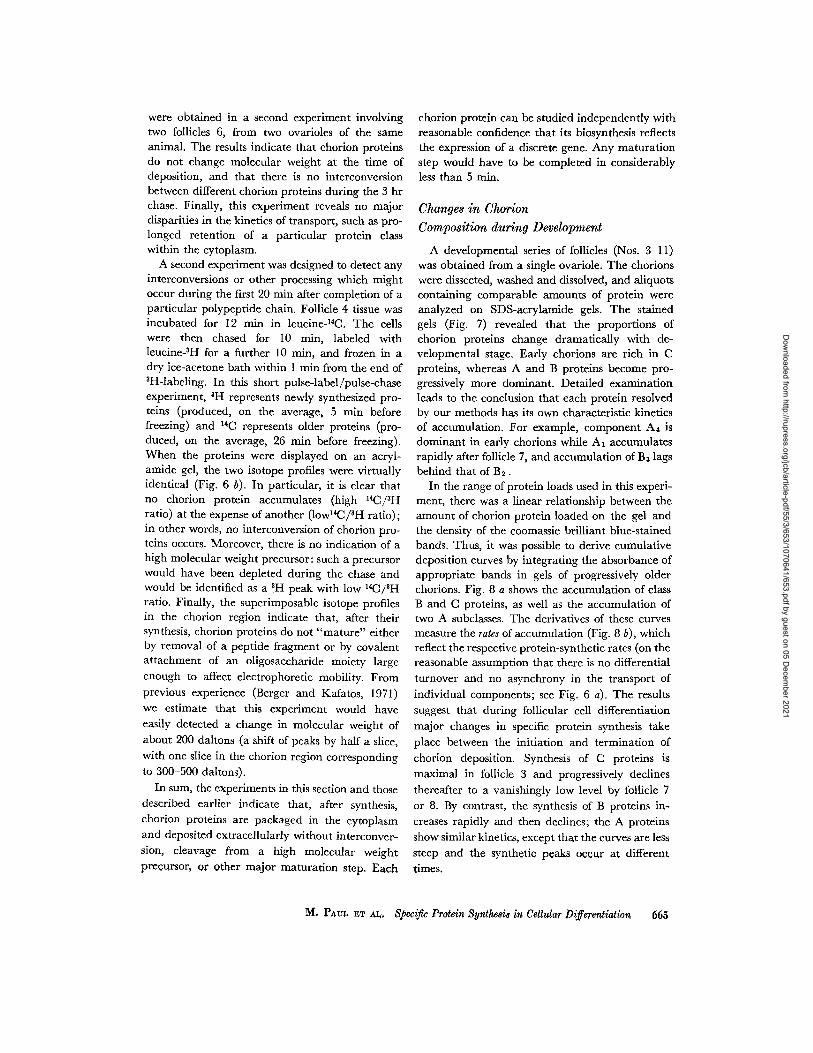
A developmental series of follicles (Nos . 3-11)was obtained from a single ovariole . The chorionswere dissected, washed and dissolved, and aliquotscontaining comparable amounts of protein wereanalyzed on SDS-acrylamide gels . The stainedgels (Fig . 7) revealed that the proportions ofchorion proteins change dramatically with de-velopmental stage . Early chorions are rich in Cproteins, whereas A and B proteins become pro-gressively more dominant . Detailed examinationleads to the conclusion that each protein resolvedby our methods has its own characteristic kineticsof accumulation. For example, component A4 isdominant in early chorions while A1 accumulatesrapidly after follicle 7, and accumulation of B3 lagsbehind that of B2 .
In the range of protein loads used in this experi-ment, there was a linear relationship between theamount of chorion protein loaded on the gel andthe density of the coomassie brilliant blue-stainedbands. Thus, it was possible to derive cumulativedeposition curves by integrating the absorbance ofappropriate bands in gels of progressively olderchorions . Fig. 8 a shows the accumulation of classB and C proteins, as well as the accumulation oftwo A subclasses . The derivatives of these curvesmeasure the rates of accumulation (Fig . 8 b), whichreflect the respective protein-synthetic rates (on thereasonable assumption that there is no differentialturnover and no asynchrony in the transport ofindividual components; see Fig . 6 a) . The resultssuggest that during follicular cell differentiationmajor changes in specific protein synthesis takeplace between the initiation and termination ofchorion deposition. Synthesis of C proteins ismaximal in follicle 3 and progressively declinesthereafter to a vanishingly low level by follicle 7or 8 . By contrast, the synthesis of B proteins in-creases rapidly and then declines ; the A proteinsshow similar kinetics, except that the curves are lesssteep and the synthetic peaks occur at differenttimes .
M. PAUL ET Al., Specific Protein Synthesis in Cellular Differentiation
665
Dow
nloaded from http://rupress.org/jcb/article-pdf/55/3/653/1070641/653.pdf by guest on 05 D
ecember 2021

FIGURE 7 Electropherograms of chorions dissected from a developmental series of follicles (Nos . 3-11,from left to right) . Follicle 3 has the first dissectable chorion. The origin is at the top ; markings at thebottom are codes for identification of gels . Chorions were dissected from sequential follicles of a singleovariole in 7% 1-propanol containing 1 mm PMSF, dissolved in SB II by heating at 100° C for 5 min,carboxamidomethylated, and analyzed electrophoretically on 8 cm gels by Method II . The fractionof the total chorion loaded was 32, %, 3s, 3io, 3i5, 3'o, 32o, 32o, and 320 for Nos . 3-11, respectively.
Changes in Follicular ProteinSynthesis during Development
As the kinetics of accumulation predicted (Fig.8), major developmental changes in protein syn-thesis were detected when staged follicles werepulse labeled with radioactive amino acids in short-term organ culture . Fig . 9 shows typical results,from an experiment in which staged follicles wereexposed to leucine 3H for 2 hr . Since our electro-phoretic conditions are designed to maximizeresolution in the mol wt range 7000-25,000, thenormally large proteins synthesized by pre-chorionating follicles penetrate only a short dis-tance into the gel (Fig . 9, follicle 0) ; in suchfollicles, there is very little incorporation in thechorion region, and none of it can be assignedspecifically to chorion components. By contrast, infollicle 2 the labeling of nonspecific proteins hasdeclined considerably, and labeling of chorion pro-teins, especially C, has become prominent . Thetrend toward reduction of nonspecific protein syn-
6 66
THE JOURNAL OF CELL BIOLOGY • VOLUME 55, 1972
thesis and accentuation of chorion synthesis con-tinues in subsequent stages .
In this experiment, the electrophoretic resolu-tion was sufficient to display unambiguously 10chorion peaks (Fig . 9, follicle 3) . Careful attentionto the incorporation profiles reveals that everysingle chorion peak shows distinct developmentalkinetics . Moreover, these kinetics are in very closeagreement with those expected from the analysisof accumulated proteins in a developmental seriesof follicles (Fig . 7) . C proteins, and especiallyCI + 2 and C6 + 6, are the earliest synthesized .Production of D proteins occurs somewhat later .Of the two major B proteins, B2 is dominant inearly incorporation profiles ; B3 becomes evidentas a prominent shoulder by follicle 6, and is thedominant component synthesized in follicle 10 .Finally, component A I + 2 is synthesized later thancomponent A 3 + 4 .
These incorporation kinetics are highly repro-ducible . They have been observed in three separateexperiments involving labeling and analysis of a
Dow
nloaded from http://rupress.org/jcb/article-pdf/55/3/653/1070641/653.pdf by guest on 05 D
ecember 2021

complete developmental series of follicles. Theyhave been observed after labeling with eitherleucine or glycine ; in fact, because of the aminoacid composition of chorion, glycine profiles areeven more dramatic .
Figure 10 a emphasizes the over-all switch tochorion synthesis . In a brief span of 4-10 hr, thefollicular cells shift 60-70% of their protein syn-thesis to chorion production . In 16-20 hr (fromfollicles 0 to 4), the shift is complete, from unde-tectable to approximately 90% chorion synthesis .
Figure 10 b summarizes the relative kinetics ofsynthesis for specific chorion proteins, as deter-mined from incorporation experiments . Since thespecific activity of the intracellular labeled aminoacid was not measured, it is not possible to expressthe data in terms of absolute rates . Very similarrelative kinetics can be derived from Fig. 8 b . Thus,the same precise developmental program of specificchorion protein synthesis can be documented bothby in vivo accumulation and by in vitro labeling .
Proteins of the Vitelline Membrane
The vitelline membrane is an extracellular layerbordering the oocyte and secreted before chorion
ad
200
ZOI-Q
150
VVQZO'X 100OXV
OW
Q 50
6
7
8
9
10 11
3
4
5
6
7
8
9
10FOLLICLE NUMBER
FOLLICLE NUMBERFrGuaE 8 Accumulation of chorion proteins (a), and rates of accumulation (b) during follicular de-velopment. To determine the cumulative amount of protein (a), the stained gels of a developmentalseries of chorions (Fig . 7) were scanned, and groups of peaks were cut out, weighed, and corrected forthe fraction of chorion used. Rates of accumulation (b) were determined by measuring the slope of theaccumulation curves . The scale of each ordinate is in arbitrary units, but the same for all protein classes .
M. PAUL ET AL . Specific Protein Synthesis in Cellular Differentiation
667
11
deposition (Telfer and Anderson, 1968; Telfer andSmith, 1970) . Electrophoretic analysis of vitellinemembrane dissected from a follicle 3 revealed threemajor components approximately 55,000, 70,000,and 100,000 mol wt, all substantially larger thanthe chorion proteins .
Changes in FollicularPolysomes during Development
Paralleling the change in synthetic activity fromlarge cellular proteins to small chorion compo-nents, there is a shift in the size distribution ofpolysomes. Prechorionating cells have a polydis-perse polysome profile ; most abundant are moder-ately large polysomes (7-12 ribosomes, the largestsize resolved by our conditions) . By contrast,chorionating follicles have almost exclusively smallpolysomes, especially tri- to heptamers, and show asharp cutoff above the heptamer region .
The unusually small polysomes of older folliclesdo not result from selective breakdown duringsample manipulations . Prechorionating (-5 to 0)and late-chorionating (4 to 8) follicles were labeledseparately with leucine-3H and leucine-14C, re-spectively, for 5 min. The tissues were then mixed,
Dow
nloaded from http://rupress.org/jcb/article-pdf/55/3/653/1070641/653.pdf by guest on 05 D
ecember 2021
Çm,
U
mxm_
2
3
C3+41
4+5e~
+2
l0
20
30
40
50
60~-7b
cb
C,+2
C3+4
B2
I C,+2
_
Um=m
l'0
2 10
3b
4b
Sb
ab
7b
668
THE JOURNAL OF CELL BIOLOGY • VOLUME 55, 1972
4
b
D
lb
2b
3b
4b
sb
60
7
`b
l
2b
10
C3+4
B 5
B3
B 2
B 2
1
30
40SLICE NUMBER
B A3+4
+4
sb
sb
76
Al+2
lb
2b
3b
4b
5b
Ob
710
Al+2
FIGURE 9 The proteins synthesized by follicular cells in short-term organ culture . A complete develop-mental series of follicles (Nos. -2 through 10) was incubated in 0.4 ml GM containing L-leucine-4,5-3H (5.4 Ci/mmole, 188,uCi/ml, Schwarz-Mann lot WR 2568) and glycine14C (uniformly labeled, 100Ci/mole, 50 yCi/ml, Schwarz-Mann lot VR 2216) for 2 hr . The follicles were chilled, cut in half, and theoocyte washed away. Each sample (epithelium plus chorion, if present) was dissolved in SB II, carboxa-midomethylated, and analyzed on an 8 cm gel by Method II. Only representative leucine3H profilesare shown, but the glycine- 14C profiles were similar. The number at upper left indicates the follicle num-ber. The major labeled chorion protein peaks are identified . The bulk of the nonchorion protein in eachsample, as seen in the stained gels (not shown here) is between slices 1 and 30, although this region ac-counts for little of the incorporation in chorionating follicles .
homogenized together, and displayed on a sucrose in prechorionating epithelium ; the 3H/14C ratiogradient (Fig . 11) . Thus, all polysomes were ex- revealed that chorionating follicles have an excessposed to identical conditions from the time of cell of dimers through hexamers (median size, fourrupture onward . Large aggregates predominated ribosomes) . Samples that include both types of
Dow
nloaded from http://rupress.org/jcb/article-pdf/55/3/653/1070641/653.pdf by guest on 05 D
ecember 2021

100
Z 90oâ 80W0
70N 0
x z: 60ZN H 500
Z r0 ~, 40W rx Z 30Uvd 20Na 10
a
0 1 2 3 4 5 6 7 8 9 10FOLLICLE NUMBER
tissue (follicles 1-6, Fig . 13) contain both types ofpolysomes.
An even better correlation between nascent pro-tein size and polysome size was revealed fromstudy of more closely staged follicles (Fig . 12) . Asexpected from earlier results (Figs. 9, 10 b),polysomes from follicle 2 (which synthesizes pre-dominantly C proteins) included major peaks in asize range (seven to nine ribosomes in this experi-ment) just higher than the cutoff of polysomes fromfollicles 5 and 6 (which synthesize almost exclu-sively A and B proteins) . Again as expected (seeFig. 9), follicle 2 also had larger polysomes . Thecontrast between the two types of tissue is empha-sized by the ratio profile (bottom ratio panel,Fig. 12) . Apparently, A and B proteins are syn-thesized predominantly in three- to five-memberpolysomes. As expected (see Fig . 9), polysomes offollicles 3 or 4 were not substantially different fromthose of follicles 5 and 6 (Fig . 12, middle and topratio panels) .
The high level of monosomes (40-60% of the
FmuaE 10 a Relative rate of total chorion protein synthesis, as revealed by amino acid incorporationin chorion relative to incorporation in the total protein during a standard labeling period (for detailsof the experiment see Fig . 9) . The amount of incorporation in each stage was determined by weighingcutouts of the total incorporation profile and of all the chorion peaks (after correcting by extrapolationfor the small amount of overlapping nonchorionr poteins) . (A-A), glycine 14C ; (• f), leucine-'H. The difference between the curves is a result of the higher glycine content of chorion as compared tononspecific proteins .
FIGURE 10b Relative rate of synthesis for particular chorion proteins, as revealed by incorporationof glycine 19C in specific classes relative to total incorporation in chorion during a standard labelingperiod . Incorporation was determined as above, by weighing cutouts of the appropriate labeled peaks(see Fig . 9) .
total ribosomes) apparently reflects in vivo condi-tions (see Bosches, 1970) : several criteria indicatethat monosomes do not result from polysomebreakdown during isolation . First, after brieflabeling with amino acids, both the level of in-corporation and the specific activity in themonosome peak are very low (Fig . 13) . Further,in common with native monosomes and in con-trast to particles engaged in protein synthesis, 80 %of follicular monosomes are dissociated by 0 .5 MKCl (Zylber and Penman, 1970) ; by contrast,addition of 2 1Lg/ml of RNase converts follicularpolysomes quantitatively to salt-resistant mono-somes. Finally, endogenous nuclease activity incrude follicular homogenates is exceptionally low.Incubation of high specific activity transfer RNA(tRNA)32P from Staphylococcus epidemidis (105 cpm,less than 1 µg) with the cytoplasmic fraction offollicle homogenate (60 follicles/ml) for 20 min at37°C converts less than I % of the tRNA tooligonucleotides smaller than eight residues long.Under identical conditions, more than 95% of the
M. PAUL ET AL. Specific Protein Synthesis in Cellular Differentiation
669
Dow
nloaded from http://rupress.org/jcb/article-pdf/55/3/653/1070641/653.pdf by guest on 05 D
ecember 2021

Vv
2
oo
ECvhNQ
10.0
5.0
0.0
0 .1 -
670
THE JOURNAL OF CELL BIOLOGY • VOLUME 55, 1972
iX
5X~_ 11II15
15
25top
FRACTION NUMBERFIGURE 11 Polysomes from prechorionating and chorionating follicles . Cells from follicles -5 to 0(from a single ovariole) were incubated for 5 min in GM containing L-leucine-4,5 3H (50 Ci/mmole,200 sCi/ml, Schwarz-Mann lot WR 2568) ; cells from follicles 4-8 were incubated for 5 min in GM con-taining leucine14C (uniformly labeled, 312 Ci/mole, 50 j Ci/ml, Schwarz-Mann lot WR 2168) . Homoge-nization and sedimentation were carried out in standard buffer with the KCl raised to 0 .25 M. Linearsucrose gradients (20-40°ßo w/w) were centrifuged at 39,000 rpm for 90 min . All solutions were treatedwith bentonite . (O-O), 3H-counts per minute (polysomes of prechorionating follicles) ; (s-.), 14C-counts per minute (polysomes from chorionating follicles) ; ( ), absorbance . The profile is dominatedby the more abundant polysomes of chorionating cells . Maximum absorbance of the monosome peakis 1 .2 . Arrows indicate the position of the monosomes (1 X) and pentasome (5 X) . (AAA), 3H/14C ratio,representing for each fraction the relative abundance of polypeptide chains from prechorionating andchorionating cells.
labeled tRNA is degraded by S. epidemidis lysates .2 longed retention of protein synthetic capacity byLow RNase activity is also indicated by the pro- follicular cell extracts stored at 0°C (see below) .
Indeed, we routinely use follicular cell homoge-I We are indebted to R . Roberts and R. Gelinas for nates to preserve labile polysomes from otherthis determination.
insect tissues, in a manner analogous to the use of
135
200
1145
bottom
Dow
nloaded from http://rupress.org/jcb/article-pdf/55/3/653/1070641/653.pdf by guest on 05 D
ecember 2021

L)
SC)
O
Q
15
10
5
10
5
25
20
15
10
5
1000
800
400
200
15
25
35
45
125
bOC
75 âv
50
25
vv
top 5FRACTION NUMBER
FIGURE 12 Stage-specific polysomes . Groups of follicles (5 each for Nos. 2, 3, or 4, from a single animal)were labeled for 9 .5, 10, and 10.5 min, respectively, in GM containing L-leucine-4,5-3H (50 Ci/mmole,100 µCi/ml, Schwarz-Mann lot WR 2568) . Follicles 5 and 6 (five each) were incubated together for 11min in leucine-14C (uniformly labeled 259 Ci/mole, 20 µCi/ml, New England Nuclear Corp. lot 605-025) . After homogenization, 0 .2 ml aliquots of the follicle 5 plus 6 homogenate were added to each ofthe other three samples before layering on gradients. Sedimentation was carried out on 20-40% (w/w)linear sucrose gradients in standard buffer at 39,000 rpm for 90 min . All solutions were treated withbentonite. (O O), polysomes from follicle2 ; (5-0),polysomes from follicles 5 plus 6. Arrows in-dicate the position of monosomes (1 X) and hexasomes (6 X) . (0 • 0), 3H/14C ratios ; bottom ratio panel,polysomes from follicle 2 versus 5 plus 6 ; middle, follicle 3 versus 5 plus 6 ; top, follicle 4 versus 5 plus 6 .
bottom
M. PAUL ET AL. Specific Protein Synthesis in Cellular Differentiation
671
Mose »0
1 I 1
•
1
400, te 00
l
411 1 1
-
9b 1 II
1 11 1 P, ' l
- 1 101 1 11
o 11é1 n9 1 1 11
o I) 1
° b 0o I
1 I100 II I I1 1
1I
1b 1
I9
I
-
6 ~̀~1 1
1X 6X
1 1 1 1
Dow
nloaded from http://rupress.org/jcb/article-pdf/55/3/653/1070641/653.pdf by guest on 05 D
ecember 2021

rat liver supernates (Roth, 1956). In summary,mechanical or enzymatic degradation of polysomesseems minimal in this tissue .
It also appears that the polysome profiles do notresult from disassembly through continuing chainelongation and termination without reinitiation .Nearly identical absorbance profiles are obtained,whether rapidly chilled cells are disrupted im-mediately or after 30 min in hypotonic homogeni-zation buffer at 0 °C. Moreover, the polysomeabsorbance profile is stable when protein synthesisis abruptly stopped at 0 °C, even if homogenatesare subsequently incubated at 18°C for up to 30min. "Runoff" is only observed if the initialchilling in homogenization buffer is insufficientlyrapid . It appears that the profiles obtained by ourstandard conditions are a reasonable reflection ofthe polysome size distribution in vivo .
Finally, it seems clear that the polysome-associated radioactivity after brief labeling withradioactive amino acids represents nascent poly-
top
6 72
THE JOURNAL OF CELL BIOLOGY • VOLUME 55, 1972
bottomFRACTION NUMBER
FIGURE 13 Polysomes isolated from follicular epithelium . Tissue from follicles 1-6, taken from a singleanimal, was labeled for 2 min in GM containing glycine-2 3H (4.3 Ci/mmole, 200 ,ttCi/ml, Schwarz-Mann lot 281-137) . Centrifugation was carried out on linear 20-35% (w/v) sucrose gradients in stand-ard buffer at 39,000 rpm for 2 hr. Arrows indicate the position of monosomes (1 X) and hexasomes (6 X) .Absorbance maximum of the monosome peak was 1 .6 . (-), absorbance ; ( ••) , radioactivity .
peptides, rather than completed and secondarilyadsorbed chains . The distribution of label isvirtually identical, whether polysomes are pre-pared with the standard low ionic strength bufferor in the presence of 0 .25-0 .5 M KCI, which shouldreduce nonspecific protein binding (WarnerPene, 1966) .
and
Changes in Translation Time duringFollicular Cell Development
The average translation time for proteins syn-thesized by prechorionating and chorionatingfollicles was determined by a modification of themethod of Fan and Penman (1970) . Since nascentpeptide chains can be assumed to be half finished,on the average (Hunt et al ., 1968), once theprecursor pool specific activity has stabilized, thetime required for one set of labeled nascent chainsto be released is equal to one-half the averagetranslation time, ti/2 . Operationally, this time is
0.5 250
0.4 200
C
0.3 150 Q-
LON
Q0.2
O..V
M
100
0.1 50
t
t1X
6X0.0 t
10
20
30
40
50 0
Dow
nloaded from http://rupress.org/jcb/article-pdf/55/3/653/1070641/653.pdf by guest on 05 D
ecember 2021

determined from the progressive increase of TCA-precipitable amino acid label in the total cell ex-tract and, separately, in released chains . The half-translation time is the time required for all theradioactivity initially found in the total sample(polysome bound plus released) to become asso-ciated with released chains alone .
Follicular epithelium was prepared from pre-chorionating (-5 to 0) and chorionating (4 to 8)follicles . Each type of tissue was labeled separatelyat 23 .5 °C for various times (5-25 min), and wasthen homogenized . Follicles from a single ovariolewere used for each time point. Nascent poly-peptides were visualized directly by displaying thetissue homogenates on sucrose gradients in 0 .25 MKCl (to minimize nonspecific binding of completedchains to ribosomes) . The radioactivity sediment-ing slower than monosomes was attributed to re-leased chains . The prechorionating epitheliumwas labeled in leucine- 3H and the chorionatingepithelium in leucine 14C, and tissues labeled forcorresponding periods of time were mixed beforehomogenization. This reduced the total numberof samples processed and made the two tissuesmore comparable. To reduce the scatter from var-iable amounts of tissue in each aliquot, total orreleased radioactivity was normalized by dividingby the ratio of total radioactivity to timeof labeling. The normalized data (now expressedin time units) were plotted against the time oflabeling (Fig . 14). Because of the normaliza-tion, the data for total counts gave a straightline through the origin, at an angle of 45 ° . Bestfit lines were then calculated by regressionanalysis for the released chain data . For both typesof tissue the best fit line had a slope in good agree-ment with the expected value of 1 (0 .998 and 0 .991for chorionating and prechorionating samples,respectively) . The horizontal distance between thebest fit line and the 45 ° line gave the value for thehalf-translation time, 1 .0 and 2.3 min forchorionating and prechorionating tissues, respec-tively.'
The calculated translation times were consistentwith the hypothesis that the average time neededto add a single amino acid to a growing poly-peptide chain is similar for chorion and for cellularproteins . The rate of peptide chain elongation isthe number of amino acids in a protein divided by
3 This difference in translation times causes a low3H/14C ratio near the top of the gradient in Fig . 11 .
w
r
X
25
20
154uâ 10o
5
o H̀ 5H, \ t
1/2=2 .3\ß̀r,/2= to
FIGURE 14 Average translation time for proteins inprechorionating (Nos. -5 to 0) and chorionating(Nos . 4-8) follicles . Follicles were selected, incubatedin radioactive GM for the indicated time, and homog-enates displayed on sucrose gradients as described inFig. 11 ; prechorionating (3H, o-o) and chorionating( L4C, &-*) samples for each time point were dis-played on the same gradient . All but the 5 min gradi-ent (shown in Fig . 11) were collected from the bottom .The first 10 fractions were designated as releasedchains, and correction for the additional chains over-lapping with monosomes was made by adding to thereleased chain total the radioactivity below the lineextrapolated from the top of the gradient through themonosome region (fractions 12-14 in Fig . 11) . Datafor each time point were normalized by dividing bythe corresponding ratio (total counts per minute)/(duration of labeling) . Best fit lines were determinedby regression analysis .
the translation time . Aliquots of total homogenatefrom the 25 min sample were dissolved and elec-trophoresed on SDS-acrylamide gels together withprotein molecular weight standards. The medianmolecular weight of the labeled proteins was de-termined, as the weight above and below whichthere were equal amounts of radioactivity in thegel . 4 The values for prechorionating and chorionat-ing tissue were 58,000 t 4000 and 13,800 f 1000,respectively (Fig . 15). The molecular weight ofthe average amino acid residue in the nonspecific
4 This is the correct formula for the average molecularweight to be used in conjunction with the averagetranslation time as calculated by the method of Fanand Penman (1970) .
10
15
20TIME (min)
25
M. PAUL. ET AL . Specific Protein Synthesis in Cellular Differentiation 673
Dow
nloaded from http://rupress.org/jcb/article-pdf/55/3/653/1070641/653.pdf by guest on 05 D
ecember 2021

xmE -
0U
M
N1b
ra'hi o
i
l
Ich
2b
30
4bSLICE NUMBER
90 ,
1b
2b
3b
4b
5b
60SLICE NUMBER
FIGURE 15 Electrophoretic analysis of released plus nascent chains from pulse-labeled chorionating(lower) and prechorionating (upper) follicular cells. Aliquots of the 25 min homogenate (Mg . 14) weredissolved in SB II by heating at 100 ° C for 10 min. Samples were analyzed either by electrophoresisMethod II (b) or on standard 10% acrylamide gels (a ; Weber and Osborn, 1969) for optimal resolutionof chorionating and prechorionating proteins, respectively . Gels were processed and radioactivity countedby Method II. Proteins of known molecular weight were run both in parallel and as internal standardsin the same gels as the samples . Arrows point to the average molecular weight of the labeled proteins(58,000 in a and 13,800 in b) ; a, bovine serum albumin ; h, heavy y-immunoglobulin chain ; o, ovalbumin ;p, pepsin ; ch, chymotrypsinogen ; m, myoglobin; c, cytochrome c ; f, ferredoxin ; i, insulin.
proteins is 110 (Kawasaki et al ., 1969; see also chorionating and 150 for the chorionating cells .
Lehninger, 1970) and in chorion proteins is 93 These values, divided by the respective transla-(Kawasaki et al., 1969, 1971 a) . Thus, the average tion times, yielded values for the rate of peptidesize is 530 amino acids per protein for the non- chain elongation, 1 .9 amino acids/sec and 1 .3
674
THE JOURNAL OF CELL BIOLOGY . VOLUME 55.1972
50
a
60
Dow
nloaded from http://rupress.org/jcb/article-pdf/55/3/653/1070641/653.pdf by guest on 05 D
ecember 2021

amino acids/sec for prechorionating and chor-ionating tissue, respectively .
Cell-Free Follicular Protein Synthesis
The cytoplasmic fraction (5000 g supernate[S-5]) of homogenized follicular cells is highlyactive in cell-free protein synthesis when sup-plemented with an ATP-generating source, ap-propriate cofactors, and amino acids . Incorpora-tion of labeled amino acids into TCA-precipitablematerial is nearly linear for 20 min (Fig . 16) .The crude cell-free system incorporates at 16-23 %of the rate of whole cells incubated in the sameconcentration of isotope (Table IV [A]) .
The crude cytoplasmic fraction (S-5) was furtherfractionated into a microsomal pellet and apostmicrosomal 105,000 g supernate (S-105) . Byitself the S-105 fraction was nearly devoid ofincorporating ability, but the microsomal fractionwas significantly active, presumably because itcontained low levels of the supernate factors ;when the two subfractions were recombined, thereconstituted system had an incorporating ability
0a NZae
5 15 2010minutes
FIGURE 16 Incorporation of leucine- 3H by a recon-stituted cell-free system. Microsomal and postmicro-somal supernate (S-105) fractions stored at -90 °C(Table IV, experiment B) were combined and incu-bated at 25 ° C in the cell-free reaction mixture con-taining L-leucine-4,5 3H (55 .2 Ci/mmole, 400 pCi/ml, New England Nuclear Corp . lot 577-027) . Aliquotswere withdrawn at the indicated times and radioactiv-ity determined as described in Methods . Similarkinetics were shown by the S-5 cell-free system .
fourfold higher than that of the microsomal pelletalone (Table IV [B]) . On the average, the re-constituted system showed one-fourth the in-
corporating ability of the S-5 crude cytoplasmicfraction (Table IV [C]) . Both the S-5 preparationand its subfractions were active after storage at-90°C for as long as I yr. In addition, the S-5fraction retained at least 50% of its activity afterstorage at 0 °C for 24 hr, indicating that ribo-nuclease activity is unusually low in these cells .Both the crude and the reconstituted systemsdisplayed a sharp pH optimum at 7 .5 to 8 .0, andoptimal K+ and Mgt+ concentrations of 30 mmand 10 mm, respectively .
Fig. 17 demonstrates that both chorion andnonchorion proteins are synthesized by the cell-free system . Just as in whole-cell experiments,determination of chorion synthesis in a cell-freepreparation is made possible by the unusually
low molecular weight and characteristic aminoacid composition (low lysine- 3H/glycine- 14C ratio)of chorion .
DISCUSSION
The Proteins of Chorion
Morphologically, the chorion of insects is adistinctive structure (Smith et al., 1971); we nowknow that it is equally distinctive biochemically.In A . polyphemus, as in other related moths (Paulet al., 1972), it consists of a small number of pro-teins of unusually low molecular weight.The moth chorion is almost exclusively pro-
teinaceous (96% according to Kawasaki et al .,1971 a ; see also Tichomiroff, 1885 ; Webster, 1910 ;McFarlane, 1962) . On the basis of solubility char-acteristics, Kawasaki and his coworkers (1971 a)distinguished one major and one or two minorchorion proteins, depending on the moth species .In the present study, we detected four predominantproteins (three in other saturniids and in Bombyxmori ; Paul et al., 1972), 11 minor components,and a number of trace constituents . Preliminaryisoelectric focusing experiments indicated onlylimited additional heterogeneity. Electrophoreticpatterns are similar in all saturniids examined andin B . mori (members of the superfamily Bomby-coidea); the pattern in the tobacco hornworm,Manduca sexta (a member of the related super-family Sphingoidea), is somewhat different (Paulet al., 1972). Morphological (for references seeSmith et al ., 1971) as well as amino acid compo-sition data (Kawasaki et al ., 1971 b) indicate
M. PAUL ET AL . Specific Protein Synthesis in Cellular Differentiation
675
Dow
nloaded from http://rupress.org/jcb/article-pdf/55/3/653/1070641/653.pdf by guest on 05 D
ecember 2021

TABLE IVWhole-Cell and Cell-Free Incorporation of Leucine- 3H
C Cytoplasmic fraction (S-5)
95 f 61 (six experiments)Microsomal pellet + S-105
26 f 8 (three experiments)
A : Follicles (Nos . 1-5) from one animal were divided into two groups. One was incu-bated at 25 °C in 0.5 ml of GM containing L-leucine-4,5- 3H (55.2 Ci/mmole,400,uCi/ml, New England Nuclear Corp . lot 577-027) . After 20 min, the epithelial tissuewas chilled, rinsed three times with MWS, homogenized in distilled water at 0 °C, andthe TCA-precipitable radioactivity and RNA content determined . An S-5 cytoplasmicfraction was prepared from the remaining follicles, and an aliquot (containing 112 ugRNA) was used in 0 .5 ml of incorporation mixture with leucine- 3H at the same concen-tration and specific activity as above . Incubation was carried out at 25 ° C for 20 min ;the value given is the average rate of incorporation between 0 and 10 min, which is atleast 707 of the initial rate of synthesis . B : An S-5 fraction (follicles 1-5) was centri-fuged at 105,000 g for 90 min at 4 °C in an IEC SB 405 rotor. The microsomal pellet(resuspended in homogenization medium ; see Methods), and the postmicrosomalsupernate (S-105) were both stored at -90 °C. Aliquots of the frozen fractions, aloneand in combination, were incubated at 25 °C in 0 .10 ml of the incorporation mixturecontaining leucine- 3H (as above). In terms of the number of follicle equivalents, themicrosomal fraction used was double the S-105 fraction . Incorporation values are theaverage rates between O and 10 min . The RNA content was 59 .2 pg/0.1 ml assay mixturefor the microsomal pellet, 1 .44 ug for S-105, and 60 .6 Ag for the two combined . C : EitherS-5 cytoplasmic fractions or a reconstituted system (microsomal pellet plus S-105supernate) were assayed in the incorporation mixture as in A and B . Incorporationrates (0-10 min) are the mean ± one standard deviation . The RNA contentwas 262 f 67 for S-5 experiments and 637 ± 44 for reconstitution experiments (0 .5 mlassay volume) .
FIGURE 17 Radioactivity profiles of protein labeled with lysine 3H and glycine-14C in a cell-free systemand analyzed electrophoretically . Cell-free protein synthesis was carried out for 15 min at 25 °C in 1 mlof reaction mixture (containing S-5 cytoplasmic fraction with 223 µg RNA/ml) . The label was L-lysine- 3H(generally labeled, 6.5 Ci/mmole, 0 .75 mCi/ml, Schwarz-Mann lot WR 2394) and glycine- 14 C (uniformlylabeled, 104 Ci/mole, 75,uCi/ml, Schwarz-Mann lot WR 2198) . The reaction was stopped at 0 °C andpart of the sample precipitated with an equal volume of ice cold 10% (w/v) TCA . The precipitate waswashed twice with ethanol, air dried, analyzed electrophoretically on an 8 cm gel by Method II, and theradioactivity profiles determined . Chorion proteins can be identified by the low 3 H/' 4C ratio, as well asby their characteristically low molecular weight. The ratio plot includes the 957 confidence limits forcounting error. Radioactivity profiles of labeled whole cells, homogenized and then precipitated as above,were similar to the profiles obtained routinely by directly dissolving samples in sample buffer (see Fig . 9) .
676
THE JOURNAL OF CELL BIOLOGY • VOLUME 55, 1972
Incorporating systemRate of incorporation(cpm/min/sg RNA)
Rate of incorporation(cpm/min/ totalassay mixture)
A Whole cells 560Cytoplasmic fraction (S-5) 112
B Microsomal pellet 261Postmicrosomal supernate 5
(S-105)Microsomal pellet + S-105 961
Dow
nloaded from http://rupress.org/jcb/article-pdf/55/3/653/1070641/653.pdf by guest on 05 D
ecember 2021

7R
7R
',PI
1CJ
0
0
NV1 .N
0a
N
U
S.IQ
00
T
10
20
30
40
50
6,0
10
20
30
40
50
6b
10
20
30
40
50
60SLICE NUMBER
Dow
nloaded from http://rupress.org/jcb/article-pdf/55/3/653/1070641/653.pdf by guest on 05 D
ecember 2021

that the chorion may be substantially differentin other insect orders .
The experiments reported here document thatthe A . polyphemus chorion proteins resolved by ourprocedures are synthesized as distinct proteinsby the secretory follicular cells . They are notartifacts of partial proteolysis . They are diversein amino acid composition, and hence not mul-timers of a fundamental unit . They are not cleavedfrom a large precursor nor do they undergo anyinterconversion or other detectable maturationstep, either during their sojourn in the cyto-plasm or during extracellular deposition . Theirtranslation time and the size of the polysomes onwhich they are synthesized are consistent withthe hypothesis that they are synthesized on mono-cistronic mRNAs . Finally, their separate kineticsof synthesis during follicle development testifyto their distinctness . Most likely, each resolvableprotein can thus be studied as the expression of adistinct gene .
Differentiation-Specific Protein Synthesis
Cellular differentiation is commonly char-acterized by major changes in the rate of syn-thesis of cell-specific proteins (Kafatos, 1972 a) .Typically, the rate of synthesis of a specific pro-tein begins to accelerate rapidly at a character-istic period of differentiation, reaches a peak value,and is then further "modulated," often down-wards (Rutter et al ., 1968; Kafatos, 1972 a) .Follicular cell differentiation conforms to thesegeneralizations and appears unusually promisingfor study. The "turning on" of chorion synthesisis very rapid and occurs in parallel with a pre-cipitous drop in incorporation into nonchorionproteins (Fig. 9) . Most important, in this systemthe synthesis of each of a number of cell-specificproteins is regulated separately, according to aprecise developmental program . We have recentlyfound that this program continues to unfurl incells maintained in organ culture (Paul andKafatos, in preparation) .
The precision and specificity of the syntheticprogram raises the question of its control . Wehope that the follicular system will be useful inanswering this type of question, so central to anunderstanding of cellular differentiation . Ob-viously, it is still too early to present hypotheseswith any degree of confidence . Nevertheless, wemay speculate that specific protein synthesis inthe follicular cells will ultimately prove to be
6 7 8
THE JOURNAL OF CELL BIOLOGY . VOLUME 55, 1972
controlled either at the level of specific mRNAproduction or at the level of specific mRNArecruitment, from an inactive into an active pool .By analogy with other highly differentiated celltypes (Kafatos, 1972 a), we do not anticipate geneamplification in the follicular cells . As detailedbelow, control does not seem to reside in theefficiency of translation per se . In view of themassive rate of chorion production, and therapidity with which newly synthesized chorion isexported, control at the level of protein degrada-tion appears unlikely. Finally, in view of therapidity of the changes in protein synthesis itwill be interesting to determine whether signifi-cant control is exerted through differential mRNAstability, which apparently plays a crucial rolein a number of other, more slowly developinghighly differentiated cell types (Kafatos, 1972a, b) .
The massive shift in follicular protein synthesisdoes not occur as a result of a correspondingchange in the efficiency of translation . Transla-tional efficiency, i .e . the number of polypeptidechains produced per polysome-bound mRNAmolecule per minute, can be calculated as theratio of the rate of peptide chain elongation di-vided by the average spacing of ribosomes onthe mRNA. The rate of peptide chain elongationis comparable in chorionating and prechorionat-ing follicles, within experimental error ; it is alsovery similar to that of other eukaryotic systemsat 25°C (Kafatos, 1972 a) . The average spacingof ribosomes on the chorion mRNAs can be esti-mated as 30-37 codons per ribosome, based onthe average size of the protein (150 amino acids ;see above) and the average size of the polysomes(four to five ribosomes ; see above). This agreeswith the very uniform spacing determined forother eukaryotic polysomes, both differentiation-specific and nonspecific (e .g ., Staehelin et al .,1964; see Kafatos, 1972 a) ; under our condi-tions, determination of the average size of thelarge polysomes in prechorionating follicles wasnot feasible . The calculated translational effi-ciency for chorion, 2.1-2.6 polypeptide chainsper minute per mRNA, is typical of eukaryoticsystems at 25 °C (Kafatos, 1972 a) .
Whether control resides in the production orthe activation of mRNA, it will be important todetect and quantify the specific mRNAs directly .The characterization of the mRNAs correspond-ing to the three or four major chorion proteins
Dow
nloaded from http://rupress.org/jcb/article-pdf/55/3/653/1070641/653.pdf by guest on 05 D
ecember 2021

should be greatly facilitated by their prepon-
derance in the cells, their expected low molecularweight (which should cause them to separateeasily from ribosomal RNA upon acrylamidegel electrophoresis), their occurrence in polysomesof a defined size class, and the relative scarcity ofribonuclease in the follicular tissue. RNA speciesof the expected properties have recently beenobserved (R . Gelinas, unpublished observations) .
Hopefully, our system for cell-free protein syn-thesis can be made initiation dependent andrefined to the point of permitting assay of specific
chorion mRNA, in conjunction with doublelabeling and SDS-acrylamide electrophoresis of
the cell-free product (Fig . 17) . Our long-term aim
is to characterize a number of the chorion mRNA
species and to relate their appearance and me-tabolism to the changing rate of synthesis ofthe corresponding protein .
We thank P . B . Moore and M. J. Randell for theirinvaluable technical and secretarial contributions,and M. V . Williams for the photograph of the ovariole(Fig . 1 a) .
This research was supported in part by a grant fromThe Rockefeller Foundation and by National Insti-tutes of Health Grant 5-RO1-HD-04701 to F . C .Kafatos, American Cancer Society Fellowship PF593to M . R . Goldsmith, and a Jane Coffin Childs Founda-tion for Medical Research grant to J . R . . Hunsley. M .Paul iE a Rockefeller Foundation Fellow, M . R. Gold-smith an American Cancer Society Fellow, and J . R .Hunsley a Fellow of the Jane Coffin Childs MemorialFoundation for Medical Research .
Received for publication 8 May 1972, and in revised form5 July 1972.
REFERENCES
ANDERSON, L. M., and W. H. TELFER . 1969 . TissueCell . 1 :633 .
ANDERSON, L. M., and W . H. TEFLER . 1970 a. J.Embryol. Exp . Morphol . 23 :35 .
ANDERSON, L. M., and W . H. TEFLER . 1970 b . J. CellPhysiol. 76 :37.
BERGER, E., and F. C. KAFATOS . 1971 . Dev. Biol . 25 :377 .
BOSHES, R . A. 1970. J. Cell Biol . 46 :477 .DAWSON, R. M. C ., D. C. ELLIOT, W . H. ELLIOT, andK. M. JONES, editors. 1969 . Data for BiochemicalResearch . Oxford University Press, New York . 2ndedition. 186 .
FAN, H ., and S. PENMAN . 1970 . J. Mol . Biol . 50 :655 .FLECK, A ., and H . N. MUNRO. 1962. Biochim . Biophys.
Acta. 55 :571 .
GOROVSKY, M. A ., K . CARLSON, and J . L . ROSENBAUM .
1970 . Anal. Biochem . 35:359.GRACE, T. D . C . 1962 . Nature (Loud.) . 195:788.HUNT, T., T. HUNTER, and A. MUNRO. 1968. J. Mol .
Biol. 36 :31 .KAEMPFER, R. O. 1970. Nature (Loud.) . 228:534 .KAEMPFER, R . O., M. MESELSON, and H . J . RASKAS .
1968 . J . Mol . Biol . 31 :277 .KAFATOS, F. C. 1972 a . Curr. Top . Dev . Biol. 7 :125.KAFATOS, F. C. 1972 b. Karolinska Symp. Res. Methods
Reprod . Enocrinol . 319 .KAFATOS, F . C., and V. KIORTSIS . 1971 . J. Cell Biol .
48 :426.KAWASAKI, H., H. SATO, and M. SUZUKI . 1971 a .
Insect Biochem . 1 :130.KAWASAKI, H ., H. SATO, and M. SUZUKI. 1971 b. Bio-
chem . J. 125 :495 .KAWASAKI, H ., H. SATO, M. SUZUKI, and N. OMIMA .
1969 . J . Insect Physiol. 15 :25 .KING, R. C ., and S . K. AGGARWAL. 1965 . Growth . 29 :
17 .LEHNINGER, A . L. 1970 . Biochemistry . Worth Pub-
lishers, Inc., New York. 93 .MANS, R . J ., and G . D. NoVELLI. 1961 . Arch . Biochem .
Biophys. 94 :48.McFARLANE, J. E. 1962 . Can . J. Zool . 40 :13 .NOZAKI, Y., and C. TANFORD . 1967 . Methods Enzymol .
11 :715.PAUL, M ., F . C. KAFATOS, and J . C. REGIER . 1972 .J. Supramol. Struct . 1 :60 .
PETERMAN, M. L., and A . PAVLOVEC. 1963 . J. Biol .Chem. 238 :318 .
POLLACK, S. B., and W . H. TELFER . 1969 . J. Exp .Zool . 170 :1 .
PRINGLE, J. R. 1970 . Biochem . Biophys. Res. Commun .39 :46.
RICHARDSON, K. C ., L. JARETT, and E. H. FINKS .1960 . Stain Technol . 35 :313 .
ROTH, J . S. 1956. Biochim . Biophys. Acta. 21 :34 .RUTTER, W. J. 1967 . In Methods in Developmental
Biology . F. H. Wilt and N. K. Wessells, editors ."Thomas Crowell Company, New York . 671 .
RUTTER, W . J ., J . D. KEMP, W. S. BRADSHAW, W. R .CLARK, R . A. RONZIo, and T. G. SANDERS. 1968 .J. Cell Physiol. 72 : (Suppl . 1) :I .
SJOSTRAND, F. S . 1967 . Electron Microscopy of Cellsand Tissues. Academic Press Inc ., New York . 181 .
SMITH, D. S., W. H. TELFER, and A. C . NEVILLE .1971 . Tissue Cell . 3 :395 .
STAEHELIN, T ., F. O. WETTSTEIN, H. OURA, and H .NOLL. 1964 . Nature (Lond.) . 201 :264 .SWANK, R. T., and K. D. MUNKRES . 1971 . Anal . Bio-
chem . 39 :462 .TELFER, W. H. 1965 . Annu . Rev. Entomol. 10 :161 .TELFER, W. H., and L. M. ANDERSON . 1968. Dev .
Biol. 17 :512 .TELFER, W. H., and L . D. RUTBERG. 1960 . Biol. Bull .
(Woods Hole) . 118:352.
M. PAUL ET AL . Specific Protein Synthesis in Cellular Differentiation
679
Dow
nloaded from http://rupress.org/jcb/article-pdf/55/3/653/1070641/653.pdf by guest on 05 D
ecember 2021
TELFER, W. H ., and D . S. SMITH. 1970. Symp. R .Entomol. Soc . Lond. 5 :117 .
TICHOMIROFF, A. 1885 . Hoppe-Seyler's Z. Physiol. Chem .9 :518.
WARBURG, O., and W. CHRISTIAN . 1941 . Biochem . Z.310:384.
WARNER, J. R ., and M. G. PENE . 1966. Biochim. Bio-phys. Acta . 129 :359 .
680 THE JOURNAL OF CELL BIOLOGY . VOLUME 55, 1972
WEBER, K., andM. OSBORN . 1969 . J. Biol. Chem . 244 :4406 .
WEBSTER, D. H. 1910. Zool . Jahrb . Abt . Syst. OekolGeogr . Tiere . 28 :531 .
WEEVERS, R. DEG. 1966 . J. Exp . Biol. 44 :163 .YUND, M. A., W. F. YUND, and F. C. KAFATOS. 1971 .
Biochem . Biophys. Res . Commun . 43:717 .ZYLBER, E. A ., and S. PENMAN. 1970. Biochim . Bio-phys . Acta . 204 :221 .
Dow
nloaded from http://rupress.org/jcb/article-pdf/55/3/653/1070641/653.pdf by guest on 05 D
ecember 2021