specificity of an analytical hplc metformin
TRANSCRIPT

Revue Roumaine de Chimie, 2007, 52(6), 603–609
SPECIFICITY OF AN ANALYTICAL HPLC ASSAY METHOD OF METFORMIN HYDROCHLORIDE
Florentin TACHEa* and Monica ALBUb
a University of Bucharest, Faculty of Chemistry, Department of Analytical Chemistry, no. 90 Sos. Panduri, Sect. 5, 050663 Bucharest, Roumania
b Analytical Control Laboratory, LaborMed Pharma S.A., no 333 Sos. Giulesti, Bucharest 6, Roumania
Received January 17, 2007
This paper is proposing an algorithm for demonstrating the specificity of the analytical method for an analyte of interest against its degradation product by applying physical (thermal degradation and photolysis) and chemical (photolytic-hydrolysis, acidic- and alkaline- hydrolysis and acidic-, neutral- and alkaline-oxidation) stress conditions. The authors define specific conditions for testing capacity of the analytical method to distinguish between the analyte and its by-products resulting in different environmental conditions. As an effective example, it is used the case of Metformin hydrochloride HPLC assay method. It is shown that by photolysis with white light or UV radiation the Metformin recovery is 99.98%. By thermal degradation it can be observed a moderate difference in between mild and high temperature application (99.98% in the first case and 86.00% in the second case, respectively). Photolytic-hydrolysis induces a slightly difference depending on the wavelength (recovery of 99.98% for white light and 99.90% for UV radiation, respectively). In turn, pH dependent hydrolysis is inducing large differences (99.93% recovery in acidic range and 89.52% in the alkaline range, respectively). Oxidation of Metformin is also conducting to significant differences in accordance with the pH (99.90% recovery in the acidic range, 87.98% in the neutral range and 71.09% in the alkaline range respectively).
INTRODUCTION*
The goal of an analytical HPLC assay is to create a method that is suitable for its intended purpose, so the results obtained from the assay validation process demonstrate if the method is suitable or not.1
In our days a great deal of importance is paid to the bases of the analytical validation for developing harmonized approach.2-4 In order to address the performance of the analytical procedure adequately, the analyst is responsible to identify the relevant parameters, to design the experimental validation studies accordingly and to define appropriate acceptance criteria.5, 6
Between the parameters demonstrating the validity of the proposed assay, its selectivity, defined as “the ability of differentiating and quantifying the analyte in the presence of other components from its matrix” is considered in the prime instance of analyzing the proposed method. The above-mentioned definition of selectivity * Corresponding author: [email protected]
relates this parameter to specificity, which, in turn, is defined as “the ability to assess unequivocally the analyte in the presence of components which might be expected to be present.” The terms selectivity and specificity are often used interchangeably. The discussion of these terms was made by Vessman.7 He pointed out the difference between the specificity as defined by ICH and IUPAC/WELAC. (ICH - International Conference of Harmonization of Technical Requirements for Registration of Pharmaceuticals for Human Use, IUPAC - International Union of Pure and Applied Chemistry, WELAC - Western European Laboratory Accreditation Conference). Even inconsistent with ICH, the term specific generally refers to a method responding to a single analyte only, while the term selective refers to a method which provides responses for a number of chemical entities that may or may not be distinguished from each other. If the response is distinguished from all other responses, the method is said to be selective. Since there are very few
604 Florentin Tache and Monica Albu
methods responding to only one analyte, the term selectivity is usually more appropriate. The USP monograph8 defines specificity of an analytical method as its ability to asses unequivocally an analyte in the presence of components that may be expected to be present, such as impurities, degradation products and matrix components.
It is difficult in chromatography to assume the peaks within a sample chromatogram are pure or consist of more than one compound. UV-Visible diode-array detectors and mass-spectrometers acquire spectra on-line throughout the entire chromatogram. The spectra acquired during the elution of a peak are normalized and overlaid for graphical presentation. If the normalized spectra are different, the peak consists of at least two compounds.
The principles of diode-array detection in HPLC and their application and limitations to peak purity are described in the literature.9 The level of impurities that can be detected depends on the spectral difference, on the detector’s performance and on the software algorithm. Under ideal conditions, peak impurities of 0.05 to 0.1% can be detected.10
From the point of view of pharmaceutical products, the validity period is limited by susceptibility of the drug substance to preserve its structure over a period of time in the preserved form under different environmental conditions. Apart from the loss of its drug potency, the stability problems, such as changes in the dissolution rate, (des)coloration, generation of toxic degradation compounds of the final pharmaceutical formulation are also very common. To ensure the efficacy and safety of pharmaceutical products with drugs susceptible to chemical degradation, a reliable and precise method is needed. Volatile degradation products and degradation products without chromophores are possible to arise and therefore also monitoring of the main compound is recommended followed by the HPLC-DAD assay.
In the present paper the stability-indicating capability of the assay was proved by conducting forced physical and chemical degradation conditions on a commercial drug product for the stability investigation of the active ingredient. The drug was subjected to stress conditions of hydrolysis, oxidation, photolysis and thermal decomposition according to different ICH recommended stress conditions followed by the HPLC-DAD assay.
EXPERIMENTAL PART
Reagents and column
Acetonitrile gradient grade for liquid chromatography LiChrosolv®, octane-1-sulfonic acid sodium salt for ion pair chromatography LiChropur®, ortho-phosphoric acid 85% (d = 1.71 g/cm3), hydrochloric acid fuming 37% (d = 1.19 g/cm3), perchloric acid 70-72% (d = 1.67 g/cm3), hydrogen peroxide 30% (Perhydrol®, d = 1.11 g/cm3) GR for analysis and sodium hydroxide pellets pure were purchased from Merck. Water used for sample preparation and LC separation was MilliQ grade (resistivity at least 18.2 MΩ, TOC maximum 30 ppb).
Metformin hydrochloride CRS [CAS No. 1115-70-4], Metformin Impurity A CRS [1-Cyanoguanidine, CAS No. 461-58-5], Metformin Impurity B CRS [(4,6-Diamino-1,3,5-triazine-2-yl)-guanidine], Metformin Impurity C CRS [N,N-Dimethyl-1,3,5-triazine-2,4,6-triamine, CAS No. 1985-46-2], Metformin Impurity D CRS [1,3,5-Triazine-2,4,6-triamine, CAS No. 108-78-1] and Metformin Impurity E CRS [1-Methylbiguanide hydrochloride, CAS No. 1674-62-0] were purchased from Mikromol GmbH - Germany.
Inertsil 5 ODS-2 (double end-capped octadecyl silica), 250 mm length, 4.6 mm i.d. and 5 µm particle size (Varian Chrompack, Cat.no. CP 28408, batch 516404) was used as analytical column. Column validation executed before starting the first experimental session revealed a reduced plate height
( h ) of 2.3 µm. Construction of the Van Deemter curve was done for fluoranthene (Test mixture no. 201 Varian Chrompack), having uracil as dead time indicator.
Mobile phase
In order to ensure a high retention of all analytes of interest an ion-pairing LC mechanism was applied.11
The mobile phase consists in a mixture of 10 mM aqueous octane-1-sulfonic acid sodium salt solution at pH 3.0 and acetonitrile gradient grade in a proportion of 80/20 (v/v), with an isocratic elution, at a flow rate of 1.2 mL/min. Injected volume was 5 µL.
The mobile phase and the column were thermostated at 30oC using the Peltier based column thermostate G1316A from Agilent.
Instrumentation
Experiments were carried out on an Agilent 1100 Liquid Chromatograph containing degasser, quaternary pump, autosampler (with large volume injection option), column thermostat and diode array detector (DAD). The system is twice a year operationally qualified using its software built-in procedures.
UV absorption at 218 ± 2 nm allows simultaneous detection of Metformin and its related impurities and subsequently was used during experiments.12 As reference wavelength, 360 ± 10 nm was used. A complete chromatographic run is achieved within 30 minutes.
The certification of the specificity of the chromatographic method was done by analyzing the chromatographic purity of the Metformin peak in the chromatogram of each resulting stressed solution, using a fixed threshold: of 990 and calculating purity level with apex spectrum.
Volumetric glassware (volumetric flasks, pipettes and cylinders) used for sample preparation was class A, in-house gravimetrically calibrated.
Specificity of an analytical HPLC assay method 605
RESULTS AND DISCUSSION
The study of specificity of the analytical method involved the following stress conditions13-
19 applied to Metformin hydrochloride in solid form or as solution:
a. Photolytic stress conditions: i. UV radiation (λ = 254 nm), provided by a 6 W
mercury lamp, on a thin layer of solid substance, for 24 hours at room temperature;
ii. White light, provided by a 100 W by a halogen lamp, on a thin layer of solid substance, for 24 hours at room temperature;
b. Thermal stress conditions: i. Mild temperature (60 °C), in a vacuum oven,
on a layer of solid substance, for 24 hours; ii. High temperature (220 °C), in a muffle furnace,
on a layer of solid substance, for 1-2 minutes; c. Photolytic-hydrolytic stress conditions:
i. UV radiation (λ = 254 nm), provided by a 6 W mercury lamp, on a Metformin solution in mobile phase placed in a quartz cuvette, for 24 hours at room temperature;
ii. White light, provided by a 100 W by a halogen lamp, on a Metformin solution in mobile phase placed in a quartz cuvette, for 24 hours at room temperature;
d. pH dependent hydrolytic stress conditions: i. Strong acidic, with 1.0 mL of hydrochloric
acid 37%/100 mg Metformin hydrochloride (corresponding to a final concentration of 0.025 M), on a Metformin solution, for 24 hours at room temperature;
ii. Strong alkaline, with 1.0 mL of 2 M sodium hydroxide solution/100 mg Metformin hydrochloride (corresponding to a final concentration of 0.005 M), on a Metformin solution, for 24 hours at room temperature;
e. pH dependent oxidative stress conditions: i. Oxidative, with 1.0 mL of hydrogen peroxide
30%/100 mg Metformin hydrochloride (corresponding to a final concentration of 0.015 M), on a Metformin solution, for 24 hours at room temperature;
ii. Oxidative-acidic, with 1.0 mL of perchloric acid/100 mg Metformin hydrochloride (correspond-ing to a final concentration of 0.0175 M), on a Metformin solution, for 24 hours at room temperature;
iii. Oxidative-alkaline, with 1.0 mL of hydrogen peroxide 30% and 1.0 mL of 2 M sodium hydroxide solution/100 mg Metformin hydrochloride
(corresponding to final concentrations of 0.025 M and 0.05 M, respectively), on a Metformin solution, for 24 hours at room temperature.
In each case, the final stressed solution prepared for the chromatographic separation has a Metformin hydrochloride concentration of about 5000 µg/mL.
All the chromatographic separations were monitored at 218 nm and 232 nm.
For the certification of the quality of the chromatographic system each experimental session was started with an injection of mobile phase and then a system suitability solution containing 5 µg/mL Metformin hydrochloride (capacity factor of 7.86), 1 µg/mL Metformin Impurity A (capacity factor of 0.44), 5 µg/mL Metformin Impurity B (capacity factor of 5.75), 5 µg/mL Metformin Impurity C (capacity factor of 6.54), 5 µg/mL Metformin Impurity D (capacity factor of 2.98) and 5 µg/mL Metformin Impurity E (capacity factor of 10.32) in mobile phase. The acceptance condition is a chromatographic resolution between Metformin and Metformin Impurity D of at least 10.
The double check of the lack of interferences of the resulting by-products with the elution of the Metformin peak was done by calculating the F factor, meaning the ratio of the UV molar absorption coefficients of Metformin at the 218 ± 2 nm and 232 ± 2 nm, respectively, using the following relationship:
F = 218
232
M
M
AA
where: 232MA is the Metformin peak area in the chroma-tograms resulting by the injection of the stressed solutions, monitored at 232 ± 2 nm;
218MA is the Metformin peak area in the chroma-tograms resulting by the injection of the stressed solutions, monitored at 218 ± 2 nm.
The calculated F factor should be included in the range 1.20 – 1.40 (1.30 ± 0.1). The obtained results are presented in Table 1.
As illustrated in Table 2 all F factors characterizing the related impurities of Metformin are placed outside the normal variation interval corresponding to the active drug. Such consideration gives consistency with respect to the specificity of the F factor for the given application.
606 Florentin Tache and Monica Albu
Table 1
Parameters for the calculation of the F factor along with the purity factor for the Metformin peak in the chromatograms of the stressed solutions
# Stress type Stressing agent Metformin peak area (232 nm)
Metformin peak area (218 nm)
F232/218 Purity factor
White light 74259.4 59180.6 1.25 996.8 1 Photolysis
UV radiation 75419.7 60098.8 1.25 996.3
White light 77232.8 61299.6 1.26 997.7 2 Photolytic-hydrolysis
UV radiation 78732.1 62606.0 1.26 997.5
60 °C thermal stress 75861.4 60452.2 1.25 996.1 3 Thermal degradation
220 °C thermal stress 68415.3 54308.0 1.26 997.4
4 Acid hydrolysis HCl conc. 79967.4 62283.3 1.28 998.8
5 Alkaline hydrolysis 2 M NaOH 45724.4 35323.9 1.29 997.6
6 Oxidation 30% H2O2 73461.0 58540.0 1.25 996.3
7 Acid oxidation 70% HClO4 71918.1 58335.3 1.23 992.5
8 Alkaline oxidation 2 M NaOH + 30% H2O2 15389.5 11850.8 1.30 998.7
Table 2
The calculated F232/218 for each known impurity is the system suitability solution
Known impurity Peak area (218 nm)
Peak area (232 nm) F232/218
Impurity A 183.2 146.6 0.80
Impurity B 41.4 10 0.24
Impurity C 246.8 43.7 0.18
Impurity D 192.2 84 0.44
Impurity E 50.9 80.5 1.58
The effects of different stress conditions applied
to Metformin hydrochloride as a solid or in a dissolved form, in terms of number of secondary peaks due to the formed degradation products, on one hand and of the degree of recovery of Metformin observed by integration of the resulting chromatograms, on the other hand, are summarized in Table 3.
From the analysis of the resulting chromatograms of the stressed solution one can conclude that:
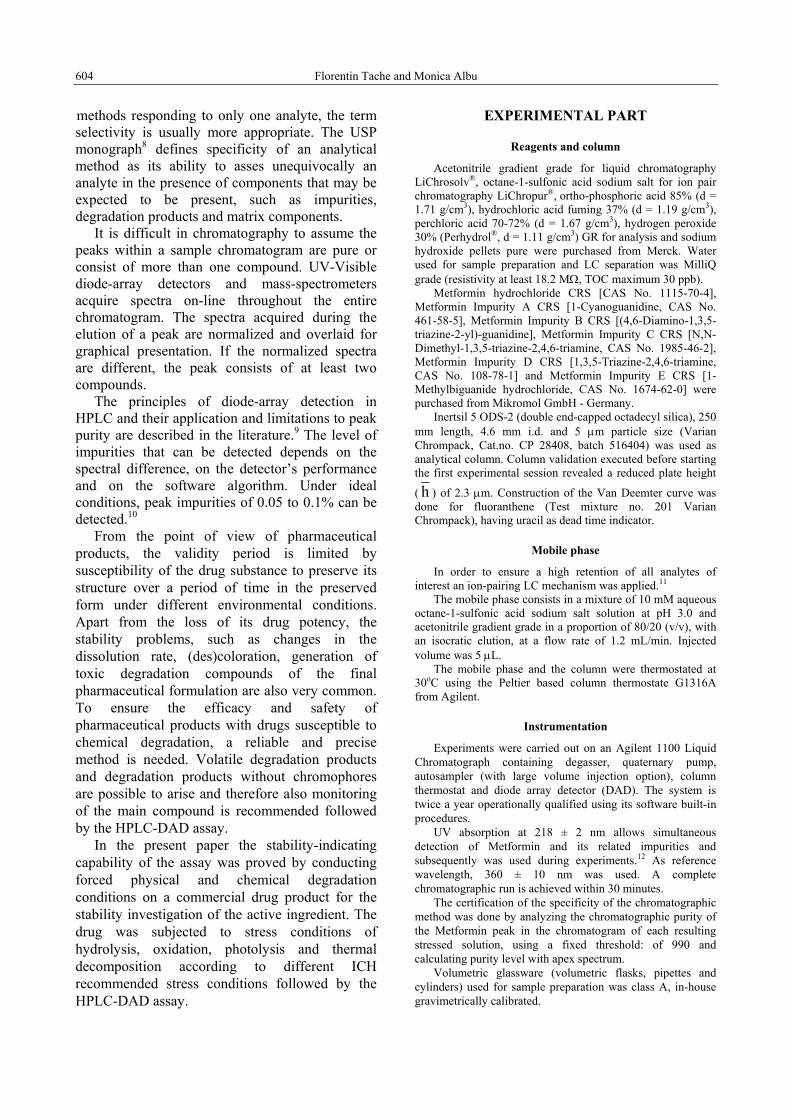
a. The photolytic and photolytic-hydrolytic exposure of the Metformin hydrochloride (see Fig. 1) has no significant impact, the recovery of Metformin being 99.9% in both cases. In addition, it can be observed that the exposure of the Metformin hydrochloride solution to UV radiation has as an distinct effect the
formation of the Metformin Impurity A at a higher level than it is acceptable (0.044%) and also the appearance of the Metformin Impurity D in a very small percentage;
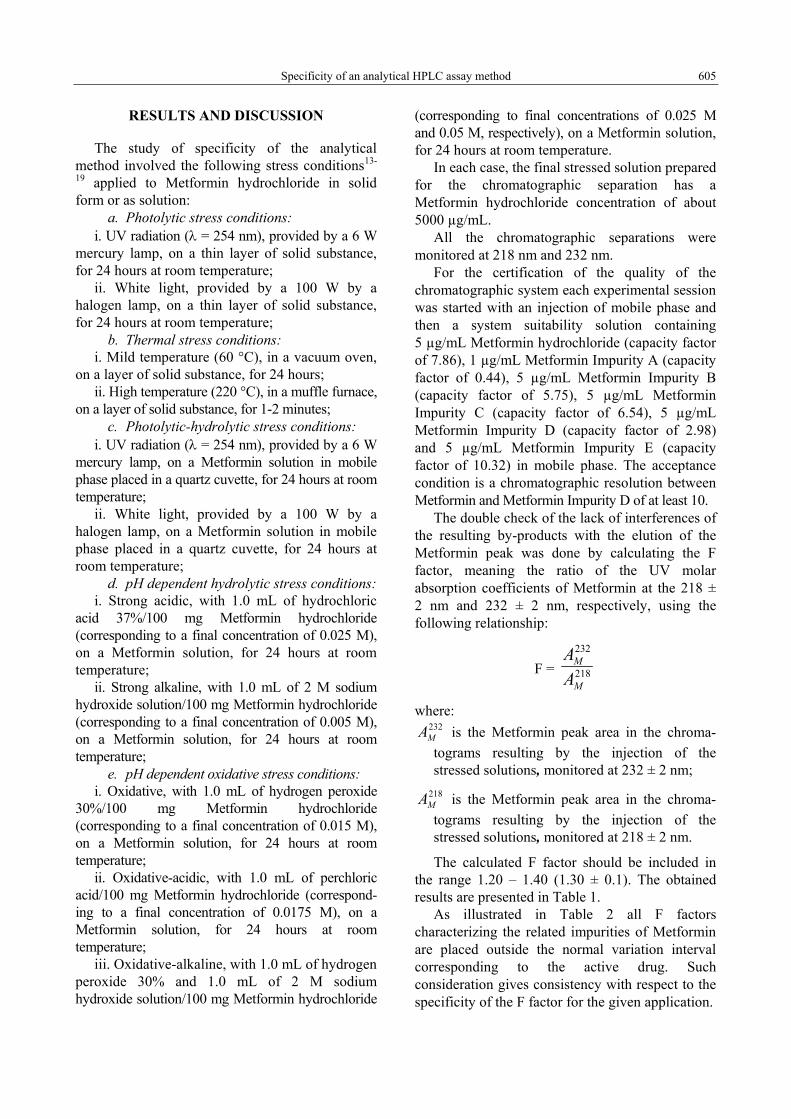
b. Mild thermal degradation (60 ºC) (see Fig. 2) is not affecting the stability of the Metformin hydrochloride (recovery of 99.98%);
c. Strong thermal degradation slightly below the melting point of the substance (220 ºC) (see Fig. 2), even on the short term, is consistently affecting the stability of the Metformin hydrochloride with the formation of a significant percentage of Metformin Impurity A (7.18%) along with the appearance of the Metformin Impurities B, C and D, respectively. One can observe the appearance at a significant level of five unknown impurities (corresponding capacity factors of 0.87, 3.47, 5.83 min., 8.51 and 12.38, respectively);

Specificity of an analytical HPLC assay method 607
Table 3
The cumulative presentation of the effects of the stress conditions applied to Metformin hydrochloride
# Stress type Stressing agent Temperature/ Exposure time
No. quantified secondary peaks
% recovery Metformin
White light 25 °C / 24 h 6 99,98 1 Photolysis
UV radiation 25 °C / 24 h 7 99,98
White light 25 °C / 24 h 5 99,98 2 Photolytic-hydrolysis
UV radiation 25 °C / 24 h 8 99,90
Mild temperature 60 °C / 24 h 7 99,98 3 Thermal degradation
High temperature 220 °C / 1-2 min. 20 86,00
4 Acid hydrolysis HCl conc. 25 °C / 24 h 6 99,93
5 Alkaline hydrolysis 2 M NaOH 25 °C / 24 h 17 89,52
6 Oxidation 30% H2O2 25 °C / 24 h 13 87,98
7 Acid oxidation 70% HClO4 25 °C / 24 h 7 99,90
8 Alkaline oxidation 2 M NaOH + 30% H2O2 25 °C / 24 h 24 71,09
min0 5 10 15 20 25
mAU
0
5
10
15
20
25
30
35
40
*DAD1 B, Sig=218,4 Ref=360,20
System suitability solution
UV light stress solid substanceWhite light stress solution
White light stress solid substance
UV light stress solution
A
D
B
C
ME
Fig. 1 – Chromatograms of photolytic and photolytic-hydrolytic stress conditions applied on Metformin hydrochloride. (A – Metformin Impurity A; B – Metformin Impurity B; C – Metformin Impurity C; D – Metformin Impurity D; E – Metformin Impurity E; M – Metformin). (Experimental conditions are given in the text)
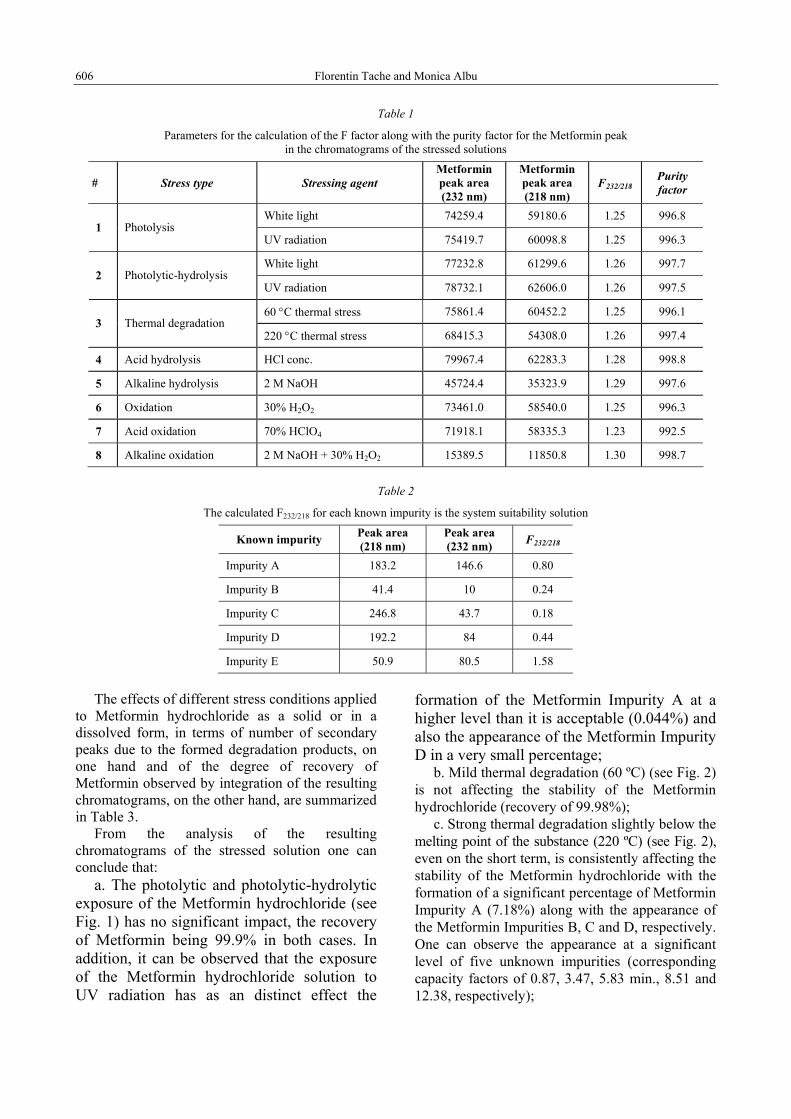
d. Acidic hydrolysis (see Fig. 3) of the
Metformin is not affecting its stability (recovery of 99.9%);
e. Alkaline hydrolysis (see Fig. 3) has a moderate impact on the stability of the substance (recovery of 89.3%) with a special remark on the level of Metformin Impurity A (0.46%, meaning a 25-fold the accepted level) along with the appearance of the Metformin Impurities B, C and
D, respectively. One can observe also, the appearance of four unknown impurities (corresponding capacity factors of 0.44, 0.57, 3.51 and 11.67, respectively);
f. Neutral-oxidation (see Fig. 4) is mildly affecting the stability of the analyte (recovery of 87.98%), Metformin Impurity A being the major developed product (11.42%) along with the appearance of the Metformin Impurities. C, D, and E, respectively;

608 Florentin Tache and Monica Albu
g. Acidic-oxidation (see Fig. 4) is insignificantly affecting the stability of the analyte (recovery of 99.9%), with the development of the Metformin Impurities A and D, respectively;
h. Alkaline-oxidation (see Fig. 4) is drastically affecting the stability of Metformin hydrochloride with the appearance of an unknown impurity
(capacity factor of 3.37) at a very consistent level (8.62%) along with the development of the Metformin Impurities A, D and E, respectively. One can observe also, the appearance of five unknown impurities (corresponding capacity factors of 0.64, 0.71, 1.45 and 7.87, respectively).
min0 5 10 15 20 25
mAU
0
20
40
60
80
100
*DAD1 B, Sig=218,4 Ref=360,20
A
M
D
EB
C
60 °C stress solid substance
220 °C stress solid substance
System suitability solution
uk1
uk2 uk
3
uk4 uk
5
Fig. 2 – Chromatograms of thermal stress conditions applied on solid Metformin hydrochloride. (A – Metformin Impurity A; B – Metformin Impurity B; C – Metformin Impurity C; D – Metformin Impurity D; E – Metformin Impurity E; M – Metformin, uk1, uk2, uk3, uk4, uk5 – unknown impurities). (Experimental conditions are given in the text)
A
M
D
EB
C
Alkaline stress solution
Acid stress solution System suitability solution
uk1
uk2
uk3
uk4
min 0 5 10 15 20 25
mAU
0
10
20
30
40
50
*DAD1 B, Sig=218,4 Ref=360,20
Fig. 3 – Chromatograms of acidic- and alkaline-hydrolytic stress conditions applied on 5000 µg/mL Metformin solutions. (A – Metformin Impurity A; B – Metformin Impurity B; C – Metformin Impurity C; D – Metformin Impurity D; E – Metformin Impurity E; M – Metformin, uk1, uk2, uk3, uk4, uk5 – unknown impurities). (Experimental conditions are given in the text)

Specificity of an analytical HPLC assay method 609
Neutral-Oxidative stress solution
Alkaline-Oxidative stress solution
Acidic-oxidative stress solution
System suitability solution
A
M
B
E
C
D
uk2
uk3
uk1
uk4
uk5
min 0 5 10 15 20 25
mAU
0
20
40
60
80
100
120
*DAD1 B, Sig=218,4 Ref=360,20
Fig. 4 – Chromatograms of acidic-, neutral- and alkaline-oxidative stress conditions applied on 5000 µg/mL Metformin solutions. (A – Metformin Impurity A; B – Metformin Impurity B; C – Metformin Impurity C; D – Metformin Impurity D; E – Metformin Impurity E; M – Metformin, uk1, uk2, uk3, uk4– unknown impurities). (Experimental conditions are given in the text).
CONCLUSIONS
The analyzed forced degradation factors cover a very large spectrum of stress conditions at their upper limit possibly affecting the stability of an active ingredient in a drug formulation.
On the other hand, it can be concluded that the proposed method is demonstrated to be specific for Metformin hydrochloride, showing that the possible development of the related compounds by different pharmaceutical manufacture processing and storage conditions of the resulting product is not interfering in the assaying of the analyte of interest. The presented analytical method is discriminating the resulting by-products in the stress conditions from the Metformin peak, as can be double demonstrated by the placement of the F factor in the range of 1.20 – 1.40 (1.30 ± 0.1) and by analyzing the purity of the Metformin peak.
REFERENCES
1. P. Rampazzo, Il Farmaco., 1990, 45, 807. 2. P. Hubert, J.J. Nguyen-Huu, B. Boulanger, E. Chapuzet,
P. Chiap, N. Cohen, P.A. Compagnon, W. Dewe, M. Feinberg, M. Lallier, M. Laurentie, N. Mercier, G. Muzard, C. Nivet and L. Valat, J. Pharm. Biomed. Anal., 2004, 36, 579.
3. R.A. Baffi, Dev. Biol. Stand., 1997, 91, 105. 4. J. Ermer, J. Pharm. Biomed. Anal., 2001, 24, 755. 5. J. Ermer and H.J. Ploss, J. Pharm. Biomed. Anal., 2005,
37, 859. 6. R. Aruga, Ann. Chim., 2004, 94, 101. 7. J. Vessman, J. Pharm. Biomed. Anal., 1996, 14, 867. 8. “United States Pharmacopeia XXIII, National Formulary”,
28, Rockville, MD, The United States Pharmacopeial Convention, Inc, 2005, 2748.
9. L. Huber and S. George, eds., “Diode-array detection in HPLC”, New York, Marcel Dekker, 1993.
10. L. Huber, “Validation and qualification in analytical laboratories”, Interpharm Press, 2002.
11. V. David, C. Barcutean, I. Sora and A. Medvedovici, Rev. Roum. Chim., 2005, 50, 269.
12. V. David, A. Medvedovici and F. Albu, J. Liq. Chromatogr. Rel. Technol., 2005, 28, 81.
13. A. Mohammadi, I. Haririan, N. Rezanour, L. Ghiasi and R.B. Walker, J. Chromatogr. A., 2006, 1116, 153.
14. P. Kovarikova, J. Klimes, J. Dohnal and L. Tisovska, J. Pharm. Biomed. Anal., 2004, 36, 205.
15. J. Burana-Osot, S. Ungboriboonpisal and L. Sriphong, J. Pharm. Biomed. Anal., 2006, 40, 1068 .
16. B. M. Rao, M. K. Srinivasu, G. Sridhar, P. R. Kumar, K. B. Chandrasekhar and A. Islam, J. Pharm. Biomed. Anal., 2005, 39, 503.
17. M. Bakshi, B. Singh, A. Singh and S. Singh, J. Pharm. Biomed. Anal., 2001, 26, 891.
18. M. Bakshi and S. Singh, J. Pharm. Biomed. Anal., 2004, 34, 11.
19. A. Dunge, N. Sharda, B. Singh and S. Singh, J. Pharm. Biomed. Anal., 2005, 37, 1109.