specifying exhaust systems that avoid fume reentry · pdf filespecifying exhaust systems that...
TRANSCRIPT

Specifying Exhaust Systems That Avoid Fume Reentry and Adverse Health Effects
Ronald L. Petersen, Ph.D. Brad C. Cochran John W. LeCompteMember ASHRAE Member ASHRAE Student Member ASHRAE
HI-02-15-3
ABSTRACT
This paper provides general information regarding theneed for good exhaust system design and discusses issues thatshould be considered when designing exhaust stacks andintakes, such as applicable standards, analytical methods,plume rise, architectural screens, and entrained air exhauststacks. Whether conventional or entrained air exhaust systemsare used, the paper discusses why exhaust specifications (i.e.,stack height, volume flow, location, and exhaust velocity)should be based on the appropriate criterion, that is, ensuringacceptable concentrations at air intakes and other appropriatelocations. Selecting an exhaust system based on simplegeometric methods or an effective stack height specificationalone is not sufficient to ensure an adequate exhaust systemdesign. A quantitative approach is discussed to specify exhaustand intake designs that ensure acceptable air quality insideand around buildings. The approach includes wind-tunneldispersion modeling and the establishment of concentrationdesign goals based on emission rates, health limits, and odorthresholds of emitted chemicals. The approach was utilized fora simple building geometry to illustrate that mathematicalmethods can give excessively tall stack heights for an unob-structed roof and can give stacks that are not tall enough fora roof with obstructions.
INTRODUCTION
The design of exhaust stacks and air intakes needs carefulconsideration due to increasing public concern over air pollu-tion in general and because adverse exposure to air pollutantsin the workplace can affect employee health and productivity.In some cases, releases of toxic pollutants may lead to litiga-
tion. Some of these issues are illustrated by the followingexcerpts from newspaper articles:
• Business Weekly (May 2, 1988): “Local residents werefrightened. New pharmacology laboratories at the Uni-versity of California at San Francisco were investigatingeverything from AIDS to parasitic diseases. Could dis-ease organisms or toxic chemicals from those labsescape and harm citizens?”
• San Francisco Chronicle (September 5, 1996): “A bar-rage of letters and concerns about toxic chemicals hasforced a circuit board manufacturer to drop, at least tem-porarily, plans to move next door to a peninsula highschool.”
• San Francisco Chronicle (May 20, 1997): “An outpa-tient clinic was closed and six of its employees weretreated for nausea after they were exposed to fumesfrom a 16 ounce spill of liquid phenol about noon yes-terday.”
• Chicago Daily Herald (April 17, 1998): “Suspicionsconfirmed. Public health officials say brain tumors atAmoco center more than coincidence. A study of Build-ing 503 at the Amoco Research Center in Napervilleindicates a rash of malignant brain cancers..... EighteenAmoco Research Center employees have developedbrain tumors in the last 28 years.”
Some challenges to specifying a good stack designinclude the existing building environment, aesthetics, buildingdesign issues, chemical utilization, source types, and localmeteorology and topography. Figure 1 shows a depiction ofthe airflow around a simple rectangular building. The figureshows the highly turbulent recirculating region on the building
THIS PREPRINT IS FOR DISCUSSION PURPOSES ONLY, FOR INCLUSION IN ASHRAE TRANSACTIONS 2002, V. 108, Pt. 2. Not to be reprinted in whole or inpart without written permission of the American Society of Heating, Refrigerating and Air-Conditioning Engineers, Inc., 1791 Tullie Circle, NE, Atlanta, GA 30329.Opinions, findings, conclusions, or recommendations expressed in this paper are those of the author(s) and do not necessarily reflect the views of ASHRAE. Writtenquestions and comments regarding this paper should be received at ASHRAE no later than July 5, 2002.
Ronald L. Petersen is vice-president, Brad C. Cochran is senior project engineer, and John W. LeCompte is an engineer for Cermak PeterkaPetersen Inc., Fort Collins, Colo.

roof, upwind of the building and in the building wake. It hasbeen generally thought that stacks are poorly designed if theexhaust is caught in these highly turbulent regions because thepollutant is not able to escape the building cavity and is thusreentrained back into the building through air intakes, opera-ble windows, and building entrances. However, stack designsmay be acceptable even under this situation if the chemicalsbeing emitted from the exhaust are not toxic or odorous and/or if sufficient dilution occurs.
The existing building environment presents a challengewhen building heights vary significantly. If a new laboratorybuilding is being designed that is shorter than surroundingbuildings, it will be difficult to design a stack such that theexhaust will not impact neighboring buildings. The effect of ataller downwind building is illustrated in Figure 2. The figureshows how the plume hits the face of the downwind building.In addition, when the taller building is upwind, as shown inFigure 3, the wake cavity region of the taller building may trapthe exhaust from the shorter building. In this case, the plumeonce again impacts the face of the taller, upwind building.Hence, the frequency of adverse concentrations on the face ofthe taller building face is augmented.
Constraints are typically placed on laboratory stackdesign. The lowest possible stack height is desired for aesthet-ics and economy. The exit momentum (exit velocity andvolume flow rate) is limited by capital and energy costs, noise,and vibration. The laboratory stack design then becomes abalance between these constraints and obtaining adequate airquality at surrounding receptors (air intakes, plazas, operablewindows, etc.). Figure 4 illustrates the problem that can becreated by a poor stack design. If an exhaust stack is not prop-erly designed, fumes from the exhaust may reenter the build-ing, or adjacent buildings, or impact pedestrians atunacceptable concentration levels. To avoid reentry, tallerstacks, higher volume flows, and/or optimum locations on theroof may be necessary.
To determine the optimal exhaust design, predictions ofthe expected concentrations of pollutants in the exhaust streamat air intakes and other sensitive locations are needed tocompare with health limits and odor thresholds. Predictions ofconcentration levels on and around buildings can be accom-
plished with varying degrees of accuracy using three differenttypes of studies: (1) a full-scale field program, (2) a mathe-matical modeling study, or (3) a reduced-scale studyconducted within an atmospheric-boundary-layer windtunnel. A full-scale field program may provide the most accu-rate prediction of concentration levels but can be very expen-sive and time consuming. In addition, it is impossible toevaluate designs before construction is completed.
Numerical models can be divided into two categories—analytical models and computational fluid dynamics (CFD)models. Gaussian-based models fall into the analytical cate-
Figure 1 Airflow around buildings.Figure 2 Plume impact on taller downwind building.
Figure 3 Plume impact on taller upwind building.
Figure 4 Ingestion of exhaust at nearby receptors.
2 HI-02-15-3

gory and are relatively simple models that use generic plumetransport algorithms to calculate downwind concentrations.Typical Gaussian-based models include the U.S. Environmen-tal Protection Agency’s SCREEN 3 (EPA 1995a), ISC (EPA1995b), AERMOD (EPA 1998), and PRIME (Schulman et al.2000) dispersion models and the dilution equations withinchapter 43 of HVAC Applications (ASHRAE 1999). Thesemodels assume a simplified building configuration andprovide concentration estimates based on assumed concentra-tion distributions. They do not consider site-specific geome-tries that may substantially alter the plume behavior.
Computational fluid dynamics (CFD) models attempt toresolve the plume transport by solving the Navier-Stokesequations at finite grid locations. Wind-tunnel modeling, onthe other hand, is much like conducting a field experimentwhere the concentrations are measured in a simulated flow atthe points of interest over a scale model of the buildings underevaluation. The pros and cons of each method are beyond thescope of this paper, and users of either method are advised toreview the current literature to determine the expected accu-racy of the method selected.
This paper describes a quantitative approach to accuratelyevaluate exhaust and intake designs to ensure acceptable airquality inside and around buildings. The approach includeswind-tunnel dispersion modeling and the establishment ofconcentration design goals based on emission rates, healthlimits, and odor thresholds of emitted chemicals. Alsodescribed for background purposes are various exhaust andintake design issues, such as applicable standards, analyticalmethods, plume rise, architectural screens, and entrainedexhaust stacks. Measured quantities are reported in dual units,with the original measured or cited unites listed first.
EXHAUST/INTAKE DESIGN ISSUES
Applicable Standards and Recommendations
Several organizations have published standards or recom-mendations regarding laboratory exhaust stack design. Theseare summarized below.
1. Maintain a minimum stack height of 10 ft (3.0 m) to protectrooftop workers (NFPA 1996).
2. Locate intakes away from sources of outdoor contamina-tion, such as mobile traffic, kitchen exhaust, streets, coolingtowers, emergency generators, and plumbing vents(ASHRAE 1999).
3. Do not locate air intakes within the same architecturalscreen enclosure as contaminated exhaust outlets(ASHRAE 1999).
4. Locate the air intake at the base of a relatively tall stack ortight cluster of stacks, if this location is not adverselyaffected by exhaust from nearby buildings. Intakes shouldnot be located near the base of highly toxic stacks due topotential fan leakage (ASHRAE 1999).
5. Avoid locating intakes near vehicle loading zones. Cano-pies over loading docks do not prevent hot vehicle exhaustfrom rising up to intakes above the canopy (ASHRAE1999).
6. Use high-efficiency particulate air (HEPA) filters or ultra-violet germicidal irradiation (UVGI) systems of similarefficiency in isolation room exhaust streams (CDC 1994).
7. Combine several exhaust streams internally to dilute inter-mittent bursts of contamination from a single source as wellas producing an exhaust with greater plume rise. Additionalair volume may also be added to the exhaust at the fan toachieve the same end (ASHRAE 1999).
8. Group separate stacks together (where separate exhaustsystems are mandated) in a tight cluster to take advantage ofthe increased plume rise from the resulting combined jet(ASHRAE 1999). Note that all the exhausts must operatecontinuously to take full advantage of the combined jet.
9. Avoid rain caps or other devices that limit plume rise onexhaust stacks. Conical rain caps often do not exclude rainbecause rain does not fall straight down. Alternative designoptions are provided in chapter 43 of the ASHRAE Hand-book—HVAC Applications (ASHRAE 1999).
10. Consider the adverse effect of architectural screens. A solidscreen effectively decreases the stack height by 80%, whilea 50% porous screen effectively decreases the stack heightby approximately 40% (Petersen et al. 1999).
Analytical Methods
ASHRAE (1999), chapter 43, discusses exhaust stackdesign and airflow around buildings in some detail. The chap-ter contains two primary types of information regarding stackdesign: (1) a geometric method of determining stack heightand (2) mathematical equations for providing conservativeprediction (i.e., overprediction) of rooftop concentrations. Inthe geometric method for determining stack height, the recom-mended stack height is that for which the bottom edge of theexhaust plume will be above various recirculation and highturbulence zones. Equations are presented for computing theheights and lengths of these zones. The bottom of the plumeis assumed to have a 1:5 downward slope from the releasepoint. The initial rise or downwash of the plume is sometimesincluded. In general, this method is entirely inadequate forexhaust streams that contain toxic or odorous material. Themethod does not provide an estimated concentration at an airintake or other sensitive location. Hence, no information onthe adequacy of the stack to avoid concentrations in excess ofhealth or odor limits is provided.
ASHRAE (1999), chapter 43, also presents analyticalequations for estimating exhaust dilution. These equationstend to be conservative for an isolated building or one that issignificantly taller than the surrounding buildings and for airintakes on the roof level. For side wall, or hidden intakes,ASHRAE (1999) has some adjustment factors that have notbeen fully tested. In fact, ASHRAE TC 4.3 is currently moni-
HI-02-15-3 3
toring a research project (1168-TRP) that will provide infor-mation on the concentration reduction factors for hidden airintakes.
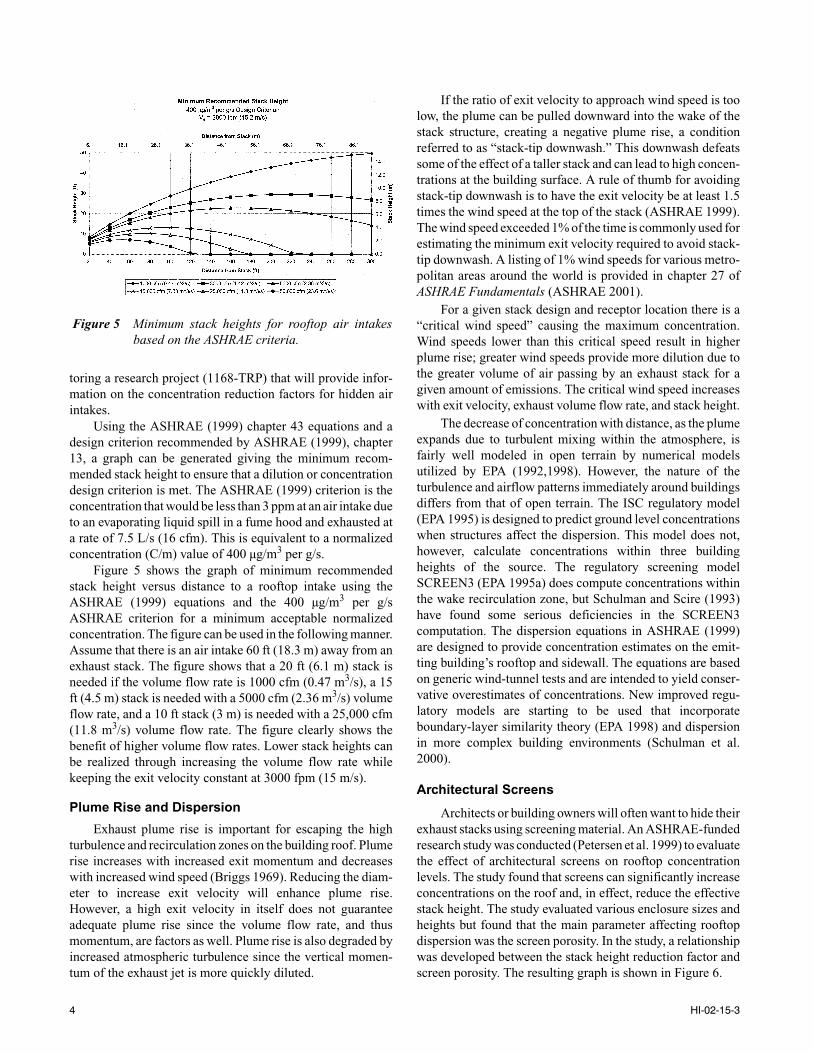
Using the ASHRAE (1999) chapter 43 equations and adesign criterion recommended by ASHRAE (1999), chapter13, a graph can be generated giving the minimum recom-mended stack height to ensure that a dilution or concentrationdesign criterion is met. The ASHRAE (1999) criterion is theconcentration that would be less than 3 ppm at an air intake dueto an evaporating liquid spill in a fume hood and exhausted ata rate of 7.5 L/s (16 cfm). This is equivalent to a normalizedconcentration (C/m) value of 400 µg/m3 per g/s.
Figure 5 shows the graph of minimum recommendedstack height versus distance to a rooftop intake using theASHRAE (1999) equations and the 400 µg/m3 per g/sASHRAE criterion for a minimum acceptable normalizedconcentration. The figure can be used in the following manner.Assume that there is an air intake 60 ft (18.3 m) away from anexhaust stack. The figure shows that a 20 ft (6.1 m) stack isneeded if the volume flow rate is 1000 cfm (0.47 m3/s), a 15ft (4.5 m) stack is needed with a 5000 cfm (2.36 m3/s) volumeflow rate, and a 10 ft stack (3 m) is needed with a 25,000 cfm(11.8 m3/s) volume flow rate. The figure clearly shows thebenefit of higher volume flow rates. Lower stack heights canbe realized through increasing the volume flow rate whilekeeping the exit velocity constant at 3000 fpm (15 m/s).
Plume Rise and Dispersion
Exhaust plume rise is important for escaping the highturbulence and recirculation zones on the building roof. Plumerise increases with increased exit momentum and decreaseswith increased wind speed (Briggs 1969). Reducing the diam-eter to increase exit velocity will enhance plume rise.However, a high exit velocity in itself does not guaranteeadequate plume rise since the volume flow rate, and thusmomentum, are factors as well. Plume rise is also degraded byincreased atmospheric turbulence since the vertical momen-tum of the exhaust jet is more quickly diluted.
If the ratio of exit velocity to approach wind speed is toolow, the plume can be pulled downward into the wake of thestack structure, creating a negative plume rise, a conditionreferred to as “stack-tip downwash.” This downwash defeatssome of the effect of a taller stack and can lead to high concen-trations at the building surface. A rule of thumb for avoidingstack-tip downwash is to have the exit velocity be at least 1.5times the wind speed at the top of the stack (ASHRAE 1999).The wind speed exceeded 1% of the time is commonly used forestimating the minimum exit velocity required to avoid stack-tip downwash. A listing of 1% wind speeds for various metro-politan areas around the world is provided in chapter 27 ofASHRAE Fundamentals (ASHRAE 2001).
For a given stack design and receptor location there is a“critical wind speed” causing the maximum concentration.Wind speeds lower than this critical speed result in higherplume rise; greater wind speeds provide more dilution due tothe greater volume of air passing by an exhaust stack for agiven amount of emissions. The critical wind speed increaseswith exit velocity, exhaust volume flow rate, and stack height.
The decrease of concentration with distance, as the plumeexpands due to turbulent mixing within the atmosphere, isfairly well modeled in open terrain by numerical modelsutilized by EPA (1992,1998). However, the nature of theturbulence and airflow patterns immediately around buildingsdiffers from that of open terrain. The ISC regulatory model(EPA 1995) is designed to predict ground level concentrationswhen structures affect the dispersion. This model does not,however, calculate concentrations within three buildingheights of the source. The regulatory screening modelSCREEN3 (EPA 1995a) does compute concentrations withinthe wake recirculation zone, but Schulman and Scire (1993)have found some serious deficiencies in the SCREEN3computation. The dispersion equations in ASHRAE (1999)are designed to provide concentration estimates on the emit-ting building’s rooftop and sidewall. The equations are basedon generic wind-tunnel tests and are intended to yield conser-vative overestimates of concentrations. New improved regu-latory models are starting to be used that incorporateboundary-layer similarity theory (EPA 1998) and dispersionin more complex building environments (Schulman et al.2000).
Architectural Screens
Architects or building owners will often want to hide theirexhaust stacks using screening material. An ASHRAE-fundedresearch study was conducted (Petersen et al. 1999) to evaluatethe effect of architectural screens on rooftop concentrationlevels. The study found that screens can significantly increaseconcentrations on the roof and, in effect, reduce the effectivestack height. The study evaluated various enclosure sizes andheights but found that the main parameter affecting rooftopdispersion was the screen porosity. In the study, a relationshipwas developed between the stack height reduction factor andscreen porosity. The resulting graph is shown in Figure 6.
Figure 5 Minimum stack heights for rooftop air intakesbased on the ASHRAE criteria.
4 HI-02-15-3
The use of Figure 6 can be illustrated by the followingexample. Assume that a 10 ft (3 m) stack is found to be accept-able using the method described above (i.e., Figure 5). It isthen decided that a 30% porous screen will be installedsurrounding the stack. Figure 6 shows that with a 30% porousscreen, a 0.5 stack height reduction factor should be applied.That means the effective stack height is 5 ft (1.5 m), i.e., the0.5 stack height reduction factor times the 10 ft (3.0 m) phys-ical stack height. Since the initial analysis showed that a 10 ft(3 m) minimum stack height was acceptable, the physicalstack height will have to be 20 ft (6.1 m), i.e., 0.5 times 20 ft(6.1 m) gives the desired effective stack height of 10 ft (3.0 m).
Entrained Air Exhausts
Entrained air exhaust manufacturers often quote an effec-tive stack height for their system, which many designersconsider when picking the appropriate system. The effectivestack height specification is based on a mathematical equation(Briggs 1969) that predicts the height of the centerline of theemitted exhaust stream versus downwind distance. The effec-tive stack height that is presented is in reality the maximumheight of the exhaust plume centerline at some large distance(say, 100 to 200 ft) downwind of the stack and is not an effec-tive stack height. What the manufacturers should supply as aspecification is the “effective stack height improvement” overthe conventional exhaust system. The stated improvementmay not be as great as one might expect, as the following anal-ysis points out.
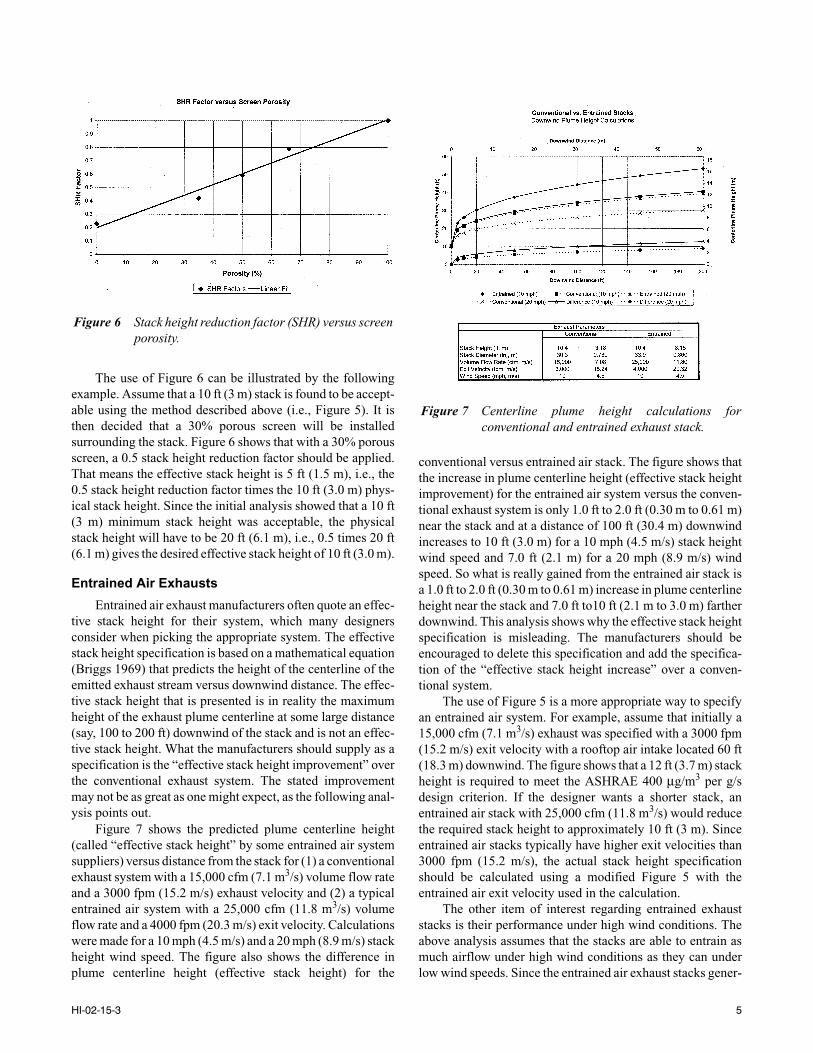
Figure 7 shows the predicted plume centerline height(called “effective stack height” by some entrained air systemsuppliers) versus distance from the stack for (1) a conventionalexhaust system with a 15,000 cfm (7.1 m3/s) volume flow rateand a 3000 fpm (15.2 m/s) exhaust velocity and (2) a typicalentrained air system with a 25,000 cfm (11.8 m3/s) volumeflow rate and a 4000 fpm (20.3 m/s) exit velocity. Calculationswere made for a 10 mph (4.5 m/s) and a 20 mph (8.9 m/s) stackheight wind speed. The figure also shows the difference inplume centerline height (effective stack height) for the
conventional versus entrained air stack. The figure shows thatthe increase in plume centerline height (effective stack heightimprovement) for the entrained air system versus the conven-tional exhaust system is only 1.0 ft to 2.0 ft (0.30 m to 0.61 m)near the stack and at a distance of 100 ft (30.4 m) downwindincreases to 10 ft (3.0 m) for a 10 mph (4.5 m/s) stack heightwind speed and 7.0 ft (2.1 m) for a 20 mph (8.9 m/s) windspeed. So what is really gained from the entrained air stack isa 1.0 ft to 2.0 ft (0.30 m to 0.61 m) increase in plume centerlineheight near the stack and 7.0 ft to10 ft (2.1 m to 3.0 m) fartherdownwind. This analysis shows why the effective stack heightspecification is misleading. The manufacturers should beencouraged to delete this specification and add the specifica-tion of the “effective stack height increase” over a conven-tional system.
The use of Figure 5 is a more appropriate way to specifyan entrained air system. For example, assume that initially a15,000 cfm (7.1 m3/s) exhaust was specified with a 3000 fpm(15.2 m/s) exit velocity with a rooftop air intake located 60 ft(18.3 m) downwind. The figure shows that a 12 ft (3.7 m) stackheight is required to meet the ASHRAE 400 µg/m3 per g/sdesign criterion. If the designer wants a shorter stack, anentrained air stack with 25,000 cfm (11.8 m3/s) would reducethe required stack height to approximately 10 ft (3 m). Sinceentrained air stacks typically have higher exit velocities than3000 fpm (15.2 m/s), the actual stack height specificationshould be calculated using a modified Figure 5 with theentrained air exit velocity used in the calculation.
The other item of interest regarding entrained exhauststacks is their performance under high wind conditions. Theabove analysis assumes that the stacks are able to entrain asmuch airflow under high wind conditions as they can underlow wind speeds. Since the entrained air exhaust stacks gener-
Figure 6 Stack height reduction factor (SHR) versus screenporosity.
Figure 7 Centerline plume height calculations forconventional and entrained exhaust stack.
HI-02-15-3 5

ally service high volume flow exhaust systems, high windspeeds are likely to be the most critical (see discussion of crit-ical wind speeds above). To the authors’ knowledge, no dataare available to indicate whether or not these stacks are able toentrain as much airflow at high wind speeds as they are able toentrain at lower wind speeds. If these stacks do not perform aswell under high wind speeds, the advantages of an entrainedexhaust stack will be less than stated above.
In summary, no matter what type of exhaust system isused, the important parameters are the physical stack height,exhaust volume flow rate, exhaust velocity, and expectedpollutant concentration levels at air intakes and other sensitivelocations. Whether conventional or entrained air exhaust airsystems are used, the overall performance should be evaluatedusing the appropriate criterion, i.e., ensuring acceptableconcentrations at appropriate locations. Selecting an exhaustsystem based on an effective stack height specification aloneis not sufficient to ensure an adequate exhaust system design.
RECOMMENDED ANALYTICAL APPROACH
The Basic Approach
The recommended approach to evaluating the air qualityaspects of laboratory exhaust stacks is to perform dispersionmodeling to demonstrate that expected concentrations do notexceed health limits or odor thresholds. The design recom-mendations and standards discussed above can be helpful inthe design process, but they do not guarantee adequate airquality. Furthermore, the ANSI/AIHA Standard Z9.5 speci-fies that concentrations at air intakes be below 20% of allow-able indoor concentrations (AIHA 1992) and confirming theseconcentrations requires dispersion modeling.
The air quality acceptability question can be written:
(1)
and
(2)
where Cmax is the maximum expected concentration atreceptors of interest (air intakes, operable windows, pedes-trian areas), Chealth is the health limit concentration of anyemitted chemical, and Codor is the odor threshold of anyemitted chemical.
In dispersion modeling, the actual quantity predicted isthe ratio of concentration to mass emission rate, C/m, where mis the mass emission rate. The value of C/m is a function of thestack exhaust design, the receptor location, and the windconditions—not a function of the chemical emitted. When alarge number of potential chemicals are emitted from a build-ing, a variety of mass emission rates, health limits, and odorthresholds are examined. It then becomes operationallysimpler to recast the acceptability question by normalizing(dividing) Equations 1 and 2 by the mass emission rate, m:
(3)
and
(4)
The left side of each equation, (C/m)max, is only depen-dent on external factors, such as stack design, receptor loca-tion, and wind conditions. The right side of each equation isrelated to the chemical emissions. For a given chemical, therelationship is defined as the ratio of the health limit or odorthreshold to the emission rate. Therefore, a highly toxic chem-ical with a low emission rate may be of less concern than a lesstoxic chemical emitted at a very high rate.
This process of analysis is simplified by establishing aC/m design goal for the dispersion modeling that is thelowest value of normalized health limits or odor thresholds,(C/m)health and (C/m)odor, for any emitted chemical. Theprocess is illustrated in Figure 8. A chemical inventory for
Figure 8 Recommended design approach.
Cmax Chealth< ?
Cmax Codor< ?
Cm----
max
Cm----
health< ?
Cm----
max
Cm----
odor< ?
6 HI-02-15-3

each exhaust type is examined to determine the appropriatevalues of (C/m)health and (C/m)odor for any released chemi-cals. The lowest value is of the most concern, and that valueis ideally the design goal, (C/m)goal. Dispersion modeling isperformed to determine (C/m)max for all stack designs stud-ied. Those designs that yield concentrations lower than thedesign goal, i.e., (C/m)max less than (C/m)goal, are therecommended exhaust stack designs.
The dispersion modeling results can also be expressed asa dilution rate between the stack exit and receptor location. Atfirst glance, a dilution design goal may be easier to compre-hend because one can visualize the relationship between theemitted exhaust plume and the percentage of the plume that ispresent at a nearby receptor location. Unfortunately, the dilu-tion design goal to achieve safe or odorless concentrations isalso a function of the exhaust volume flow rate, Q. The higherthe volume flow rate, the greater the interior dilution of theemitted substance that is present at the stack exit. Looking atonly the exterior dilution between the exhaust stack and thereceptor ignores the interior dilution component. For a singlestack design where volume flow rate does not vary or where nointernal dilution occurs, diesel generators, for example, a dilu-tion-based approach is satisfactory. However, dilution goals orstandards are not transferable to other designs with differingvolume flow rates when the emission rate of a particularsubstance is not proportional with the total volume flow ratethrough the exhaust stack. This emission scenario is charac-teristic of exhaust sources such as a laboratory fume hood,biological safety cabinet, or isolation room exhaust. Thus, adilution design goal for an entire university campus or indus-trial facility would not be practical where volume flow ratesthrough individual exhaust stacks may vary widely.
Formulating a Concentration Design Goal
Three types of information are needed to developnormalized health limits and odor thresholds, (C/m)healthand (C/m)odor, for comparison to the dispersion modelingresults: (1) a listing of the toxic or odorous substances thatmay be emitted, (2) health limits and odor thresholds foreach emitted substance, and (3) the maximum potentialemission rate for each substance.
Chemicals Emitted. A list of toxic and odorous chemi-cals is usually obtained from the building owners. The list maybe a chemical inventory or a list prepared to meet environmen-tal regulations. Storage amounts are useful for obtaining anupper-bound estimate of the largest amount released.
Health Limits. The recommended health limits (Chealth)are based on ANSI/AIHA Standard Z9.5 on laboratory venti-lation discussed above, which specifies air intake concentra-tions no higher than 20% of acceptable indoor concentrations.Acceptable indoor concentrations are taken to be the mini-mum short-term exposure limits (STEL) from the AmericanConference of Governmental Industrial Hygienists (ACGIH),the Occupational Safety and Health Administration (OSHA),and the National Institute of Occupational Safety and Health
(NIOSH), as listed in ACGIH (2001a). STELs are usuallyassumed appropriate for a 15-minute averaging time. Forchemicals with only an eight-hour time weighted average(TWA) limit, the TWA can be adjusted to a short-term expo-sure limit (STEL) by multiplying the TWA by three (ACGIH2001b). Conversation factors from one concentration averag-ing time to another (i.e., 3 hour, 24 hour, and annual averages)can be found in EPA (1992).
Odor Thresholds. ACGIH (1989) provides a goodsource for odor thresholds (Codor). ACGIH critically reviewsprevious experimental data and lists geometric means ofaccepted data. For chemicals not listed in ACGIH (1989),geometric means of high and low values provided in Ruth(1986), another review article, are recommended. Geometricmeans are used since there are large variations in the sense ofsmell among individuals. Concentrations at the geometricmean of the reported odor thresholds are detectable by approx-imately 50% of the population. Higher concentrations arerequired to recognize the character or the odor (“fishy,”“sweet,” etc.). In most cases, a person will smell a chemicalwell before the health limit is reached.
Emission Rates. For laboratories, emission rates are typi-cally based on small-scale accidental releases, either liquidspills or emptying of a small lecture bottle of compressed gas.The actual emission rates from experimental procedures aredifficult to quantify, especially at large laboratories withdiverse research. Small accidental releases have two advan-tages: (1) they can be considered to be the upper limit of thelargely unknown release rates occurring in laboratories; and(2) they can be quantified. However, there are several assump-tions concerning spill amounts and gas bottle release rates thataffect the concentration design goal. Evaporation from liquidspills is computed from equations in EPA (1992) based on aworst-case spill within a fume hood. Typically, the worst-casespill is defined as the complete evacuation of a 1.0 L (0.26 gal)beaker. A 1.0 L (0.26 gal) beaker is used as a worst-casescenario for two reasons. First, a 1.0 L (0.26 gal) beaker isoften the largest container size typically found within a fumehood. Second, the typical countertop within a fume hood is onthe order of 0.9 m (3.0 ft) deep by 1.1 m (3.6 ft) wide or 1.0m2 (11 ft2). EPA (1992) suggests that the area of a liquid spillshould be calculated assuming a 1 mm (0.004 in.) depth overthe area of the spill. Thus, an area of 1.0 m2 (11 ft2) coveredat a depth of 1 mm (0.004 in.) requires a volume of 1.0 L (0.26gal). Since the evaporation of a liquid spill is proportional tothe area of the spill, and not the depth, a spill volume of greaterthan 1.0 L (0.26 gal) over an area of 1.0 m2 (11 ft2) will notresult in an increased emission rate. However, if the spillvolume is decreased, the evaporation rate will decreaseproportionally. Appropriate adjustments to the worst-casespill volume can be made to account for maximum storagequantities less than 1.0 L (0.26 gal) and for fume hood countersurface areas that are less than or greater than 1.0 m2 (11 ft2).
Compressed gas leaks assume the emptying of a lecturebottle in five minutes. Five minutes is the minimum time listed
HI-02-15-3 7

in the Uniform Fire Code (UFC 1991) for control of accidentalreleases, although a deliberate opening of a lecture bottle canresult in emptying times of less than one minute. Compressedgas bottle contents can be obtained from the provided inven-tories or from commercial catalogs. If a bottle much largerthan a lecture bottle is specified, the emission time is eitherfive minutes for a chemical in the gas phase in the bottle or 30minutes if the gas is in a liquid phase inside the bottle (UFC1991).
For other sources, such as emergency generators, boilers,and vehicles, chemical emissions rates are often availablefrom the manufacturer.
Concentration Design Goal Selection. Once the infor-mation on chemical usage, health limits, odor thresholds, andemission rates is gathered, the normalized health and odorlimits (C/m)health and (C/m)odor for all emitted chemicals arecomputed. The computation can be limited to those known tohave high toxicity, odor strength, and/or emission rates sincethese chemicals will have the most influence on the concen-tration design goal. The concentration design goal for thestack/receptor design will ideally be the minimum value ofthese limits for all of the chemicals.
Often for a facility with intensive chemical usage, thisminimum normalized concentration value is below the mini-mum normalized concentration achievable with a reasonablestack design. There are limits to the effectiveness that a stackcan provide in dispersing its exhaust. For example, if 1.0 L(0.26 gal) of undiluted ethyl mercaptan (a toxic chemical witha strong odor) were spilled, strong odors would be detectablethroughout the site regardless of stack design. Usage controlscan reduce the worst-case emission rates, m, and raise theconcentration design goal to achievable levels. Such usagecontrols can include diluted mixtures, smaller liquid storagequantities, or smaller gas bottles. The concentration design
goal then becomes a compromise between these administra-tive measures and the aggressiveness of the stack design.
Use of the Concentration Design Goal for the Analysis.Once a concentration design goal has been selected and a stackdesign is installed that meets the goal, the concentrationdesign goal is a useful quantity for the safety officer in chargeof the laboratory to retain. As new processes and chemicals areused in the laboratory, the quantities (C/m)health and (C/m)odorcan be evaluated for each chemical added to the inventory. Ifthese values are below the concentration design goal, air qual-ity problems may arise, and usage or emission controls arewarranted.
Wind-Tunnel Modeling
In the recommended approach, wind-tunnel modeling isused to predict maximum concentrations, normalized by emis-sion rate, (C/m), for the stack designs and receptors of interest(ASHRAE 2001, chapter 16). The following section providesa description of typical wind-tunnel modeling methods.
Wind-Tunnel Similarity Criteria. An accurate simula-tion of the boundary-layer winds and stack gas flow is anessential prerequisite to any wind-tunnel study of diffusion fora laboratory facility. Wind-tunnel modeling uses similarityrequirements obtained from dimensional arguments and theequations governing fluid motion. The similarity require-ments are described in Cermak (1975) and the EnvironmentalProtection Agency fluid modeling guidelines (EPA 1981). Themore important similarity requirements for wind-tunnelmodeling are:
1. Use of a physical model with similar geometric features tothe real-world configuration that has no distortion of thevertical scale compared to the horizontal scale.
2. The matching of ratios of stack exit momentum to approachflow momentum and exhaust density to ambient density.
3. Sufficient airflow velocities within the wind tunnel toprovide fully turbulent flow over the buildings.
4. Sufficient stack volume flow rate in the wind tunnel toprovide fully turbulent exit flows for sources with signifi-cant upward momentum, or the use of “trips” within thestack to mechanically create a fully turbulent exit flow.
5. A representative approach “atmospheric boundary layer”flow that duplicates the increase of wind speed and decreaseof turbulence with height above the ground seen in the full-scale atmosphere.
Scale Model and Wind Tunnel Setup. A scale model ofthe facility under evaluation and nearby surroundings, withina 1000 ft (300 m) to 3000 ft (900 m) radius, is constructed andplaced on a turntable. A typical model turntable is shown inFigure 9. Model stacks are installed at the appropriate loca-tions. Most stacks are supplied with a tracer gas mixture (e.g.,an ethane and nitrogen mixture) with a density similar to roomtemperature air. Sources with a temperature hotter than ambi-ent air, such as diesel generators and boilers, are supplied witha gas mixture with a density lighter than ambient air (e.g.,
Figure 9 Photograph of a model installed in anatmospheric boundary-layer wind tunnel.
8 HI-02-15-3

ethane and helium). Precision mass flow controllers are usedto monitor and regulate the discharge velocities. Concentra-tion sampling points (receptors) are installed at the locationsof interest for the particular facility under evaluation, i.e., airintakes, entrances, operable windows, courtyards, etc.
Testing is carried out in an atmospheric boundary-layerwind tunnel. Flow straighteners and screens at the tunnel inletare used to create a homogenous, low-turbulence entranceflow. Spires and a trip downwind of the flow straightenersbegin the development of the atmospheric boundary layer. Thelong boundary layer development region between the spiresand the site model is filled with roughness blocks placed in therepeating roughness pattern. The roughness pattern is experi-mentally set to develop the appropriate approach boundary-layer wind profiles and approach surface roughness lengths.The approach profile is normally characterized by a surfaceroughness length, zo, which is determined by fitting themeasured velocity profile to the following equation:
(5)
whereU = velocity at height z,z = elevation above ground level,zo = surface roughness length,U* = the friction velocity,k = von Karmans constant (which is equal to 0.4).
Data Acquisition. The primary data of interest collectedduring the course of a study is concentration due to the tracergas release from each source being simulated. Volume flowand wind speed measurements are also obtained for documen-tation and to set the wind-tunnel operating conditions. Thefollowing is a summary of the general concentration datacollection procedures: (1) the airflow velocity within the windtunnel is set to the specified value; (2) a tracer gas mixture with
the appropriate density is released from the specified stack atthe specified volume flow rate; (3) concentrations aremeasured at the receptor of interest and mean and root-mean-square normalized concentrations are displayed for the oper-ator and saved to a computer file; (4) step three is repeated fora range of wind directions and wind speeds such that the maxi-mum normalized concentration is found and such that suffi-cient dataare obtained to develop an equation to describenormalized concentration as a function of wind speed anddirection; (5) the above process is repeated for every source/receptor combination identified in the concentration measure-ment test plan; and (6) the saved data files are then used togenerate summary tables and for additional analysis, e.g.,percent time a certain concentration is exceeded, total concen-trations, annual averages, etc.
RESULTS FOR SIMPLE RECTANGULAR BUILDING
A simple rectangular building (Petersen et al. 1999)that is 50.0 ft (15.2 m) high, 50.0 ft (15.2 m) wide, and 100ft (30.5 m) long was constructed and positioned in a bound-ary layer wind tunnel with a simulated suburban approachwind condition, i.e., surface roughness length of 0.50 m(19.7 in.). A tracer gas mixture with the same density asambient air was released from a stack installed on the roofof the model building. The simulated volume flow rate fromthe stack was 5111 cfm (2.41 m3/s), the exhaust velocitywas 2000 fpm (10.2 m/s), and the stack height was variedfrom 1 ft to 12 ft (0.3 m to 3.7 m) while maintaining a 16mph (7.2 m/s) wind speed at 33 ft (10 m). Concentrationlevels were measured on the building roof and building sidefor each condition. One test was run with an 11 ft (3.4 m)stack and 10 ft (3.0 m) solid screen positioned around thestack. All other tests had an unobstructed roof.
Figure 10 shows the normalized concentrations (C/m) onthe building roof and the building side for various stackheights and screen configurations. It should be noted thatstring distances between 0 ft and 50.0 ft (15.2 m) are on thebuilding roof, and string distances between 50.0 ft (15.2 m)and 100 ft (30.4 m) are on the side wall of the building. Thefigure shows the expected trend that, as stack height increases,the concentrations on the roof decrease with the point of maxi-mum C/m moving farther away from the stack location.Concentrations on the building sidewall are much lower thanthose on the roof for each configuration evaluated. This resultpoints out the advantage of locating air intakes on buildingsidewalls versus the roof.
The results in Figure 10 can be used to assess theadequacy of the simple ASHRAE method for specifying stackheights illustrated in Figure 5. Using Figure 5, the minimumacceptable stack height for a 5000 cfm (2.4 m3/s) and 3000fpm (15.2 m/s) exhaust with an air intake 50.0 ft (15.2 m) fromthe exhaust point is approximately 13 ft (4.0 m). Figure 10shows that a 10 ft (3.0 m) stack would be adequate to meet the400 µg/m3 per g/s ASHRAE design criterion. If the air intakeis on the building side wall, there is presently no reliablemethod for accounting for the concentration decrease and aconservative approach would have to be taken, i.e., use Figure
UU *-------- 1
k--- z
zo---- ln=
Figure 10 Concentration distribution along roof anddownwind side of rectangular building.
HI-02-15-3 9

5, which would give a 13 ft (4.0 m) stack height. Figure 10shows that if the air intake were on the building side wall, a 5ft stack would meet the ASHRAE criterion.
Figure 10 also shows that with a 10 ft (3.0 m) solid screenpositioned around a 12 ft (3.7 m) stack, the concentrations onthe roof are high and are similar to those for a 5.0 ft (1.5 m)stack. Hence, the solid screen has in effect reduced the effec-tive stack height by a factor of 0.4. This result illustrates theadverse effect of rooftop features. The effect of these elementsare often not accounted for using the simplified methodsdiscussed previously and, hence, stack heights can be speci-fied that are not tall enough to ensure acceptable air quality. Itshould be noted that the effect of screens on rooftop concen-trations is discussed in detail in Petersen et al. (1999).
DISCUSSION AND CONCLUSIONS
This paper has provided general information regardingthe need for good stack design and discusses issues that shouldbe considered when specifying exhausts and intakes. Nomatter what type of exhaust system is used, the importantparameters are the physical stack height, the exhaust volumeflow rate, exhaust velocity, and expected pollutant concentra-tion levels at air intakes and other sensitive locations. Whetherconventional or entrained exhaust air systems are used, theexhaust specification should be based on the appropriate crite-rion, that is, ensuring acceptable concentrations at appropriatelocations. Selecting an exhaust system based on an effectivestack height specification alone is not sufficient to ensure anadequate exhaust system design.
The paper also presented a quantitative approach to eval-uate the air quality aspects of exhaust stack design. Theapproach includes dispersion modeling, specifically wind-tunnel modeling, to predict maximum concentrations at likelyreceptors, such as air intakes, operable windows, and pedes-trian areas. Concentration goals for design acceptability arebased on emission rates of chemicals likely to be used at thefacility. Health limits, odor thresholds, and emission rates forthe emitted chemicals are incorporated into the concentrationdesign goal. Utilizing the approach for a simple buildinggeometry demonstrated that the mathematical methods tendedto give unnecessarily tall stack heights for an unobstructedroof and gave stacks that are not tall enough for a roof withobstructions.
REFERENCES
ACGIH. 2001a. Guide to Occupational Exposure Values—2001. American Conference of Governmental IndustrialHygienists.
ACGIH. 2001b. 2001 Threshold Limit Values for ChemicalSubstances and Physical Agents. American Conferenceof Governmental Industrial Hygienists.
ACGIH. 1989. Odor Thresholds for Chemicals with Estab-lished Occupational Health Standards. American Con-ference of Governmental Industrial Hygienists.
AIHA. 1992. ANSI/AIHA Standard Z9.5, Laboratory Venti-lation. American Industrial Hygiene Association.
ASHRAE. 2001. 2001 ASHRAE Handbook—Fundamen-tals, chapter 16, Airflow around buildings.; chapter 27,Climatic design information. Atlanta: American Societyof Heating, Refrigerating and Air-Conditioning Engi-neers, Inc.
ASHRAE. 1999. 1999 ASHRAE Handbook—HVAC Applica-tions. Atlanta: American Society of Heating, Refrigerat-ing and Air-Conditioning Engineers, Inc.
Briggs, G.A. 1969. Plume Rise, Critical Review Series.U.S.Atomic Energy Commission, NTIS #TID-25075.
Cermak, J.E. 1975. Applications of fluid mechanics to windengineering. Journal Fluids Engineering, Vol. 97, p. 9.
CDC. 1994. Guidelines for preventing the transmission ofmycobacterium tuberculosis in health-care facilities.U.S. Department of Health and Human Services, PublicHealth Service, Centers for Disease Control and Preven-tion, Atlanta.
EPA. 1981. Guideline for Use of Fluid Modeling of Atmo-spheric Diffusion. U.S. Environmental ProtectionAgency, Office of Air Quality, Planning and Standards,Research Triangle Park, North Carolina, EPA-600/8-81-009.
EPA. 1992. Screening Procedures for Estimating the AirQuality Impact of Stationary Sources, Revised. U.S.Environmental Protection Agency, Office of Air Quality,Planning and Standards, Research Triangle Park, NorthCarolina, EPA-454/R-92-0192.
EPA. 1995a. User's Guide for the Industrial Source Complex(ISC3) Dispersion Models. U.S. Environmental Protec-tion Agency, Office of Air Quality, Planning and Stan-dards, Research Triangle Park, North Carolina, EPA-454/B-95-003a.
EPA. 1995b. SCREEN3 Model User’s Guide. U.S. Environ-mental Protection Agency, EPA-454/B-95-004.
EPA. 1998. AERMOD: Description of Model Formulation.U.S. Environmental Protection Agency, Research Trian-gle Park, North Carolina.
NFPA. 1996. ANSI/NFPA Standard 45-96, Fire Protectionfor Laboratories Using Chemicals. Quincy, Mass.:National Fire Protection Association.
Petersen, R.L., J.J. Carter, and M.A. Ratcliff. 1999. Influ-ence of architectural screens on rooftop concentrationsdue to effluent from the short stacks. ASHRAE Transac-tions 105(1).
Ruth, J.H. 1986. Odor threshold and irritation levels of sev-eral chemical substances: A review. Journal of Ameri-can Industrial Hygiene Association, Vol. 47, p. A-142.
Schulman, L.L., and J.S. Scire. 1993. Building downwashscreening modeling for the downwind recirculation cav-ity. Journal of the Air and Waste Management Associa-tion 43:1122-1127.
Schulman, L.L., D.G. Strimaitis, and J.S. Scire. 2000. Devel-opment and wvaluation of the PRIME plume rise andbuilding downwash model. Journal of the Air and WasteManagement Association 50: 378-390.
UFC. 1991. Uniform Fire Code, Article 80.303, p. 376.
10 HI-02-15-3