spectramax i3 multi-mode platform - moleculardevices.com · options allow the spectramax i3 system...
TRANSCRIPT
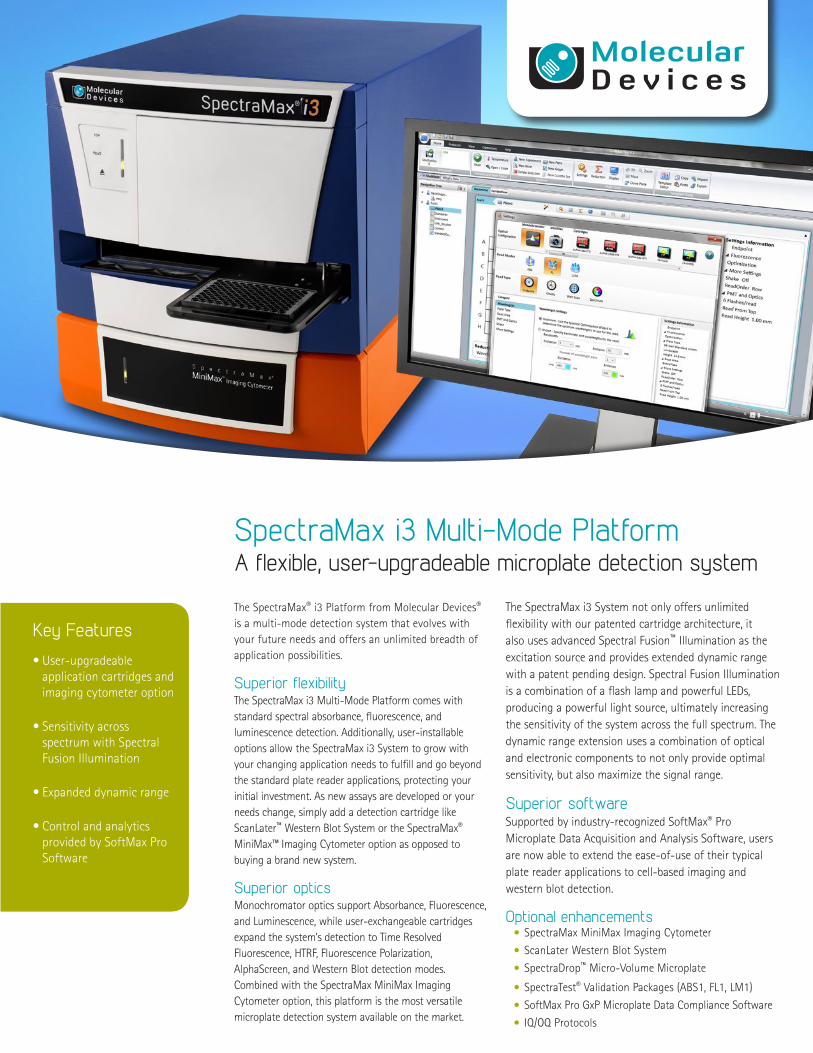
SpectraMax i3 Multi-Mode Platform A flexible, user-upgradeable microplate detection system
Key FeaturesThe SpectraMax® i3 Platform from Molecular Devices® is a multi-mode detection system that evolves with your future needs and offers an unlimited breadth of application possibilities.
Superior flexibilityThe SpectraMax i3 Multi-Mode Platform comes with standard spectral absorbance, fluorescence, and luminescence detection. Additionally, user-installable options allow the SpectraMax i3 System to grow with your changing application needs to fulfill and go beyond the standard plate reader applications, protecting your initial investment. As new assays are developed or your needs change, simply add a detection cartridge like ScanLater™ Western Blot System or the SpectraMax® MiniMax™ Imaging Cytometer option as opposed to buying a brand new system.
Superior opticsMonochromator optics support Absorbance, Fluorescence, and Luminescence, while user-exchangeable cartridges expand the system’s detection to Time Resolved Fluorescence, HTRF, Fluorescence Polarization, AlphaScreen, and Western Blot detection modes. Combined with the SpectraMax MiniMax Imaging Cytometer option, this platform is the most versatile microplate detection system available on the market.
The SpectraMax i3 System not only offers unlimited flexibility with our patented cartridge architecture, it also uses advanced Spectral Fusion™ Illumination as the excitation source and provides extended dynamic range with a patent pending design. Spectral Fusion Illumination is a combination of a flash lamp and powerful LEDs, producing a powerful light source, ultimately increasing the sensitivity of the system across the full spectrum. The dynamic range extension uses a combination of optical and electronic components to not only provide optimal sensitivity, but also maximize the signal range.
Superior softwareSupported by industry-recognized SoftMax® Pro Microplate Data Acquisition and Analysis Software, users are now able to extend the ease-of-use of their typical plate reader applications to cell-based imaging and western blot detection.
Optional enhancements• SpectraMax MiniMax Imaging Cytometer
• ScanLater Western Blot System
• SpectraDrop™ Micro-Volume Microplate
• SpectraTest® Validation Packages (ABS1, FL1, LM1)
• SoftMax Pro GxP Microplate Data Compliance Software
• IQ/OQ Protocols
• User-upgradeable application cartridges and imaging cytometer option
• Sensitivity across spectrum with Spectral Fusion Illumination
• Expanded dynamic range
• Control and analytics provided by SoftMax Pro Software
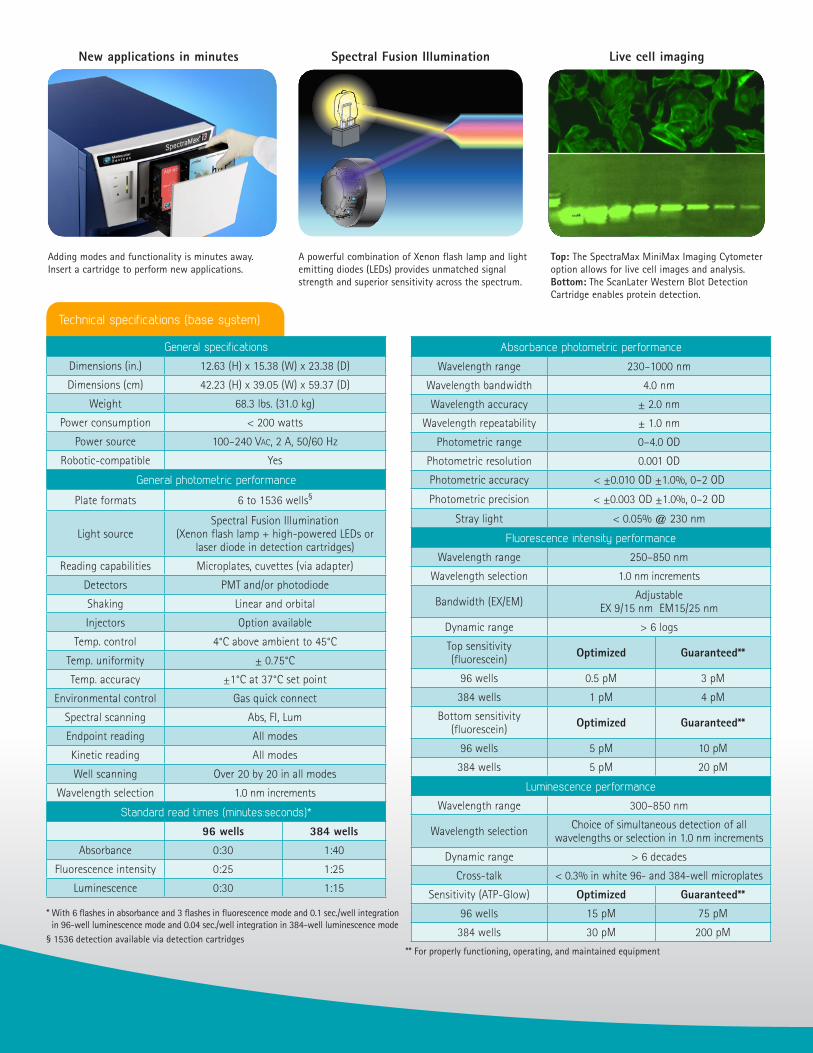
New applications in minutes
Adding modes and functionality is minutes away. Insert a cartridge to perform new applications.
Spectral Fusion Illumination
A powerful combination of Xenon flash lamp and light emitting diodes (LEDs) provides unmatched signal strength and superior sensitivity across the spectrum.
Live cell imaging
Top: The SpectraMax MiniMax Imaging Cytometer option allows for live cell images and analysis. Bottom: The ScanLater Western Blot Detection Cartridge enables protein detection.
Technical specifications (base system)
General specifications
Dimensions (in.) 12.63 (H) x 15.38 (W) x 23.38 (D)
Dimensions (cm) 42.23 (H) x 39.05 (W) x 59.37 (D)
Weight 68.3 lbs. (31.0 kg)
Power consumption < 200 watts
Power source 100–240 Vac, 2 A, 50/60 Hz
Robotic-compatible Yes
General photometric performance
Plate formats 6 to 1536 wells§
Light sourceSpectral Fusion Illumination
(Xenon flash lamp + high-powered LEDs or laser diode in detection cartridges)
Reading capabilities Microplates, cuvettes (via adapter)
Detectors PMT and/or photodiode
Shaking Linear and orbital
Injectors Option available
Temp. control 4°C above ambient to 45°C
Temp. uniformity ± 0.75°C
Temp. accuracy ±1°C at 37°C set point
Environmental control Gas quick connect
Spectral scanning Abs, FI, Lum
Endpoint reading All modes
Kinetic reading All modes
Well scanning Over 20 by 20 in all modes
Wavelength selection 1.0 nm increments
Standard read times (minutes:seconds)*
96 wells 384 wells
Absorbance 0:30 1:40
Fluorescence intensity 0:25 1:25
Luminescence 0:30 1:15
* With 6 flashes in absorbance and 3 flashes in fluorescence mode and 0.1 sec./well integration in 96-well luminescence mode and 0.04 sec./well integration in 384-well luminescence mode
§ 1536 detection available via detection cartridges
Absorbance photometric performance
Wavelength range 230–1000 nm
Wavelength bandwidth 4.0 nm
Wavelength accuracy ± 2.0 nm
Wavelength repeatability ± 1.0 nm
Photometric range 0–4.0 OD
Photometric resolution 0.001 OD
Photometric accuracy < ±0.010 OD ±1.0%, 0–2 OD
Photometric precision < ±0.003 OD ±1.0%, 0–2 OD
Stray light < 0.05% @ 230 nm
Fluorescence intensity performance
Wavelength range 250–850 nm
Wavelength selection 1.0 nm increments
Bandwidth (EX/EM) Adjustable EX 9/15 nm EM15/25 nm
Dynamic range > 6 logs
Top sensitivity (fluorescein) Optimized Guaranteed**
96 wells 0.5 pM 3 pM
384 wells 1 pM 4 pM
Bottom sensitivity (fluorescein) Optimized Guaranteed**
96 wells 5 pM 10 pM
384 wells 5 pM 20 pM
Luminescence performance
Wavelength range 300–850 nm
Wavelength selection Choice of simultaneous detection of all wavelengths or selection in 1.0 nm increments
Dynamic range > 6 decades
Cross-talk < 0.3% in white 96- and 384-well microplates
Sensitivity (ATP-Glow) Optimized Guaranteed**
96 wells 15 pM 75 pM
384 wells 30 pM 200 pM
** For properly functioning, operating, and maintained equipment
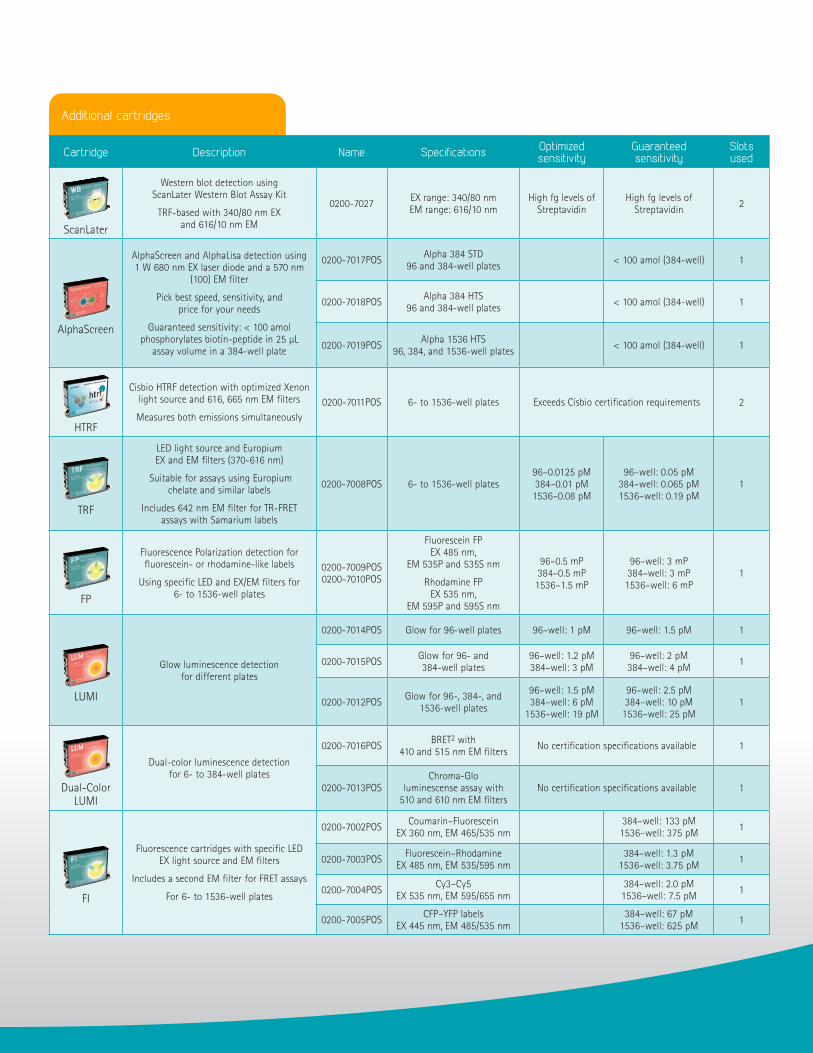
Additional cartridges
Cartridge Description Name Specifications Optimized sensitivity
Guaranteed sensitivity
Slots used
ScanLater
Western blot detection using ScanLater Western Blot Assay Kit
TRF-based with 340/80 nm EX and 616/10 nm EM
0200-7027 EX range: 340/80 nmEM range: 616/10 nm
High fg levels of Streptavidin
High fg levels of Streptavidin 2
AlphaScreen
AlphaScreen and AlphaLisa detection using 1 W 680 nm EX laser diode and a 570 nm
(100) EM filter
Pick best speed, sensitivity, and price for your needs
Guaranteed sensitivity: < 100 amol phosphorylates biotin-peptide in 25 µL
assay volume in a 384-well plate
0200-7017POS Alpha 384 STD96 and 384-well plates < 100 amol (384-well) 1
0200-7018POS Alpha 384 HTS96 and 384-well plates < 100 amol (384-well) 1
0200-7019POS Alpha 1536 HTS96, 384, and 1536-well plates < 100 amol (384-well) 1
HTRF
Cisbio HTRF detection with optimized Xenon light source and 616, 665 nm EM filters
Measures both emissions simultaneously0200-7011POS 6- to 1536-well plates Exceeds Cisbio certification requirements 2
TRF
LED light source and Europium EX and EM filters (370-616 nm)
Suitable for assays using Europium chelate and similar labels
Includes 642 nm EM filter for TR-FRET assays with Samarium labels
0200-7008POS 6- to 1536-well plates96–0.0125 pM384–0.01 pM
1536–0.08 pM
96–well: 0.05 pM384–well: 0.065 pM1536–well: 0.19 pM
1
FP
Fluorescence Polarization detection for fluorescein- or rhodamine-like labels
Using specific LED and EX/EM filters for 6- to 1536-well plates
0200-7009POS0200-7010POS
Fluorescein FP EX 485 nm,
EM 535P and 535S nm
Rhodamine FP EX 535 nm,
EM 595P and 595S nm
96–0.5 mP384–0.5 mP
1536–1.5 mP
96–well: 3 mP384–well: 3 mP1536–well: 6 mP
1
LUMI
Glow luminescence detection for different plates
0200-7014POS Glow for 96-well plates 96–well: 1 pM 96–well: 1.5 pM 1
0200-7015POS Glow for 96- and 384-well plates
96–well: 1.2 pM384–well: 3 pM
96–well: 2 pM384–well: 4 pM 1
0200-7012POS Glow for 96-, 384-, and 1536-well plates
96–well: 1.5 pM384–well: 6 pM
1536–well: 19 pM
96–well: 2.5 pM384–well: 10 pM
1536–well: 25 pM1
Dual-Color LUMI
Dual-color luminescence detection for 6- to 384-well plates
0200-7016POS BRET2 with 410 and 515 nm EM filters No certification specifications available 1
0200-7013POSChroma-Glo
luminescense assay with 510 and 610 nm EM filters
No certification specifications available 1
FI
Fluorescence cartridges with specific LED EX light source and EM filters
Includes a second EM filter for FRET assays
For 6- to 1536-well plates
0200-7002POS Coumarin–Fluorescein EX 360 nm, EM 465/535 nm
384–well: 133 pM1536–well: 375 pM 1
0200-7003POS Fluorescein–RhodamineEX 485 nm, EM 535/595 nm
384–well: 1.3 pM1536–well: 3.75 pM 1
0200-7004POS Cy3–Cy5 EX 535 nm, EM 595/655 nm
384–well: 2.0 pM1536–well: 7.5 pM 1
0200-7005POS CFP–YFP labels EX 445 nm, EM 485/535 nm
384–well: 67 pM1536–well: 625 pM 1
FOR RESEARCH USE ONLY. NOT FOR USE IN DIAGNOSTIC PROCEDURES. The trademarks used herein are the property of Molecular Devices, LLC or their respective owners. ©2013 Molecular Devices, LLC • 10/13 • Printed in USA • PN: 0120-1567.D
Contact UsPhone: +1-800-635-5577Web: www.moleculardevices.comEmail: [email protected]
Check our website for a current listing of worldwide distributors.
Regional OfficesUSA and Canada +1-800-635-5577Brazil +55-11-3616-6607China (Beijing) +86-10-6410-8669China (Shanghai) +86-21-3372-1088Germany 00800-665-32860
Japan (Osaka) +81-6-7174-8831Japan (Tokyo) +81-3-6362-5260South Korea +82-2-3471-9531United Kingdom +44-118-944-8000
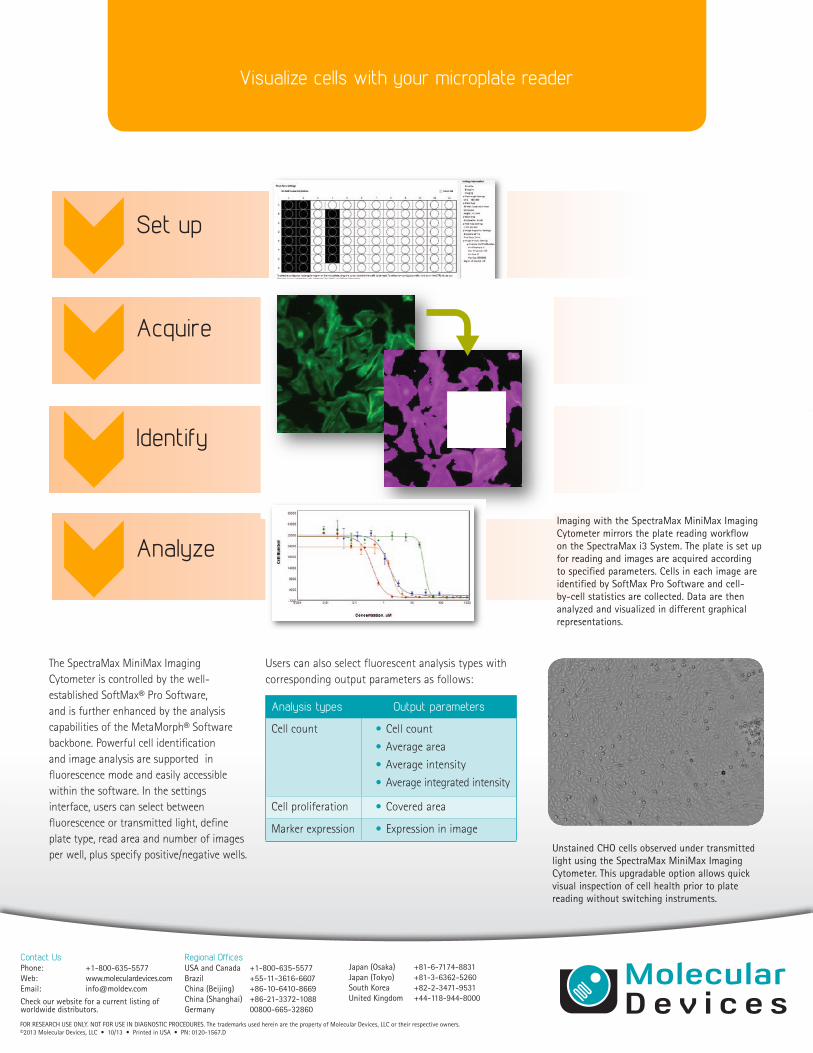
Unstained CHO cells observed under transmitted light using the SpectraMax MiniMax Imaging Cytometer. This upgradable option allows quick visual inspection of cell health prior to plate reading without switching instruments.
The SpectraMax MiniMax Imaging Cytometer is controlled by the well-established SoftMax® Pro Software, and is further enhanced by the analysis capabilities of the MetaMorph® Software backbone. Powerful cell identification and image analysis are supported in fluorescence mode and easily accessible within the software. In the settings interface, users can select between fluorescence or transmitted light, define plate type, read area and number of images per well, plus specify positive/negative wells.
Set up
Identify
Acquire
AnalyzeImaging with the SpectraMax MiniMax Imaging Cytometer mirrors the plate reading workflow on the SpectraMax i3 System. The plate is set up for reading and images are acquired according to specified parameters. Cells in each image are identified by SoftMax Pro Software and cell-by-cell statistics are collected. Data are then analyzed and visualized in different graphical representations.
Users can also select fluorescent analysis types with corresponding output parameters as follows:
Analysis types Output parameters
Cell count • Cell count
• Average area
• Average intensity
• Average integrated intensity
Cell proliferation • Covered area
Marker expression • Expression in image
Visualize cells with your microplate reader