spectrophotmetrical and thermal
TRANSCRIPT
8/6/2019 Spectrophotmetrical and Thermal
http://slidepdf.com/reader/full/spectrophotmetrical-and-thermal 1/13
Spectrophotmetrical and Thermal studies on Vanadium-
Pyrocatechol Complexes and their Application for Vanadium lons
Determination.
A. E. Arifien, M. A. Zayed* and E. A. Abou-El-Nasr.Chemistry Department, Faculty of Science, Aswan, South Valley
university, A. R. Egypt.
*Chemistry Department, Faculty of Science, Cairo University, Giza, A.
R. Egypt.
Abstract
Pyrocatechol (P.C.) is proposed as a spectrophotometric reagent for
some metal ions determination. It reacts with vanadium ions to give
stable coloured complexes in two stoichiometric ratios 1:2 and 1:3. Thecomposition, stability and spectrophotometric characteristics of the
formed complexes are reported. The solid V-P.C. complexes are
separated and characterixed using elemental analysis, IR spectra and
thermal analysis (DTA and TG) in order to outline their structures and
thermal stability. Determination of vanadium in some deposits are also
outlined spectrophotometrically.
Keywords: Vanadium pyrocatechol complexes, spectrophotometrically,
thermal analysis.
Introduction
Vanadium forms number of complexes with some phenolic ligands
and have been studied spectrophotometry1-4. Charney et al5. and others6-7
reported interesting investigation on the polyhydric phenols containing
two ortho OH groups as excellent analytical reagents. On the
discriminating and stability increasing properties of pyrocatechol-
vanadium complexes, many works were published elsewhere8-10
.
Unfortunately, the publication on studying the effect of temperature on
such complexes are scanty. Therefore, this work is devoted to throw morelight on the thermal stability of the formed solid complexes and the use of
the coloured V-P.C. chelates in the microdetermination of vanadium of
some deposits. Also, it is aimed to study the capability of using these
complexes as dye stuff.
Experimental
Reagents
All chemical used were of analytical-reagent grade and doubly
distilled water from alkaline permanganate solutions was used forpreparation of solutions. Pyrocatechol stock solution, 1.0 x 10
-2M of

8/6/2019 Spectrophotmetrical and Thermal
http://slidepdf.com/reader/full/spectrophotmetrical-and-thermal 2/13
ammonium metavanadate solution was prepared by dissolving the
appropriate amount in 250ml of distilled water. 1.0M and 0.1M solutions
of HCI and carbonate free-NaOH were prepared and used for adjusting
the pH-values. All stock solutions were diluted as necessary to produce
working standard solutions.
Apparatus
The absorption spectra of solutions to be tested were recorded on
spectronic 601 instrument (from Milton Roy Company, USA). The IR
spectra of the prepared complexes were also recorded as KBr discs on a
Beckmann Infrared spectrophotometer (Inc, fullation. California USA) in
the wave number range 250-4000cm-1
.Thermal analysis (DTA. TG) were
performed by using Shimadzu 30 series thermal analysis instrument in the
temperature range 20-520oC with a heating rate of 10
omin
-1. under a
nitrogen atmosphere.
Solid complexes
The solid V-P.C. complexes (1:2 and 1:3) were prepared as the
method mentioned elsewhere11. The microanalyses of separated
complexes were carried out in the Micro Analytical Unit, Cairo
University.
Spectrophotometric Determination of Vanadium in its Deposits
The sample deposits were used to test the possibility of using P.C.
as a selective indicator for the spectrophotometric determination of
vanadium (V). Nine samples of vanadium deposits were collected from
boilers of the electrical generating station of South Cairo. The samples
were dissolved and prepared for analysis as given before11
. 1.0x10⁻²
M of
P.C. was added to 0.1-0.7ml of the previously prepared vanadium deposit
solutions. The pH was adjusted at 5.5 and the absorbance was measured
at =550nm after waiting 1min., 1hrs., 3hrs. or 5hrs. for colour
development.
Results and Discussion
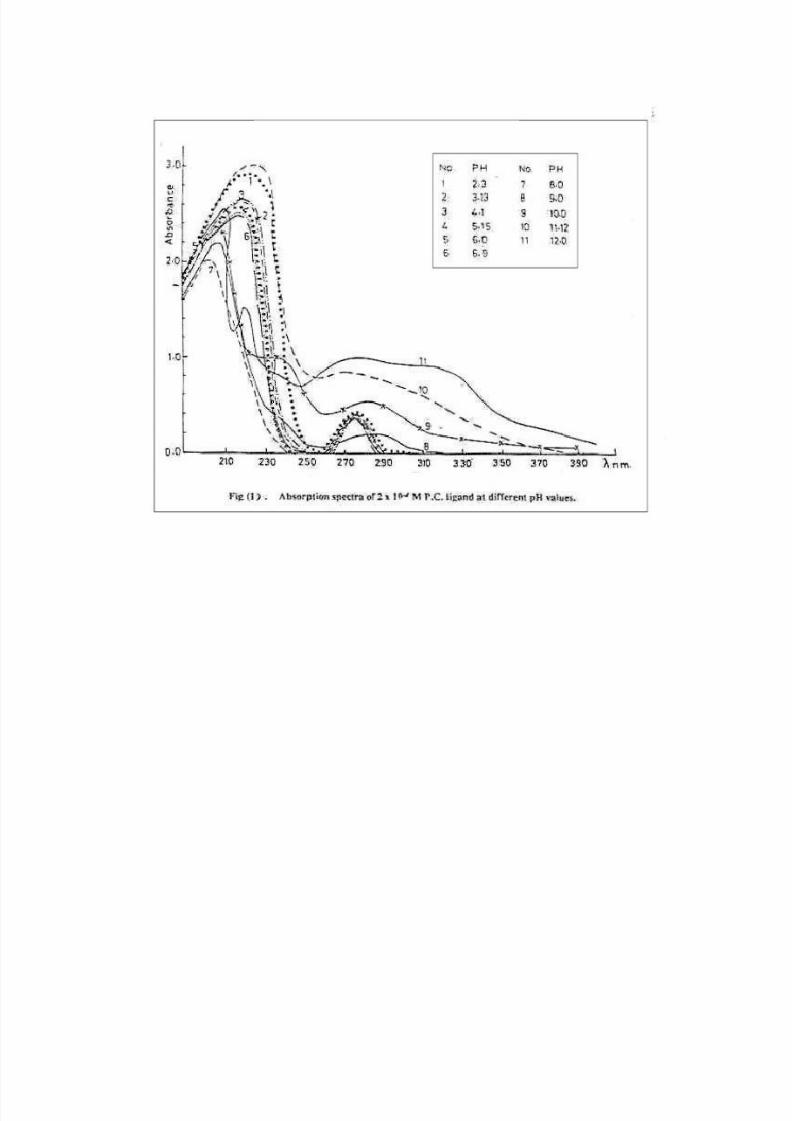
Absorption Spectra
The absorption spectra of 2x10⁻⁴
M P.C. ligand as shown in Fig. (1)
exhibit two absorption bands at pH 2.0-12.0 and ¡ ¡ £
-230nm ( ¥ =
1.46x10⁴) and 250nm ( ¥ = 5 x 10
5). The pKa values of P.C. calculated by
the limiting absorbance method12
were pK1 = 7.15 and pK2 = 10.75
respectively. The spectrum of the reaction of (1x10⁻²M) with V(V) (2x
10-3M) solution against a reagent blank similarly prepared but containing
no vanadium exhibits a new band at¦ § ¨ ¨ § "
-8 (Fig.2). Theband is unambiguously due to the formation of V-P.C. binary complex.

8/6/2019 Spectrophotmetrical and Thermal
http://slidepdf.com/reader/full/spectrophotmetrical-and-thermal 3/13
This band undergoes bathochromic and hypthochromic shifts on
increasing th -10. This may be attributed to the formation of
more than one complex species of different maximum absorbances. The
intensity of the colour of the formed complex increases with time, so it is
preferable to leave the excess ligand in contact with V(V) ions at thesuitable pH (5.5) for some times (15min.) to allow the colour
development.
Stoichiometry of the Complexes
The stoichiometry of the formed complexes between V(V) and
P.C. indicator was studies spectrophotometrically by applying the
familiar molar ratio (M.R.) and continuous variation (C.V.) methods. The
results revealed the formation of 1:3; M:L, complex at pH = 2.0 - 10.0
and max = 550nm but the absorbance pH graph for solutions containing
excess ligand to V(V) ions show two inflections at the aforementioned
pH range indicating the existence of two ratios of the complexes in
solution. This is probably due to a stepwise transition of the two
complexes (Fig.2). This result was also confirmed by microanalysis for
the separated solid complexes. The stability constants of the complexes
were evaluated by the method of Taneija13 and are given in Table 1. The
average value of the stability constant for 1:3 complex was 8.76. These
conditions allow the spectrophotometric determination of V(V) as an
alternative to ICP-OES.
Table 1. Stability constant of V(V) P.C. complex at pH=5.0 7.0;
max=550nm TL = 1 x 10⁻²M; TM = 2 x 10⁻³M; pK1 = 7.10 and
pk 2 = 10.75
pH A Amax n- pL Log K
5.0 1.228 1.875 0.655 9.966 10.24
5.2 1.260 1.875 0.675 9.57 9.94
5.4 1.290 1.875 0.688 9.42 9.76
5.6 1.340 1.875 0.715 8.77 9.17
5.8 1.390 1.875 0.741 8.30 8.176.0 1.490 1.875 0.768 7.97 8.75
6.2 1.500 1.875 0.800 7.58 8.49
6.4 1.570 1.875 0.837 7.18 8.18
6.6 1.650 1.875 0.880 6.79 7.89
6.8 1.760 1.875 0.938 6.39 7.66
7.0 1.875 1.875 1.000 6.00 7.55
Log K av = 8.75, TL = The stoichiometric concentration of the ligand,
TM= The stiochiometric concentration of the metal.
8/6/2019 Spectrophotmetrical and Thermal
http://slidepdf.com/reader/full/spectrophotmetrical-and-thermal 4/13
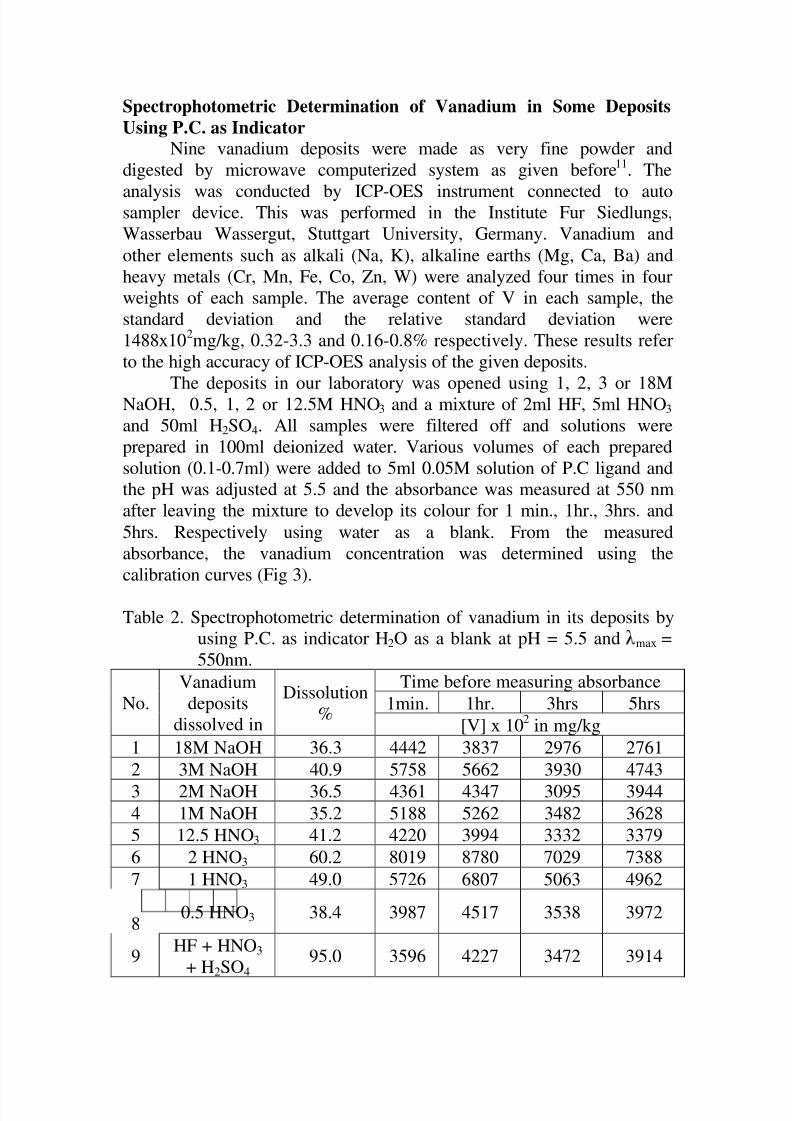
Spectrophotometric Determination of Vanadium in Some Deposits
Using P.C. as Indicator
Nine vanadium deposits were made as very fine powder and
digested by microwave computerized system as given before11. The
analysis was conducted by ICP-OES instrument connected to autosampler device. This was performed in the Institute Fur Siedlungs,
Wasserbau Wassergut, Stuttgart University, Germany. Vanadium and
other elements such as alkali (Na, K), alkaline earths (Mg, Ca, Ba) and
heavy metals (Cr, Mn, Fe, Co, Zn, W) were analyzed four times in four
weights of each sample. The average content of V in each sample, the
standard deviation and the relative standard deviation were
1488x102mg/kg, 0.32-3.3 and 0.16-0.8% respectively. These results refer
to the high accuracy of ICP-OES analysis of the given deposits.
The deposits in our laboratory was opened using 1, 2, 3 or 18M
NaOH, 0.5, 1, 2 or 12.5M HNO3 and a mixture of 2ml HF, 5ml HNO3
and 50ml H2SO4. All samples were filtered off and solutions were
prepared in 100ml deionized water. Various volumes of each prepared
solution (0.1-0.7ml) were added to 5ml 0.05M solution of P.C ligand and
the pH was adjusted at 5.5 and the absorbance was measured at 550 nm
after leaving the mixture to develop its colour for 1 min., 1hr., 3hrs. and
5hrs. Respectively using water as a blank. From the measured
absorbance, the vanadium concentration was determined using the
calibration curves (Fig 3).
Table 2. Spectrophotometric determination of vanadium in its deposits by
using P.C. as indicator H2O as a blank at pH = 5.5 and max =
550nm.
Time before measuring absorbance
1min. 1hr. 3hrs 5hrsNo.
Vanadium
deposits
dissolved in
Dissolution
%[V] x 10
2in mg/kg
1 18M NaOH 36.3 4442 3837 2976 2761
2 3M NaOH 40.9 5758 5662 3930 4743
3 2M NaOH 36.5 4361 4347 3095 39444 1M NaOH 35.2 5188 5262 3482 3628
5 12.5 HNO3 41.2 4220 3994 3332 3379
6 2 HNO3 60.2 8019 8780 7029 7388
7 1 HNO3 49.0 5726 6807 5063 4962
80.5 HNO3 38.4 3987 4517 3538 3972
9HF + HNO3
+ H2SO4 95.0 3596 4227 3472 3914

8/6/2019 Spectrophotmetrical and Thermal
http://slidepdf.com/reader/full/spectrophotmetrical-and-thermal 5/13
The results recorded in Table (2) show a much deviation of V
concentration in comparison to its average value measured by ICP-OES
method (1488x102 mg/kg). Therefore, we have been studied the
interference of the coherent elements present in V deposits. In this
concentration we use these metals in concentration similar to that givenby ICP-OES mixed with the used concentration of P.C as blank. The
results presented in Table (3) indicates that the value of V concentration
in deposits which was opened by 3M NaOH, 0.5 or 2M HNO3 or mixture
of HF+HNO3 + H2SO4 (0.4:1:10) are 1323x102, 1374 x 10
2, 1400 x 10
2
and 1577 x 102 mg/kg respectively which are near to the average value of
V obtained by ICP-OES ( 1488 x 102 mg/kg). It is worth mentioning that,
the deposit is not completely digested by microwave system and values
obtained here are for the digested part of the deposits only.
Table 3. Spectrophotometric determination of vanadium in its deposit
using P.C. as indicator and a blank solution containing the same
concentration of the interfering metal ion at pH = 5.5 and max =
550nm
SampleV deposit
dissolved in[V] in mg/kg
1 18M NaOH 1120.0x102
2 3M NaOH 1323.4.0x102
3 2M NaOH 1221.6x102
4 1M NaOH 534.5x10²
5 12.5 HNO3 1043.5x102
6 2 HNO3 1400.0x102
7 1 HNO3 2074.2x102
8 0.5 HNO3 1374x102
9 HF + HNO3 + H2SO4 1577.9x102
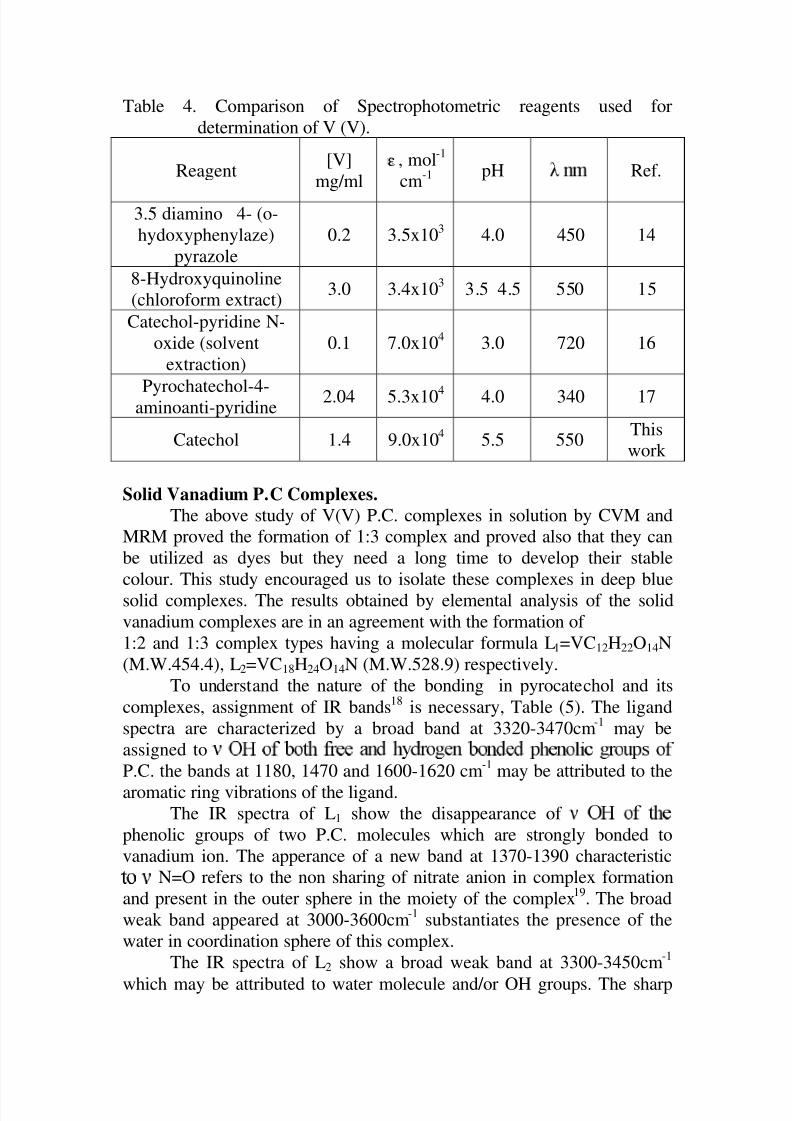
Comparison With Other Methods
The proposed method is simple and yields a dark blue complex
which is stable for 12hrs. Therefore, V(V) can be determined directly in
aqueous solution without the need for extraction into organic solvents.
The method described here is highly sensitive and is comparable to other
methods for direct spectrophotometric determination of V. The sensivity
of other methods are listed in Table (4).
8/6/2019 Spectrophotmetrical and Thermal
http://slidepdf.com/reader/full/spectrophotmetrical-and-thermal 6/13
Table 4. Comparison of Spectrophotometric reagents used for
determination of V (V).
Reagent[V]
mg/ml
ε , mol-1
cm-1
pH ¡ £ Ref.
3.5 diamino 4- (o-
hydoxyphenylaze)
pyrazole
0.2 3.5x10³ 4.0 450 14
8-Hydroxyquinoline
(chloroform extract)3.0 3.4x10
33.5 4.5 550 15
Catechol-pyridine N-
oxide (solvent
extraction)
0.1 7.0x10⁴
3.0 720 16
Pyrochatechol-4-aminoanti-pyridine 2.04 5.3x10⁴ 4.0 340 17
Catechol 1.4 9.0x10⁴
5.5 550This
work
Solid Vanadium P.C Complexes.
The above study of V(V) P.C. complexes in solution by CVM and
MRM proved the formation of 1:3 complex and proved also that they can
be utilized as dyes but they need a long time to develop their stable
colour. This study encouraged us to isolate these complexes in deep blue
solid complexes. The results obtained by elemental analysis of the solid
vanadium complexes are in an agreement with the formation of
1:2 and 1:3 complex types having a molecular formula L1=VC12H22O14N
(M.W.454.4), L2=VC18H24O14N (M.W.528.9) respectively.
To understand the nature of the bonding in pyrocatechol and its
complexes, assignment of IR bands18 is necessary, Table (5). The ligand
spectra are characterized by a broad band at 3320-3470cm-1
may be
assigned to ¥ ¦ § © © ! # % & % © ' # © # % % ( # © 0 1 2 3 ' © 5 ( 6 ©
P.C. the bands at 1180, 1470 and 1600-1620 cm-1
may be attributed to the
aromatic ring vibrations of the ligand.The IR spectra of L1 show the disappearance of 9 ¦ § ©
phenolic groups of two P.C. molecules which are strongly bonded to
vanadium ion. The apperance of a new band at 1370-1390 characteristic
© 9
N=O refers to the non sharing of nitrate anion in complex formation
and present in the outer sphere in the moiety of the complex19. The broad
weak band appeared at 3000-3600cm-1
substantiates the presence of the
water in coordination sphere of this complex.
The IR spectra of L2 show a broad weak band at 3300-3450cm-1
which may be attributed to water molecule and/or OH groups. The sharp

8/6/2019 Spectrophotmetrical and Thermal
http://slidepdf.com/reader/full/spectrophotmetrical-and-thermal 7/13
band appear at 500-600cm-1
in both complexes indicates the bonding of
either phenolate anions to metal (M-O)19
.
Table 5. Assignment of the fundamental group vibration of p. c. and
vanadium P. C. complexes (L1 and L2).
Mode
Comp. (C=C)
aromatic
(C H)
aromatic
(C H)
aromatic (OH) (NO2)
P. C.1180 sh
1470 sh
1600-
1620 sh
730-
770sh3050 s
3330 b
3470 b ------
L1
1450 s 1600 w,b 870 s,b 3150 s,b 3000-
3600 b
1370-
1390 s,b
L2 1470 s,b 1600 b 820 s, sh
880 s, sh 3150 s,b
3300-
3450 b 1370 s,b
b= broad, S= small, sh= sharp and w = weak.
Thermal Analysis
The DTA and TG of L1 and L2 complexes were studied aiming to
check their thermal stability. The resulting data are shown in Fig. 4 and
represented in Table (6). The DTA of L1 shows one very large big
endotherm at 40-200o
C which refers to the loss of five water molecules of hydration and/or crystallization (cacld. mass loss = 19.8 and found =
20%) as given by TG of L1. This is followed immediately by a broad
exthotherm at 200-310oC which may be attributed to the increase in heat
capacity of the remaining part of the complex. The second endotherm at
310-400oC refers to the loss of the pyrocatechol molecule together with
NO3 group (calcd. mass loss = 37.6 and found = 37.5%).
The decomposition of NO3 radical into NO2 gas or radical appears
as a vigorous sharp exotherm at 400-420oC. these changes can be
represented by
V [C12 H8O4]NO3.7H2O V[C12H8O4]NO3.2H2O+5H2O
V[C6H4O2] + NO.3 + C6H4O
.2
NO.3 NO2 2
Scheme (1)
40-200oC
310-400oC
400-420oC

8/6/2019 Spectrophotmetrical and Thermal
http://slidepdf.com/reader/full/spectrophotmetrical-and-thermal 8/13
This scheme indicates no loss of phenolic radical which means that
vanadium is strongly bounded to P.C molecules. Therefore this complex
can be used as dye ink or painting agent at high temperature.
The DTA and TG of L2 show an exothermic sharp peak at 20-30oC
which may be attributed to increase in heat capacity and vigorous internalrearrangement occur in complex. This followed by a very large broad
endotherm at 30-190oC comparable to L1 and it refers to a mass loss of
five water molecules of hydration and/or crystallization ( calcd. mass loss
17.0 and found 17.0). At 190-270oC a broad exotherm peak is appeared
due to the mass loss of two molecules of P.C. ligand as active radicals
(calcd. mass loss = 41.2 and found 41.0%) as given by TG data (Table 6).
The last very sharp exotherm appears in a narrow range (280-290oC)
which may be attributed to fast rearrangement occurs in the remaining
part of L2
and/or rearrangement of the loosed active P. C. radical. These
changes and reactions may be tentatively given by:
←++
+ →
−••
−
C
C
O
O
O H C O H C V NO
O H NOO H C V O H NOO H C V
270190
2462463
2361418
19030
2361418
][2][
5][5.][
Scheme (2)
The activation energy and the order process were calculated byZayed method
20and are depicted in Table (6). Comparing the activation
energies of the two complexes, one can state that L1 is more stable than
L2. Based upon the above facts, the following structural formulae for the
formed complexes are proposed:

8/6/2019 Spectrophotmetrical and Thermal
http://slidepdf.com/reader/full/spectrophotmetrical-and-thermal 9/13
Table 6. Mass loss and activation parameters for decomposition steps of
vanadium complexes (L1 and L2).
Mass loss %
Comp.
Decomposition
steps and temp.
range (oC) Calcd. found
Decomposition
Products
E*
(kg/mol)Order
1st
step endo
40-20019.8 20.0 5H2O 0.022 1.0
L1 2nd step exo
310-40037.6 37.5 C6H5O2 + NO3 0.146 0.0
1st
step exo
20-30- - - 0.565 0.667
2nd
step endo
30-19017.0 17.0 5H2O 0.323 1.0L2
3rd step exo190-270
41.2 41.0 C12H10O4+NO3 0.253 0.0
Conclusion
Pyrocatechol is recommended as indicator for spectrophotmetric
determination of vanadium in its deposits with using mixture of heavy
metal complexes with P. C. in the same conditions as a blank. This
suggested classical procedure can be used to avoid the use of highly
expensive sophisticated instruments as ICP-OES and XRF which may not
be available in the field of vanadium deposit production. Also, theprepared complexes are freely soluble in water and polar organic
solvents; therefore they can be used as dye, black ink or in industrial
tanning processes21.
References
1. Shnaiderman, S. Ya; Ukrain. Khim. Zhur. 25, 795-9 (1959).
2. Shnaiderman, S. Ya; Zh. Neorgan. Khim., 8, 464-73 (1963).
3. Bhattacharya, P. K.; and Banerji. N. S.; Z. Anorg. Allegem. Chim.
315, 118-20 (1962).4. Patrovsky,; Collection Czech Chem. Commun. 31 (8), 3392-6 (1966).
5. Charney, L. M., Finklea, H. O. and Schuttz, F. A., Inorg. Chem. 21(2),
549-6 (1982).
6. Shnaiderman, S. Ya and Chernaya, N. V; Zh. Ne-Organ Khim. 11(1).
134-7 (1966).
7. Singh, A. K. and Kumar, D.; Analyst, 110 (6) ,751-3) 1985).
8. Kavarof, Yu. N; Ali-Zade, T. D. and Gamide-Zade, G. A., Zh.
Neorgan. Khim., 25(9), 2421-9 (1980).
9. Galeffi, B.; Postel, M; Grand, A. and Rey, P. Inorg. Chim. Acta
160(1) 87-91 (1989).

8/6/2019 Spectrophotmetrical and Thermal
http://slidepdf.com/reader/full/spectrophotmetrical-and-thermal 10/13
10. Hawkins, C. T. and Cabanos, T. A.; Inorg. Chem., 28(6), 1084-7
(1989).
11. Abou El-Nasr, E. A., Studies on structures of some dihydroxy phenol
derivatives and its complexes with some metal ions and its
applications in analysis of some Egyptian ores, M. Sc. Thesis Facultyof Science Aswan, South Valley University, (1992).
12. Issa, R. M. and Zewail, A. H.; Srivastava, K. P., J. Inorg. Nucl.
Chem., 33(8), 267 (1971).
13. Taneija, A. D. and Srivastava. K. P., J. Inorg. Nucl. Chem., 33(8), 267
(1971).
14. Arifien, A. E., Asain J., Chem., 4(4), 804-11, (1992).
15.rd
edn., pp. 900-930, Beverly, L. C. Elving, P. J. and Kolthoff, I. M.
16. Shnaiderman, S. Ya. And Demidovskaya, A. N., Khim. Technol. (2),
37-8 (1971).
17.
Zaved., Khim Technol., 17(12), 1783-6, (1974).
18. Furniss, B. S., Hannaford, A. J., Rogers, V., Smith, P. W. G. and
4th edn. (ELBS), pp. 1272-9 (1980).
19. -
Wiley, New York (1958).
20. Zayed, M. A., Thermochim. Acta, 159, 43 (1990).
21. Kamel, M.; Hannout. I. B. and Morsi, A. Z., J. Parkt. Chem., 313(1),
129-36 (1971).
8/6/2019 Spectrophotmetrical and Thermal
http://slidepdf.com/reader/full/spectrophotmetrical-and-thermal 11/13

8/6/2019 Spectrophotmetrical and Thermal
http://slidepdf.com/reader/full/spectrophotmetrical-and-thermal 12/13

8/6/2019 Spectrophotmetrical and Thermal
http://slidepdf.com/reader/full/spectrophotmetrical-and-thermal 13/13