spectroscopic analysis of different types of single-wall carbon nanotubes
TRANSCRIPT

This content has been downloaded from IOPscience. Please scroll down to see the full text.
Download details:
IP Address: 128.252.67.66
This content was downloaded on 26/06/2014 at 07:53
Please note that terms and conditions apply.
Spectroscopic analysis of different types of single-wall carbon nanotubes
View the table of contents for this issue, or go to the journal homepage for more
1998 Europhys. Lett. 44 518
(http://iopscience.iop.org/0295-5075/44/4/518)
Home Search Collections Journals About Contact us My IOPscience

EUROPHYSICS LETTERS 15 November 1998
Europhys. Lett., 44 (4), pp. 518-524 (1998)
Spectroscopic analysis of different typesof single-wall carbon nanotubes
H. Kuzmany1, B. Burger
1, M. Hulman
1, J. Kurti
2
A. G. Rinzler3 and R. E. Smalley
3
1 Universitat Wien, Institut fur Materialphysik - Strudlhofgasse 4, A-1090 Wien, Austria2 Eotvos University, Department for Biological PhysicsPuskin U. 5-7, H-1088 Budapest, Hungary3 Department of Chemistry, Rice University - Houston, TX 77005, USA
(received 25 May 1998; accepted in final form 1 October 1998)
PACS. 78.30−j – Infrared and Raman spectra.PACS. 78.66Qn – Polymers; organic compounds.PACS. 63.20Dj – Phonon states and bands, normal modes, and phonon dispersion.
Abstract. – The Raman response of the radial breathing mode in single-wall carbon nanotubeswas analyzed for excitation with 10 different laser lines. The line shape was fitted with 14Voigtian oscillators which could be correlated to tubes of different helicity. The strongestlines were observed between 172 and 199 cm−1. For an assignment frequencies evaluated froma density functional calculation and scattering intensities for the resonance transitions wereused. The 5 strongest lines observed are consistent with scattering from tubes with 11 differenthelicities. From the evaluation of the scattering intensities the nearest-neighbor integral betweentwo carbon atoms on the curved sheet was found to be 2.6± 0.5 eV.
Since the discovery of carbon nanotubes this material attracts increasing interest in thecommunity of scientists studying nanomaterials. However, the fundamental properties of theindividual tubes could not be investigated until a technology was provided to prepare largeamounts of single-wall nanotubes (SWNTs). This possibility was first demonstrated by Thesset al. [1] using laser evaporation of a graphite target doped with 2% Ni/Co catalyst. Theresulting tubes were found to have a rather uniform diameter and to condense into bundles orropes with a triangular structure. From the X-ray analysis the length of the unit cell for thisstructure is 1.7 nm, corresponding to a diameter of 1.38 nm for the individual tubes.
At this point the quantitative descriptions of the structure and electronic properties ofcylindrical graphene sheets became important as they were developed a few years before [2,3].The single-wall tubes consist of a graphene sheet rolled up along an arbitrary lattice vectorwith components (n,m). Tubes with n = m are labeled armchair, tubes with either n = 0or m = 0 are labeled zigzag. All other tubes are chiral. The observed diameter of 1.38 nm isconsistent with (10, 10) and (17, 0) tubes.
The rolled-up graphene sheet represents an exactly one-dimensional lattice with the fun-
c© EDP Sciences

h. kuzmany et al.: spectroscopic analysis of different types etc. 519
damental lattice vector T along the tube axis. Armchair nanotubes are metallic. The othertypes of tubes are quasi-metallic if n−m is a multiple of 3.
The band structure and the density of states for the tubes can be obtained by the zonefolding technique. This yields subbands with sharp peaks in the density of states for the πand for the π∗ band. Since these peaks are approximately symmetric to the Fermi level, thejoint density of states resonates between symmetric pairs and optical transitions will resonateas a consequence. For small enough tubes the resonance energy depends on the tube diameter.Using the force constants for a flat graphene sheet, approximate frequencies were obtained [4,5]and revealed for some of the mode frequencies a dependence on the diameter of the tube, ifthe latter is smaller than about 2 nm.
A situation where vibrational frequencies and electronic transition energies depend on thesize of particles is appropriate for photoselective resonance scattering in Raman experiments asit is very well known for conjugated polymers. In this case the exciting laser selects a fractionof particles for which resonance conditions are fulfilled. The result is a shift of the Raman lineswith the energy of the exciting laser. This effect was recently observed for single-wall nanotubesby Rao et al. [5]. Another recent result reported diameter-dependent Raman scattering forthe high-frequency E2g derived mode located around 1600 cm−1 [6].
From the calculations in [4] the radial breathing mode (RBM) of the tubes was expected togive the best information on the type and diameter of the tubes. Thus, we performed a detailedRaman analysis of this mode. Preliminary results of this study were reported before [7,8] andexhibited the contribution of a rather large number of tubes to this line in full agreementwith a recent analysis of similar tube material by scanning tunneling microscopy [9]. Thework presented here provides a more refined analysis in a sense that a wider spectral range forthe excitation of the spectra was used, the Raman cross-sections were evaluated explicitly, areliable and high-level evaluation of the mode frequencies was used, and more credit is givento contributions from chiral tubes. The Raman response in all recorded spectra was foundto have a fine structure consisting of a rather large but well-defined number of discrete lines.Using the first-principle calculations for the mode frequencies these lines could be assigned toa distribution of armchair, zigzag, and chiral tubes. The result is important for future work ongrowth and cleaning conditions of SWNTs. For the strongest lines the spectroscopic propertiesand in turn information on the electronic structure of the cylindrical graphene sheets could beobtained. The evaluation was consistent with a nearest-neighbor overlap integral of 2.6±0.5 eVin agreement with recent results from tunneling spectroscopy on single tubes [9] (2.7 eV) anda value derived from LDA calculations [10] (2.5 eV).
SWNTs were prepared by the two-beam laser desorption process and deposited on a coldfinger [1]. The as-grown material was excited in front of a Raman spectrometer at ambientconditions with lasers in the near infrared (NdYAG at 1.16 eV) and in the visible spectralrange. For the line shape analysis 9 different laser lines in the spectral range from 1.6 eVto 2.7 eV were used. The laser power was about 1 mW focused with a cylindrical lens. Thespectra were recorded with 2 cm−1 resolution. They were completely stable with irradiationtime and highly independent of the position on the sample. No difference between as-grownand purified tubes was recorded for the frequency range of the RBM.
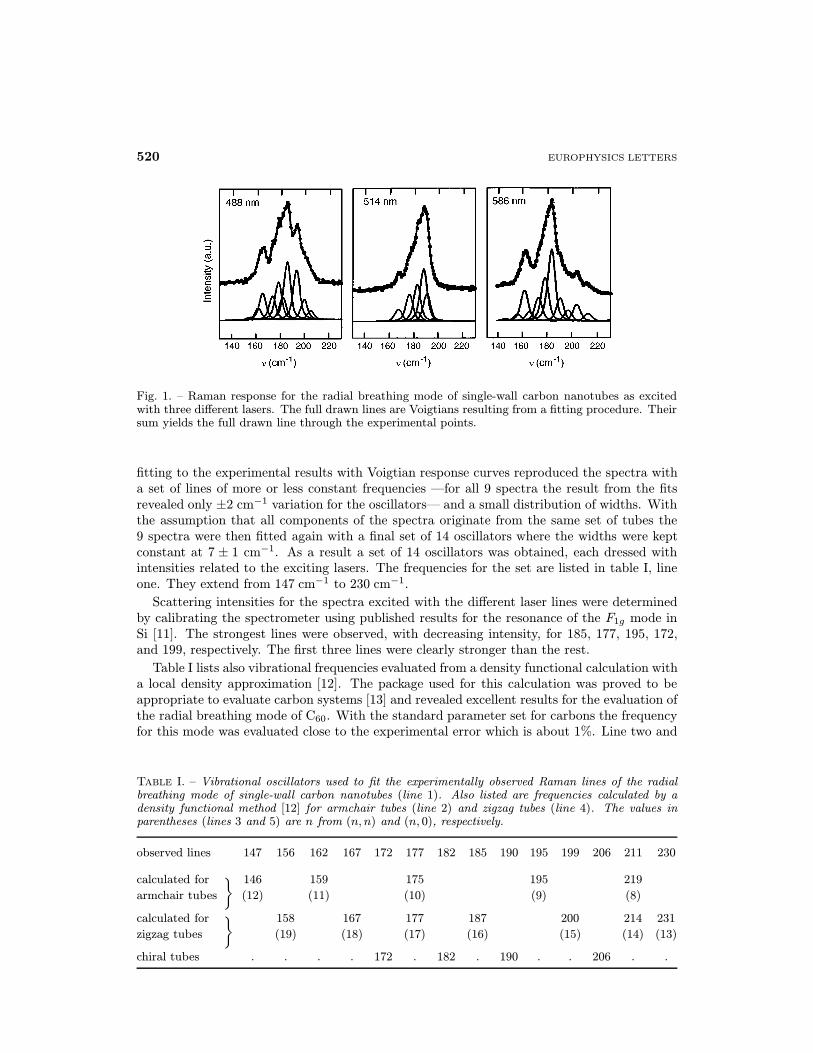
The overall Raman spectrum as excited with 1.16 eV or in the visible spectral rangeshowed two strong lines at 179 cm−1 and just below 1600 cm−1. The low-frequency andthe high-frequency lines originate from the RBM and from the tangential carbon stretching,respectively. In the following we concentrate on the response from the RBM. The three plotsof fig. 1 show a selection of spectra excited with three representative laser lines. The shape,structure and peak position of the lines depend strongly on the energy of the exciting laser.
To represent the whole set of the 9 spectra oscillators were first selected by inspection. A
520 EUROPHYSICS LETTERS
Fig. 1. – Raman response for the radial breathing mode of single-wall carbon nanotubes as excitedwith three different lasers. The full drawn lines are Voigtians resulting from a fitting procedure. Theirsum yields the full drawn line through the experimental points.
fitting to the experimental results with Voigtian response curves reproduced the spectra witha set of lines of more or less constant frequencies —for all 9 spectra the result from the fitsrevealed only ±2 cm−1 variation for the oscillators— and a small distribution of widths. Withthe assumption that all components of the spectra originate from the same set of tubes the9 spectra were then fitted again with a final set of 14 oscillators where the widths were keptconstant at 7 ± 1 cm−1. As a result a set of 14 oscillators was obtained, each dressed withintensities related to the exciting lasers. The frequencies for the set are listed in table I, lineone. They extend from 147 cm−1 to 230 cm−1.
Scattering intensities for the spectra excited with the different laser lines were determinedby calibrating the spectrometer using published results for the resonance of the F1g mode inSi [11]. The strongest lines were observed, with decreasing intensity, for 185, 177, 195, 172,and 199, respectively. The first three lines were clearly stronger than the rest.
Table I lists also vibrational frequencies evaluated from a density functional calculation witha local density approximation [12]. The package used for this calculation was proved to beappropriate to evaluate carbon systems [13] and revealed excellent results for the evaluation ofthe radial breathing mode of C60. With the standard parameter set for carbons the frequencyfor this mode was evaluated close to the experimental error which is about 1%. Line two and
Table I. – Vibrational oscillators used to fit the experimentally observed Raman lines of the radialbreathing mode of single-wall carbon nanotubes (line 1). Also listed are frequencies calculated by adensity functional method [12] for armchair tubes (line 2) and zigzag tubes (line 4). The values inparentheses (lines 3 and 5) are n from (n, n) and (n, 0), respectively.
observed lines 147 156 162 167 172 177 182 185 190 195 199 206 211 230}calculated for 146 159 175 195 219
armchair tubes (12) (11) (10) (9) (8)}calculated for 158 167 177 187 200 214 231
zigzag tubes (19) (18) (17) (16) (15) (14) (13)
chiral tubes . . . . 172 . 182 . 190 . . 206 . .

h. kuzmany et al.: spectroscopic analysis of different types etc. 521
line four in the table were evaluated for armchair tubes and for zigzag tubes, respectively. Theexcellent agreement of the frequency for the (10, 10) tube (175 cm−1) with the observed modeat 177 cm−1 makes it almost certain that the (10, 10) armchair tubes contribute to this line.Ab initio evaluation of the frequencies for the chiral tubes was not possible since the unit cellis too large. However, using the results for the armchair and zigzag tubes the frequencies forthe chiral tubes can savely be evaluated from their diameter D using the 1/D scaling law.
With the above assignment for the (10, 10) tubes an excellent agreement between ex-periments and calculation was obtained for the rest of the modes. Two different sets areeasily identified. The first set with frequencies 147, 162, 177, and 195 cm−1 is consistentwith armchair tubes with (n, n) decreasing from (12, 12) to (9, 9). The second set withfrequencies 156, 167, 177, 185, 199, 211, and 230 cm−1 is consistent with zigzag tubes with(n, 0) decreasing from (19, 0) to (13, 0). Note that the modes for two tubes ((10, 10) and(17, 0)) overlap completely so that they cannot be distinguished from each other if only thefrequency is considered.
The line at 172 and a few other small lines located at 182, 190, and 206 cm−1 could not beidentified in this way. It is very suggestive to assign them to chiral tubes. There is indeed alarge number of possibilities for chiral tubes in the expected diameter range, about 15 speciesbetween (10, 10) and (9, 9), for example. This means there may be other overlaps with thearmchair and zigzag tubes as is indicated by the dots in line 6 of the table. Thus, in contrastto the highly selective results from electron diffraction on nanotube ropes [14] the presenceof a considerable number of armchair tubes, zigzag tubes and chiral tubes is demonstrated toexist in the material.
The scattering intensities (Raman cross-sections) are an other experimental signature whichcan be used to identify the tubes and to study their electronic structure. To make use of this,the Raman cross-section has to be evaluated. Since the cross-section is strongly related to thedensity of states, it is expected to exhibit very sharp resonances as a consequence of the vanHove singularities in the latter. The density of states g(ε) can be evaluated from the bandstructure ε(k, q, n,m, γ) by g(ε) = |∂ε/∂k|−1. The band structure for a tube with arbitraryvector (m,n) is given by
ε(k, q, n,m, γ) = ±γ
{1 + 2
[cos
(√3ka
2
m
(n2 +m2 + nm)1/2+ qπ
2n+m
n2 +m2 + nm
)+
+ cos
(−
√3ka
2
n
(n2 +m2 + nm)1/2+ qπ
n+ 2m
n2 +m2 + nm
)]+
+ 2
[1 + cos
(√3ka
2
m+ n
(n2 +m2 + nm)1/2+ qπ
n−m
n2 +m2 + nm
)]}1/2
. (1)
a and γ are the lattice constant of the graphene sheet and the next-neighbor overlap integral,respectively. q is the subband index extending from 0 to N/2 where N = 2(n2 +m2 +nm)/dR
is the number of subbands in the conduction band and in the valence band, respectively. dR
is the largest common divisor between 2n + m and 2m + n. For each subband k extendsfrom −π/T to π/T , where T is the length of the unit cell. From a comparison between LDAcalculations and tight-binding calculations γ was found to be 2.5 eV for the rolled-up graphenesheet [10].
For a symmetry between valence band and conduction band the joint density of states gjd
is identical to the density of states except for a factor two in the energy, and thus immediately
522 EUROPHYSICS LETTERS
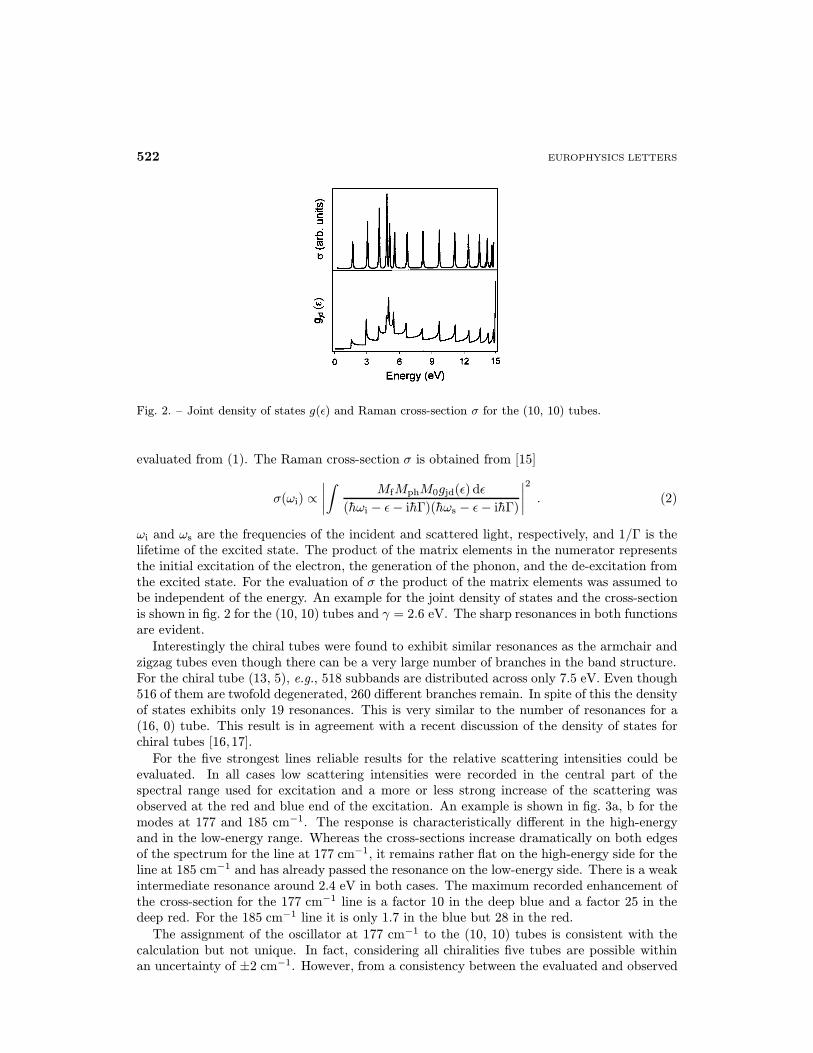
Fig. 2. – Joint density of states g(ε) and Raman cross-section σ for the (10, 10) tubes.
evaluated from (1). The Raman cross-section σ is obtained from [15]
σ(ωi) ∝
∣∣∣∣∫ MfMphM0gjd(ε) dε
(hωi − ε− ihΓ)(hωs − ε− ihΓ)
∣∣∣∣2 . (2)
ωi and ωs are the frequencies of the incident and scattered light, respectively, and 1/Γ is thelifetime of the excited state. The product of the matrix elements in the numerator representsthe initial excitation of the electron, the generation of the phonon, and the de-excitation fromthe excited state. For the evaluation of σ the product of the matrix elements was assumed tobe independent of the energy. An example for the joint density of states and the cross-sectionis shown in fig. 2 for the (10, 10) tubes and γ = 2.6 eV. The sharp resonances in both functionsare evident.
Interestingly the chiral tubes were found to exhibit similar resonances as the armchair andzigzag tubes even though there can be a very large number of branches in the band structure.For the chiral tube (13, 5), e.g., 518 subbands are distributed across only 7.5 eV. Even though516 of them are twofold degenerated, 260 different branches remain. In spite of this the densityof states exhibits only 19 resonances. This is very similar to the number of resonances for a(16, 0) tube. This result is in agreement with a recent discussion of the density of states forchiral tubes [16,17].
For the five strongest lines reliable results for the relative scattering intensities could beevaluated. In all cases low scattering intensities were recorded in the central part of thespectral range used for excitation and a more or less strong increase of the scattering wasobserved at the red and blue end of the excitation. An example is shown in fig. 3a, b for themodes at 177 and 185 cm−1. The response is characteristically different in the high-energyand in the low-energy range. Whereas the cross-sections increase dramatically on both edgesof the spectrum for the line at 177 cm−1, it remains rather flat on the high-energy side for theline at 185 cm−1 and has already passed the resonance on the low-energy side. There is a weakintermediate resonance around 2.4 eV in both cases. The maximum recorded enhancement ofthe cross-section for the 177 cm−1 line is a factor 10 in the deep blue and a factor 25 in thedeep red. For the 185 cm−1 line it is only 1.7 in the blue but 28 in the red.
The assignment of the oscillator at 177 cm−1 to the (10, 10) tubes is consistent with thecalculation but not unique. In fact, considering all chiralities five tubes are possible withinan uncertainty of ±2 cm−1. However, from a consistency between the evaluated and observed

h. kuzmany et al.: spectroscopic analysis of different types etc. 523
Fig. 3. – Comparison between observed relative scattering intensities (◦) and calculated Raman cross-section (—) for two modes at 177 (a) and 185 cm−1 (b), respectively. The dashed line in (a) is for a(17, 0) tube.
resonant transition energies only (10, 10) and (14, 5) remain as candidates. The full drawnline in fig. 3a is the cross-section calculated for (10, 10) tubes and γ = 2.6 eV.
The intermediate resonance around 2.4 eV may originate from the (17, 0) tubes whichexhibit the same frequency as the (10, 10) or (14, 5) tubes. The dashed line reflects theresonance cross-section evaluated from the inverse derivative of (1) together with (2) for thesame value of γ but with a smaller scaling factor for the absolute intensity. This scaling factorcan be considered as describing the concentration of the scatterer.
For the resonance of the line at 185 cm−1 shown in fig. 3 we can proceed similarly but theexperimental values in the red are now on the decreasing edge of the resonance. From theevaluation of the frequencies several candidates exist but considering the transition energiesonly two remain, namely (16, 0) and (14, 4). The full drawn line in the figure is calculated for(16, 0) with γ = 2.55 eV. The intermediate maximum around 2.4 eV must originate from achiral tube with the same frequency. In table II we have listed characteristic data for severalchiral tubes which exhibit a RBM frequency located ±2 cm−1 from 185 cm−1. Since theresonance width is expected to be less than ±1 cm−1 as seen from fig. 3, the only candidate isthe (13, 5) tube.
The three other strong lines were found to be consistent with (17, 1) and (13, 7) (for172 cm−1), (13, 4) and (9, 9) (for 195 cm−1), and (14, 2) and (15, 0) (for 199 cm−1).
Summarizing we have analyzed the fine structure of the Raman response of the RBM in
Table II. – Frequencies and optical transitions energies εi for chiral tubes with frequencies around185 cm−1.
tube (n,m) chiral angle (degree) RBM (cm−1) ε1 (eV) ε2 (eV) ε3 (eV)
(10, 9) 28.3 183 2.12 3.04 3.36
(15, 2) 6.2 187 2.07 2.99 3.31
(13, 5) 15.6 187 2.31 2.55 3.72
(14, 4) 12.2 184 2.05 2.87 3.30
(11, 8) 24.8 185 1.63 1.7 3.12

524 EUROPHYSICS LETTERS
single-wall carbon nanotubes and found a rather large number of tubes with different helicitiesas the source for this structure. Helicities extended from armchair to tubes with variouschiralities including zigzag species. Using first-principle calculations for the RBM an absolutecorrelation between the observed modes and the corresponding tube was established at leastfor armchair and zigzag structures. Chiral tubes were found to exhibit similar resonances asthe nonchiral species. For the strongest observed species a spectroscopic analysis could beprovided for the optical transitions.
***
Work supported by the FFWF in Austria, project P-11943-phy and the HSF OTKAT022980 in Hungary. Nanotube research at Rice University was supported by the NSF, theTexas Advanced Technology Program, and the R. A. Welch Foundation. We acknowledgevaluable discussions with G. Kresse (T.U. Wien), and A. Kasuya (Tohoku U.).
REFERENCES
[1] A. Thess et al., Science, 273 (1996) 483.
[2] Jishi R. A. et al., J. Phys. Soc. Jpn., 63 (1994) 2252.
[3] Hamada N. et al., Phys. Rev. Lett., 68 (1992) 1579.
[4] Jishi R. A. et al., Chem. Phys. Lett., 209 (1993) 77.
[5] Rao A. et al., Science, 275 (1997) 187.
[6] Kasuya A. et al., Phys. Rev. Lett., 78 (1997) 4434.
[7] Kuzmany H. et al., Physica B, 244 (1998) 186.
[8] Kuzmany H. et al., Carbon, 36 (1998) 709.
[9] Wildoer J. W. et al., Nature, 391 (1998) 59.
[10] Mintmire J. W. and White C. T., Carbon, 33 (1995) 893.
[11] Renucci J. B., Tyte R. N. and Cardona M., Phys. Rev. B, 11 (1975) 3885.
[12] Kurti J. et al., Phys. Rev. B, 58 (1998) 8869.
[13] Kresse G. and Hafner J., Phys. Rev. B, 49 (1994) 14251.
[14] Cowley J. M. et al., Chem. Phys. Lett., 97 (1997) 379.
[15] Martin R. M. and Falicov L. M., Topics Appl. Phys., 8 (1983) 79.
[16] White C. T. and Mintmire J. W., Nature, 394 (1998) 29.
[17] Charlier J. C. and Lambin P., Phys. Rev. B, 57 (1998) 15037.