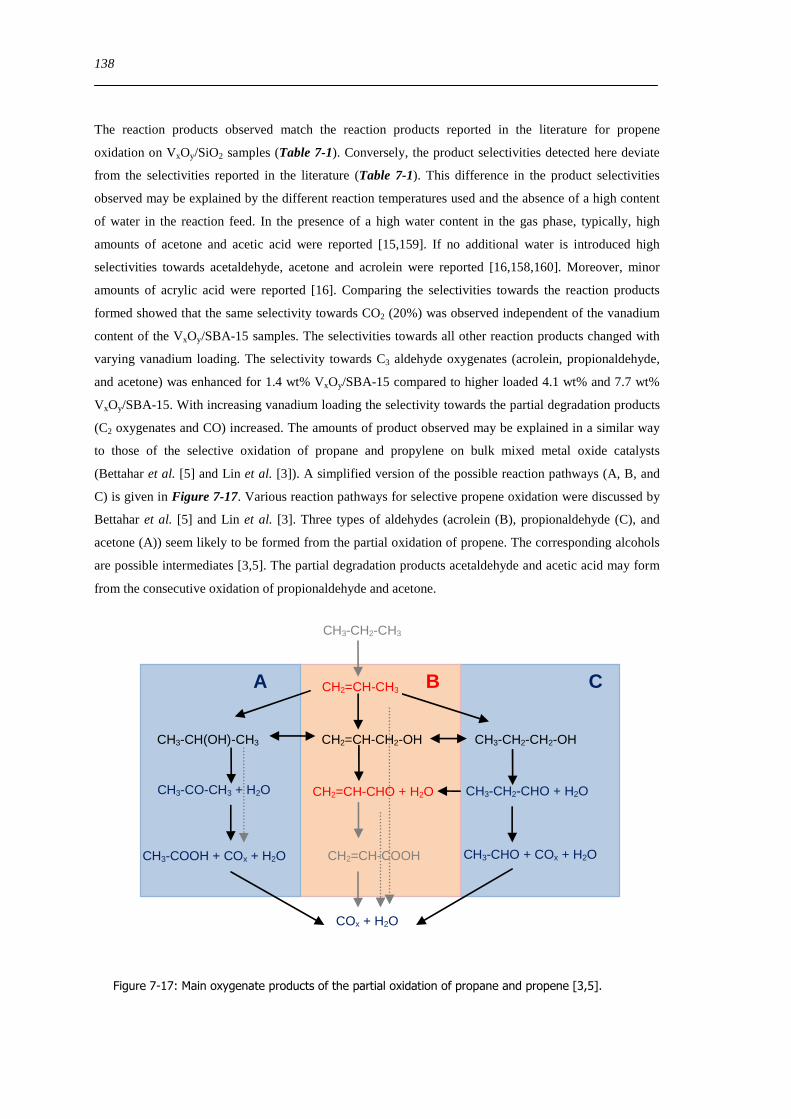
spectroscopic and catalytic investigations of v xoy/sba-15
TRANSCRIPT
Spectroscopic and catalytic investigations of VxOySBA-15
and magnesium vanadate model catalysts for selective
propene oxidation
vorgelegt von
Diplom-Chemikerin
Anke Walter
aus Berlin
Von der Fakultaumlt II - Mathematik und Naturwissenschaften
der Technischen Universitaumlt Berlin
zur Erlangung des akademischen Grades
Doktor der Naturwissenschaften
Drrernat
genehmigte Dissertation
Promotionsausschuss
Vorsitzender Prof Dr Thomas Friedrich TU Berlin
1 Berichter Prof Dr Thorsten Ressler TU Berlin
2 Berichter Prof Dr Christian Hess TU Darmstadt
Tag der wissenschaftlichen Aussprache 26102011
Berlin 2011
D 83
Abstract
The objective of the present work was elucidating structure-activity relationships concerning the individual role of vanadium sites in selective propene oxidation Two suitable vanadium oxide model catalyst systems were employed vanadium oxides supported on SBA-15 ldquoVxOySBA-15rdquo and various magnesium vanadate phases Detailed investigations on the preparation thermal stability structure and structural evolution under reducing and propene oxidizing condition were conducted Various in situ methods were used eg UV-Vis-DRS X-ray absorption spectroscopy Raman spectroscopy and X-ray powder diffraction These were combined with online MS gas phase analysis Catalytic characterization of the model catalysts was performed using quantitative GC gas phase analysis
In a first investigation magnesium vanadate phases Mg3V10O2828H2O MgV2O6 monoclinic and triclinic Mg2V2O7 and Mg3V2O8 were prepared and compared with V2O5 Besides Mg3V10O2828H2O all oxides were stable enough to be used for reaction tests No significant structural changes or reduction of the bulk phase during propene oxidation occurred for the magnesium vanadates up to 673 K Conversely V2O5 was reduced to VO2(B) under reaction conditions and V4O9 was formed as intermediate phase Catalytic performance of the magnesium vanadates was lower compared to that of V2O5 The highest propene conversions were measured for monoclinic Mg2V2O7 Only marginal differences in selectivity towards oxygenated products such as acrolein were observed for the different magnesium vanadate phases Compared to V2O5 total oxidation was increased while mainly acrolein was formed as partial oxidation product In situ UV-Vis-DRS revealed that the catalytic performance correlated with the reducibility of the magnesium vanadate catalysts
Second part Emphasis of the present work was placed on the investigation of selective propene oxidation over VxOySBA-15 model catalysts Preparation of highly disperse VxOySBA-15 samples without formation of V2O5 during the preparation process was possible using a grafting anion exchange method Three different VxOySBA-15 samples with vanadium loadings in the range of 14 wt-77 wt (03 Vnm2 ndash 24 Vnm2) were synthesized A hydrated state of VxOySBA-15 was present at ambient temperatures of 300 K in humid atmospheres The hydrated state consisted of polymerized vanadium oxide units with square pyramidal coordination of the vanadium centers Thermal treatment in oxygen and water saturated atmospheres resulted in dehydration loss of coordinated water and the direct formation of the dehydrated state of VxOySBA-15 above 440 K The dehydrated state of VxOySBA-15 was described by an ordered arrangement of dimeric vanadium oxide units with tetrahedral coordination of the vanadium centers In situ spectroscopic measurements revealed that the dehydrated VxOySBA-15 structure corresponds to the vanadium oxide structure during selective propene oxidation Formation of additional V-O-Si bonds to the support during catalytic reaction was deduced Moreover catalytic reaction in propene and oxygen lowered the reducibility of the vanadium centers in VxOySBA-15 using propene as reducing agent Vanadium loading had only minor impact on the catalytic performance of VxOySBA-15 Besides formation of CO2 and CO mainly formation of acrolein propionaldehyde acetaldehyde and acetic acid was observed No significant change in product selectivites was observed compared to V2O5 reference Hence similar active vanadium oxides centers may be present on VxOySBA-15 and bulk V2O5 Conversely to V2O5 the average vanadium valence of VxOySBA-15 was V5+ during propene oxidation independent of the initial oxygen to propene ratio Dynamic investigations in changing reducing and catalytic condition and a reaction order of zero for oxygen during propene oxidation showed that VxOySBA-15 exhibited a fast re-oxidation of the vanadium centers during propene oxidation
Zusammenfassung
Das Ziel dieser Arbeit war die Erstellung von geeigneten Struktur-Aktivitaumlts-Beziehungen von Vanadiumzentren in der selektiven Oxidation von Propen Dafuumlr wurden zwei Modelsysteme auf Basis von Vanadiumoxiden untersucht Auf SBA-15 getraumlgerte Vanadiumoxide ldquoVxOySBA-15rdquo und verschiedene Magnesiumvanadat-Phasen Diverse analytische Methoden wurden genutzt um die Praumlparation die Vanadiumoxid-Struktur und die Entwicklung der Vanadiumoxid-Struktur unter reduzierenden und Propen-oxidierenden Bedingungen zu verfolgen Es wurden unter anderem in situ UV-Vis-DRS Roumlntgenabsorptionsmessungen Raman-Messungen sowie Roumlntgendiffraktionsmessungen angewendet Gleichzeitig wurde die Zusammensetzung der Gasphasen mittels online Massenspektrometrie untersucht Zusaumltzlich erfolgte eine quantitative katalytische Charakterisierung der Modell-Katalysatoren mittels Gaschromatographie
Im ersten Teil der Arbeit wurden Magnesiumvanadat-Phasen hergestellt Mg3V10O2828H2O MgV2O6 monoklines und triklines Mg2V2O7 sowie Mg3V2O8 Diese wurden mit V2O5 verglichen Auszliger Mg3V10O2828H2O waren alle untersuchten Oxide thermisch stabil und konnten fuumlr Reaktionstests verwendet werden Fuumlr die untersuchten Magnesiumvanadat-Phasen wurde keine Reduktion unterhalb von 673 K beobachtet Im Gegensatz dazu wurde V2O5 zu VO2(B) unter katalytischen Bedingungen reduziert V4O9 wurde als Zwischenphase gebildet Die gemessene katalytische Aktivitaumlt der Magnesiumvanadat-Phasen war deutlich niedriger als die von V2O5 Innerhalb der Magnesiumvanadat-Phasen zeigte monoklines Mg2V2O7 die houmlchste Aktivitaumlt Die gemessenen Produktselektivitaumlten zwischen den Magnesiumvanadat-Phasen unterschieden sich nur geringfuumlgig Gegenuumlber V2O5 fand eine erhoumlhte Totaloxidation von Propen statt Weiterhin wurde hauptsaumlchlich Acrolein als Partialoxidations Produkt von Propen gebildet In situ UV-Vis-DRS Messungen zeigten dass die katalytische Aktivitaumlt der Magnesiumvanadat-Phasen mit der Reduzierbarkeit der Vanadiumzentren korrelierte
Im zweiten Teil dem Mittelpunkt dieser Arbeit wurden VxOySBA-15 Modell Katalysatoren fuumlr die selektive Oxidation von Propen untersucht Die Herstellung von hoch dispersen Vanadiumoxid-Strukturen auf dem SBA-15 Traumlger ohne die Bildung von kristallinen V2O5-Phasen war mittels einer speziellen Ionen-Austausch Prozedur moumlglich Es wurden drei Proben mit Vanadium-Beladungen im Bereich von 14 wt-77 wt (03 Vnm2 ndash 24 Vnm2) hergestellt Bei niedrigen Temperaturen von 300 K und in wassergesaumlttigten Atmosphaumlren lag eine hydratisierte Phase von VxOySBA-15 vor Die Vanadiumoxid-Struktur der hydratisierten Phase besteht aus kondensierten Vanadiumoxideinheiten mit quadratisch planarer Koordination der Vanadiumzentren Thermische Behandlung in sauerstoffhaltigen Atmosphaumlren fuumlhrte zu einer Dehydratation der hydratisierten Phase Fuumlr Temperaturen houmlher 440 K bildete sich die dehydratisierte Struktur von VxOySBA-15 unter der Abspaltung von koordiniertem Wasser aus Die Vandiumoxid-Struktur der dehydratisierten Phase konnte durch eine regelmaumlszligige Anordnung von benachbarten dimeren Vanadiumoxideinheiten beschrieben werden Dabei sind die Vanadiumzentren in der dehydratisierten Phase tetraedisch koordiniert In situ spektroskopische Messungen haben gezeigt dass die dehydratisierte Phase der Vanadiumoxid-Phase unter katalytischen Bedingungen entspricht Waumlhrend der Propenoxidation bilden sich zusaumltzliche V-O-Si-Bindungen aus Weiter aumlndert sich die Reduzierbarkeit der Vanadiumzentren in VxOySBA-15 nachdem diese katalytischen Reaktionsbedingungen ausgesetzt waren Die Vanadiumbeladung hatte nur einen geringen Einfluss auf die katalytischen Eigenschaften von VxOySBA-15 Neben der Bildung von CO2 und CO wurde die Bildung von Acrolein Propionaldehyd Acetaldehyd und Essigsaumlure beobachtet Gegenuumlber einer V2O5 Referenz wurden nur geringe Unterschiede in den gemessene Selektivitaumlten der Reaktionsprodukte der Propenoxidation festgestellt Daher wird vermutet dass sowohl auf VxOySBA-15 als auch auf V2O5 aumlhnliche aktive Zentren auf der Oberflaumlche vorliegen muumlssen Im Gegensatz zu V2O5 war die mittlere Vanadiumvalenz +5 waumlhrend der Oxidation von Propen Untersuchungen mit wechselnden reduzierenden und oxidierenden Gasatmosphaumlren und eine Reaktionsordnung nullter Ordnung fuumlr Sauerstoff zeigten dass eine schnelle Re-Oxidation der Vanadiumzentren waumlhrend der Propenoxidation stattfindet
Danksagung
Zunaumlchst bedanke ich mich bei den drei Gutachtern dieser Arbeit Prof Dr Thorsten Ressler fuumlr die
interessante wissenschaftliche Fragestellung die exzellente fachliche Betreuung die mit dieser Arbeit
verbunden war und stete Diskussionsbereitschaft waumlhrend meiner Promotionszeit Bei Prof Dr Christian
Hess bedanke ich mich fuumlr seine Unterstuumltzung die Moumlglichkeit zur Durchfuumlhrung von in situ Raman
Experimenten in seinem Arbeitskreis hilfreiche Diskussionen und die Uumlbernahme des Zweitgutachtens
Prof Dr Thomas Friedrich danke ich fuumlr die Uumlbernahme des Pruumlfungsvorsitzes
Herrn Dr Jan Dirk Epping danke ich fuumlr Durchfuumlhrung und Auswertung der Festkoumlrper NMR
Messungen Dr Joumlrg Thielemann danke ich fuumlr die Durchfuumlhrung und Unterstuumltzung bei den in situ
Raman Messungen Fuumlr die Aufnahme der Elektronenmikroskopbilder danke ich den Mitarbeitern des
ZELMI an der TU Berlin Herrn Harald Link moumlchte ich fuumlr die durchgefuumlhrten ICP-OES Messungen
danken Dr Elisabeth Irran danke ich fuumlr die Aufnahme und Hilfe bei der Auswertung der Einkristall-
Roumlntgenmessungen
Semiha Schwarz danke ich fuumlr Unterstuumltzung bei der Synthese von SBA-15 und VxOySBA-15 und die
vielen TG Messungen Weiter bedanke ich mich bei ihr auch fuumlr die herzliche Atmosphaumlre und die vielen
nicht fachlichen Gespraumlche die das Arbeiten so angenehm gemacht haben Bei Dr Astrid Juumlrgensen
bedanke ich mich fuumlr die Aufnahme der zahlreichen Diffraktogramme und die durchgefuumlhrten RFA
Messungen sowie fuumlr ihre Unermuumldlichkeit beim Korrekturlesen dieser Arbeit Auch allen weiteren
Mitgliedern des Arbeitskreises danke ich die stets Diskussionsbereitschaft gezeigt haben und mich bei
der Durchfuumlhrung der zahlreichen Messungen auf vielfaumlltige Weise unterstuumltzt haben Dr Thomas
Christoph Roumldel Alexander Hahn Dr Anne Dennstedt Gregor Koch Juliane Scholz Alexander Muumlller
Rafael Zubrzycki und Sigrid Imme Ich danke auch Mateusz Jastak Jacek Kozuch und Udo Dorn die
mich im Rahmen ihrer Praktika waumlhrend der Synthese der Magnesiumvanadate und Vanadium-
Referenzen unterstuumltzt haben Weiter moumlchte ich mich auch bei Alper Uumlnal und Dr Ingo Piotrowski
bedanken fuumlr ihre hilfreichen Ratschlaumlge zur Synthese Auch allen weiteren Mitgliedern des Instituts fuumlr
Chemie der TU Berlin die diese Arbeit unterstuumltzt haben und nicht weiter namentlich genannt sind
danke ich
Besonders bedanke ich mich auch bei DESY und dem Hasylab in Hamburg und ANKA in Karlsruhe fuumlr
die Erteilung von Messzeit und die finanzielle Unterstuumltzung Weiter bedanke ich mich bei der Deutschen
Forschungsgemeinschaft (DFG) und dem Beirat der Zentralen Frauenbeauftragten der TU Berlin fuumlr die
finanzielle Unterstuumltzung
Stephan Rau und meiner Familie danke ich fuumlr den Ruumlckhalt und die stete Motivation zu dieser Arbeit
IX
Contents
Abstract XI
Zusammenfassung XIII
Danksagung XV
Contents IX
1 Introduction 1
11 Motivation 1
12 Vanadium oxides in catalysis 3
13 Supported vanadium oxides in catalysis 3
14 Outline of the work 6
Part I Spectroscopic and catalytic investigations of magnesium vanadate model
catalysts and V2O5 for selective propene oxidation
2 Magnesium vanadate model systems and V2O5 during selective propene oxidation 11
21 Introduction 11
22 Experimental 12
221 Sample preparation 12
222 Powder X-ray diffraction (XRD) 13
223 UV-Vis Diffuse reflectance spectroscopy (UV-Vis-DRS) measurements 13
224 X-ray absorption spectroscopy (XAS) 14
225 Quantitative catalysis measurements 14
23 Results and discussion 14
231 Ex situ structural characterization of prepared samples 14
232 Structure and reactivity of V2O5 and m-Mg2V2O7 under catalytic conditions 18
233 Catalytic performance of the magnesium vanadates and V2O5 21
234 Structural evolution of V2O5 and m-Mg2V2O7 under reductive conditions 23
235 Correlations of structure reducibility and catalytic activity of V2O5 26
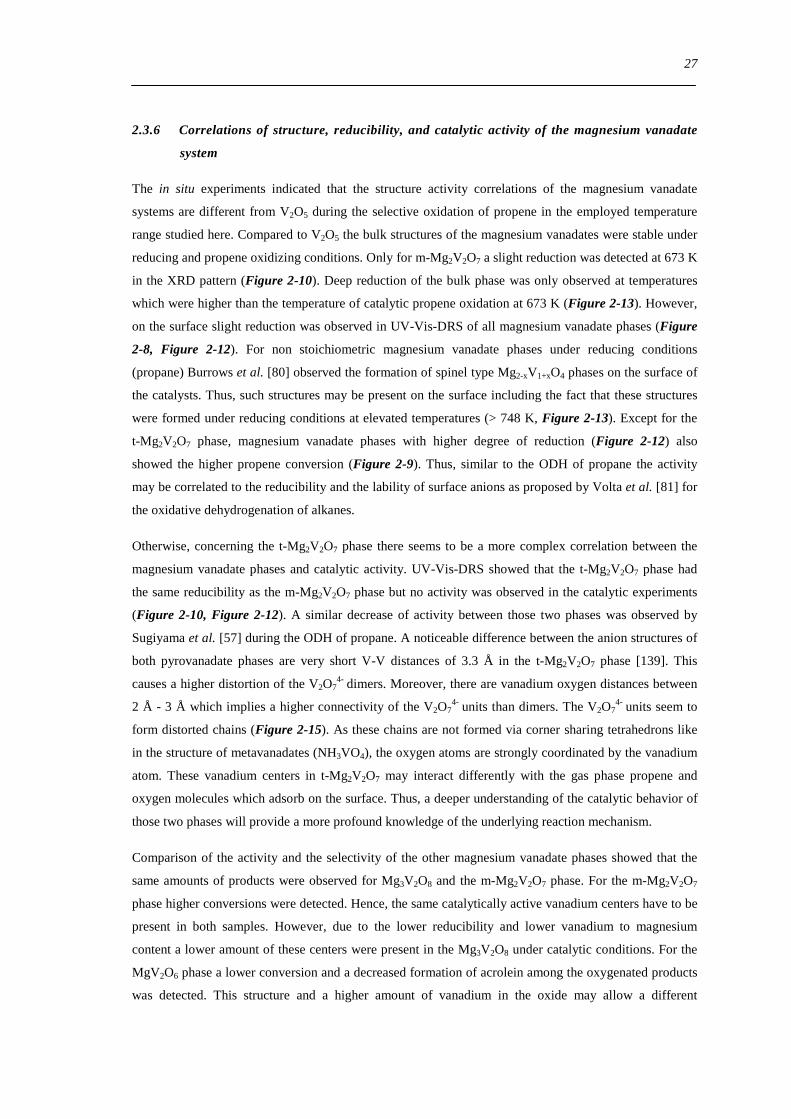
236 Correlations of structure reducibility and catalytic activity of the magnesium vanadate system 27
237 Comparison of the magnesium vanadate system and V2O5 28
24 Summary 29
X
Part II Spectroscopic and catalytic investigations of VxOySBA 15 model catalysts for
selective propene oxidation
3 Fundamentals and experimental details 33
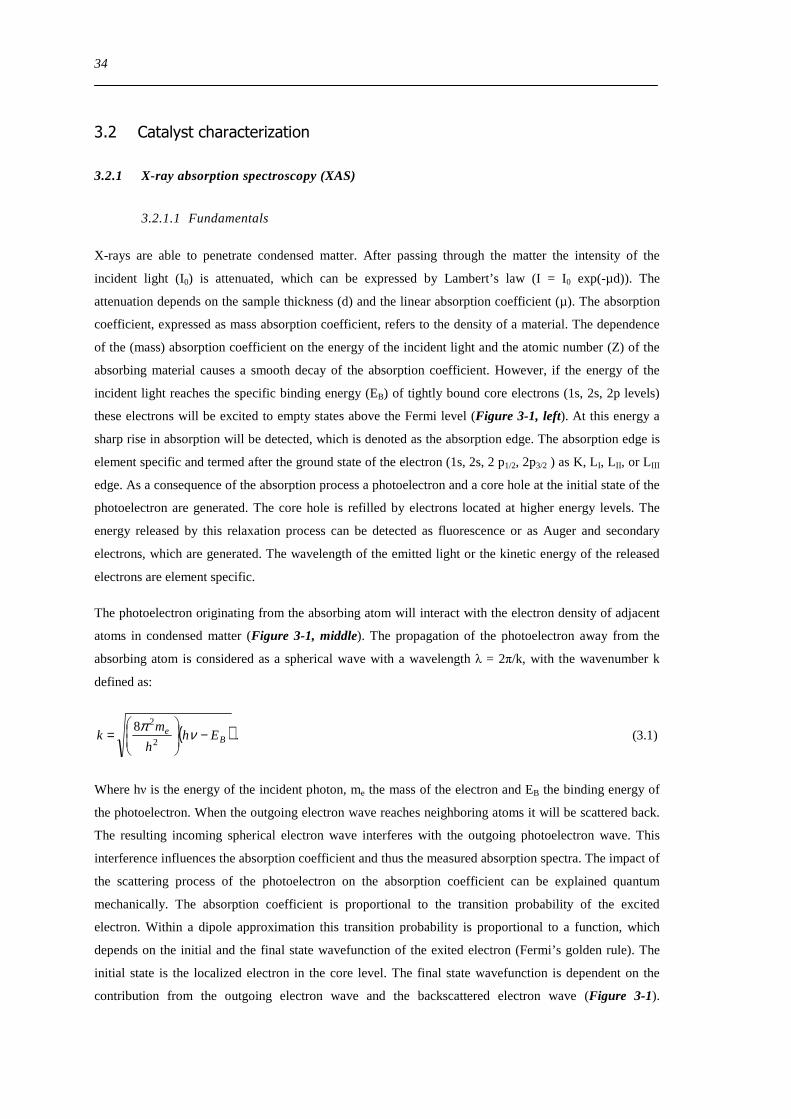
31 Catalyst preparation 33
32 Catalyst characterization 34
321 X-ray absorption spectroscopy (XAS) 34
322 UV-Vis Diffuse reflectance spectroscopy measurements 39
323 Powder X-ray diffraction (XRD) 42
324 Physisorption measurements 42
325 Elemental analysis 43
326 Solid state NMR 43
327 Raman spectroscopy 43
328 Thermal analysis 44
329 Electron microscopy 44
33 Catalytic characterization 45
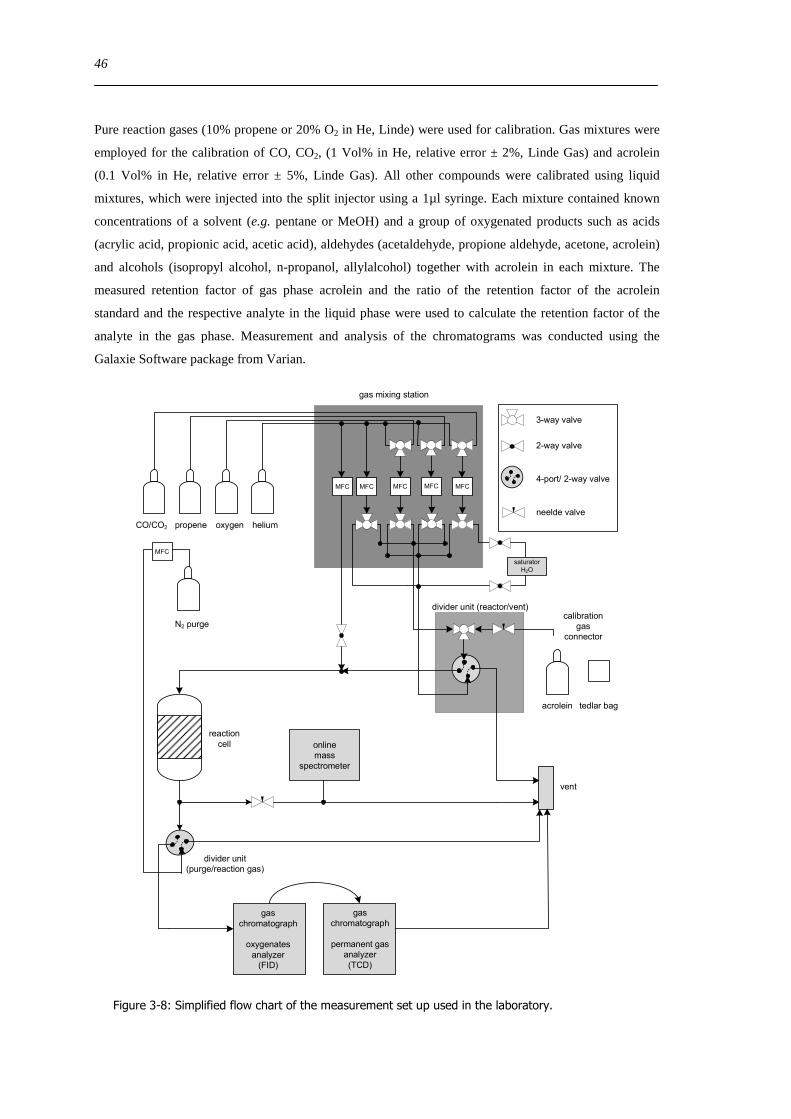
331 Quantitative measurements ndash gas chromatography 45
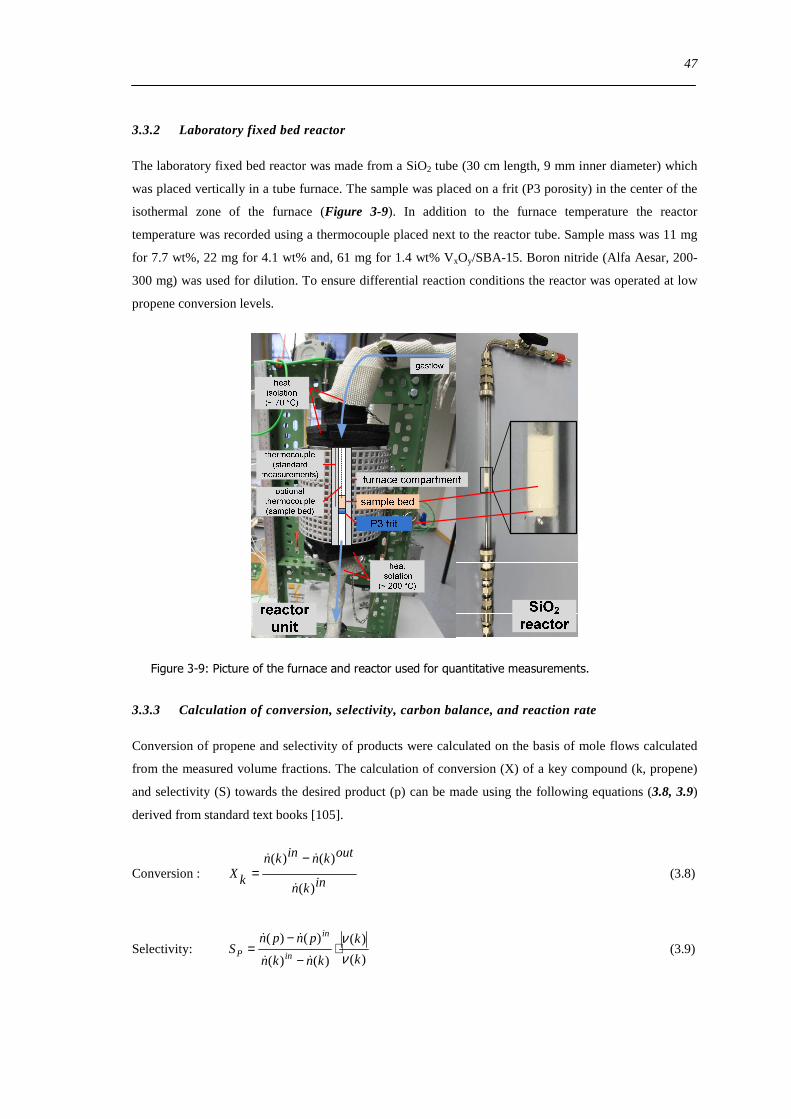
332 Laboratory fixed bed reactor 47
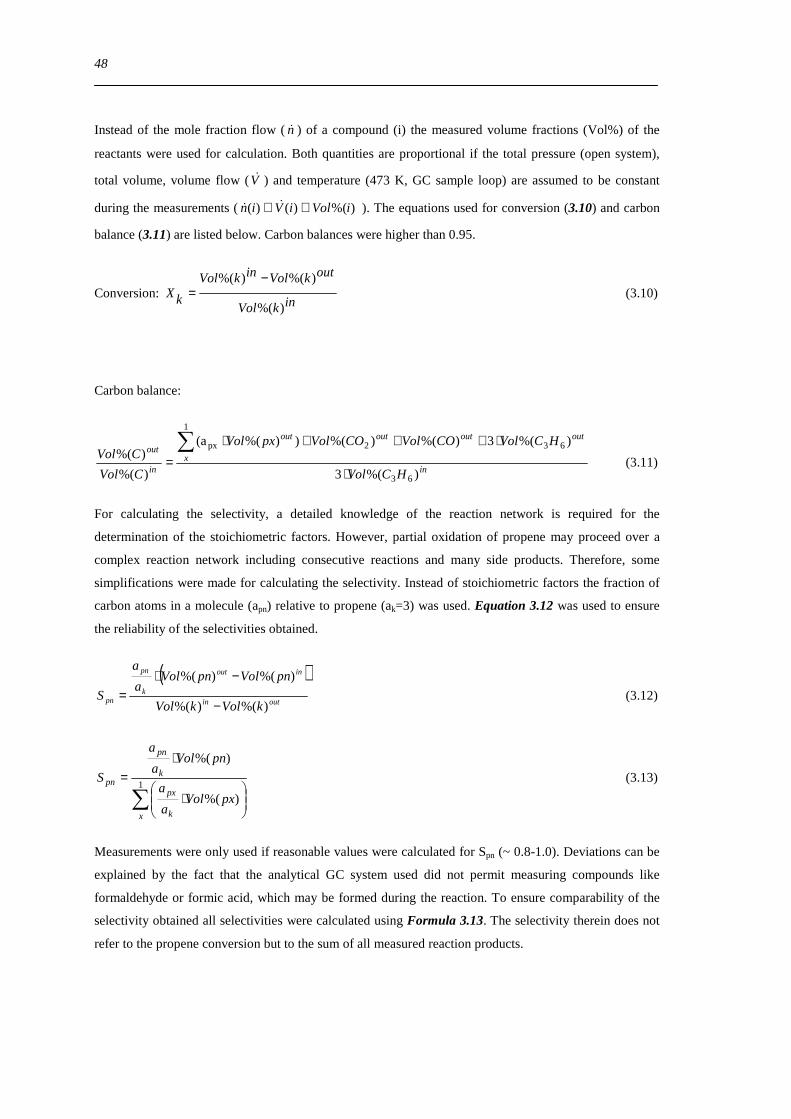
333 Calculation of conversion selectivity carbon balance and reaction rate 47
334 Estimation of mass and heat transport limitations 49
4 Comparison of various preparation methods for the synthesis of supported vanadium oxide catalysts 51
41 Introduction 51
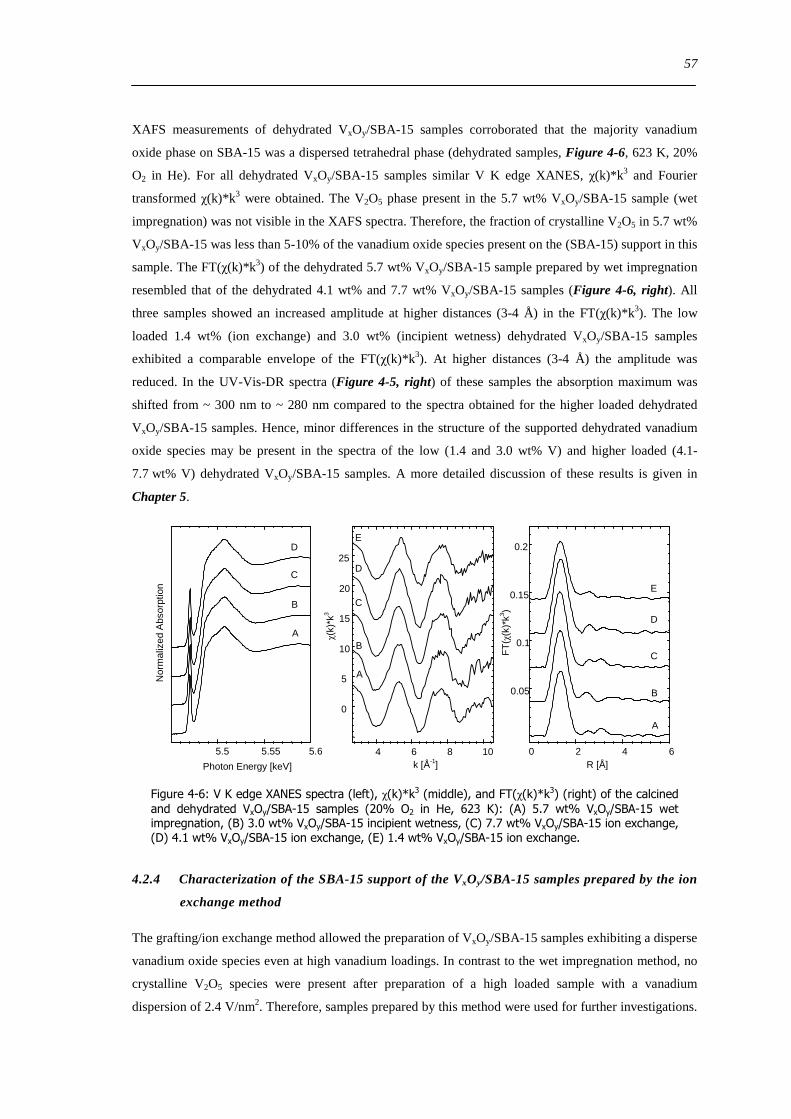
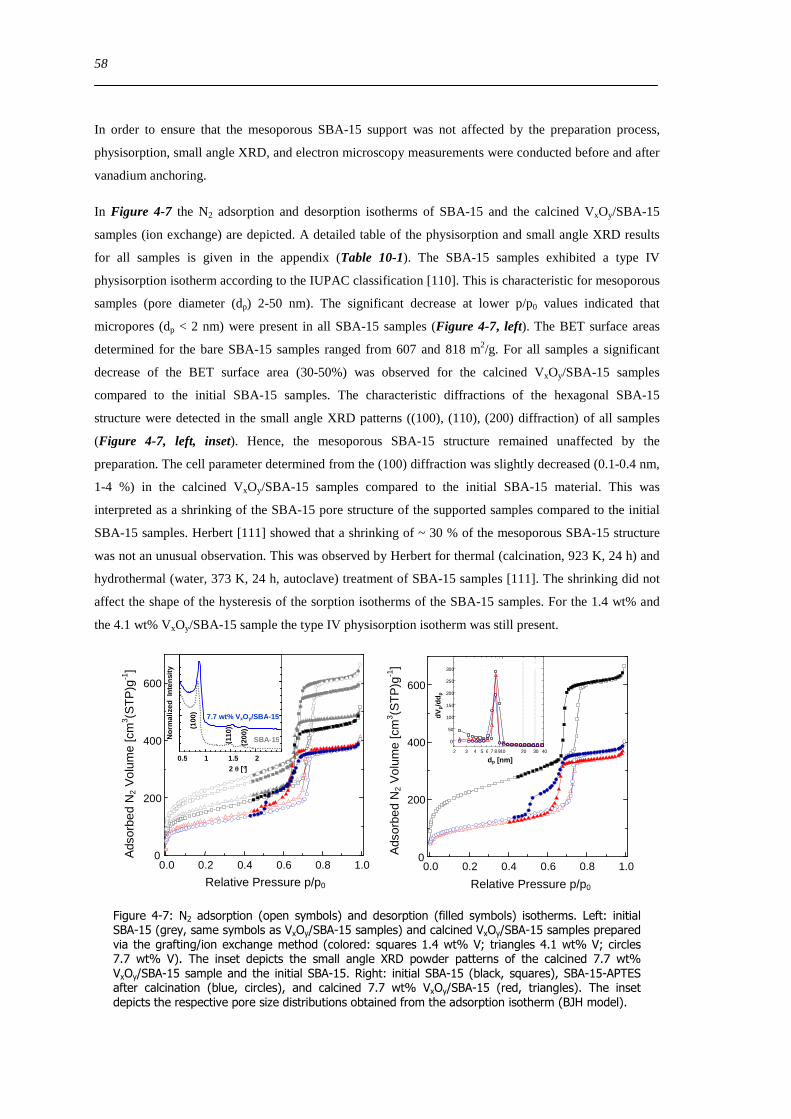
42 Results and discussion 51
421 Surface area and vanadium content of the VxOySBA-15 samples 51
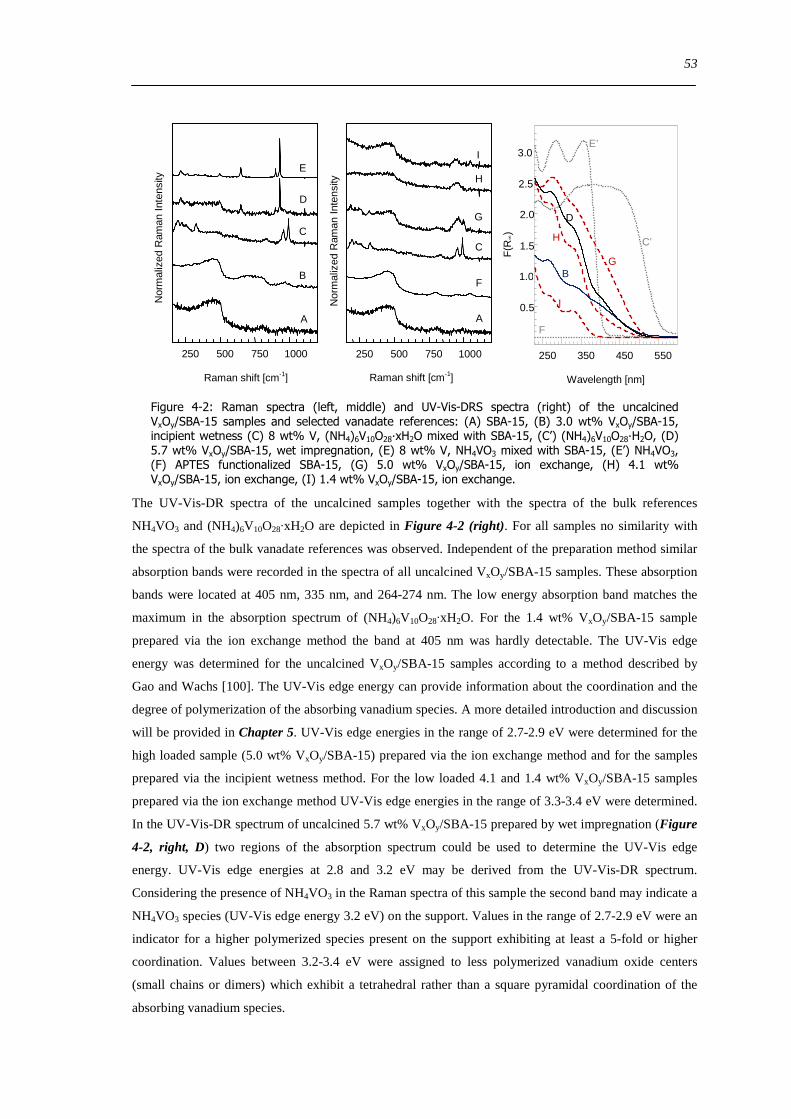
422 Structural characterization of the uncalcined VxOySBA-15 samples 52
423 Vanadium dispersion in the calcined VxOySBA-15 samples 55
424 Characterization of the SBA-15 support of the VxOySBA-15 samples prepared by the ion exchange method 57
43 Summary 60
5 Structural characterization of hydrated and dehydrated VxOySBA-15 63
51 Introduction 63
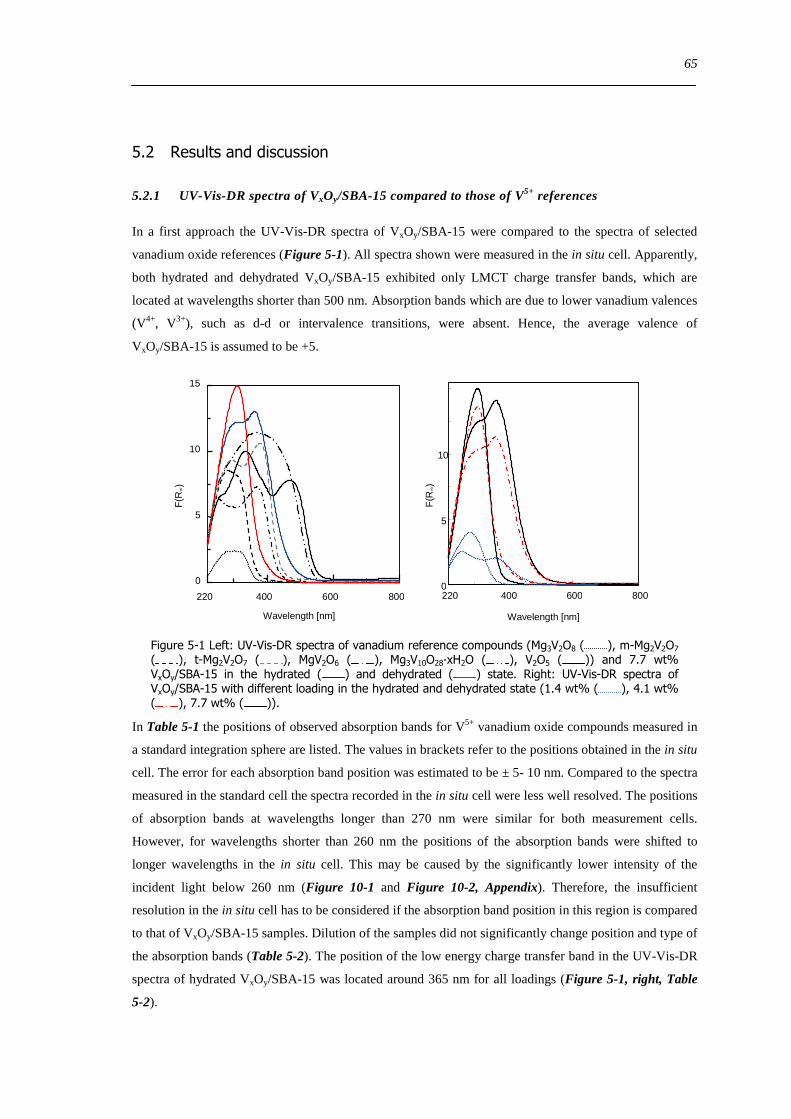
52 Results and discussion 65
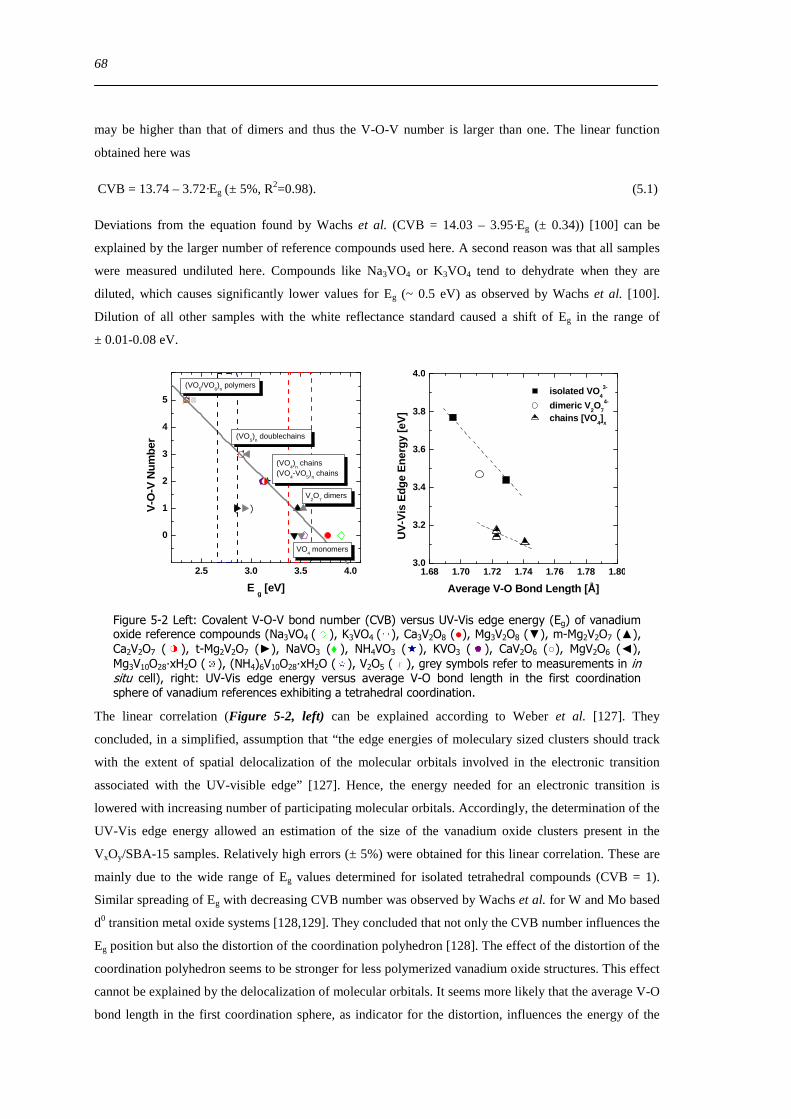
521 UV-Vis-DR spectra of VxOySBA-15 compared to those of V5+ references 65
522 Correlation of the UV-Vis-DRS edge energy Eg with the local structure of vanadium oxide references 67
523 UV-Vis Eg- indicator for the local structure of hydrated and dehydrated VxOySBA-15 69
524 XANES analysis ndash coordination and distortion of V species in VxOySBA-15 70
525 Local structure of dehydrated VxOySBA-15 ndash Comparison to V oxide references 72
XI
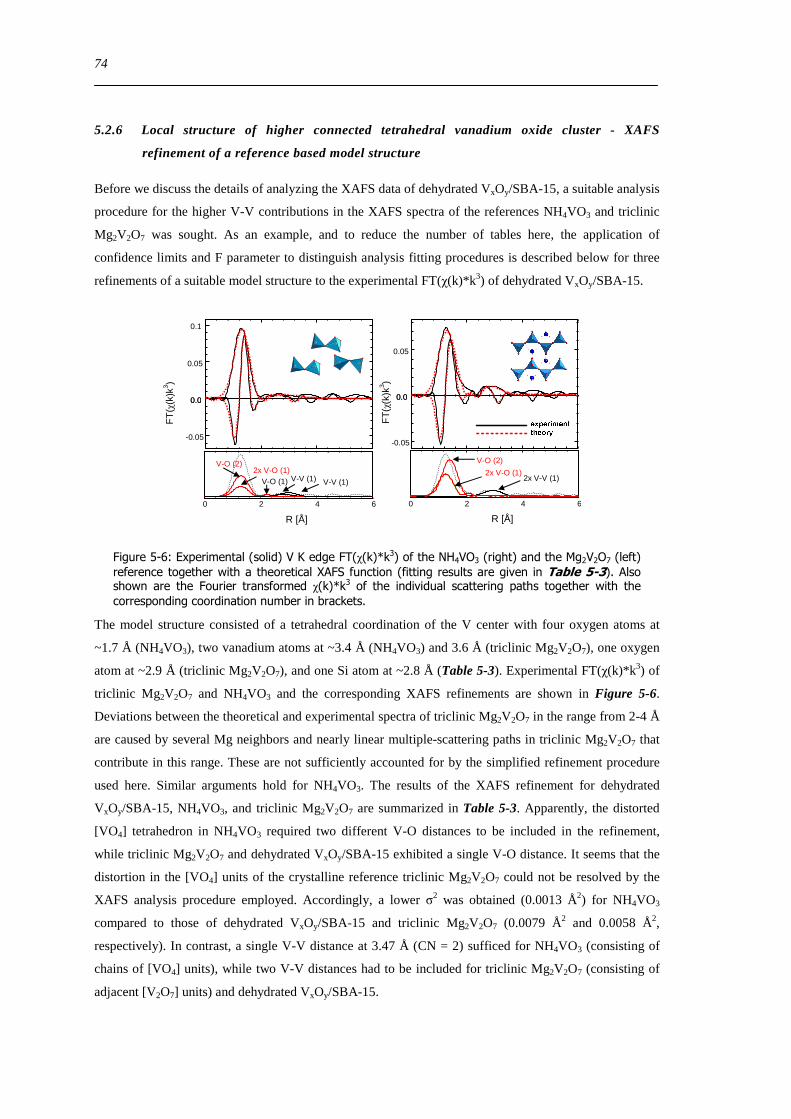
526 Local structure of higher connected tetrahedral vanadium oxide cluster - XAFS refinement of a reference based model structure 74
527 Local structure of dehydrated VxOySBA-15 ndash XAFS refinement of ldquoVO4ldquo based model structures 76
528 Local structure of dehydrated VxOySBA-15 ndash XAFS refinement of ldquoV2O7ldquo based model structures 78
529 Schematic structural representation of dehydrated VxOySBA-15 79
5210 Limitations of the XAFS analysis of dehydrated VxOySBA-15 81
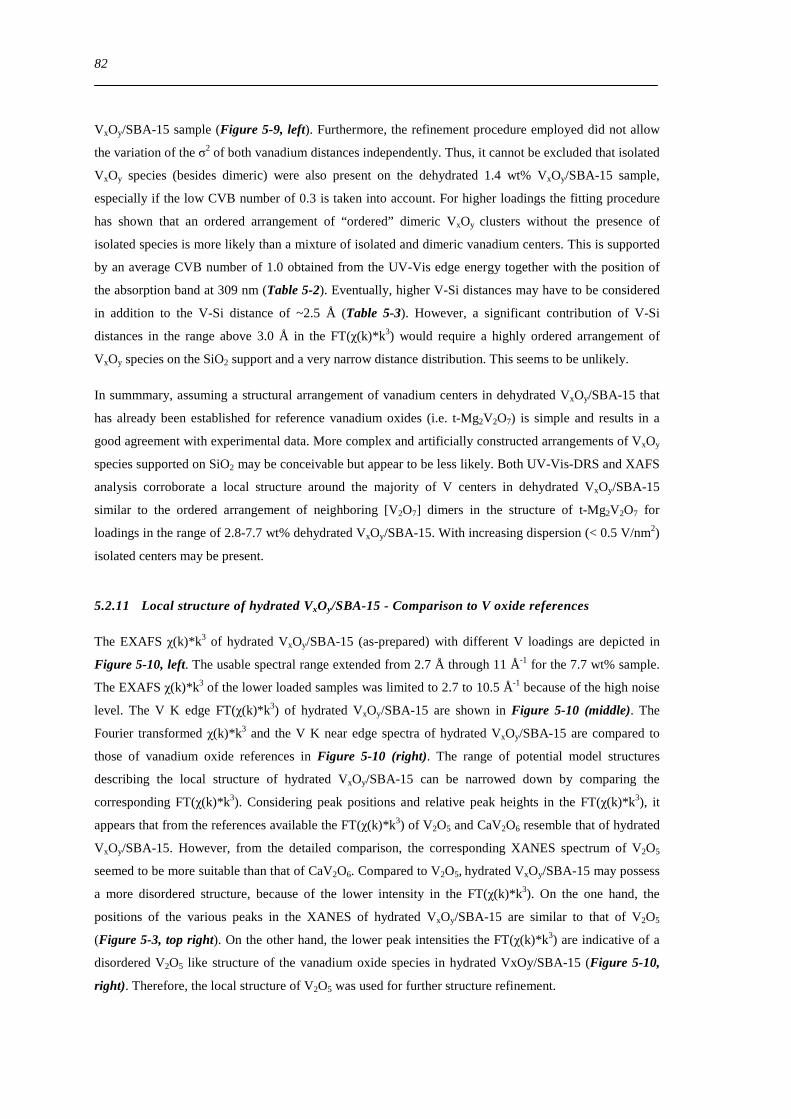
5211 Local structure of hydrated VxOySBA-15 - Comparison to V oxide references 82
5212 Local structure of a square pyramidal vanadium oxide cluster - XAFS refinement of a ldquoV 2O5ldquo model structure 83
5213 Local structure of hydrated VxOySBA-15 ndash XAFS refinement of a ldquoV2O5ldquo based model structure 85
53 Summary 88
6 Dynamic changes in the local structure of VxOySBA-15 model catalysts in oxidative and water saturated atmospheres 89
61 Introduction 89
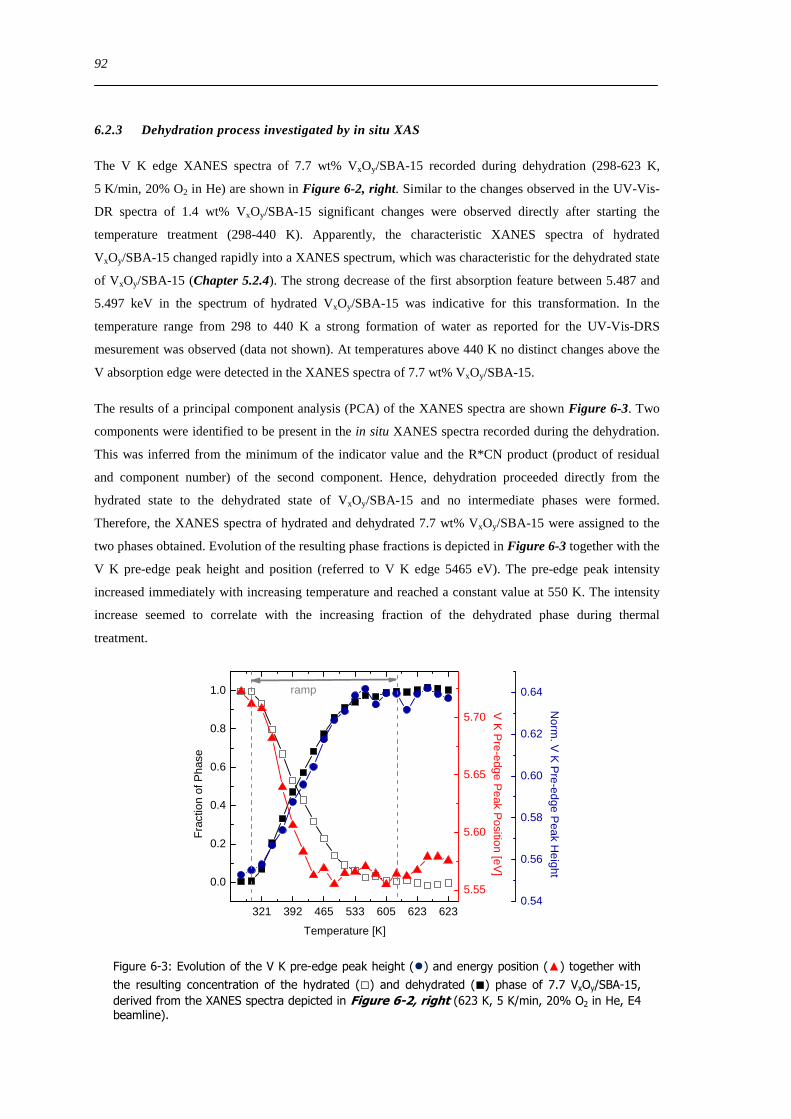
62 Results and discussion 90
621 Impact of pretreatment temperature on dehydrated VxOySBA-15 phase 90
622 Dehydration process investigated by in situ UV-Vis-DRS 91
623 Dehydration process investigated by in situ XAS 92
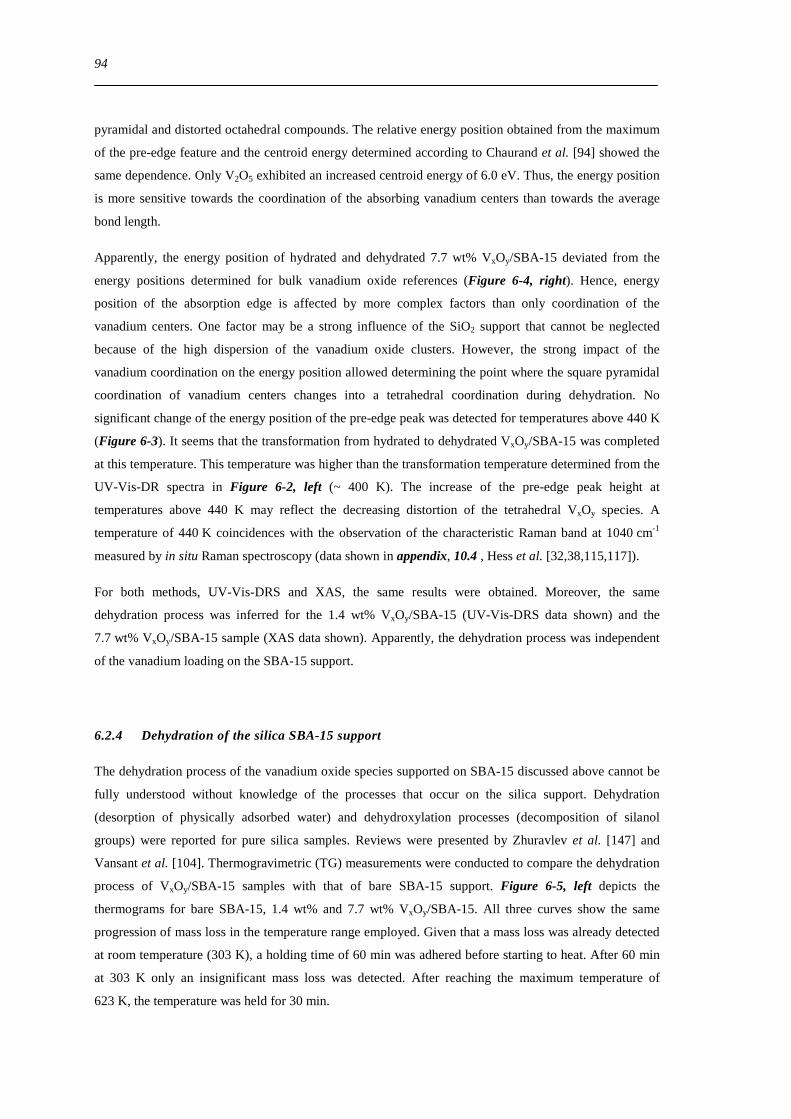
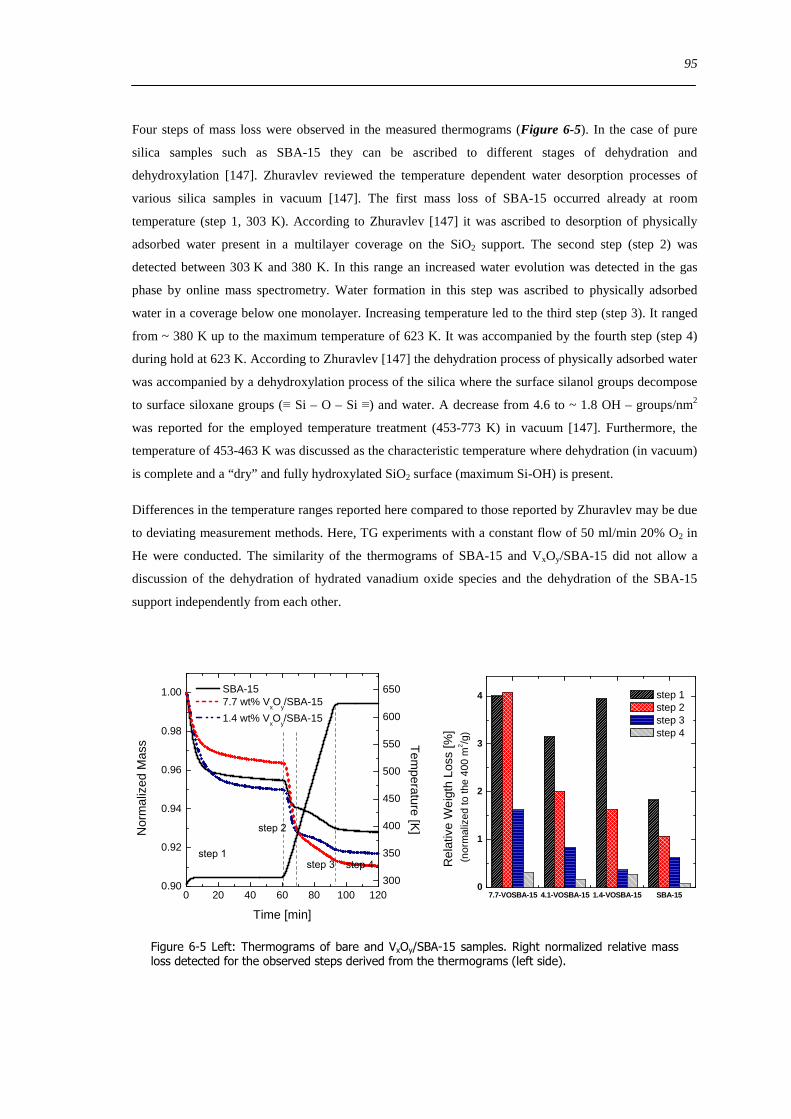
624 Dehydration of the silica SBA-15 support 94
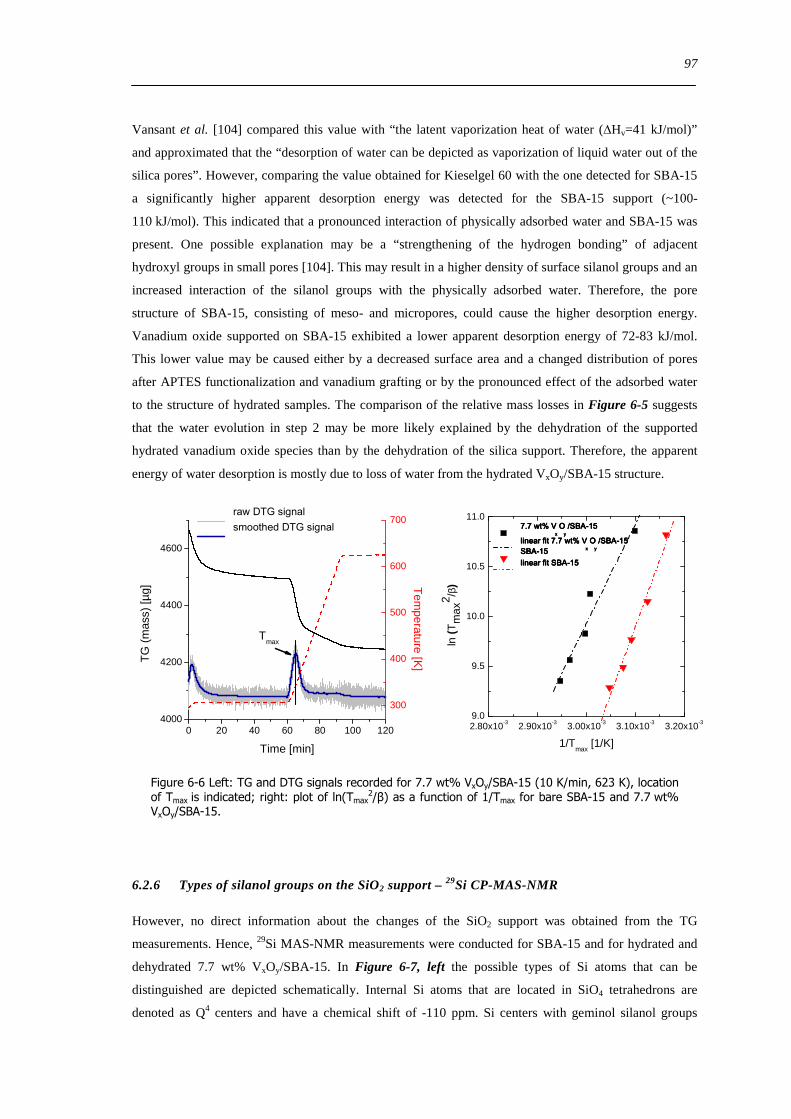
625 Determination of the apparent activation energy of water desorption - ED 96
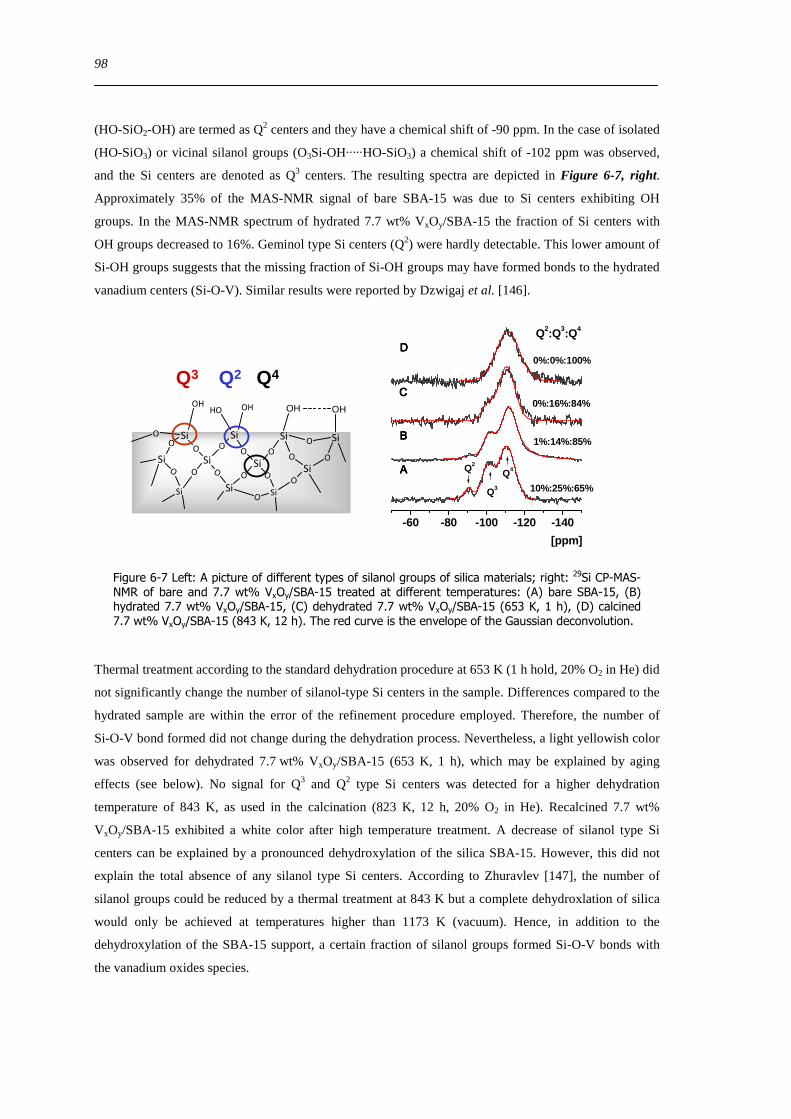
626 Types of silanol groups on the SiO2 support ndash 29Si CP-MAS-NMR 97
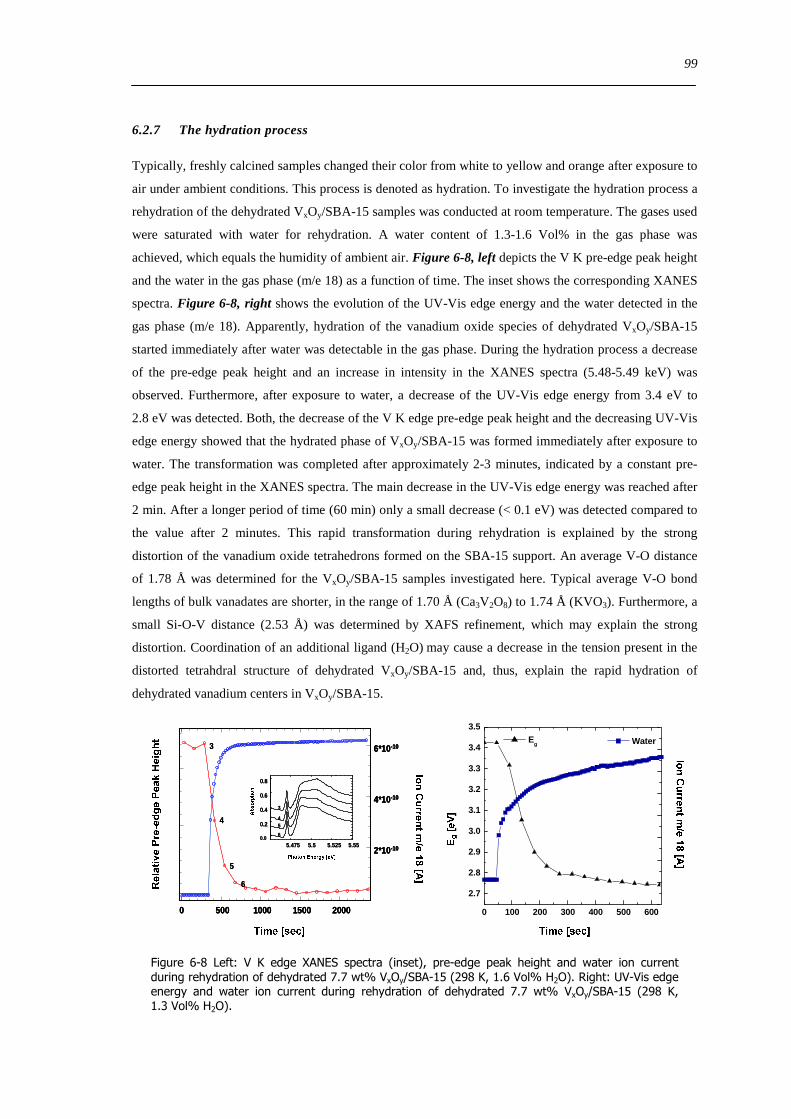
627 The hydration process 99
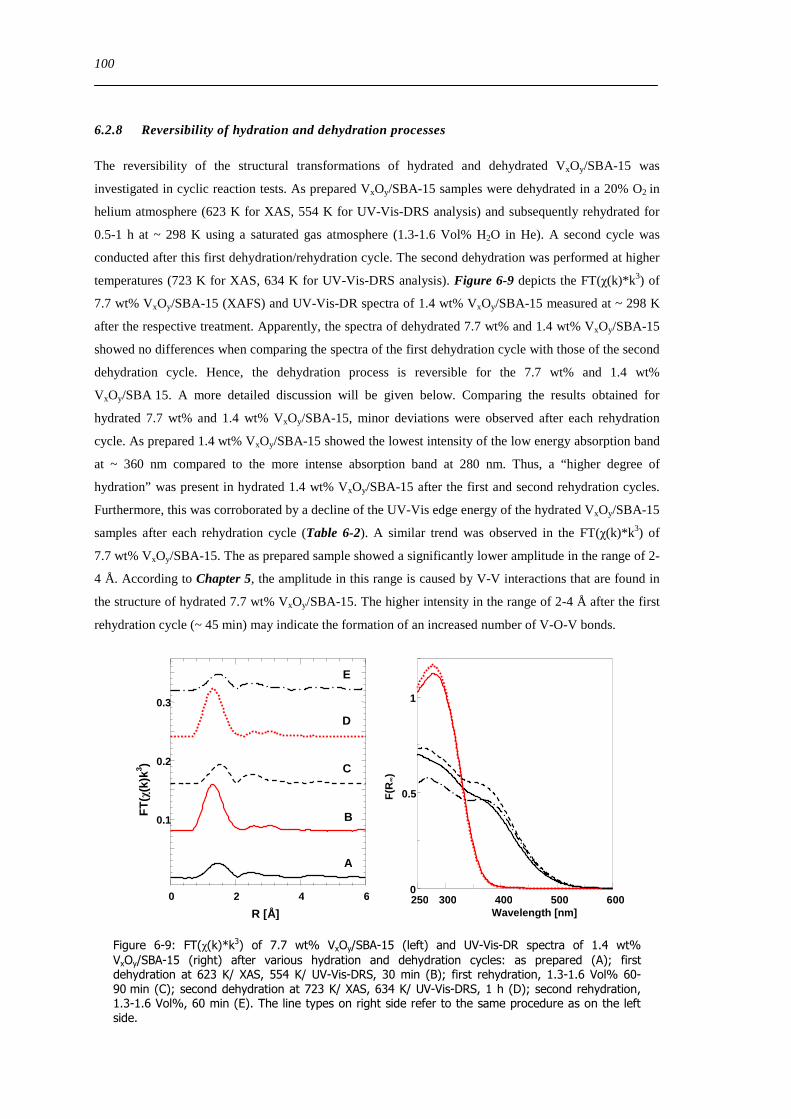
628 Reversibility of hydration and dehydration processes 100
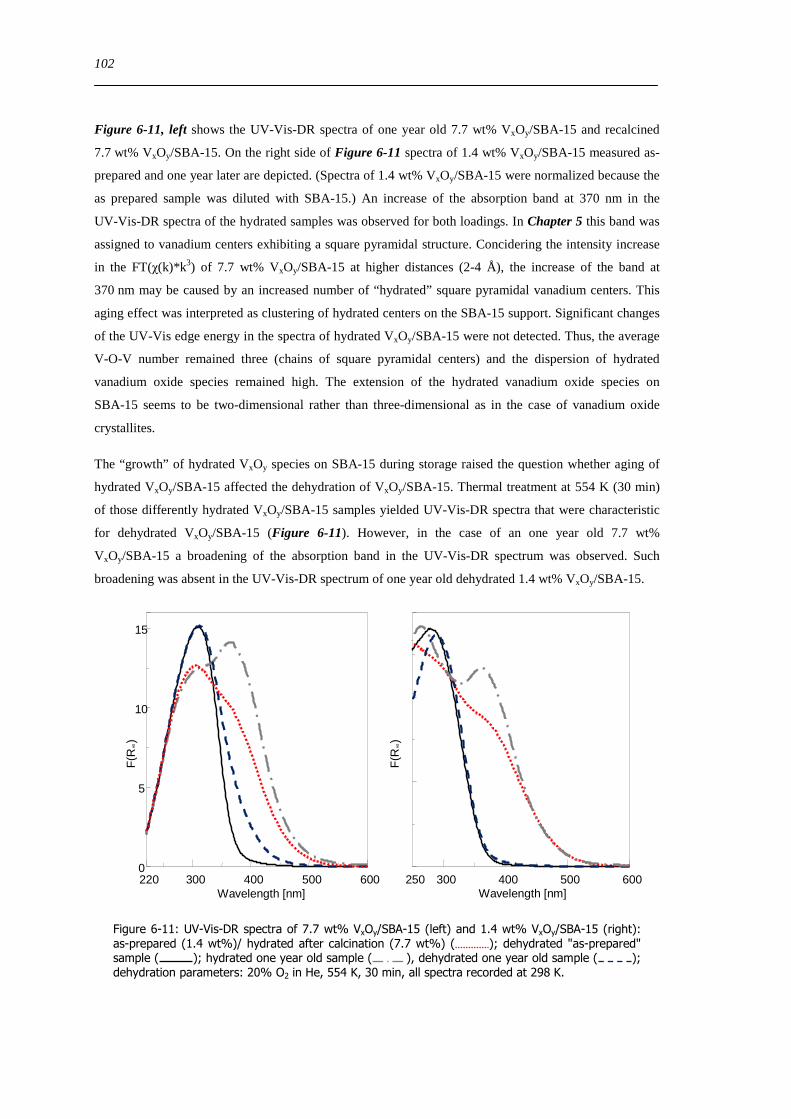
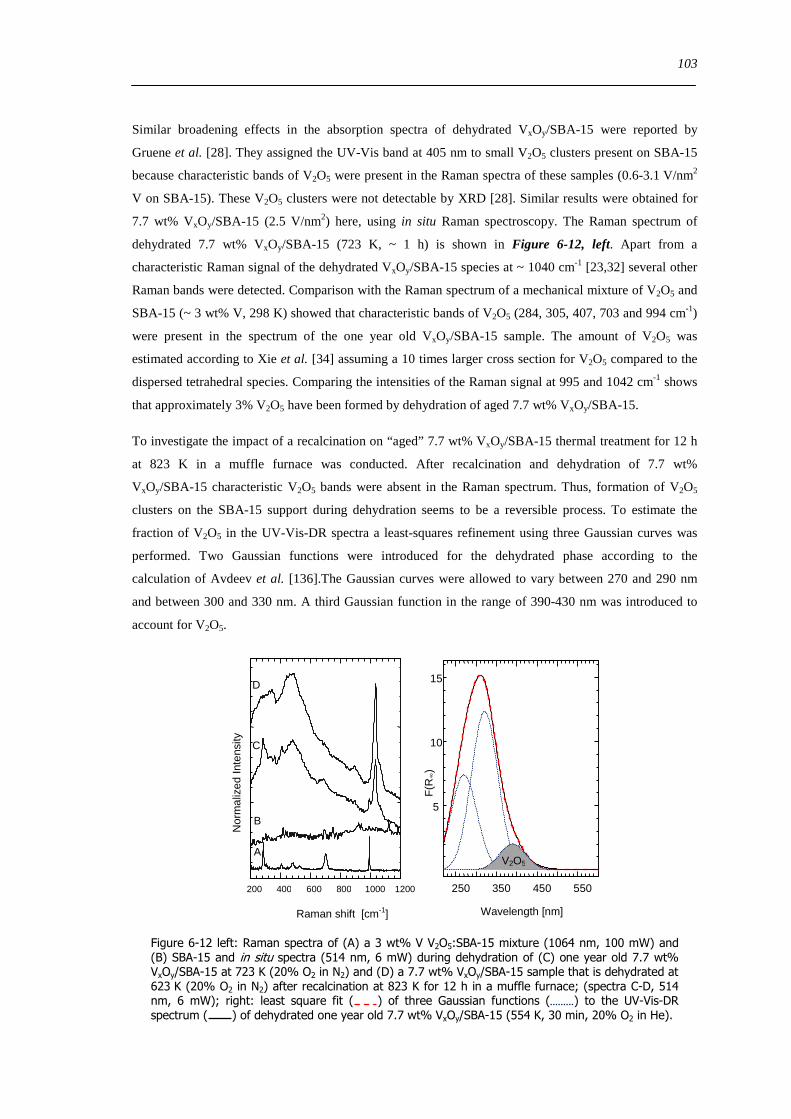
629 Impact of aging on the structure of VxOySBA-15 101
6210 Dehydration in water saturated atmospheres 105
63 Concluding remarks on the hydration and dehydration of VxOySBA-15 108
631 Coordination of hydrated VxOySBA-15 108
632 Impact of coordinated water on hydrated VxOySBA-15 109
633 Formation of dehydrated VxOySBA-15 110
634 Formation of V2O5 crystallites versus dispersion during dehydration 111
635 Number of V-O-Si bonds ndash Is a O=V[O-Si]3 species possible 112
636 Effect of water on the dehydration process 112
64 Summary 114
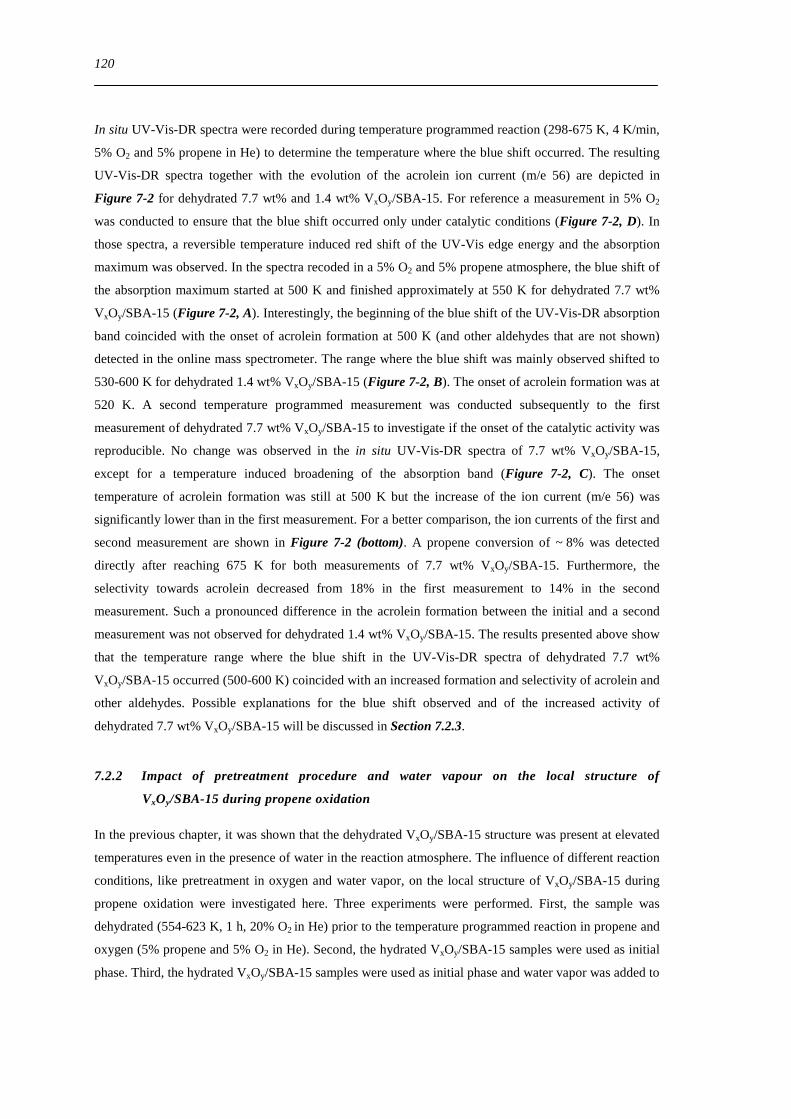
7 Structural evolution and reactivity of VxOySBA-15 catalysts under propene oxidizing conditions 115
71 Introduction 115
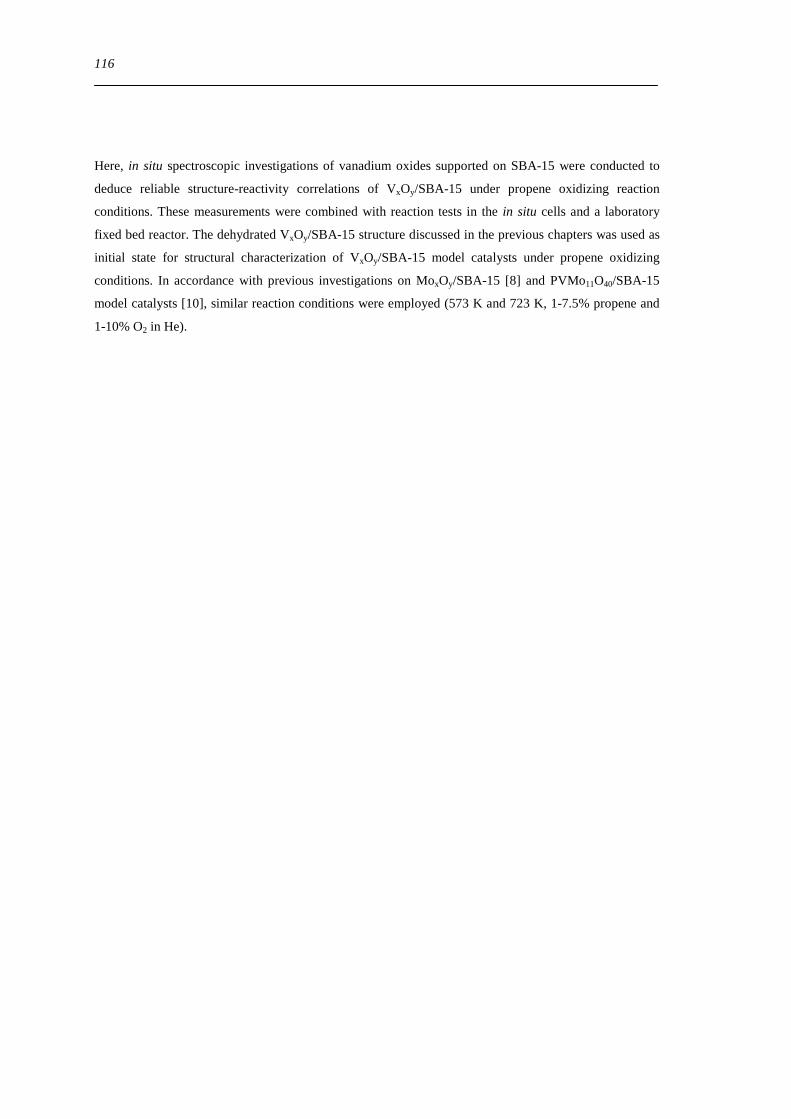
72 Results and discussion 117
721 Local structure of VxOySBA-15 under propene oxidation 117
XII
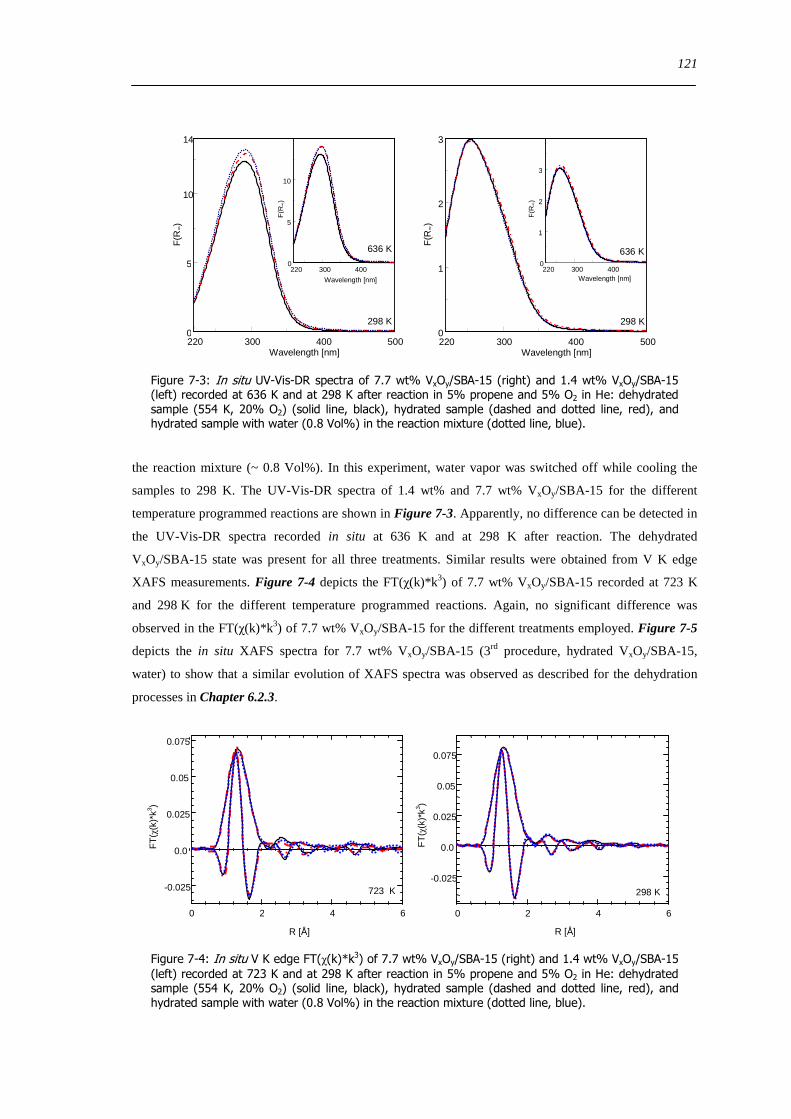
722 Impact of pretreatment procedure and water vapour on the local structure of VxOySBA-15 during propene oxidation 120
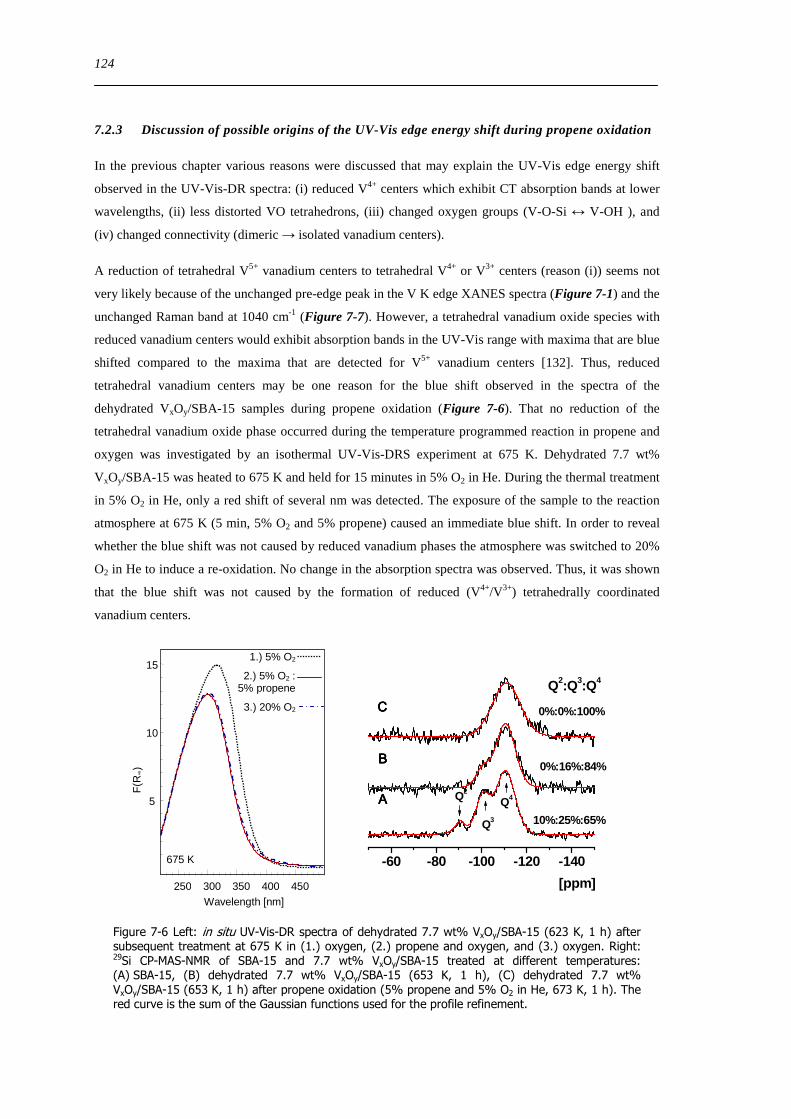
723 Discussion of possible origins of the UV-Vis edge energy shift during propene oxidation 124
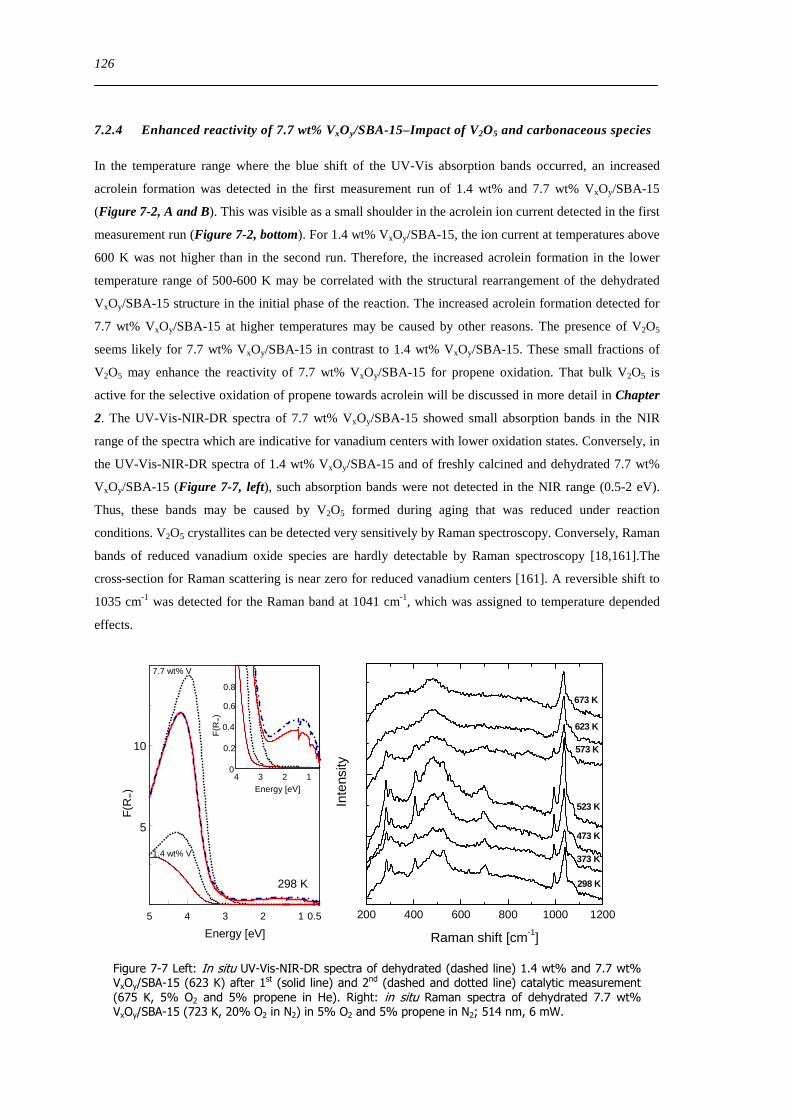
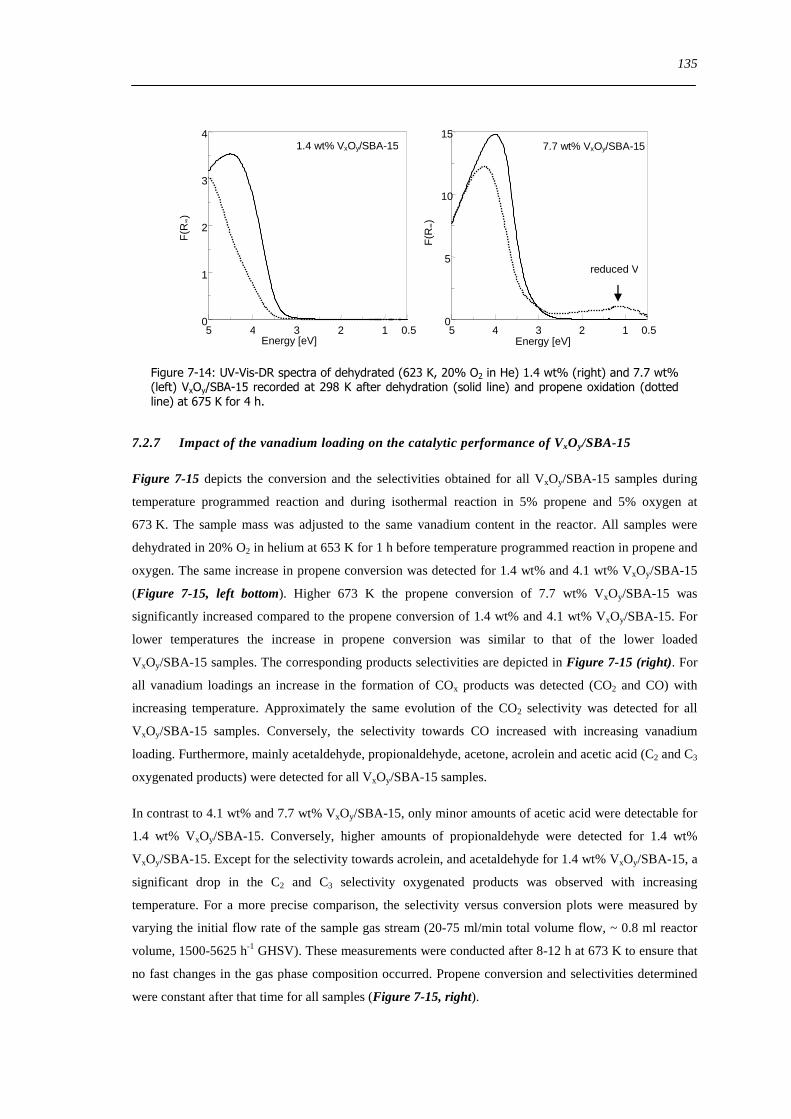
724 Enhanced reactivity of 77 wt VxOySBA-15ndashImpact of V2O5 and carbonaceous species 126
725 Evaluation of the different reactor types for quantitative catalytic measurements 128
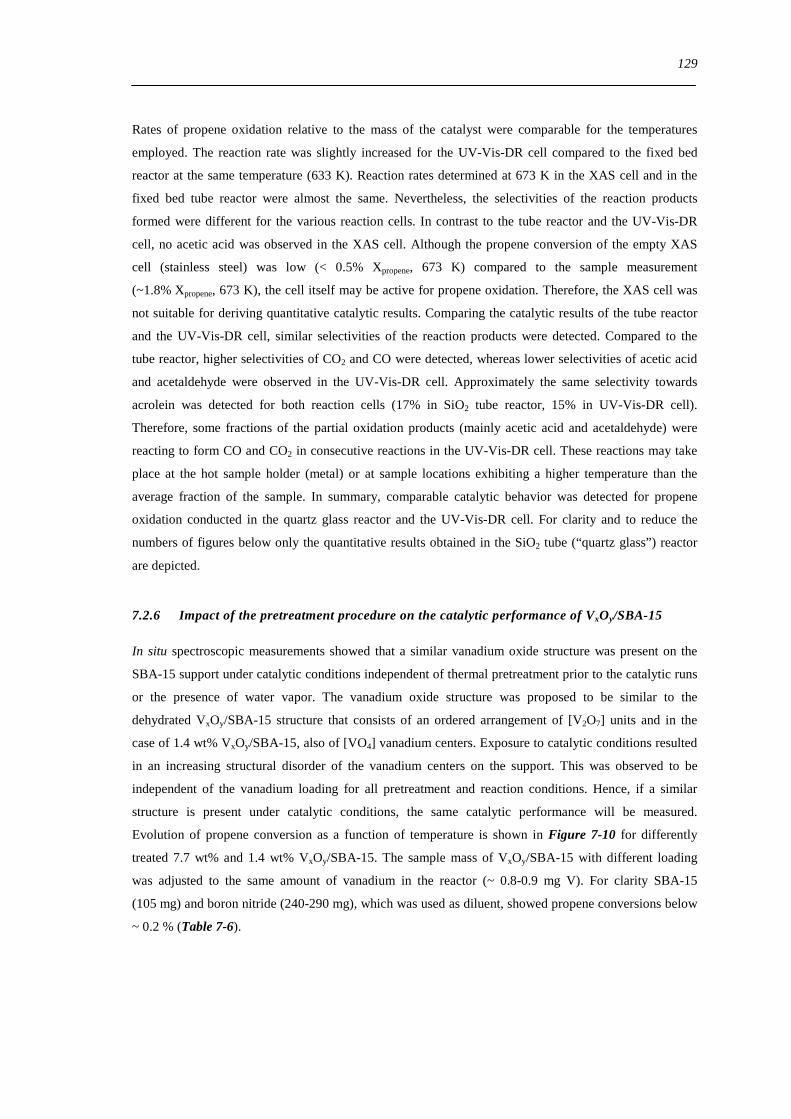
726 Impact of the pretreatment procedure on the catalytic performance of VxOySBA-15 129
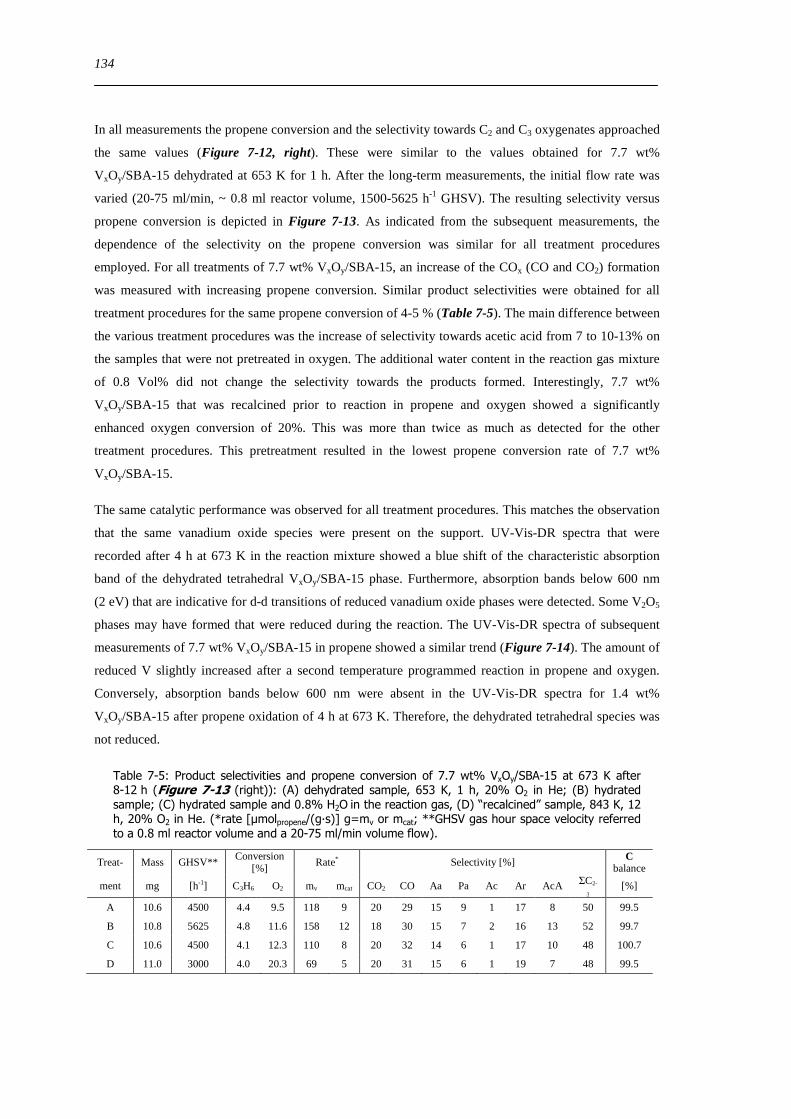
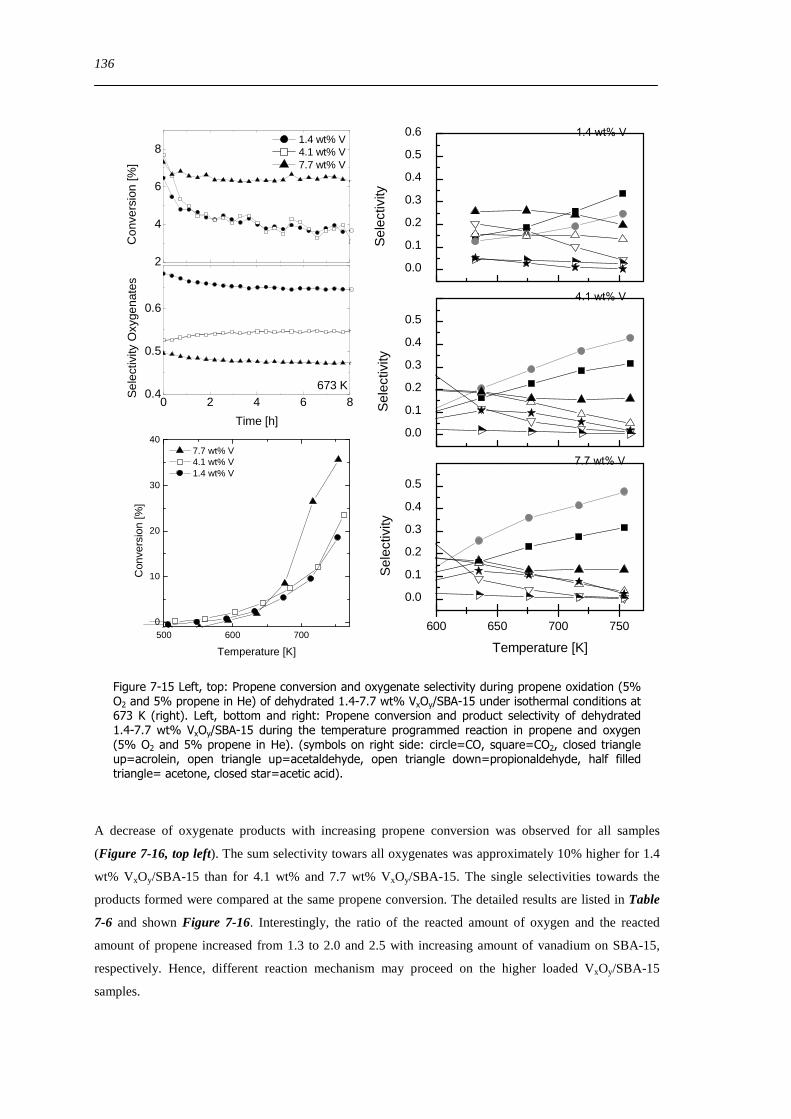
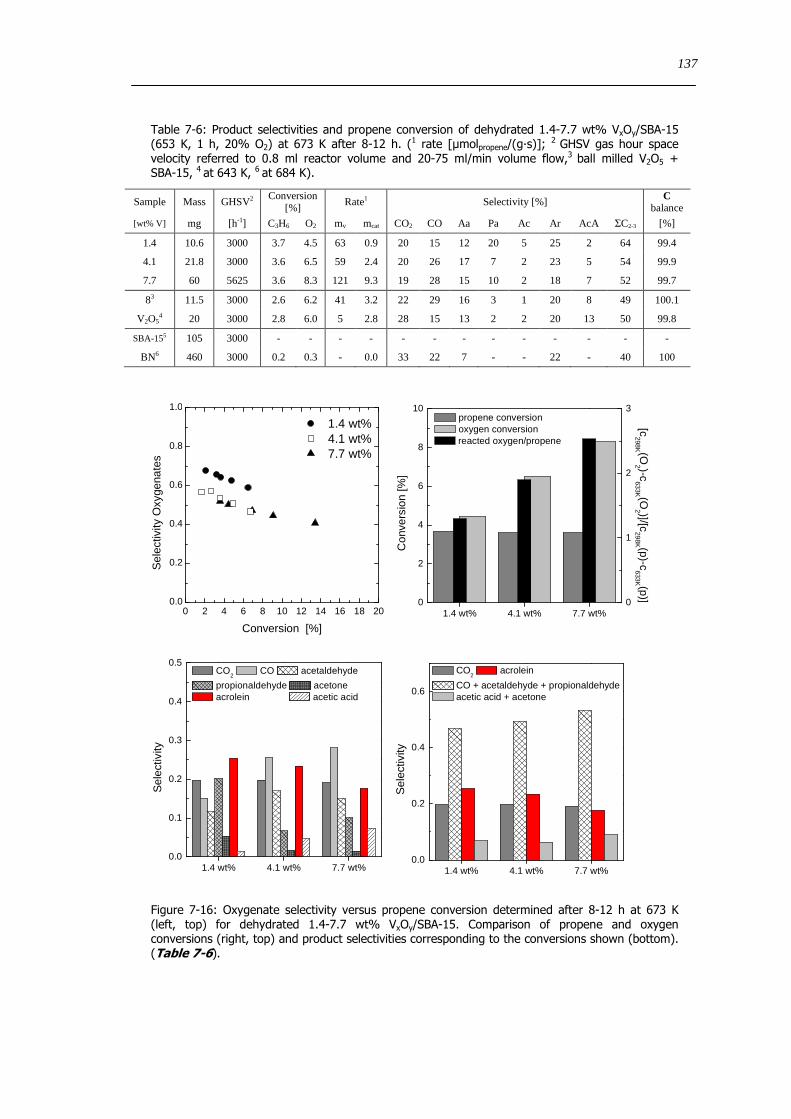
727 Impact of the vanadium loading on the catalytic performance of VxOySBA-15 135
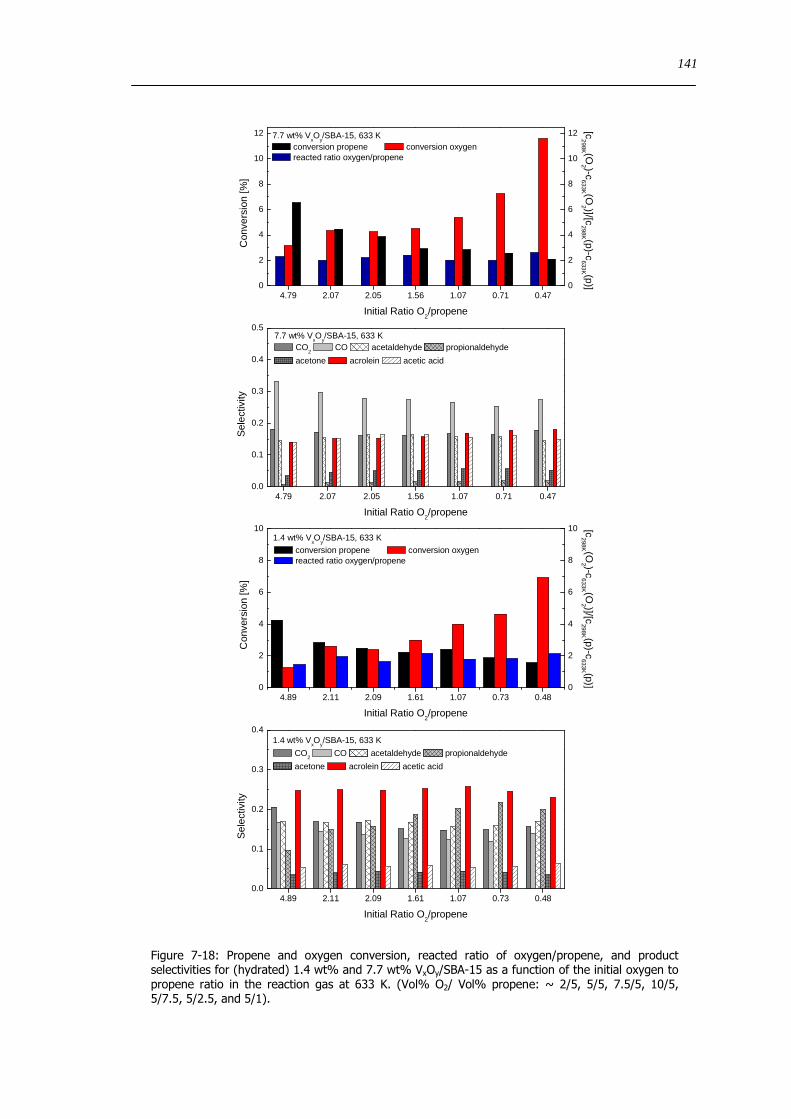
728 The influence of the oxygen and propene concentration on the catalytic performance of VxOySBA-15 140
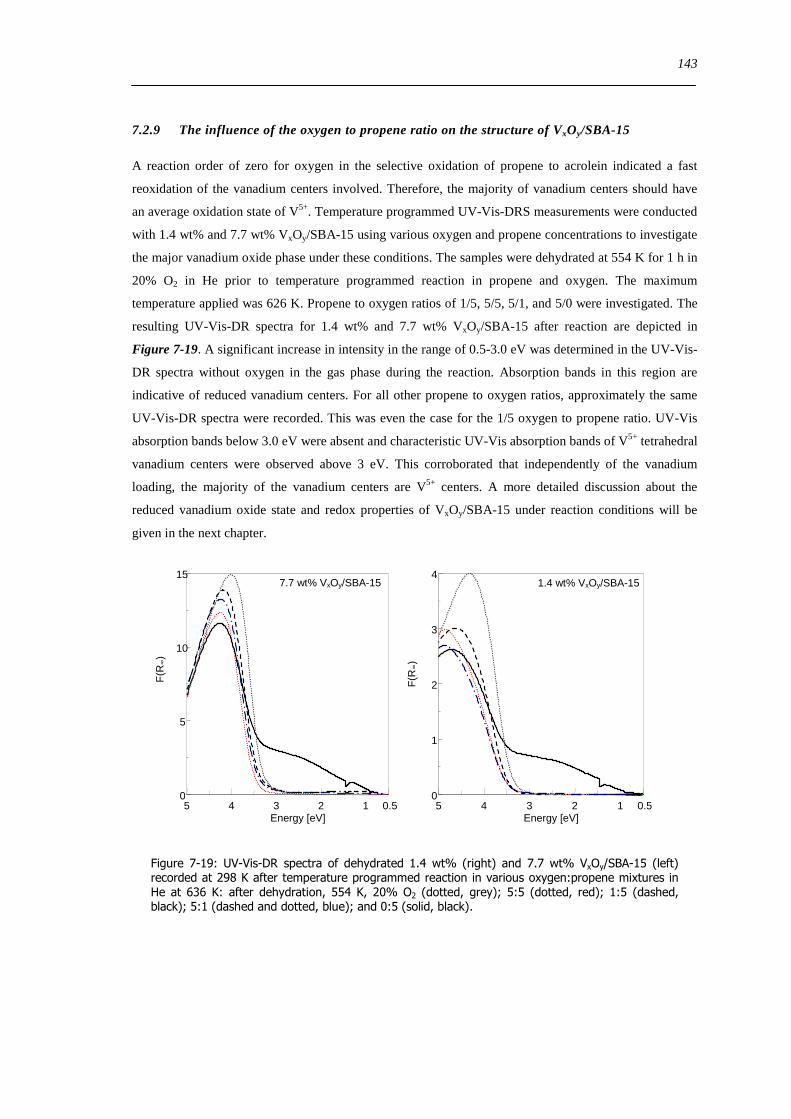
729 The influence of the oxygen to propene ratio on the structure of VxOySBA-15 143
73 Concluding remarks on the catalytic performance and the structural evolution of VxOySBA-15 during catalytic propene oxidation 144
731 Structural evolution of VxOySBA-15 during propene oxidation 144
732 Catalytic performance of VxOySBA-15 during propene oxidation 145
733 Impact of vanadium loading on the catalytic performance of VxOySBA-15 146
734 Selective oxidation of propene to acrolein on isolated ldquoVO4rdquo centers 146
735 Elucidation of structure-activity correlations with respect to other model systems 147
74 Summary 148
8 Investigation of reducibility and re-oxidation of VxOy-SBA-15 catalysts 151
81 Introduction 151
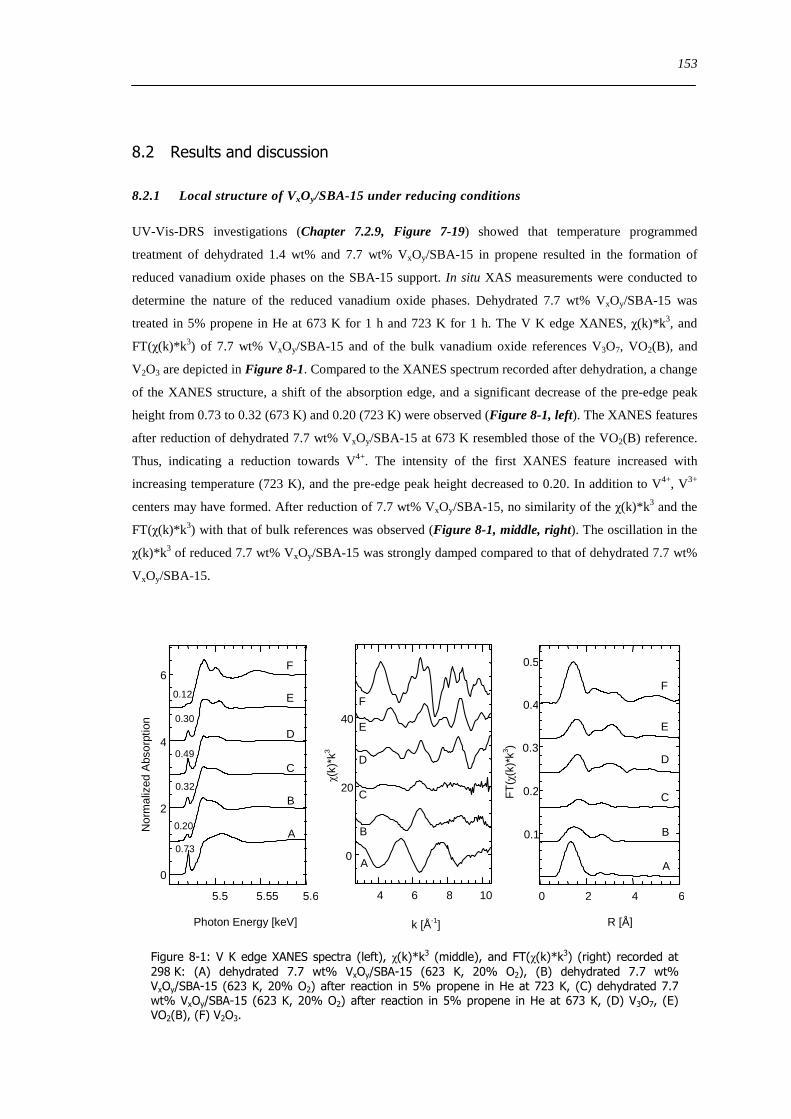
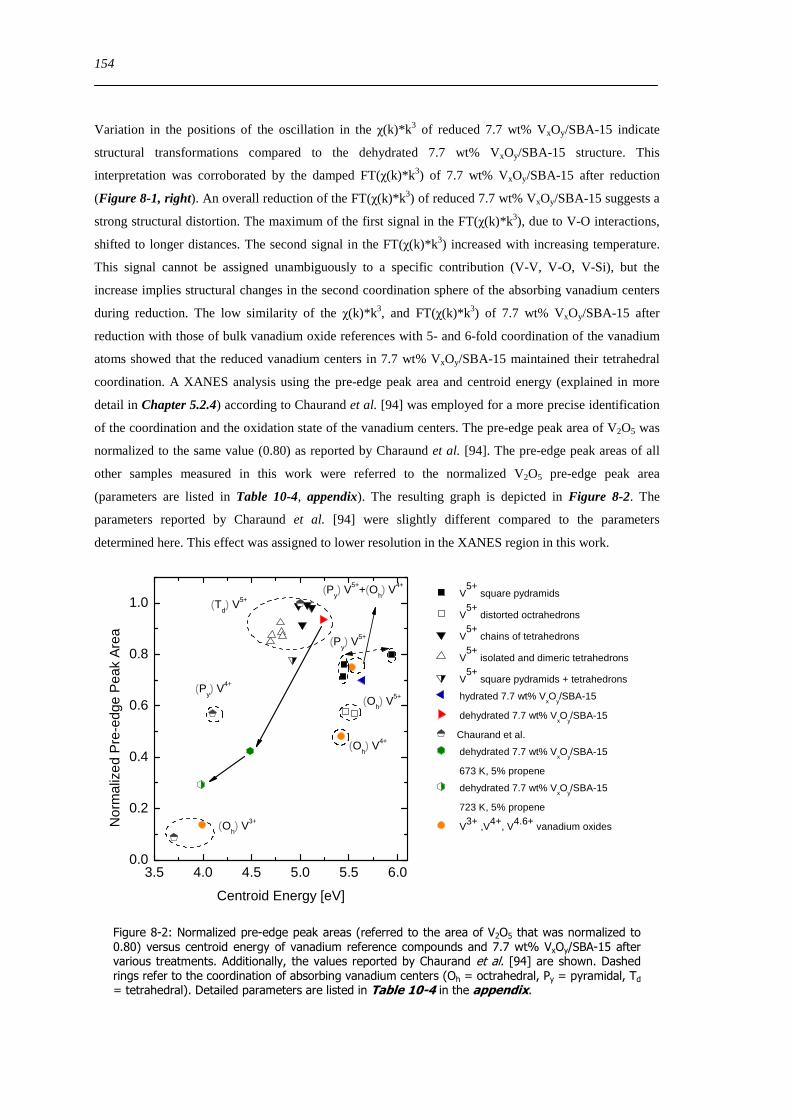
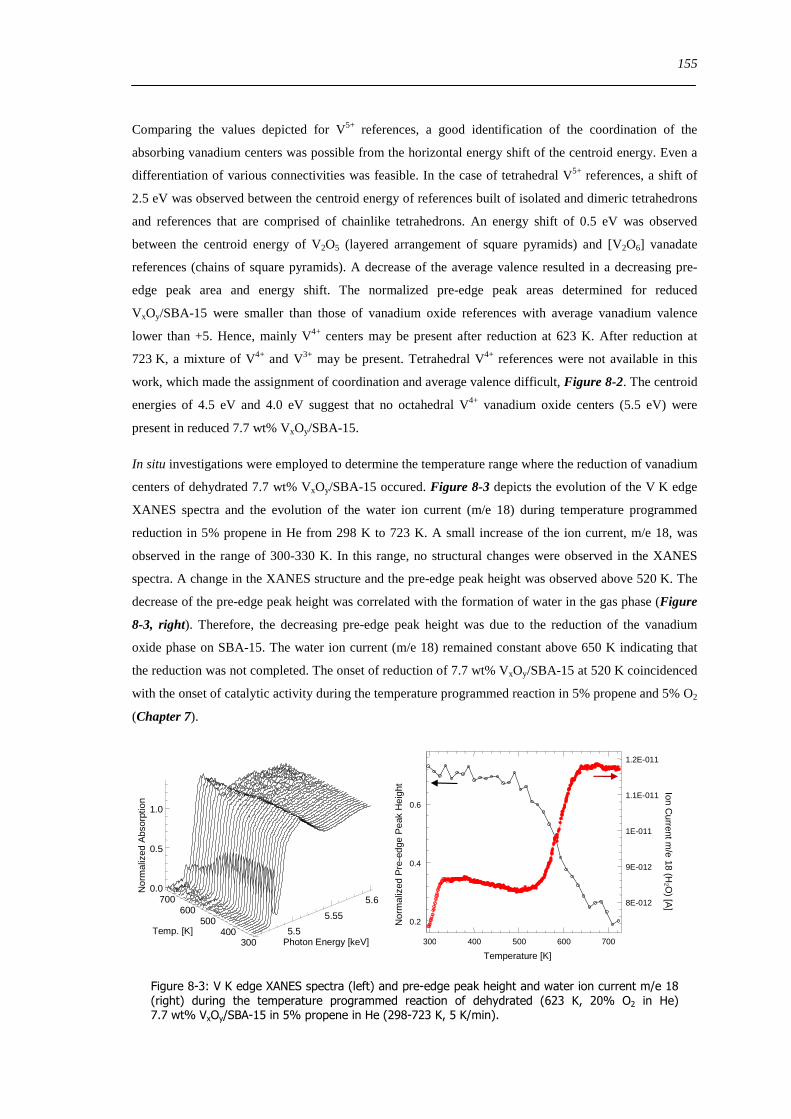
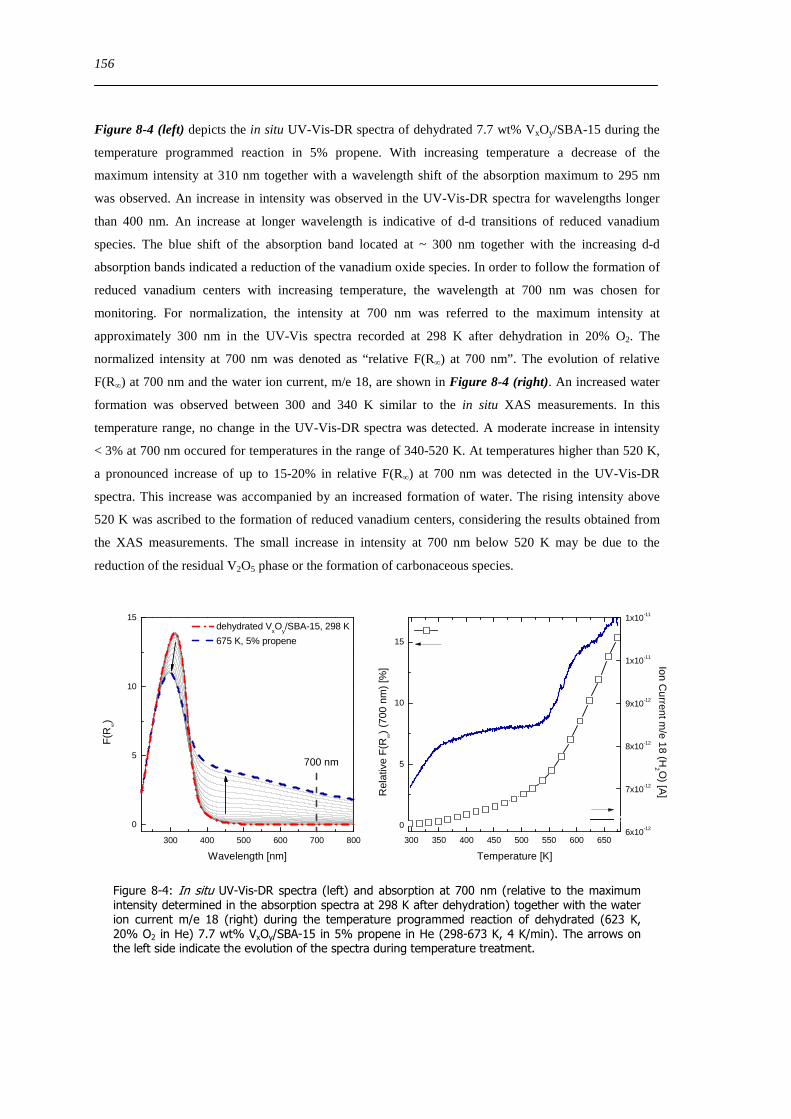
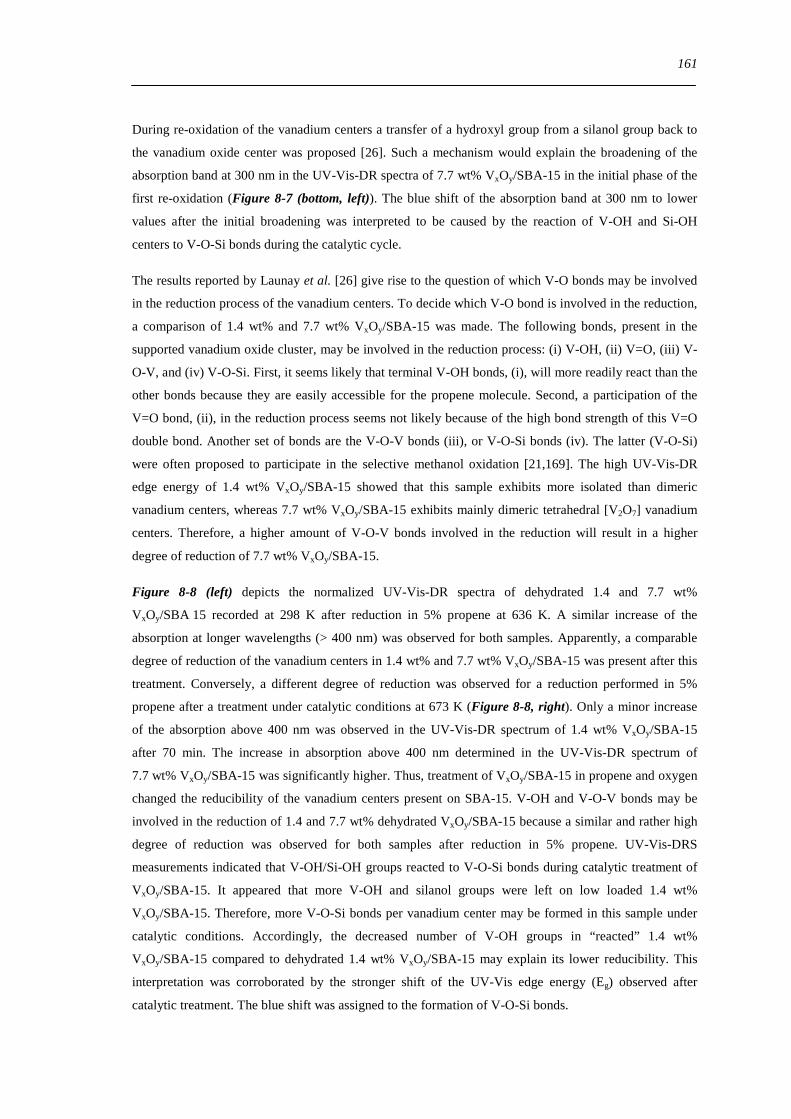
82 Results and discussion 153
821 Local structure of VxOySBA-15 under reducing conditions 153
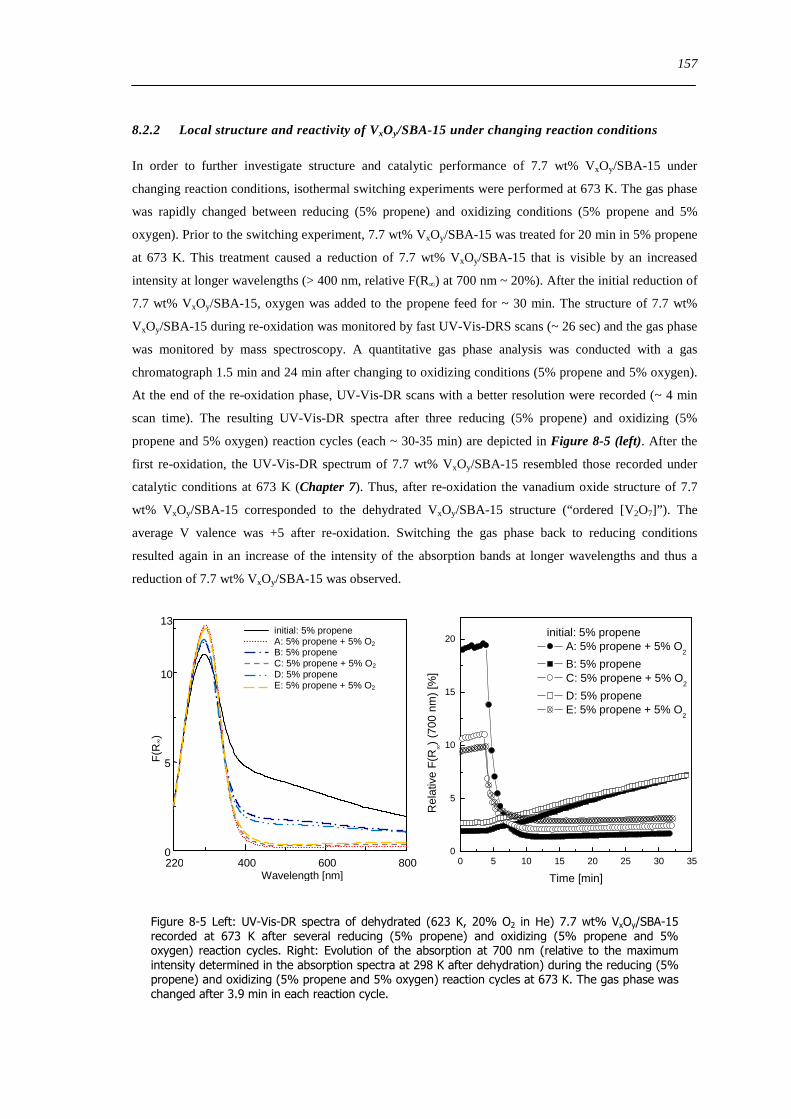
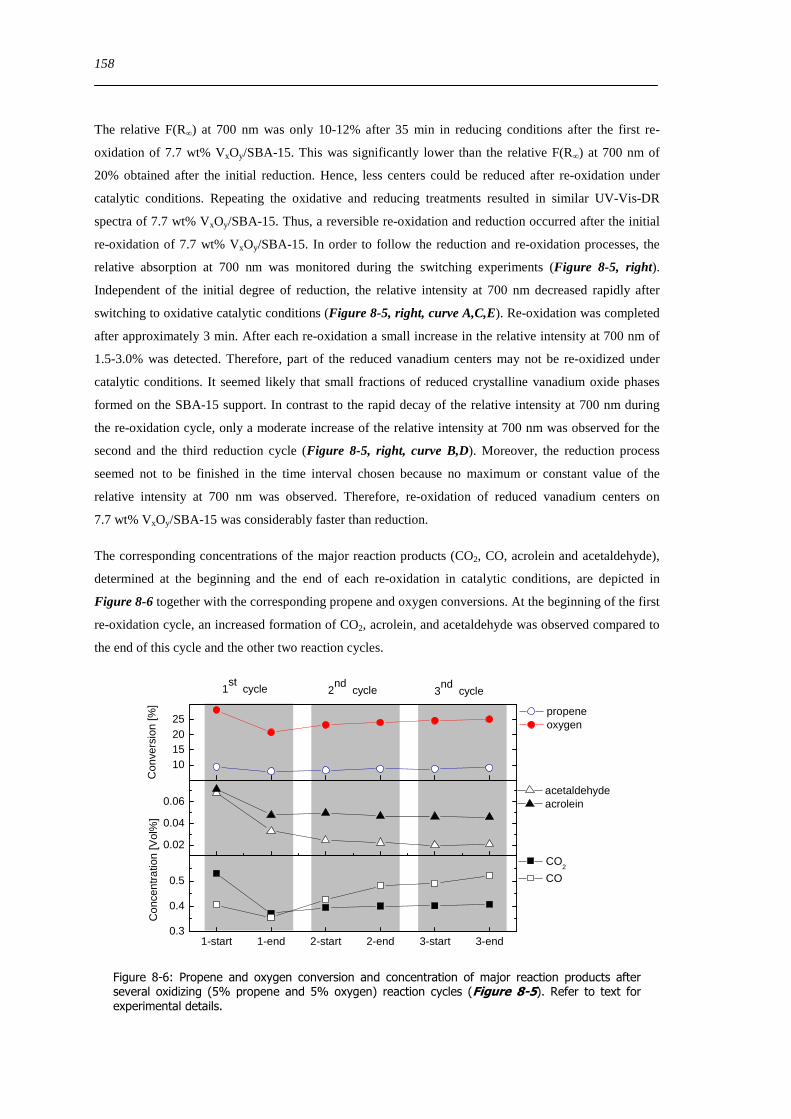
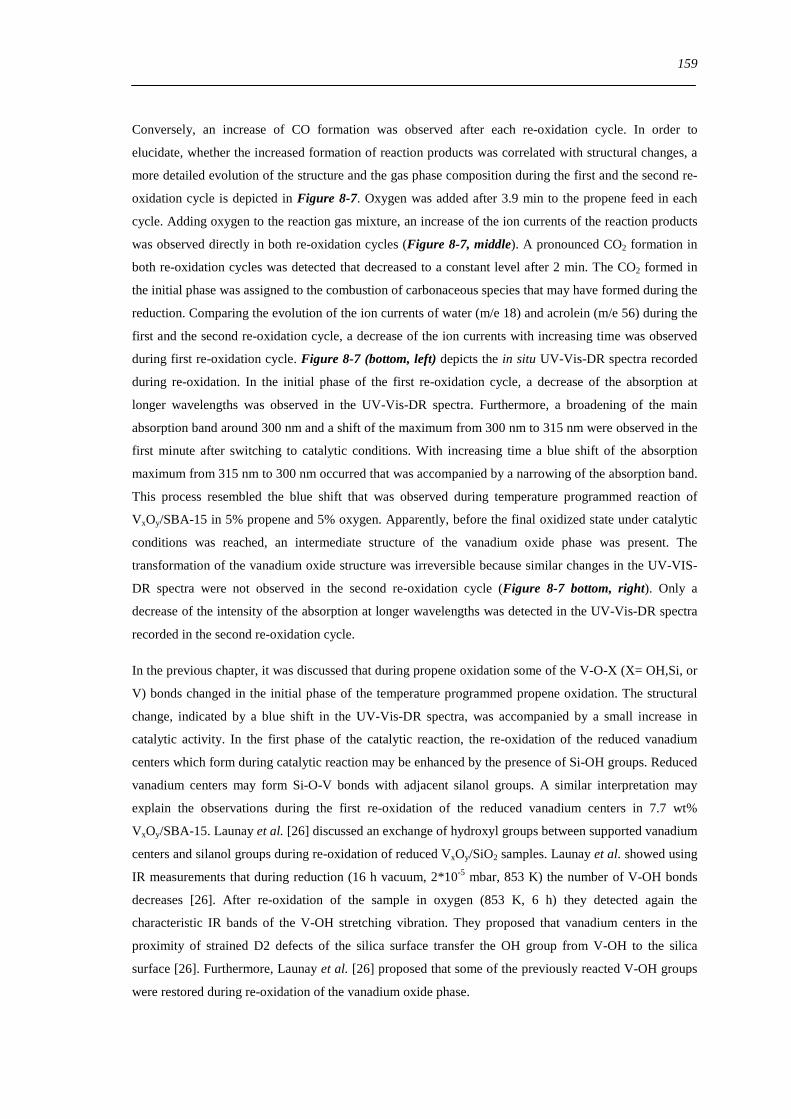
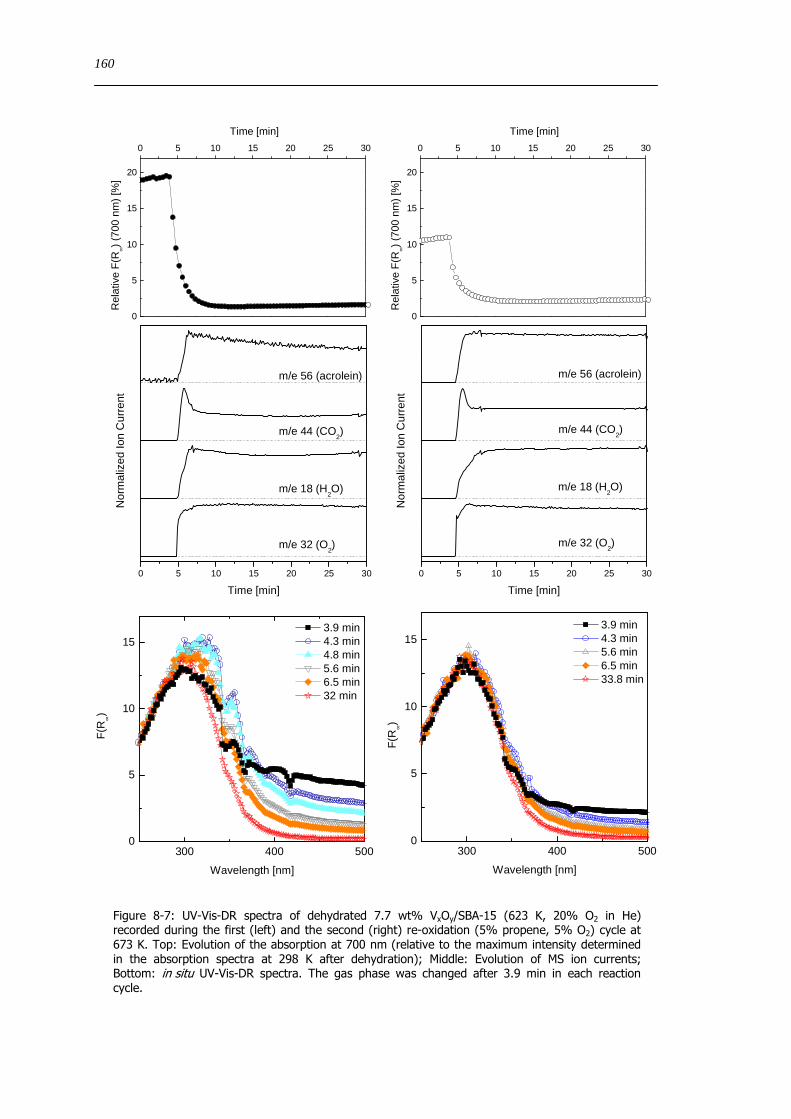
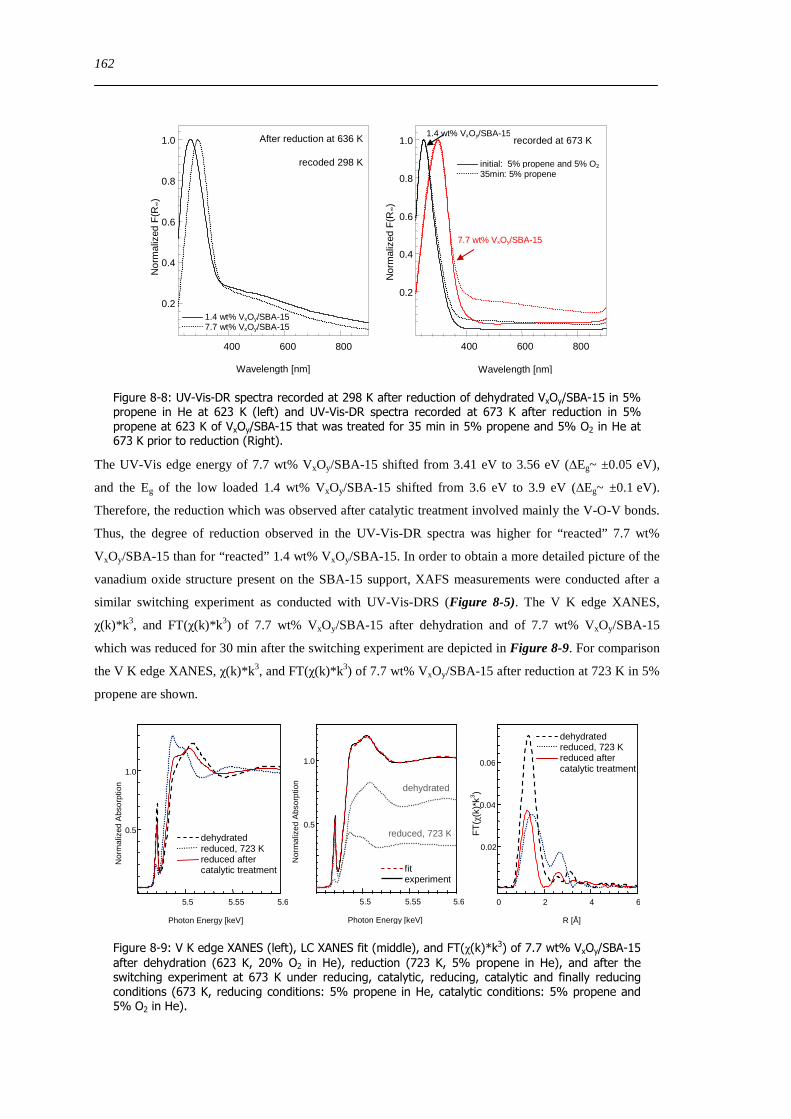
822 Local structure and reactivity of VxOySBA-15 under changing reaction conditions 157
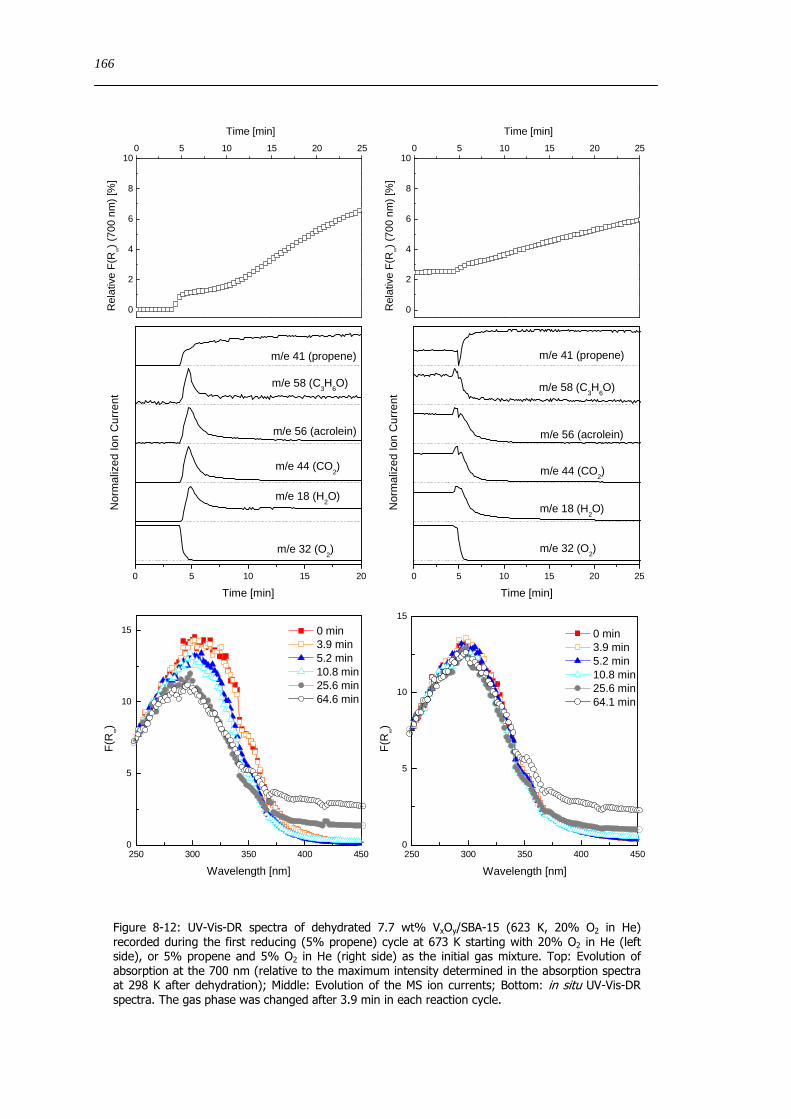
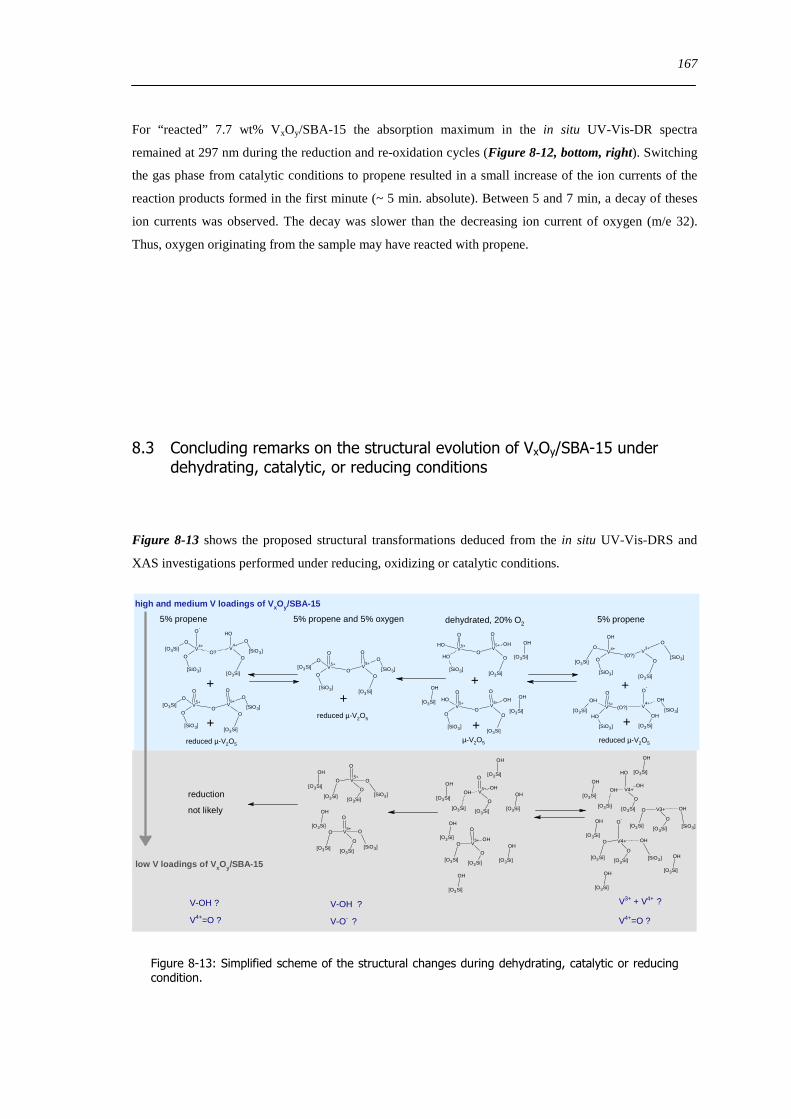
83 Concluding remarks on the structural evolution of VxOySBA-15 under dehydrating catalytic or reducing conditions 167
84 Summary 170
9 General conclusions on VxOySBA-15 model catalysts 171
91 Introduction 171
92 Hydrated state of VxOySBA-15 171
93 Dehydrated state of VxOySBA-15 172
94 Structure of VxOySBA-15 catalysts under reducing and under catalytic conditions 173
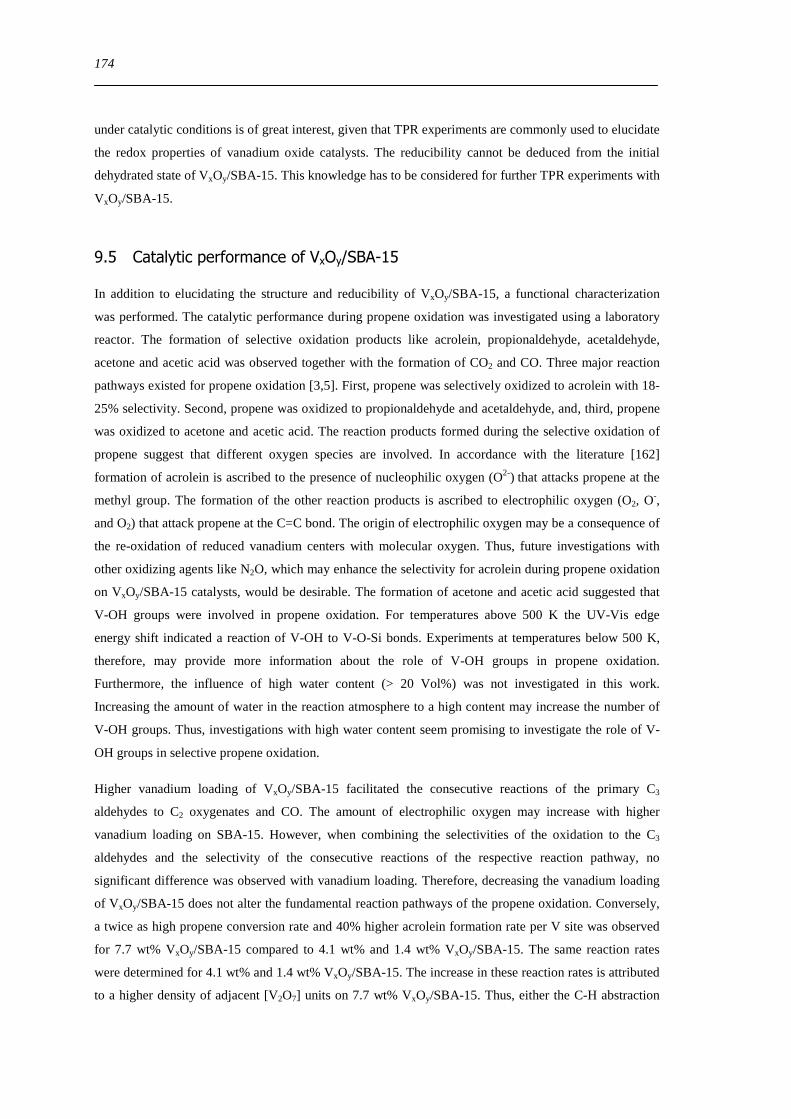
95 Catalytic performance of VxOySBA-15 174
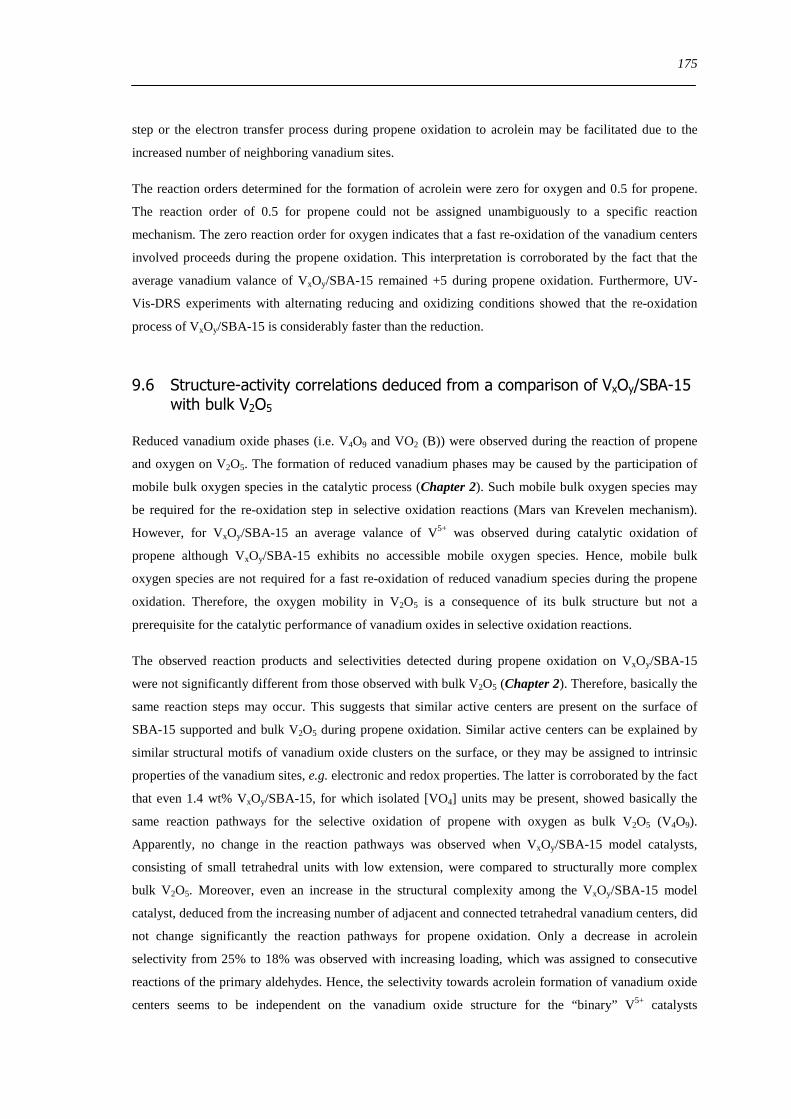
96 Structure-activity correlations deduced from a comparison of VxOySBA-15 with bulk V2O5175
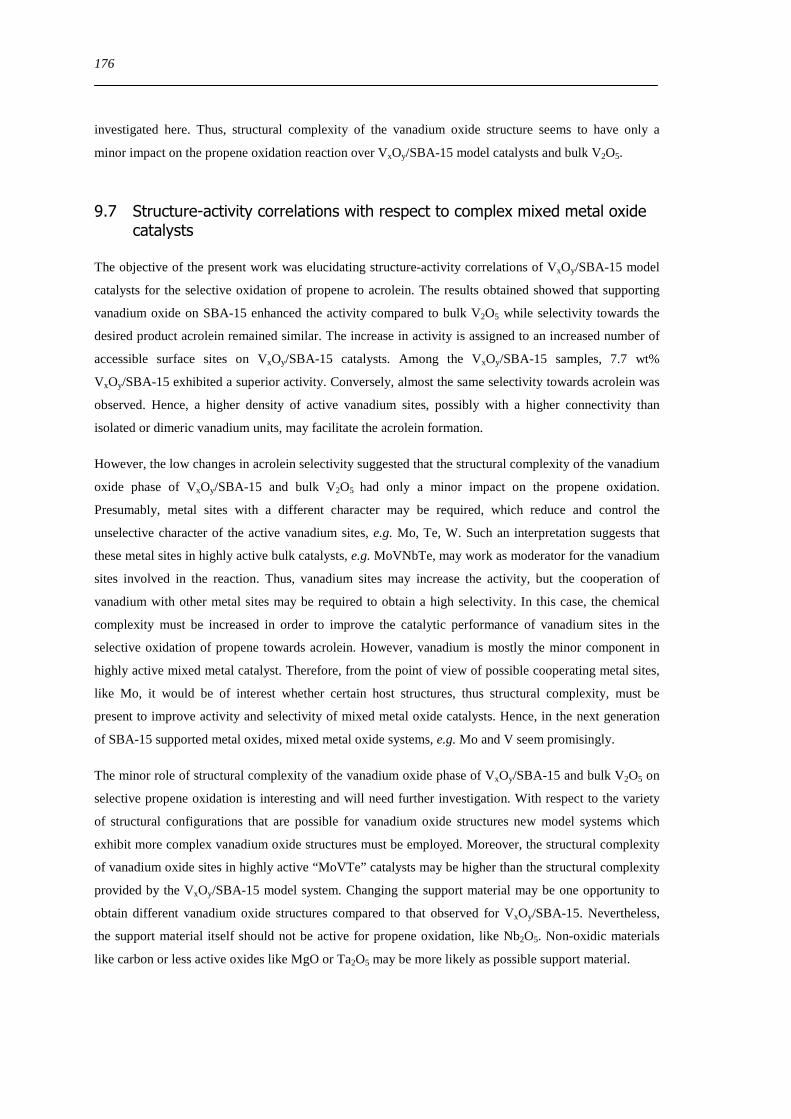
97 Structure-activity correlations with respect to complex mixed metal oxide catalysts 176
10 Appendix 179
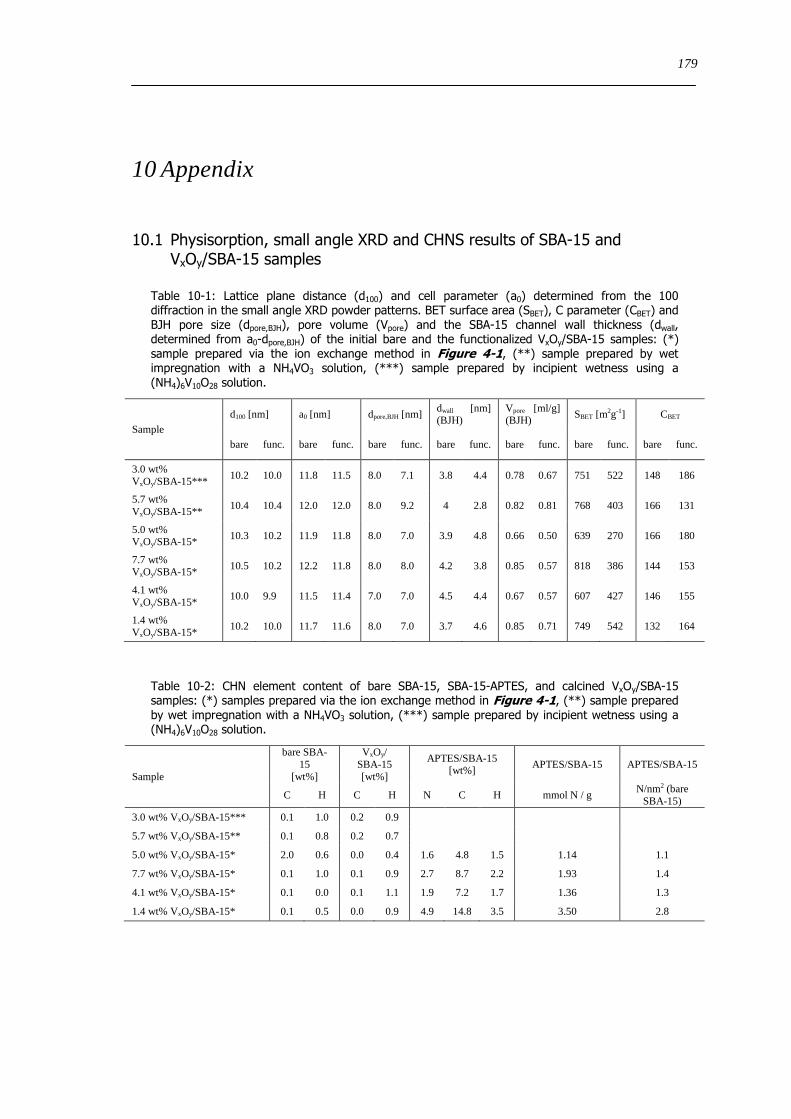
101 Physisorption small angle XRD and CHNS results of SBA-15 and VxOySBA-15 samples 179
102 Information Vanadium oxide and vanadate references 180
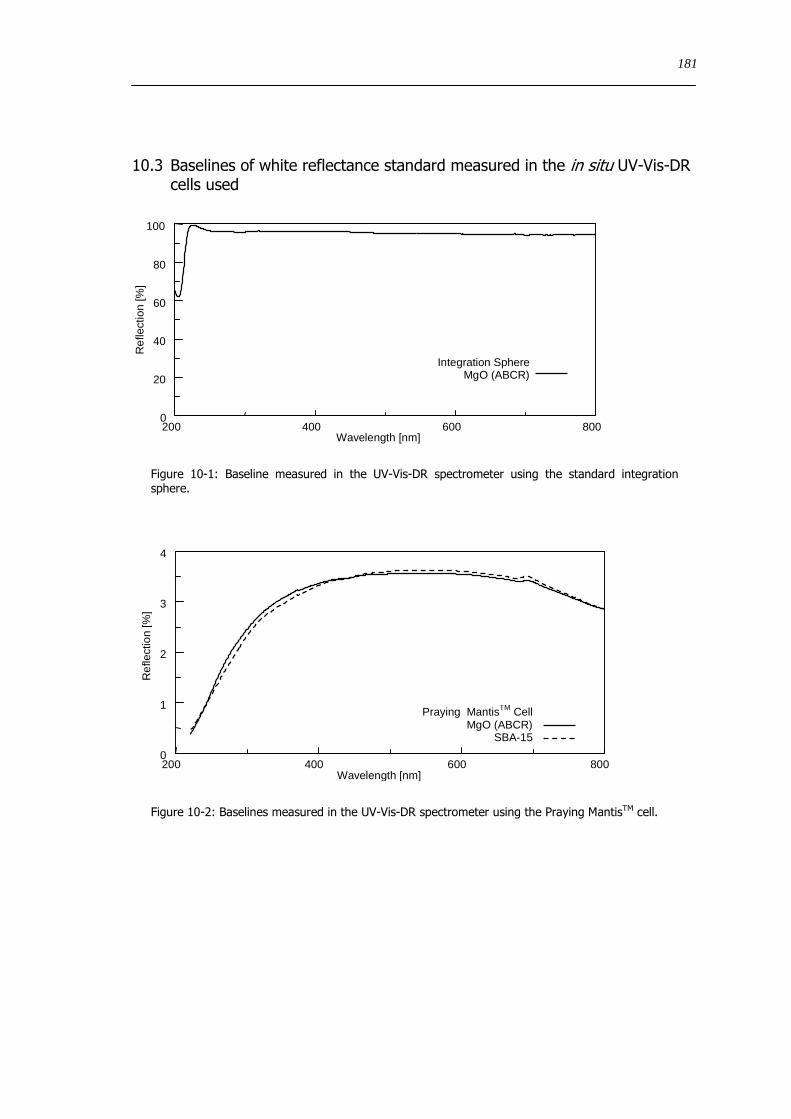
103 Baselines of white reflectance standard measured in the in situ UV-Vis-DR cells used 181
XIII
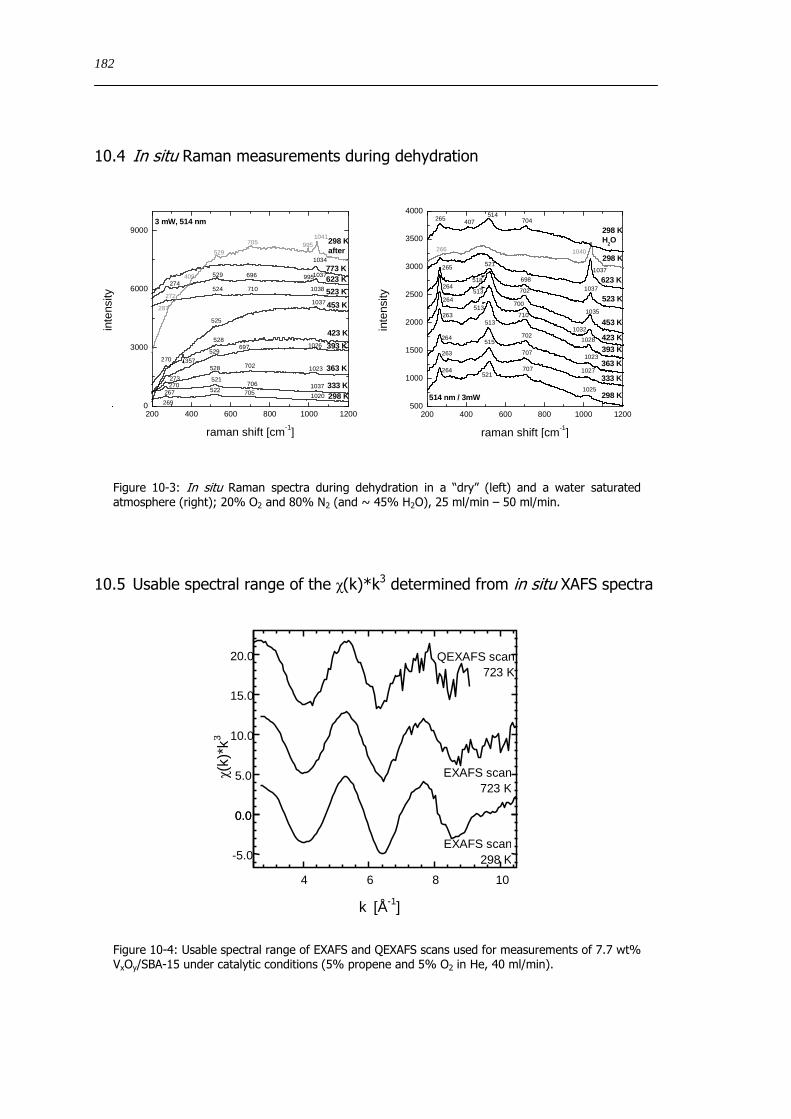
104 In situ Raman measurements during dehydration 182
105 Usable spectral range of the χ(k)k3 determined from in situ XAFS spectra 182
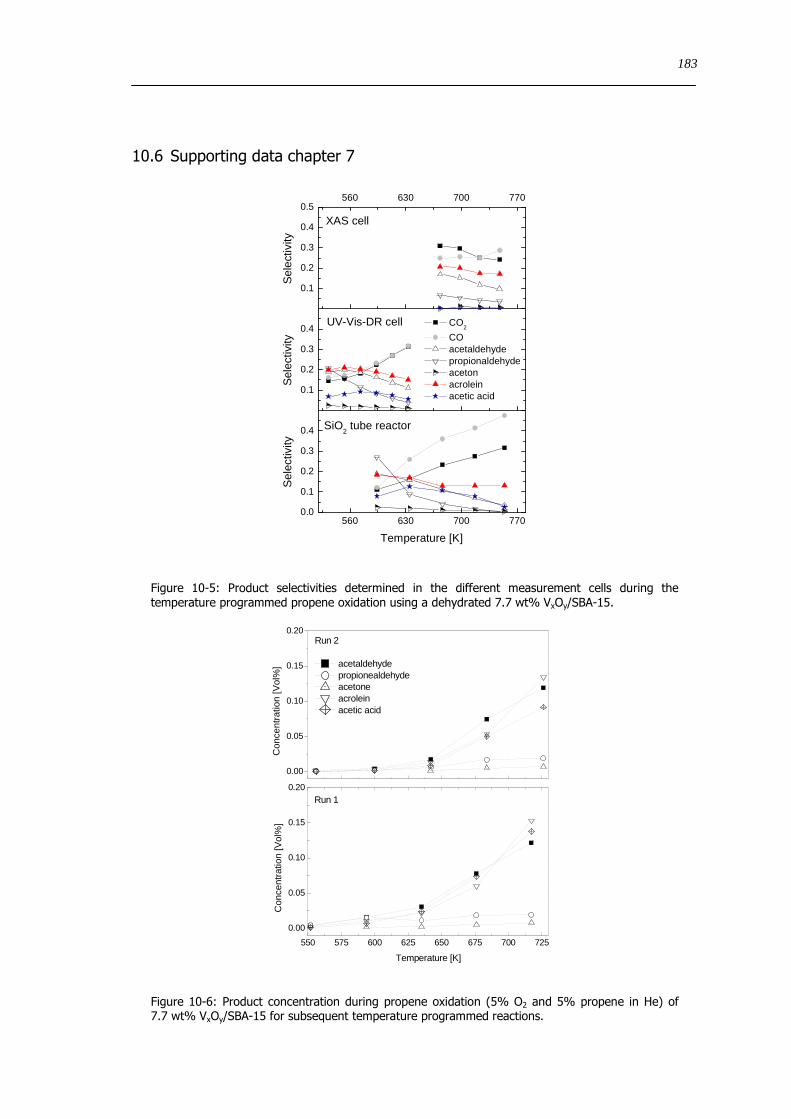
106 Supporting data chapter 7 183
107 Results of the analysis of the V K edge pre-edge feature 185
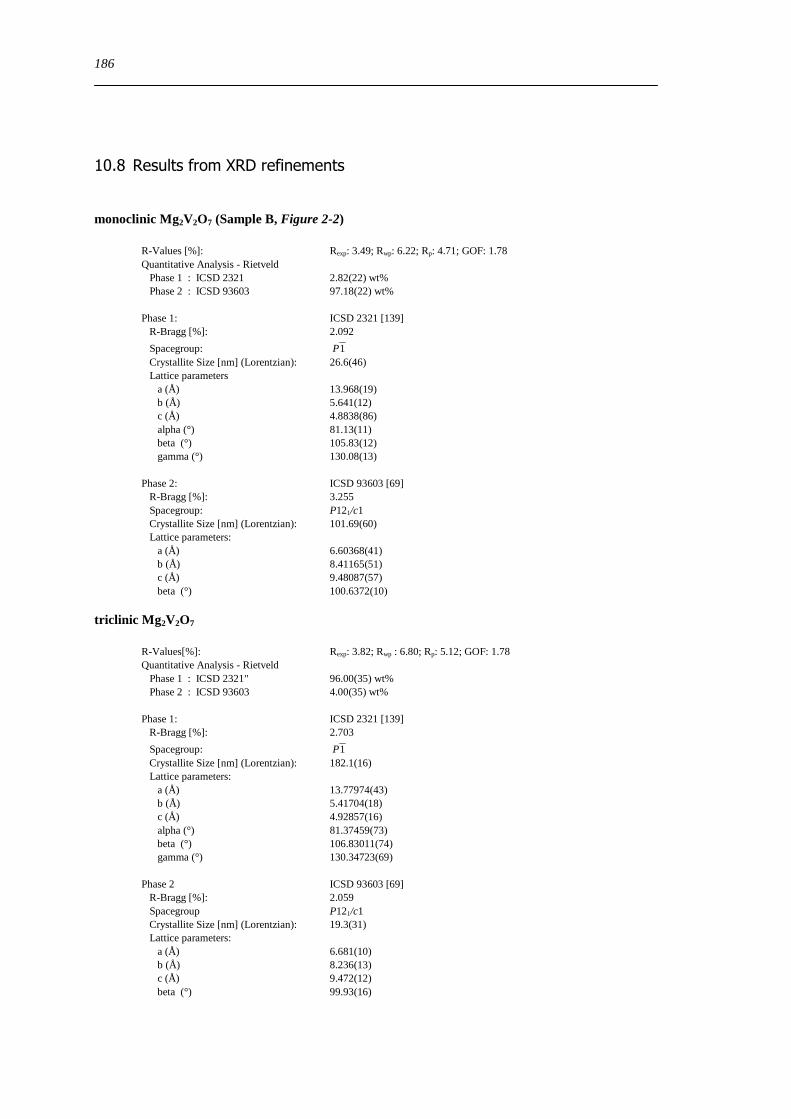
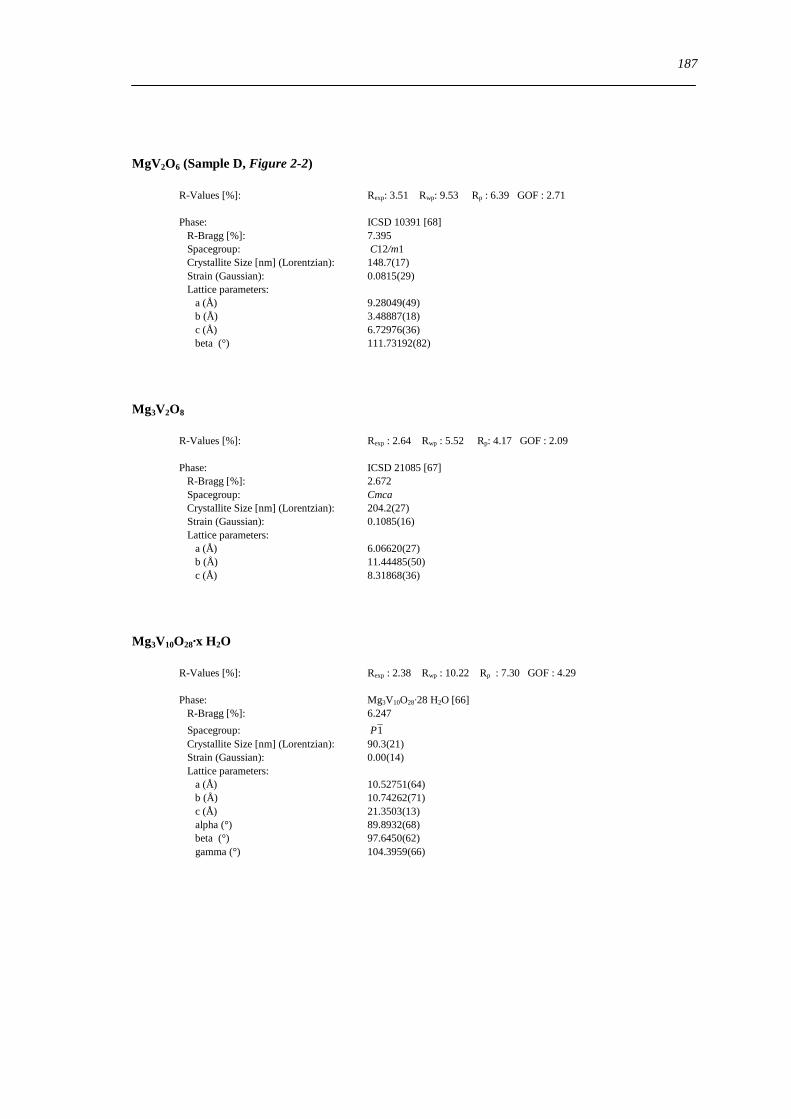
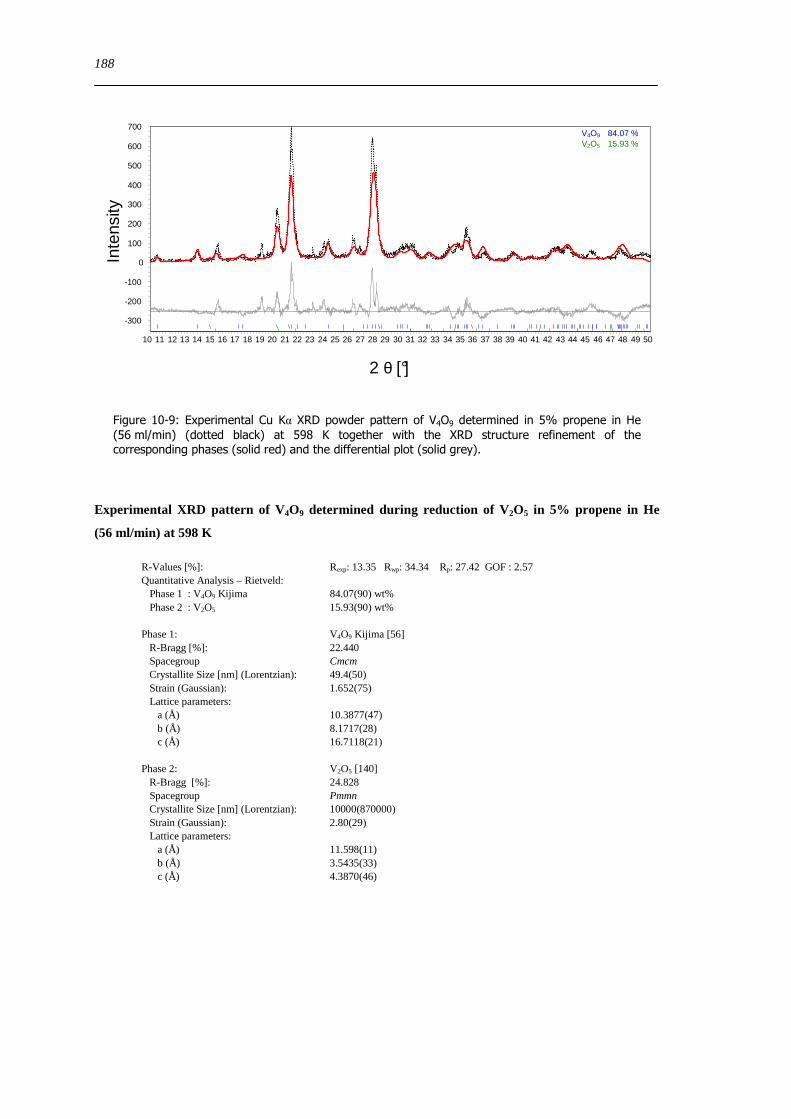
108 Results from XRD refinements 186
Bibliography 189
Table Captions 201
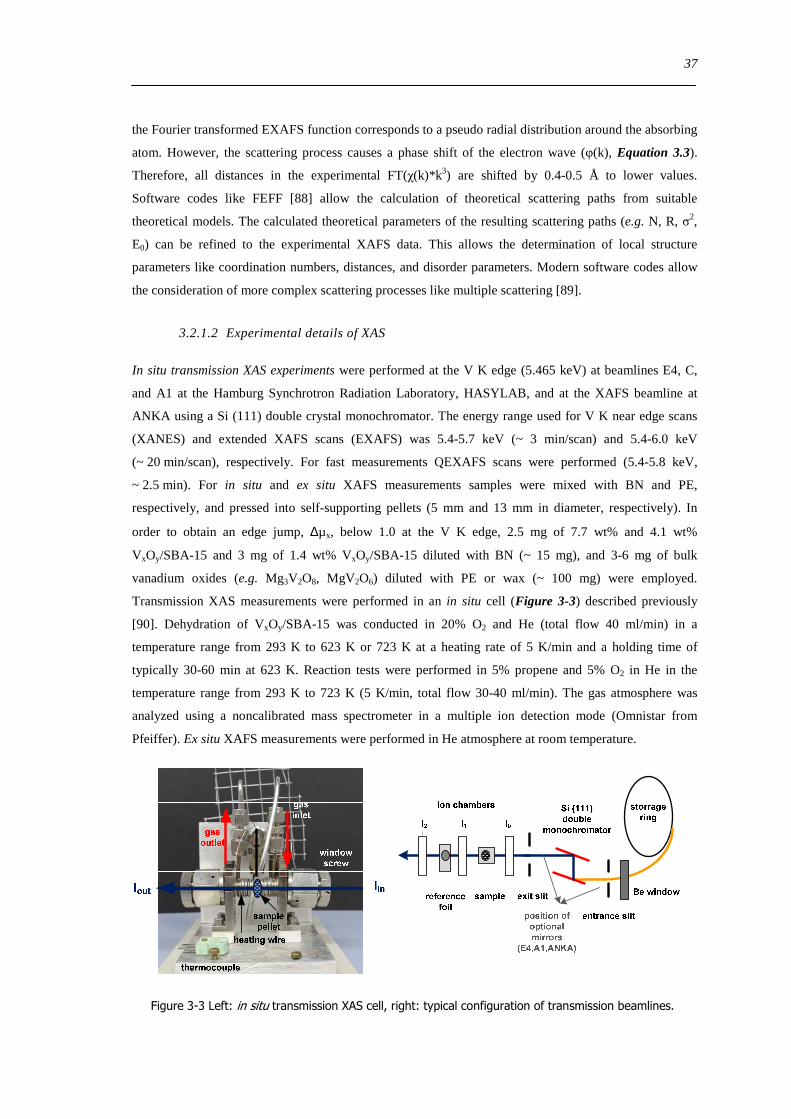
Figure Captions 204
XIV
1
1 Introduction
11 Motivation
Heterogeneously catalyzed reactions play a fundamental role in the production of fuels and a wide range
of chemical products Approximately 60 of industrial chemicals and intermediates are produced via
selectively catalyzed oxidation reactions [1] One important industrial process is the selective oxidation of
propene towards acrolein and acrylic acid (37 million tons per year [2]) The major production process is
a two stage reaction using propene as feedstock [3] First propene is oxidized to acrolein using bismuth
molybdate based catalysts Second acrolein is oxidized to acrylic acid using molybdenum based oxide
catalysts mixed with other transition metals such as vanadium and tungsten The total yield of acrylic acid
of this process is 87 [3] Increasing the total yield of industrial processes like the production of acrylic
acid is of great interest because natural resources like crude oil are saved and costs are lowered
Therefore new catalysts with improved activity and high selectivity towards the desired products are
sought
Industrial research is mostly based on chemical intuition and ldquotrial and errorrdquo methods which involve
testing of a large number of catalysts Another approach in research is a rational catalyst design [4] that
involves a deeper understanding of the complexity of active catalysts In addition to catalytic testing the
objective of these studies is to elucidate the properties of well chosen model catalysts Properties like
chemical composition electronic structure coordination of metal sites and surface and bulk structures
are investigated The aim is to derive structure-activity relationships that enlighten how the catalytic
performance correlates with these properties Furthermore this knowledge is used to develop new and
improved model catalysts However the required structure-activity relationships are not sufficiently
understood for the majority of heterogeneous catalysts
The development of new catalysts that use propane instead of propene as initial feed for the acrylic acid
synthesis [356] attracted much attention in the past decades Highly active mixed metal oxide catalysts
for the direct oxidation of propane to acrylic acid exhibit complex structures and compositions eg Mo
V W Te and Nb oxides [456] With respect to structure-activity relationships it is crucial to
understand how structure and individual metal sites influence the catalytic performance However
changing the composition of these active mixed metal oxides will mostly induce a change in the structure
as well Therefore the superior catalytic performance of these active bulk mixed metal oxides cannot be
assigned unambiguously to the functionality of individual metal centers or particular structure motifs
Hence it is difficult to distinguish between chemical and structural complexity In order to reduce the
number of variables that affect the catalytic performance suitable model systems exhibiting a lower
complexity are sought [7] Two approaches seem feasible Model systems with either plain composition
and structural variety [89] or model systems exhibiting structural invariance and a suitable
2
compositional variety [10] are promisingly Binary metal oxides constitute rather simple model systems
for the former case The present work focused on vanadium oxides as binary metal oxides
Although a huge structural variety exists among binary vanadium oxides [11] V2O5 was found to be the
only stable binary V5+ oxide Therefore two approaches for vanadium oxide based model catalysts were
chosen in the present work In a first approach ternary vanadium oxides were sought as model catalysts
to extend the range of available bulk vanadium oxides Magnesium vanadates were chosen because no
additional possibly active ldquometal sitesrdquo are introduced Furthermore magnesium vanadate systems exhibit
a variety of structural motifs (octahedral and tetrahedral coordination of V5+) which makes them very
suitable as structural model systems In a second approach silica supported vanadium oxides were chosen
as model systems Supporting metal oxides on silica may enable the stabilization of particular metal
structures that are not stable and thus not available under in situ conditions otherwise It was shown
recently that hexagonal MoO3 supported on mesoporous silica (SBA-15) is stabilized up to 773 K under
reaction conditions [8] Furthermore silica supports exhibit a large surface area no activity for catalytic
reactions and rather weak interactions with the supported metal oxides In addition to bulk model
systems supported metal oxide catalysts exhibit high dispersions and an improved surface to bulk ratio
Hence the need for differentiating between bulk and surface structures is avoided
Both model systems chosen were previously investigated in the selective oxidation of propane to propene
[5121314] However few investigations addressed the selective oxidation of propene towards acrolein
Here selective oxidation of propene was chosen as model reaction because many Mo [7-10] or V [1516]
mixed transition metal oxide model systems are active for this reaction Understanding the correlations of
structure and reactivity of these simple ldquobinaryrdquo model systems with different metal sites thus may help
to understand the complexity of highly active mixed transition metal catalysts
3
12 Vanadium oxides in catalysis
Only 3-5 of the vanadium consumption is due to the use of vanadium compounds in catalysis [1718]
Vanadium is mainly used as alloying element in the steel and metal industry Nevertheless vanadium
based oxide catalysts mainly V2O5 play an important role in selective oxidation reactions Some
important chemical processes that are based on vanadium containing metal oxide catalysts are
summarized in Table 1-1
Table 1-1 Commercially important selective oxidations with catalysts containing vanadium [1819]
Industrial process Catalyst material World production 2002
product (Mty)
Oxidation of SO2 to SO3 production of sulfuric acid V2O5 gt 100
Selective reduction NH3 to NOx V2O5WO3TiO2 -
Oxidation of benzene to maleic anhydride V2O5 14
Oxidation of butane to maleic anhydride VP oxides
Oxidation of naphthalene to phthalic anhydride VMo oxides and V-K oxides on
SiO2 22 Oxidation of o-xylene to phthalic anhydride VTi oxides
Oxidation of acrolein to acrylic acid VMoW oxides 38
Oxidation of methacrolein to methacrylic acid VMoW oxides 24
13 Supported vanadium oxides in catalysis
Supported vanadium oxides constitute model systems that are employed for the elucidation of
fundamental knowledge on structure and reactivity of many heterogeneous oxidation reactions The most
important reactions discussed are the selective oxidation of methanol [20212223] and methane
[24252627] to formaldehyde and the oxidative dehydrogenation of propane to propene [122829]
Typical supports are SiO2 Al2O3 ZrO2 TiO2 and Nb2O5 [1630] In the past decades many investigations
were performed that concern the impact of the respective support material on the structure of the
supported vanadium oxide phase and the catalytic performance However fundamental aspects
concerning the vanadium oxide structure and the reactivity of supported vanadium oxide catalysts are still
discussed intensively in the literature A general introduction into the main topics discussed is provided
by reviews from Wachs et al [30] Keller et al [18] and Muyalert et al [31] A brief summary of the
proposed vanadium oxide structures of VxOySiO2 catalysts under various conditions will be given below
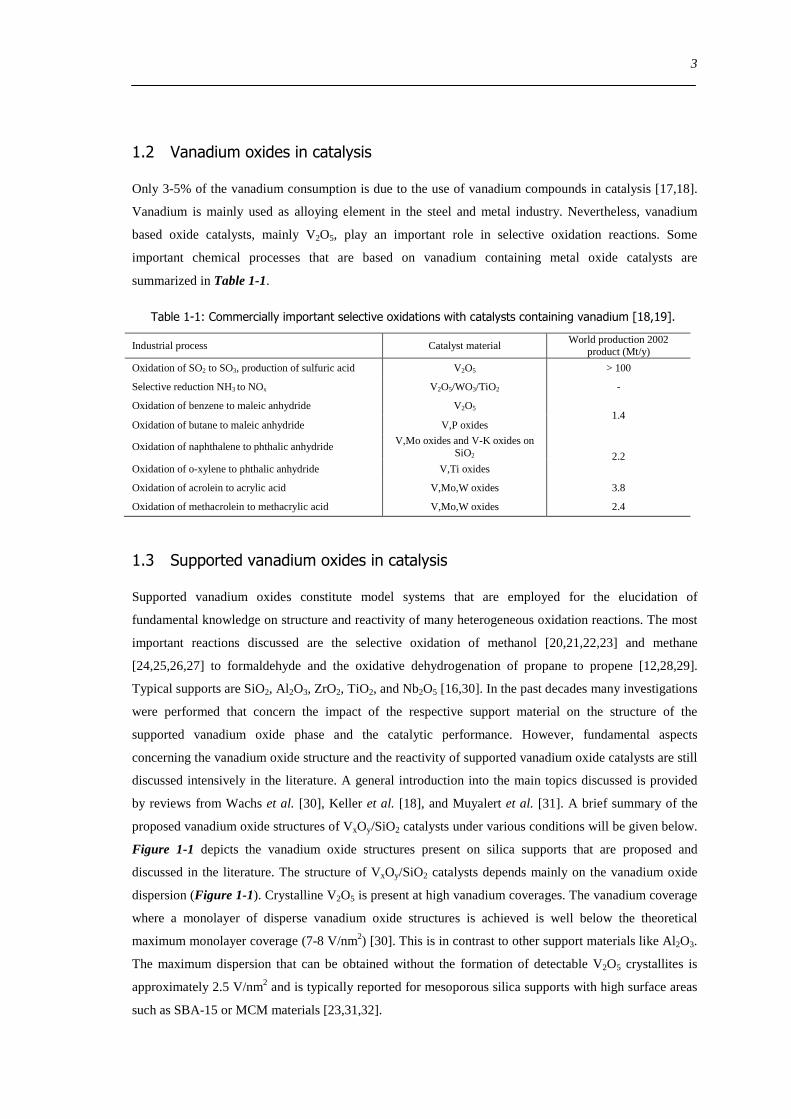
Figure 1-1 depicts the vanadium oxide structures present on silica supports that are proposed and
discussed in the literature The structure of VxOySiO2 catalysts depends mainly on the vanadium oxide
dispersion (Figure 1-1) Crystalline V2O5 is present at high vanadium coverages The vanadium coverage
where a monolayer of disperse vanadium oxide structures is achieved is well below the theoretical
maximum monolayer coverage (7-8 Vnm2) [30] This is in contrast to other support materials like Al2O3
The maximum dispersion that can be obtained without the formation of detectable V2O5 crystallites is
approximately 25 Vnm2 and is typically reported for mesoporous silica supports with high surface areas
such as SBA-15 or MCM materials [233132]
4
V
O
OO
O
Si Si Si
V
O
O O
OH
Si Si
V
O
O OH
OH
Si
V
O
O O
O
Si
V
O
OO
O
Si Si
V
O
OO
SiSi
V
O
OOH
O
Si
V
O
OHO
Si
V
O
OO
O
Si Si
V
O
OO
Si
V
O
O
Si
OX
V
O
O
H2O
O
Si
V
O
OH2
O
Si
OH OH
SiH3
OH
SiH3
OH
V loading gt 25 Vnm2
V loading lt 25 Vnm2 deydrated state
4-fold coordination
hydrated state
5- and 6-fold coordination
∆∆∆∆ T
298 K H2O
isolated vanadyl sites
dimeric sites
oligomeric sites
small hydrated clusters
larger hydrated centers
V2O5 nH2O gels
H2O
∆ T
crystalline V 2O5
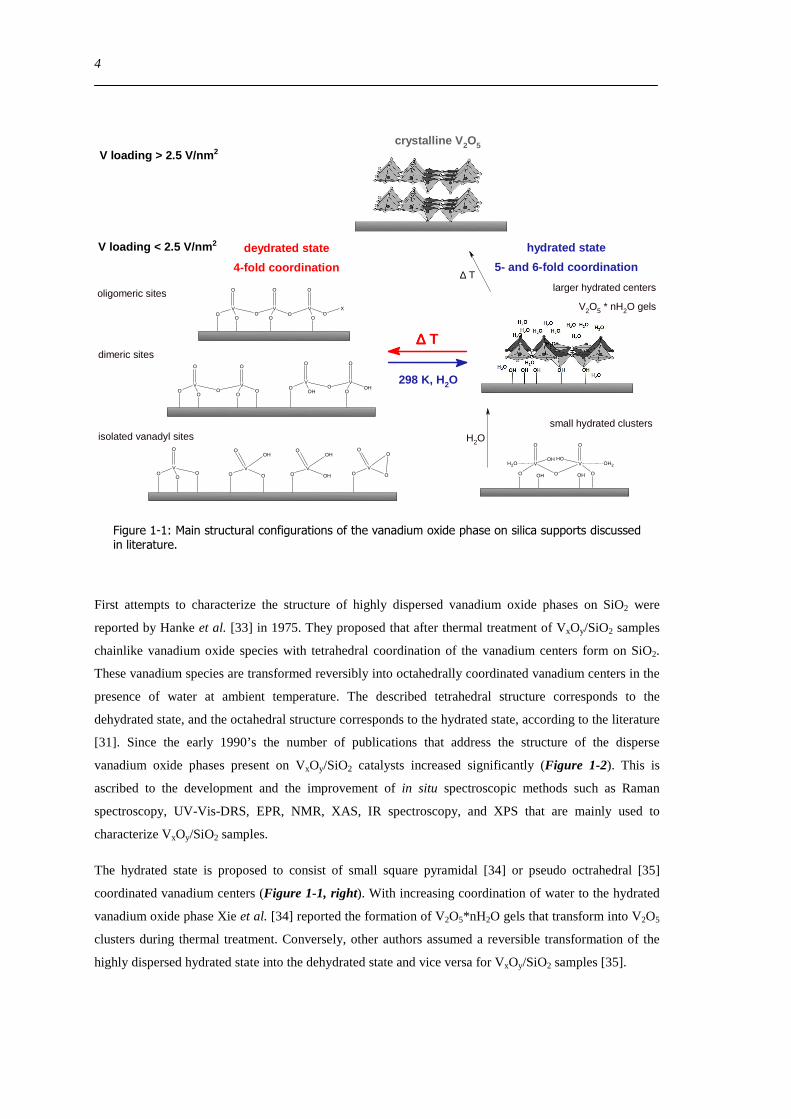
Figure 1-1 Main structural configurations of the vanadium oxide phase on silica supports discussed in literature
First attempts to characterize the structure of highly dispersed vanadium oxide phases on SiO2 were
reported by Hanke et al [33] in 1975 They proposed that after thermal treatment of VxOySiO2 samples
chainlike vanadium oxide species with tetrahedral coordination of the vanadium centers form on SiO2
These vanadium species are transformed reversibly into octahedrally coordinated vanadium centers in the
presence of water at ambient temperature The described tetrahedral structure corresponds to the
dehydrated state and the octahedral structure corresponds to the hydrated state according to the literature
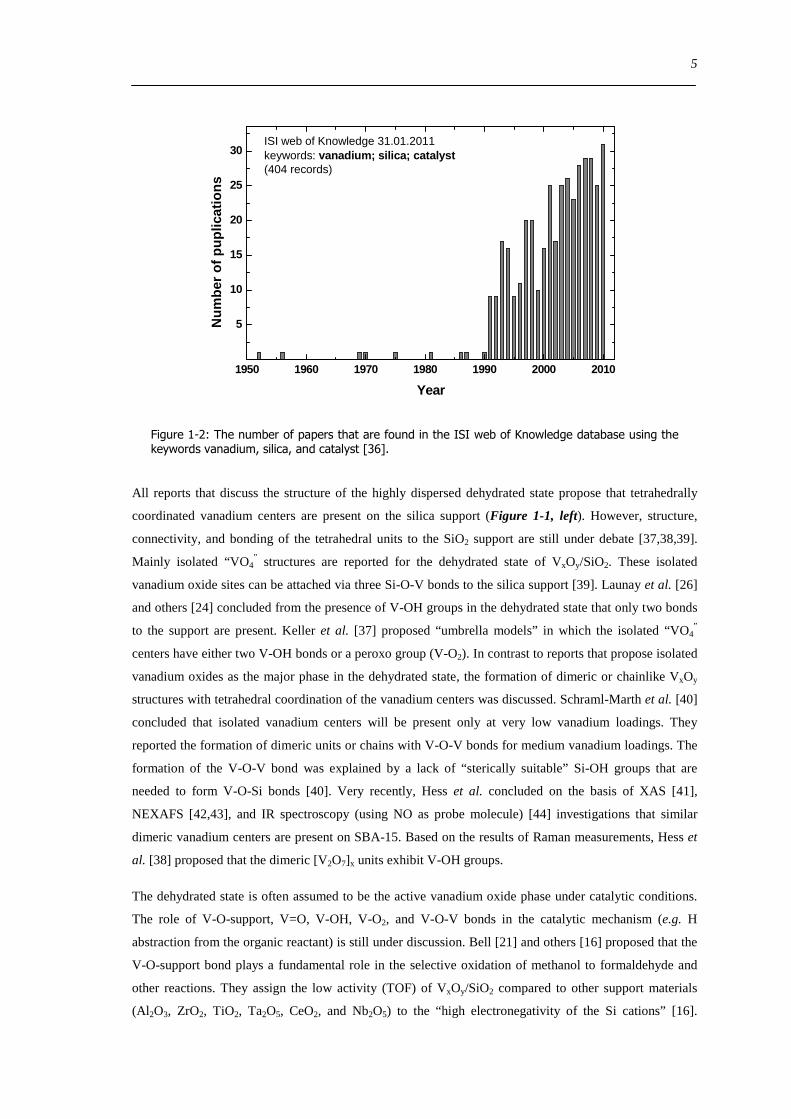
[31] Since the early 1990rsquos the number of publications that address the structure of the disperse
vanadium oxide phases present on VxOySiO2 catalysts increased significantly (Figure 1-2) This is
ascribed to the development and the improvement of in situ spectroscopic methods such as Raman
spectroscopy UV-Vis-DRS EPR NMR XAS IR spectroscopy and XPS that are mainly used to
characterize VxOySiO2 samples
The hydrated state is proposed to consist of small square pyramidal [34] or pseudo octrahedral [35]
coordinated vanadium centers (Figure 1-1 right) With increasing coordination of water to the hydrated
vanadium oxide phase Xie et al [34] reported the formation of V2O5nH2O gels that transform into V2O5
clusters during thermal treatment Conversely other authors assumed a reversible transformation of the
highly dispersed hydrated state into the dehydrated state and vice versa for VxOySiO2 samples [35]
5
1950 1960 1970 1980 1990 2000 2010
5
10
15
20
25
30
ISI web of Knowledge 31012011keywords vanadium silica catalyst(404 records)
Num
ber
of p
uplic
atio
ns
Year
Figure 1-2 The number of papers that are found in the ISI web of Knowledge database using the keywords vanadium silica and catalyst [36]
All reports that discuss the structure of the highly dispersed dehydrated state propose that tetrahedrally
coordinated vanadium centers are present on the silica support (Figure 1-1 left) However structure
connectivity and bonding of the tetrahedral units to the SiO2 support are still under debate [373839]
Mainly isolated ldquoVO4rdquo structures are reported for the dehydrated state of VxOySiO2 These isolated
vanadium oxide sites can be attached via three Si-O-V bonds to the silica support [39] Launay et al [26]
and others [24] concluded from the presence of V-OH groups in the dehydrated state that only two bonds
to the support are present Keller et al [37] proposed ldquoumbrella modelsrdquo in which the isolated ldquoVO4rdquo
centers have either two V-OH bonds or a peroxo group (V-O2) In contrast to reports that propose isolated
vanadium oxides as the major phase in the dehydrated state the formation of dimeric or chainlike VxOy
structures with tetrahedral coordination of the vanadium centers was discussed Schraml-Marth et al [40]
concluded that isolated vanadium centers will be present only at very low vanadium loadings They
reported the formation of dimeric units or chains with V-O-V bonds for medium vanadium loadings The
formation of the V-O-V bond was explained by a lack of ldquosterically suitablerdquo Si-OH groups that are
needed to form V-O-Si bonds [40] Very recently Hess et al concluded on the basis of XAS [41]
NEXAFS [4243] and IR spectroscopy (using NO as probe molecule) [44] investigations that similar
dimeric vanadium centers are present on SBA-15 Based on the results of Raman measurements Hess et
al [38] proposed that the dimeric [V2O7]x units exhibit V-OH groups
The dehydrated state is often assumed to be the active vanadium oxide phase under catalytic conditions
The role of V-O-support V=O V-OH V-O2 and V-O-V bonds in the catalytic mechanism (eg H
abstraction from the organic reactant) is still under discussion Bell [21] and others [16] proposed that the
V-O-support bond plays a fundamental role in the selective oxidation of methanol to formaldehyde and
other reactions They assign the low activity (TOF) of VxOySiO2 compared to other support materials
(Al 2O3 ZrO2 TiO2 Ta2O5 CeO2 and Nb2O5) to the ldquohigh electronegativity of the Si cationsrdquo [16]
6
Conversely calculations by Rosanska et al [45] showed that a reaction mechanism involving vanadyl
groups (V=O) or peroxo groups (V-O2) is also feasible in the ODP of propane No differences between
isolated and dimeric VxOysupport species were determined by Rosanska et al [45] V-O-V bonds were
proposed to be irrelevant for the selective oxidation of hydrocarbons because no increase of the TOF was
observed with increasing vanadium loading (V-O-V bonds) [31] However the results of the vanadium
oxide structure in the dehydrated state of VxOySiO2 reported in the literature are very ambiguous With
respect to structure activity relationships more detailed knowledge on the structure of supported
VxOySiO2 will be required to reveal the active vanadium oxide phase under catalytic conditions
More detailed introductions concerning the topic of the respective chapter and to the magnesium vanadate
system will be provided in front of each chapter
14 Outline of the work
The objective of the present work was the investigation of suitable vanadium oxide model systems for the
selective oxidation of propene to acrolein In addition to V2O5 magnesium vanadate systems and silica
supported vanadium oxide catalysts with different vanadium loading were chosen as model catalysts
Prior to investigating the catalysts under catalytic conditions a detailed characterization of the vanadium
oxide structures was performed The focus of this work was on supported vanadium oxide catalysts
denoted as VxOySBA-15 A brief outline of the work is given below
Part I (Chapter 2) Magnesium vanadates and V2O5 are discussed as model catalysts for the selective
oxidation of propene
Magnesium vanadate phases (Mg3V10O28middot28H2O Mg2V2O7 MgV2O6 and Mg3V2O8) with
different structural motifs were synthesized The structural evolution of thermally stable
maganesium vanadates and V2O5 under oxidizing reducing and propene oxidation conditions
was investigated in situ using UV-Vis-DRS XAS and XRD In addition the catalytic
performance during propene oxidation was determined in a fixed bed reactor Correlations of
reducibility and the vanadium oxide structure with the catalytic performance are described
7
Part II (Chapter 3-9) SBA-15 supported vanadium oxides are discussed as model catalysts for the
selective oxidation of propene
Chapter 3 A short introduction to the fundamentals of X-ray absorption spectroscopy and
UV-Vis-DR spectroscopy is given Furthermore the experimental details about the preparation
of SBA-15 and VxOySBA-15 and the various measurements performed are described
Chapter 4 Three different preparation methods were evaluated for the preparation of supported
vanadium oxide catalysts During preparation the evolution of the vanadium oxide structure was
monitored using spectroscopic methods The SBA-15 support was characterized with XRD
physisorption measurements and electron microscopy Three vanadium loadings in the range of
14-77 wt V (03-24 Vnm2) were chosen for further structural and catalytic characterization
Chapter 5 Elucidation of the hydrated and dehydrated vanadium oxide structure present on
SBA-15 was performed using UV-Vis-DRS and XAS spectroscopy Theoretical model structures
which were suitable to describe the experimental data were employed
Chapter 6 Hydration and dehydration processes of the vanadium oxide structure were
investigated in situ using various spectroscopic methods In addition the dehydration of the
SBA-15 support was investigated Aging effects and re-dispersion of crystalline V2O5 species to
disperse vanadium oxide species were observed The impact of water on the dehydration process
was probed
Chapter 7 The evolution of the structure of VxOySBA-15 catalysts and the composition of the
gas phase were investigated in situ under propene oxidation conditions Reliable catalytic results
were obtained from measurements in a laboratory fixed bed reactor The catalytic performance
during propene oxidation was investigated as a function of thermal treatment and vanadium
loading
Chapter 8 Reducibility in propene and re-oxidation of VxOySBA-15 in oxygen and under
catalytic conditions was followed by in situ UV-Vis-DRS and XAS Changing interactions of the
vanadium oxide phase and the SiO2 support were observed as a result of the catalytic reaction in
propene and oxygen
Chapter 9 General conclusions that were deduced from the VxOySBA-15 model system with
respect to structure activity relationships are provided
8
Introduction
9
MAGNESIUM VANADATE MODEL CATALYSTS AND V2O5
Part I
Spectroscopic and catalytic
investigations of magnesium vanadate
model catalysts and V2O5 for selective
propene oxidation
10
11
2 Magnesium vanadate model systems and V2O5 during
selective propene oxidation
21 Introduction
Vanadium based mixed transition metal oxide catalysts play an important role in selective oxidation
catalysis of light alkanes and alkenes with gas phase oxygen [516246] However the most active and
selective catalysts for such reactions exhibit complex structures and compositions
eg MoV(SbTe)NbO catalysts [51446] For the development of improved catalysts it is essential to
understand the specific role of vanadium in oxidation catalysis Besides lsquotrial and errorrsquo approaches
model system based studies are employed The latter allow disentangling of the individual effects of
chemical composition coordination and electronic structure of the transition metal oxide The focus of
the present work was to investigate the influence of structural motifs on the catalytic behavior of
vanadium oxides Selective oxidation of propene was chosen as model reaction because many Mo [47] or
V [1648] mixed transition metal oxide model systems are active for this reaction Finding correlations
between these model systems may help to understand the complexity of highly active mixed transition
metal catalysts
Here vanadium oxide based model systems exhibiting an average vanadium valence of V5+ were
employed Only V2O5 was found as stable binary V5+ oxide Therefore ternary vanadium oxides were
sought to extent the range of available oxides In order to avoid the introduction of a second ldquopossibly
activerdquo metal atom (Fe Cr Zn Pb Cuhellip) alkali and alkali earth vanadates were preferred However
most alkali (Na K) orthovanadates are sensitive towards hydration which makes them unsuitable
Furthermore alkali earth vanadates tend to form carbonates which may be stable and may not decompose
at reaction temperatures [4950] Typical carbonate decomposition temperatures are 1098 K for CaCO3
and 1723 K for BaCO3 Only MgCO3 decomposes at a lower temperature of 623 K Therefore different
magnesium vanadate phases were synthesized as ternary vanadium oxide phases Magnesium vanadate
systems exhibit a variety of structural motifs (octahedral and tetrahedral coordination of V5+) which
makes them very suitable as structural model systems
Reports on the catalytic performance of magnesium vanadates in propene oxidation are rarely found in
literature [5152] Supported vanadium oxide and magnesium vanadate catalysts are mostly used for
oxidative dehydrogenation (ODH) of light alkanes In this field activity and selectivity of vanadium
oxide catalysts is still a controversial issue [53] A summary of the concepts is provided by Centi et al
[14] and Bettahar et al [5] The influence of geometry between the vanadium oxide unit and the
hydrocarbon [54] the redox properties [55565758] and other aspects are reviewed For the selective
propene oxidation similar correlations as found for the ODH of propane may be present
12
V2O5 was measured in addition to the magnesium vanadates V2O5 is often used as a reference compound
It is active but less selective for propene oxidation and other reactions like the ODH of propane
[515859] Haber et al [60] and other authors discussed the catalytic behavior of V2O5 on the basis of
theoretical calculations and in situ measurements They proposed V6O13 and V4O9 intermediates to be
present under reducing and catalytic conditions [60616263] In contrast Yamazaki et al [64] and
Holdago et al [65] only detected V4O9 phases under sulfur and H2S oxidizing conditions The important
role of the nature and the valence of reduced vanadium oxide phases in oxidation catalysis of V2O5 was
shown by Ballarini et al for the ODH reaction [59] However a detailed knowledge of structure activity
correlations under in situ propene oxidizing conditions remains scarce Hence a detailed in situ analysis
was performed to investigate the kind of binary vanadium oxide phase present under catalytic propene
oxidation
22 Experimental
221 Sample preparation
Mg3V2O8 (magnesium orthovanadate) MgV2O6 (magnesium metavanadate) and Mg2V2O7 (magnesium
pyrovanadate) where synthesized according to Delmon et al [55] via a citrate method Mg(NO3)2middot6H2O
(Fluka 99 ) and NH4VO3 (Fluka 99 ) were used as metal precursors in the concentrations required
for the desired MgV ratio The salts were dissolved in 500 ml water The mixture was heated at 363 K
for 2 h until a clear yellow solution was obtained After cooling to 300 K 2 ml of 65 HNO3 were added
to avoid precipitation Subsequently citric acid (three negative charges per molecule Roth 995) was
added to neutralize the positive charges of Mg2+ and V5+ Water was removed by evaporation in two steps
to avoid the formation of NOx gases (200 mbar and 343 K 30 mbar and 363 K) The resulting amorphous
solid was calcined in two steps 18 h at 653 K and 6-85 h at 823-1023 K either in a muffle furnace or an
open tube furnace depending on the resulting phase (Table 2-1) Calcination of the precursor was
performed in several batches due to the small size of the crucibles Batches exhibiting the same structural
characteristics were mixed and homogenized
Mg3V10O28middot28H2O (magnesium decavanadate) was synthesized according to Iida and Ozeki [66] V2O5
(364 g 201 mmol) was dissolved in 450 ml of a H2O2H2O mixture (50 ml 30 H2O2 and 400 ml H2O)
resulting in a red solution Afterwards a solution of Mg(CH3COO)2middot4H2O (268 g 1250 mmol) in 15 ml
water was added and the color of the mixture changed to orange The amount of water was slowly
reduced by evaporation (363 K 30-40 mbar 15 h) to 100 ml Acetone was added drop wise to the
remaining solution (100 ml 30 min) The resulting precipitate was filtered washed with acetone and
dried under reduced pressure The solid phase was recrystallized by dissolving the powder in a few ml of
water and then storing the solution in a closed bottle in the refrigerator Deep orange crystals were
obtained
13
V2O5 (vanadiumpentoxide) was used as purchased (Alfa Aesar 998) Phase purity was confirmed by
XRD The V2O5 structure proposed by Enjalbert et al [140] matched the experimental XRD pattern and
was used for structure refinement
All samples were stored under ambient conditions (298 K air)
Table 2-1 Preparation details of the synthesized magnesium vanadate samples
Magnesium vanadate phase Furnace type Crucible Temperature [K]
Time second step [h]
Mg3V2O8 muffle and tube furnace ceramic quartz 1023 6
m-Mg2V2O7 (Batch A) muffle furnace ceramic 923 6
m-Mg2V2O7 (Batch B) muffle furnace ceramic with cover 823-923 85
t-Mg2V2O7 tube furnace quartz 1023 6
MgV2O6 (Batch C) muffle furnace ceramic 923 6
MgV2O6 (Batch D) tube furnace quartz 923 6
222 Powder X-ray diffraction (XRD)
Ex situ XRD measurements were carried out on an XPert PRO MPD diffractometer (θ-θ geometry)
using Cu K alpha radiation and a solid-state multi-channel PIXcelreg detector Wide angle scans
(5deg le 2θ le 90deg variable slits) were collected in reflection mode The sample was prepared on a silicon
sample holder Data analysis was performed using the software package Topas 3 and Diffrac Plus
Evaluation 2003 (Bruker AXS) For phase identification a phase analysis was performed using the PDF
and ICSD databases To verify the structures found a refinement was performed using a fundamental
parameter approach Only the cell parameters (abcαβγ) of the corresponding theoretical structures a
background function and the size and strain parameters were refined In situ XRD measurements were
conducted on a STOE diffractometer (θ-θ Mode) using an Anton Paar in situ cell Thermal stability tests
were conducted in 20 O2 in He (total flow 100 mlmin) in a temperature range from 293 K to 773 K
Reaction tests were performed in 5 propene and 5 O2 in He in the temperature range from 323 K to
673 K (5 Kmin total flow 56 mlmin) The gas phase composition at the cell outlet was continuously
monitored using a non-calibrated mass spectrometer in a multiple ion detection mode (Pfeiffer Omnistar)
Phase analysis was performed using the WinXPOW software package (STOE) After reaction all samples
were measured ex situ (see above)
223 UV-Vis Diffuse reflectance spectroscopy (UV-Vis-DRS) measurements
UV-Vis-DRS measurements were conducted in a Jasco-V670 UV-VIS-NIR spectrometer using an ex situ
integration sphere and a Praying MantisTM in situ cell (Harrick Scientific Products Inc) MgO (ABCR)
was used as reflectance standard To avoid sintering effects the samples were diluted with MgO for in situ
measurements Thermal stability tests were conducted in 20 O2 and He (total flow 50 mlmin) in a
temperature range from 293 K to 657 K using a heating rate of 4 Kmin Reaction tests were performed in
14
5 propene and 5 O2 in He in the temperature range from 293 K to 657 K (4 Kmin total flow
40 mlmin) The gas atmosphere was analyzed using a non-calibrated mass spectrometer in a multiple ion
detection mode (Pfeiffer Omnistar) A linear correction (Tsample = 085 T holder + 2 [degC]) was applied to the
sample holder temperature which was obtained by a separate measurement using a thermocouple placed
in the sample powder bed
224 X-ray absorption spectroscopy (XAS)
Ex situ transmission XAS experiments at the V K edge (5465 keV) were performed at the XAS beamline
C at HASYLAB using a Si (111) double crystal monochromator Powders were pressed with a force of
1 ton into a 13 mm diameter pellet resulting in an edge jump at the V K edge of ∆microx ~ 1 X-ray absorption
fine structure (XAFS) analysis was performed using the software package WinXAS v32 [91]
Background subtraction and normalization were carried out by fitting a linear polynomial to the pre-edge
and a 3rd degree polynomial to the post-edge region of an absorption spectrum respectively The extended
X-ray absorption fine structure (EXAFS) χ(k) was extracted by using cubic splines to obtain a smooth
atomic background χ(k) The FT(χ(k)k3) often referred to as pseudo radial distribution function was
calculated by Fourier transformation of the k3-weighted experimental χ(k) function multiplied by a
Bessel window into R space
225 Quantitative catalysis measurements
Quantitative catalysis measurements were performed using either the UV-Vis-DR in situ cell or a fixed
bed laboratory reactor connected to an online gas chromatography system (Varian CP-3800) and a non
calibrated mass spectrometer (Pfeiffer Omnistar) Hydrocarbons and oxygenated reaction products were
analyzed using a Carbowax 52CB capillary column connected to an Al2O3MAPD capillary column or a
fused silica restriction (25 m x 032 mm) each connected to a flame ionization detector (FID) Reactant
gas flow rates of oxygen propene and helium were adjusted through separate mass flow controllers to a
total flow of 40 mlmin A mixture of 5 propene and 5 oxygen in He was used for catalytic tests in the
range of 295-683 K Boron nitride (Alfa Aesar 995 ) was used as diluent
23 Results and discussion
231 Ex situ structural characterization of prepared samples
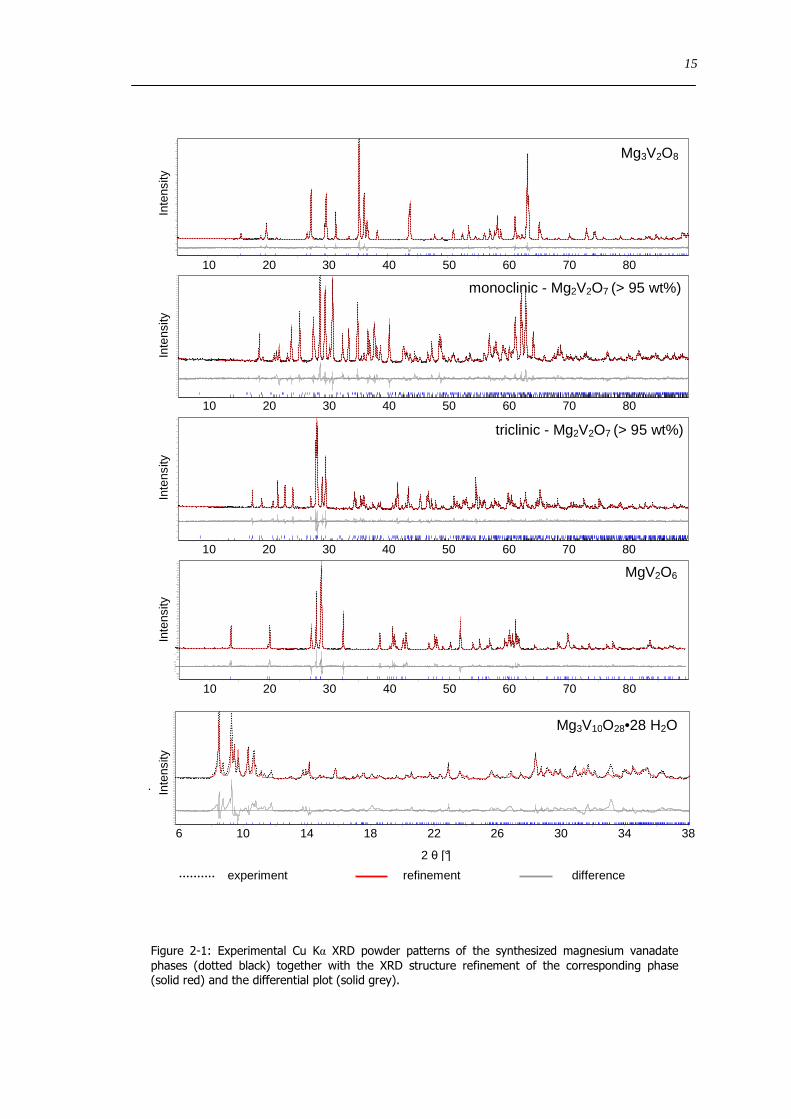
The synthesized samples were investigated using X-ray powder diffraction (XRD) for phase identification
and structure refinement Figure 2-1 shows the detected XRD powder pattern of the phases obtained
together with the theoretical pattern from structure refinement (Appendix 108) For Mg3V2O8 [67] and
MgV2O6 [68] only a single phase was detected For Mg2V2O7 a monoclinic [69] and a triclinic [139]
phase were synthesized depending on the calcination temperature and furnace type (Table 2-1) Each
phase was obtained with a phase purity of more than 95 wt
15
experiment refinement difference
80 70 60 50 40 30 20 10
80 70 60 50 40 30 20 10
80 70 60 50 40 30 20 10
80 70 60 50 40 30 20 10
38 34 30 26 22 18 14 10 6
2 θ [deg]
Inte
nsity
In
tens
ity
Inte
nsity
In
tens
ity
Inte
nsity
Mg3V2O8
monoclinic - Mg2V2O7 (gt 95 wt)
triclinic - Mg2V2O7 (gt 95 wt)
MgV2O6
Mg3V10O28bull28 H2O
Figure 2-1 Experimental Cu Kα XRD powder patterns of the synthesized magnesium vanadate phases (dotted black) together with the XRD structure refinement of the corresponding phase (solid red) and the differential plot (solid grey)
16
a
bc
a
bc
a
b
ca
b
c
abc
abc
ab
ca
b
c
Mg3V10O28bull28 H2O
corner and edge sharing octahedrons
MgV2O6
corner and edge sharing square pyramids
triclinic
Mg2V2O7
corner sharing tetrahedrons
monoclinic
Mg2V2O7
corner sharing tetrahedrons
Mg3V2O8
isolated tetrahedrons
a
bc
a
bc
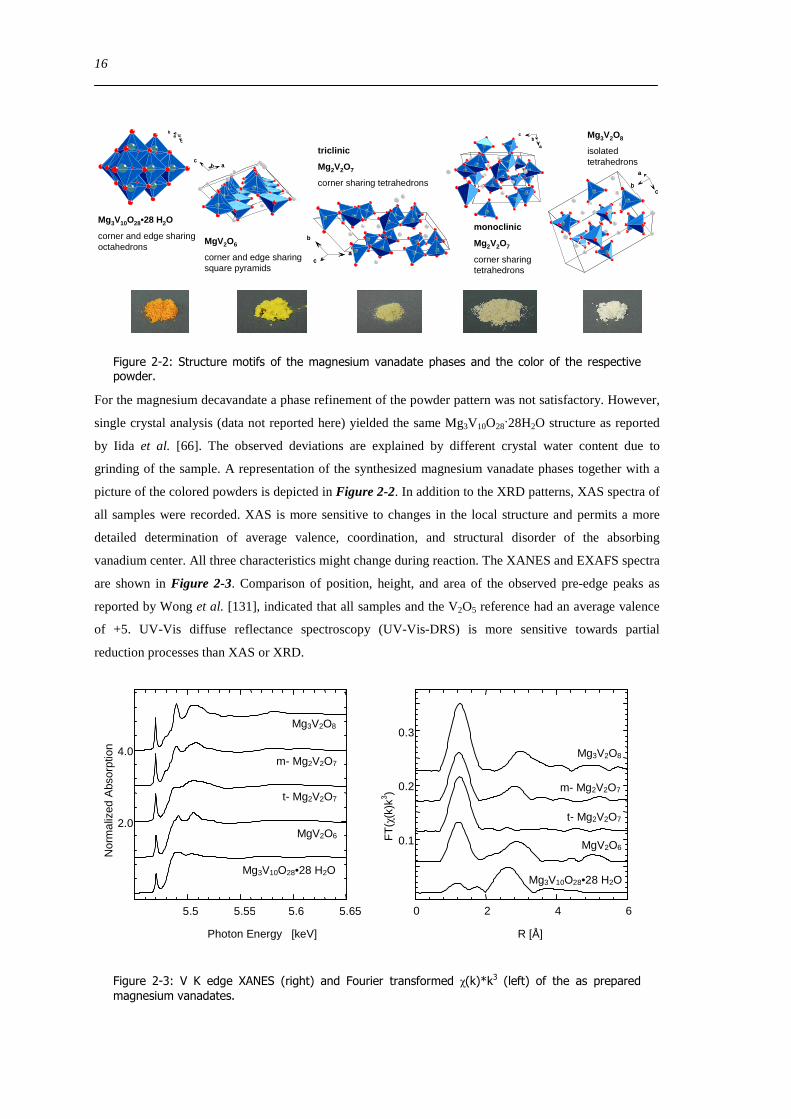
Figure 2-2 Structure motifs of the magnesium vanadate phases and the color of the respective powder
For the magnesium decavandate a phase refinement of the powder pattern was not satisfactory However
single crystal analysis (data not reported here) yielded the same Mg3V10O2828H2O structure as reported
by Iida et al [66] The observed deviations are explained by different crystal water content due to
grinding of the sample A representation of the synthesized magnesium vanadate phases together with a
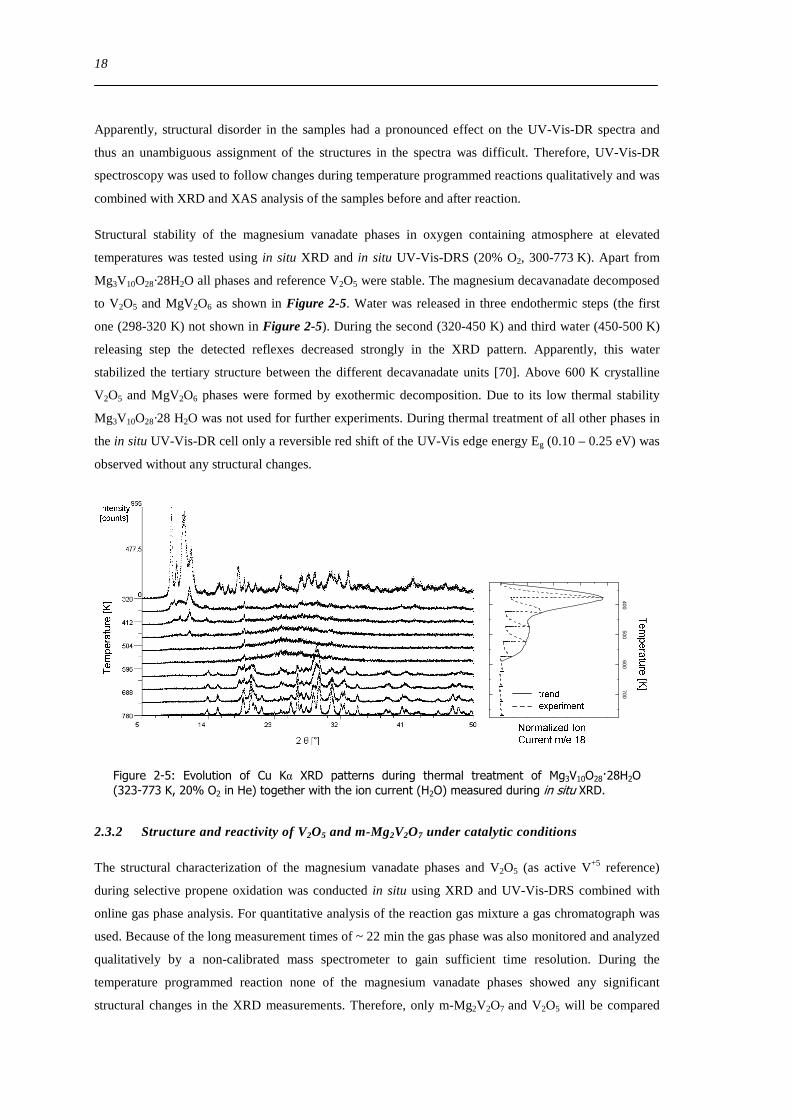
picture of the colored powders is depicted in Figure 2-2 In addition to the XRD patterns XAS spectra of
all samples were recorded XAS is more sensitive to changes in the local structure and permits a more
detailed determination of average valence coordination and structural disorder of the absorbing
vanadium center All three characteristics might change during reaction The XANES and EXAFS spectra
are shown in Figure 2-3 Comparison of position height and area of the observed pre-edge peaks as
reported by Wong et al [131] indicated that all samples and the V2O5 reference had an average valence
of +5 UV-Vis diffuse reflectance spectroscopy (UV-Vis-DRS) is more sensitive towards partial
reduction processes than XAS or XRD
FT
(χ(k
)k3 )
01
02
03
0 2 4 6
R [Aring]
Mg3V2O8
m- Mg2V2O7
t- Mg2V2O7
MgV2O6
Mg3V10O28bull28 H2O
20
40
55 555 56 565
Nor
mal
ized
Abs
orpt
ion
Photon Energy [keV]
Mg3V2O8
m- Mg2V2O7
t- Mg2V2O7
MgV2O6
Mg3V10O28bull28 H2O
Figure 2-3 V K edge XANES (right) and Fourier transformed χ(k)k3 (left) of the as prepared magnesium vanadates
17
0
1
2
3
4
225 800 400 600
F(R
infin)
Wavelength [nm]
C
D
A B
A C
B D
Mg3V10O28bull28 H2O
Mg3V2O8
m- Mg2V2O7
t- Mg2V2O7
MgV2O6
Figure 2-4 Left UV-Vis-DR absorption spectra of the as-prepared magnesium vanadate phases and differrent sample batches (Table 2-1) Right picture of the different colored samples batches of the monoclinic Mg2V2O7 phase (AB) and MgV2O6 (CD) phase (lines are the same as on the left side)
The UV-Vis-DR spectra of all samples are shown in Figure 2-4 Only LMCT transitions were visible
which are located at wavelengths lower than 600 nm Vanadium valences of V4+ V3+ would generate
intervalence and d-d transitions at longer wavelengths The absence of such bands matched the average
valence of V+5 observed in XAS Differences between the respective sample batches considerably
affected the UV-Vis-DR spectra As shown in Figure 2-4 right different sample batches of the prepared
MgV2O6 and m-Mg2V2O7 did not have the same color To gain information about the electronic structure
UV-Vis edge energies [99100127] and low energy LMCT band positions were determined The
differences in Eg value and the low energy LMCT band position (Table 2-2) between the samples batches
was ~ 02 eV This was more than the deviations achieved by simple dilution of the sample with the
reflectance standard (lt 01 eV) In XAS a damped XANES and EXAFS were observed for samples A and
C compared to sample B and D (Figure 2-4 right) XRD structure refinement resulted in poor residuals
(GOF RBragg) for sample C (Figure 2-4 right)
Table 2-2 UV-Vis edge energies (Eg) and low energy LMCT band positions extracted from UV-Vis-DR spectra in Figure 2-4
Sample Low energy LMCT [nm] Low energy LMCT [eV] Eg [eV]
Mg3V2O8 336 373 344
m-Mg2V2O7 (Batch A) 330 376 329
m-Mg2V2O7 (Batch B) 315 392 347
MgV2O6 (Batch D) 376 330 290
MgV2O6 (Batch C) 396 313 273
t-Mg2V2O7 385 322 285
Mg3V10O28middot28 H2O ~ 400 ~ 31 235
18
Apparently structural disorder in the samples had a pronounced effect on the UV-Vis-DR spectra and
thus an unambiguous assignment of the structures in the spectra was difficult Therefore UV-Vis-DR
spectroscopy was used to follow changes during temperature programmed reactions qualitatively and was
combined with XRD and XAS analysis of the samples before and after reaction
Structural stability of the magnesium vanadate phases in oxygen containing atmosphere at elevated
temperatures was tested using in situ XRD and in situ UV-Vis-DRS (20 O2 300-773 K) Apart from
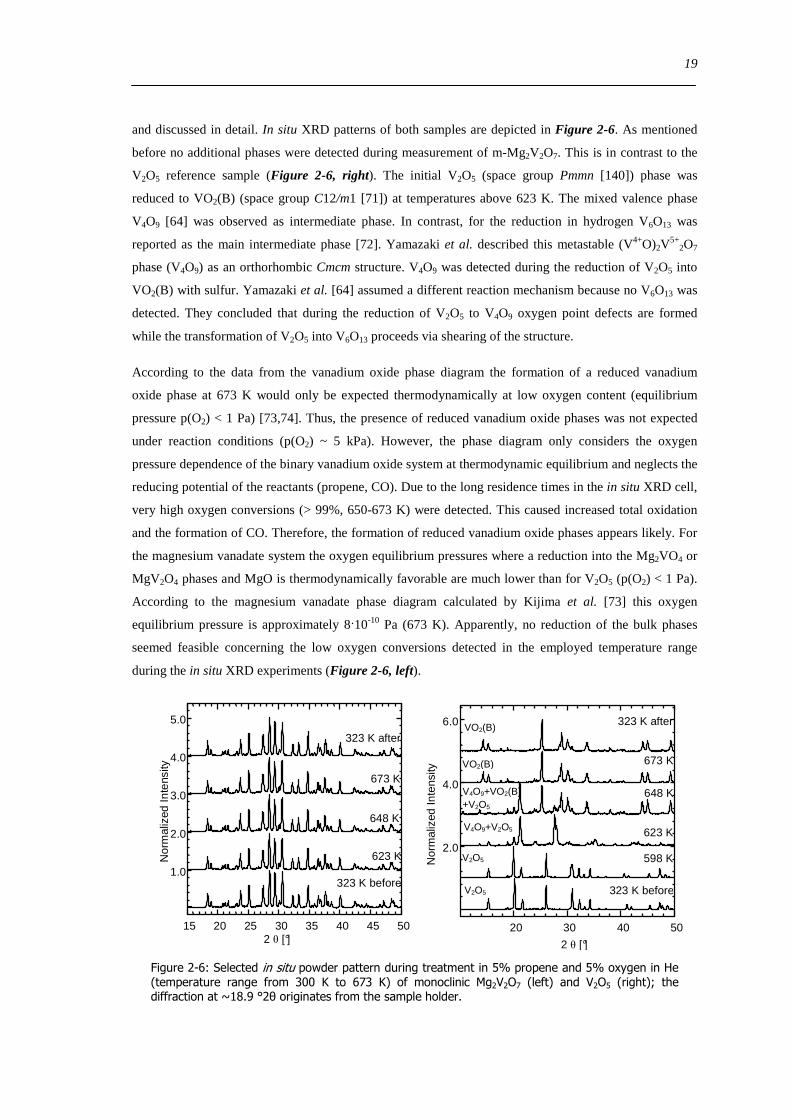
Mg3V10O28middot28H2O all phases and reference V2O5 were stable The magnesium decavanadate decomposed
to V2O5 and MgV2O6 as shown in Figure 2-5 Water was released in three endothermic steps (the first
one (298-320 K) not shown in Figure 2-5) During the second (320-450 K) and third water (450-500 K)
releasing step the detected reflexes decreased strongly in the XRD pattern Apparently this water
stabilized the tertiary structure between the different decavanadate units [70] Above 600 K crystalline
V2O5 and MgV2O6 phases were formed by exothermic decomposition Due to its low thermal stability
Mg3V10O28middot28 H2O was not used for further experiments During thermal treatment of all other phases in
the in situ UV-Vis-DR cell only a reversible red shift of the UV-Vis edge energy Eg (010 ndash 025 eV) was
observed without any structural changes
400500
600700
Normalized Ion Current me 18 au
Temperature [K
]
Figure 2-5 Evolution of Cu Kα XRD patterns during thermal treatment of Mg3V10O2828H2O (323-773 K 20 O2 in He) together with the ion current (H2O) measured during in situ XRD
232 Structure and reactivity of V2O5 and m-Mg2V2O7 under catalytic conditions
The structural characterization of the magnesium vanadate phases and V2O5 (as active V+5 reference)
during selective propene oxidation was conducted in situ using XRD and UV-Vis-DRS combined with
online gas phase analysis For quantitative analysis of the reaction gas mixture a gas chromatograph was
used Because of the long measurement times of ~ 22 min the gas phase was also monitored and analyzed
qualitatively by a non-calibrated mass spectrometer to gain sufficient time resolution During the
temperature programmed reaction none of the magnesium vanadate phases showed any significant
structural changes in the XRD measurements Therefore only m-Mg2V2O7 and V2O5 will be compared
19
and discussed in detail In situ XRD patterns of both samples are depicted in Figure 2-6 As mentioned
before no additional phases were detected during measurement of m-Mg2V2O7 This is in contrast to the
V2O5 reference sample (Figure 2-6 right) The initial V2O5 (space group Pmmn [140]) phase was
reduced to VO2(B) (space group C12m1 [71]) at temperatures above 623 K The mixed valence phase
V4O9 [64] was observed as intermediate phase In contrast for the reduction in hydrogen V6O13 was
reported as the main intermediate phase [72] Yamazaki et al described this metastable (V4+O)2V5+
2O7
phase (V4O9) as an orthorhombic Cmcm structure V4O9 was detected during the reduction of V2O5 into
VO2(B) with sulfur Yamazaki et al [64] assumed a different reaction mechanism because no V6O13 was
detected They concluded that during the reduction of V2O5 to V4O9 oxygen point defects are formed
while the transformation of V2O5 into V6O13 proceeds via shearing of the structure
According to the data from the vanadium oxide phase diagram the formation of a reduced vanadium
oxide phase at 673 K would only be expected thermodynamically at low oxygen content (equilibrium
pressure p(O2) lt 1 Pa) [7374] Thus the presence of reduced vanadium oxide phases was not expected
under reaction conditions (p(O2) ~ 5 kPa) However the phase diagram only considers the oxygen
pressure dependence of the binary vanadium oxide system at thermodynamic equilibrium and neglects the
reducing potential of the reactants (propene CO) Due to the long residence times in the in situ XRD cell
very high oxygen conversions (gt 99 650-673 K) were detected This caused increased total oxidation
and the formation of CO Therefore the formation of reduced vanadium oxide phases appears likely For
the magnesium vanadate system the oxygen equilibrium pressures where a reduction into the Mg2VO4 or
MgV2O4 phases and MgO is thermodynamically favorable are much lower than for V2O5 (p(O2) lt 1 Pa)
According to the magnesium vanadate phase diagram calculated by Kijima et al [73] this oxygen
equilibrium pressure is approximately 810-10 Pa (673 K) Apparently no reduction of the bulk phases
seemed feasible concerning the low oxygen conversions detected in the employed temperature range
during the in situ XRD experiments (Figure 2-6 left)
10
20
30
40
50
15 20 25 30 35 40 45 502 θ [deg]
Nor
mal
ized
Inte
nsity
323 K before
323 K after
673 K
648 K
623 K 20
40
60
20 30 40 50
2 θ [deg]
323 K before
323 K after
673 K
648 K
623 K
598 K V2O5
V2O5
V4O9+V2O5
VO2(B)
VO2(B)
V4O9+VO2(B) +V2O5
Nor
mal
ized
Inte
nsity
Figure 2-6 Selected in situ powder pattern during treatment in 5 propene and 5 oxygen in He (temperature range from 300 K to 673 K) of monoclinic Mg2V2O7 (left) and V2O5 (right) the diffraction at ~189 deg2θ originates from the sample holder
20
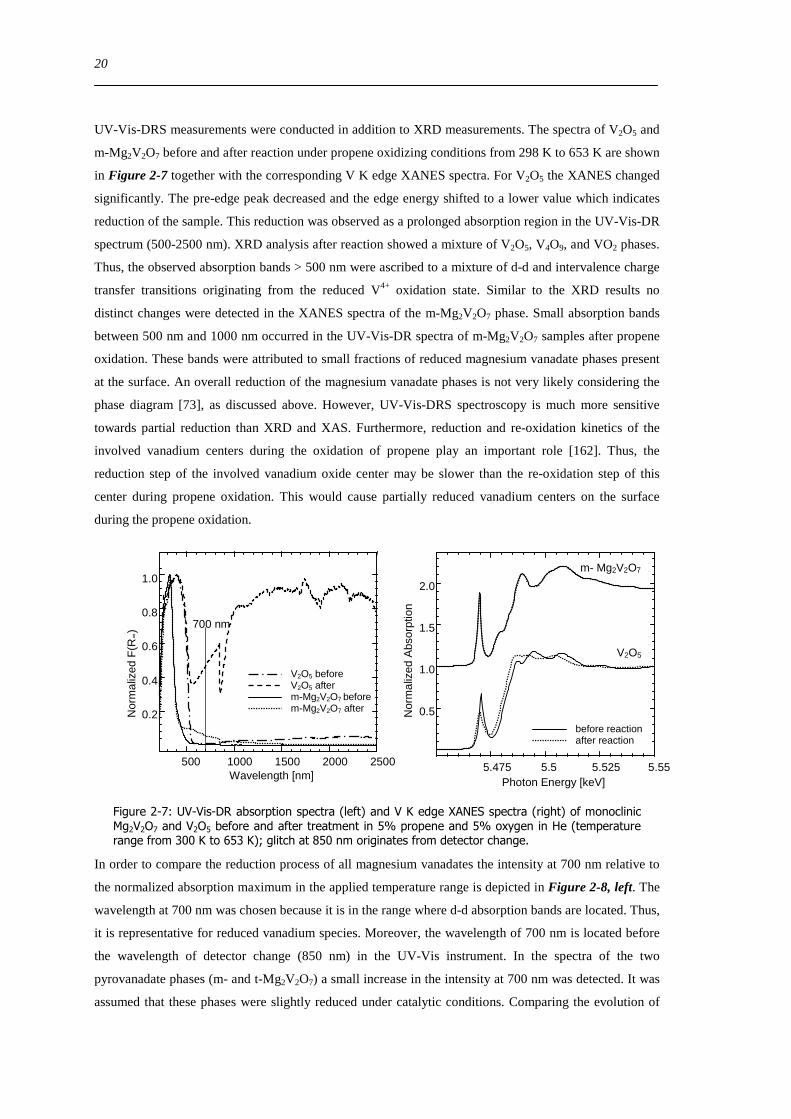
UV-Vis-DRS measurements were conducted in addition to XRD measurements The spectra of V2O5 and
m-Mg2V2O7 before and after reaction under propene oxidizing conditions from 298 K to 653 K are shown
in Figure 2-7 together with the corresponding V K edge XANES spectra For V2O5 the XANES changed
significantly The pre-edge peak decreased and the edge energy shifted to a lower value which indicates
reduction of the sample This reduction was observed as a prolonged absorption region in the UV-Vis-DR
spectrum (500-2500 nm) XRD analysis after reaction showed a mixture of V2O5 V4O9 and VO2 phases
Thus the observed absorption bands gt 500 nm were ascribed to a mixture of d-d and intervalence charge
transfer transitions originating from the reduced V4+ oxidation state Similar to the XRD results no
distinct changes were detected in the XANES spectra of the m-Mg2V2O7 phase Small absorption bands
between 500 nm and 1000 nm occurred in the UV-Vis-DR spectra of m-Mg2V2O7 samples after propene
oxidation These bands were attributed to small fractions of reduced magnesium vanadate phases present
at the surface An overall reduction of the magnesium vanadate phases is not very likely considering the
phase diagram [73] as discussed above However UV-Vis-DRS spectroscopy is much more sensitive
towards partial reduction than XRD and XAS Furthermore reduction and re-oxidation kinetics of the
involved vanadium centers during the oxidation of propene play an important role [162] Thus the
reduction step of the involved vanadium oxide center may be slower than the re-oxidation step of this
center during propene oxidation This would cause partially reduced vanadium centers on the surface
during the propene oxidation
05
10
15
20
5475 55 5525 555
Nor
mal
ized
Abs
orpt
ion
Photon Energy [keV]
before reaction after reaction
m- Mg2V2O7
V2O5
V2O5 before V2O5 after m-Mg2V2O7 before m-Mg2V2O7 after
02
04
06
08
10
500 1000 1500 2000 2500
Nor
mal
ized
F(R
infin)
Wavelength [nm]
700 nm
Figure 2-7 UV-Vis-DR absorption spectra (left) and V K edge XANES spectra (right) of monoclinic Mg2V2O7 and V2O5 before and after treatment in 5 propene and 5 oxygen in He (temperature range from 300 K to 653 K) glitch at 850 nm originates from detector change
In order to compare the reduction process of all magnesium vanadates the intensity at 700 nm relative to
the normalized absorption maximum in the applied temperature range is depicted in Figure 2-8 left The
wavelength at 700 nm was chosen because it is in the range where d-d absorption bands are located Thus
it is representative for reduced vanadium species Moreover the wavelength of 700 nm is located before
the wavelength of detector change (850 nm) in the UV-Vis instrument In the spectra of the two
pyrovanadate phases (m- and t-Mg2V2O7) a small increase in the intensity at 700 nm was detected It was
assumed that these phases were slightly reduced under catalytic conditions Comparing the evolution of
21
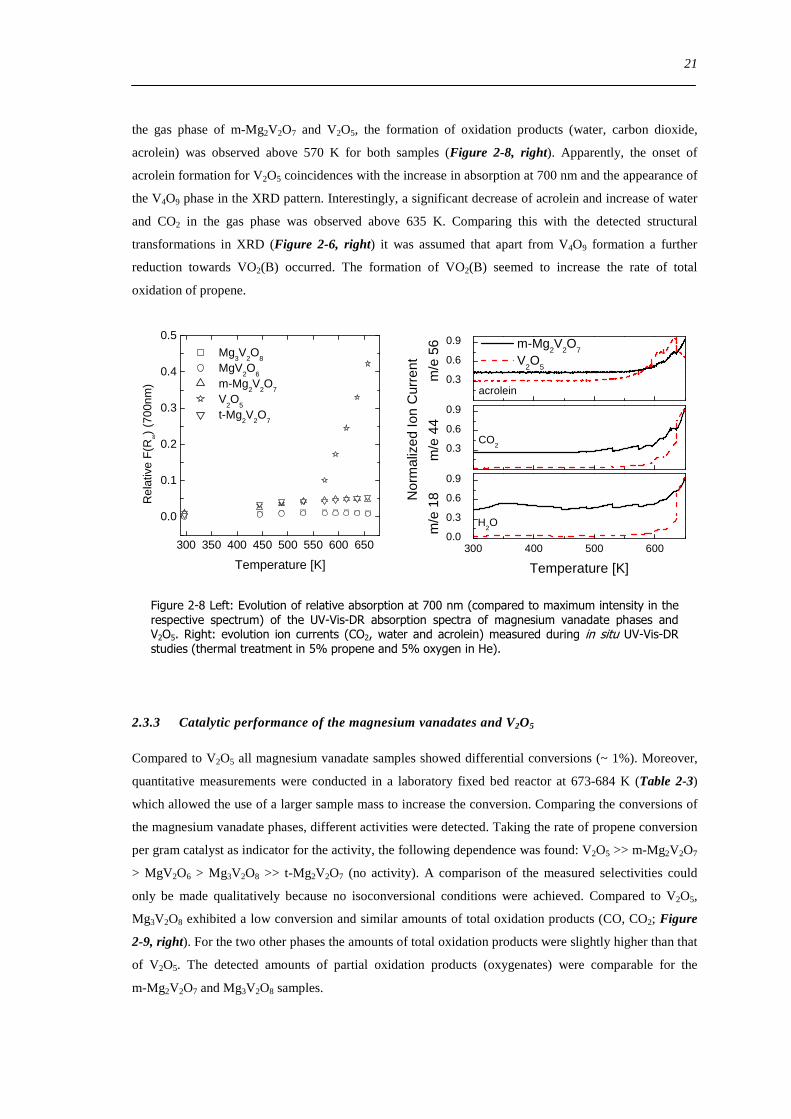
the gas phase of m-Mg2V2O7 and V2O5 the formation of oxidation products (water carbon dioxide
acrolein) was observed above 570 K for both samples (Figure 2-8 right) Apparently the onset of
acrolein formation for V2O5 coincidences with the increase in absorption at 700 nm and the appearance of
the V4O9 phase in the XRD pattern Interestingly a significant decrease of acrolein and increase of water
and CO2 in the gas phase was observed above 635 K Comparing this with the detected structural
transformations in XRD (Figure 2-6 right) it was assumed that apart from V4O9 formation a further
reduction towards VO2(B) occurred The formation of VO2(B) seemed to increase the rate of total
oxidation of propene
300 350 400 450 500 550 600 650
00
01
02
03
04
05
Mg3V
2O
8
MgV2O
6
m-Mg2V
2O
7
V2O
5
t-Mg2V
2O
7
Rel
ativ
e F
(Rinfin)
(700
nm)
Temperature [K]300 400 500 600
00
03
06
09
Temperature [K]
me
18
03
06
09
H2O
m-Mg2V
2O
7
V2O
5
me
44
03
06
09
CO2
acrolein
Nor
mal
ized
Ion
Cur
rent
me
56
Figure 2-8 Left Evolution of relative absorption at 700 nm (compared to maximum intensity in the respective spectrum) of the UV-Vis-DR absorption spectra of magnesium vanadate phases and V2O5 Right evolution ion currents (CO2 water and acrolein) measured during in situ UV-Vis-DR studies (thermal treatment in 5 propene and 5 oxygen in He)
233 Catalytic performance of the magnesium vanadates and V2O5
Compared to V2O5 all magnesium vanadate samples showed differential conversions (~ 1) Moreover
quantitative measurements were conducted in a laboratory fixed bed reactor at 673-684 K (Table 2-3)
which allowed the use of a larger sample mass to increase the conversion Comparing the conversions of
the magnesium vanadate phases different activities were detected Taking the rate of propene conversion
per gram catalyst as indicator for the activity the following dependence was found V2O5 gtgt m-Mg2V2O7
gt MgV2O6 gt Mg3V2O8 gtgt t-Mg2V2O7 (no activity) A comparison of the measured selectivities could
only be made qualitatively because no isoconversional conditions were achieved Compared to V2O5
Mg3V2O8 exhibited a low conversion and similar amounts of total oxidation products (CO CO2 Figure
2-9 right) For the two other phases the amounts of total oxidation products were slightly higher than that
of V2O5 The detected amounts of partial oxidation products (oxygenates) were comparable for the
m-Mg2V2O7 and Mg3V2O8 samples
22
V2O
5m-Mg
2V
2O
7MgV
2O
6Mg
3V
2O
8
00
02
04
06
08
10
S
elec
tivity
CO2
CO acetaldehyde propionaldehyde acetone acrolein acetic acid
0
2
4
6
8
10
12
14
propene conversion
Conversion [
]
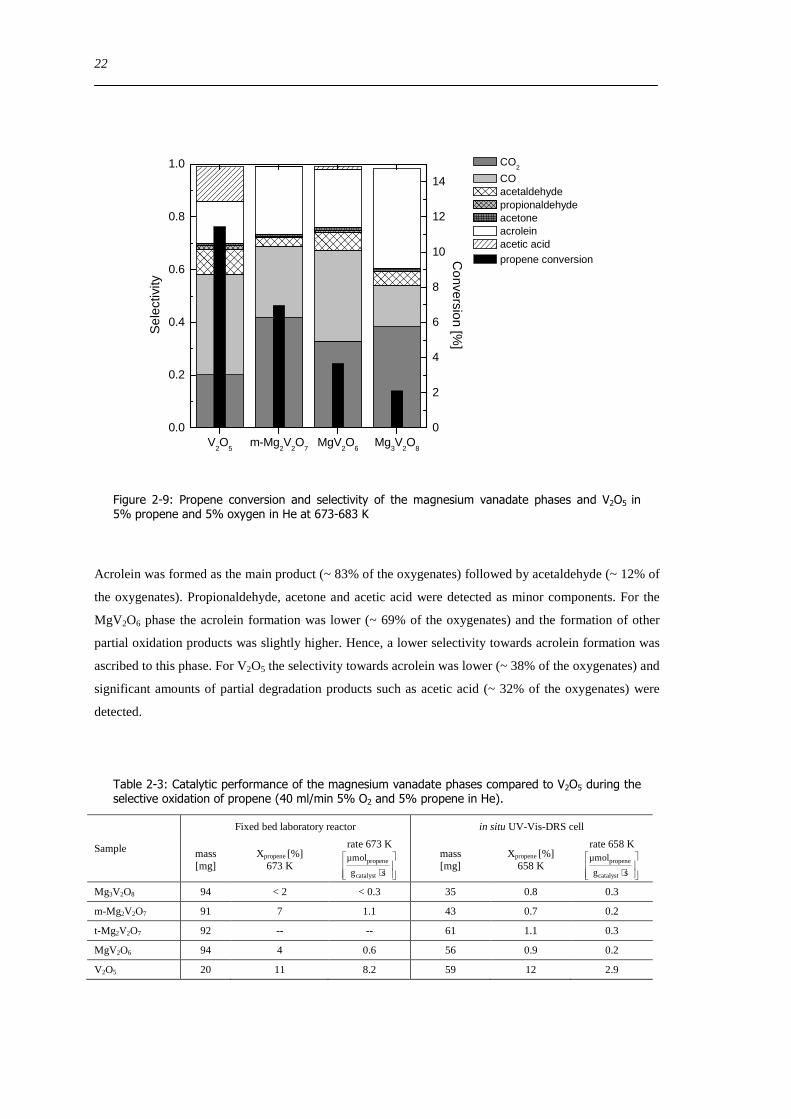
Figure 2-9 Propene conversion and selectivity of the magnesium vanadate phases and V2O5 in 5 propene and 5 oxygen in He at 673-683 K
Acrolein was formed as the main product (~ 83 of the oxygenates) followed by acetaldehyde (~ 12 of
the oxygenates) Propionaldehyde acetone and acetic acid were detected as minor components For the
MgV2O6 phase the acrolein formation was lower (~ 69 of the oxygenates) and the formation of other
partial oxidation products was slightly higher Hence a lower selectivity towards acrolein formation was
ascribed to this phase For V2O5 the selectivity towards acrolein was lower (~ 38 of the oxygenates) and
significant amounts of partial degradation products such as acetic acid (~ 32 of the oxygenates) were
detected
Table 2-3 Catalytic performance of the magnesium vanadate phases compared to V2O5 during the selective oxidation of propene (40 mlmin 5 O2 and 5 propene in He)
Sample
Fixed bed laboratory reactor in situ UV-Vis-DRS cell
mass [mg]
Xpropene [] 673 K
rate 673 K
sdot
sg
micromol
catalyst
propene mass
[mg] Xpropene []
658 K
rate 658 K
sdot
sg
micromol
catalyst
propene
Mg3V2O8 94 lt 2 lt 03 35 08 03
m-Mg2V2O7 91 7 11 43 07 02
t-Mg2V2O7 92 -- -- 61 11 03
MgV2O6 94 4 06 56 09 02
V2O5 20 11 82 59 12 29
23
234 Structural evolution of V2O5 and m-Mg2V2O7 under reductive conditions
A common explanation of activities and selectivities of magnesium vanadates in the ODH of propane is
the difference in their reduction behavior [5557] Here temperature-programmed reduction (TPR) in
propene (298-673 K 5 propene in 95 He) was used to investigate possible correlations between
catalytic performance and reducibility of magnesium vanadates and V2O5 Comparable to the results
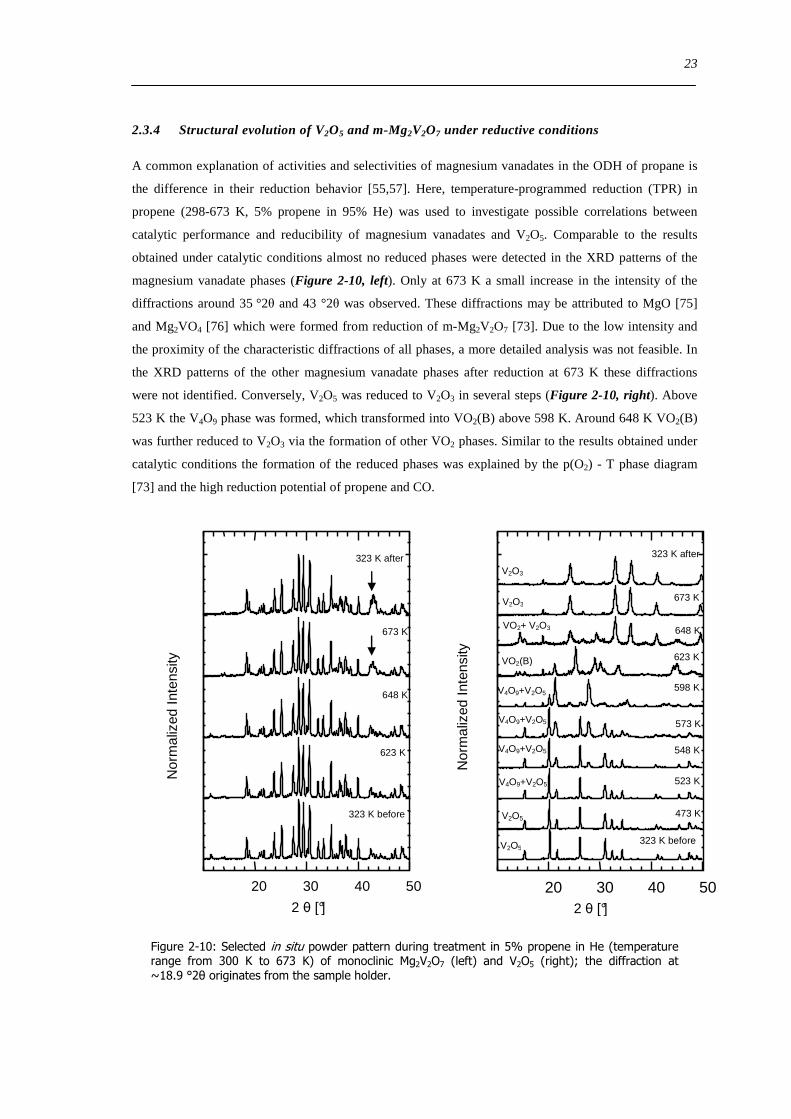
obtained under catalytic conditions almost no reduced phases were detected in the XRD patterns of the
magnesium vanadate phases (Figure 2-10 left) Only at 673 K a small increase in the intensity of the
diffractions around 35 deg2θ and 43 deg2θ was observed These diffractions may be attributed to MgO [75]
and Mg2VO4 [76] which were formed from reduction of m-Mg2V2O7 [73] Due to the low intensity and
the proximity of the characteristic diffractions of all phases a more detailed analysis was not feasible In
the XRD patterns of the other magnesium vanadate phases after reduction at 673 K these diffractions
were not identified Conversely V2O5 was reduced to V2O3 in several steps (Figure 2-10 right) Above
523 K the V4O9 phase was formed which transformed into VO2(B) above 598 K Around 648 K VO2(B)
was further reduced to V2O3 via the formation of other VO2 phases Similar to the results obtained under
catalytic conditions the formation of the reduced phases was explained by the p(O2) - T phase diagram
[73] and the high reduction potential of propene and CO
20 30 40 50
323 K after
673 K
648 K
623 K
323 K before
2 θ [deg]
Nor
mal
ized
Inte
nsity
20 30 40 50
Nor
mal
ized
Inte
nsity
2 θ [deg]
V2O5
V2O5
V4O9+V2O5
VO2+ V2O3
VO2(B)
V4O9+V2O5
V4O9+V2O5
V4O9+V2O5
323 K before
323 K after
673 K
648 K
623 K
598 K
573 K
548 K
523 K
473 K
V2O3
V2O3
Figure 2-10 Selected in situ powder pattern during treatment in 5 propene in He (temperature range from 300 K to 673 K) of monoclinic Mg2V2O7 (left) and V2O5 (right) the diffraction at ~189 deg2θ originates from the sample holder
24
Photon Energy [keV]
05
10
15
20
5475 55 5525 555
before reaction after reaction
Nor
mal
ized
Abs
orpt
ion
m- Mg2V2O7
V2O5
02
04
06
08
10
500 1000 1500 2000 2500
Nor
mal
ized
F(R
infin)
Wavelength [nm]
700 nm V2O5 before V2O5 after m-Mg2V2O7 before
m-Mg2V2O7 after
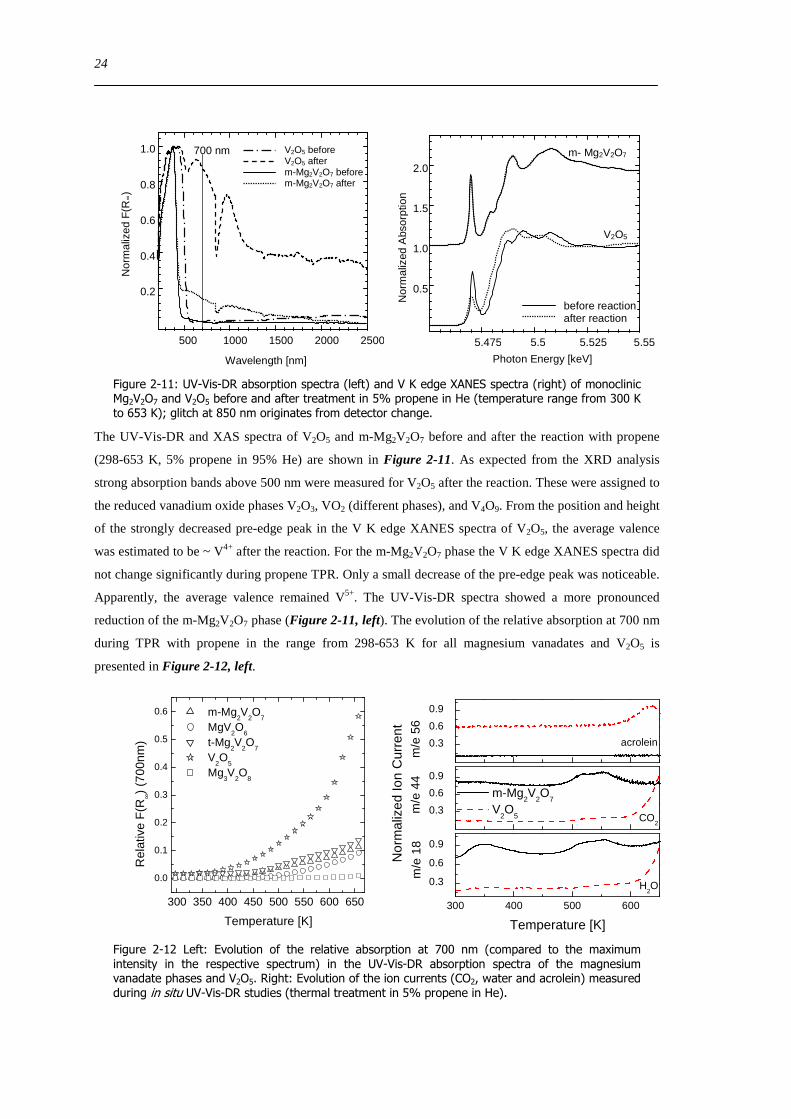
Figure 2-11 UV-Vis-DR absorption spectra (left) and V K edge XANES spectra (right) of monoclinic Mg2V2O7 and V2O5 before and after treatment in 5 propene in He (temperature range from 300 K to 653 K) glitch at 850 nm originates from detector change
The UV-Vis-DR and XAS spectra of V2O5 and m-Mg2V2O7 before and after the reaction with propene
(298-653 K 5 propene in 95 He) are shown in Figure 2-11 As expected from the XRD analysis
strong absorption bands above 500 nm were measured for V2O5 after the reaction These were assigned to
the reduced vanadium oxide phases V2O3 VO2 (different phases) and V4O9 From the position and height
of the strongly decreased pre-edge peak in the V K edge XANES spectra of V2O5 the average valence
was estimated to be ~ V4+ after the reaction For the m-Mg2V2O7 phase the V K edge XANES spectra did
not change significantly during propene TPR Only a small decrease of the pre-edge peak was noticeable
Apparently the average valence remained V5+ The UV-Vis-DR spectra showed a more pronounced
reduction of the m-Mg2V2O7 phase (Figure 2-11 left) The evolution of the relative absorption at 700 nm
during TPR with propene in the range from 298-653 K for all magnesium vanadates and V2O5 is
presented in Figure 2-12 left
300 350 400 450 500 550 600 650
00
01
02
03
04
05
06 m-Mg2V
2O
7
MgV2O
6
t-Mg2V
2O
7
V2O
5
Mg3V
2O
8
Rel
ativ
e F
(Rinfin)
(700
nm)
Temperature [K]300 400 500 600
03
06
09
acrolein
CO2
H2O
Temperature [K]
me
18
03
06
09
m-Mg2V
2O
7
V2O
5
me
44
03
06
09
Nor
mal
ized
Ion
Cur
rent
me
56
Figure 2-12 Left Evolution of the relative absorption at 700 nm (compared to the maximum intensity in the respective spectrum) in the UV-Vis-DR absorption spectra of the magnesium vanadate phases and V2O5 Right Evolution of the ion currents (CO2 water and acrolein) measured during in situ UV-Vis-DR studies (thermal treatment in 5 propene in He)
25
Except for the Mg3V2O8 phase all samples showed an increased absorption and thus reduction at
elevated temperatures above 400-450 K Relative to the maximum absorption peak the increase of
absorption at 700 nm followed the order V2O5 gtgt t-Mg2V2O7 m-Mg2V2O7 gt MgV2O6 gt Mg3V2O8
(no increase) For V2O5 above 600 K the slope of the curve increased in agreement with the detection of
VO2 in the XRD pattern This increase correlated with an enhanced formation of water CO2 and
acrolein Hence different reaction kinetics may be present when V5+ is fully reduced to V4+ The
evolution of the gas phase during TPR of V2O5 and m-Mg2V2O7 is depicted in Figure 2-12 right For
V2O5 two steps were observed in the formation of water and CO2 The first step occurred between 520 K
and 600 K and correlated with the formation of V4O9 The second step occurred between 600 K and
653 K in agreement with the formation of V4+ and V3+ phases detected in the XRD pattern (Figure 2-10
right) Increased formation of acrolein was only detected during the second step For m-Mg2V2O7 several
steps occurred in the formation of water (me 18) The first step between 300 K and 400 K was ascribed
to dehydration processes Above 450 K a second step was accompanied by the formation of CO2
(me 44) Afterwards the signal for me 18 and 44 slightly increased The CO2 formed may be due to
carbonates which formed during storage of the samples under ambient conditions
10 20 30 40 50
00
02
04
06
08
10
Nor
mal
ized
Inte
nsity
2 θ [deg]
MgO MgV
2O
4
Mg2VO
4
ab
c
Mg2+
V3+
O2-
ab
c
Mg2VO4
MgV2O4
Mg2+
V4+
O2-
Figure 2-13 The XRD powder pattern of Mg3V2O8 before (grey) and after (black) treatment in 5 propene in He (300-773 K) together with the structure motif of the possible Mg2-xV1+xO4 spinel type phases
To reveal the formation of reduced magnesium vanadate phases as predicted from the chemical potential
diagram [73] Mg3V2O8 was reduced at temperatures higher than the reaction temperature of 673 K The
XRD patterns before and after reduction at 773 K are shown in Figure 2-13 New phases were detected
(gt 748 K) which were assigned to MgO [75] and MgV2O4 [77] Mg2VO4 [76] (Figure 2-13) and
MgV2O4 form together with Mg3V2O8 spinel type Mg2-xV1+xO4 phases Hence the formation of these
reduced magnesium vanadate phases under reductive conditions was likely
26
235 Correlations of structure reducibility and catalytic activity of V2O5
The presence of reduced vanadium phases during catalytic propene oxidation was shown for V2O5 In
contrast to the literature [64] here a V4O9 phase was mainly detected at lower temperatures of 593- 648 K
(instead of V6O13) The V4O9 phase was further reduced towards VO2(B) at higher temperatures of 648-
673 K (Figure 2-6 right Figure 2-10 right) Formation of VO2(B) was accompanied by an increased
oxygen conversion and a decreased formation of partial oxidation products (Figure 2-8 right) During
reduction in hydrogen V6O13 was observed as mixed valence vanadium oxide phase [78] This can be
explained via a shearing of the V2O5 structure through the formation of oxygen defects [6071] In
contrast to propene hydrogen is much smaller and more likely to diffuse into the bulk structure of V2O5
Thus the different intermediate structures during reduction in hydrogen or propene may be explained by
the nature of the reducing agent The observed V4O9 is not the same V4O9 phase reported to be formed by
shearing of the V2O5 structure [61626579] The main difference to that phase was the (202) diffraction
at ~ 202 deg2θ Unfortunately this diffraction was not easily distinguishable from the (001) diffraction of
the V2O5 structure (~ 203 deg2θ) In the XRD pattern in Figure 2-10 (598 K) residuals of approximately
16 wt V2O5 may be present next to V4O9 Nevertheless the V4O9 structure reported by Yamazaki et al
[64] was used here because it was verified by structure refinement of the proposed structure to the
experimental powder pattern (Figure 10-9 appendix) For the other reported V4O9 structure [79] only an
indexed file was found in the PDF databases A representation of the vanadium oxide phases formed
during reduction and propene oxidation is depicted in Figure 2-14 Yamazaki et al [64] discussed that
the structure of V4O9 is similar to (VO)2P2O7 structures which are active in many oxidation reactions
[162] Hence it has to be investigated if a specific influence of the proposed structure motifs in this
structure (V5+ tetrahedrons and V4+ V5+ square pyramids and octahedrons) accounts for the catalytic
activity of V2O5 Alternately the formation of V4+ centers together with oxygen defects and mobile bulk
oxygen may be responsible However the formation of V4O9 coincides with the formation of reaction
products during in situ UV-Vis-DR measurements (Figure 2-8) This leads to the conclusion that V2O5 is
not the catalytically relevant vanadium oxide structure under selective propene oxidizing conditions
Moreover the role of lower vanadium valences of binary vanadium oxides in the reaction processes of
propene oxidation has to be investigated in more detail
a b
c
V+4
O-2b
c
V+5
O-2
a b
c
V
O
= RV-Ogt23 Aringlt28 Aring(001)
Figure 2-14 (100) plane of the phases formed during the reduction and oxidation of V2O5 in the presence of propene at elevated temperatures (left V2O5 Pmmn [140] middle V4O9 Cmcm [64] right VO2(B) C12m1 [71]) triangles indicate location of distorted octahedrons with V-O distances between 23 Aring and 28 Aring
27
236 Correlations of structure reducibility and catalytic activity of the magnesium vanadate
system
The in situ experiments indicated that the structure activity correlations of the magnesium vanadate
systems are different from V2O5 during the selective oxidation of propene in the employed temperature
range studied here Compared to V2O5 the bulk structures of the magnesium vanadates were stable under
reducing and propene oxidizing conditions Only for m-Mg2V2O7 a slight reduction was detected at 673 K
in the XRD pattern (Figure 2-10) Deep reduction of the bulk phase was only observed at temperatures
which were higher than the temperature of catalytic propene oxidation at 673 K (Figure 2-13) However
on the surface slight reduction was observed in UV-Vis-DRS of all magnesium vanadate phases (Figure
2-8 Figure 2-12) For non stoichiometric magnesium vanadate phases under reducing conditions
(propane) Burrows et al [80] observed the formation of spinel type Mg2-xV1+xO4 phases on the surface of
the catalysts Thus such structures may be present on the surface including the fact that these structures
were formed under reducing conditions at elevated temperatures (gt 748 K Figure 2-13) Except for the
t-Mg2V2O7 phase magnesium vanadate phases with higher degree of reduction (Figure 2-12) also
showed the higher propene conversion (Figure 2-9) Thus similar to the ODH of propane the activity
may be correlated to the reducibility and the lability of surface anions as proposed by Volta et al [81] for
the oxidative dehydrogenation of alkanes
Otherwise concerning the t-Mg2V2O7 phase there seems to be a more complex correlation between the
magnesium vanadate phases and catalytic activity UV-Vis-DRS showed that the t-Mg2V2O7 phase had
the same reducibility as the m-Mg2V2O7 phase but no activity was observed in the catalytic experiments
(Figure 2-10 Figure 2-12) A similar decrease of activity between those two phases was observed by
Sugiyama et al [57] during the ODH of propane A noticeable difference between the anion structures of
both pyrovanadate phases are very short V-V distances of 33 Aring in the t-Mg2V2O7 phase [139] This
causes a higher distortion of the V2O74-
dimers Moreover there are vanadium oxygen distances between
2 Aring - 3 Aring which implies a higher connectivity of the V2O74-
units than dimers The V2O74-
units seem to
form distorted chains (Figure 2-15) As these chains are not formed via corner sharing tetrahedrons like
in the structure of metavanadates (NH3VO4) the oxygen atoms are strongly coordinated by the vanadium
atom These vanadium centers in t-Mg2V2O7 may interact differently with the gas phase propene and
oxygen molecules which adsorb on the surface Thus a deeper understanding of the catalytic behavior of
those two phases will provide a more profound knowledge of the underlying reaction mechanism
Comparison of the activity and the selectivity of the other magnesium vanadate phases showed that the
same amounts of products were observed for Mg3V2O8 and the m-Mg2V2O7 phase For the m-Mg2V2O7
phase higher conversions were detected Hence the same catalytically active vanadium centers have to be
present in both samples However due to the lower reducibility and lower vanadium to magnesium
content a lower amount of these centers were present in the Mg3V2O8 under catalytic conditions For the
MgV2O6 phase a lower conversion and a decreased formation of acrolein among the oxygenated products
was detected This structure and a higher amount of vanadium in the oxide may allow a different
28
coordination of the reactants on the surface Furthermore other oxidizing species (more electrophilic O-
than nucleophilic O2- [162]) may have formed which are reacting with the propene molecule Examples of
such distinct differences between the various magnesium vanadate phases are not yet found in literature
for the reaction with propene Solonsa et al [51] detected the formation of acrolein solely for the MgV2O6
and the m-Mg2V2O7 phase
a
b
c
Figure 2-15 Scheme of the triclinic Mg2V2O7 structure (lines indicate connections between tetrahedral V2O7
4- units when the first V-O coordination sphere is extended from 23 Aring to 3Aring)
237 Comparison of the magnesium vanadate system and V2O5
Similar to the binary vanadium oxide system (V2O5) the catalytic activity of the ternary magnesium
vanadate system seemed to be correlated with the reducibility of the vanadium oxide species Conversely
if the selectivites of the reaction products were compared more differences were detected between the
magnesium vanadates and V2O5 Especially m-Mg2V2O7 and Mg3V2O8 exhibited an increased total
oxidation of propene compared to V2O5 This was explained by the enhanced basicity of the surface due
to the Mg content in the samples In general propene (considered as basic molecule) will be more readily
adsorbed at acidic centers than at basic centers and oxygenated reaction products (organic acids and
aldehydes) will adsorb more strongly on basic surfaces Thus through the stronger adsorption of the
oxygenated reaction products consecutive reactions such as total oxidation seemed to be favored on
magnesium vanadate catalysts The same concept was used to interpret their superior performance
compared to V2O5 in the ODH of propane However this concept explains only the formation of CO2 and
CO Comparison of the amounts of oxygenated reaction products showed a significantly higher selectivity
towards acrolein for the magnesium vanadate phases (69 - 83 of the oxygenates) than for V2O5
(~ 32 of the oxygenates) For V2O5 an increased formation of partial degradation products was detected
(acetic acid acetaldehyde) Thus a different nature of the oxygen species may be present on the surface
According to general concepts [162] electrophilic oxygen (O-) is proposed to be less selective than
nucleophilic oxygen (O2-) Similar to the concepts reviewed by Gryzybowska et al [162] the oxygen
species present may be correlated with the re-oxidation mechanism of the metal oxide during catalysis
Therefore a low re-oxidation rate of the reduced vanadium species may be present on the binary
vanadium oxide causes a higher amount of unselective O-
29
24 Summary
Various ternary magnesium vanadate phases were synthesized and tested for the selective oxidation of
propene Consistent with the results during ODH of propane the reactivity was correlated with the
reducibility of the surface of the respective magnesium vanadate phase The reactivity followed the order
monoclinic Mg2V2O7 gt MgV2O6 gt Mg3V2O8 Only the triclinic Mg2V2O7 showed no activity for the
selective oxidation of propene The different magnesium vanadate phases showed only marginal
differences in the selectivities towards oxygenated products such as acrolein Compared to measurements
perfomed with V2O5 total oxidation was increased but among the partial oxidation products mainly
acrolein was formed The overall activity of the magnesium vanadate phases was significantly lower than
that of the reference V2O5 In contrast to the magnesium vanadate system a bulk reduction was observed
for V2O5 during the selective oxidation of propene With the onset of catalytic activity formation of the
mixed valence phase V4O9 was observed V4O9 was further reduced to VO2(B) at elevated temperatures
Apparently the measured activities and selectivities of the ternary magnesium vanadate and the binary
vanadium oxide system indicated that apart from the reducibility of the vanadium oxide phases different
catalytic mechanisms may apply In summary the results presented here confirm the suitability of these
vanadium oxides as model systems for studying the influence of vanadium in selective propene oxidation
The formation of reduced phases for both binary and ternary systems is subject of further investigation
30
31
VXOYSBA-15 MODEL CATALYSTS
PART II
Spectroscopic and catalytic
investigations of VxOySBA-15 model
catalysts for selective propene
oxidation
32
33
3 Fundamentals and experimental details
31 Catalyst preparation
Mesoporous silica SBA-15 was prepared according to literature procedures [8283] 10 g poly(ethylene
glycol)-block-poly(propylene glycol)-block-poly(ethylene glycol) triblock copolymer (Aldrich pluronic
P-123) was dissolved in 605 ml water and 33 ml concentrated H2SO4 at 323 K in a water bath After
drop wise addition of 23 g tetraethyl orthosilicate (TEOS) the reaction mixture was stirred for 24 h at
323 K The resulting suspension was heated in a closed bottle to 381 K for 24 h The resulting white
powder was filtered and washed with deionized water and dried at 353 K for 72 h The dry powder was
calcined at 453 K for 4 h and for 12 h at 823 K
The ammonium decavanadate precursor was prepared as follows [84] 1 g NH4VO3 was dissolved in
33 ml water and heated to 343 K for 24 h The remainder was filtered off and 14 ml 50 acetic acid was
added drop wise to the resulting yellow solution After addition of 265 ml ethanol the deep orange
solution was cooled with a mixture of 11 acetone and dry ice The resulting orange powder was filtered
and washed with 1 ml ethanol and 2 ml diethyl ether Structure and phase purity were confirmed by single
crystal XRD analysis and X-ray powder diffraction (data not shown here)
Functionalized SBA-15 was prepared via a grafting ion exchange method described by Hess et al [32]
SBA-15 was heated in vacuum for 24 h and afterwards functionalized by adding
3-aminopropyltriethoxysilane (APTES) to a suspension of SBA-15 in toluene (1 ml APTES 15 ml
toluene 1 g SBA-15) The suspension was stirred under reflux for 24 h After distilling off the solvent
the content was washed with diethyl ether and afterwards filtered and washed in a Soxhlet apparatus with
diethyl ether for 24 h and then dried at room temperature for 72 h The dry powder was stirred in 03 M
HCl for 12 hours The content was filtered again washed with water and dried in air overnight
(functionalized SBA-15) Vanadium oxide supported on SBA-15 was prepared by adding appropriate
amounts of ammonium decavanadate to a suspension of functionalized SBA-15 in water and stirring
under ambient conditions for 12 h After filtration and washing with water the resulting powder was dried
at 323 K for 2 h and calcined at 823 K for 12 hours In comparison to the samples prepared by the
grafting ion exchange method two samples were prepared by incipient wetness and wet impregnation
method For the incipient wetness SBA-15 69 mg of ammonium decavanadate were dissolved in 1 ml
water and added drop wise to 1 g SBA-15 powder After each addition the powder was homogenized and
dried under ambient conditions The resulting powder was calcined at 823 K for 12 hours For wet
impregnation SBA-15 10 g NH4VO3 (Fluka 99) were dissolved in 450 ml water After addition of 5 g
SBA-15 the mixture was stirred at 343 K for 17 h The suspension was filtered hot and the resulting
powder was dried for 1 h at 323 K The powder was heated to 773 K (rate 1 Kmin) and calcined for 3 h
The samples were stored under ambient conditions (298 K air)
34
32 Catalyst characterization
321 X-ray absorption spectroscopy (XAS)
3211 Fundamentals
X-rays are able to penetrate condensed matter After passing through the matter the intensity of the
incident light (I0) is attenuated which can be expressed by Lambertrsquos law (I = I0 exp(-microd)) The
attenuation depends on the sample thickness (d) and the linear absorption coefficient (micro) The absorption
coefficient expressed as mass absorption coefficient refers to the density of a material The dependence
of the (mass) absorption coefficient on the energy of the incident light and the atomic number (Z) of the
absorbing material causes a smooth decay of the absorption coefficient However if the energy of the
incident light reaches the specific binding energy (EB) of tightly bound core electrons (1s 2s 2p levels)
these electrons will be excited to empty states above the Fermi level (Figure 3-1 left) At this energy a
sharp rise in absorption will be detected which is denoted as the absorption edge The absorption edge is
element specific and termed after the ground state of the electron (1s 2s 2 p12 2p32 ) as K LI LII or LIII
edge As a consequence of the absorption process a photoelectron and a core hole at the initial state of the
photoelectron are generated The core hole is refilled by electrons located at higher energy levels The
energy released by this relaxation process can be detected as fluorescence or as Auger and secondary
electrons which are generated The wavelength of the emitted light or the kinetic energy of the released
electrons are element specific
The photoelectron originating from the absorbing atom will interact with the electron density of adjacent
atoms in condensed matter (Figure 3-1 middle) The propagation of the photoelectron away from the
absorbing atom is considered as a spherical wave with a wavelength λ = 2πk with the wavenumber k
defined as
( )Be Eh
h
mk minus
= νπ
2
28 (31)
Where hν is the energy of the incident photon me the mass of the electron and EB the binding energy of
the photoelectron When the outgoing electron wave reaches neighboring atoms it will be scattered back
The resulting incoming spherical electron wave interferes with the outgoing photoelectron wave This
interference influences the absorption coefficient and thus the measured absorption spectra The impact of
the scattering process of the photoelectron on the absorption coefficient can be explained quantum
mechanically The absorption coefficient is proportional to the transition probability of the excited
electron Within a dipole approximation this transition probability is proportional to a function which
depends on the initial and the final state wavefunction of the exited electron (Fermirsquos golden rule) The
initial state is the localized electron in the core level The final state wavefunction is dependent on the
contribution from the outgoing electron wave and the backscattered electron wave (Figure 3-1)
35
Moreover the core hole in the initial state of the electron influences the final state wave function These
different energy depended contributions to the final wavefunction lead to oscillations of the absorption
coefficient that can be extracted from the X-ray absorption spectra
Figure 3-1 Left excitation process of the photoelectron middle scattering process of the photoelectron right typical V K edge spectrum
Typically XAS spectra are recorded in transmission mode The sample is placed between two ion
chambers that measure the intensity of the X-ray radiation Detection with fluorescence radiation or
Auger electrons is also possible in the cases of low element concentration and of light elements
surrounded by a strongly absorbing matrix The spectra are normally recorded from 100 eV before to a
few hundred eV after the absorption edge of the analyzed element in the sample X-ray absorption spectra
can be divided into two sections (Figure 3-1 right) The X-ray absorption near edge structure (XANES)
and the extended X-ray absorption fine structure (EXAFS)
The XANES region is located approximately 50 eV before and after the absorption edge This region
contains information about the electronic properties eg the oxidation state and the local geometry
around the absorbing atom The latter is mostly determined from pre-edge features that are located before
the absorption edge These are caused by dipole andor quadruple transitions of core electrons into empty
or partially filled d states near the Fermi level in transition metal elements For K edges (1s ground state)
dipole transitions are forbidden (Lapportersquos rule) in the case of centrosymmetric configurations
Therefore very symmetrical octahedrally coordinated absorption centers will not show significant pre-
edge features In contrast absorption centers in a strongly distorted environment eg tetrahedral allow a
mixing of d and p states and will show very intense pre-edge features For 3d transition metal elements
(V Cr Mn) the mixing of 3d and 4p states is more likely than for higher d band transition metal elements
(Mo W) After the absorption edge the XANES spectra show specific oscillations which are either due
to transitions to higher unoccupied states or to multiple scattering effects of the photoelectron which is
more dominant Typically this region is used as ldquofingerprintrdquo region in comparison with the spectra of
well characterized references A theoretical description is more difficult than for the EXAFS region but
possible using software codes like Feff 8 [85]
36
00
10
20
0
-10
-20
4 6 8 10
χ(k
)k
3
k [Aring -1]
00
001
002
00
-001
0 2 4 6R [Aring]
FT
[χ(k
)k
3]
00
025
05
075
10
000 5 100
norm
ab
sorp
tion
k [Aring -1]
micro(k)
micro0(k)
∆∆∆∆micro0
Figure 3-2 XAS data reduction left extraction of the χ(k) middle k3 weighted χ(k) right Fourier transformed k3 weighted χ(k)
The EXAFS region at higher energies is dominated by oscillations of the absorption coefficient caused by
scattering of the photoelectron at adjacent atoms The oscillatory part of the measured absorption
coefficient micro(k) can be separated from the atomic absorption of a free atom micro0(k) and is denoted as the
EXAFS function χ(k)
))(1()()( 0 kkmicrokmicro χ+sdot= (32)
The typical steps of XAFS data reduction are depicted in Figure 3-2 For a single scattering event the
EXAFS function can be described theoretically by a single scattering plane-wave approximation which is
well described in the literature [8687] The EXAFS function of an atom in a compound is the sum of all
scattering events caused by the presence of neighboring atoms
))(2sin()()(1
kkRkAk jj
j
j
j ϕχ +=sum=
(33)
with the amplitude
)(acute)(
)(222
2
)(220 kFe
kR
ekSNkA j
k
j
kR
jjj
jσ
λminus
minus
= (34)
The term Nj refers to the number of atoms in the jth coordination shell (coordination numbers) The
fraction term describes the damping of the signal The amplitude reduction term S02 describes the
intensity loss due to relaxation effects on the remaining electrons of the absorber atom caused by the core
hole The intensity loss of the spherical electron wave is considered by the term 1R2 The term
exp(-2Rjλ(k)) considers the finite lifetime of the core hole It is determined by the average free path
length of the photoelectron The term exp(-2k2σ2j) describes the influence of static and thermal disorder
on the amplitude It is determined by the disorder parameter σ2j The Fj(k) function considers the specific
backscattering power of each element and is strongly dependent on k Weighting the EXAFS function
with k allows emphasizes of light (eg oxygen k weight 0) or strong scatterers (eg platinum k weight
3) Typically the EXAFS function is Fourier transformed as shown in Figure 3-2right The envelope of
37
the Fourier transformed EXAFS function corresponds to a pseudo radial distribution around the absorbing
atom However the scattering process causes a phase shift of the electron wave (φ(k) Equation 33)
Therefore all distances in the experimental FT(χ(k)k3) are shifted by 04-05 Aring to lower values
Software codes like FEFF [88] allow the calculation of theoretical scattering paths from suitable
theoretical models The calculated theoretical parameters of the resulting scattering paths (eg N R σ2
E0) can be refined to the experimental XAFS data This allows the determination of local structure
parameters like coordination numbers distances and disorder parameters Modern software codes allow
the consideration of more complex scattering processes like multiple scattering [89]
3212 Experimental details of XAS
In situ transmission XAS experiments were performed at the V K edge (5465 keV) at beamlines E4 C
and A1 at the Hamburg Synchrotron Radiation Laboratory HASYLAB and at the XAFS beamline at
ANKA using a Si (111) double crystal monochromator The energy range used for V K near edge scans
(XANES) and extended XAFS scans (EXAFS) was 54-57 keV (~ 3 minscan) and 54-60 keV
(~ 20 minscan) respectively For fast measurements QEXAFS scans were performed (54-58 keV
~ 25 min) For in situ and ex situ XAFS measurements samples were mixed with BN and PE
respectively and pressed into self-supporting pellets (5 mm and 13 mm in diameter respectively) In
order to obtain an edge jump ∆microx below 10 at the V K edge 25 mg of 77 wt and 41 wt
VxOySBA-15 and 3 mg of 14 wt VxOySBA-15 diluted with BN (~ 15 mg) and 3-6 mg of bulk
vanadium oxides (eg Mg3V2O8 MgV2O6) diluted with PE or wax (~ 100 mg) were employed
Transmission XAS measurements were performed in an in situ cell (Figure 3-3) described previously
[90] Dehydration of VxOySBA-15 was conducted in 20 O2 and He (total flow 40 mlmin) in a
temperature range from 293 K to 623 K or 723 K at a heating rate of 5 Kmin and a holding time of
typically 30-60 min at 623 K Reaction tests were performed in 5 propene and 5 O2 in He in the
temperature range from 293 K to 723 K (5 Kmin total flow 30-40 mlmin) The gas atmosphere was
analyzed using a noncalibrated mass spectrometer in a multiple ion detection mode (Omnistar from
Pfeiffer) Ex situ XAFS measurements were performed in He atmosphere at room temperature
Figure 3-3 Left in situ transmission XAS cell right typical configuration of transmission beamlines
38
X-ray absorption fine structure (XAFS) analysis was performed using the software package WinXAS
v32 [91] Background subtraction and normalization of the extended XAFS scans were carried out by
fitting linear polynomials to the pre-edge and 3rd degree polynomials to the post-edge region of an
absorption spectrum respectively The extended X-ray absorption fine structure (EXAFS) χ(k) was
extracted by using cubic splines to obtain a smooth atomic background micro0(k) The FT(χ(k)k3) often
referred to as pseudo radial distribution function was calculated by Fourier transforming the k3-weighted
experimental χ(k) function multiplied by a Bessel window into R space EXAFS data analysis was
performed using theoretical backscattering phases and amplitudes calculated with the ab-initio multiple-
scattering code FEFF7 [88] EXAFS refinements were performed in R space simultaneously to the
magnitude and the imaginary part of a Fourier transformed k3-weighted experimental χ(k) using the
standard EXAFS formula [92] Structural parameters allowed to vary in the refinement were (i) the
disorder parameter σ2 of selected single-scattering paths assuming a symmetrical pair-distribution
function and (ii) distances of selected single-scattering paths Coordination numbers (CN) E0 shifts and
the amplitude reduction factor S02 were kept invariant in the final fitting procedures To ensure the
statistical significance of parameters during the fitting procedure correlations of specific parameters were
made to reduce the number of free running parameters and to improve the stability of the refinement The
reduction of the parameters was conducted in the following steps First the number of independent
parameters (Nind) was calculated according to the Nyquist theorem Nind = 2π ∆R ∆k + 2 In all cases
the number of free running parameters in the refinements was well below Nind Second confidence limits
were calculated for each individual parameter Third a so-called F test was performed to assess the
significance of the effect of additional fitting parameters on the fit residual The corresponding procedure
was adopted from the well-known library ldquoNumerical Recipes in Crdquo [93]
XANES Analysis was performed in using a shorter range of the XAFS scans Background subtraction and
normalization of the XAFS scans were carried out by fitting linear polynomials to the pre-edge and the
post-edge regions of an absorption spectrum 540-5456 and 552-560 keV respectively Peak height and
energy position (relative to 5465 keV) were determined for the point of maximum intensity of the pre-
edge feature The pre-edge peak area and the centroid energy (relative to 5465 keV) were determined
according to a method described by Chaurand et al [94] In short the section around the absorption edge
(5465 eV) was extracted from the normalized XANES spectra (~ 2 eV before edge ~ 10-150 eV after
edge) The background was fitted by an empirically interpolated function using a cubic spline function
with 12 independently adjustable knots After subtraction of the background the normalized pre-edge
feature was fitted using 2-3 pseudo Voigt functions (GaussLorentz factor was fixed to 07) The centroid
energy was determined from the center of gravity which is obtained from the area weighted energy
positions of the individual pseudo Voigt functions
39
322 UV-Vis Diffuse reflectance spectroscopy measurements
3221 Fundamentals
UV-Vis (200-800 nm) and near-infrared (NIR 800-2500 nm) spectroscopy are used for investigations of
electronic transitions of valence electrons eg in transition metal compounds Electronic excitations of
transition metal compounds may arise from metal centered transitions (MC) where the orbitals involved
are localized at the absorbing metal center In the case of vanadium compounds these are mainly due to
d-d transitions of vanadium centers in the oxidation states of +4 and +3 These transitions are located at
wavelengths higher than 600 nm and are weak for centrosymmetric configurations (octahedral
coordination) because they are forbidden according to the Laporte selection rule (∆ l = plusmn 1) Metal
centered transitions are theoretically well described by Crystal field and Ligand field theory [9596]
Another class of transitions are charge transfer (CT) transitions These are theoretical described by the
molecular orbital (MO) theory The molecular orbitals involved are formed by linear combination of
metal and ligand orbitals The transition takes place between an occupied electronic level located on a
donor atom to an empty level centered on an acceptor atom In the case of highly oxidized transition
metal oxide compounds (d0 configuration) mostly ligand-to-metal charge transfer transitions (LMCT)
appear These are due to a transfer of electron density from the oxygen lone pair orbital to an empty t2 or
e state of the d0 transition metal ion Mostly these transitions are located at a wavelength lower than
600 nm and are very intense (Laporte-allowed) Charge transfer transitions must be described by
molecular orbital theory which makes interpretation more complex than for metal centered transitions An
example for a calculation of the MnO4- ion is provided by Woodward et al [97] Moreover interpretation
of UV-Vis spectra becomes more complex in solid compounds as molecular orbitals tend to overlap and
form electronic band structures
Typically UV-Vis spectra are measured by transmission spectroscopy from liquid phase According to
Lampert-Beerrsquos law quantification can be made by measuring the ratio transmitted light (IT) to incident
light (I0) The resulting absorbance (Aλ) obtained from the transmission spectrum is proportional to the
sample thickness (d) the absorption coefficient (ελ) and the analyte concentration (canalyte)
danalyte
cIT
IA sdotsdot=
minus= λελ
0lg (35)
However in the solid phase light will normally not be transmitted through the sample Hence diffused
reflectance spectroscopy (DRS) is used for powdered samples It is described theoretically by a model
developed by Schuster Kubelka and Munk (denoted as SK or SKM model) In the following a short
introduction will be provided More detailed descriptions are found in the literature [959899]
Due to the fact that the wavelength of incident light has the same dimensions as the illuminated particles
(200-3000 nm) the incident light can be absorbed and scattered from the particles Scattering is mainly
due to specular (regular or mirror like) and diffuse reflectance which is depicted schematically in Figure
40
3-4 Specular reflectance is dependent on the angle of incidence In contrast diffuse reflected light will be
scattered in all directions There are three types of diffuse scattering (i) single scattering (ii) multiple
scattering and (iii) dependent scattering The last one is present when phase coherence exists between
photons scattered from neighboring centers It occurs when the average distance between two scattering
centers is smaller than 2-3 times the particle diameter which is the case for the VxOySiO2 samples
studied here For a theoretical description of dependent scattering the Radiative Transfer theory has to be
employed Schuster Kubelka and Munk simplified the solution of this model with the assumptions
explained below In short the incident light and the scattered light are considered as monochromatic
fluxes in (I) and out (J) of the sample bed These fluxes are connected to apparent absorption (K) and
scattering (S) coefficients These coefficients are related to the diffuse reflected light (remittance or
reflectance) of an infinitely thick sample (Rinfin) that can be determined experimentally
S
K
R
RRF =
infin
infinminus=infin 2
2)1()( with
ref
samplereal
R
RRR
infin
infininfininfin =asymp (36)
Rinfin cannot be determined directly from spectrometric measurements Typically the ratio of the remittance
of a sample related to the remittance of an ideal white standard reference is measured White standards
are MgO BaSO4 Spectralonreg (special Teflon) or the support material of a supported catalyst
The SKM model is only valid if some assumptions are made The incident light has to be diffuse and
monochromatic and the scattered light has to be scattered isotropically Which means that no specular
reflection occurs that is also strongly dependent on the absorption of the sample The sample has to be
infinitely thick which in practice is achieved with 1-5 mm sample thickness Also there must not be any
fluorescence The distribution of the absorbing centers has to be homogenous and the concentration of the
absorbing centers has to be low (F(Rinfin) lt 10) The latter has to be considered if DRS is used
quantitatively However in practice if no quantitative information is needed a better resolution is often
achieved for higher F(Rinfin) values To exclude spectral artifacts like damping of signals or asymmetric
signals a comparison with a diluted sample has to be performed
Figure 3-4 Left Praying MantisTM set up right illustration of specular and diffuse reflection
41
Normally diffuse reflectance spectra are measured in additional cells which are placed into a normal UV-
VIS-Spectrometer All types of measurement cells have in common that they reduce the amount of
specular reflection and mainly collect the diffuse reflected light For in situ measurements typically a
Praying MantisTM configuration (Harrick Scientific Products Inc) is used which allows a horizontal
placement of the sample bed (Figure 3-4) The in situ cell is depicted in Figure 3-5 A disadvantage of
the Praying MantisTM configuration is the low performance and high spectral noise in the UV range (200-
300 nm) because of the high number of optical mirrors Furthermore in the NIR range heat radiation is
detectable
3222 Experimental details of UV-Vis-DRS
UV-Vis-DRS measurements were conducted in a Jasco-V670 UV-Vis-NIR spectrometer using an ex situ
integration sphere or a Praying MantisTM in situ cell (Harrick Scientific Products Inc) as depicted in
Figure 3-5 MgO (ABCR) or pure SBA-15 were used as reflectance standard Samples were measured as
is or diluted with MgO for bulk vanadium oxides or SBA-15 in the case of VxOySBA-15 samples
Pretreatment was conducted in 20 O2 and He (total flow 50 mlmin) in a temperature range from 293 K
to 554-626 K using a heating rate of 4 Kmin Reaction tests were performed in 5 propene and 5 O2 in
He in the temperature range from 293 K to 676 K (4 Kmin total flow 40 mlmin) The gas atmosphere
was analyzed using a non-calibrated mass spectrometer in a multiple ion detection mode (Pfeiffer
Omnistar) and a gas chromatograph (section 331) A linear correction (Tsample = 080 T holder + 1 [degC]) was
applied to the sample holder temperature which was obtained by a separate measurement using a
thermocouple placed in the sample powder bed Figure 3-5
IinIout
Iin
Iout
Gas
inlet
Gas
outlet
Gas
inlet
Gas
outlet
Heating cartridge
sample powder bed
filter fleece
thermo-
couple
furnace control
sample cup block
optional
thermocouple
sample
optional
thermocouple
sample
O-ring viton
SiO2 window
water
cooling
Figure 3-5 Left schematic drawing of the Praying MantisTM in situ UV-Vis-DR cell right picture of the in situ UV-Vis-DR cell The position of the optional thermocouple that was used to determine the sample temperature is marked as dashed line
Data processing and the conversion of the measured spectra to Kubelka Munk units (denoted as KM or
F(Rinfin)) were performed using the spectra manger 20 software package from Jasco UV-Vis edge energies
(Eg) were determined from the spectra according to the procedure described in the literature [100]
Therefore the data was plotted as (F(Rinfin)hν)2 versus energy (eV) A linear function was fitted to the first
intensity increase in the spectrum The intersection of this fit line with the abscissa was used as the Eg
value An example is given in Figure 3-6
42
2 3 4 5 6
0
50
100
150
200
250
linear function
(F(R
infin
hν)2
Energy [eV]
Eg
experimental spectrum
Figure 3-6 Example for the determination of the UV-Vis edge energy Eg of V2O5
323 Powder X-ray diffraction (XRD)
The XRD measurements were made with an XPert PRO MPD diffractometer (θ-θ geometry) using Cu K
alpha radiation and a solid-state multi-channel PIXcelreg detector Wide angle scans (5-90 deg2θ
step=0013 deg2θ time=60 sstep variable slits) were collected in reflection mode The sample was
prepared as a cavity mount using a silicon sample holder The cavity had a diameter of 15 mm and a
depth of ~01 mm and the surface of the holder was cut in such a way that no Si-peaks were detected To
obtain absolute values for the (100) diffraction line of SBA-15 small angle scans (04-60 deg2θ and -04-
40 deg2θ step=0013 deg2θ time=90 sstep fixed slits) were collected in transmission mode with the sample
spread between two layers of Kaptonreg foil For comparison small angle scans (04-60 deg2θ
step=0013 deg2θ time=60 sstep fixed slits) were collected in reflection mode which had a better
resolution of the higher hkl diffraction lines of SBA-15
324 Physisorption measurements
Nitrogen physisorption isotherms were measured at 77 K on a BEL Mini II volumetric sorption analyzer
(BEL Japan Inc) The SBA-15 samples were outgassed under vacuum for about 20 min at 368 K and
16-20 h at 443 K before starting the measurement After outgassing the sample color had turned from
orange to a color between white and grey Data processing was done using the BELMaster V5230
software package The specific surface area was calculated using the standard BrunauerndashEmmettndashTeller
(BET) method in the relative pressure (pp0) range of 005ndash020 with a nitrogen area of 0162 nm2 The
adsorption branch of the isotherm was used to calculate pore size distribution and cumulative pore area
according to the method of Barrett Joyner and Halenda (BJH) [101]
43
325 Elemental analysis
The V content was determined by ICP-OES and X-ray fluorescence analysis (RFA) For ICP-OES
measurements (Jobin Yvon JY 38 Plus) 40-200 mg sample were dissolved in 01 M NaOH using a
100 ml volumetric flask (~ 40 mgL V content) Standard solutions made from V2O5 and SBA-15 were
used for calibration (20- 60 mgL V content) RFA measurements were performed on a PANalytical
AXIOS spectrometer (24 kW model) equipped with a Rh Kα source a gas flow detector and a
scintillation detector Samples were prepared as 13 mm pellets (100 mg sample diluted with 100 mg
wax) Quantification was performed using a standardless analysis which considered the finite thickness of
the sample in the calculation (Super Q 5 software package PANalytical) CHNS Element Analysis was
performed to determine the nitrogen content after APTES funtionalization and the amount of residual
carbon and sulfur content after calcination of SBA-15 and the functionalized SBA-15 samples For
CHNS-measurements a FlashEA 1112 NC Analyzer with CHNS-O configuration (ThermoFinnigan
ThermoElectron) was used The relative error was ~ 2
326 Solid state NMR
The solid state 29Si MAS-NMR-measurements were carried out on a Bruker Avance II spectrometer with
an external magnetic field of 94 T (ie a 1H resonance frequency of 400 MHz) and with a Bruker 4 mm
double resonance-H-X MAS-probe The 29Si resonance frequency was 7946 MHz Between 2000 and
20000 transients were recorded with a relaxation delay of 30 s Proton signals were decoupled during the
acquisition by applying TPPM (Two Pulse Phase Modulation) decoupling The 29Si spectra are referenced
to TMS (tetramethylsilane) using TKS (Tetrakis(trimethylsilyl)silan) as a secondary reference Data
analysis was performed using the software package DMfit by Massiot et al [102] Three Gaussian
functions were refined to the experimental spectrum of the SBA-15 samples The NMR shift was
determined for the bare SBA-15 sample and fixed in the refinement of the VxOySBA-15 samples
Samples treated under reaction atmosphere were prepared in the laboratory reactor and transferred into
the air tight sample containers in a moisture free glovebox
327 Raman spectroscopy
Ex situ Raman spectra were recorded using a FT-RAMAN spectrometer RFS 100 (Bruker) For excitation
a Nd YAG laser was used (1064 nm resolution 1 cm-1) The laser power was 100 mW as measured at
the position of the sample Samples were measured in glass containers For dehydrated VxOySBA-15
samples the sample containers were heated in a sand bath for 12 h at 673 K in a muffle furnace Directly
after the sample containers were taken out of the hot oven (673K) they were closed by melting to avoid
rehydration of the samples
44
In situ Raman spectra were measured at the TU Darmstadt An argon ion laser (Melles Griot) at 514 nm
and a helium neon laser at 632 nm were used for excitation For detection a transmissive spectrometer
equipped with a Pelletier CCD detector (Kaiser Optical HL5R) operated at 233 K was used The spectral
resolution was about 5 cm-1 The laser power was 3 mW for hydrated VxOySBA-15 samples and 3 and
6 mW for dehydrated VxOySBA-15 samples as measured at the position of the sample The powder
samples were introduced into a sample holder developed by Hess and Thielemann [103] The
accumulation time for the spectra was typically 33 min Heating was therefore performed stepwise
Pretreatment and dehydration experiments were conducted in synthetic air (total flow 25-60 mlmin) in a
temperature range from 293 K to 623-823 K Reaction tests were performed in 5 propene and 5 O2 in
N2 in the temperature range from 293 K to 823 K (total flow 70 mlmin) Gas atmosphere was analyzed
using a non-calibrated mass spectrometer in a multiple ion detection mode For in situ experiments
VxOySBA-15 was pressed at 70 MPa and sieved to obtain a particle size between 250 and 355 microm
328 Thermal analysis
Thermogravimetric (TG) and Differential thermal analysis (DTA) measurements were conducted using a
SSC 5200 from Seiko Instruments The gas flow through the sample compartment was kept very low to
avoid mass transport of the light SBA-15 particles out of the sample container It was adjusted to
50 mlmin (20 O2 80 N2) The gas atmosphere was analyzed using a noncalibrated mass
spectrometer in a multiple ion detection mode (Omnistar from Pfeiffer) Heating was conducted with a
rate of 5 Kmin in the range from 303 K to 623 K or 723 K in an aluminum cup For measurements up to
1173 K a corundum cup was used To extract the apparent activation energy of the dehydration step of the
Kieselgel 60 SBA-15 and VxOySBA-15 sample heating rates (β) of 2 4 6 8 and 10 Kmin were used
Before and after heating the furnace temperature was held for 60 min at 303 K and 623 K respectively
The apparent activation energy was determined by a method described by Vansant et al [104] for silica
samples The maximum of the DTA curve (temperature Tmax) was determined and used to calculate the
apparent activation energy for water desorption (ED) using an Arrhenius type linear plot (Equation 37)
CRT
ET D +=minus
maxmax lnln2 β (37)
329 Electron microscopy
Selected samples were measured in a high resolution Hitachi S-4000 scanning electron microscope
(SEM) to estimate particle size and distribution The samples were prepared using a standard sample
holder with carbon stickers The same samples were investigated by transmission electron microscopy
(TEM) on a FEI Tecnai Gsup2 20 S-TWIN instrument The instrument worked with a LaB6 cathode and a
acceleration voltage of 200 kV An EDX (EDAX) r-TEM SUTW detector (Si(Li)) was used for EDX
measurements Measurements on both instruments were performed by ZELMI (Zentraleinrichtung
Elektronenmikroskopie) at the TU Berlin
45
33 Catalytic characterization
331 Quantitative measurements ndash gas chromatography
Quantitative measurements were performed using a laboratory fixed bed reactor or the in situ
spectroscopic cells connected to a non calibrated mass spectrometer (Omnistar from Pfeiffer) and an
online GC system The double GC-system consisted of two connected Varian CP-3800 gas
chromatographs (Figure 3-7) A flow chart is depicted in Figure 3-7 and Figure 3-8 Hydrocarbons and
partial oxidation products were analyzed with the first Varian CP-3800 using a Carbowax 52CB capillary
column (25 m x 032 mm) connected via a Deans switch either to an Al2O3MAPD capillary column
(25 m x 032 mm) or to a fused silica restriction (25 m x 032 mm) each connected to a flame ionization
detector (FID) Permanent gases (O2 N2 CO2 CO) were separated using a Varian CP-3800 ldquoPermanent
Gas Analyzerrdquo with a Hayesep Q (2 m x 18rdquo) and a Hayesep T packed column (05 m x 18rdquo) as
precolumns combined with a back flush by using a 10-fold valve For separation a Hayesep Q packed
column (05 m x 18rdquo) was connected via a molesieve (15 m x 18rdquo) to a thermal conductivity detector
(TCD) Sample delivery tubes after the reaction cell outlet valves and sample loops where constantly
heated to 473 K Mixtures of 1-5 propene and 2-10 oxygen in helium were used for catalytic tests in
the range of 295-770 K Reactant gas flow rates of oxygen (20 O2 (48) in He (50) relative error plusmn 1
Linde Gas Air Liquide) propylene (10 propene (35) in He (50) relative error plusmn 1 Linde Gas) and
helium (60 Air Liquide) were adjusted through separate mass flow controllers to a total flow of 20-
75 mlmin (1013 hPa 273 K) Independent of the reaction gas flow rate the flow rate through the sample
loops was adjusted to 20 mlmin To ensure reproducibility of the measurements the sample gas flow was
stopped for several seconds before injection The injection of sample gas was performed simultaneously
in both gas chromatographs A scan time of approximately 22 min was achieved
Figure 3-7 Drawing of the used double GC setting
46
Pure reaction gases (10 propene or 20 O2 in He Linde) were used for calibration Gas mixtures were
employed for the calibration of CO CO2 (1 Vol in He relative error plusmn 2 Linde Gas) and acrolein
(01 Vol in He relative error plusmn 5 Linde Gas) All other compounds were calibrated using liquid
mixtures which were injected into the split injector using a 1microl syringe Each mixture contained known
concentrations of a solvent (eg pentane or MeOH) and a group of oxygenated products such as acids
(acrylic acid propionic acid acetic acid) aldehydes (acetaldehyde propione aldehyde acetone acrolein)
and alcohols (isopropyl alcohol n-propanol allylalcohol) together with acrolein in each mixture The
measured retention factor of gas phase acrolein and the ratio of the retention factor of the acrolein
standard and the respective analyte in the liquid phase were used to calculate the retention factor of the
analyte in the gas phase Measurement and analysis of the chromatograms was conducted using the
Galaxie Software package from Varian
MFC
COCO2 propene oxygen helium
MFC MFC MFC MFC
saturator
H2O
acrolein
vent
online
mass
spectrometer
N2 purge
reaction
cell
gas
chromatograph
oxygenates
analyzer
(FID)
gas
chromatograph
permanent gas
analyzer
(TCD)
gas mixing station
divider unit (reactorvent)
divider unit
(purgereaction gas)
MFC
tedlar bag
calibration
gas
connector
3-way valve
2-way valve
4-port 2-way valve
neelde valve
Figure 3-8 Simplified flow chart of the measurement set up used in the laboratory
47
332 Laboratory fixed bed reactor
The laboratory fixed bed reactor was made from a SiO2 tube (30 cm length 9 mm inner diameter) which
was placed vertically in a tube furnace The sample was placed on a frit (P3 porosity) in the center of the
isothermal zone of the furnace (Figure 3-9) In addition to the furnace temperature the reactor
temperature was recorded using a thermocouple placed next to the reactor tube Sample mass was 11 mg
for 77 wt 22 mg for 41 wt and 61 mg for 14 wt VxOySBA-15 Boron nitride (Alfa Aesar 200-
300 mg) was used for dilution To ensure differential reaction conditions the reactor was operated at low
propene conversion levels
Figure 3-9 Picture of the furnace and reactor used for quantitative measurements
333 Calculation of conversion selectivity carbon balance and reaction rate
Conversion of propene and selectivity of products were calculated on the basis of mole flows calculated
from the measured volume fractions The calculation of conversion (X) of a key compound (k propene)
and selectivity (S) towards the desired product (p) can be made using the following equations (38 39)
derived from standard text books [105]
Conversion inkn
outkninkn
kX)(
)()(
amp
ampamp minus= (38)
Selectivity )(
)(
)()(
)()(
k
k
knkn
pnpnS
in
in
P νν
sdotminus
minus=
ampamp
ampamp
(39)
48
Instead of the mole fraction flow (namp ) of a compound (i) the measured volume fractions (Vol) of the
reactants were used for calculation Both quantities are proportional if the total pressure (open system)
total volume volume flow (Vamp ) and temperature (473 K GC sample loop) are assumed to be constant
during the measurements ( )()()( iVoliVin propprop ampamp ) The equations used for conversion (310) and carbon
balance (311) are listed below Carbon balances were higher than 095
Conversion inkVol
outkVolinkVol
kX)(
)()( minus= (310)
Carbon balance
in
outoutout
x
out
in
out
HCVol
HCVolCOVolCOVolpxVol
CVol
CVol
)(3
)(3)()())((a
)(
)(
63
632
1
px
sdot
sdot+++sdot=sum
(311)
For calculating the selectivity a detailed knowledge of the reaction network is required for the
determination of the stoichiometric factors However partial oxidation of propene may proceed over a
complex reaction network including consecutive reactions and many side products Therefore some
simplifications were made for calculating the selectivity Instead of stoichiometric factors the fraction of
carbon atoms in a molecule (apn) relative to propene (ak=3) was used Equation 312 was used to ensure
the reliability of the selectivities obtained
( )outin
inout
k
pn
pnkVolkVol
pnVolpnVola
a
S)()(
)()(
minus
minussdot= (312)
sum
sdot
sdot=
1
)(
)(
x k
px
k
pn
pn
pxVola
a
pnVola
a
S (313)
Measurements were only used if reasonable values were calculated for Spn (~ 08-10) Deviations can be
explained by the fact that the analytical GC system used did not permit measuring compounds like
formaldehyde or formic acid which may be formed during the reaction To ensure comparability of the
selectivity obtained all selectivities were calculated using Formula 313 The selectivity therein does not
refer to the propene conversion but to the sum of all measured reaction products
49
Reaction rates for a compound (i) were determined using Formula 314 The catalyst mass refers to the
total mass of the sample used or to the respective mass (mcat) of the transition metal in the sample
(eg V)
60
sdotsdotsdotsdot
=mcat
ii Vm
VVolXr
amp
sg
molri sdot
=][ (314)
334 Estimation of mass and heat transport limitations
To ensure that the quantitative gas phase data were determined in a regime of kinetic control mass
transport and heat transport effects were estimated for propene oxidation reactions
C3H6 (g) + 45 O2 (g) rarr 3 CO2 (g) + 3 H2O (g) ∆HR0 = -1926 kJmol
C3H6 (g) + 3 O2 (g) rarr 3 CO (g) + 3 H2O (g) ∆HR0 = -1077 kJmol
C3H6 (g) + O2 (g) rarr C3H4O (g) + H2O (g) ∆HR0 = -329 kJmol
The selective oxidation of propene towards acrolein was chosen as model reaction for the VxOySBA-15
catalysts Many side reactions eg total oxidation to CO and CO2 are possible for this reaction In the
case of total oxidation the reaction enthalpy (∆HR0) is much higher than for the oxidation to acrolein
Thus an increased heat formation will be observed in the case of propene combustion to CO2 A
calculation of the heat that will occur at 10 propene conversion (assumption that only CO2 is formed) is
shown below The reaction enthalpies were calculated using the parameters in Table 3-1 The parameters
for the mole stream calculation are listed in Table 3-2
mole stream calculation XV
VVolVrn
m
sdotsdot=minus=amp
amp
(315)
heat stream calculation min170 JHnQ R =∆sdot= ampamp (316)
With the calculated heat stream of 17 Jmin the increase of temperature (T) of a 1g material with a heat
capacity (CP) of 1 J(gk) can be calculated
TmCQ P ∆sdotsdot= ampamp (317)
min17KmC
QT
P
=sdot
=∆amp
amp (318)
That the heat formed can be dissipated by the sample gas stream was inferred from the following
calculation A sample gas stream of 40 mlmin was assumed with an estimated density of 05 gcm3
Therefore a mass stream of 20 gmin gas is present The heat capacity (Cp) of the gas was estimated to be
1 JgK Considering these values the sample gas stream can dissipate 20 Jmin which is higher than the
heat of combustion formed Thus heat transport should not disturb the measurements
50
Table 3-1 Standard enthalpy of formation ∆Hf0 for selected compounds in the gas phase
Compound ∆Hf0 Ref
H2O (g) -24183 kJmol [106]
O2 (g) 0 kJmol [106]
CO2 (g) -3935 kJmol [106]
CO (g) -1105 kJmol [106]
C3H6 (g) -204 kJmol [106]
C3H4O (g) -670 kJmol [107]
To ensure that no mass transport limitations due to the mesoporous SBA-15 were present an estimation
based on the Weisz-Prater criterion was conducted The parameters used are listed in Table 3-2
12
1
2 ltltsdot
sdot+=minuspropenepropeneeff
cateffPW cD
rnLC
ρ (319)
Given that the pore diameter dp of 8 nm is much shorter than the particle length of ~ 50 microm Knudsen
diffusion was assumed
3
~p
Kneff
dDD
ν=cong (320)
using the average velocity of propene molecules in the gas phasepropene
B
m
Tk
sdotsdotsdot=
πν 8~ (321)
A resulting Weisz modulus (CW-P) of 011 indicates that the reaction proceeds much slower than the
propene diffusion into the pores of SBA-15 Thus mass transport effects can be neglected
Table 3-2 Parameters used to estimate the mass and heat transfer
Parameter Value Description
L 50 microm particle length
n 1 reaction order
reff (5 Vol 40 mlmin X=10) 136 mol(gs) effective reaction rate
T 673 K reaction temperature
mpropne 710-23g mass of propene molecule
R 8314 J(molK) gas constant
kB 13810-13 JK Boltzmann constant
dp 8 nm pore diameter
Mpropene 42 gmol molarmass of propene
DKn (673 K) 510-8 m2s Knudsen diffusion of propene in SBA-15
cpropene (673 K 5 Vol) 136 10-6 molcm3 propene concentrations
ρcat 2 gcm3 assumed density of SBA-15
mV 22414 moll molar volume of an ideal gas
namp (5 Vol 40 mlmin X=10) 910-6 molmin mole stream of propene
ν~ (673 K) 184 ms average velocity of propene molecules
51
4 Comparison of various preparation methods for the
synthesis of supported vanadium oxide catalysts
41 Introduction
Various methods for the preparation of supported transition metal oxide catalysts are reported in
literature They range from rather simple methods like wet impregnation [840] and incipient wetness
procedures [37108] to multi step reactions where the transition metal precursor is chemically bound to
the support (silica) [32] before the calcination step For all preparation methods the formation of disperse
vanadium oxide structures for calcined VxOySiO2 samples (hydrated and dehydrated state) exhibiting a
vanadium density lower than 25 Vnm2 was reported [2332] Three typical preparation methods were
tested to verify that independent of the preparation method applied the same well dispersed vanadium
oxide structures will be present on the SBA-15 support First samples were prepared by wet
impregnation which means stirring SBA-15 in an aqueous NH4VO3 solution Second samples were
prepared by incipient wetness using an aqueous (NH4)6V10O28middotxH2O solution Third samples were
prepared by a graftingion exchange method introduced by Hess et al [32] (Figure 4-1) For all samples
vanadium coverages below 25 Vnm2 were intended The structure of the prepared samples were
characterized in the calcined (hydrated and dehydrated) and uncalcined state using XRD XAFS Raman
spectroscopy and UV-Vis-DRS Additionally physisorption electron microscopy and small angle XRD
measurements were conducted to detect changes in the mesoporous SBA-15 support
Si OH
Si OH
Si OH
Si OH
Si OH
Si OH
1 (EtO)3Si(CH2)3NH2
2 HCl
Si(CH2)3NH3+Cl
-Si O
Si O
OEt
O
Si(CH2)3NH3+Cl
-Si O
Si O
Si(CH2)3NH3+Cl
-Si O
Si O
1 V10O286-
Si(CH2)3NH3+Si O
Si O
OEt
O
Si(CH2)3NH3+Si O
Si O
Si(CH2)3NH3+Si O
Si O
+ V10O286- VxOySBA-15
823 K 12 h
Figure 4-1 Simplified reaction scheme of the APTES grafting and ion exchange ((NH4)6V10O28middotxH2O precursor) preparation process of VxOySBA-15 samples
42 Results and discussion
421 Surface area and vanadium content of the VxOySBA-15 samples
The results of the vanadium element analysis and the BET surface area determination are listed in Table
4-1 More detailed tables of the physisorption results small angle XRD and CHN element analysis are
provided in the appendix (Table 10-1 Table 10-2) The vanadium dispersion in Table 4-1 was referred to
the BET surface area determined for the calcined VxOySBA-15 samples A similar V dispersion was
52
determined on different samples Therefore the sample names refer to the vanadium content (ICP) of the
samples (eg 77 wt VxOySBA-15)
Table 4-1 BET surface area (SBET) and vanadium content of the calcined VxOySBA-15 samples () sample prepared via the ion exchange method in Figure 4-1 () sample prepared by wet impregnation with a NH4VO3 solution () sample prepared by incipient wetness using a (NH4)6V10O28 solution The values in brackets refer to the V content determined by RFA)
Sample SBET [m2g-1] wt ICP (RFA) mmol V g Vdensity nm2
30 wt VxOySBA-15 522 30 (31) 059 07
57 wt VxOySBA-15 403 57 (57) 112 17
50 wt VxOySBA-15 270 -- (50) (098) (22)
77 wt VxOySBA-15 386 77 (73) 151 (143) 24 (22)
41 wt VxOySBA-15 427 41 (41) 081 11
14 wt VxOySBA-15 542 14 (14) 028 03
422 Structural characterization of the uncalcined VxOySBA-15 samples
In Figure 4-2 the Raman and UV-Vis-DR spectra of the uncalcined vanadium containing SBA-15
samples are depicted The Raman spectrum of the SBA-15 support exhibited a broad band at 490 cm-1
(cyclic tetrasiloxane rings D1 defect mode) and less intense bands at ~ 600 800 and 977 cm-1 (cyclic
trisiloxane rings D2 defect mode) [2332] In the spectrum of the uncalcined 57 wt VxOySBA-15
sample (wet impregnation) additional bands at 930 899 648 496 261 and 212 cm-1 were detected
(Figure 4-2 left D) These were assigned to crystalline NH4VO3 which may be a residual from the
preparation process A broad background in the region 870-1000 cm-1 indicates the presence of a second
vanadium oxide species V-O stretching vibrations of vanadium V5+ compounds are typically located in
this spectral range [109] In the Raman spectrum of the 30 wt VxOySBA-15 sample (incipient wetness)
in Figure 4-2 (left B) two ranges of additional Raman bands were detected (~ 970 cm-1 622-850 cm-1)
Thus a mixture of different vanadium oxide phases may be present on the SBA-15 support The Raman
spectra of the samples prepared by the ion exchange method are shown in Figure 4-2 (middle) together
with the spectra of the SBA-15 support and APTES modified SBA-15 Characteristic Raman bands for
APTES modified SBA-15 (Figure 4-2 middle F) were detected (~ 950 and ~ 1050 cm-1 assigned to C-C
stretching vibrations of the propylammonium group in the grafted APTES group [32]) Hess et al [32]
reported that the decavanadate ion is preserved during the grafting process Indeed characteristic Raman
bands of the decavanadate precursor were detected at 992 658 321 253 221 and 184 cm-1 (Figure 4-2
middle G) for the high loaded uncalcined 50 wt VxOySBA-15 sample (22 Vnm2 similar to sample
77 wt VxOySBA-15) Compared to the spectrum of the bulk V10O286- reference the Raman band at
958 cm-1 was broadened and increased relative to the band at 992 cm-1 With decreasing vanadium
loading the low frequency bands lt 700 cm-1 were not observed in the Raman spectra and the Raman band
at 992 cm-1 decreased significantly For all samples a band around 1040-1050 cm-1 was observed in the
spectra which was assigned to the grafted APTES Due to the broad Raman signal at 960 cm-1 in the
Raman spectra of all uncalcined VxOySBA-15 samples (ion exchange method) more than one vanadium
oxide species may be present
53
250 500 750 1000
Raman shift [cm-1]
Nor
mal
ized
Ram
an In
tens
ity
A
B
C
D
E
250 500 750 1000
Raman shift [cm-1]
Nor
mal
ized
Ram
an In
tens
ity
C
G
H
I
F
A 05
10
15
20
25
30
250 350 450 550
Wavelength [nm]
F(R
infin)
)
F
Crsquo
Ersquo
G
H
D
I
B
Figure 4-2 Raman spectra (left middle) and UV-Vis-DRS spectra (right) of the uncalcined VxOySBA-15 samples and selected vanadate references (A) SBA-15 (B) 30 wt VxOySBA-15 incipient wetness (C) 8 wt V (NH4)6V10O28middotxH2O mixed with SBA-15 (Crsquo) (NH4)6V10O28middotH2O (D) 57 wt VxOySBA-15 wet impregnation (E) 8 wt V NH4VO3 mixed with SBA-15 (Ersquo) NH4VO3 (F) APTES functionalized SBA-15 (G) 50 wt VxOySBA-15 ion exchange (H) 41 wt VxOySBA-15 ion exchange (I) 14 wt VxOySBA-15 ion exchange
The UV-Vis-DR spectra of the uncalcined samples together with the spectra of the bulk references
NH4VO3 and (NH4)6V10O28middotxH2O are depicted in Figure 4-2 (right) For all samples no similarity with
the spectra of the bulk vanadate references was observed Independent of the preparation method similar
absorption bands were recorded in the spectra of all uncalcined VxOySBA-15 samples These absorption
bands were located at 405 nm 335 nm and 264-274 nm The low energy absorption band matches the
maximum in the absorption spectrum of (NH4)6V10O28middotxH2O For the 14 wt VxOySBA-15 sample
prepared via the ion exchange method the band at 405 nm was hardly detectable The UV-Vis edge
energy was determined for the uncalcined VxOySBA-15 samples according to a method described by
Gao and Wachs [100] The UV-Vis edge energy can provide information about the coordination and the
degree of polymerization of the absorbing vanadium species A more detailed introduction and discussion
will be provided in Chapter 5 UV-Vis edge energies in the range of 27-29 eV were determined for the
high loaded sample (50 wt VxOySBA-15) prepared via the ion exchange method and for the samples
prepared via the incipient wetness method For the low loaded 41 and 14 wt VxOySBA-15 samples
prepared via the ion exchange method UV-Vis edge energies in the range of 33-34 eV were determined
In the UV-Vis-DR spectrum of uncalcined 57 wt VxOySBA-15 prepared by wet impregnation (Figure
4-2 right D) two regions of the absorption spectrum could be used to determine the UV-Vis edge
energy UV-Vis edge energies at 28 and 32 eV may be derived from the UV-Vis-DR spectrum
Considering the presence of NH4VO3 in the Raman spectra of this sample the second band may indicate a
NH4VO3 species (UV-Vis edge energy 32 eV) on the support Values in the range of 27-29 eV were an
indicator for a higher polymerized species present on the support exhibiting at least a 5-fold or higher
coordination Values between 32-34 eV were assigned to less polymerized vanadium oxide centers
(small chains or dimers) which exhibit a tetrahedral rather than a square pyramidal coordination of the
absorbing vanadium species
54
2
4
6
55 555 56Photon Energy [keV]
Nor
mal
ized
Abs
orpt
ion
B
C
D
E
F
A
G
20
40
0
4 6 8 10
k [Aring-1]
χ(k)
k3
B
C
D
E
F
A
G
01
02
03
04
0 2 4 6R [Aring]
FT
(χ(k
)k3 )
B
C
D
E
F
A
G
Figure 4-3 V K edge XANES spectra (left) χ(k)k3 (middle) and FT(χ(k)k3) (right) of the uncalcined VxOySBA-15 samples and selected vanadate references (A) (NH4)6V10O28middotxH2O (B) NH4VO3 (C) 57 wt VxOySBA-15 wet impregnation (D) 30 wt VxOySBA-15 incipient wetness (E) 50 wt VxOySBA-15 ion exchange (F) 41 wt VxOySBA-15 ion exchange (G) 14 wt VxOySBA-15 ion exchange
XAFS measurements were conducted to obtain information about the structure of the main vanadium
oxide phase of the uncalcined VxOySBA-15 sample The V K edge XANES spectra the derived χ(k)k3
and the Fourier transformed χ(k)k3 are depicted in Figure 4-3 The XANES spectra of the uncalcined
57 wt (wet impregnation) 30 wt (incipient wetness) and 77 wt (ion exchange) VxOySBA-15
samples were comparable to that of the (NH4)6V10O28middotxH2O reference sample (Figure 4-3 left) In
contrast to the decavanadate reference sample the pre-edge peak was enhanced in the XANES spectra of
the uncalcined VxOySBA-15 samples The χ(k)k3 of the uncalcined 57 wt (wet impregnation)
30 wt (incipient wetness) and 77 wt (ion exchange) VxOySBA-15 samples showed oscillations
similar to the χ(k)k3 of the (NH4)6V10O28middotxH2O reference The amplitude of these oscillations was
decreased (Figure 4-3 middle) After the Fourier transformation of the χ(k)k 3 of the uncalcined 57 wt
(wet impregnation) 30 wt (incipient wetness) and 77 wt (ion exchange) VxOySBA-15 samples
mainly two signals in the range of 1-2 Aring and 3-4 Aring were detected in the envelope of the FT(χ(k)k3)
(Figure 4-3 right not phase shift corrected) The first signal was assigned to V-O scattering
contributions and the second signal was assigned to V-V scattering paths Comparing the FT(χ(k)k3) of
the high loaded uncalcined VxOySBA-15 samples with that of the (NH4)6V10O28middotxH2O reference no direct
similarity was observed The increased V-O signal (1-2 Aring) in the FT(χ(k)k3) of these samples resembled
that of lower coordinated vanadate species like NH4VO3 Therefore a mixture of decavanadate vanadium
centers and lower coordinated vanadium centers may be present on the SBA-15 support With decreasing
vanadium loading the signal at higher distances (3-4 Aring) decreased in the FT(χ(k)k3) of the uncalcined
VxOySBA-15 samples prepared by the ion exchange method The first signal (1-2 Aring) in the FT(χ(k)k3)
of the uncalcined 14 wt and 41 wt VxOySBA-15 samples (ion exchange) was slightly enhanced
compared to the 57 wt and 77 wt VxOySBA-15 samples Nevertheless it was still smaller than in
the FT(χ(k)k3) of most tetrahedral vanadate reference compounds (Chapter 525) like NH4VO3 Thus
vanadium centers exhibiting a strong structural disorder may be present The rather high pre-edge peak in
55
the XANES spectra of the uncalcined 14 wt and 41 wt VxOySBA-15 (ion exchange) suggested that
these vanadium centers may have a tetrahedral coordination (Chapter 524)
423 Vanadium dispersion in the calcined VxOySBA-15 samples
XRD measurements were conducted to exclude the presence of crystalline vanadium oxide phases on the
support after calcination of the VxOySBA-15 samples The resulting powder patterns are depicted in
Figure 4-4 A physical mixture of ball milled V2O5 and SBA-15 was prepared (8 wt V) for reference
The domain size of the V2O5 crystallites was estimated from the integral breadth using the Debye-
Scherrer equation It was approximately 170 Aring ((200) diffraction line 1538 deg2θ) The powder pattern in
Figure 4-4 shows that a mixture of these V2O5 crystallites and SBA-15 still exhibited well resolved and
characteristic diffraction lines of V2O5 Only the 57 wt VxOySBA-15 sample (wet impregnation)
showed characteristic diffraction lines of V2O5 The V2O5 in the sample prepared via wet impregnation
was probably formed by decomposition of NH4VO3 residuals that were detected in the Raman spectra of
the uncalcined 57 wt VxOySBA-15 sample (wet impregnation) (Figure 4-2 left)
20 40 60 80
2 θ [deg]
SBA-15
77 wt VxOySBA-15ion exchange
(8 wt V) ball milled V2O5
mixed with SBA-15
Rel
ativ
e In
tens
ity
20 40 60 80
2 θ [deg]
(8 wt V) ball milled V2O5
mixed with SBA-15
57 wt VxOySBA-15wet impregnation
14 wt VxOySBA-15ion exchange
41 wt VxOySBA-15ion exchange
30 wt VxOySBA-15incipient wetness
Rel
ativ
e In
tens
ity
Figure 4-4 XRD powder patterns (Cu Kα) of the calcined VxOySBA-15 samples bare SBA-15 and a physical mixture of ball milled V2O5 and SBA-15 (8 wt V)
XRD is not sensitive to minority phases of less than 5 phase fraction Therefore Raman spectra of the
calcined VxOySBA-15 samples were recorded In Figure 4-5 (left and middle) the Raman spectra of the
hydrated (as prepared) and the dehydrated (air 673 K 12 h) state of the calcined VxOySBA-15 samples
are depicted together with the Raman spectrum of a physical mixture of V2O5 and SBA-15 (3 wt V)
The spectra of all calcined VxOySBA-15 samples showed characteristic bands for the hydrated state
(1028 706 270 160 cm-1) and dehydrated state (~ 1040 cm-1) of dispersed vanadium oxide centers on
silica supported samples as reported in the literature [2332] Therefore after calcination a disperse
vanadium oxide species may have formed as the majority phase on the SBA-15 support in all samples
Characteristic Raman bands of V2O5 were only detected for the 57 wt VxOySBA-15 sample prepared
via wet impregnation
56
10
20
30
40
50
250 500 750 1000
Nor
ma
lized
Ram
an In
tens
ity
Raman shift [cm-1]
250 500 750 1000
77 wt VxOy-SBA-15 ion exchange
57 wt VxOy-SBA-15 wet impregnation
3 wt VxOy-SBA-15 incipient wetness
SBA-15
physical mixture (3 wt V) V2O5 in SBA-15
77 wt VxOy-SBA-15 ion exchange
57 wt VxOy-SBA-15 wet impregnation
3 wt VxOy-SBA-15 incipient wetness
SBA-15
physical mixture (3 wt V) V2O5 in SBA-15
Raman shift [cm-1]
hydrated state dehydrated state
Nor
ma
lized
Ram
an I
nten
sity
0
4
1
2
3
250 600300 R [Aring] 500
F(R
infin)
Wavelength [nm]
V2O5E
C
D
A
B
dehydrated state
Figure 4-5 Raman (left middle) and UV-Vis-DRS spectra (right) of the calcined VxOySBA-15 samples and selected vanadium oxide references (A) 30 wt VxOySBA-15 incipient wetness (B) 57 wt VxOySBA-15 wet impregnation (C) 77 wt VxOySBA-15 ion exchange (D) 41 wt VxOySBA-15 ion exchange (E) 14 wt VxOySBA-15 ion exchange (samples diluted 11 or 12 with SBA-15 for UV-Vis-DRS measurments)
The characteristic Raman bands of V2O5 were present in the hydrated and dehydrated state of the calcined
57 wt VxOySBA-15 (wet impregnation) Crystalline vanadium oxide phases (determined by Raman
spectroscopy) originating from the preparation method were excluded for samples prepared by the
incipient wetness and ion exchange procedures in the range of V loading employed
UV-Vis-DRS and XAFS play a pronounced role for the structural characterization of the VxOySBA-15
model catalysts as will be discussed in more detail in the following chapters In order to show that for all
preparation methods used similar spectra and thus similar dispersed vanadium oxide species were
obtained all samples were dehydrated and investigated in situ using UV-Vis-DRS and XAFS Figure 4-5
(right) shows the UV-Vis-DR spectra of all calcined VxOySBA-15 samples after dehydration at 554 K
(20 O2 in He) The spectra of all VxOySBA-15 samples exhibited absorption bands with a maximum in
the range of 280 nm (dehydrated 14 wt and 30 wt VxOySBA-15) and 310 nm (dehydrated 41 wt
57 wt and 77 wt VxOySBA-15) These absorption bands were assigned to a highly dispersed
tetrahedral vanadium oxide species (Chapter 521) Furthermore in the spectra of the calcined and
dehydrated VxOySBA-15 samples (except for the 14 wt VxOySBA-15 sample) a small absorption
band at approximately 405 nm was observed This absorption band was significantly pronounced in the
spectrum of the 57 wt VxOySBA-15 sample (wet impregnation) Considering the presence of V2O5 in
the Raman spectrum and XRD pattern of this sample the absorption band at 405 nm was assigned to a
V2O5 phase The absence of characteristic V2O5 Raman bands in the Raman spectra of all other samples
indicate that the slight increase at 405 nm in the UV-Vis-DR spectra was caused by very small amounts
of crystalline V2O5
57
XAFS measurements of dehydrated VxOySBA-15 samples corroborated that the majority vanadium
oxide phase on SBA-15 was a dispersed tetrahedral phase (dehydrated samples Figure 4-6 623 K 20
O2 in He) For all dehydrated VxOySBA-15 samples similar V K edge XANES χ(k)k3 and Fourier
transformed χ(k)k3 were obtained The V2O5 phase present in the 57 wt VxOySBA-15 sample (wet
impregnation) was not visible in the XAFS spectra Therefore the fraction of crystalline V2O5 in 57 wt
VxOySBA-15 was less than 5-10 of the vanadium oxide species present on the (SBA-15) support in this
sample The FT(χ(k)k3) of the dehydrated 57 wt VxOySBA-15 sample prepared by wet impregnation
resembled that of the dehydrated 41 wt and 77 wt VxOySBA-15 samples (Figure 4-6 right) All
three samples showed an increased amplitude at higher distances (3-4 Aring) in the FT(χ(k)k3) The low
loaded 14 wt (ion exchange) and 30 wt (incipient wetness) dehydrated VxOySBA-15 samples
exhibited a comparable envelope of the FT(χ(k)k3) At higher distances (3-4 Aring) the amplitude was
reduced In the UV-Vis-DR spectra (Figure 4-5 right) of these samples the absorption maximum was
shifted from ~ 300 nm to ~ 280 nm compared to the spectra obtained for the higher loaded dehydrated
VxOySBA-15 samples Hence minor differences in the structure of the supported dehydrated vanadium
oxide species may be present in the spectra of the low (14 and 30 wt V) and higher loaded (41-
77 wt V) dehydrated VxOySBA-15 samples A more detailed discussion of these results is given in
Chapter 5
55 555 56
A
B
C
D
Photon Energy [keV]
Nor
mal
ized
Abs
orpt
ion
5
10
15
20
25
0
4 6 8 10
A
B
C
D
E
k [Aring-1]
χ(k)
k3
005
01
015
02
0 2 4 6
A
B
C
D
E
R [Aring]
FT
(χ(k
)k3 )
Figure 4-6 V K edge XANES spectra (left) χ(k)k3 (middle) and FT(χ(k)k3) (right) of the calcined and dehydrated VxOySBA-15 samples (20 O2 in He 623 K) (A) 57 wt VxOySBA-15 wet impregnation (B) 30 wt VxOySBA-15 incipient wetness (C) 77 wt VxOySBA-15 ion exchange (D) 41 wt VxOySBA-15 ion exchange (E) 14 wt VxOySBA-15 ion exchange
424 Characterization of the SBA-15 support of the VxOySBA-15 samples prepared by the ion
exchange method
The graftingion exchange method allowed the preparation of VxOySBA-15 samples exhibiting a disperse
vanadium oxide species even at high vanadium loadings In contrast to the wet impregnation method no
crystalline V2O5 species were present after preparation of a high loaded sample with a vanadium
dispersion of 24 Vnm2 Therefore samples prepared by this method were used for further investigations
58
In order to ensure that the mesoporous SBA-15 support was not affected by the preparation process
physisorption small angle XRD and electron microscopy measurements were conducted before and after
vanadium anchoring
In Figure 4-7 the N2 adsorption and desorption isotherms of SBA-15 and the calcined VxOySBA-15
samples (ion exchange) are depicted A detailed table of the physisorption and small angle XRD results
for all samples is given in the appendix (Table 10-1) The SBA-15 samples exhibited a type IV
physisorption isotherm according to the IUPAC classification [110] This is characteristic for mesoporous
samples (pore diameter (dp) 2-50 nm) The significant decrease at lower pp0 values indicated that
micropores (dp lt 2 nm) were present in all SBA-15 samples (Figure 4-7 left) The BET surface areas
determined for the bare SBA-15 samples ranged from 607 and 818 m2g For all samples a significant
decrease of the BET surface area (30-50) was observed for the calcined VxOySBA-15 samples
compared to the initial SBA-15 samples The characteristic diffractions of the hexagonal SBA-15
structure were detected in the small angle XRD patterns ((100) (110) (200) diffraction) of all samples
(Figure 4-7 left inset) Hence the mesoporous SBA-15 structure remained unaffected by the
preparation The cell parameter determined from the (100) diffraction was slightly decreased (01-04 nm
1-4 ) in the calcined VxOySBA-15 samples compared to the initial SBA-15 material This was
interpreted as a shrinking of the SBA-15 pore structure of the supported samples compared to the initial
SBA-15 samples Herbert [111] showed that a shrinking of ~ 30 of the mesoporous SBA-15 structure
was not an unusual observation This was observed by Herbert for thermal (calcination 923 K 24 h) and
hydrothermal (water 373 K 24 h autoclave) treatment of SBA-15 samples [111] The shrinking did not
affect the shape of the hysteresis of the sorption isotherms of the SBA-15 samples For the 14 wt and
the 41 wt VxOySBA-15 sample the type IV physisorption isotherm was still present
00 02 04 06 08 10 0
200
400
600
Relative Pressure pp0
Ads
orbe
d N
2 V
olum
e [c
m3 (S
TP
)g-1
]
05 1 15 2
Nor
mal
ized
Int
ensi
ty
2 θ [deg]
SBA-15
77 wt V xOySBA-15
(100
)
(110
)
(200
)
00 02 04 06 08 10 0
200
400
600
Relative Pressure pp0
Ads
orbe
d N
2 V
olum
e [c
m3 (S
TP
)g-1
]
2 3 4 5 6 7 8 910 20 30 40
0
50
100
150
200
250
300
dV
pd
dp
dp [nm]
Figure 4-7 N2 adsorption (open symbols) and desorption (filled symbols) isotherms Left initial SBA-15 (grey same symbols as VxOySBA-15 samples) and calcined VxOySBA-15 samples prepared via the graftingion exchange method (colored squares 14 wt V triangles 41 wt V circles 77 wt V) The inset depicts the small angle XRD powder patterns of the calcined 77 wt VxOySBA-15 sample and the initial SBA-15 Right initial SBA-15 (black squares) SBA-15-APTES after calcination (blue circles) and calcined 77 wt VxOySBA-15 (red triangles) The inset depicts the respective pore size distributions obtained from the adsorption isotherm (BJH model)
59
Figure 4-8 top REM images of the calcined 77 wt VxOySBA-15 sample middle TEM images of the initial SBA-15 bottom TEM images of the calcined 77 wt VxOySBA-15 sample
60
For the high loaded 77 wt VxOySBA-15 a second step (pp0 ~ 05) was visible in the desorption
isotherm (Figure 4-7 right) Two different interpretations of this step are feasible A possible origin for
the additional step in the desorption isotherm may be a change of the SBA-15 mesoporous structure
during the ATPES grafting step in the preparation of this sample This argument was excluded because
the shape of the desorption isotherms did not change for the lower loaded 41 wt and 14 wt
VxOySBA-15 samples which were prepared in the same way (Figure 4-7 left) Moreover the
desorption isotherm exhibited only one step if the functionalized SBA-15-APTES sample was calcined
before the ion exchange step For such a sample a decrease of the BET surface area of ~ 53 was
observed Thus the APTES functionalization step decreased the BET surface area but did not change the
SBA-15 pore structure Another explanation for the second step in the desorption isotherm of 77 wt
VxOySBA-15 may be a pore plugging of some of the SBA-15 mesoporous channels by the supported
vanadium oxide phase Similar plugging effects on desorption isotherms were reported by Van der Voort
et al for PHTS SBA-15 materials [112] and Meyen et al for SBA-VS-15 materials [113] The fact that
the vanadium oxide phase at higher loading may plug some of the SBA-15 channels indicated that it was
possible to disperse the vanadium oxide phase into the pores of the SBA-15 using the graftingion
exchange method
That the SBA-15 channel structure was preserved during the preparation process was visible in the
electron microscopy images of the samples (Figure 4-8) In the TEM images of the initial SBA-15 and
the calcined VxOySBA-15 samples a channel structure was detected Some of the TEM images showed
the hexagonal orientation of these channels which is characteristic for SBA-15 (Figure 4-8 middle and
bottom) The wall thickness between the channels was estimated to be 3 nm and the channel diameter was
approximately 6-7 nm for bare SBA-15 For the calcined 77 wt VxOySBA-15 the wall thickness was
estimated to be 3-5 nm and the channel diameter was approximately 5-7 nm The slight decrease of the
channel diameter and the increase of the wall thickness indicates that either Si of the APTES reactant or
vanadium oxide were attached to the channel walls Due to the low element contrast of V and Si this
could not be discriminated However EDX measurements showed that a high vanadium dispersion was
present on the 77 wt VxOySBA-15 sample No areas of higher V content than 11 wt were identified
(3 measurements spot size ~ 30 nm) In order to determine the particle size and morphology SEM
images (Figure 4-8 top) were recorded of 77 wt VxOySBA-15 The main fraction of particles was
typically 30-70 microm long and 10 microm wide
43 Summary
VxOySBA-15 samples were prepared by incipient wetness wet impregnation and a graftingion
exchange method In situ UV-Vis-DRS XAFS and Raman measurements were conducted to determine
the nature of the vanadium oxide species present on SBA-15 Spectroscopic measurements of the
uncalcined VxOySBA-15 samples suggested that mixtures of different vanadium centers were present on
SBA-15 Features corresponding to vanadium oxide centers with higher (5-fold or 6-fold coordination)
61
and lower (4-fold or 5-fold coordination) degree of polymerization were observed in the spectra of the
uncalcined 30 wt -77 wt VxOySBA-15 samples From Raman and XAFS measurements it seems
likely that the higher polymerized vanadium centers may exhibit a structure similar to that of the
decavanadate ion With decreasing vanadium loading the amount of the less polymerized (4-fold or 5-fold
coordination) vanadium oxide centers increased In the spectra of uncalcined 14 wt VxOySBA-15 no
higher polymerized vanadium oxide phases were observed The probability that the lower polymerized
vanadium oxide centers were formed during the preparation was higher for the graftingion exchange
process In addition residuals of crystalline NH4VO3 were detected in the Raman spectrum of the
uncalcined sample prepared via wet impregnation (57 wt VxOySBA-15)
Calcination of the VxOySBA-15 samples yielded well dispersed vanadium oxide centers on SBA-15
Raman spectra of as prepared and thermally treated samples (dehydrated in 20 O2 in He 673 K)
showed characteristic bands for the hydrated and the highly dispersed dehydrated state of supported
vanadium oxides respectively These Raman bands matched those of VxOySiO2 samples reported in the
literature [2332] Therefore the VxOySBA-15 samples investigated here were comparable to highly
disperse VxOySiO2 samples reported in the literature [2332]
No distinct differences resulted from the preparation method employed as observed in the Raman UV-
Vis-DR and XAFS spectra of the VxOySBA-15 samples in the dehydrated state For all samples the
majority phase in the dehydrated state was a highly dispersed tetrahedral vanadium oxide species For the
sample prepared by wet impregnation with an aqueous NH4VO3 solution small amounts of crystalline
V2O5 were detected Therefore samples prepared by this method were not used for further structural
characterization and catalytic reactivity tests Samples prepared by the incipient wetness method were
also not used as model catalysts although only a dispersed vanadium oxide species was detected The
preparation of larger sample batches (5-10 g SBA-15) using this method is impractical and may cause an
inhomogeneous vanadium distribution on the SBA-15 support during the drying process of the uncalcined
samples Therefore the ion exchange method was preferred for sample preparation The calcined
14 wt 41 wt and 77 wt VxOySBA-15 (ion exchange) samples shown in this chapter were used
for structural characterization of the dispersed vanadium oxide species and for catalytic testing
The mesoporous structure of SBA-15 was not affected by the preparation method chosen A decrease of
the BET surface area was observed for all VxOySBA-15 samples Except for the 77 wt VxOySBA-15
sample the characteristic type IV physisorption isotherms were still present after anchoring the vanadium
oxide phase and calcination A second step in the desorption isotherm occurred for the calcined 77 wt
VxOySBA-15 sample Hence the supported vanadium oxide phase may be present inside the SBA-15
channels which causes plugging of some pores on the high loaded sample TEM and small angle XRD
measurements showed that the hexagonal channel structure of SBA-15 was maintained in this sample
62
63
5 Structural characterization of hydrated and
dehydrated VxOySBA-15
51 Introduction
Structural characterization of VxOy supported on SiO2 has been subject of many spectroscopic studies
including IR [44114115] XPS [116117118] Raman [233240117118119] UV-VIS
[233240100118] and EXAFS [21-2337108120121122] A recent review of spectroscopic
investigations and structural characteristics of various supported vanadium oxides has been presented by
Weckhuysen and Keller [18] It is assumed that the structure of supported vanadium oxide depends on
both amount of vanadium and degree of hydration [32] Hence most studies were performed on
VxOySiO2 samples exhibiting low vanadium loading (lt 25 Vnm2) At these loadings a monolayer of
supported VxOy species is assumed and crystalline V2O5 is not detectable [303132] Under ambient
conditions the structure of hydrated vanadium oxide supported on SiO2 resembles that of V2O5
[23117108] Thermal treatment in oxygen results in dehydration of the vanadium oxide species which
will be discussed in detail in Chapter 6 The dehydrated state has been proposed to consist of isolated
ldquoVO 4rdquo tetrahedrons bound to the SiO2 support [2123123124] However V2O7 dimers or further
extended structures supported on SiO2 have not been excluded [40] In total the structure of dehydrated
vanadium oxide species supported on SiO2 remains under debate
Here the combination of the spectroscopic methods UV-Vis-DRS and XAFS was used to elucidate the
structure of hydrated and dehydrated VxOySBA-15 Both methods provide information about the
electronic and geometric structure and they are particularly suitable to study supported catalysts under
reaction conditions
UV-Vis-DR spectroscopy allows the investigation of electronic transitions of valence electrons From the
nature of the observed transitions (CT intervalence d-d) information about the oxidation state and the
geometric configuration can be derived [95125] An example of how UV-Vis-DRS can be used to
identify the oxidation states of supported transition metal oxides like for instance CrxOySiO2 is given by
Weckhuysen et al [126] For the vanadium oxide on SiO2 model system investigated here the vanadium
oxidation state of V5+ can be distinguished from the lower vanadium oxidation states (V3+V4+) by
UV-Vis-DRS Furthermore in the last decade a simple approach for deriving information about the
geometric structure and the degree of polymerization of transition metal oxides (d0 configuration) from
UV-Vis-DR spectra was described by several authors [100127] They observed that the edge energy Eg
of d0 metal oxides is influenced by the coordination of the metal oxide structure and the degree of
polymerization Wachs et al correlated the number of covalent M-O-M bonds around the central
transition metal cation (d0 V Mo W) with the position of the UV-Vis edge energy Eg [100128129] A
64
linear correlation was observed that allowed distinguishing MO5MO6 polymers from MO4 polymers and
isolated MO4 metal oxide structures From this kind of plot Wachs et al [100] concluded that VxOy is
present as an isolated [VO4] tetrahedron in the dehydrated state of VOx on the silica support
Comparable to UV-Vis-DRS it is possible to derive information about the local geometric and electronic
structure from XAFS The average valence for instance can be obtained by comparison with known
reference compounds [130] Moreover Wong et al and Chaurand et al [94131] described how the V
pre-edge peak in the XANES region can be used for deriving information about coordination and valence
of the vanadium oxide species
Elucidating the geometric structure in more detail from XAFS however is often difficult In the
conventional approach theoretical XAFS scattering amplitudes and phases are calculated for a suitable
model structure Subsequently a sum of theoretical XAFS functions is refined to the experimental data
Structural parameters like coordination numbers nearest neighbor distances and disorder parameters may
be determined However more often than not the number of potential parameters exceeds the number of
ldquoindependentrdquo parameters The upper limit may be calculated from Fourier theory and must not be
exceeded Nonetheless it appears that even refinements employing a much smaller number of freely
varied parameters may yield ambiguous structural results The often used Nyquist criteria may not be
sufficient to evaluate a fitting procedure Basically one pair of strongly correlated parameters suffices to
render a seemingly good agreement between experimental data and theoretical model structure
meaningless While this case may be clearly indicated by the correlation matrix of the refinement other
pitfalls may be less obvious Hence procedures are sought that enable evaluating the significance of each
fit parameter individually
This chapter focuses on elucidating the local structure around the vanadium centers in the hydrated and
dehydrated state of VxOySBA-15 model catalysts with different vanadium loadings The UV-Vis-DR and
XANES spectra of the VxOySBA-15 model catalysts and suitable vanadium oxide references were
investigated In addition a detailed XAFS data analysis in particular of higher V-V distances was
performed together with a detailed evaluation of the significance of the fit parameters employed
65
52 Results and discussion
521 UV-Vis-DR spectra of VxOySBA-15 compared to those of V5+ references
In a first approach the UV-Vis-DR spectra of VxOySBA-15 were compared to the spectra of selected
vanadium oxide references (Figure 5-1) All spectra shown were measured in the in situ cell Apparently
both hydrated and dehydrated VxOySBA-15 exhibited only LMCT charge transfer bands which are
located at wavelengths shorter than 500 nm Absorption bands which are due to lower vanadium valences
(V4+ V3+) such as d-d or intervalence transitions were absent Hence the average valence of
VxOySBA-15 is assumed to be +5
0
15
5
10
220 800400 600
F(R
infin)
Wavelength [nm]
0
5
10
220 800400 600
F(R
infin)
Wavelength [nm]
Figure 5-1 Left UV-Vis-DR spectra of vanadium reference compounds (Mg3V2O8 ( ) m-Mg2V2O7 ( ) t-Mg2V2O7 ( ) MgV2O6 ( ) Mg3V10O28middotxH2O ( ) V2O5 ( )) and 77 wt VxOySBA-15 in the hydrated ( ) and dehydrated ( ) state Right UV-Vis-DR spectra of VxOySBA-15 with different loading in the hydrated and dehydrated state (14 wt ( ) 41 wt ( ) 77 wt ( ))
In Table 5-1 the positions of observed absorption bands for V5+ vanadium oxide compounds measured in
a standard integration sphere are listed The values in brackets refer to the positions obtained in the in situ
cell The error for each absorption band position was estimated to be plusmn 5- 10 nm Compared to the spectra
measured in the standard cell the spectra recorded in the in situ cell were less well resolved The positions
of absorption bands at wavelengths longer than 270 nm were similar for both measurement cells
However for wavelengths shorter than 260 nm the positions of the absorption bands were shifted to
longer wavelengths in the in situ cell This may be caused by the significantly lower intensity of the
incident light below 260 nm (Figure 10-1 and Figure 10-2 Appendix) Therefore the insufficient
resolution in the in situ cell has to be considered if the absorption band position in this region is compared
to that of VxOySBA-15 samples Dilution of the samples did not significantly change position and type of
the absorption bands (Table 5-2) The position of the low energy charge transfer band in the UV-Vis-DR
spectra of hydrated VxOySBA-15 was located around 365 nm for all loadings (Figure 5-1 right Table
5-2)
66
Table 5-1 Absorption band position and UV-Vis edge energy determined from UV-Vis-DR spectra of vanadium oxide reference compounds (Figure 5-1 left) together with the assumed covalent V-O-V bond (CVB) number (reference of the theoretical structure which matched the experimental XRD powder pattern Table 10-3 appendix) Values in brackets refer to measurements in in situ cell
Sample Absorption Band [nm] Eg [eV] CVB No
Na3VO4 230 255 290 391 0
K3VO4 272 313 354 0
Ca3V2O8 225 250 297 377 0
Mg3V2O8 271 336 (280-320 plateau) 344 (351) 0
m-Mg2V2O7 273 315 (276 311) 347 (353) 1
Ca2V2O7 261 326 314 2
t-Mg2V2O7 285 385 (293 382) 285 (294) gt 1
NaVO3 225 281 347 314 2
NH4VO3 225 284 357 317 2
KVO3 248 295 371 311 2
CaV2O6 250 272 344 290 3
MgV2O6 240 376 (248 370) 290 (297) 3
Mg3V10O28middotxH2O 250 broad ~ 400 nm (broad ~ 400 nm) 235 5
(NH4)6V10O28middotxH2O 240 370 440 (broad ~ 400 nm) 235 5
V2O5 241 334 390 460 (264 334 390h 468) 235 5
A second absorption band located at ~ 300 nm for the 77 VxOySBA-15 sample was blue shifted with
decreasing V density (~ 293 nm 41wt V 260 nm 14 wt V) A weak shoulder at 460 nm may be
present (Figure 5-1 right) Similar bands were found for references with square pyramidal coordination
(pseudo octahedral) such as V2O5 and MgV2O6 (Table 5-1) An interpretation of the observed bands was
given by Centi et al [132] They reported that the charge transfer band due to the V=O double bond is
observed at ~ 380 nm It can be calculated from the differences in electronegativity between the metal and
the ligand for an octahedral coordination of vanadium oxo compounds [133] However this does not
explain the band at 460 nm According to Centi this charge transfer band is due to ldquodelocalized donor
acceptor sitesrdquo originating from higher ldquoconjugated sites like octahedral VO6 chainsrdquo [132] The
absorption band at 460 nm in the spectra of hydrated VxOySBA-15 was rather weak Thus the structure
of hydrated VxOySBA-15 seems to have a square pyramidal coordination but in contrast to V2O5 it
seems to be less extended
During thermal treatment of hydrated VxOySBA-15 in oxygen (20 O2 in He 554-626 K) a loss of water
and a distinct change in structure were observed (Figure 5-1 Table 5-2) For dehydrated 77 wt
VxOySBA-15 the low energy LMCT band is located at ~ 309 nm and was blue shifted with decreasing
loading of V (~ 285 nm 14 wt V on SiO2) The bands of undiluted crystalline vanadate references with
tetrahedral coordination are located in these regions for instance Na3VO4 NH4VO3 m-Mg2V2O7 and
Mg3V2O8 (Table 5-1) Referring to Centi et al [132] the charge transfer bands of tetrahedral vanadium
oxo compounds are located below 333 nm Therefore a tetrahedral structure of dehydrated VxOySBA-15
is assumed A more distinct determination of the degree of polymerization of the tetrahedral vanadium
oxide species seemed not feasible from comparing only the absorption band positions of the VxOySBA-
15 samples with those of the references The interpretation of the charge transfer bands of solid
compounds remains challenging The interpretation by Centi et al [132] considers the vanadium oxide as
solely molecular a cluster similar to the common interpretation of molecular coordination complexes
67
Table 5-2 Absorption band position and UV-Vis edge energy determined from the UV-Vis-DR spectra of hydrated and dehydrated VxOySBA-15 samples (Figure 5-1 right) together with the calculated covalent V-O-V bond (CVB) number Values in brackets refer to diluted samples (F(Rinfin)max~ 1-2)
Sample Absorption Band [nm] Eg [eV] CVB No
77 wt V hydrated 300 368 (300 368) 276 (274) 35
41 wt V hydrated 293 364 (283 363) 280 (279) 34
14 wt V hydrated 260 365 (260 368) 288 (280) 30
77 wt V dehydrated 309 (302) 343 (337) 10
41 wt V dehydrated 309 (305) 342 (344) 10
14 wt V dehydrated 286 (280) 359 (360) 04
Moreover if this interpretation was sufficient to describe the LMCT absorption bands even though more
than a single transition would occur for an isolated free VO43- ion [134] Calculations may provide more
detailed information about the type and intensity of the absorption bands that can be expected For V2O5
monocrystals Lazukova et al received a good agreement between the experimental and the theoretically
calculated electroreflectivity spectra [135] Ronde et al [134] calculated the position of the charge
transfer band for isolated tetrahedral compounds The range obtained (240-330 nm) agrees well with the
values of tetrahedral vanadate references found here However these results do not allow us to distinguish
unambiguously between different connectivities of tetrahedral vanadium oxide compounds such as
isolated dimeric or chain-like structures One attempt to distinguish different arrangements of supported
vandium oxide clusters was reported by Avdeev et al [136] They concluded that for isolated [VO4]
structures on SiO2 two absorption bands at 238 and 263 nm are present These bands are red shifted to
250-260 nm and 270-290 nm if dimeric tetrahedral compounds are present (V-O-V linkage) These
results match with the absorption bands of dehydrated VxOxSBA-15 with the maximum at 286 and
309 nm found here (Table 5-2) Therefore for all loadings a dimeric tetrahedral structure is present
Avdeev et al [136] attributed an increase in coordination from 4-fold to 5-fold to absorption bands
located at 340 nm in the spectra of hydrated VxOySiO2 samples (here 365 nm Table 5-2) Identifying the
contributions of these transitions in the experimental UV-Vis-DR spectra would provide more detailed
information However considering the broad absorption bands and the insufficient resolution in the UV
range (in situ cell) a reasonable refinement seems not very likely and thus was not performed here
522 Correlation of the UV-Vis-DRS edge energy Eg with the local structure of vanadium
oxide references
To gain more insight into the nature of the dispersed vanadium oxide species present on the support the
UV-Vis edge energy Eg of the LMCT band was correlated with the number of V-O-V bonds in the
measured crystalline vanadium oxide references as reported by Wachs et al [100] The Eg values
obtained are summarized in Table 5-1 and the resulting plot is depicted in Figure 5-2 (left) For clarity
all references were measured undiluted in the integration sphere cell Samples measured in the in situ
Praying MantisTM cell as shown in Figure 5-2 (left) are depicted as grey symbols The linear correlation
of the V-O-V bond number (CVB) with Eg was almost linear (grey line) The t-Mg2V2O7 reference was
not considered in this correlation As discussed in Chapter 236 the connectivity of [V2O7]x polyhedrons
68
may be higher than that of dimers and thus the V-O-V number is larger than one The linear function
obtained here was
CVB = 1374 ndash 372middotEg (plusmn 5 R2=098) (51)
Deviations from the equation found by Wachs et al (CVB = 1403 ndash 395middotEg (plusmn 034)) [100] can be
explained by the larger number of reference compounds used here A second reason was that all samples
were measured undiluted here Compounds like Na3VO4 or K3VO4 tend to dehydrate when they are
diluted which causes significantly lower values for Eg (~ 05 eV) as observed by Wachs et al [100]
Dilution of all other samples with the white reflectance standard caused a shift of Eg in the range of
plusmn 001-008 eV
25 30 35 40
0
1
2
3
4
5
( )
VO4 monomers
V2O
7 dimers
(VO4)
n chains
(VO4-VO
5)
n chains
(VO5)
n doublechains
(VO5VO
6)
n polymers
V-O
-V N
umbe
r
E g [eV]
168 170 172 174 176 178 18030
32
34
36
38
40
UV
-Vis
Edg
e E
nerg
y [e
V]
Average V-O Bond Length [Aring]
isolated VO4
3-
dimeric V2O
7
4-
chains [VO4]x
Figure 5-2 Left Covalent V-O-V bond number (CVB) versus UV-Vis edge energy (Eg) of vanadium oxide reference compounds (Na3VO4 ( ) K3VO4 ( ) Ca3V2O8 () Mg3V2O8 () m-Mg2V2O7 () Ca2V2O7 ( ) t-Mg2V2O7 () NaVO3 (diams) NH4VO3 ( ) KVO3 ( ) CaV2O6 () MgV2O6 () Mg3V10O28middotxH2O ( ) (NH4)6V10O28middotxH2O ( ) V2O5 ( ) grey symbols refer to measurements in in situ cell) right UV-Vis edge energy versus average V-O bond length in the first coordination sphere of vanadium references exhibiting a tetrahedral coordination
The linear correlation (Figure 5-2 left) can be explained according to Weber et al [127] They
concluded in a simplified assumption that ldquothe edge energies of moleculary sized clusters should track
with the extent of spatial delocalization of the molecular orbitals involved in the electronic transition
associated with the UV-visible edgerdquo [127] Hence the energy needed for an electronic transition is
lowered with increasing number of participating molecular orbitals Accordingly the determination of the
UV-Vis edge energy allowed an estimation of the size of the vanadium oxide clusters present in the
VxOySBA-15 samples Relatively high errors (plusmn 5) were obtained for this linear correlation These are
mainly due to the wide range of Eg values determined for isolated tetrahedral compounds (CVB = 1)
Similar spreading of Eg with decreasing CVB number was observed by Wachs et al for W and Mo based
d0 transition metal oxide systems [128129] They concluded that not only the CVB number influences the
Eg position but also the distortion of the coordination polyhedron [128] The effect of the distortion of the
coordination polyhedron seems to be stronger for less polymerized vanadium oxide structures This effect
cannot be explained by the delocalization of molecular orbitals It seems more likely that the average V-O
bond length in the first coordination sphere as indicator for the distortion influences the energy of the
69
LMCT transitions A similar trend was proposed by Ronde et al for the absorption band maxima [134]
Figure 5-2 right shows the edge energy versus the average V-O bond length for several vanadates
exhibiting tetrahedral coordination A decrease of Eg with increasing distortion (average RV-O) was
obtained Moreover the slope of the linear correlation decreased with increasing V-O-V number from
orthovanadate to metavanadate structures For higher coordinated structures exhibiting a V-O-V number
of 3 or 5 no comparable correlation was found Hence only the effect of delocalization determines the
electronic structure of higher polymerized vanadium centers Conversely in lower coordinated tetrahedral
compounds the electronic structure of the vanadium centers is rather described with molecular orbitals
which are present in molecular coordination complexes Moreover it is possible that the electronic
structure of the absorbing vanadium centers is more sensitive towards disturbances of the surrounding
cations than the electronic structure of the vanadium centers in the higher clustered vanadium oxide
anions like V2O62- or V10O28
6- A more detailed explanation was not possible because of the limited data
set of isolated and dimeric tetrahedral vanadium oxide references or missing calculations of the electronic
structure of model compounds However as a result of these contributions (delocalization and distortion)
to the electronic structure of vanadium oxides in tetrahedral coordination an unambiguous discrimination
between dimeric and isolated structures is hardly feasible
523 UV-Vis Eg- indicator for the local structure of hydrated and dehydrated VxOySBA-15
Accordingly the linear correlation of the V-O-V number and the UV-Vis edge energy was used only as
an indicator for the structure of the VxOySBA-15 structures In Table 5-2 the values obtained for
hydrated and dehydrated VxOySBA-15 are listed for all loadings employed The values in brackets refer
to diluted samples No distinct changes were observed with dilution Hence undiluted samples were used
for further reaction experiments as described in the following chapters For the hydrated VxOySBA-15
samples UV-Vis edge energies from 276 to 288 eV were obtained which increased with higher
dispersion of vanadium oxide on the SBA-15 support The CVB numbers were determined to be between
30 and 35 These values supported the observation above that hydrated VxOySBA-15 exhibits a square
pyramidal coordination For dehydrated VxOySBA-15 V-O-V numbers of 10 were obtained for the
41 wt and the 77 wt V on VxOySBA-15 sample which confirmed the dimeric tetrahedral structure
that was indicated by the position of the absorption bands The low loaded 14 wt VxOySBA-15 sample
exhibited a reduced V-O-V number of 03 which suugests an isolated [VO4] structure According to
Weber et al [127] the value of 03 may also indicate a mixture of isolated and dimeric structures on the
support Similar results were recently observed for low loaded MoxOy on SBA-15 samples [137]
The absorption band positions and UV-Vis-DRS edge energies detected here were comparable to those
reported by other authors for vanadium oxides supported on SiO2 in a monolayer coverage [23100]
However mostly an isolated structure was assumed for low loaded dehydrated VxOySBA-15 which is in
contrast to the dimeric structures discussed here Therefore a detailed XAFS analysis was performed on
hydrated and dehydrated VxOySBA-15 to obtain additional information about the local structure around
the V atoms
70
25
05
10
15
20
30
545 55 555 56 565
Nor
mal
ized
Inte
nsity
Photon Energy [keV]
dehydrated 77 wt VSBA-15
dehydrated 41 wt VSBA-15
dehydrated 14 wt VSBA-15
00
20
40
60
00
545 55 555 56 565
Nor
mal
ized
Inte
nsity
Photon Energy [keV]
hydrated 77 wt VSBA-15
V2O5
MgV2O6
CaV2O6
Mg3V10O28 middotH2O
(NH4)6V10O28 middotH2O
00
05
10
15
20
25
30
545 55 555 56 565
Nor
mal
ized
Inte
nsity
Photon Energy [keV]
hydrated 77 wt VSBA-15
hydrated 41 wt VSBA-15
hydrated 14 wt VSBA-15
20
40
00
545 55 555 56 565
Nor
mal
ized
Inte
nsity
Photon Energy [keV]
Mg3V2O8
Dehydrated 77 wt VSBA-15
Ca3V2O8
Na3VO4
K3VO4
00
10
20
30
40
545 55 555 56 565
Nor
mal
ized
Inte
nsity
Photon Energy [keV]
t-Mg2V2O7
Ca2V2O7
m-Mg2V2O7
Dehydrated 77 wt VSBA-15
00
10
20
30
40
545 55 555 56 565
Nor
ma
lized
Inte
nsity
Photon Energy [keV]
NH4VO3
KVO3
NaVO3
Dehydrated 77 wt VSBA-15
Figure 5-3 V K edge XANES spectra of hydrated and dehydrated VxOySBA-15 samples with different vanadium loadings (14 wt 41 wt and 77 wt) V K edge compared to the spectra of various V5+ reference compounds (dotted line refers to 77 wt dehydrated VxOySBA-15)
524 XANES analysis ndash coordination and distortion of V species in VxOySBA-15
The XANES spectra of hydrated VxOySBA-15 are depicted in Figure 5-3 (top left) The spectra
resembled those of vanadium oxide references where the vanadium centers exhibit a distorted octahedral
or distorted square pyramidal coordination (Figure 5-3 top right) The XANES spectra of hydrated
VxOySBA-15 V2O5 MgV2O6 CaV2O6 (NH4)6V10O28middotxH2O and Mg3V10O28middotxH2O all had a pre-edge
peak of similar height Because the pre-edge peak height is determined by the coordination of the
vanadium centers as discussed in more detail below hydrated VxOySBA-15 also appeared to exhibit a
distorted square pyramidal coordination of the V centers During thermal treatment of as-prepared
hydrated VxOySBA-15 in oxygen (20 O2 in He) a loss of water and a distinct change in structure were
observed (discussed in Chapter 6) After thermal treatment dehydrated VxOySBA-15 was cooled to
293 K (20 O2 in He) without exposure to air or water (Figure 5-3 top middle) No changes in the XAFS
71
spectra were observed during cooling Compared to the vanadium oxide references the overall XANES
region of dehydrated VxOySBA-15 resembled those of metavanadate references like NH4VO3 KVO3
and Na3VO4 and distorted pyrovanadate references like t-Mg2V2O7 and Ca2V2O7 (Figure 5-3 bottom) In
the local structure of these references the vanadium centers are tetrahedrally coordinated by four oxygen
atoms Compared to the XANES spectrum of dehydrated VxOySBA-15 NH4VO3 KVO3 and NaVO3
exhibit very similar pre-edge peak heights in their XANES spectra Conversely the pre-edge peaks in the
XANES of Ca3V2O8 K3VO4 Na3VO4 and Mg3V2O8 are much higher than that of dehydrated
VxOySBA-15 (Figure 5-3 bottom right)
More detailed correlations of the position and height of the pre-edge peak with the average valence and
coordination of the vanadium center were described by Wong et al [131] and Chaurand et al [94] Here
a method referring to a report by Wong et al was chosen to investigate the coordination of the absorbing
vanadium centers in the VxOySBA-15 samples Wong et al [131] showed that a plot of the intensity of
the pre-edge peak feature versus a ldquomolecular cage-size parameterrdquo such as the average V-O bond length
results in a linear correlation With increasing distortion in the same coordination and with increasing
coordination number (tetrahedral to octahedral) a decrease of the intensity was observed Thus an
identification of different coordinations of the absorbing vanadium center is possible In contrast to Wong
et al the intensity of the pre-edge peak was not determined by the product of its height and its width at
half height Due to the asymmetry of the observed pre-edge peaks the area was determined by a method
described by Chaurand et al [94] For the analysis the energy range around the pre-edge peak was
extracted from the normalized spectra The increase of the absorption edge was eliminated by using an
empirical background as shown in Figure 5-4 (right) The resulting background corrected signal was
fitted using three pseudo Voigt functions The resulting product of the area and the pre-edge peak height
at peak maximum (PHA) was plotted versus the average bond length (RV-O) of the measured reference
compounds (structure confirmed by XRD refinement Table 10-3 appendix) As shown in Figure 5-4
(left) a linear correlation was obtained The different coordinations (456-fold) are separated by a shift of
the average RV-O of 008-010 Aring The signals of tetrahedral references range from 170 -174 Aring those of
distorted square pyramidal references from 182-183 Aring and that of octahedral references are found at
192 Aring Interestingly the Ca2V2O7 sample which consists of a mixture of distorted square pyramidal and
tetrahedral VOx units (average coordination number 467) fits very well in the linear correlation
Compared to the UV-Vis edge energy no influence of the delocalization of the orbitals involved was
found In contrast to the UV-Vis edge energy it is possible to identify the coordination of the vanadium
centers in the oxide cluster Moreover information about the degree of distortion around the absorbing
vanadium center can be derived
Compared to references the coordination of the vanadium centers in hydrated VxOySBA-15 may be
distorted square pyramidal similar to compounds such as V2O5 and MgV2O6 This has also been observed
by Bell et al [108] Dehydrated VxOySBA-15 seemed to exhibit a coordination and distortion more
similar to references like NH4VO3 and KVO3
72
16 17 18 19 20 2100
05
10
15
20
25
30
octrahedral
square pyramidal
tetrahedral
-H2O
dehydrated VxO
ySBA-15
hydrated VxO
ySBA-15
V K
Pre
Edg
e P
eak
Hei
ght
Are
a
Average V-O Bond Length R [Aring]
-4 -2 0 2 4 6 8 10 12 14 16
00
02
04
06
08 background corrected profile fitted Pseudo Voigt functions fitted lineprofile
Cor
rect
ed A
bsor
ptio
n
Edge shift [eV]
00
02
04
06
08 experimental lineprofile manual interpolated
background
Nor
m a
bsor
ptio
n
Figure 5-4 Left Correlation of the product of the V K edge pre-edge peak intensity and area versus average V-O bond length R in the first coordination sphere (Ca3V2O8 () Mg3V2O8 () m-Mg2V2O7 () Ca2V2O7 ( ) t-Mg2V2O7 () NaVO3 (diams) NH4VO3 ( ) KVO3 ( ) CaV2O6 () MgV2O6 () Mg3V10O28middotxH2O ( ) (NH4)6V10O28middotxH2O ( ) V2O5 ( )) right subtraction of the background from V K edge pre-edge peak of 77 wt VxOySBA-15 (top) and an example of the peak fit to the background corrected signal (bottom) The pre-edge peak heights for VxOySBA-15 are indicated as lines (Refer to text and Table 10-4 for details)
The average V-O bond length around the absorbing vanadium centers was estimated by using the linear
correlation
PHA = 1328 ndash 658middot RV-O (plusmn 7-9 R2=096) (52)
For the hydrated VxOySBA-15 samples RV-O was 188 Aring and for dehydrated VxOySBA-15 RV-O was
177 Aring The latter value suggests the presence of a strongly distorted VOx tetrahedron in the vanadium
oxide structure of dehydrated VxOySBA-15 Both RV-O values were increased compared to the bulk
vanadium oxide references This may be an influence of the high dispersion of the supported vanadium
oxide which may cause a higher distortion
525 Local structure of dehydrated VxOySBA-15 ndash Comparison to V oxide references
In addition to the UV-Vis-DRS experiments and the investigations of the XANES structure a detailed
EXAFS investigation of samples with different V loadings in the hydrated and dehydrated state was
performed In particular the contribution of higher scattering shells to the XAFS signal was analyzed to
possibly reveal the presence of V nearest neighbors in the local structure of vanadium oxide species
supported on SiO2 In the corresponding literature only a few authors present XAFS refinements of
supported vanadium oxide samples [212237114120-122 124] Typically the first V-O coordination
sphere was analyzed by XAFS refinement [2294] A detailed XAFS analysis of higher shells in the
FT(χ(k)k3) has been largely neglected Only Keller et al [37114120-122124] discussed contributions
of higher V-O and V-Si shells located at distances gt 2 Aring They excluded higher V-O-V contributions to
the FT(χ(k)k3) of highly dispersed dehydrated VxOy samples supported on SiO2 or Al2O3
73
0
5
10
15
20
25
4 6 8 10
χ(k)
k3
k [Aring-1]
41 wt VSBA-15
14 wt VSBA-15
77 wt VSBA-15
NH4VO3
01
02
0 2 4 6
R [Aring]
NH 4VO 3
KVO 3
NaVO 3
t-Mg 2V2O7
01
02
03
04
0 2 4 6
R [Aring]
Ca 2V2O7
m-Mg 2V2 O 7
Mg 3 V2 O8
Ca 3V2 O8
FT
(χ(k
)k3 )
FT
(χ(k
)k3 )
dehydrated 77 wt VSBA-15
dehydrated 77 wt VSBA-15
Figure 5-5 left V K edge χ(k) of dehydrated VxOySBA-15 with different vanadium loadings (14 wt 41 wt and 77wt ) and NH4VO3 middle right V K edge FT(χ(k)k3) of dehydrated VxOySBA-15 (77 wt dotted) compared to those of various references
The EXAFS χ(k)k3 of dehydrated VxOySBA-15 with different V loadings are depicted in Figure 5-5
(left) The usable range extended from 27 to 105 Aring-1 The V K edge FT(χ(k)k3) of the dehydrated
VxOySBA-15 sample (77 wt) measured at 293 K are shown in Figure 5-5 FT(χ(k)k3) and χ(k)k3 are
not phase shift corrected Thus the distances in the FT(χ(k)k3) are shifted to lower values by ~ 04 Aring
compared to crystallographic distances
The FT(χ(k)k3) of various vanadium oxide references exhibiting a tetrahedral coordination are compared
to that of dehydrated VxOySBA-15 (Figure 5-5 middle and right) In contrast to the XANES spectra the
FT(χ(k)k3) of Na3VO4 and K3VO4 are not shown The high tendency for dehydration of these
compounds caused a high level of noise in the resulting χ(k)k3 The first V-O peak in the FT(χ(k)k3) at
~ 14 Aring (not phase shift corrected) for all references shown corresponds to a [VO4] tetrahedron in the
respective structures The spectra of the metavanadate structures like NH4VO3 and KVO3 resembled that
of dehydrated VxOySBA-15 most closely In the FT(χ(k)k3) of the pyrovanadate structures like
Mg2V2O7 and Ca2V2O7 and the orthovanadate structures like Ca3V2O8 and Mg3V2O8 the first V-O peak is
significantly higher than in the FT(χ(k)k3) of dehydrated VxOySBA-15 In contrast to the FT(χ(k)k3) of
Mg3V2O8 and the pyrovanadates Ca2V2O7 and monoclinic Mg2V2O7 which exhibit a significant
amplitude at distances above 2 Aring the FT(χ(k)k3) of Ca3V2O8 KVO3 NH4VO3 triclinic Mg2V2O7 and
dehydrated VxOySBA-15 show little amplitude at higher distances Moreover looking at the differences
between the FT(χ(k)k3) of Ca3V2O8 KVO3 NH4VO3 and triclinic Mg2V2O7 the latter two appear to
yield the best agreement with that of dehydrated VxOySBA-15 In all references the low amplitude of the
FT(χ(k)k3) at R gt 2 Aring is characteristic of the local structure around the tetrahedral V centers In
conclusion based on comparing the XANES and FT(χ(k)k3) of dehydrated VxOySBA-15 to those of
potential references NH4VO3 and triclinic Mg2V2O7 have been identified as suitable references to serve
as model systems for a more detailed structural analysis
74
526 Local structure of higher connected tetrahedral vanadium oxide cluster - XAFS
refinement of a reference based model structure
Before we discuss the details of analyzing the XAFS data of dehydrated VxOySBA-15 a suitable analysis
procedure for the higher V-V contributions in the XAFS spectra of the references NH4VO3 and triclinic
Mg2V2O7 was sought As an example and to reduce the number of tables here the application of
confidence limits and F parameter to distinguish analysis fitting procedures is described below for three
refinements of a suitable model structure to the experimental FT(χ(k)k3) of dehydrated VxOySBA-15
00
005
01
00
-005
FT
(χ(k
)k3 )
0 2 4 6
R [Aring]
00
005
00
-005
FT
(χ(k
)k3 )
0 2 4 6
R [Aring]
V-O (2) 2x V-O (1)
V-V (1) V-V (1) V-O (1)
V-O (2)
2x V-O (1) 2x V-V (1)
V+5O-2
Figure 5-6 Experimental (solid) V K edge FT(χ(k)k3) of the NH4VO3 (right) and the Mg2V2O7 (left) reference together with a theoretical XAFS function (fitting results are given in Table 5-3) Also shown are the Fourier transformed χ(k)k3 of the individual scattering paths together with the corresponding coordination number in brackets
The model structure consisted of a tetrahedral coordination of the V center with four oxygen atoms at
~17 Aring (NH4VO3) two vanadium atoms at ~34 Aring (NH4VO3) and 36 Aring (triclinic Mg2V2O7) one oxygen
atom at ~29 Aring (triclinic Mg2V2O7) and one Si atom at ~28 Aring (Table 5-3) Experimental FT(χ(k)k3) of
triclinic Mg2V2O7 and NH4VO3 and the corresponding XAFS refinements are shown in Figure 5-6
Deviations between the theoretical and experimental spectra of triclinic Mg2V2O7 in the range from 2-4 Aring
are caused by several Mg neighbors and nearly linear multiple-scattering paths in triclinic Mg2V2O7 that
contribute in this range These are not sufficiently accounted for by the simplified refinement procedure
used here Similar arguments hold for NH4VO3 The results of the XAFS refinement for dehydrated
VxOySBA-15 NH4VO3 and triclinic Mg2V2O7 are summarized in Table 5-3 Apparently the distorted
[VO4] tetrahedron in NH4VO3 required two different V-O distances to be included in the refinement
while triclinic Mg2V2O7 and dehydrated VxOySBA-15 exhibited a single V-O distance It seems that the
distortion in the [VO4] units of the crystalline reference triclinic Mg2V2O7 could not be resolved by the
XAFS analysis procedure employed Accordingly a lower σ2 was obtained (00013 Aring2) for NH4VO3
compared to those of dehydrated VxOySBA-15 and triclinic Mg2V2O7 (00079 Aring2 and 00058 Aring2
respectively) In contrast a single V-V distance at 347 Aring (CN = 2) sufficed for NH4VO3 (consisting of
chains of [VO4] units) while two V-V distances had to be included for triclinic Mg2V2O7 (consisting of
adjacent [V2O7] units) and dehydrated VxOySBA-15
75
Table 5-3 Type and number (N) of atoms at distance R from the absorbing V atom in a model system assuming an ordered arrangement of V2O7 units (Figure 5-9 right) compared to experimental distances and XAFS disorder parameters (σ2) The parameters were obtained from the refinement of this model structure to the experimental V K edge XAFS FT(χ(k)k3) of dehydrated VxOySBA-15 (77 wt) t-Mg2V2O7 and NH4VO3 (k range from 27-105 Aring-1 R range 084-362 Aring Nind = 16 E0 = 0 eV in all cases fit residual 39 (dehydrated VxOySBA-15) (Nfree = 8) 107 (t-Mg2V2O7) (Nfree = 7) 147 (NH4VO3) (Nfree = 5)) (subscript c indicates parameters that were correlated in the refinement subscript f indicates parameters that were fixed in the refinement) Confidence limits and significance to the fit parameters are given in Table 5-4
N Rmodel [Aring] deh 77 wt t-Mg2V2O7 NH4VO3
Type R [Aring] σ2 [Aring2] R [Aring] σ2
[Aring2] R [Aring] σ2 [Aring2]
V - O 1 163 178 00079 174 00058 169 00013
V - O 1 170 178 c 00079 c 174 c 00058 c 169 00013 c
V - O 2 176 178 c 00079 c 174 c 00058 c 184 00013 c
V - O 1 287 289 00012 f 277 00113 -- --
V - V 1 342 329 00116 333 00148 347 00143
V - V 1 362 360 00116 c 352 00148 347 00143 c
V - Si 1 280 254 0013 -- -- -- --
In the cases of the references a similar σ2 parameter for the V-V contributions of about 0014 Aring2 was
obtained For dehydrated VxOySBA-15 it was slightly decreased (0012 Aring2) The corresponding
confidence limits and significance parameters F are given in Table 5-4 In fitting procedure 1 two V-O
distances in the first V-O shell were allowed to vary independently (both with a CN of 2 and the same σ2)
Moreover E0 was also allowed to vary in fitting procedure 1 Because Nind = 16 and Nfree = 11 the
refinement procedure 1 would be taken as reliable according to the Nyquist criteria However F
parameter of 06 and 09 were obtained with procedure 1 for R and σ2 of the V-O distances Moreover
E0 exhibited a confidence limit of plusmn 025 and F = 04 Apparently fitting procedure 1 already exceeded
the number of meaningful parameters and yielded ambiguous structural parameters On the one hand the
reduced amplitude of the FT(χ(k)k3) of dehydrated VxOySBA-15 compared to that of references
consisting of undistorted [VO4] units (Figure 5-5) suggested the presence of more than one V-O distance
including a short ldquovanadylrdquo V=O distance On the other hand however the resolution in the experimental
FT(χ(k)k3) and the available degree of freedom did not permit refining more than one V-O distance in
the procedure used Therefore the fitting procedure was modified E0 was kept invariant in the refinement
and only one V-O distance at ~175 Aring was used In contrast to procedure 1 procedure 2 yielded
reasonable confidence limits and acceptable F parameters Conversely the σ2 parameter of the V-Si at
25 Aring and the V-O contribution at 29 Aring exhibited rather high confidence limits Apparently both V-O
and V-Si neighbors in the distance range from 25 Aring to 29 Aring are required for a good refinement of the
model structure to the experimental data This is indicated by the confidence limits and F parameters
calculated for the corresponding distances (Table 5-4) Nevertheless the high σ2 obtained for the V-Si
contribution and the rather low σ2 obtained for the V-O at 29 Aring indicate a certain ambiguity of the
corresponding fit results
76
Table 5-4 V K edge XAFS parameters (Z for distances R and disorder parameter σ2) obtained from three different procedures of fitting a model structure (ie ldquoordered V2O7 dimersrdquo on SiO2 support) to the experimental XAFS FT(χ(k)k3) of dehydrated VxOySBA-15 (77 wt ) (details of fit given in Table 5-3) together with confidence limits (plusmn z referring to 95 of fit residual) and significance parameters F (details given in text)
Procedure 1 Procedure 2 Procedure 3
Pair N Z plusmnz F Z plusmnz F Z plusmnz F
R(V - O) 2(4) 175 0008 06 178 0001 -- 178 0001 --
σ2(V - O) 4 00072 00001 -- 00080 00001 -- 00079 00001 --
R(V - O) 2(--) 180 0002 -- -- -- -- -- -- --
R(V - O) 1 289 001 289 001 -- 289 001 --
σ2(V - O) 1 00001 00006 09 00001 00008 -- 00012f -- --
R(V - V) 1 327 002 -- 328 002 -- 329 001 --
σ2(V - V) 1 00125 00006 -- 00128 00007 -- 00116 00007 --
R(V - V) 1 360 002 -- 360 002 -- 360 002 --
R(V - Si) 1 253 001 -- 254 001 -- 254 001 --
σ2(V - Si) 1 00114 0002 04 00120 00013 03 00130 00008 --
E0 - 09 025 04 0f -- -- 0f -- --
Residual 41 38 39
The reason may be a considerable static disorder and thus a broadened V-Si distance distribution
Therefore the σ2 parameter was fixed in the final procedure 3 to a reasonable value which was obtained
empirically This constraint yielded a more reliable confidence limit for the σ2 parameter (plusmn 00008 Aring2) of
the V-Si contribution at 25 Aring (Table 5-4) Calculating and evaluating confidence limits and F tests
permitted us to arrive at a meaningful and reliable fitting procedure Moreover the approach employed
appears to be superior to calculating only the Nyquist criteria In total procedures 2 and 3 worked very
well for the XAFS data analysis of dehydrated VxOySBA-15 and triclinic Mg2V2O7 In contrast the local
structure around V centers in NH4VO3 was best described by assuming two different V-O distances in the
first coordination shell and only one V-V distance at 347 Aring (CN = 2) (Table 5-4) A V-O distance at
28 Aring was found to be insignificant
527 Local structure of dehydrated VxOySBA-15 ndash XAFS refinement of ldquoVO4ldquo based model
structures
After having identified two suitable references as model structures for XAFS refinements to the
experimental FT(χ(k)k3) of dehydrated VxOySBA-15 (Figure 5-5 middle and right) the XAFS
analysis approach chosen shall be described in more detail In addition to using confidence limits and
F tests as introduced above the suitable XAFS fitting procedure was developed stepwise as outlined in
the following
First we started with a common assumption from the literature UV-Vis-DRS or Raman measurements
reported in the literature revealed that dehydration of VxOySBA-15 resulted in a characteristic change
from a distorted square pyramidal to a distorted tetrahedral coordination [23117100] The local structure
of vanadium oxide species supported on SiO2 was assumed to correspond to isolated [VO4] units Hence
in a first tetrahedron approach the theoretical XAFS function of a [VO4] tetrahedron consisting of two
77
slightly different V-O distances was refined to the FT(χ(k)k3) of dehydrated VxOySBA-15 (Figure 5-7
left) Because of the similar height of the pre-edge peak in the XANES (Figure 5-3 bottom left) and the
first V-O peak in the FT(χ(k)k3) phases and amplitudes employed in the refinement were calculated
using the model structure of NH4VO3 (ICSD 1487 [138]) Figure 5-7 (left) shows a good agreement
between theoretical and experimental FT(χ(k)k3) of dehydrated VxOySBA-15 for the first V-O peak
below 2 Aring Naturally the amplitude between 2 Aring and 4 Aring in the FT(χ(k)k3) could not be accounted for
Hence a structural model assuming only isolated [VO4] species cannot adequately describe the local
structure around the V centers in dehydrated VxOySBA-15 Therefore we assumed that higher
coordination shells around the vanadium centers significantly contribute to the FT(χ(k)k3) of dehydrated
VxOy SBA-15 These shells have to be included in the refinement A seemingly expected contribution
may arise from silicon backscatterers in the SiO2 support at distances of less than 30 Aring This has been
proposed previously by Keller et al [120] Thus in extension of the tetrahedron approach a silicon atom
at a V-Si distance of 28 Aring was included in the theoretical model In the corresponding ldquoO3V-O-Sirdquo unit a
Si-O distance of 162 Aring is assumed (Figure 5-7 middle) as it is found in various silicates The result of
the XAFS refinement of the ldquoO3V-O-Sirdquo model to the FT(χ(k)k3) of dehydrated VxOySBA-15 is
depicted in Figure 5-7 (middle) The additional Si backscatterer resulted in a better agreement between
theoretical and experimental FT(χ(k)k3) at distances of about 24 Aring (not phase shift corrected) The
resulting V-Si distance amounted to 254 Aring comparable to the distance obtained by Keller et al (261 Aring
[120]) However it can be seen easily from Figure 5-7 (middle) that the amplitude in the FT(χ(k)k3) of
dehydrated VxOySBA-15 between 24 and 40 Aring is still not accounted for In addition to the V-Si
contributions in the range of 2-3 Aring Keller et al [114] proposed the presence of V-O contributions at 27
Aring which are caused by the oxygen atoms of the SiO2 support
00
005
-005
FT
(χ(k
)k3 )
0 2 4 6R [Aring]
0 2 4 6R [Aring]
0 2 4 6R [Aring]
V-O (2) 2x V-O (1)
V-O (1) V-Si (1)
V-O (2) 2x V-O (1)
V-Si (1) V-O (2) 2x V-O (1)
Figure 5-7 Experimental (solid) V K edge FT(χ(k)k3) of dehydrated VxOySBA-15 (77 wt) together with theoretical XAFS functions (left ldquoisolated VO4rdquo model middle addition of a V-Si path to the ldquoisolated VO4rdquo model right addition of support oxygen to ldquoisolated VO4rdquo model) Insets show the [VO4] tetrahedron (left) and a schematic representation of the V-Si path employed (middle) Also shown are the Fourier transformed χ(k)k3 of the individual scattering paths together with the corresponding coordination number in brackets
78
Thus to simulate this contribution a V-O distance originating from the triclinic Mg2V2O7 [139] at 28 Aring
was added to the refinement The result of the XAFS refinement is shown in Figure 5-7 (right) The
extended refinement procedure resulted in a better agreement between the theoretical XAFS function of
the model structure and the FT(χ(k)k3) of dehydrated VxOySBA-15 However for distances higher than
3 Aring the refinement of the FT(χ(k)k3) of dehydrated VxOySBA-15 was still not sufficient
528 Local structure of dehydrated VxOySBA-15 ndash XAFS refinement of ldquoV2O7ldquo based model
structures
Figure 5-7 shows that an ldquoisolated VO4ldquo model did not properly describe the local structure between 2 Aring
and 4 Aring around vanadium centers in dehydrated VxOySBA-15 Hence considering the results from UV-
Vis-DRS it was assumed that at least ldquoV2O7 dimersrdquo would be needed to achieve a good agreement
between theoretical and experimental XAFS FT(χ(k)k3) [V2O7] units are present in the structures of the
references NH4VO3 and triclinic Mg2V2O7 whose spectra resembled the XANES and EXAFS spectra of
dehydrated VxOySBA-15 (Figure 3 and Figure 5-5) Therefore a V-V scattering path at 34 Aring was
included in the model used for the XAFS refinement This distance corresponds to the V-V distance
between two corner-sharing [VO4] tetrahedrons in ldquoV2O7 dimersrdquo of NH4VO3 and Mg2V2O7 The result of
the corresponding XAFS refinement is shown in Figure 5-8 Apparently a structural model based on
isolated [V2O7] dimers was equally unsuited to describe the local structure around V centers in
dehydrated VxOySBA-15 The agreement between theoretical and experimental FT(χ(k)k3) in the range
from 2 to 4 Aring is still not sufficient (Figure 5-8 left) Also adding a V-Si distance to this ldquoisolated V2O7
dimer modelrdquo only resulted in a minor improvement of the refinement (not shown)
V+5O-2V+5
O-2
00
005
-005
FT
(χ(k
)k3 )
0 2 4 6R [Aring]
0 2 4 6 R [Aring]
0 2 4 6R [Aring]
V-O (2) 2x V-O (1)
V-V (1) V-V (1) V-O (1) V-Si (1)
V-O (2) 2x V-O (1)
V-V (1) V-V (1)
V-O (1)
V-O (2) 2x V-O (1)
V-V (2)
Si
Figure 5-8 Experimental (solid) V K edge FT(χ(k)k3) of dehydrated VxOySBA-15 (77 wt) together with a theoretical XAFS function (ie ldquoordered arrangement of V2O7rdquo model) Fit results are given in Table 5-3 The inset shows a schematic representation of the arrangement of V2O7 units in Mg2V2O7 Also shown are the Fourier transformed χ(k)k3 of the individual scattering paths together with corresponding coordination number in brackets
79
Figure 5-7 and Figure 5-8 (left) clearly show that neither an ldquoisolated VO4rdquo model nor an ldquoisolated
V2O7rdquo model describe the local structure of the majority of V centers in dehydrated VxOySBA-15
properly Hence in the next step an ordered arrangement of neighboring [V2O7] units was assumed
Because of their similar XANES and EXAFS spectra we again referred to NH4VO3 and triclinic
Mg2V2O7 as references [V2O7] units form chains in NH4VO3 with one V-V distance Conversely [V2O7]
units are neighboring but more separated in t-Mg2V2O7 resulting in two distinct V-V distances (ICSD
2321 [139]) Accordingly two additional scattering paths were added to the previous ldquoisolated V2O7rdquo
model These two paths correspond to V-O (28 Aring) and V-V (36 Aring) distances between two neighboring
[V 2O7] units in the structure of t-Mg2V2O7 The result of the corresponding XAFS refinement to the
FT(χ(k)k3) of dehydrated VxOySBA-15 is shown in Figure 5-8 (middle) together with the various V-O
and V-V distances used Apparently assuming neighboring [V2O7] units in an ordered arrangement
supported on SBA-15 yielded a good agreement between theoretical and experimental FT(χ(k)k3) of
dehydrated VxOySBA-15 over the extended R range from 1 Aring to 4 Aring The structural and fitting
parameters obtained from the XAFS refinement to the experimental FT(χ(k)k3) of dehydrated
VxOySBA-15 and triclinic Mg2V2O7 are given in Table 5-3 and Table 5-4 The similar V-O distances V-
V distances and σ2 parameters of dehydrated VxOySBA-15 and t-Mg2V2O7 corroborated our choice of
model system to describe the local structure around V centers in dehydrated VxOySBA-15
00
005
01
015
02
025
03
-005
0 2 4 6
FT
(χ(k
)k3 )
R [Aring]
41 wt VSBA-15
14 wt VSBA-15
77 wt VSBA-15
Figure 5-9 left Experimental (solid) V K edge FT(χ(k)k3) of dehydrated VxOySBA-15 (14 wt 41 wt and 77 wt) together with a theoretical XAFS function The fit results are given in Table 5-5 right Schematic structural representation of dehydrated VxOySBA-15 The most prominent distances employed in the XAFS refinement procedure are indicated
529 Schematic structural representation of dehydrated VxOySBA-15
A schematic structural representation of the ordered arrangement of [V2O7] units in dehydrated
VxOySBA-15 is depicted in Figure 5-9 (right) In contrast to previous results on low loaded (lt 1 Vnm2)
VxOySiO2 samples [21121] it is concluded that isolated [VO4] units are not the major vanadium oxide
species present in the dehydrated VxOySBA-15 samples studied here Of the different loadings studied
80
only the 14 wt VxOySBA-15 sample possessed a vanadium content of less than 05 Vnm2 The three
dehydrated VxOySBA-15 samples exhibited only minor differences in their XANES spectra (Figure 5-3)
FT(χ(k)k3) (Figure 5-9) and XAFS fit results (Table 5-5) Similar results were obtained for a 28 wt
sample prepared by Hess et al [41] Hence in the range of 28ndash 77 wt V on SiO2 the local structure of
the majority of V centers in dehydrated VxOySBA-15 is best described by an ordered arrangement of
neighboring [V2O7] units (Table 5-5 Figure 9) The presence of non-monomeric VxOy species in
dehydrated VxOySBA-15 samples was concluded recently based on NEXAFS studies combined with
theoretical calculations [4243] However the highly dispersed 14 wt VxOySBA-15 sample leaves
some ambiguity Concerning the low CVB number of 04 determined from the UV-Vis edge energy it
may be possible that a lower connectivity of VxOy or even isolated [VO4] tetrahedrons were present on
the SiO2 support In the corresponding refinement (Table 5-5) higher σ2 were obtained for the V-O and
V-V distances and a decreased σ2 for the V-Si distance was obtained for the dehydrated 14 wt
VxOySBA-15 sample compared to samples with higher loadings Thus the low vanadium loading caused
an increased disorder of the VxOy structure motifs on the support Comparing the V-O distances no
significant change was obtained for the different loadings Thus a change of the distortion of the [VO4]
tetrahedrons and the primary structure of dehydrated VxOySBA-15 was not observed with increasing
dispersion Furthermore a decreased amplitude in the FT(χ(k)k3) was observed for the second feature at
higher distances (~ 3-4 Aring)This indicates that the influence of higher V-V distances is less pronounced
Moreover it may be possible that isolated [VO4] tetrahedrons are present on the support together with a
dimeric tetrahedral species
Oxygen and silicon atoms of the SiO2 support are not depicted in the schematic representation shown in
Figure 5-9 (right) In particular Si atoms in the topmost layer of SiO2 belong to the second coordination
sphere of the V centers
Table 5-5 Type and number (N) of atoms at distance R from the absorbing V atom in a model system assuming an ordered arrangement of [V2O7] units (Figure 5-9 right) compared to experimental distances and XAFS disorder parameters (σ2) The parameters were obtained from the refinement of this model structure to the experimental V K edge XAFS FT(χ(k)k3) of dehydrated VxOySBA-15 with different V loadings (ie 77 wt 41 wt 14 wt ) (Figure 5-9 left) (k range from 27-105 Aring-1 R range 084-362 Aring Nind = 16 Nfree = 8 E0 = 0 eV in all cases fit residual 38 (77 wt) 70 (41 wt) 56 (14 wt)) (subscript c indicates parameters that were correlated in the refinement subscript f indicates parameters that were fixed in the refinement) Confidence limits and significance of fit parameters correspond to those given in Table 5-4 for the 77 wt sample
dehyd 77 wt dehyd 41 wt dehyd 14 wt
Type N Rmodel [Aring] R [Aring] σ2 [Aring2] R [Aring] σ2
[Aring2] R [Aring] σ2 [Aring2]
V - O 1 163 178 00079 178 00088 178 001
V - O 1 170 178 c 00079 c 178 00088 c 178 c 001 c
V - O 2 176 178 c 00079 c 178 00088 c 178 c 001 c
V - O 1 287 289 00012 f 290 0003 f 287 0003 f
V - V 1 342 329 00116 330 00119 335 00129
V - V 1 362 360 00116 c 361 00119 c 361 00129 c
V - Si 1 280 254 0013 255 00118 251 00109
81
Previous reports have indicated that V-Si distances may contribute to the experimental FT(χ(k)k3) of
dehydrated VxOySBA-15 [37] Therefore a single V-Si scattering path was included in the refinement of
the ldquoneighboring V2O7rdquo model described above (Figure 5-8 right) The structural parameters and
refinement details are given in Table 5-3 and Table 5-4 Comparing fit residuals confidence limits and F
parameters a significant improvement was observed Concerning the low distance of the V-Si
contribution an angle between V and Si (V-O-Si) of about 90 deg has to be present This may explain the
high average V-O bond length and the distortion of the dehydrated VxOySBA-15 structure as concluded
from the XANES analysis (177 Aring) and XAFS refinement (178 Aring) Apparently both the local structure
in VxOy species and the interaction with the SiO2 support are required to describe the FT(χ(k)k3) of
dehydrated VxOySBA-15 samples
5210 Limitations of the XAFS analysis of dehydrated VxOySBA-15
Eventually the limitations of the XAFS analysis of dehydrated VxOySBA-15 presented here should be
discussed XAFS is not a very sensitive technique with respect to distinguishing and identifying
additional minority species Experimental XAFS spectra are clearly dominated by the signal of the
majority phase Hence the presence of minority vanadium oxide species in dehydrated VxOySBA-15
with concentrations of less than ~5 cannot be excluded Only if the contribution of additional phases
amounts to more than ~5-10 will the distortion of the FT(χ(k)k3) and the deviation from the model
structure assumed be detectable In particular this holds if these minority species happen to be less
ordered than the majority phase
Moreover XAFS is an averaging technique Certainly higher shells should be taken into account
properly and various references should be measured for comparison Even then however it may remain
difficult to distinguish unambiguously between mixtures of various species or structures Hence a more
detailed discussion concerning the vicinity of different vanadium oxide species needs to be performed
Some constraints have to be made when an equal mixture of isolated [VO4] and neighboring [V2O7] units
is assumed for the high dispersion sample First the V-O distances in the first ldquoVO4rdquo shell of the two
species would have to be the same which was obtained by the refinement (Table 5-5) Otherwise a strong
reduction in amplitude of the first V-O peak in the FT(χ(k)k3) caused by destructive interference would
be discernible Secondly isolated [VO4] would not contribute to the FT(χ(k)k3) in the range from 2 Aring to
4 Aring Thus reduction in amplitude and much higher σ2 parameters compared to the t-Mg2V2O7 reference
would be detectable This was not observed in the EXAFS analysis of the dehydrated VxOySBA-15
presented here (Table 5-3 and Table 5-5) A similar statement holds for isolated [V2O7] units or a less
ordered arrangement of neighboring [V2O7] units Both would result in a reduction in the FT(χ(k)k3)
amplitude because of missing contributions in the 2-4 Aring range or destructive interference caused by a
broadened distribution of distances respectively Moreover for isolated or less ordered [V2O7] units a
single V-V distance would suffice to describe the experimental XAFS spectrum However a partial
reduction in amplitude in the range of 2-4 Aring was observed for the low loaded 14 wt dehydrated
82
VxOySBA-15 sample (Figure 5-9 left) Furthermore the refinement procedure employed did not allow
the variation of the σ2 of both vanadium distances independently Thus it cannot be excluded that isolated
VxOy species (besides dimeric) were also present on the dehydrated 14 wt VxOySBA-15 sample
especially if the low CVB number of 03 is taken into account For higher loadings the fitting procedure
has shown that an ordered arrangement of ldquoorderedrdquo dimeric VxOy clusters without the presence of
isolated species is more likely than a mixture of isolated and dimeric vanadium centers This is supported
by an average CVB number of 10 obtained from the UV-Vis edge energy together with the position of
the absorption band at 309 nm (Table 5-2) Eventually higher V-Si distances may have to be considered
in addition to the V-Si distance of ~25 Aring (Table 5-3) However a significant contribution of V-Si
distances in the range above 30 Aring in the FT(χ(k)k3) would require a highly ordered arrangement of
VxOy species on the SiO2 support and a very narrow distance distribution This seems to be unlikely
In summmary assuming a structural arrangement of vanadium centers in dehydrated VxOySBA-15 that
has already been established for reference vanadium oxides (ie t-Mg2V2O7) is simple and results in a
good agreement with experimental data More complex and artificially constructed arrangements of VxOy
species supported on SiO2 may be conceivable but appear to be less likely Both UV-Vis-DRS and XAFS
analysis corroborate a local structure around the majority of V centers in dehydrated VxOySBA-15
similar to the ordered arrangement of neighboring [V2O7] dimers in the structure of t-Mg2V2O7 for
loadings in the range of 28-77 wt dehydrated VxOySBA-15 With increasing dispersion (lt 05 Vnm2)
isolated centers may be present
5211 Local structure of hydrated VxOySBA-15 - Comparison to V oxide references
The EXAFS χ(k)k3 of hydrated VxOySBA-15 (as-prepared) with different V loadings are depicted in
Figure 5-10 left The usable spectral range extended from 27 Aring through 11 Aring-1 for the 77 wt sample
The EXAFS χ(k)k3 of the lower loaded samples was limited to 27 to 105 Aring-1 because of the high noise
level The V K edge FT(χ(k)k3) of hydrated VxOySBA-15 are shown in Figure 5-10 (middle) The
Fourier transformed χ(k)k3 and the V K near edge spectra of hydrated VxOySBA-15 are compared to
those of vanadium oxide references in Figure 5-10 (right) The range of potential model structures
describing the local structure of hydrated VxOySBA-15 can be narrowed down by comparing the
corresponding FT(χ(k)k3) Considering peak positions and relative peak heights in the FT(χ(k)k 3) it
appears that from the references available the FT(χ(k)k 3) of V2O5 and CaV2O6 resemble that of hydrated
VxOySBA-15 However from the detailed comparison the corresponding XANES spectrum of V2O5
seemed to be more suitable than that of CaV2O6 Compared to V2O5 hydrated VxOySBA-15 may possess
a more disordered structure because of the lower intensity in the FT(χ(k)k3) On the one hand the
positions of the various peaks in the XANES of hydrated VxOySBA-15 are similar to that of V2O5
(Figure 5-3 top right) On the other hand the lower peak intensities the FT(χ(k)k 3) are indicative of a
disordered V2O5 like structure of the vanadium oxide species in hydrated VxOySBA-15 (Figure 5-10
right) Therefore the local structure of V2O5 was used for further structure refinement
83
00
50
100
150
200
4 6 8 10
k [Aring-1]
41 wt VSBA-15
14 wt VSBA-15
77 wt VSBA-15
V2O5 χ(
k)k3
005
01
0 2 4 6
R [Aring]
41 wt VSBA-15
14 wt VSBA-15
77 wt VSBA-15
V2O5
FT
(χ(k
)k3 )
01
02
03
0 2 4 6
R [Aring]
77 wt VSBA-15
V2O5
CaV2O6
MgV2O6
(NH4)6V10O28middotH2O
Mg3V10O28middotH2O
FT
(χ(k
)k3 )
Figure 5-10 V K edge FT(χ(k)k3) of hydrated VxOySBA-15 (77 wt) compared to those of various references (eg V2O5 and MgV2O6) and the FT(χ(k)k3) and χ(k)k3 of hydrated VxOySBA-15 samples with different vanadium loadings (14 wt 41 wt and 77 wt)
5212 Local structure of a square pyramidal vanadium oxide cluster - XAFS refinement of a
ldquoV 2O5ldquo model structure
Comparison of the XANES and FT(χ(k)k3) of hydrated VxOySBA-15 with those of various references
identified V2O5 as the most suitable model structure for a detailed EXAFS analysis Therefore a
theoretical XAFS function calculated on the basis of a V2O5 model structure (ICSD 60767 [140]) was
refined to the experimental FT(χ(k)k3) of hydrated VxOySBA-15 Before the ldquolocal V2O5rdquo model was
applied to hydrated VxOySBA-15 the V2O5 model structure was refined to the FT(χ(k)k3) of V2O5 to
validate the procedure chosen Good agreement between the theoretical XAFS function of a V2O5 model
structure and the FT(χ(k)k3) of V2O5 was obtained (Figure 5-11) As described above the validity of the
XAFS analysis approach chosen was evaluated by calculating confidence limits and F parameters (Table
5-6) The model structure employed corresponds to the local structure around V centers in bulk V2O5
(Figure 5-11 right) In fitting procedure 1 three V-O distances (16 Aring 18 Aring and 20 Aring) and two σ2
(one for R = 16 Aring and one for all other V-O distances) in the first V-O shell were allowed to vary
independently Additionally three V-V distances (31 Aring 34 Aring and 36 Aring) with the same σ2 were refined
Moreover E0 was also allowed to vary in fitting procedure 1 Again because of Nind = 17 and Nfree = 10
the refinement procedure 1 would be considered reliable according to the Nyquist criteria Reasonable F
values (F lt 02) were calculated for the V-V distances and the σ2 (V-V) parameter However rather high
confidence limits of the V-O and V-V distances of plusmn 03 Aring and a F parameter of 08 for the first σ2 (V-O)
parameter were obtained with procedure 1 Moreover E0 exhibited a confidence limit of plusmn 05 and
F = 06 Hence fitting procedure 1 clearly exceeds the number of meaningful parameters Therefore the
fitting procedure was modified and the number of free parameters was reduced E0 was kept invariant
again in the refinement and only one σ2 (V-O) parameter was used
84
00
002
004
-002FT
(χ(k
)k3 )
)
00
002
004
-002FT
(χ(k
)k3 )
)
0 2 4 6
R [Aring]
Procedure 2
Procedure 3
Figure 5-11 Experimental (solid) V K edge FT(χ(k)k3) of V2O5 (left) together with theoretical XAFS functions (V2O5 model red lines refer to the V-O scattering path black lines refer to the V-V scattering paths) and a representation of the structural V2O5 model (right) Prominent distances employed in the XAFS refinement procedure are indicated
In contrast to procedure 1 procedure 2 yielded reasonable confidence limits (eg plusmn 001 for V-O
distances) and acceptable F parameters (mostly F=0) The theoretical local structure of V2O5 from
refinement procedure 1 and 2 represents the local structure motif of connected square pyramids in
V2O5 These square pyramids are connected via edges and are within the layers of the V2O5 structure
(Figure 5-11 right) In order to test if it is necessary to assume a layered structure to fully describe the
local structure of crystalline V2O5 the refinement procedure was extended by a fourth V-O distance at
~ 28 Aring (procedure 3) From Table 5-6 it is obvious that a reasonable refinement with low confidence
limits and acceptable F parameters (all F=0) was obtained
Table 5-6 V K edge XAFS parameters (Z for distances R and disorder parameter σ2) obtained from two different procedures of fitting a model structure (ie V2O5) to the experimental XAFS FT(χ(k)k3) of the V2O5 reference together with confidence limits (plusmn z referring to 95 of fit residual) and significance parameter F (details given in text)
Procedure 1 Procedure 2 Procedure 3
Pair N Z plusmnz F Z plusmnz F Z plusmnz F
R(V - O) 1 158 0327 -- 159 0009 -- 159 0008 --
σ2(V - O) 00076 008 08 00077 00004 -- 00081 00003 --
R(V - O) 3 187 013 -- 188 0003 -- 188 0003 --
σ2(V - O) 00087 00004 -- -- -- -- -- -- --
R(V - O) 1 201 013 -- 203 002 01 202 002 --
R(V - O) 1 -- -- -- -- -- -- 272 002 --
R(V - V) 2 313 005 -- 313 001 -- 313 0005 --
σ2(V - V) 00056 00003 -- 00057 00003 -- 00058 00003 --
R(V - V) 2 342 010 02 342 002 -- 342 002 --
R(V - V) 1 364 008 -- 364 001 -- 363 001 --
E0 28 05 06 28f -- -- 28f -- --
Residual 88 87 71
85
Moreover Figure 5-11 shows that the resulting theoretical FT(χ(k)k 3) of V2O5 from procedure 3 was
more similar to the experimental one for intermediate distances (2-3 Aring) than the one obtained from
procedure 2 Evidently the assumption of a layered structure is necessary for a good description of the
local structure of the V centers in crystalline V2O5
5213 Local structure of hydrated VxOySBA-15 ndash XAFS refinement of a ldquoV2O5ldquo based model
structure
Applying the refinement procedure introduced above to hydrated VxOySBA-15 resulted in good
agreement between the theoretical XAFS function of a V2O5 model structure and the FT(χ(k)k3) of
hydrated VxOySBA-15 (Figure 5-12 left) However an increased F parameter and a strongly shifted
V-O distance at 31 Aring with a rather high confidence limit was obtained (Table 5-7 procedure SBA1)
Therefore this distance was not seen as meaningful for describing the local structure of hydrated
VxOySBA-15 The structure of hydrated VxOySBA-15 seems to be less extended than the layered V2O5
structure
00
00
-002
FT
(χ(k
)k3 )
0 2 4 6 0 2 4 6
R [Aring]
0 2 4 6
R [Aring]R [Aring]
Procedure
SBA1
Procedure
SBA3
Procedure
SBA4
Figure 5-12 Experimental (solid) V K edge FT(χ(k)k3) of hydrated VxOySBA-15 (77 wt) together with theoretical XAFS functions The procedures refer to the subsequent reduction of the theoretical V2O5 model Details are provided in the text and the fit results are given in Table 5-7 Also shown are the Fourier transformed χ(k)k3 of the individual scattering paths together with the corresponding coordination number in brackets
Removing the V-O contribution at 28 Aring from the V2O5 model structure resulted in a higher R value of
the refinement (Table 5-7 procedure SBA2) Apparently the local structure of hydrated VxOySBA-15
is similar to that of V2O5 but not identical To improve the structure model used for the refinement of
hydrated VxOySBA-15 the number of V-V distances was reduced In procedure SBA3 the V-V distance
of 342 Aring was neglected This distance is found between two V centers in the V2O5 structure which are
only connected to each other via the corner of [VO5]x square pyramids (Figure 5-11 right) This V-V
distance is not found in the structure of ternary vanadates such as CaV2O6 which are also built from
square pyramidal units like V2O5
86
Table 5-7 V K edge XAFS parameters (Z for distances R and disorder parameter σ2) obtained from four different procedures of fitting a model structure (ie V2O5) to the experimental XAFS FT(χ(k)k3) of hydrated VxOySBA-15 (77 wt) (details of fit given in Table 5-8) together with the confidence limits (plusmn z referring to 95 of fit residual) and the significance parameter F (details given in text)
Procedure SBA1 Procedure SBA2 Procedure SBA3 Procedure SBA4
Pair N Z plusmnz F Z plusmnz F Z plusmnz F Z plusmnz F
R(V - O) 1 162 001 -- 163 001 -- 162 002 -- 163 001 --
σ2(V - O) 00105 00003 -- 00106 00003 -- 00104 00005 -- 00105 00003 --
R(V - O) 3 188 0003 -- 188 0003 -- 188 0004 -- 188 0003 --
R(V - O) 1 197 002 03 197 002 04 198 003 -- 198 002 03
R(V - O) 1(-) 307 006 06 -- -- -- -- -- -- -- -- --
R(V - V) 2 307 001 -- 307 0006 -- 306 001 -- 308 0006 --
σ2(V - V) 00121 00005 -- 00114 00005 -- 00114 00005 -- 00087 00004 --
R(V - V) 1(-) 342 003 01 343 003 02 -- -- -- 333 002 --
R(V - V) 2(1) 366 002 -- 366 002 -- 366 002 -- 360 002 --
E0 0f -- -- 0f -- -- 0f -- -- 0f -- --
Residual 85 100 147 86
As shown in figure Figure 5-12 (middle) and Table 5-7 the reduced refinement procedure SBA3
resulted in a rather weak agreement between the theoretical XAFS function of the model structure and the
FT(χ(k)k3) of hydrated VxOySBA-15 This was expected from the lower similarity found in the XANES
spectra of hydrated 77 wt VxOySBA-15 and CaV2O6 (Figure 5-3 top right) Moreover from the UV-
Vis-DR spectra (Figure 5-2 left ) an average V-O-V number of 30-35 was determined for the hydrated
VxOySBA-15 samples This indicated that the local structure of hydrated VxOySBA-15 was more similar
to square pyramidal [VO5]x chains than to a layered structure of square pyramidal vanadium centers like
in V2O5 (V-O-V number = 5) Therefore the refinement SBA3 was modified by separating the single V-
V distance at ~ 36 Aring with a coordination number of 2 into two individual distances of 34 and 36 Aring each
exhibiting a coordination number of 1 As shown in Figure 5-12 (right) and Table 5-7 this refinement
procedure (SBA4) resulted in a better residual low confidence limits and mostly zero F parameters
Hence it is assumed that the local structure of hydrated VxOySBA-15 can be described by a chain-like
square pyramidal [VO5]x structure However the differences between model structures assumed for the
local structure of V2O5 and hydrated VxOySBA-15 are small As shown in Figure 5-13 (bottom left) it
was possible to describe V2O5 with the reduced structure model applied to hydrated VxOySBA-15
(Figure 5-13 right) Details of the resulting parameters are given in Table 5-8 Higher R values and
increased F parameters (F=06) for the refinement of V2O5 indicate that procedure SBA4 is not sufficient
for describing the V2O5 structure Nevertheless the disorder parameters σ2 for the V-O and V-V scattering
paths used in the XAFS refinement increased for hydrated VxOySBA-15 compared to the V2O5 reference
(Table 5-8) This indicates an increased disorder in the local structure of hydrated VxOy species supported
on SBA-15 compared to bulk V2O5 The structural similarity between hydrated vanadium oxide species
supported on SiO2 and V2O5 has previously been observed by Raman spectroscopy [117] Evidently the
local structure of hydrated VxOySBA-15 used here is very similar to other materials described previously
in the literature [23117]
87
00
002
00
-002
FT
(χ(k
)k3 )
00
002
004
00
-002
0 2 4 6
FT
(χ(k
)k3 )
R [Aring]
77 wt VSBA-15
V2O5
Figure 5-13 left Experimental (solid) V K edge FT(χ(k)k3) of hydrated VxOySBA-15 (77 wt) (top) and of V2O5 (bottom) together with the theoretical XAFS functions Right A representation of the reduced V2O5 model structure used for the refinement The most prominent distances employed in the XAFS refinement procedure are indicated
In addition to the 77 wt VxOySBA-15 samples with lower loadings of 14 wt and 41 wt V were
measured (Figure 5-10) The amplitude of the FT(χ(k)k3) decreased with increasing dispersion
Especially in the range of 2-4 Aring a strong decrease of the amplitude was visible Hence the disorder
increased with decreasing V loading Similar trends were observed in UV-Vis-DR spectra (Table 5-2)
where the average CVB number decreased from 35 to 30 with decreasing loading Therefore a lower
degree of ldquohydrationrdquo was assumed for low loaded 14 wt VxOySBA-15 Apparently the degree of
hydration (V-V contribution) in the hydrated state depends on the vanadium dispersion Conversely in
the range of V loadings from ~ 14 to 77 wt the local structure of dehydrated VxOySBA-15 was largely
independent of the amount of vanadium oxide supported on SBA-15
Table 5-8 Type and number (N) of atoms at distance R from the V atoms in a V2O5 system compared to the experimental distances and the XAFS disorder parameter (σ2) The parameters were obtained from the refinement of a reduced V2O5 model structure (ICSD 60767 [140]) to the experimental V K edge XAFS FT(χ(k)k3) of hydrated VxOySBA-15 (77 wt) and bulk V2O5 (k range from 27 - 110 Aring-1 R range 09 - 38 Aring E0 (VxOySBA-15) = 00 eV E0 (V2O5) = 00 fit residual 86 (VxOySBA-15) and 125 (V2O5) Nind = 17 Nfree = 8) (subscript c indicates parameters that were correlated in the refinement) Confidence limits and significance of the fit parameters are given in Table 5-7
V2O5
hydrated 77 wt VxOySBA-15
Type N Rmodel [Aring] R [Aring] σ2 [Aring2] R [Aring] σ2
[Aring2] V - O 1 158 159 00073 163 00105 V - O 1 178 186 00073c 188 00105 c V - O 2 188 186c 00073 c 188 c 00105 c V - O 1 202 201 (F=06) 00073 c 198 (F=03) 00105 c V - V 2 308 311 00075 308 00087 V - V 1 342 353 (F=02) 00075 c 334 00087 c V - V 1 356 364 00075 c 361 00087 c
88
53 Summary
Both UV-Vis and X-ray absorption spectroscopy are very suitable techniques for studying the local
structure of dispersed metals or metal oxides on various support materials Here the local structure of
vanadium oxide supported on nanostructured SiO2 (SBA-15) was investigated Three samples with
different vanadium loadings (14 wt 41 wt and 77 wt V on SBA-15) were employed
For hydrated VxOySBA-15 a square pyramidal structure similar to V2O5 was assumed to be present
Compared to bulk V2O5 a lower degree of extension and higher distortion of the [VO5] vanadium centers
was inferred from the UV-Vis edge energy position and the XAFS refinement Thermal treatment in air at
623 K resulted in characteristic structural changes of the V oxide species UV-Vis-DRS and XAFS
measurements of dehydrated VxOySBA-15 showed that the local structure could be described by a model
structure consisting of an ordered arrangement of neighboring [V2O7] units in the range of 05-25 Vnm2
This is in good agreement with NEXAFS studies and theoretical calculations that also concluded the
presence of V-O-V bonds in the VxOy species supported on SBA-15 [4243] However at lower loadings
(lt 05 Vnm2) isolated [VO4] tetrahedrons besides dimeric tetrahedral structures may also be present A
similar trend was recently observed for low loaded MoxOySBA-15 samples [137] The influence of the
SiO2 support was not negligible and caused a high distortion of the tetrahedral vanadium oxide cluster in
dehydrated VxOySBA-15
The local structures of dehydrated VxOySBA-15 were found to be mainly independent of the V loading
over the range employed Conversely in hydrated VxOySBA-15 a decrease of the number of V-O-V
contributions in FT(χ(k)k3) and of the structural disorder of the hydrated square pyramidal vanadium
centers with increasing vanadium dispersion was observed A more detailed discussion about the
formation processes of hydrated and dehydrated VxOySBA-15 as a function of time and atmosphere will
be given in the next chapter
In contrast to conventional XAFS analysis an extended approach to evaluate the significance of structural
fitting parameters in XAS data analysis was employed After fitting the theoretical XAFS functions of a
suitable model structure to the experimental data confidence limits and F parameters were calculated to
identify suitable analysis procedures Because the number of parameters often exceeds the number of
ldquoindependentrdquo parameters evaluating the reliability and significance of a particular fitting procedure is
mandatory It was shown that the number of independent parameters (Nyquist) alone was not sufficient to
verify a reliable refinement procedure
89
6 Dynamic changes in the local structure of
VxOySBA-15 model catalysts in oxidative and water
saturated atmospheres
61 Introduction
In the previous chapter the structure of dehydrated and hydrated vanadium oxide supported on SBA-15
was discussed The hydrated structure was proposed to consist of chainlike square pyramidal vanadium
oxide centers The dehydrated vanadium oxide supported on SBA-15 was described by dimeric vanadium
oxide units with tetrahedral coordination of the vanadium centers For lower vanadium loadings
(lt 03 Vnm2) these centers may be present together with isolated tetrahedral centers However these
results represent only a picture of the vanadium oxide structure present on SBA-15 under static
conditions Because these samples were introduced as model catalysts it is crucial to know how the
transformation between the hydrated and dehydrated state proceeds under reaction conditions
In situ investigations of structural changes during thermal treatment have been subject of only a few
reports In situ IR and NIR measurements reported [232740114141142] a decrease of the isolated Si-
OH bonds with increasing vanadium loading The presence of V-OH bands (3660 cm-1) was reported for
hydrated and dehydrated VxOySiO2 samples In situ Raman [3234143] and UV-Vis-DRS [24144]
measurements showed that at temperatures above 473 K characteristic Raman bands and UV-Vis-DRS
absorption bands of the dehydrated state were present independent of the presence of water in the reaction
atmosphere Furthermore it was reported that hydration and dehydration processes were reversible
[2435145] In contrast Xie et al [34] reported the formation of V2O5 crystallites after repeated
hydration and dehydration of samples with dispersed vanadium oxide species below the monolayer
coverage (25 Vnm2) They assumed that V2O5middotnH2O gels were formed during the hydration process
which decomposed to V2O5 clusters and served as ldquonucleirdquo for the growth of crystalline V2O5 Raman
[23] IR [23115141] and MAS NMR [146] measurements indicated that some of the silanol groups of
SiO2 are consumed during formation of the dehydrated state and that the respective tetrahedral vanadium
oxide species is linked via V-O-Si bonds to the support
Given these diverse results on the dehydration process found in the literature it was intended to
investigate the dehydration process of VxOySBA-15 in more detail here Therefore the evolution of the
vanadium oxide structure on SBA-15 was investigated during temperature programmed reaction in
oxygen containing atmospheres using UV-Vis-DRS XAS and Raman spectroscopy Furthermore the
impact of the vanadium loading and the influence of water vapor on the hydration and dehydration
process were investigated
90
62 Results and discussion
621 Impact of pretreatment temperature on dehydrated VxOySBA-15 phase
Various temperatures for the oxygen pretreatment process (dehydration process) were reported in the
literature They range from rather low temperatures of 573 K [35146] and 623 K [32] up to 773 K [23]
853 K [141] and 1073 K [40] Therefore various pretreatment temperatures were tested for dehydration
of the VxOySBA-15 samples In Figure 6-1 the FT(χ(k)k3) and UV-Vis-DR spectra of 77 wt
VxOySBA-15 dehydrated at different temperatures in the range of 554-773 K are shown (20 O2 in He)
The UV-Vis-DR spectra of 77 wt VxOySBA-15 treated at 554 K and 626 K showed only a small blue
shift of a few nm of the UV-Vis absorption edge with increasing temperature (Figure 6-1 left) The blue
shift in the UV-Vis-DR spectra did not affect the average V-O-V number of ~ 1 (dimeric tetrahedrons)
determined from the UV-Vis edge energy The experimental FT(χ(k)k3) of 77 wt VxOySBA-15
treated at 623 K 723 K and 770 K (Figure 6-1 right) showed only minimal differences and they were
simulated successfully using the model structure of dehydrated VxOy (ordered arrangement of [V2O7]
units introduced in Chapter 5) The amplitude of the fist V-O shell at 178 Aring in the FT(χ(k)k3) of
77 wt VxOySBA-15 increased after calcination at 770 K for 8 h compared to dehydration at 623 K for
30 min The disorder parameter σ2 of the V-O scattering path decreased from 00071 Aring2 to 00063 Aring2 with
increasing dehydration temperature (Table 6-3 Table 6-4 page 104 and 106) This indicates a wider V-O
distance distribution and thus a slightly increased structural order of the first V-O coordination sphere
Apparently above a certain temperature the dehydrated state of vanadium oxide on mesoporous SiO2 is
present with only small changes in average V-O bond length and structural order Higher temperatures
than 773 K were not investigated because of the upper temperature limits of the in situ cells used
0
15
5
10
220 600300 400 500
F(R
infin)
Wavelength [nm]
626 K 1 h
554 K 30 min005
01
015
02
0 2 4 6
R [Aring]
FT
(χ(k
)k3 )
623 K 30 min
723 K 1 h
770 K 8 h
Figure 6-1 Left UV-Vis-DR spectra of 77 wt VxOySBA-15 dehydrated at different temperatures All spectra were recorded at 298 K Right V K edge FT(χ(k)k3) of 77 wt VxOySBA-15 after different dehydration procedures The dehydration was performed in 20 O2 in He
91
A more detailed knowledge of the dehydration process was obtained from in situ XAS and UV-Vis-DR
spectra recorded during temperature treatment The UV-Vis-DRS measurements are depicted only for
14 wt VxOySBA-15 and the XAS results only for 77 wt VxOySBA-15 Dehydration experiments
were conducted for all loadings (14 41 77 wt V on SiO2) using both spectroscopic methods The
results were similar for all loadings employed (Figure 6-2)
622 Dehydration process investigated by in situ UV-Vis-DRS
In situ UV-Vis-DR spectra of 14 wt VxOySBA-15 during dehydration and the evolution of the water
ion current (me 18) are depicted in Figure 6-2 left Immediately after starting to heat the sample a
change in the UV-Vis-DR spectra was visible (294-400 K) which was accompanied by an increased
formation of water The intensity of the absorption maximum at ~ 365 nm decreased which caused a blue
shift of the UV-Vis absorption edge A direct correlation between UV-Vis edge energy and vanadium
structure as discussed in Chapter 523 was not made because of the temperature broadening of the UV-
Vis-DR spectra Typically a red shift of the UV-Vis edge energy of 01- 02 eV was observed for V2O5
and magnesium vanadate references during heating to 657 K However the strong blue shift of the UV-
Vis edge energy between 294 K and 400 K indicates that changes in coordination geometry of the
absorbing vanadium centers from square pyramidal to tetrahedral proceeded mainly in this temperature
range A red shift to 286 nm and an increase in intensity were observed for the second absorption band at
260 nm in the UV-Vis-DR spectra At temperatures above 550 K a slight decrease of this band was
detected The increase in intensity of the band at 286 nm was enhanced after the low energy band at
365 nm nearly disappeared In the temperature range (400-540 K) where the absorption band at 286 nm
reached its maximum a second step of water formation was observed
300 350 400 450 500 550 600
250
300
350
400
450
Norm
alized Ion Current m
e 18
0 04 07 10 14 17 21 24 28 31 35 38 42 45
Temperature [K]
Wav
elen
gth
[nm
] 10
20
30
40
250 350
λ [nm]
450 550
F(R
infin)
F(Rinfin)
00
025
05
075
10
00
545 55
555 56
565
300 350
400 450
500 550
600 Nor
mal
ized
Abs
orpt
ion
Photon Energy [keV] Temp [K]
Figure 6-2 Left in situ UV-Vis-DR spectra of the 14 wt VxOySBA-15 sample and the water ion current me 18 (554 K 4 Kmin 20 O2 in He) during dehydration The inset shows the 2D spectra depicted in the 3D color map Right V K edge in situ XANES spectra during dehydration of the 77 wt VxOySBA-15 sample (623 K 5 Kmin 20 O2 in He E4 Beamline)
92
623 Dehydration process investigated by in situ XAS
The V K edge XANES spectra of 77 wt VxOySBA-15 recorded during dehydration (298-623 K
5 Kmin 20 O2 in He) are shown in Figure 6-2 right Similar to the changes observed in the UV-Vis-
DR spectra of 14 wt VxOySBA-15 significant changes were observed directly after starting the
temperature treatment (298-440 K) Apparently the characteristic XANES spectra of hydrated
VxOySBA-15 changed rapidly into a XANES spectrum which was characteristic for the dehydrated state
of VxOySBA-15 (Chapter 524) The strong decrease of the first absorption feature between 5487 and
5497 keV in the spectrum of hydrated VxOySBA-15 was indicative for this transformation In the
temperature range from 298 to 440 K a strong formation of water as reported for the UV-Vis-DRS
mesurement was observed (data not shown) At temperatures above 440 K no distinct changes above the
V absorption edge were detected in the XANES spectra of 77 wt VxOySBA-15
The results of a principal component analysis (PCA) of the XANES spectra are shown Figure 6-3 Two
components were identified to be present in the in situ XANES spectra recorded during the dehydration
This was inferred from the minimum of the indicator value and the RCN product (product of residual
and component number) of the second component Hence dehydration proceeded directly from the
hydrated state to the dehydrated state of VxOySBA-15 and no intermediate phases were formed
Therefore the XANES spectra of hydrated and dehydrated 77 wt VxOySBA-15 were assigned to the
two phases obtained Evolution of the resulting phase fractions is depicted in Figure 6-3 together with the
V K pre-edge peak height and position (referred to V K edge 5465 eV) The pre-edge peak intensity
increased immediately with increasing temperature and reached a constant value at 550 K The intensity
increase seemed to correlate with the increasing fraction of the dehydrated phase during thermal
treatment
321 392 465 533 605 623 623
00
02
04
06
08
10 ramp
Fra
ctio
n of
Pha
se
Temperature [K]
054
056
058
060
062
064
Norm
V K
Pre-edge P
eak Height
555
560
565
570
V K
Pre-edge P
eak Position [eV
]
Figure 6-3 Evolution of the V K pre-edge peak height () and energy position () together with
the resulting concentration of the hydrated () and dehydrated () phase of 77 VxOySBA-15 derived from the XANES spectra depicted in Figure 6-2 right (623 K 5 Kmin 20 O2 in He E4 beamline)
93
16 17 18 19 2004
06
08
10
12
-H2O
hydrated V
xO
ySBA-15
dehydratedV
xO
ySBA-15)
Nor
mV
K P
re e
dge
Pea
k H
eigh
t
Average V-O Bond Length R [Aring]
170 175 180 185 190 195
46
48
50
52
54
56
58
60V
2O
5
tetrahedral
squarepyramidal
octrahedral
peak maximumcentroid energy
dehyd
hyd
Pre
-edg
e P
eak
Pos
ition
[eV
]
Average V-O Bond Lentgh R [Aring]
Figure 6-4 V K edge pre-edge peak height as a function of average V-O bond length (left) and relative energy position and centroid energy (right) of vanadium oxide reference compounds measured at A1 beamline The values determined for dehydrated and hydrated 77 wt VxOySBA-15 are indicated as lines (symbols as in Figure 5-4 Chapter 524 details Table 10-4)
The energy position decreased in the temperature range from 298 K to 440 K and remained constant
above 440 K In contrast to the evolution of the pre-edge peak height no direct correlation of the energy
position with the evolution of the VxOySBA-15 phases was observed
In Chapter 524 the linear correlation between the pre-edge peak height and the average length of V-O
distances was discussed Only the pre-edge peak height was used here and not the product of the pre-edge
peak area and height (Figure 6-4 left) The reason behind this was that the spectra shown in
Chapter 524 were recorded at beamline A1 whereas the spectra shown here were measured at different
beamlines (A1 C E4 Hasylab) Small differences in the resolution of the beamline spectrometer cause
small differences in the XANES spectra For instance the pre-edge peak height of dehydrated 77 wt
VxOySBA-15 was 064 at beamline E4 and 074 at beamline A1 Due to the fact that not all references
shown in Figure 6-4 were available on all beamlines the linear function (52) was not derived for all data
sets and applied to the XANES spectra in Figure 6-2 right (E4 beamline) Nevertheless the pre-edge
peak height showed a linear dependence with the average V-O bond length as depicted in Figure 6-4 left
(beamline A1) Referring to Chapter 524 the pre-edge peak height represents the average bond length
of the V-O distance in the first coordination sphere Given this relation appears that a continuous decrease
of the average bond length took place during the dehydration process However the point where the
vanadium centers in VxOySBA-15 changed from a square pyramidal to a tetrahedral coordination could
not be determined directly from the pre-edge peak height (average V-O bond length) An estimate was
made from the relative energy position of the pre-edge peak Figure 6-4 right depicts the relative energy
position and centroid energy of the pre-edge peak of vanadium reference compounds as a function of the
average V-O bond length In contrast to the pre-edge peak height no linear correlation was found A broad
range of energy positions between 47 eV and 51 eV was detected for tetrahedral compounds
Conversely almost the same energy positions between 52 eV and 55 eV were determined for square
94
pyramidal and distorted octahedral compounds The relative energy position obtained from the maximum
of the pre-edge feature and the centroid energy determined according to Chaurand et al [94] showed the
same dependence Only V2O5 exhibited an increased centroid energy of 60 eV Thus the energy position
is more sensitive towards the coordination of the absorbing vanadium centers than towards the average
bond length
Apparently the energy position of hydrated and dehydrated 77 wt VxOySBA-15 deviated from the
energy positions determined for bulk vanadium oxide references (Figure 6-4 right) Hence energy
position of the absorption edge is affected by more complex factors than only coordination of the
vanadium centers One factor may be a strong influence of the SiO2 support that cannot be neglected
because of the high dispersion of the vanadium oxide clusters However the strong impact of the
vanadium coordination on the energy position allowed determining the point where the square pyramidal
coordination of vanadium centers changes into a tetrahedral coordination during dehydration No
significant change of the energy position of the pre-edge peak was detected for temperatures above 440 K
(Figure 6-3) It seems that the transformation from hydrated to dehydrated VxOySBA-15 was completed
at this temperature This temperature was higher than the transformation temperature determined from the
UV-Vis-DR spectra in Figure 6-2 left (~ 400 K) The increase of the pre-edge peak height at
temperatures above 440 K may reflect the decreasing distortion of the tetrahedral VxOy species A
temperature of 440 K coincidences with the observation of the characteristic Raman band at 1040 cm-1
measured by in situ Raman spectroscopy (data shown in appendix 104 Hess et al [3238115117])
For both methods UV-Vis-DRS and XAS the same results were obtained Moreover the same
dehydration process was inferred for the 14 wt VxOySBA-15 (UV-Vis-DRS data shown) and the
77 wt VxOySBA-15 sample (XAS data shown) Apparently the dehydration process was independent
of the vanadium loading on the SBA-15 support
624 Dehydration of the silica SBA-15 support
The dehydration process of the vanadium oxide species supported on SBA-15 discussed above cannot be
fully understood without knowledge of the processes that occur on the silica support Dehydration
(desorption of physically adsorbed water) and dehydroxylation processes (decomposition of silanol
groups) were reported for pure silica samples Reviews were presented by Zhuravlev et al [147] and
Vansant et al [104] Thermogravimetric (TG) measurements were conducted to compare the dehydration
process of VxOySBA-15 samples with that of bare SBA-15 support Figure 6-5 left depicts the
thermograms for bare SBA-15 14 wt and 77 wt VxOySBA-15 All three curves show the same
progression of mass loss in the temperature range employed Given that a mass loss was already detected
at room temperature (303 K) a holding time of 60 min was adhered before starting to heat After 60 min
at 303 K only an insignificant mass loss was detected After reaching the maximum temperature of
623 K the temperature was held for 30 min
95
Four steps of mass loss were observed in the measured thermograms (Figure 6-5) In the case of pure
silica samples such as SBA-15 they can be ascribed to different stages of dehydration and
dehydroxylation [147] Zhuravlev reviewed the temperature dependent water desorption processes of
various silica samples in vacuum [147] The first mass loss of SBA-15 occurred already at room
temperature (step 1 303 K) According to Zhuravlev [147] it was ascribed to desorption of physically
adsorbed water present in a multilayer coverage on the SiO2 support The second step (step 2) was
detected between 303 K and 380 K In this range an increased water evolution was detected in the gas
phase by online mass spectrometry Water formation in this step was ascribed to physically adsorbed
water in a coverage below one monolayer Increasing temperature led to the third step (step 3) It ranged
from ~ 380 K up to the maximum temperature of 623 K It was accompanied by the fourth step (step 4)
during hold at 623 K According to Zhuravlev [147] the dehydration process of physically adsorbed water
was accompanied by a dehydroxylation process of the silica where the surface silanol groups decompose
to surface siloxane groups (equiv Si ndash O ndash Si equiv) and water A decrease from 46 to ~ 18 OH ndash groupsnm2
was reported for the employed temperature treatment (453-773 K) in vacuum [147] Furthermore the
temperature of 453-463 K was discussed as the characteristic temperature where dehydration (in vacuum)
is complete and a ldquodryrdquo and fully hydroxylated SiO2 surface (maximum Si-OH) is present
Differences in the temperature ranges reported here compared to those reported by Zhuravlev may be due
to deviating measurement methods Here TG experiments with a constant flow of 50 mlmin 20 O2 in
He were conducted The similarity of the thermograms of SBA-15 and VxOySBA-15 did not allow a
discussion of the dehydration of hydrated vanadium oxide species and the dehydration of the SBA-15
support independently from each other
0 20 40 60 80 100 120090
092
094
096
098
100 SBA-15 77 wt V
xO
ySBA-15
14 wt VxO
ySBA-15
Nor
mal
ized
Mas
s
Time [min]
300
350
400
450
500
550
600
650
step 4step 3
step 2
step 1
Tem
perature [K]
77-VOSBA-15 41-VOSBA-15 14-VOSBA-15 SBA-150
1
2
3
4
Rel
ativ
e W
eigt
h Lo
ss [
] (n
orm
aliz
ed to
the
400
m2 g
)
step 1 step 2 step 3 step 4
Figure 6-5 Left Thermograms of bare and VxOySBA-15 samples Right normalized relative mass loss detected for the observed steps derived from the thermograms (left side)
96
A comparison of the relative mass loss is depicted in Figure 6-5 right The mass loss was referred to a
BET surface area of 400 m2g The highest total mass loss of ~ 100 (400 m2g) was detected for
77 wt VxOySBA-15 A total mass loss of ~ 62 (400 m2g) was detected for 41 wt and 14 wt
VxOySBA-15 and a mass loss of 36 (400 m2g) for bare SBA-15 Thus the presence of vanadium on
the SBA-15 support allows the adsorption of a higher amount of water on the same surface area as on
bare SBA-15 Comparing the mass loss of the individual steps showed that step 1 and step 4 seemed to be
independent of the vanadium loading on the catalyst The loss of mass in step 2 and step 3 decreased with
decreasing vanadium loading on SBA-15 Thus in these steps the additional adsorption of water in
hydrated VxOySBA-15 played a pronounced role The temperature range of step 2 was 303-380 K In this
range the structure transformation from the hydrated to the dehydrated state was observed in the UV-Vis-
DR and XANES spectra Hence the additional water compared to bare SBA-15 was adsorbed or bound
in the structure of hydrated VxOySBA-15 The water evolution in step 3 may originate from a further
water evolution from the vanadium oxide species or from the dehydroxylating SBA-15 support Which of
these processes is more likely cannot be determined solely from the thermograms The in situ UV-Vis-
DRS and XAS measurements indicated that in this temperature range (400-600 K) structural changes
were still proceeding These were ascribed to the formation and ordering of the tetrahedral dehydrated
VxOySBA-15 phase
625 Determination of the apparent activation energy of water desorption - ED
The apparent activation energy for step 2 was determined to reveal the effect of the vanadium oxide on
the water desorption process A method according to Vansant et al [104] was chosen The maximum of
the differential thermogravimetry (DTG signal) was used to determine a maximum rate temperature
(Tmax) as a function of the heating rate (β = 246810 Kmin) By using an Arrhenius type plot the
apparent activation energy for water desorption (ED) was determined from these values Figure 6-6 In
addition to bare SBA-15 a measurement of Kieselgel 60 (reference used by Vansant et al [104]) was
conducted Figure 6-6 depicts the Arrhenius plots for the 77 wt VxOySBA-15 sample Desorption
energies are listed in Table 6-1 An apparent desorption energy of 40 kJmol was determined for
Kieselgel 60 in agreement with the values reported by Vansant et al [104]
Table 6-1 Apparent activation energies of water desorption Ed determined from the plot of ln(Tmax
2β) as a function of 1Tmax (Figure 6-6) freshly calcined sample two year old sample
ED [kJmol]
Sample bare silica support VxOxSBA-15
77 wt VxOy-SBA-15 111 plusmn 7 83 plusmn 10 (91 plusmn 7)
41 wt VxOy-SBA-15 -- 72 plusmn 5
14 w VxOy-SBA-15 101 plusmn 12 75 plusmn 7
Kieselgel 60 40 plusmn 9 --
97
Vansant et al [104] compared this value with ldquothe latent vaporization heat of water (∆Hv=41 kJmol)rdquo
and approximated that the ldquodesorption of water can be depicted as vaporization of liquid water out of the
silica poresrdquo However comparing the value obtained for Kieselgel 60 with the one detected for SBA-15
a significantly higher apparent desorption energy was detected for the SBA-15 support (~100-
110 kJmol) This indicated that a pronounced interaction of physically adsorbed water and SBA-15 was
present One possible explanation may be a ldquostrengthening of the hydrogen bondingrdquo of adjacent
hydroxyl groups in small pores [104] This may result in a higher density of surface silanol groups and an
increased interaction of the silanol groups with the physically adsorbed water Therefore the pore
structure of SBA-15 consisting of meso- and micropores could cause the higher desorption energy
Vanadium oxide supported on SBA-15 exhibited a lower apparent desorption energy of 72-83 kJmol
This lower value may be caused either by a decreased surface area and a changed distribution of pores
after APTES functionalization and vanadium grafting or by the pronounced effect of the adsorbed water
to the structure of hydrated samples The comparison of the relative mass losses in Figure 6-5 suggests
that the water evolution in step 2 may be more likely explained by the dehydration of the supported
hydrated vanadium oxide species than by the dehydration of the silica support Therefore the apparent
energy of water desorption is mostly due to loss of water from the hydrated VxOySBA-15 structure
0 20 40 60 80 100 1204000
4200
4400
4600
TG
(m
ass)
[microg]
Time [min]
raw DTG signal smoothed DTG signal
300
400
500
600
700
Tem
perature [K]
Tmax
280x10-3 290x10-3 300x10-3 310x10-3 320x10-390
95
100
105
110
77 wt V 77 wt V 77 wt V 77 wt VxxxxOOOO
yyyySBA-15SBA-15SBA-15SBA-15
linear fit 77 wt V linear fit 77 wt V linear fit 77 wt V linear fit 77 wt VxxxxOOOO
yyyySBA-15SBA-15SBA-15SBA-15
ln (
Tm
ax2 β
)
1Tmax
[1K]
SBA-15 SBA-15 SBA-15 SBA-15 linear fit SBA-15 linear fit SBA-15 linear fit SBA-15 linear fit SBA-15
Figure 6-6 Left TG and DTG signals recorded for 77 wt VxOySBA-15 (10 Kmin 623 K) location of Tmax is indicated right plot of ln(Tmax
2β) as a function of 1Tmax for bare SBA-15 and 77 wt VxOySBA-15
626 Types of silanol groups on the SiO2 support ndash 29Si CP-MAS-NMR
However no direct information about the changes of the SiO2 support was obtained from the TG
measurements Hence 29Si MAS-NMR measurements were conducted for SBA-15 and for hydrated and
dehydrated 77 wt VxOySBA-15 In Figure 6-7 left the possible types of Si atoms that can be
distinguished are depicted schematically Internal Si atoms that are located in SiO4 tetrahedrons are
denoted as Q4 centers and have a chemical shift of -110 ppm Si centers with geminol silanol groups
98
(HO-SiO2-OH) are termed as Q2 centers and they have a chemical shift of -90 ppm In the case of isolated
(HO-SiO3) or vicinal silanol groups (O3Si-OHmiddotmiddotmiddotmiddotmiddotHO-SiO3) a chemical shift of -102 ppm was observed
and the Si centers are denoted as Q3 centers The resulting spectra are depicted in Figure 6-7 right
Approximately 35 of the MAS-NMR signal of bare SBA-15 was due to Si centers exhibiting OH
groups In the MAS-NMR spectrum of hydrated 77 wt VxOySBA-15 the fraction of Si centers with
OH groups decreased to 16 Geminol type Si centers (Q2) were hardly detectable This lower amount of
Si-OH groups suggests that the missing fraction of Si-OH groups may have formed bonds to the hydrated
vanadium centers (Si-O-V) Similar results were reported by Dzwigaj et al [146]
Si
O
Si
Si
OH
OO
O
O
Si
OH
OO
HO
Si
OO
Si
O
SiO
SiO
OO
OH
Si
O
O
Si
OH
Si
Q4Q2Q3
-60 -80 -100 -120 -140
DDDD
CCCC
BBBB
AAAA
Q2Q3Q4
00100
01684
11485
102565
Q4
Q3
Q2
[ppm]
Figure 6-7 Left A picture of different types of silanol groups of silica materials right 29Si CP-MAS-NMR of bare and 77 wt VxOySBA-15 treated at different temperatures (A) bare SBA-15 (B) hydrated 77 wt VxOySBA-15 (C) dehydrated 77 wt VxOySBA-15 (653 K 1 h) (D) calcined 77 wt VxOySBA-15 (843 K 12 h) The red curve is the envelope of the Gaussian deconvolution
Thermal treatment according to the standard dehydration procedure at 653 K (1 h hold 20 O2 in He) did
not significantly change the number of silanol-type Si centers in the sample Differences compared to the
hydrated sample are within the error of the refinement procedure employed Therefore the number of
Si-O-V bond formed did not change during the dehydration process Nevertheless a light yellowish color
was observed for dehydrated 77 wt VxOySBA-15 (653 K 1 h) which may be explained by aging
effects (see below) No signal for Q3 and Q2 type Si centers was detected for a higher dehydration
temperature of 843 K as used in the calcination (823 K 12 h 20 O2 in He) Recalcined 77 wt
VxOySBA-15 exhibited a white color after high temperature treatment A decrease of silanol type Si
centers can be explained by a pronounced dehydroxylation of the silica SBA-15 However this did not
explain the total absence of any silanol type Si centers According to Zhuravlev [147] the number of
silanol groups could be reduced by a thermal treatment at 843 K but a complete dehydroxlation of silica
would only be achieved at temperatures higher than 1173 K (vacuum) Hence in addition to the
dehydroxylation of the SBA-15 support a certain fraction of silanol groups formed Si-O-V bonds with
the vanadium oxides species
99
627 The hydration process
Typically freshly calcined samples changed their color from white to yellow and orange after exposure to
air under ambient conditions This process is denoted as hydration To investigate the hydration process a
rehydration of the dehydrated VxOySBA-15 samples was conducted at room temperature The gases used
were saturated with water for rehydration A water content of 13-16 Vol in the gas phase was
achieved which equals the humidity of ambient air Figure 6-8 left depicts the V K pre-edge peak height
and the water in the gas phase (me 18) as a function of time The inset shows the corresponding XANES
spectra Figure 6-8 right shows the evolution of the UV-Vis edge energy and the water detected in the
gas phase (me 18) Apparently hydration of the vanadium oxide species of dehydrated VxOySBA-15
started immediately after water was detectable in the gas phase During the hydration process a decrease
of the pre-edge peak height and an increase in intensity in the XANES spectra (548-549 keV) was
observed Furthermore after exposure to water a decrease of the UV-Vis edge energy from 34 eV to
28 eV was detected Both the decrease of the V K edge pre-edge peak height and the decreasing UV-Vis
edge energy showed that the hydrated phase of VxOySBA-15 was formed immediately after exposure to
water The transformation was completed after approximately 2-3 minutes indicated by a constant pre-
edge peak height in the XANES spectra The main decrease in the UV-Vis edge energy was reached after
2 min After a longer period of time (60 min) only a small decrease (lt 01 eV) was detected compared to
the value after 2 minutes This rapid transformation during rehydration is explained by the strong
distortion of the vanadium oxide tetrahedrons formed on the SBA-15 support An average V-O distance
of 178 Aring was determined for the VxOySBA-15 samples investigated here Typical average V-O bond
lengths of bulk vanadates are shorter in the range of 170 Aring (Ca3V2O8) to 174 Aring (KVO3) Furthermore a
small Si-O-V distance (253 Aring) was determined by XAFS refinement which may explain the strong
distortion Coordination of an additional ligand (H2O) may cause a decrease in the tension present in the
distorted tetrahdral structure of dehydrated VxOySBA-15 and thus explain the rapid hydration of
dehydrated vanadium centers in VxOySBA-15
210-10
410-10
610-10
0 500 1000 1500 2000
Rel
ativ
e he
ight
of p
re e
dge
peak
a
u
Time sec
Ion Current m
e18 A
00
02
04
06
08
5475 55 5525 555
Abs
orpt
ion
[au
]
Photon Energy keV
3
4
5
6
3
45
6
210-10
410-10
610-10
0 500 1000 1500 2000
Rel
ativ
e he
ight
of p
re e
dge
peak
a
u
Time sec
Ion Current m
e18 A
210-10
410-10
610-10
0 500 1000 1500 2000
Rel
ativ
e he
ight
of p
re e
dge
peak
a
u
Time sec
Ion Current m
e18 A
00
02
04
06
08
5475 55 5525 555
Abs
orpt
ion
[au
]
Photon Energy keV
3
4
5
6
3
45
6
0 100 200 300 400 500 600
27
28
29
30
31
32
33
34
35
normalized ion current m
e 18
Eg
[eV
]
time [sec]
Eg Water
Figure 6-8 Left V K edge XANES spectra (inset) pre-edge peak height and water ion current during rehydration of dehydrated 77 wt VxOySBA-15 (298 K 16 Vol H2O) Right UV-Vis edge energy and water ion current during rehydration of dehydrated 77 wt VxOySBA-15 (298 K 13 Vol H2O)
100
628 Reversibility of hydration and dehydration processes
The reversibility of the structural transformations of hydrated and dehydrated VxOySBA-15 was
investigated in cyclic reaction tests As prepared VxOySBA-15 samples were dehydrated in a 20 O2 in
helium atmosphere (623 K for XAS 554 K for UV-Vis-DRS analysis) and subsequently rehydrated for
05-1 h at ~ 298 K using a saturated gas atmosphere (13-16 Vol H2O in He) A second cycle was
conducted after this first dehydrationrehydration cycle The second dehydration was performed at higher
temperatures (723 K for XAS 634 K for UV-Vis-DRS analysis) Figure 6-9 depicts the FT(χ(k)k3) of
77 wt VxOySBA-15 (XAFS) and UV-Vis-DR spectra of 14 wt VxOySBA-15 measured at ~ 298 K
after the respective treatment Apparently the spectra of dehydrated 77 wt and 14 wt VxOySBA-15
showed no differences when comparing the spectra of the first dehydration cycle with those of the second
dehydration cycle Hence the dehydration process is reversible for the 77 wt and 14 wt
VxOySBA 15 A more detailed discussion will be given below Comparing the results obtained for
hydrated 77 wt and 14 wt VxOySBA-15 minor deviations were observed after each rehydration
cycle As prepared 14 wt VxOySBA-15 showed the lowest intensity of the low energy absorption band
at ~ 360 nm compared to the more intense absorption band at 280 nm Thus a ldquohigher degree of
hydrationrdquo was present in hydrated 14 wt VxOySBA-15 after the first and second rehydration cycles
Furthermore this was corroborated by a decline of the UV-Vis edge energy of the hydrated VxOySBA-15
samples after each rehydration cycle (Table 6-2) A similar trend was observed in the FT(χ(k)k3) of
77 wt VxOySBA-15 The as prepared sample showed a significantly lower amplitude in the range of 2-
4 Aring According to Chapter 5 the amplitude in this range is caused by V-V interactions that are found in
the structure of hydrated 77 wt VxOySBA-15 The higher intensity in the range of 2-4 Aring after the first
rehydration cycle (~ 45 min) may indicate the formation of an increased number of V-O-V bonds
01
02
03
0 2 4 6
FT
(χ(k
)k3 )
R [Aring]
A
B
C
D
E
0
05
1
250 600 300 400 500
F(R
infin)
Wavelength [nm]
Figure 6-9 FT(χ(k)k3) of 77 wt VxOySBA-15 (left) and UV-Vis-DR spectra of 14 wt VxOySBA-15 (right) after various hydration and dehydration cycles as prepared (A) first dehydration at 623 K XAS 554 K UV-Vis-DRS 30 min (B) first rehydration 13-16 Vol 60-90 min (C) second dehydration at 723 K XAS 634 K UV-Vis-DRS 1 h (D) second rehydration 13-16 Vol 60 min (E) The line types on right side refer to the same procedure as on the left side
101
Table 6-2 UV-Vis edge energy Eg of hydrated VxOySBA-15 samples determined after various rehydration procedures Dehydration treatments as described in Figure 6-9
Eg [eV]
Sample as prepared 1 rehydration 2 rehydration
77 wt VxOy-SBA-15 274 271 267
41 wt VxOy-SBA-15 279 276 273
14 wt VxOy-SBA-15 280 279 277
629 Impact of aging on the structure of VxOySBA-15
An increasing V-V signal at 2-4 Aring in the FT(χ(k)k3) was observed in the XAFS spectra of hydrated
77 wt VxOySBA-15 measured at different times Figure 6-10 depicts the FT(χ(k)k3) of hydrated
samples measured after two weeks and after two years following preparation For comparison the
FT(χ(k)k3) of V2O5 and the rehydrated samples are also depicted Rehydration experiments were
conducted using the two week old 77 wt VxOySBA-15 The first signal (V-O tetrahedron) in the
FT(χ(k)k3) of as-prepared 77 wt VxOySBA-15 was asymmetric thus part of the dehydrated phase
was still present A least-squares XANES refinement was conducted to quantify the remaining fraction of
dehydrated phase in the spectrum of the two week old 77 wt VxOySBA-15 Spectra recorded after the
first dehydration and after the first rehydration cycle of 77 wt VxOySAB-15 were used as references
Approximately 18 of the dehydrated phase was present in the spectrum of two week old as-prepared
77 wt VxOySBA-15 A similar trend was observed for 41 wt and 14 wt VxOySBA-15 The
presence of dehydrated VxOySBA-15 two weeks after preparation suggests that hydration of freshly
calcined samples is significantly slower (weeks) than rehydration of dehydrated samples (~ 1 hour)
001
002
003
004
0 2 4 6
FT
(χ(k
)k
3 )
R [Aring]
two weeks oldfirst rehydration
2 years oldV2O5
00
025
05
075
10
545 55 555 56 565
Nor
mal
ized
Abs
orpt
ion
Photon E ngery [keV]
dehydrated VxOySBA-15
hydrated VxOySBA-15
two weeks old VxOySBA-15
Figure 6-10 Left FT(χ(k)k3) of differently hydrated 77 wt VxOySBA-15 and V2O5 Right result of the least-squares fit ( ) using the V K edge XANES spectra of dehydrated and rehydrated 77 wt VxOySBA-15 ( ) recorded after the first de-rehydration cycle (Figure 6-9 left) to the experimental XANES spectrum ( )of two week old as-prepared 77 wt VxOySBA-15
102
Figure 6-11 left shows the UV-Vis-DR spectra of one year old 77 wt VxOySBA-15 and recalcined
77 wt VxOySBA-15 On the right side of Figure 6-11 spectra of 14 wt VxOySBA-15 measured as-
prepared and one year later are depicted (Spectra of 14 wt VxOySBA-15 were normalized because the
as prepared sample was diluted with SBA-15) An increase of the absorption band at 370 nm in the
UV-Vis-DR spectra of the hydrated samples was observed for both loadings In Chapter 5 this band was
assigned to vanadium centers exhibiting a square pyramidal structure Concidering the intensity increase
in the FT(χ(k)k3) of 77 wt VxOySBA-15 at higher distances (2-4 Aring) the increase of the band at
370 nm may be caused by an increased number of ldquohydratedrdquo square pyramidal vanadium centers This
aging effect was interpreted as clustering of hydrated centers on the SBA-15 support Significant changes
of the UV-Vis edge energy in the spectra of hydrated VxOySBA-15 were not detected Thus the average
V-O-V number remained three (chains of square pyramidal centers) and the dispersion of hydrated
vanadium oxide species remained high The extension of the hydrated vanadium oxide species on
SBA-15 seems to be two-dimensional rather than three-dimensional as in the case of vanadium oxide
crystallites
The ldquogrowthrdquo of hydrated VxOy species on SBA-15 during storage raised the question whether aging of
hydrated VxOySBA-15 affected the dehydration of VxOySBA-15 Thermal treatment at 554 K (30 min)
of those differently hydrated VxOySBA-15 samples yielded UV-Vis-DR spectra that were characteristic
for dehydrated VxOySBA-15 (Figure 6-11) However in the case of an one year old 77 wt
VxOySBA-15 a broadening of the absorption band in the UV-Vis-DR spectrum was observed Such
broadening was absent in the UV-Vis-DR spectrum of one year old dehydrated 14 wt VxOySBA-15
0
5
10
15
220 600300 400 500
F(R
infin)
Wavelength [nm] 250 600300 400 500
Wavelength [nm]
F(R
infin)
Figure 6-11 UV-Vis-DR spectra of 77 wt VxOySBA-15 (left) and 14 wt VxOySBA-15 (right) as-prepared (14 wt) hydrated after calcination (77 wt) ( ) dehydrated as-prepared sample ( ) hydrated one year old sample ( ) dehydrated one year old sample ( ) dehydration parameters 20 O2 in He 554 K 30 min all spectra recorded at 298 K
103
Similar broadening effects in the absorption spectra of dehydrated VxOySBA-15 were reported by
Gruene et al [28] They assigned the UV-Vis band at 405 nm to small V2O5 clusters present on SBA-15
because characteristic bands of V2O5 were present in the Raman spectra of these samples (06-31 Vnm2
V on SBA-15) These V2O5 clusters were not detectable by XRD [28] Similar results were obtained for
77 wt VxOySBA-15 (25 Vnm2) here using in situ Raman spectroscopy The Raman spectrum of
dehydrated 77 wt VxOySBA-15 (723 K ~ 1 h) is shown in Figure 6-12 left Apart from a
characteristic Raman signal of the dehydrated VxOySBA-15 species at ~ 1040 cm-1 [2332] several other
Raman bands were detected Comparison with the Raman spectrum of a mechanical mixture of V2O5 and
SBA-15 (~ 3 wt V 298 K) showed that characteristic bands of V2O5 (284 305 407 703 and 994 cm-1)
were present in the spectrum of the one year old VxOySBA-15 sample The amount of V2O5 was
estimated according to Xie et al [34] assuming a 10 times larger cross section for V2O5 compared to the
dispersed tetrahedral species Comparing the intensities of the Raman signal at 995 and 1042 cm-1 shows
that approximately 3 V2O5 have been formed by dehydration of aged 77 wt VxOySBA-15
To investigate the impact of a recalcination on ldquoagedrdquo 77 wt VxOySBA-15 thermal treatment for 12 h
at 823 K in a muffle furnace was conducted After recalcination and dehydration of 77 wt
VxOySBA-15 characteristic V2O5 bands were absent in the Raman spectrum Thus formation of V2O5
clusters on the SBA-15 support during dehydration seems to be a reversible process To estimate the
fraction of V2O5 in the UV-Vis-DR spectra a least-squares refinement using three Gaussian curves was
performed Two Gaussian functions were introduced for the dehydrated phase according to the
calculation of Avdeev et al [136]The Gaussian curves were allowed to vary between 270 and 290 nm
and between 300 and 330 nm A third Gaussian function in the range of 390-430 nm was introduced to
account for V2O5
200 400 600 800 1000 1200
Nor
mal
ized
Inte
nsity
Raman shift [cm-1]
A
B
C
D
5
10
15
250 350 450 550
F(R
infin)
Wavelength [nm]
V2O5
Figure 6-12 left Raman spectra of (A) a 3 wt V V2O5SBA-15 mixture (1064 nm 100 mW) and (B) SBA-15 and in situ spectra (514 nm 6 mW) during dehydration of (C) one year old 77 wt VxOySBA-15 at 723 K (20 O2 in N2) and (D) a 77 wt VxOySBA-15 sample that is dehydrated at 623 K (20 O2 in N2) after recalcination at 823 K for 12 h in a muffle furnace (spectra C-D 514 nm 6 mW) right least square fit ( ) of three Gaussian functions ( ) to the UV-Vis-DR spectrum ( ) of dehydrated one year old 77 wt VxOySBA-15 (554 K 30 min 20 O2 in He)
104
Peak heights were allowed to vary between 0 and 20 Kubelka Munk units and the full band width was
allowed to vary independently for each Gaussian function The resulting refinement yielded a good
agreement between experimental and refined curves as depicted in Figure 6-12 right For the one year
old sample approximately 10 of the area of the UV-Vis-DR signal was caused by V2O5 In dehydrated
77 wt VxOySBA-15 which was recalcined this fraction was reduced to below 1 (Figure 6-11)
However after storage of the recalcined sample for several days the fraction of V2O5 increased again
After 7 days a fraction of 6-7 was determined The real concentrations will be lower because a strong
decrease of intensity was measured below 300 nm in the UV-Vis-DR spectra obtained with the Praying
MantisTM cell Moreover the amount of V2O5 determined from the Raman spectra was lower
In XAFS spectra no significant changes with storage time were observed for dehydrated 77 wt
VxOySBA-15 The FT(χ(k)k3) exhibited a small decrease of the first V-O signal in the range of 16-
20 Aring The disorder parameter of the V-O distance at 178 Aring increased from 00071 Aring2 (Table 6-3) to
00079 Aring2 in two year old dehydrated VxOySBA-15 (Table 6-3) After a treatment of 8 h at 770 K the
amplitude in the FT(χ(k)k3) of two year old dehydrated 77 wt VxOySBA-15 increased The disorder
parameter of the V-O distance at 178 Aring decreased from 00079 Aring2 to 00063 Aring2 A similar trend was
observed for V-V and V-Si contributions The overall increase of the disorder parameters of two year old
77 wt VxOySBA-15 showed that the structure of dehydrated vanadium species was less ordered after
dehydration However all experimental FT(χ(k)k3) of dehydrated 77 wt VxOySBA-15 were
simulated successfully using the dehydrated VxOy model structure (ordered arrangement of [V2O7] Table
6-3) Hence the major vanadium oxide phase in dehydrated 77 wt VxOySBA-15 was still the dimeric
tetrahedral species For the 41 wt VxOySBA-15 a similar aging effect was observed in the UV-Vis-DR
spectra As a consequence of the aging effect discussed above the presence of V2O5 was never fully
excluded for dehydrated 41 wt and 77 wt VxOySBA-15 during further experiments
Table 6-3 Experimental distances (R) and XAFS disorder parameters (σ2) for different type and number (N) of atoms at distance R from the absorbing V atom in a model system assuming an ordered arrangement of [V2O7] units (Chapter 5) Parameters were obtained from the refinement of this model structure to the experimental V K edge XAFS FT(χ(k)k3) of dehydrated 77 wt VxOySBA-15 at various stages of aging (k range from 27-105 Aring-1 R range 083-362 Aring Nind = 16 E0 = 0 eV in all cases (subscript c indicates parameters that were correlated in the refinement subscript f indicates parameters that were fixed in the refinement) Dehydration was conducted in 20 O2 in He
Type (N)
2 weeks old 2 years old recalcined
623 K 30 min 623 K 30 min 770 K 8 h
R [Aring] σ2 [Aring
2] R [Aring] σ
2 [Aring
2] R [Aring] σ
2 [Aring
2]
V-O (4) 178 00071 178 00079 178 00063
V-O (1) 290 00012f 289 00012f 289 00012f V-V (1) 329 00094 329 00116 330 00107
V-V (1) 361 00094c 360 00116c 360 00107c
V-Si (1) 255 00116 254 00130 253 00112
Residual 66 38 59
105
6210 Dehydration in water saturated atmospheres
Because water is a common reactant in propene oxidation its influence on the dehydration was
investigated At moderate temperatures (298 K) and in humid atmospheres the hydrated structure of
VxOySBA-15 was the major vanadium oxide phase present on the support A comparable treatment as
used for dehydration (623 K 20 O2 in He) was employed to investigate the structure that was present at
elevated temperatures in humid atmospheres In addition the helium carrier gas was saturated with water
to obtain a humidity of 13-16 Vol water in the gas phase The UV-Vis-DRS and XAS measurements
were performed after the rehydrationdehydration cycles reported above After the second rehydration the
samples were heated in a water saturated oxygen atmosphere to 623 K (XAS) or 554 K (UV-Vis-DRS)
The in situ spectra recorded at the respective temperatures are shown in Figure 6-13
The FT(χ(k)k3) of 77 wt VxOySBA-15 obtained during treatment with water vapor and after
switching the water off at 623 K is depicted in Figure 6-13 (left) Furthermore the FT(χ(k)k3) measured
at 298 K after thermal treatment is shown together with the FT(χ(k)k3) recorded at 298 K after the first
dehydration in dry atmosphere Apparently no significant differences were observed XAFS refinements
using the ldquodimeric V2O7rdquo model structure yielded good agreement between the experimental and refined
theoretical FT(χ(k)k3) The resulting parameters are listed in Table 6-4 The results obtained during the
thermal treatment at 623 K in the presence of water (3rd dehydration cycle) and the results obtained after
switching the water off at 623 K were similar Further no significant differences were observed after
cooling the sample down The σ2 of the V-O contribution at 178 Aring was slightly enhanced which was
assigned to thermal disorder effects
0 10 20 30 40 50 60 70 80 90 100 110250
300
350
400
450
009 018 028 037 046 055 065 074 083 092 102 111 120
Wav
elen
gth
[nm
]
300
350
400
450
500
550
600
Tem
perature [K]
Norm
alized Ion Current m
e 18
05
10
300 400 500
F(R
infin)
λ [nm]
F(Rinfin)
Time [min]
005
01
0 1 2 3 4 5
R [Aring]
FT
(χ(k
)k3 )
A
B
C
D
Figure 6-13 Left V K edge FT(χ(k)k3) of 77 wt VxOySBA-15 after different dehydration procedures 623 K 10 O216 Vol H2OHe (A) 623 K 10 O2He (B) 298 K 10 O2He (C) and 1st dehydration cycle (623 K 20 O2He) 298 K (D) Right in situ UV-Vis-DR spectra of the 14 wt VxOySBA-15 sample during dehydration together with water ion current me 18 (554 K 4 Kmin13 Vol H2O 20 O2 in He) The inset shows the 2D spectra recorded at 86 min and 113 min
106
Table 6-4 Experimental distances and XAFS disorder parameters (σ2) for different type and number (N) of atoms at distance R from the absorbing V atom in a model system assuming an ordered arrangement of [V2O7] units (Chapter 5) Parameters were obtained from the refinement of this model structure to the experimental V K edge XAFS FT(χ(k)k3) of dehydrated 77 wt VxOySBA-15 (k range from 27-105 Aring-1 R range 083-362 Aring Nind = 16 E0 = 0 eV in all cases (subscript c indicates parameters that were correlated in the refinement subscript f indicates parameters that were fixed in the refinement) Dehydration in the 1st and 2nd cycle was conducted in 20 O2 in He and in 10 O2 (and 16 H2O) in He in the 3rd dehydration cycle
Type (N)
1st dehydration cycle 2nd dehydration cycle 3nd dehydration cycle
298K (30min 623K) 298K (60min 723K) 623K (H2O) 623K (H2O off) 298K (H2O off)
R [Aring] σ2 [Aring
2] R [Aring] σ
2 [Aring
2] R [Aring] σ
2 [Aring
2] R [Aring] σ
2 [Aring
2] R [Aring] σ
2 [Aring
2]
V-O (4) 178 00071 178 00066 179 00079 178 00079 178 00070
V-O (1) 290 00012f 289 00012f 288 00012f 288 00012f 288 00012f V-V (1) 329 00094 330 00095 331 00123 327 00131 330 00129
V-V (1) 361 00094c 361 00095c 361f 00123c 358f 00131c 361 00129c
V-Si (1) 255 00116 253 00114 255 00119 253 00111 253 00133
Residual 66 51 53 78 53
Hence the dehydrated VxOySBA-15 phase was present on the SBA-15 support independent of water in
the gas phase at elevated temperatures In situ XANES spectra and PCA results were similar to those
obtained in the first dehydration cycle in Figure 6-3 (data not shown) In contrast to the XANES spectra
the disorder parameter of the V-V (33 and 36 Aring) and V-Si (25 Aring) contributions in the FT(χ(k)k3)
increased slightly during the dehydration in the presence of water Conversely the disorder parameter of
the V-O contribution at 178 Aring remained constant (Table 6-4)
Figure 6-13 (right) depicts the evolution of the UV-Vis-DR spectra during the dehydration of 14 wt
VxOySBA-15 together with the evolution of the MS ion current of water (me 18) Water addition to the
gas phase was stopped 35 min after reaching the maximum temperature of 554 K (total time 100 min)
Compared to the spectra recorded during dehydration in a dry atmosphere shown in Figure 6-2 left no
distinct changes were observed during thermal treatment of hydrated 14 wt VxOySBA-15 The main
transformation between the hydrated and the dehydrated VxOySBA-15 state was completed between 400
and 440 K It was accompanied by an increased formation of water At elevated temperatures the UV-
Vis-DR spectra resembled those of dehydrated VxOySBA-15 The inset in Figure 6-13 right depicts the
spectra recorded at 554 K in a water saturated atmosphere at 86 min (13 Vol H2O) and in a dry
atmosphere at 113 min After switching the water off only a small blue shift of 3 nm was observed
Compared to the UV-Vis edge energies obtained in the previous dehydration cycles only small changes
were observed for all VxOySBA-15 samples (Table 6-5) The UV-Vis edge energy of dehydrated
41 wt and 14 wt VxOySBA-15 increased after each rehydrationdehydration cycle This may be
caused by a decreasing distortion of the [VO4] tetrahedron or a decreasing V-O-V number (2 to 1 dimeric
to isolated VO tetrahedrons) These two effects cannot be distinguished sufficiently as discussed in
Chapter 5 Comparing UV-Vis-DR spectra of dehydrated VxOySBA-15 recorded at 298 K after several
dehydrationrehydration cycles small changes were observed for the various vanadium loadings
107
Table 6-5 UV-Vis edge energies Eg determined from the UV-Vis-DR spectra recorded at 298 K after different dehydration cycles (details given in Figure 6-14) The samples were diluted with SBA-15 (13 (SBA-15 77 wt VxOySBA-15) and 11 (SBA-15 14 wt or 41 wt VxOySBA-15))
Eg [eV]
Sample 623 K 05 h 20 O2 He
723 K 1 h 20 O2 He
723 K 1 h 20 O2 He 15 Vol H2O
77 wt VxOy-SBA-15 337 340 341
41 wt VxOy-SBA-15 344 345 352
14 w VxOy-SBA-15 360 362 368
Similar spectra were recorded for dehydrated 14 wt VxOySBA-15 after dehydration at 554 K and
634 K After dehydration in a humid atmosphere at 554 K the UV-Vis-DR spectrum was blue shifted by
several nm The UV-Vis edge energy increased from 360 eV to 368 eV and the absorption maximum
shifted from 280 nm to 265 nm This strong blue shift to 265 nm suggests an increased dispersion in the
presence of water during the dehydration process Thus more isolated vanadium oxide centers may have
formed after this treatment Similar blue shifted UV-Vis-DR spectra were recorded for higher loaded
dehydrated VxOySBA-15 A blue shift from 305 nm to 290 nm was detected for 41 wt dehydrated
VxOySBA-15 and from 308 nm to 296 nm for 77 wt VxOySBA-15 (Figure 6-14) According to the
calculation by Avdeev et al [136] the absorption band at 290 nm indicated that the dimeric tetrahedral
VxOySBA-15 species was still present on the support as discussed in Chapter 5 This was also
corroborated by the results obtained from XAFS refinement of the FT(χ(k)k3) of 77 wt dehydrated
VxOySBA-15 However for dehydrated 77 wt VxOySBA-15 a significant increase in absorption
intensity at 405 nm was detected during the third dehydration cycle in a humid atmosphere Hence V2O5
clusters may have formed during this process
0
2
05
1
15
250 600300 400 500
F(R
infin)
Wavelength [nm]
77 wt VxOySBA-15
0
4
1
2
3
250 600300 400 500
F(R
infin)
Wavelength [nm]
41 wt VxOySBA-15
0
12
05
1
250 600300 400 500
F(R
infin)
Wavelength [nm]
14 wt VxOySBA-15
Figure 6-14 UV-Vis-DR spectra recorded at 298 K after different dehydration cycles 1st dehydration at 554 K for 30 min ( ) 2nd dehydration at 634 K for 1 h ( ) 3nd dehydration at 554 K for 30 min (13 Vol H2O) and 15 min (ldquodryrdquo) ( ) The samples were diluted with SBA-15 (13 (SBA-15 77 wt VxOySBA-15) and 11 (SBA-15 14 or 41 wt VxOySBA-15))
108
63 Concluding remarks on the hydration and dehydration of VxOySBA-15
In situ UV-Vis-DRS and XAFS measurements showed that VxOySBA-15 samples changed their
structure dynamically as a function of temperature water content in the gas phase and vanadium loading
Moreover changes in the silanol distribution of the SiO2 support played a pronounced role The scheme
depicted in Figure 6-15 is introduced to summarize and discuss the results presented above
OH
[O3Si][SiO3]
OO
VO
V
OHO
OH
OH
[O3Si][O3Si]
O
OH V
O
OH
V2O5n H2O V2O5mltn H2O or micro-V2O5
hydration 298 K H2O fast
dehydration
550-723 K 05-1 h
dehydration vs crystallization
550-723 K 05-1 h
hydration 298 K H2O
aging
OH
[O3Si][SiO3]
OO
VO
V
OO
OH
calcination
770-843 K 8-12 h
low vanadium loadings lt 05 Vnm2
high and medium V loadings 05-25 Vnm2
hydration 298 K H2O slow
hydration 298 K H2O fast
OH
[O3Si]
OH
[O3Si]
OH
[O3Si]
[SiO4]
[SiO4]
hydrated state dehydrated state
OH
[O3Si]
H2O H2OH2O
[SiO2]
[O3Si]
OH
OV
O
HO
V
O
O
V
O
H2O
OH OH
O
V
O
O
V
OOH
O[SiO3]
OH2
H2OH2O
H2O H2OH2O
OH
[O3Si]
[SiO3]
[O3Si]
OO
VHO
V
OOH
OH
high and medium V loadings 05-25 Vnm2
high and medium V loadings 05-25 Vnm2
Figure 6-15 Schematic drawing of assumed dynamic structural transformations of supported vanadium oxide phase on SBA-15 during hydration and dehydration
631 Coordination of hydrated VxOySBA-15
Under ambient conditions at 298 K and in a humid atmosphere the hydrated state of VxOySBA-15 was
observed A vanadium oxide structure with a square pyramidal coordination of the vanadium centers
similar to the V2O5 and V2O62- vanadate structures was determined from XAFS refinements and the UV-
Vis edge energy position (Chapter 5) However no direct evidence about the kind of oxygen groups
around the absorbing vanadium centers could be derived in this work Four types of oxygen containing
groups seemed possible according to the literature [35] and the results discussed above (i) V-OH (ii)
V-O-Si (iii) V-O-V and (iv) VOH2 Possible configurations are shown in Figure 6-15 First
measurements reported by Schraml-Marth [27] and others [2640114] indicated that V-OH stretching
modes (~ 3660 cm-1) were present in the FT-IR (DRIFT) spectra of hydrated VxOySiO2 samples Second 29Si MAS-NMR measurements showed that fractions of the silanol type Si centers present on SBA-15
109
may have formed bonds (V-O-Si) to the grafted hydrated vanadium oxide centers The third configuration
(iii) involves direct linkages of V-O-V Such V-V distances were determined from the increased signal at
2-4 Aring in the FT(χ(k)k3) of the hydrated VxOySBA-15 samples Furthermore the average V-O-V number
as determined from the UV-Vis edge energy was 3 (connected square pyramidal double chains) Hence
V-O-V bonds between the vanadium oxide centers may be present in the hydrated state As a last possible
configuration (iv) a coordination of water seemed likely (VOH2) The maximum temperature of water
formation was determined from TG experiments to be ~ 323-343 K This is quite low and suggests
weakly bonded water in the structure of hydrated VxOySBA-15 In addition to coordinated water layers
of physically adsorbed water are depicted in Figure 6-15 because a significant mass loss was observed at
303 K in dry atmospheres
632 Impact of coordinated water on hydrated VxOySBA-15
That water molecules play a key role in the coordination of the hydrated vanadium oxide structure was
deduced from in situ UV-Vis-DRS and XAFS measurements The main structural transformation of
hydrated VxOySBA-15 into dehydrated VxOySBA-15 was observed to be independent of the vanadium
loading in a temperature range between 298 K and 440 K It was accompanied by an increased formation
of water Spectra recorded at higher temperatures resembled those of the dehydrated state of
VxOySBA-15 Therefore the majority of water is coordinated in the structure of hydrated VxOySBA-15
The apparent activation energy for water desorption (ED) in this temperature range was determined from
TG experiments to be 70-83 kJmol for VxOySBA-15 (Table 6-1) This was lower than for the pure
SBA-15 support (~ 110 kJmol) and higher than for the Kieselgel 60 silica reference (~ 40 kJmol) On
the one hand Vansant et al [104] explained the low value for Kieselgel 60 by an evaporation process of
physically adsorbed water from the SiO2 surface On the other hand the rather high apparent activation
energy for water desorption determined for pure SBA-15 was explained by an increased number of
micropores of the untreated SBA-15 samples However relating the mass loss observed in this
temperature range to the same surface area it was shown that the detected thus adsorbed water content
on VxOySBA-15 samples decreased with the decreasing vanadium loading Therefore ED in the range of
70-83 kJmol was ascribed to water which was released from the hydrated vanadium oxide structure The
increase in ED with increasing vanadium loading was explained by a coordinative interaction of water
with the vanadium centers on the SBA-15 support Furthermore the apparent activation energy of water
desorption of hydrated VxOySBA-15 increased with increasing time of storage in humid atmosphere
Therefore the coordinative interaction of water with the vanadium centers in hydrated VxOySBA-15 may
increase with ldquosample agerdquo For ldquoagedrdquo hydrated 77 wt VxOySBA-15 more V-V interactions were
detectable in the FT(χ(k)k 3) Moreover the similarity of the FT(χ(k)k3) of hydrated VxOySBA-15 with
that of V2O5 increased A V2O5middot12 H2O gel like structure was proposed by some authors [202334] to be
present in the hydrated state of VxOySiO2 because the Raman spectra of hydrated VxOySiO2 samples
resembled that of V2O5middotnH2O gels [148] Thus the increasing similarity with V2O5 indicates that the
110
vanadium oxide structure of ldquoagedrdquo hydrated 77 wt VxOySBA-15 may be similar to that of V2O5middotnH2O
gels
In summary water is important for the formation and coordination of the vanadium oxide structure of
hydrated VxOySBA-15 The fact that water is rather weakly bond to the vanadium centers causes a low
thermal stability and dehydration of hydrated VxOySBA-15 below temperatures of 440 K
633 Formation of dehydrated VxOySBA-15
At elevated temperatures between 440 and 550 K V K edge XANES spectra of VxOySBA-15 resembled
that of dehydrated VxOySBA-15 (Figure 6-2) A principal component analysis showed that the
transformation of hydrated to dehydrated VxOySBA-15 proceeded directly and that no intermediate
structures were formed Hence only a rearrangement process of the dehydrated vanadium oxide species
on the SBA-15 support occurred at temperatures higher than 440 K The increasing pre-egde peak height
in the V K edge XANES spectra indicate a decreasing distortion of the tetrahedral vanadium oxide
species At temperatures above 550 K only minor changes were observed in the XAFS and UV-Vis-DR
spectra of VxOySBA-15 samples dehydrated in the temperature range from 554 to 723 K The
FT(χ(k)k3) of VxOySBA-15 dehydrated at 723 K showed a slightly decreased disorder parameter σ2
(00066 Aring2) of the first V-O coordination sphere than after dehydration at 623 K (00070 Aring2) This is
explained by a narrower distance distribution which may be a consequence of a slightly enhanced
structural order of the dimeric tetrahedrons on the SBA-15 support (Table 6-4) In the gas phase only a
minor water formation was observed in the temperature range of 440-550 K The observed water content
may be explained by loss of water due to dehydration of V-OH species Schraml-Marth et al [40]
reported a decrease of the V-OH band (~ 3660 cm-1) in DRIFT spectra of VxOySBA-15 samples after
dehydration (573 K) of a rehydrated sample which matches this interpretation In addition to the
dehydration of the vanadium oxide phase a dehydroxylation of the silica support seems possible
[104147] However this interpretation is not preferred because no significant changes in the number of
silanol groups were observed in the 29Si MAS NMR spectra of 77 wt VxOySBA-15 Thus a
dehydration of the vanadium oxide species (V-OH) during the formation of the dehydrated vanadium
oxide centers was assumed in the temperature range of 440-550 K Some authors reported that V-OH
interactions are detectable by IR measurements for VxOySiO2 samples treated at 853 K (12 h O2) [141]
Therefore some of the dehydrated vanadium oxide species may have remained coordinated by hydroxyl
groups (V-OH) above 550 K (Figure 6-15)
Apparently the dehydrated state corresponds to the stable vanadium oxide state of VxOySBA-15 at
elevated temperatures higher than 550 K Thus 550 K will be sufficient as pretreatment temperature to
obtain dehydrated VxOySBA-15 samples
111
634 Formation of V2O5 crystallites versus dispersion during dehydration
Rehydrated VxOySBA-15 could be dehydrated again to the same dimeric tetrahedral structure obtained
after the first dehydration procedure Similar observations were reported by Morey et al and Luan et al
[35145] Conversely Xie et al [34] observed V2O5 formation after repeated hydrationdehydration
cycles They explained this ldquogradual transformationrdquo [34] of the hydrated state into ldquoV2O5rdquo crystals by
the formation of V2O5middotnH2O gels that transform into V2O5 during dehydration (for samples hydrated
longer than 10 min using 3 Vol H2O 298 K) Moreover Xie et al [34] discussed the reversible
hydration of V2O5 crystals formed into V2O5middotnH2O gels as long as these V2O5 crystallites are small
enough so that water can ldquointercalaterdquo into them [34] Lager V2O5 crystals that were present already after
calcination of higher loaded samples were not hydrated [34] The observation of V2O5 after several
hydration and dehydration cycles matches the V2O5 formation (denoted as micro-V2O5 in Figure 6-15) in
77 wt VxOySBA-15 which was dehydrated in water saturated atmospheres or after longer times of
storage Hence dehydration of ldquoagedrdquo 77 wt VxOySBA-15 results in the formation of V2O5 Raman
bands similar to those detected for V2O5 were reported by Abello et al [148] for V2O5middot03H2O gels
Therefore it seems likely that V2O5middotnH2O gels did not transform completely into V2O5 and only a lower
amount of water was intercalated into the structure (denoted as V2O5middotm lt n H2O gels) as depicted in
Figure 6-15
However recalcination of ldquoagedrdquo 77 wt VxOySBA-15 prior to dehydration resulted in an apparent
redispersion of V2O5 (Figure 6-12) into dimeric tetrahedral species Such a redisperion of large V2O5
crystallites seems not very likely considering the well accepted assumption in literature that spreading of
crystalline V2O5 on SiO2 supports is not possible [149 150] Given the low Tammann temperature of
V2O5 of 482 K [150] V2O5 or the vanadium oxide phase in general may be mobile on the SiO2 support
The formation of V2O5 may be explained by the low amount of reactive silanol groups on the SiO2
surface that would anchor the vanadium oxide species to the support Vanadium oxide centers that were
not linked to the SiO2 support will show sintering (V2O5 formation) This was shown by Van Der Voort et
al [151] They prepared 28 wt VxOySiO2 samples via impregnation of VO(acac)2 on Kieselgel 60
calcined at 473 K and at 973 K On samples pretreated at 973 K large amounts of V2O5 were detected
with Raman spectroscopy Van Der Voort et al [151] explained this V2O5 formation by the decreased
number of silanols on the support that induce the dispersion of the vanadium oxide They detected only a
few isolated silanol groups left on the support calcined at 973 K This explains V2O5 formation on
77 wt VxOySBA-15 but not the redispersion of V2O5 formed during the dehydration of aged 77 wt
VxOySBA-15 Following the mechanism discussed above Si-OH centers have to be present on the
support that react with the ldquomobilerdquo vanadium oxide and thus cause redispersion as it was observed
during recalcination A temperature of 843 K and a holding time of 12 h were chosen for recalcination It
is known from the 29Si NMR results that in the hydrated state and after dehydration at 653 K
approximatly 15 of the Si-OH centers were left on 77 wt VxOySBA-15 After calcination of 77 wt
VxOySBA-15 at 843 K no Si-OH signal was detected in the NMR spectrum Thus a reaction of the
vanadium centers with the SBA-15 support occurred The temperature of 843 K used for recalcination is
112
in the range where isolated Si-OH groups start to dehydroxylate into siloxane groups [147] Hence
instead of dehydroxylation of isolated silanol groups into siloxane groups a reaction of these isolated
silanol centers with the vanadium oxide may take place resulting in a redispersion This formation of
more V-O-Si bonds with the support after calcination was considered by the depiction of a second V-O-Si
bond of the dimeric tetrahedral unit in Figure 6-15
Apparently the presence of at least one V-O-Si bond per vanadium center or dimeric unit seems to be a
prerequisite for the formation of the dehydrated tetrahedral vanadium species If the amount of vanadium
centers exceeds the number of Si-OH groups that are sterically suitable to form V-O-Si bonds then the
formation of V2O5 during dehydration seems likely In this case a redispersion of hydrated to dehydrated
VxOySBA-15 is not completely reversible
635 Number of V-O-Si bonds ndash Is a O=V[O-Si]3 species possible
The mechanism discussed above explained the dispersion process of vanadium oxide species on SBA-15
To form the dehydrated state of VxOySBA-15 the dispersed vanadium oxides species have to form at
least one bond (Si-O-V) with the SiO2 support Considering the vanadium density of 25 Vnm2 for
77 wt VxOySBA-15 a linkage of the dispersed species via 3 V-O-Si bonds as claimed by Molinari and
Wachs [39] seemed not very likely Three bonds would be present in an isolated [VO4] tetrahedron To
link this monovanadate to the support three Si-OH centers would be required Assuming a V density of
25 Vnm2 a Si-OH density of 75 OHnm2 would be required for a full dispersion However fully
hydrated silica exhibits a silanol density of only 4-5 OHnm2 [147] Moreover Van der Voort et al [151]
showed that a small fraction of silanol groups was detected even on a VxOySiO2 sample where V2O5
formed Thus a O=V[O-Si]3 species seems not very likely For higher loaded dehydrated VxOySBA-15
samples a condensation of the adjacent tetrahedrons to dimeric species that are linked to the silica via one
or two Si-O-V bonds is assumed This suggestion is corroborated by the detection of dimeric [V2O7] units
with UV-Vis-DRS and XAS Nevertheless the high UV-Vis edge energies determined for 14 wt
VxOySBA-15 (gt 36 eV) indicated that isolated species (VO4) may have formed This seems possible
considering the low vanadium loading of 14 wt VxOySBA-15 (03 Vnm2) However a O=V[O-Si]3
species as proposed by Molinari and Wachs [39] seemed not likely because not all sterically suitable
Si-OH groups may be available to form three V-O-Si bonds Therefore a coordination by the Si-OH
groups of the SBA-15 support is suggested (Figure 6-15) The majority of the V-O-Si bonds formed may
be conserved during hydration of the vanadium oxide species This explains the unchanged number of
Si-OH centers in the hydrated and dehydrated state of VxOySBA-15 detected in the NMR measurements
(Figure 6-7)
636 Effect of water on the dehydration process
As shown in Figure 6-13 the dehydration process was observed even when water was present in the gas
phase Apparently water coordinated to the hydrated structure of VxOySBA-15 was only weakly bound
113
to the vanadium centers In contrast to dehydration in ldquodryrdquo atmospheres the formation of V2O5 was
detected for 77 wt VxOySBA-15 The presence of water may disturb the dehydrationdispersion
process Water may enhance the mobility of vanadium oxide centers on the support and thus accelerate
the sintering process
Moreover a small blue shift of the absorption band was observed for all samples This shift can be
interpreted by different assumptions (i) reduced V4+ centers which exhibit CT absorption bands at lower
wavelengths (ii) stronger distorted VO tetrahedrons (iii) changed oxygen groups (V-O-Si harr V-OH )
and (iv) changed connectivity (dimeric rarr isolated vanadium oxides centers) Assumption (i) seems
unlikely considering the high oxygen content in the gas phase (20 O2) and the fact that no red shift
(ldquoreoxidationrdquo) was detected after switching the water off Assumption (ii) seems not likely because the
average bond length remained constant during the 3rd dehydration cycle (Table 6-4) Referring to
assumption (iii) that the oxygen groups around the vanadium centers changed would indicate that V-OH
groups changed into (V-O-Si) groups In this case O is a stronger ligand than OH A similar behavior
was calculated by Atanasov et al for Cr(IV) Mn(V) and Fe(VI) oxo and hydroxo clusters [152] The
increasing number of V-O-Si bonds suggests that water from the gas phase causes a hydrolysis of the
V-OH bond This assumption was not confirmed by an experimental measurement The last assumption
(vi) that some of the dimeric [V2O7] units transformed into [VO4] units suggests that the V-O-V bond of
the dimeric vanadium species was opened by water in the gas phase This may be possible but seemed not
likely because the low loaded 14 wt sample already consisted of a considerable amount of isolated
vanadium oxide centers and also showed a blue shift of the absorption bands In conclusion the effect of
water on the dehydrated structure remained somewhat ambiguous Here assumption (iii) was preferred
V-OH groups transferred into V-O-Si groups However the dehydration process of VxOySBA-15 in
humid atmospheres did not change significantly compared to the dehydration process in dry atmospheres
The majority of the vanadium centers remained as dimeric tetrahedral species on SBA-15 which was
inferred from the successful XAFS refinements of 77 wt VxOySBA-15 (Table 6-4)
114
64 Summary
In situ UV-Vis-DRS XAFS and Raman measurements were conducted to investigate the evolution of the
vanadium oxide structure and the gas phase during thermal treatment of VxOySBA-15 catalysts in 20
O2 in He Furthermore the effect of water vapor on the VxOySBA-15 structure under ambient conditions
and during thermal treatment was determined
In situ XAFS measurements showed that the hydrated VxOySBA-15 structure transformed directly into
the dehydrated structure during thermal treatment in 20 O2 No intermediate vanadium oxide phase was
detected Water was released from the hydrated VxOySBA-15 structure during the dehydration process
In the temperature range between 298 K and 440 K this water loss was accompanied by the
transformation from a square pyramidal to a tetrahedral coordination of the vanadium centers Only minor
amounts of water were detected for elevated temperatures (440-550 K) A rearrangement and ordering
process of the dimeric tetrahedral vanadium oxide species is suggested in this temperature range For
temperatures higher than 550 K only minor changes were observed in the dehydrated VxOySBA-15
structure (550-723 K) 29Si MAS NMR measurements indicated that the dehydrated and hydrated
vanadium oxide centers are partially linked via Si-O-V bonds to the SBA-15 support
Exposure to water under ambient (humid) conditions resulted in a hydration of the dehydrated
VxOySBA-15 phase within minutes After subsequent dehydration of the rehydrated VxOySBA-15 phase
the dehydrated VxOySBA-15 phase was obtained again These rehydrationdehydration cycles showed
that the observed structural transformations of VxOySBA-15 were reversible and independent of the
amount of vanadium on SBA-15 However ldquoaging effectsrdquo were observed for 77 wt VxOySBA-15 A
clustering of square pyramidal hydrated centers comparable to the formation of V2O5middotnH2O gels was
assumed Dehydration of ldquoagedrdquo 77 wt VxOySBA-15 resulted in the formation of V2O5 crystallites
These crystallites were redispersed successfully under calcination conditions at higher temperatures
(843 K 12 h) For low loaded 14 wt VxOySBA-15 no sample aging was observed in the UV-Vis-DR
spectra
In general formation of the dehydrated phase was independent of the presence of water in the reaction
atmosphere and resulted in the formation of an ordered [V2O7] structure Small amounts of V2O5 formed
on 77 wt VxOySBA-15 Slight changes in the dehydrated VxOySBA-15 species were detected for all
VxOySBA-15 samples after the addition of water during the dehydration process These rearrangements
indicated a transformation of V-OHSi-OH into V-O-Si coordination sites Because water is commonly
present in oxidation reactions like propene oxidation these changes may play a role for the catalytic
performance of VxOySBA-15
115
7 Structural evolution and reactivity of VxOySBA-15
catalysts under propene oxidizing conditions
71 Introduction
The VxOySBA-15 model system was introduced to obtain detailed knowledge on the role of vanadium
sites during propene oxidation Similar investigations were reported for other supported metal oxides
model systems eg MoxOySiO2 [103153] However reaction product selectivities reported for
MoxOySiO2 model catalysts differ from those reported for VxOySiO2 catalysts (Table 7-1) This suggests
different structure-activity correlations during propene oxidation of vanadium in mixed metal oxide
catalysts Structure-reactivity correlations of vanadium oxide catalysts on different supports has been a
controversial issue during the past decades eg for the oxidative dehydrogenation of propane
[2829144154155156157] or for the oxidation of methanol or methane to formaldehyde
[202223141] However only few reports discuss the role of vanadium oxide supported on SiO2 in
selective oxidation of propene to acrolein (Table 7-1) Recently Zhao et al [16158] investigated the
catalytic performance in selective propene oxidation and the structure of vanadium oxide phases
supported on SiO2 Al2O3 Nb2O5 TiO2 and ZrO2 in the range of 573-623 K Compared to vanadium
oxide phases on other support oxides they reported a rather poor activity of the VxOySiO2 catalysts for
the propene oxidation to acrolein Furthermore they concluded that different reaction kinetics and a lower
number of active ldquoVO4rdquo sites [16] were responsible for this poor catalytic activity The kind of reaction
products that are formed during the oxidation of propene over VxOySiO2 catalysts depend on the reaction
conditions applied (Table 7-1) In the presence of high water content in the gas phase increased amounts
of acetone and acetic acid were reported [15159] If no water was added to the initial reaction mixture
high selectivities towards acetaldehyde acetone and acrolein were described [16160]
Table 7-1 Propene conversion and selectivity for propene oxidation over vanadium and molybdenum oxides supported on SiO2
Catalysts Condition ratio
O2propene Conversion C3H6 []
Selectivity towards main products Ref
5 wt V2O5SiO2 473K ~ 12 19 29 acetaldehyde 73 propionaldehyde 268 acrolein
[160]
058 Vnm2 V2O5SiO2
523 K 20 steam 3 18 435 acetone 18 acetic acid 183 COx
[15]
1-8 wt V2O5SiO2
(02-27 Vnm2) 623 K 8-1 02
48-51 acrolein 47-49 acetone 6 acrylic acid
[16158]
10 wt V2O5SiO2
(117 Vnm2) 463 K 25 water
vapor 2 35 95 acetone [159]
58 wt MoO3SiO2 (08 Vnm2)
673 K 23 3 53 propionaldehyde 10 acrolein 8 acetaldehyde 29 COx
[103]
6 wt MoO3SiO2 673 K 1 29 53 propionaldehyde 18 acrolein 21 acetaldehyde 8 COx
[153]
116
Here in situ spectroscopic investigations of vanadium oxides supported on SBA-15 were conducted to
deduce reliable structure-reactivity correlations of VxOySBA-15 under propene oxidizing reaction
conditions These measurements were combined with reaction tests in the in situ cells and a laboratory
fixed bed reactor The dehydrated VxOySBA-15 structure discussed in the previous chapters was used as
initial state for structural characterization of VxOySBA-15 model catalysts under propene oxidizing
conditions In accordance with previous investigations on MoxOySBA-15 [8] and PVMo11O40SBA-15
model catalysts [10] similar reaction conditions were employed (573 K and 723 K 1-75 propene and
1-10 O2 in He)
117
72 Results and discussion
721 Local structure of VxOySBA-15 under propene oxidation
Figure 7-1 depicts the room temperature V K edge XANES the FT(χ(k)k3) and the UV-Vis-DR spectra
of the dehydrated VxOySBA-15 samples (554-623 K 1h 20 O2 in He) before and after temperature
programmed reaction in propene and oxygen (676-723 K 1 h 5 O2 and 5 propene in He ) The V K
edge XANES spectra after reaction were similar to the spectra of the initial dehydrated state of
VxOySBA-15 No changes in the characteristic XANES structure pre-edge peak height and shape were
observed for 41 wt and 77 wt dehydrated VxOySBA-15 (Figure 7-1 left) The spectrum of 14 wt
dehydrated VxOySBA-15 exhibited a slight increase of the amplitude of the XANES after reaction
whereas the pre-edge peak height and shape remained unchanged The same similarity before and after
propene oxidation was observed in the FT(χ(k)k3) of the VxOySBA-15 samples (Figure 7-1 middle)
Only minor differences in the amplitude of the envelope of the FT(χ(k)k3) were detected for all loadings
employed A small decrease of the amplitude at higher distances (2-4 Aring) where V-V interactions are
located was observed for dehydrated 77 wt VxOySBA-15 In contrast an increase of the amplitude
was detected in the same region in the FT(χ(k)k3) of dehydrated 14 wt VxOySBA-15 XAFS
refinements were conducted to reveal that the ldquoordered dimeric tetrahedral model structurerdquo was still
sufficient for describing the experimental FT(χ(k)k3) The resulting parameters for 77 wt and 14 wt
VxOySBA-15 are listed in Table 7-2 (A detailed description of the refinements is given in Chapter 5) A
good agreement of the experimental and theoretical FT(χ(k)k3) was obtained for all samples as indicated
by residuals lower than 8 (Table 7-2)
00
10
20
30
55 555 56
Nor
mal
ized
Abs
orpt
ion
Photon Energy [keV]
A
B
C
V-V
01
02
0 2 4 6
FT
(χ(k
)k3 )
R [Aring]
A
B
C
V-O
V-O V-Si
0
5
10
15
220 600300 400 500
F(R
infin)
Wavelength [nm]
A
C
Figure 7-1 V K edge XANES (left) FT(χ(k)k3) (middle) and UV-Vis-DR spectra (right) recorded at 298 K after dehydration (solid line 623 K 1 h 20 O2 in He) and after propene oxidation (dashed line 673 K (UV-Vis) and 723 K (XAS) 1 h 5 O2 and 5 propene in He) (A) 77 wt (B) 41 wt and (C) 14 wt VxOySBA-15
118
Table 7-2 Experimental distances (R) XAFS disorder parameters (σ2) and coordination numbers (N) for different types of atom in a model system assuming an ordered arrangement of [V2O7] units (Chapter 5) Parameters were obtained from the refinement of this model structure to the experimental V K edge XAFS FT(χ(k)k3) of dehydrated 14 wt and 77 wt VxOySBA-15 (k range from 27-105 Aring-1 R range 083-362 Aring Nind = 16 E0 = 0 eV in all cases (subscript c indicates parameters that were correlated in the refinement subscript f indicates parameters that were fixed in the refinement) Dehydration was conducted in 20 O2 in He at 623 K for 1 h and propene oxidation at 723 K for 1 h (5 O2 and 5 propene in He)
77 wt VxOySBA-15 14 wt VxOySBA-15
dehydrated after propene oxidation dehydrated after propene oxidation
Type ( N) R [Aring] σ2 [Aring2] R [Aring] σ2
[Aring2] R [Aring] σ2 [Aring2] R [Aring] σ2
[Aring2]
V ndash O (1) 178 00067 178 00069 178 001 178 0009
V ndash O (1) 178 c 00067 c 178 c 00069 c 178 c 001 c 178 c 0009 c
V ndash O (2) 178 c 00067 c 178 c 00069 c 178 c 001 c 178 c 0009 c
V ndash O (1) 289 00012 f 289 00012 f 287 0003 f 287 0003 f
V ndash V (1) 333 00098 333 00123 335 00129 333 00089
V ndash V (1) 361 00098 c 360 00123 c 361 00129 c 356 00089 c
V ndash Si (1) 254 00088 254 00923 251 00109 252 00103
Residual 40 40 56 79
Accordingly the dehydrated vanadium oxide structure was still present on the SBA-15 support after
propene oxidation Compared to the parameters obtained from a refinement to the initial FT(χ(k)k3) of
dehydrated 77 wt VxOySBA-15 the disorder parameter σ2 of the V-V distances at 33 and 36 Aring
increased during propene oxidation from 00098 to 00123 Aring2 Small rearrangements of the [V2O7]
dimers which cause a wider distance distribution as a consequence of a slightly decreased structural
disorder may have occurred during propene oxidation Another reason for a wider distribution of the V-V
distances may be a transformation of small fractions of the dimeric vanadium oxide centers into isolated
tetrahedral vanadium oxide centers In contrast to 77 wt VxOySBA-15 the V-V disorder parameter σ2
of 14 wt VxOySBA-15 was decreased after propene oxidation The narrower V-V distance distribution
and may be explained by an increased structural order Additionally it seems possible that the number of
V-O or V-Si contributions increased at distances higher than 2 Aring However the disorder parameters σ2 of
the V-O and V-Si distances showed no significant changes for 14 wt and 77 wt VxOySBA-15 after
propene oxidation (Table 7-2)
Distinct changes were detected In the UV-Vis-DR spectra of dehydrated VxOySBA-15 recorded before
and after exposure to catalytic conditions (Figure 7-1 right) In the UV-Vis-DR spectra that were
measured at 298 K after temperature programmed reaction in propene and oxygen a blue shift of the
absorption maximum and a decrease of the maximum intensity at 300 nm were observed The UV-Vis
edge energy of 77 wt VxOySBA-15 shifted from 341 eV to 356 eV (∆Eg~ plusmn005 eV) and that of
41 wt VxOySBA-15 from 342 eV to 362 eV (∆Eg~ plusmn005 eV) Eg of low loaded 14 wt
VxOySBA-15 shifted from 36 eV to 39 eV (∆Eg~ plusmn01 eV) A UV-Vis edge energy of 36 eV would be
indicative for the presence of isolated and dimeric tetrahedral vanadium centers For low loaded
dehydrated 14 wt VxOySBA-15 a UV-Vis edge energy of 39 eV suggests that isolated centers may be
present predominately
119
300 350 400 450 500 550 600
250
300
350
400
450
500
0 036 072 11 14 18 21 25 29 32 36 39 43
Temperature [K]
Wav
elen
gth
[nm
]
Norm
alized Ion Current m
e 56
250 300 350 400 450 5000
1
2
3
4
F(R
infin)
Wavelength [nm]
F(Rinfin)
B
300 350 400 450 500 550 600 650
250
300
350
400
450
500
Norm
alized Ion Current m
e 56
0 12 24 36 48 60 71 83 95 11 12 13 14
Temperature [K]
Wav
elen
gth
[nm
]
250 300 350 400 450 5000
2
4
6
8
10
12
14
F(R
infin)
Wavelength [nm]
F(Rinfin)
A
300 350 400 450 500 550 600 650
250
300
350
400
450
500
0 12 24 36 48 60 71 83 95 11 12 13 14
Temperature [K]
Wav
elen
gth
[nm
]
Norm
alized Ion Current m
e 56
250 300 350 400 450 5000
2
4
6
8
10
12
F(R
infin)
Wavelength [nm]
F(Rinfin)
C
300 350 400 450 500 550 600 650
250
300
350
400
450
500
Temperature [K]
Wav
elen
gth
[nm
]
0 13 25 38 50 63 75 88 10 11 13 14 15
300 400 5000
2
4
6
8
10
12
14
F(R
infin)
Wavelength [nm]
F(Rinfin)
D
300 350 400 450 500 550 600 650
10x10-12
20x10-12
30x10-12
77 wt VxO
ySBA-15
Run1 Run2
Ion
Cur
rent
me
56
[A]
Temperature [K]
300 350 400 450 500 550 600 650
60x10-13
12x10-12
18x10-1214 wt V
xO
ySBA-15
Run1 Run2
Ion
Cur
rent
me
56
[A]
Temperature [K]
Figure 7-2 Top and middle in situ UV-Vis-DR spectra of dehydrated VxOySBA-15 (623 K 1 h 20 O2 in He) and the evolution of the ion current me 56 (acrolein) during the temperature programmed reaction (A) 77 wt VxOySBA-15 (675 K 5 O2 and 5 propene in He 1st run) (B) 14 wt VxOySBA-15 (634 K 5 O2 and 5 propene in He 1st run) (C) 77 wt VxOySBA-15 (675 K 1 h 5 O2 and 5 propene in He 2nd run) (D) 77 wt VxOySBA-15 (675 K 5 O2 in He) Bottom Evolution of the ion current me 56 for the 1st and 2nd measurement run All measurements were performed with 4 Kmin
120
In situ UV-Vis-DR spectra were recorded during temperature programmed reaction (298-675 K 4 Kmin
5 O2 and 5 propene in He) to determine the temperature where the blue shift occurred The resulting
UV-Vis-DR spectra together with the evolution of the acrolein ion current (me 56) are depicted in
Figure 7-2 for dehydrated 77 wt and 14 wt VxOySBA-15 For reference a measurement in 5 O2
was conducted to ensure that the blue shift occurred only under catalytic conditions (Figure 7-2 D) In
those spectra a reversible temperature induced red shift of the UV-Vis edge energy and the absorption
maximum was observed In the spectra recoded in a 5 O2 and 5 propene atmosphere the blue shift of
the absorption maximum started at 500 K and finished approximately at 550 K for dehydrated 77 wt
VxOySBA-15 (Figure 7-2 A) Interestingly the beginning of the blue shift of the UV-Vis-DR absorption
band coincided with the onset of acrolein formation at 500 K (and other aldehydes that are not shown)
detected in the online mass spectrometer The range where the blue shift was mainly observed shifted to
530-600 K for dehydrated 14 wt VxOySBA-15 (Figure 7-2 B) The onset of acrolein formation was at
520 K A second temperature programmed measurement was conducted subsequently to the first
measurement of dehydrated 77 wt VxOySBA-15 to investigate if the onset of the catalytic activity was
reproducible No change was observed in the in situ UV-Vis-DR spectra of 77 wt VxOySBA-15
except for a temperature induced broadening of the absorption band (Figure 7-2 C) The onset
temperature of acrolein formation was still at 500 K but the increase of the ion current (me 56) was
significantly lower than in the first measurement For a better comparison the ion currents of the first and
second measurement are shown in Figure 7-2 (bottom) A propene conversion of ~ 8 was detected
directly after reaching 675 K for both measurements of 77 wt VxOySBA-15 Furthermore the
selectivity towards acrolein decreased from 18 in the first measurement to 14 in the second
measurement Such a pronounced difference in the acrolein formation between the initial and a second
measurement was not observed for dehydrated 14 wt VxOySBA-15 The results presented above show
that the temperature range where the blue shift in the UV-Vis-DR spectra of dehydrated 77 wt
VxOySBA-15 occurred (500-600 K) coincided with an increased formation and selectivity of acrolein and
other aldehydes Possible explanations for the blue shift observed and of the increased activity of
dehydrated 77 wt VxOySBA-15 will be discussed in Section 723
722 Impact of pretreatment procedure and water vapour on the local structure of
VxOySBA-15 during propene oxidation
In the previous chapter it was shown that the dehydrated VxOySBA-15 structure was present at elevated
temperatures even in the presence of water in the reaction atmosphere The influence of different reaction
conditions like pretreatment in oxygen and water vapor on the local structure of VxOySBA-15 during
propene oxidation were investigated here Three experiments were performed First the sample was
dehydrated (554-623 K 1 h 20 O2 in He) prior to the temperature programmed reaction in propene and
oxygen (5 propene and 5 O2 in He) Second the hydrated VxOySBA-15 samples were used as initial
phase Third the hydrated VxOySBA-15 samples were used as initial phase and water vapor was added to
121
0
14
5
10
220 500 300 400
Wavelength [nm]
0
5
10
220 300 400
F(R
infin)
Wavelength [nm]
298 K
636 K
F(R
infin)
0
3
1
2
220 500 300 400
Wavelength [nm]
0
1
2
3
220 300 400
F(R
infin)
Wavelength [nm]
636 K
298 K
F(R
infin)
Figure 7-3 In situ UV-Vis-DR spectra of 77 wt VxOySBA-15 (right) and 14 wt VxOySBA-15 (left) recorded at 636 K and at 298 K after reaction in 5 propene and 5 O2 in He dehydrated sample (554 K 20 O2) (solid line black) hydrated sample (dashed and dotted line red) and hydrated sample with water (08 Vol) in the reaction mixture (dotted line blue)
the reaction mixture (~ 08 Vol) In this experiment water vapor was switched off while cooling the
samples to 298 K The UV-Vis-DR spectra of 14 wt and 77 wt VxOySBA-15 for the different
temperature programmed reactions are shown in Figure 7-3 Apparently no difference can be detected in
the UV-Vis-DR spectra recorded in situ at 636 K and at 298 K after reaction The dehydrated
VxOySBA-15 state was present for all three treatments Similar results were obtained from V K edge
XAFS measurements Figure 7-4 depicts the FT(χ(k)k3) of 77 wt VxOySBA-15 recorded at 723 K
and 298 K for the different temperature programmed reactions Again no significant difference was
observed in the FT(χ(k)k3) of 77 wt VxOySBA-15 for the different treatments employed Figure 7-5
depicts the in situ XAFS spectra for 77 wt VxOySBA-15 (3rd procedure hydrated VxOySBA-15
water) to show that a similar evolution of XAFS spectra was observed as described for the dehydration
processes in Chapter 623
00
0025
005
0075
-0025
0 2 4 6
R [Aring]
FT
(χ(k
)k3 )
723 K
00
0025
005
0075
-0025
0 2 4 6
R [Aring]
FT
(χ(k
)k3 )
)
298 K
Figure 7-4 In situ V K edge FT(χ(k)k3) of 77 wt VxOySBA-15 (right) and 14 wt VxOySBA-15 (left) recorded at 723 K and at 298 K after reaction in 5 propene and 5 O2 in He dehydrated sample (554 K 20 O2) (solid line black) hydrated sample (dashed and dotted line red) and hydrated sample with water (08 Vol) in the reaction mixture (dotted line blue)
122
002
004
006
0 1 2 3 4 300400
500600
700
FT
(χ(k
)k3 )
R [Aring]
00
025
05
075
10
00
55
555
56
400500
600700
Nor
mal
ize
d A
bsor
ptio
n
00
02
04
06
08
10
300 400 500 600 700
Temperature [K]
Nor
mal
ized
Ion
Cur
rent
me 18 (H2O)
me 44 (CO2)
me 56 (acrolein)
300 400 500 600 700
00
02
04
06
08
10
Fra
ctio
n of
Pha
se
Temperature [K]
560
565
570 V K
Pre-E
dge Peak P
osition [eV] 054
057
060
063
066
Norm
V K
Pre-E
dge Peak H
eight
Figure 7-5 Evolution of the recorded MS ion currents (left top) and the V K edge pre-edge peak height () and energy position () (left bottom relative to 5465 keV) and the phase fraction for the hydrated () and dehydrated () vanadium oxide structure obtained from a PCA (left bottom) of the V K edge XANES spectra (right top) that were recorded during the temperature programmed reaction (5 O2 and 5 propene in He 298-723 K 5 Kmin) of 77 wt hydrated VxOySBA-15 FT(χ(k)k3) (QEXAFS scans) of a comparable measurement are shown on the right side (bottom)
The XANES spectra the FT(χ(k)k3) MS ion currents and the respective parameters obtained from a
PCA analysis and an analysis of the pre-edge peak height and position are depicted in Figure 7-5
XANES scans were recorded in the standard operation mode of the monochromator crystals to gain a
better signal to noise ratio The FT(χ(k)k3) was extracted from QEXAFS scans that were recorded in a
separate measurement The usable spectral range of the QEXAFS scans was 25-90 Aring-1(Figure 10-4
appendix) Similar to dehydration of 77 wt VxOySBA-15 (Chapter 623 Figure 6-3) two
components involved in the structural transformation were determined by a PCA of the V K edge
XANES spectra The amount of hydrated and dehydrated VxOySBA-15 was determined using the
XANES spectrum of the initial hydrated structure and the XANES spectrum recorded at 723 K The
evolution of the hydrated and dehydrated state was comparable to that observed during dehydration in
20 O2 As depicted in Figure 7-5 the transformation of the hydrated VxOySBA-15 structure into the
dehydrated VxOySBA-15 structure occured in the temperature range from 300 K to 440 K In this
temperature range changes in the XANES were observed and the pre-edge peak position reached its
minimum (Figure 7-5 left bottom) In contrast to Figure 6-3 in Chapter 623 a small increase of the
pre-edge peak position was observed above 500 K The origin of this increase is unclear It may indicate a
change of the coordination sphere (eg type of ligand) around the absorbing vanadium center during
propene oxidation The increase of the pre-edge peak height coincided with the increasing amount of
123
dehydrated VxOySBA-15 phase This was similar to the dehydration of 77 wt VxOySBA-15 Below
550 K only the formation of water (me 18) was detected with the online mass spectrometer An increase
in the ion currents of the reaction products of propene oxidation was observed for temperatures higher
than 550 K Figure 7-5 (left top) depicts the ion currents of water (me 18) CO2 (me 44) and acrolein
(me 56) The formation of reaction products was observed at temperatures where the dehydrated phase
was already present on the support Therefore the dehydrated structure of VxOySBA-15 was the main
vanadium oxide phase present during catalytic propene oxidation The in situ FT(χ(k)k3) of 77 wt
VxOySBA-15 resembled that of the dehydrated phase above 440 K XAFS refinements showed that the
ldquoordered V2O7rdquo model structure was sufficient to describe the experimental FT(χ(k)k3) of 77 wt
VxOySBA-15 recorded at 723 K for all reaction conditions employed Low residuals of 8 acceptable F
parameters and acceptable confidence limits were obtained for all refinements Compared to the
parameters that were obtained after reaction at 298 K only a small increase of the disorder parameters
and small changes of the V-V distances were observed at 723 K The disorder parameter of the V-V
distances increased (~ 0014 Aring2) compared to that determined at 623 K in a 20 O2 atmosphere
(0009 Aring2Table 6-3 Chapter 629) The increased σ2 suggests a wider V-V distance distribution which
may be a consequence of structural rearrangements that occur during the reaction with propene
Nevertheless for all treatments the ordered dimeric [V2O7] model structure was sufficient to describe the
experimental FT(χ(k)k3) of the 77 wt VxOySBA-15 sample under reaction conditions
In conclusion the pretreatment procedure and the presence of water vapor during catalytic reaction did
not affect the local vanadium oxide structure of VxOySBA-15 The same dehydrated VxOySBA-15 state
was present for all treatments employed
Table 7-3 Experimental distances (R) XAFS disorder parameters (σ2) and coordination numbers (N) for different types of atom in a model system assuming an ordered arrangement of [V2O7] units (Chapter 5) Parameters were obtained from the refinement of this model structure to the experimental V K edge XAFS FT(χ(k)k3) of dehydrated 14 wt and 77 wt VxOySBA-15 (k range from 27-105 Aring-1 R range 083-362 Aring Nind = 16 E0 = 0 eV in all cases (subscript c indicates parameters that were correlated in the refinement subscript f indicates parameters that were fixed in the refinement) Dehydration was conducted in 20 O2 in He at 623 K and propene oxidation at 723 K (5 O2 and 5 propene in He 08 H2O)
dehydrated hydrated hydrated dehydrated after reaction
723 K 723 K 723 K 298 K
5 propene 5 O2 5 propene 5 O2 5 prop 5 O2 08 H2O He
Type ( N) R [Aring] σ2 [Aring2] R [Aring] R [Aring] R [Aring] σ2
[Aring2] R [Aring] σ2 [Aring2]
V ndash O (1) 179 00084 178 00084 178 00088 178 00069
V ndash O (1) 179 c 00084 c 178 c 00084 c 178 c 00088 c 178 c 00069 c
V ndash O (2) 179 c 00084 c 178 c 00084 c 178 c 00088 c 178 c 00069 c
V ndash O (1) 291 00012 f 288 00012 f 291 00012 f 289 00012 f
V ndash V (1) 326 00146 330 00165 332 00140 333 00123
V ndash V (1) 359 00146 c 363 00165 c 363 00140 c 360 00123 c
V ndash Si (1) 256 00104 253 00121 255 00105 254 00923
Residual 73 55 49 41
124
723 Discussion of possible origins of the UV-Vis edge energy shift during propene oxidation
In the previous chapter various reasons were discussed that may explain the UV-Vis edge energy shift
observed in the UV-Vis-DR spectra (i) reduced V4+ centers which exhibit CT absorption bands at lower
wavelengths (ii) less distorted VO tetrahedrons (iii) changed oxygen groups (V-O-Si harr V-OH ) and
(iv) changed connectivity (dimeric rarr isolated vanadium centers)
A reduction of tetrahedral V5+ vanadium centers to tetrahedral V4+ or V3+ centers (reason (i)) seems not
very likely because of the unchanged pre-edge peak in the V K edge XANES spectra (Figure 7-1) and the
unchanged Raman band at 1040 cm-1 (Figure 7-7) However a tetrahedral vanadium oxide species with
reduced vanadium centers would exhibit absorption bands in the UV-Vis range with maxima that are blue
shifted compared to the maxima that are detected for V5+ vanadium centers [132] Thus reduced
tetrahedral vanadium centers may be one reason for the blue shift observed in the spectra of the
dehydrated VxOySBA-15 samples during propene oxidation (Figure 7-6) That no reduction of the
tetrahedral vanadium oxide phase occurred during the temperature programmed reaction in propene and
oxygen was investigated by an isothermal UV-Vis-DRS experiment at 675 K Dehydrated 77 wt
VxOySBA-15 was heated to 675 K and held for 15 minutes in 5 O2 in He During the thermal treatment
in 5 O2 in He only a red shift of several nm was detected The exposure of the sample to the reaction
atmosphere at 675 K (5 min 5 O2 and 5 propene) caused an immediate blue shift In order to reveal
whether the blue shift was not caused by reduced vanadium phases the atmosphere was switched to 20
O2 in He to induce a re-oxidation No change in the absorption spectra was observed Thus it was shown
that the blue shift was not caused by the formation of reduced (V4+V3+) tetrahedrally coordinated
vanadium centers
-60 -80 -100 -120 -140
CCCC
BBBB
AAAA
Q2Q3Q4
00100
01684
102565
Q4
Q3
Q2
[ppm]
5
10
15
250 300 350 400 450
F(R
infin)
Wavelength [nm]
1) 5 O2
2) 5 O2 5 propene
3) 20 O2
675 K
Figure 7-6 Left in situ UV-Vis-DR spectra of dehydrated 77 wt VxOySBA-15 (623 K 1 h) after subsequent treatment at 675 K in (1) oxygen (2) propene and oxygen and (3) oxygen Right 29Si CP-MAS-NMR of SBA-15 and 77 wt VxOySBA-15 treated at different temperatures (A) SBA-15 (B) dehydrated 77 wt VxOySBA-15 (653 K 1 h) (C) dehydrated 77 wt VxOySBA-15 (653 K 1 h) after propene oxidation (5 propene and 5 O2 in He 673 K 1 h) The red curve is the sum of the Gaussian functions used for the profile refinement
125
The second reason (ii) that the distortion of the VO tetrahedron decreased was not corroborated by
XAFS refinement results A blue shift of the UV-Vis edge energy would be observed if the average V-O
bond length decreased (Chapter 522 Figure 5-2 right) The parameters in Table 7-2 show clearly that
the average V-O distance and the disorder parameters underwent no significant change
Reason (iii) implies a change of the oxygen ligands induced by the interaction with the propene molecule
In the previous Chapter 6 such an exchange was interpreted by a change of V-OHSi-OH to V-O-Si
groups This interpretation was corroborated by NMR measurements that allowed determining the Si-OH
distribution on the SBA-15 support As shown in Figure 7-7 (right) exclusively Q4 type Si centers and
no Si-OH centers were detectable on the SBA-15 support after the catalytic measurement of dehydrated
77 wt VxOySBA-15 However Gao et al [23] observed a similar decrease of the number of isolated
Si-OH centers with NIR-DR spectroscopy for a 1 VxOySiO2 sample under catalytic (methanol
oxidizing) conditions For the same 1 VxOySiO2 sample they observed a comparable blue shift of the
UV-Vis edge energy from 36 eV to 38 eV as observed here for VxOySBA-15 under catalytic conditions
Gao et al [23] assigned the decrease in Si-OH centers to the formation of Si-O-CxHy species The blue
shift in the UV-Vis-DR spectra was assigned to the formation of isolated 4-fold V-methoxy species [23]
which is in contrast to the interpretation here The feasibility of detecting V-O-CxHy species formed
during propene oxidation at 675 K with UV-Vis-DRS seems not very likely Even though such V-O-CxHy
and Si-O-CxHy species may form as intermediates it is expected that these are oxidized in 20 O2
atmospheres at 675 K and that the blue shift will be reversible Figure 7-7 (left) shows that no change in
the UV-Vis-DR spectra of 77 wt VxOySBA-15 was observed after changing the gas phase from
catalytic conditions to 20 O2 at 675 K Therefore the transformation of V-OH to V-O-Si bonds seems
to be the explanation of the blue shift if it was assumed that the type of oxygen group changed during
propene oxidation Another reason (vi) for the observed blue shift in the UV-Vis-DR spectra may be a
change in the average V-O-V number In this case some of the dimeric centers may transform into
isolated tetrahedral vanadium centers and additional V-O-Si bonds are formed Reason (vi) was
corroborated by the decreasing UV-Vis edge energy determined for dehydrated VxOySBA-15 after the
reaction which indicates a lower connectivity of the vanadium centers (V-O-V number Chapter 522) In
contrast the XAFS measurements showed no clear trend that would support this interpretation The
increase of the disorder parameter of the V-V distances (33 and 36 Aring) for 41 wt and 77 wt
VxOySBA-15 (Table 7-2) may indicate that some of the dimeric tetrahedral vanadium centers
transformed into isolated ones Nevertheless the opposite trend was observed for 14 wt VxOySBA-15
The disorder parameter for the V-V distances of 14 wt VxOySBA-15 decreased after propene oxidation
(Table 7-2) However the transformation of V-OHSi-OH groups to V-O-Si bonds (reason (iii)) rather
than the V-O-V bond rupture (reason (iv)) seems to be the more likely explanation of the blue shift
observed in the UV-Vis-DR spectra This suggestion was corroborated by the fact that the blue shift of
the UV-Vis edge energy observed was larger for 14 wt VxOySBA-15 than for 41 wt and 77 wt
VxOySBA-15 14 wt VxOySBA-15 already exhibits a considerable amount of isolated vanadium
centers and a lower number of V-O-V bonds
126
724 Enhanced reactivity of 77 wt VxOySBA-15ndashImpact of V2O5 and carbonaceous species
In the temperature range where the blue shift of the UV-Vis absorption bands occurred an increased
acrolein formation was detected in the first measurement run of 14 wt and 77 wt VxOySBA-15
(Figure 7-2 A and B) This was visible as a small shoulder in the acrolein ion current detected in the first
measurement run (Figure 7-2 bottom) For 14 wt VxOySBA-15 the ion current at temperatures above
600 K was not higher than in the second run Therefore the increased acrolein formation in the lower
temperature range of 500-600 K may be correlated with the structural rearrangement of the dehydrated
VxOySBA-15 structure in the initial phase of the reaction The increased acrolein formation detected for
77 wt VxOySBA-15 at higher temperatures may be caused by other reasons The presence of V2O5
seems likely for 77 wt VxOySBA-15 in contrast to 14 wt VxOySBA-15 These small fractions of
V2O5 may enhance the reactivity of 77 wt VxOySBA-15 for propene oxidation That bulk V2O5 is
active for the selective oxidation of propene towards acrolein will be discussed in more detail in Chapter
2 The UV-Vis-NIR-DR spectra of 77 wt VxOySBA-15 showed small absorption bands in the NIR
range of the spectra which are indicative for vanadium centers with lower oxidation states Conversely in
the UV-Vis-NIR-DR spectra of 14 wt VxOySBA-15 and of freshly calcined and dehydrated 77 wt
VxOySBA-15 (Figure 7-7 left) such absorption bands were not detected in the NIR range (05-2 eV)
Thus these bands may be caused by V2O5 formed during aging that was reduced under reaction
conditions V2O5 crystallites can be detected very sensitively by Raman spectroscopy Conversely Raman
bands of reduced vanadium oxide species are hardly detectable by Raman spectroscopy [18161]The
cross-section for Raman scattering is near zero for reduced vanadium centers [161] A reversible shift to
1035 cm-1 was detected for the Raman band at 1041 cm-1 which was assigned to temperature depended
effects
200 400 600 800 1000 1200
673 K
623 K
573 K
523 K
473 K
373 K
Inte
nsity
Raman shift [cm-1]
298 K
5 0512 34
0
123
Energy [eV]
0
02
04
06
08
F(R
infin)
4
5
10
Energy [eV]
F(R
infin)
77 wt V
14 wt V
298 K
Figure 7-7 Left In situ UV-Vis-NIR-DR spectra of dehydrated (dashed line) 14 wt and 77 wt VxOySBA-15 (623 K) after 1st (solid line) and 2nd (dashed and dotted line) catalytic measurement (675 K 5 O2 and 5 propene in He) Right in situ Raman spectra of dehydrated 77 wt VxOySBA-15 (723 K 20 O2 in N2) in 5 O2 and 5 propene in N2 514 nm 6 mW
127
Even though (reduced) V2O5 was observed for 77 wt VxOySBA-15 the increased acrolein formation
detected was not assigned to such a phase The amount of V2O5 formed on 77 wt VxOySBA-15 was
estimated to be 3-5 of the vanadium oxide phase (Chapter 629) As discussed later on (Chapter 726)
it was shown by catalytic testing that this amount is too low to explain the increased activity of 77 wt
VxOySBA-15
Carbonaceous species formed during reaction may also enhance the catalytic activity of 77 wt
VxOySBA-15 for the propene oxidation The formation of carbonaceous species in propene atmospheres
was reported by Zhao et al [158] They observed characteristic Raman bands at approximately 1400 cm-1
and 1600 cm-1 in the in situ Raman spectra of 5 and 8 VxOySiO2 catalysts (12 and 27 Vnm2)
recorded at 623 K in 3 propene [158] Such Raman bands were visible in the in situ Raman spectra of
hydrated and dehydrated 77 wt VxOySBA-15 recorded during the temperature programmed reaction in
5 propene and 5 O2 in the range from 298 K to 523 K (Figure 7-8) These bands were not detected at
higher temperatures The Raman bands of carbonaceous species had a significantly lower intensity for
77 wt VxOySBA-15 dehydrated prior to reaction in propene and oxygen (Figure 7-8 right) Hence
intermediates during the dehydration of hydrated VxOySBA-15 may enhance formation of carbonaceous
species The carbon formation observed was not caused by residual carbon from the preparation because a
carbon amount lower than 01 wt was determined by CHN elemental analysis of hydrated VxOySBA-
15 samples Hence the carbon has to be formed by decomposition of propene Nevertheless Raman
bands of the carbonaceous species were not detectable above 573 K This temperature is below the
temperature (600 K) where 77 wt VxOySBA-15 showed an increased activity for acrolein formation
compared to 14 wt VxOySBA-15 Apparently neither V2O5 nor carbonaceous species were responsible
for the enhanced catalytic activity of 77 wt VxOySBA-15 Therefore this effect is assigned to an
intrinsic property of the ldquoordered V2O7rdquo structure of dehydrated VxOySBA-15 present for high vanadium
loadings near the maximum vanadium coverage of disperse vanadium oxide species on SBA-15
250 500 750 1000 1250 1500 1750
500
1000
1500
2000
2500
3000
623 K
573 K
523 K
473 K
363 K
423 K
Inte
nsity
Raman shift [cm-1]
298 K
10
15
20
25
500 1000 1500
Nor
mal
ized
Inte
nsity
Raman shift [cm-1]
473 K ldquohydratedrdquo
523 K ldquohydratedrdquo
473 K ldquodehydratedrdquo
523 K ldquodehydratedrdquo
Figure 7-8 Left in situ Raman spectra of hydrated 77 wt VxOySBA-15 during propene oxidation 5 O2 and 5 propene in N2 514 nm 6 mW Right Comparison of the in situ Raman spectra of hydrated and dehydrated 77 wt VxOySBA-15 during propene oxidation at 473 K and 523 K
128
725 Evaluation of the different reactor types for quantitative catalytic measurements
Prior to the discussion of the results obtained from catalytic reaction tests a short evaluation of the
suitability of the reaction cells used for catalytic measurements will be performed Three different types
of reaction cells were used to characterize the VxOySBA-15 samples under propene oxidizing conditions
Mainly in situ XAS and UV-Vis-DRS cells were used for the structural characterization Catalytic results
obtained in the in situ cells were compared to measurements conducted in a laboratory fixed bed reactor
(SiO2 tube ldquoquartz glassrdquo) Therefore both in situ cells and the reactor were connected to the same online
mass spectrometer and gas chromatograph to allow qualitative and quantitative determination of the
respective gas phase composition The catalytic propene oxidation (5 O2 and 5 propene in He) of
dehydrated 77 wt VxOySBA-15 (20 O2 in He 554-653 K) is used for comparison The propene
conversion and the sum selectivity towards all oxygenated reaction products as a function of temperature
are depicted in Figure 7-9 for all reactors used A more detailed depiction of the selectivities is given in
Figure 10-5 in the appendix The temperature range where acceptable results were obtained was different
for all reactors used For XAFS measurements reliable quantitative results were obtained for temperatures
higher than 673 K The low propene conversion is due to the low sample mass of 24 mg which was
required for the XAFS measurements at the V K edge In contrast to the in situ XAS cell significantly
higher propene conversion was determined in the in situ UV-Vis-DR cell for temperatures above 520 K
because a higher amount of sample could be introduced into the sample holder (189 mg) Temperatures
higher than 673 K were not feasible in the in situ UV-Vis-DR cell Moreover a high deviation of 20 in
temperature between the sample and the sample cup was observed The sample mass in the quartz glass
reactor was adjusted to a propene conversion between 5-10 at 673 K According to the different sample
masses used the rate of propene oxidation and the respective selectivities of the reaction products are
compared in Figure 7-9 (right)
500 600 700 8000
5
10
15
20
25
30
35
40 XAS SiO
2 tube
UV-Vis-DRS
Con
vers
ion
Pro
pene
[]
Temperature [K]
00
02
04
06
08
10
Selectivity O
xygenates
SiO2-Tube UV-Vis-DR XAS SiO
2-Tube
00
02
04
06
08
10676 K
Sel
ectiv
ity
acetic acid acrolein acetone propionaldehyde acetaldehyde CO CO
2
673 K635 K 633 K
0
2
4
6
8
10
12
14
Rate
Rate [micro
molpropene g
cat s]
Figure 7-9 Propene conversion and oxygenate selectivity (left) Propene conversion rate referred to the sample mass and product selectivities determined in the different measurement cells during the temperature programmed propene oxidation using dehydrated 77 wt VxOySBA-15 (right)
129
Rates of propene oxidation relative to the mass of the catalyst were comparable for the temperatures
employed The reaction rate was slightly increased for the UV-Vis-DR cell compared to the fixed bed
reactor at the same temperature (633 K) Reaction rates determined at 673 K in the XAS cell and in the
fixed bed tube reactor were almost the same Nevertheless the selectivities of the reaction products
formed were different for the various reaction cells In contrast to the tube reactor and the UV-Vis-DR
cell no acetic acid was observed in the XAS cell Although the propene conversion of the empty XAS
cell (stainless steel) was low (lt 05 Xpropene 673 K) compared to the sample measurement
(~18 Xpropene 673 K) the cell itself may be active for propene oxidation Therefore the XAS cell was
not suitable for deriving quantitative catalytic results Comparing the catalytic results of the tube reactor
and the UV-Vis-DR cell similar selectivities of the reaction products were detected Compared to the
tube reactor higher selectivities of CO2 and CO were detected whereas lower selectivities of acetic acid
and acetaldehyde were observed in the UV-Vis-DR cell Approximately the same selectivity towards
acrolein was detected for both reaction cells (17 in SiO2 tube reactor 15 in UV-Vis-DR cell)
Therefore some fractions of the partial oxidation products (mainly acetic acid and acetaldehyde) were
reacting to form CO and CO2 in consecutive reactions in the UV-Vis-DR cell These reactions may take
place at the hot sample holder (metal) or at sample locations exhibiting a higher temperature than the
average fraction of the sample In summary comparable catalytic behavior was detected for propene
oxidation conducted in the quartz glass reactor and the UV-Vis-DR cell For clarity and to reduce the
numbers of figures below only the quantitative results obtained in the SiO2 tube (ldquoquartz glassrdquo) reactor
are depicted
726 Impact of the pretreatment procedure on the catalytic performance of VxOySBA-15
In situ spectroscopic measurements showed that a similar vanadium oxide structure was present on the
SBA-15 support under catalytic conditions independent of thermal pretreatment prior to the catalytic runs
or the presence of water vapor The vanadium oxide structure was proposed to be similar to the
dehydrated VxOySBA-15 structure that consists of an ordered arrangement of [V2O7] units and in the
case of 14 wt VxOySBA-15 also of [VO4] vanadium centers Exposure to catalytic conditions resulted
in an increasing structural disorder of the vanadium centers on the support This was observed to be
independent of the vanadium loading for all pretreatment and reaction conditions Hence if a similar
structure is present under catalytic conditions the same catalytic performance will be measured
Evolution of propene conversion as a function of temperature is shown in Figure 7-10 for differently
treated 77 wt and 14 wt VxOySBA-15 The sample mass of VxOySBA-15 with different loading
was adjusted to the same amount of vanadium in the reactor (~ 08-09 mg V) For clarity SBA-15
(105 mg) and boron nitride (240-290 mg) which was used as diluent showed propene conversions below
~ 02 (Table 7-6)
130
500 600 7000
5
10
15
20
25
30
35
40 A B C D E F G H
Con
vers
ion
C3H
6 []
(nor
m t
o 10
5 m
g sa
mpl
e)
Temperature [K]
500 600 7000
10
20
30
40
Con
vers
ion
C3H
6 [
]
(nor
m t
o 60
mg
sam
ple)
Temperature [K]
A C E F
Figure 7-10 Propene conversion during propene oxidation (5 O2 and 5 propene in He) on 14 wt VxOySBA-15 (right) and 77 wt VxOySBA-15 (left) (A) dehydrated sample 653 K 1 h 20 O2 in He (B) dehydrated sample 763 K 1 h 20 O2 in He (C) ldquorecalcinedrdquo sample 843 K 12 h 20 O2 in He (D) ldquomultisteprdquo sample (i) 843 K 12 h 20 O2 in He (ii) 298 K 24 h 20 O2 and 2 H2O in He 653 K 1 h 20 O2 in He (E) hydrated sample (F) hydrated sample and 08 H2O in the reaction gas (G) physical mixture of V2O5 and SBA-15 (8 wt V) (H) physical mixture of ldquoball milledrdquo V2O5 and SBA-15 (8 wt V) Approximately 08-09 mg V was used for all measurements
For the reaction conditions employed in the spectroscopic measurements the same propene conversions
with increasing temperature were observed for differently treated samples (Figure 7-10 curve AEF)
However differences were present when 77 wt VxOySBA-15 was pretreated at 763 K for 1 h (Figure
7-10 left curve B) or recalcined at 843 K for 12 h (Figure 7-10 left curve C) The propene conversion
decreased significantly compared to measurements without a pretreatment procedure (Figure 7-10 left
curve EF) or with a thermal treatment at lower temperature (653 K Figure 7-10 left curve A) Such a
difference was not observed for 14 wt VxOySBA-15 (Figure 7-10 right)
NMR measurements showed that after recalcination of 77 wt VxOySBA-15 almost no Si-OH centers
were detectable (Chapter 626 Figure 6-7) Additionally XAS measurements showed that the
dehydrated vanadium oxide structure was the same as determined for the standard pretreatment procedure
(623 K 05-1 h Chapter 629 Table 6-3) Furthermore in the case of ldquoagedrdquo 77 wt VxOySBA-15
samples a decrease of the structural disorder of the ldquoagedrdquo dehydrated vanadium oxide structure was
observed after recalcination In contrast to the increased structural order of the vanadium oxide phase
after recalcination a significant change in the XAFS spectra was observed if the ldquorecalcinedrdquo sample was
treated under reaction conditions Figure 7-11 depicts the V K edge XANES spectra and the
corresponding FT(χ(k)k3) of ldquorecalcinedrdquo 77 wt VxOySBA-15 after reaction in propene and oxygen
A decrease of the pre-ege peak height from 076 to 063 was detected in the XANES spectra Using the
linear correlation introduced in Chapter 524 an increase of the average V-O distance from 177 to
184 Aring was indicated A reduction of the valence of the vanadium centers which may explain a decrease
of the pre-edge peak was excluded because of the unchanged energy position of the pre-edge peak
maximum in the V K edge XANES (54 eV relative to V K edge at 5465 eV)
131
55 555 56
05
10
15
A
B N
orm
aliz
ed A
bsor
ptio
n
Photon Energy [keV]
00
005
0 2 4 6
R [Aring]
AB
FT
(χ(k
)k3 )
Figure 7-11 V K edge XANES spectra (left) and FT(χ(k)k3) (right) of 77 wt VxOySBA-15 recorded at 298 K after ldquorecalcinationrdquo at 768 K for 8 h in 20 O2 in helium (A) and after a temperature programmed propene oxidation at 723 K 5 O2 and 5 propene in He (B)
Moreover a change in the V-O coordination from 4- to 5-fold seems likely but cannot be distinguished
unambiguously from a distorted 4-fold V-O coordination To show that the dehydrated [V2O7] model
structure was suitable to describe the experimental FT(χ(k)k3) of recalcined 77 wt VxOySBA-15 after
reaction in propene and oxygen an XAFS refinement was conducted The results are summarized in
Table 7-4 Compared to the refinement conducted to the FT(χ(k)k3) after calcination an increase of the
disorder parameters of all scattering paths used was determined A significant increase of the V-V
distances was determined which was accompanied by an increase of the confidence limits For the
disorder parameters determined for the V-Si distance at 25 Aring and for the V-V distances F parameters
higher than 05 were determined After propene oxidation that was conducted after a recalcination
pretreatment (gt 760 K) the vanadium oxide structure was strongly distorted This is in contrast to
samples pretreated below 723 K
Table 7-4 Experimental distances and XAFS disorder parameters (σ2) for different types of atom at distance R from the absorbing V atom in a model system assuming an ordered arrangement of [V2O7] units (Chapter 5) Parameters were obtained from the refinement of this model structure to the experimental V K edge XAFS FT(χ(k)k3) of dehydrated 77 wt VxOySBA-15 (k range from 27-105 Aring-1 R range 083-362 Aring Nind = 16 E0 = 0 eV in all cases (subscript c indicates parameters that were correlated in the refinement subscript f indicates parameters that were fixed in the refinement) Recalcination was conducted in 20 O2 in He at 768 K for 8 h and propene oxidation at 723 K (5 O2 and 5 propene in He)
77 wt VxOySBA-15
dehydrated for 12 h 768 K after propene oxidation
Type ( N) R [Aring] σ2 [Aring2] R [Aring] σ2
[Aring2]
V ndash O (1) 178 00063 179 00108
V ndash O (1) 178 c 00063 c 179 c 00108 c
V ndash O (2) 178 c 00063 c 179 c 00108 c
V ndash O (1) 289 00012 f 293 0003 f
V ndash V (1) 330plusmn002 00010 337plusmn004 00149 (F=06)
V ndash V (1) 360plusmn003 00010 c 373plusmn007 00149 c
V ndash Si (1) 253 00112 252 00190 (F=08)
Residual 59 95
132
Spectroscopic measurement suggested that during the catalytic process V-O-Si bonds were formed The
formation of such bonds to the support would be more likely if Si-OH centers were present As
determined from NMR these centers were almost absent after recalcination of 77 wt VxOySBA-15
Thus the low availability of these centers on recalcined 77 wt VxOySBA-15 causes the high structural
distortion of the vanadium oxide structure because of a lack of binding sites with the support SBA-15
Such a decrease in propene conversion was not observed for low loaded 14 wt VxOySBA-15 This
may be explained by the lower V to surface ratio (03 Vnm2) and the higher surface (40) of this sample
Thus the probability that Si-OH centers remained after the recalcination process was higher Due to the
fact that no comparable NMR or XAFS measurements were performed with recalcined 14 wt
VxOySBA-15 this could not be investigated further That the presence of OH groups either Si-OH or V-
OH was important for obtaining the higher propene conversion was shown by a rehydration experiment
Curve D in Figure 7-10 shows the propene conversion for 77 wt VxOySBA-15 that was pretreated in a
multistep procedure The sample was recalcined for 12 h at 843 K and afterwards rehydrated at 298 K for
24 h with 2 H2O vapor and finally dehydrated for 1 h at 653 K After this multistep treatment the
propene conversion above 600 K was even enhanced compared to 77 wt VxOySBA-15 that was just
dehydrated at 653 K for 1 h
For 77 wt VxOySBA-15 V2O5 may have formed on the SBA-15 support Therefore V2O5 may cause
the increased activity compared to recalcined 77 wt VxOySBA-15 To estimate the reactivity of
crystalline V2O5 compared to 77 wt VxOySBA-15 two physical mixtures of V2O5 and SBA-15 with
8 wt V were prepared The first mixture was prepared using well crystalline V2O5 (domain size gtgt
1000 Aring) and the second with less crystalline V2O5 (Debye-Sherrer domain size ~ 170 Aring) that was treated
in a ball mill Both samples showed an increasing propene oxidation above 650 K (Figure 7-11 left
curve G and H) In contrast to the well crystalline V2O5 sample the ldquoball milledrdquo V2O5 sample showed a
strong increase in the propene conversion above 700 K For higher temperatures the propene conversion
remained constant whereas the oxygen conversion increased to ~ 100 Similar to the results discussed
in Chapter 2 for bulk V2O5 reduced V4+ and V3+ phases may be present Thus ldquonanordquo crystallinerdquo V2O5
formed on SBA-15 may have a similar reactivity at lower temperatures as the dehydrated VxOySBA-15
phase but it is more likely that this phase is reduced to less reactive V4+ and V3+ vanadium oxide phases
at higher temperatures (gt 700 K) Furthermore the reactivity could only be only comparable to 77 wt
VxOySBA-15 if an equal V mass was used for the catalytic measurements In Chapter 629 the amount
of V2O5 formed on ldquoagedrdquo 77 wt VxOySBA-15 was estimated by Raman spectroscopy to be 3 This
would mean that only 02 wt of the V was present as crystalline V2O5 Such a small amount of
crystalline V2O5 would not explain the increased reactivity of 77 wt VxOySBA-15
A second measurement run was conducted to investigate the reproducibility of the increased propene
conversion on 77 wt VxOySBA-15 with ldquomildrdquo or no pretreatment procedure Figure 7-12 depicts the
propene conversion during the first and the second measurement of 77 wt VxOySBA-15 pretreated at
653 K for 1 h or pretreated at 763 K for 1 h
133
500 600 7000
5
10
15
20
25
30
35
40 dehydrated 763 K 1h Run 1 dehydrated 763 K 1h Run 2 dehydrated 653 K 1h Run 1 dehydrated 653 K 1h Run 2
C
onve
rsio
n C
3H6 [
]
(nor
m t
o 10
5 m
g sa
mpl
e)
Temperature [K]
0 2 4 6 8 10 12040
050
060
Sel
ectiv
ity O
xyge
nate
sTime [h]
0
5
10
15
dehydrated 840 K 12 h dehydrated 650 K 1 h hydrated H
2O
hydrated
Con
vers
ion
C3H
6 []
Figure 7-12 Propene conversion and oxygenate selectivity during propene oxidation (5 O2 and 5 propene in He) of 77 wt VxOySBA-15 for different treatments During subsequent temperature programmed reactions (left) and under isothermal conditions at 673 K (right)
Similarly to the UV-Vis-DRS measurements (Figure 7-2 bottom left) the formation of aldehydes
increased for the first run of 77 wt VxOySBA-15 pretreated at 653 K for 1 h (Figure 10-6 appendix)
For 77 wt VxOySBA-15 pretreated at 653 K the conversion of propene was lower in the second run
whereas the conversion increased for 77 wt VxOySBA-15 pretreated at 763 K for 1 h It seems that for
both pretreatment procedures the conversion of propene approached the same value In order to further
investigate this behavior long-term measurements (8-12 h) at 673 K were performed for selected
pretreatment procedures
0 5 10 15 20 25 3000
02
04
06
08
10
A B C D
Sel
ectiv
ity O
xyge
nate
s
Conversion C3H
6 []
A B C D00
02
04
06
08
10
Sel
ectiv
ity
CO2
CO acetaldehyde propionaldehyde acetone acrolein acetic acid
0
2
4
6
8
10
12
14
16
18
20
propene conversion oxygen conversion
Conversion [
]
Figure 7-13 Oxygenate selectivity versus propene conversion determined after 8-12 h at 673 K (left) for 77 wt VxOySBA-15 and comparision of the product selectivities for similar propene conversion (right) (A) dehydrated sample 653 K 1 h 20 O2 in He (B) hydrated sample (C) hydrated sample and 08 H2O in the reaction gas (D) ldquorecalcinedrdquo sample 843 K 12 h 20 O2 in He (Details Table 7-5)
134
In all measurements the propene conversion and the selectivity towards C2 and C3 oxygenates approached
the same values (Figure 7-12 right) These were similar to the values obtained for 77 wt
VxOySBA-15 dehydrated at 653 K for 1 h After the long-term measurements the initial flow rate was
varied (20-75 mlmin ~ 08 ml reactor volume 1500-5625 h-1 GHSV) The resulting selectivity versus
propene conversion is depicted in Figure 7-13 As indicated from the subsequent measurements the
dependence of the selectivity on the propene conversion was similar for all treatment procedures
employed For all treatments of 77 wt VxOySBA-15 an increase of the COx (CO and CO2) formation
was measured with increasing propene conversion Similar product selectivities were obtained for all
treatment procedures for the same propene conversion of 4-5 (Table 7-5) The main difference between
the various treatment procedures was the increase of selectivity towards acetic acid from 7 to 10-13 on
the samples that were not pretreated in oxygen The additional water content in the reaction gas mixture
of 08 Vol did not change the selectivity towards the products formed Interestingly 77 wt
VxOySBA-15 that was recalcined prior to reaction in propene and oxygen showed a significantly
enhanced oxygen conversion of 20 This was more than twice as much as detected for the other
treatment procedures This pretreatment resulted in the lowest propene conversion rate of 77 wt
VxOySBA-15
The same catalytic performance was observed for all treatment procedures This matches the observation
that the same vanadium oxide species were present on the support UV-Vis-DR spectra that were
recorded after 4 h at 673 K in the reaction mixture showed a blue shift of the characteristic absorption
band of the dehydrated tetrahedral VxOySBA-15 phase Furthermore absorption bands below 600 nm
(2 eV) that are indicative for d-d transitions of reduced vanadium oxide phases were detected Some V2O5
phases may have formed that were reduced during the reaction The UV-Vis-DR spectra of subsequent
measurements of 77 wt VxOySBA-15 in propene showed a similar trend (Figure 7-14) The amount of
reduced V slightly increased after a second temperature programmed reaction in propene and oxygen
Conversely absorption bands below 600 nm were absent in the UV-Vis-DR spectra for 14 wt
VxOySBA-15 after propene oxidation of 4 h at 673 K Therefore the dehydrated tetrahedral species was
not reduced
Table 7-5 Product selectivities and propene conversion of 77 wt VxOySBA-15 at 673 K after 8-12 h (Figure 7-13 (right)) (A) dehydrated sample 653 K 1 h 20 O2 in He (B) hydrated sample (C) hydrated sample and 08 H2O in the reaction gas (D) ldquorecalcinedrdquo sample 843 K 12 h 20 O2 in He (rate [micromolpropene(gmiddots)] g=mv or mcat GHSV gas hour space velocity referred to a 08 ml reactor volume and a 20-75 mlmin volume flow)
Treat- Mass GHSV Conversion
[] Rate Selectivity [] C
balance
ment mg [h-1] C3H6 O2 mv mcat CO2 CO Aa Pa Ac Ar AcA ΣC2-
3 []
A 106 4500 44 95 118 9 20 29 15 9 1 17 8 50 995
B 108 5625 48 116 158 12 18 30 15 7 2 16 13 52 997
C 106 4500 41 123 110 8 20 32 14 6 1 17 10 48 1007
D 110 3000 40 203 69 5 20 31 15 6 1 19 7 48 995
135
0
4
1
2
3
5 051234
Energy [eV]
F(R
infin)
)
14 wt VxOySBA-15
0
15
5
10
5 051234
Energy [eV]
F(R
infin)
77 wt VxOySBA-15
reduced V
Figure 7-14 UV-Vis-DR spectra of dehydrated (623 K 20 O2 in He) 14 wt (right) and 77 wt (left) VxOySBA-15 recorded at 298 K after dehydration (solid line) and propene oxidation (dotted line) at 675 K for 4 h
727 Impact of the vanadium loading on the catalytic performance of VxOySBA-15
Figure 7-15 depicts the conversion and the selectivities obtained for all VxOySBA-15 samples during
temperature programmed reaction and during isothermal reaction in 5 propene and 5 oxygen at
673 K The sample mass was adjusted to the same vanadium content in the reactor All samples were
dehydrated in 20 O2 in helium at 653 K for 1 h before temperature programmed reaction in propene and
oxygen The same increase in propene conversion was detected for 14 wt and 41 wt VxOySBA-15
(Figure 7-15 left bottom) Higher 673 K the propene conversion of 77 wt VxOySBA-15 was
significantly increased compared to the propene conversion of 14 wt and 41 wt VxOySBA-15 For
lower temperatures the increase in propene conversion was similar to that of the lower loaded
VxOySBA-15 samples The corresponding products selectivities are depicted in Figure 7-15 (right) For
all vanadium loadings an increase in the formation of COx products was detected (CO2 and CO) with
increasing temperature Approximately the same evolution of the CO2 selectivity was detected for all
VxOySBA-15 samples Conversely the selectivity towards CO increased with increasing vanadium
loading Furthermore mainly acetaldehyde propionaldehyde acetone acrolein and acetic acid (C2 and C3
oxygenated products) were detected for all VxOySBA-15 samples
In contrast to 41 wt and 77 wt VxOySBA-15 only minor amounts of acetic acid were detectable for
14 wt VxOySBA-15 Conversely higher amounts of propionaldehyde were detected for 14 wt
VxOySBA-15 Except for the selectivity towards acrolein and acetaldehyde for 14 wt VxOySBA-15 a
significant drop in the C2 and C3 selectivity oxygenated products was observed with increasing
temperature For a more precise comparison the selectivity versus conversion plots were measured by
varying the initial flow rate of the sample gas stream (20-75 mlmin total volume flow ~ 08 ml reactor
volume 1500-5625 h-1 GHSV) These measurements were conducted after 8-12 h at 673 K to ensure that
no fast changes in the gas phase composition occurred Propene conversion and selectivities determined
were constant after that time for all samples (Figure 7-15 right)
136
500 600 7000
10
20
30
40 77 wt V 41 wt V 14 wt V
Con
vers
ion
[]
Temperature [K]
600 650 700 750
00
01
02
03
04
05
Temperature [K]
Sel
ectiv
ity
00
01
02
03
04
05
Sel
ectiv
ity
00
01
02
03
04
05
06
77 wt V
41 wt V
14 wt V
Sel
ectiv
ity
0 2 4 6 804
05
06
14 wt V 41 wt V 77 wt V
Sel
ectiv
ity O
xyge
nate
s
Time [h]
673 K
2
4
6
8
Con
vers
ion
[]
Figure 7-15 Left top Propene conversion and oxygenate selectivity during propene oxidation (5 O2 and 5 propene in He) of dehydrated 14-77 wt VxOySBA-15 under isothermal conditions at 673 K (right) Left bottom and right Propene conversion and product selectivity of dehydrated 14-77 wt VxOySBA-15 during the temperature programmed reaction in propene and oxygen (5 O2 and 5 propene in He) (symbols on right side circle=CO square=CO2 closed triangle up=acrolein open triangle up=acetaldehyde open triangle down=propionaldehyde half filled triangle= acetone closed star=acetic acid)
A decrease of oxygenate products with increasing propene conversion was observed for all samples
(Figure 7-16 top left) The sum selectivity towars all oxygenates was approximately 10 higher for 14
wt VxOySBA-15 than for 41 wt and 77 wt VxOySBA-15 The single selectivities towards the
products formed were compared at the same propene conversion The detailed results are listed in Table
7-6 and shown Figure 7-16 Interestingly the ratio of the reacted amount of oxygen and the reacted
amount of propene increased from 13 to 20 and 25 with increasing amount of vanadium on SBA-15
respectively Hence different reaction mechanism may proceed on the higher loaded VxOySBA-15
samples
137
Table 7-6 Product selectivities and propene conversion of dehydrated 14-77 wt VxOySBA-15 (653 K 1 h 20 O2) at 673 K after 8-12 h (1 rate [micromolpropene(gmiddots)] 2 GHSV gas hour space velocity referred to 08 ml reactor volume and 20-75 mlmin volume flow3 ball milled V2O5 + SBA-15 4 at 643 K 6 at 684 K)
Sample Mass GHSV2 Conversion []
Rate1 Selectivity [] C balance
[wt V] mg [h-1] C3H6 O2 mv mcat CO2 CO Aa Pa Ac Ar AcA ΣC2-3 []
14 106 3000 37 45 63 09 20 15 12 20 5 25 2 64 994
41 218 3000 36 65 59 24 20 26 17 7 2 23 5 54 999
77 60 5625 36 83 121 93 19 28 15 10 2 18 7 52 997
83 115 3000 26 62 41 32 22 29 16 3 1 20 8 49 1001
V2O54 20 3000 28 60 5 28 28 15 13 2 2 20 13 50 998
SBA-155 105 3000 - - - - - - - - - - - - -
BN6 460 3000 02 03 - 00 33 22 7 - - 22 - 40 100
0 2 4 6 8 10 12 14 16 18 2000
02
04
06
08
10
14 wt 41 wt 77 wt
Sel
ectiv
ity O
xyge
nate
s
Conversion []14 wt 41 wt 77 wt
0
2
4
6
8
10C
onve
rsio
n [
]
propene conversion oxygen conversion
0
1
2
3
[c298K (O
2 )-c633K (O
2 )][c298K (p)-c
633K (p)]
reacted oxygenpropene
14 wt 41 wt 77 wt00
01
02
03
04
05
Sel
ectiv
ity
V Content
CO2 CO acetaldehyde
propionaldehyde acetone acrolein acetic acid
14 wt 41 wt 77 wt00
02
04
06
Sel
ectiv
ity
CO2 acrolein
CO + acetaldehyde + propionaldehyde acetic acid + acetone
Figure 7-16 Oxygenate selectivity versus propene conversion determined after 8-12 h at 673 K (left top) for dehydrated 14-77 wt VxOySBA-15 Comparison of propene and oxygen conversions (right top) and product selectivities corresponding to the conversions shown (bottom) (Table 7-6)
138
The reaction products observed match the reaction products reported in the literature for propene
oxidation on VxOySiO2 samples (Table 7-1) Conversely the product selectivities detected here deviate
from the selectivities reported in the literature (Table 7-1) This difference in the product selectivities
observed may be explained by the different reaction temperatures used and the absence of a high content
of water in the reaction feed In the presence of a high water content in the gas phase typically high
amounts of acetone and acetic acid were reported [15159] If no additional water is introduced high
selectivities towards acetaldehyde acetone and acrolein were reported [16158160] Moreover minor
amounts of acrylic acid were reported [16] Comparing the selectivities towards the reaction products
formed showed that the same selectivity towards CO2 (20) was observed independent of the vanadium
content of the VxOySBA-15 samples The selectivities towards all other reaction products changed with
varying vanadium loading The selectivity towards C3 aldehyde oxygenates (acrolein propionaldehyde
and acetone) was enhanced for 14 wt VxOySBA-15 compared to higher loaded 41 wt and 77 wt
VxOySBA-15 With increasing vanadium loading the selectivity towards the partial degradation products
(C2 oxygenates and CO) increased The amounts of product observed may be explained in a similar way
to those of the selective oxidation of propane and propylene on bulk mixed metal oxide catalysts
(Bettahar et al [5] and Lin et al [3]) A simplified version of the possible reaction pathways (A B and
C) is given in Figure 7-17 Various reaction pathways for selective propene oxidation were discussed by
Bettahar et al [5] and Lin et al [3] Three types of aldehydes (acrolein (B) propionaldehyde (C) and
acetone (A)) seem likely to be formed from the partial oxidation of propene The corresponding alcohols
are possible intermediates [35] The partial degradation products acetaldehyde and acetic acid may form
from the consecutive oxidation of propionaldehyde and acetone
CH3-CH2-CH3
CH2=CH-CH3
CH2=CH-CH2-OH
CH2=CH-CHO + H2O
CH3-CH2-CH2-OH CH3-CH(OH)-CH3
CH3-CH2-CHO + H2O CH3-CO-CH3 + H2O
CH3-COOH + COx + H2O CH2=CH-COOH CH3-CHO + COx + H2O
COx + H2O
A B C
Figure 7-17 Main oxygenate products of the partial oxidation of propane and propene [35]
139
The highest selectivity towards acrolein (25) propionaldehyde (20) and acetone (5) was
determined for 14 wt VxOySBA-15 (Table 7-6 Figure 7-16) With the increase of the vanadium
content in the VxOySBA-15 samples a significant decrease of the propionaldehyde selectivity from 20
to 7-10 was observed This was accompanied by an increase in CO selectivity from 15 to 26-28 and
an increase of the acetaldehyde selectivity from 12 to 15-17 The other reaction products showed less
intense changes in selectivity with increasing vanadium content The selectivity towards acrolein
decreased from 25 to 18 and acetone selectivity decreased from 5 to 2 Conversely acetic acid
selectivity increased from 2 to 7 with increasing vanadium loading The proposed reaction scheme
was suitable to explain the observed product selectivities because the decreased acetone selectivity was
accompanied with an increased formation of acetic acid Furthermore a decrease of propionaldehyde
selectivity was accompanied by an increased formation of acetaldehyde and COx Only CO increased with
the decreasing propionaldehyde selectivity Therefore CO may be the major COx oxidation product from
the consecutive oxidation of propionaldehyde Additionally the CO observed may be formed from
oxidation of acetone to acetic acid because increase of CO selectivity was stronger than increase of
acetaldehyde selectivity In order to determine which reaction pathway of the propene oxidation was
present the selectivities towards propionaldehyde CO and acetaldehyde were combined (Figure 7-16
right bottom) These products represent reaction pathway C Acetone and acetic acid were selectivity
combined to represent reaction pathway A The combined selectivities towards path A and C together
with those towards acrolein (B) and CO2 are depicted in Figure 7-16 (right bottom) Independent of the
vanadium loading approximately the same selectivity was determined towards CO2 formation (20)
The combined selectivity towards path A showed a small increase (7-9) Interestingly the combined
selectivity towards reaction pathway C increased by 6 (47 to 53) whereas the acrolein selectivity
decreased by 7 (25 to 18) with increasing vanadium content Thus the higher vanadium content
mainly shifts the propene oxidation to reaction pathway C Furthermore the probability of a consecutive
reaction of the corresponding C3 aldehydes the formation of acetaldehyde and acetic acid increased with
increasing vanadium content of the VxOySBA-15 samples This increase in consecutive reactions
matches the increased oxygen conversion observed for 41 wt and 77 wt VxOySBA-15
Comparing the rates of propene oxidation per gram vanadium showed that no dependence on the surface
area was determined (Table 7-6) for VxOySBA-15 samples The reaction rate per gram vanadium was
approximately the same for 14 wt (highest surface area) and 41 wt VxOySBA-15 and was twice as
high for 77 wt VxOySBA-15 at 673 K (lowest surface area) Similarly to the rate of propene oxidation
the rate of acrolein formation increased by approximately 40 for 77 wt VxOySBA-15 compared to
41 wt and 14 wt VxOySBA-15 A similar observation was made by Zhao et al [15158] for
VxOyAl 2O3 but not for VxOySiO2 The increased activity of 77 wt VxOySBA-15 may be an effect of
the high density of vanadium centers on the surface or of the presence of small clusters of crystalline
vanadium oxide phases The latter was excluded because reduced vanadium phases were also observed
for 41 wt VxOySBA-15 Thus the high density of vanadium oxide centers on 77 wt VxOySBA-15
may explain the enhanced rate of propene oxidation
140
Additionally propene oxidation rate and product selectivities measured for bulk V2O5 are listed in Table
7-6 These values were not determined after several hours of reaction but from the temperature
programmed reactions using a constant rate (Figure 7-10 curve H and Figure 2-9 Chapter 2)
Apparently no significant changes in the product selectivities were obtained for V2O5 reference
compared to 77 wt VxOySBA-15 Hence similar reaction mechanisms may proceed on the surfaces of
V2O5 and of high loaded 41 and 77 wt VxOySBA-15 The reaction rate of propene oxidation per gram
vanadium was lower for bulk V2O5 This was explained by the higher amount of accessible vanadium
surface sites present on VxOySBA-15 samples
728 The influence of the oxygen and propene concentration on the catalytic performance of
VxOySBA-15
The measurements discussed above showed that similarly to propene oxidation on bulk mixed metal
oxides three reaction pathways can be distinguished for the propene oxidation on VxOySBA-15 catalysts
A second set of experiments intended to investigate the impact of various propene and oxygen
concentrations on the catalytic performance of 14 wt and 77 wt VxOySBA-15 Therefore the
samples were heated with a constant rate to 713 K Measurements were performed at 593 K 633 K
673 K and 713 K (plusmn 4 K) No pretreatment procedure was conducted prior to the temperature
programmed oxidation in propene and oxygen This resulted in an increase of 6 for the acetic acid
selectivity and a slight decrease (3) of the acrolein and propionaldehyde selectivities compared to the
sample pretreated at 653 K (1 h 20 O2 in He) The oxygen to propene ratio was varied from 5 to 05 by
changing the initial propene and oxygen concentrations (Vol O2 Vol propene ~ 25 55 755 105
575 525 and 51) The resulting conversions and selectivities (633 K) are depicted in Figure 7-18 For
clarity the reacted ratio of oxygen and propene is also shown Independent of the initial ratio the ratio of
reacted O2propene remained constant between 20 and 25 for 77 wt VxOySBA-15 and between 14
and 21 for 14 wt VxOySBA-15 Furthermore no drastic changes of the product selectivity were
observed With decreasing O2propene ratio a decrease of the CO selectivity from 33 to 25 was
observed This was accompanied by an increase of the acrolein selectivity from 14 to 18 and a
decrease of the propionaldehyde selectivity from 3 to 1 The change in selectivity for all other
products was below 1 Hence an excess of oxygen in the gas phase may mainly facilitate the oxidation
of acrolein to CO on 77 wt VxOySBA-15
141
479 207 205 156 107 071 0470
2
4
6
8
10
12
0
2
4
6
8
10
1277 wt VxO
ySBA-15 633 K
[c298K (O
2 )-c633K (O
2 )][c298K (p)-c
633K (p)]
conversion propene conversion oxygen reacted ratio oxygenpropene
Con
vers
ion
[]
Initial Ratio O2propene
479 207 205 156 107 071 04700
01
02
03
04
0577 wt V
xO
ySBA-15 633 K
Sel
ectiv
ity
Initial Ratio O2propene
CO2 CO acetaldehyde propionaldehyde
acetone acrolein acetic acid
489 211 209 161 107 073 0480
2
4
6
8
10
0
2
4
6
8
1014 wt V
xO
ySBA-15 633 K
conversion propene conversion oxygen reacted ratio oxygenpropene
[c298K (O
2 )-c633K (O
2 )][c298K (p)-c
633K (p)]
Con
vers
ion
[]
Initial Ratio O2propene
489 211 209 161 107 073 04800
01
02
03
0414 wt V
xO
ySBA-15 633 K
CO2 CO acetaldehyde propionaldehyde
acetone acrolein acetic acid
Sel
ectiv
ity
Initial Ratio O2propene
Figure 7-18 Propene and oxygen conversion reacted ratio of oxygenpropene and product selectivities for (hydrated) 14 wt and 77 wt VxOySBA-15 as a function of the initial oxygen to propene ratio in the reaction gas at 633 K (Vol O2 Vol propene ~ 25 55 755 105 575 525 and 51)
142
The selectivity towards acrolein (25) remained constant with decreasing O2propene ratio for 14 wt
VxOySBA-15 (Figure 7-18) Conversely the selectivity towards propionaldehyde increased This
increase was accompanied by a decrease of the CO2 selectivity from 21 to 15 and of the CO
selectivity from 17 to 12 In the case of 14 wt VxOySBA-15 an oxygen excess may facilitated the
deeper oxidation of propionaldehyde to CO and CO2 These results suggest that an excess of oxygen in
the reaction mixture enhances the content of unselective oxygen species These oxygen species may react
with the C3 aldehydes to form COx The probability that acrolein will be oxidized to COx seems to be
lower than for the oxidation of propionaldehyde This would explain that the acrolein selectivity
decreases on 77 wt VxOySBA-15 where only low amounts of propionaldehyde were detected
According to Grzybowska-Świerkosz [162] gaseous or chemisorbed oxygen species (O2 O2- or O-) may
be responsible for the deep oxidation of propene to COx products
Reaction orders determined for propene and oxygen indicated that the formation of acrolein was mainly
independent of the oxygen content Taking a formal kinetic reaction approach the reaction orders of
propene (m) and oxygen (n) can be obtained from the acrolein reaction rate (Equation 61) Keeping the
concentration of one reactant constant allows determining the reaction order of the other reactant by
measuring the reaction rate of acrolein as a function of its concentration
)()()( 2 propenecOckacroleinr mneff sdot= (71)
rarr [ ] [ ] [ ] [ ])(ln)(lnln)(ln 2 propenecmOcnkacroleinr eff ++= (72)
In the case of a constant oxygen concentration the reaction order for propene was calculated from the
linear function 63 refined to the experimental data The corresponding plots depicted in Figure 10-7 and
Figure 10-8 in the Appendix
[ ] [ ] [ ])(lnln)(ln propenecmkacroleinr eff += (73)
The reaction orders were determined at 633 K to ensure differential conversions below 10 for both
VxOySBA-15 samples Reactions orders of m ~ 05 and n ~ 0 were obtained for 14 wt VxOySBA-15
A slight increase to n = 02 was observed for 77 wt VxOySBA-15 which may be due to the stronger
influence of electrophilic oxygen Similar reaction orders were determined by Zhao et al for VxOySiO2
[158] They interpreted the reaction order of zero for oxygen as an indicator that only V5+ vanadium
centers are the active site Reduced crystalline V2O5 phases were excluded as active centers [158] The
reaction order of 05 for propene cannot be explained unambiguously Typically a reaction order of 05
indicates that the molecule dissociates at the catalyst surface This may be indicative for the necessary H
abstraction step that is discussed in the process of the activation of the propene molecule for further
oxidation to acrolein However this interpretation is highly speculative without further investigating
different kinetic models Nevertheless the reaction order of zero for oxygen indicates that formation of
acrolein was mainly independent of the oxygen content and a fast re-oxidation of the vanadium centers
during catalytic propene oxidation
143
729 The influence of the oxygen to propene ratio on the structure of VxOySBA-15
A reaction order of zero for oxygen in the selective oxidation of propene to acrolein indicated a fast
reoxidation of the vanadium centers involved Therefore the majority of vanadium centers should have
an average oxidation state of V5+ Temperature programmed UV-Vis-DRS measurements were conducted
with 14 wt and 77 wt VxOySBA-15 using various oxygen and propene concentrations to investigate
the major vanadium oxide phase under these conditions The samples were dehydrated at 554 K for 1 h in
20 O2 in He prior to temperature programmed reaction in propene and oxygen The maximum
temperature applied was 626 K Propene to oxygen ratios of 15 55 51 and 50 were investigated The
resulting UV-Vis-DR spectra for 14 wt and 77 wt VxOySBA-15 after reaction are depicted in
Figure 7-19 A significant increase in intensity in the range of 05-30 eV was determined in the UV-Vis-
DR spectra without oxygen in the gas phase during the reaction Absorption bands in this region are
indicative of reduced vanadium centers For all other propene to oxygen ratios approximately the same
UV-Vis-DR spectra were recorded This was even the case for the 15 oxygen to propene ratio UV-Vis
absorption bands below 30 eV were absent and characteristic UV-Vis absorption bands of V5+ tetrahedral
vanadium centers were observed above 3 eV This corroborated that independently of the vanadium
loading the majority of the vanadium centers are V5+ centers A more detailed discussion about the
reduced vanadium oxide state and redox properties of VxOySBA-15 under reaction conditions will be
given in the next chapter
0
15
5
10
5 051234
Energy [eV]
F(R
infin)
77 wt VxOySBA-15
0
4
1
2
3
5 051234
Energy [eV]
F(R
infin)
14 wt VxOySBA-15
Figure 7-19 UV-Vis-DR spectra of dehydrated 14 wt (right) and 77 wt VxOySBA-15 (left) recorded at 298 K after temperature programmed reaction in various oxygenpropene mixtures in He at 636 K after dehydration 554 K 20 O2 (dotted grey) 55 (dotted red) 15 (dashed black) 51 (dashed and dotted blue) and 05 (solid black)
144
73 Concluding remarks on the catalytic performance and the structural evolution of VxOySBA-15 during catalytic propene oxidation
731 Structural evolution of VxOySBA-15 during propene oxidation
XAFS measurements and Raman experiments showed that mainly the dehydrated VxOySBA-15 structure
was present during propene oxidation Compared to the structure obtained after dehydration in 20 O2 a
wider V-V distance distribution was determined from XAFS refinements of 41 wt and 77 wt
VxOySBA-15 after propene oxidation Conversely XAFS measurements showed that the V-V interaction
or V-Si interaction increased for 14 wt VxOySBA-15 A structural transformation comparable to the
dehydration process described in Chapter 6 was observed when hydrated VxOySBA-15 samples were
used for catalytic measurements Raman measurements showed that carbonaceous species were formed
below 573 K during temperature programmed reaction of hydrated VxOySBA-15 in propene oxidizing
conditions For 77 wt VxOySBA-15 thermally treated in 20 O2 at 768 K for 8 h a significant change
compared to the dehydrated state was observed in the XANES spectra and in the FT(χ(k)k3) after
propene oxidation This change may be caused by a strong distortion of the dehydrated ldquoordered V2O7rdquo
structure The average vanadium oxidation state was V5+ for all treatments employed NMR
measurements showed that on dehydrated 77 wt VxOySBA-15 (573 K 1 h 20 O2 in He) no Si-OH
centers were detected after propene oxidation at 673 K (5 O2 and 5 propene in He 1 h)
The characteristic absorption band in the UV-Vis-DR spectra of dehydrated VxOySBA-15 was blue
shifted under propene oxidizing conditions For 77 wt VxOySBA-15 small amounts of reduced
vanadium oxide phases were present under catalytic conditions These were ascribed to partially reduced
V2O5 nano particles present on ldquoagedrdquo VxOySBA-15 samples The blue shift observed occurred for all
VxOySBA-15 samples in the range of 500-600 K In this temperature region an increase of propene
conversion propionaldehyde and acrolein formation was observed compared to a repeated measurement
The onset of catalytic activity (aldehyde formation) was in the range of 500-520 K The blue shift of the
absorption band under propene oxidation conditions (gt 550 K) was observed independent of the initial
VxOySBA-15 structure and the vanadium loading The blue shift may be caused by a reaction of V-OH
groups to Si-O-V groups This reaction would be accompanied by a decrease of Si-OH centers which
matches the decrease of Si-OH centers detected by NMR
Changes in the V-OH and Si-OH concentration were also reported for other oxidation reactions A similar
decrease of Si-OH centers accompanied with a similar blue shift in the UV-Vis-DR spectra was observed
by Gao et al [23] during catalytic methanol oxidation using a 1 VxOySiO2 catalyst Launay et al [26]
observed a decrease of the V-OH IR absorption bands at ~3660 cm-1 on a 21 VxOySiO2 catalyst during
methane oxidation Furthermore Launay et al [26] reported an increased number of V-OH species that
may lead to a better catalytic activity in the methane oxidation to formaldehyde The results reported in
145
the literature imply that the V-OH bond may be involved in the oxidation of propene Li et al [159]
reported that such V-OH centers (ascribed to Broslashnstedt acid centers) are the major active site for the
oxidation of propene to acetone in the presence of water They proposed a ldquoV-O-CH-(CH3)2rdquo as
intermediate [159] Such an intermediate suggests that the V-OH group attacks the C=C double bond of
the propene molecule Moreover the decrease of the Si-OH groups during propene oxidation indicates
reduced vanadium centers left after the desorption of acetone may react with the Si-OH centers to Si-O-V
bonds Another interpretation for the decrease of Si-OH centers may be that not the V-OH bond but the
V-O-V bond or a V-(OH)-V bond reacts with the propene molecule In this case the blue shift in the UV-
Vis-DR spectra would be considerably smaller for low loaded 14 wt VxOySBA-15 than for higher
loaded 41 wt and 77 wt VxOySBA-15 However on 14 wt VxOySBA-15 a lower number of
V-O-V bonds was present and the blue shift increased with decreasing vanadium content Therefore V-
OH bonds seem to be involved in the formation of V-O-Si bonds during propene oxidation
732 Catalytic performance of VxOySBA-15 during propene oxidation
Nevertheless more acrolein and propionaldehyde than acetone were detected in the temperature range
where the blue shift in the UV-Vis absorption spectra occurred (Figure 10-6) The higher concentration
of C3 aldehydes indicates a complex reaction of propene with VxOySBA-15 The formation of acetone
and propionaldehyde may be explained by the attack of electrophilic oxygen on the C=C double bond in
propene which would result in an adsorbed [OC3H6] that is negatively charged In contrast the formation
of acrolein is generally described by a nucleophilic attack of Mn+-O2- to the propene molecule According
to Grzybowska-Świerkosz [162] this redox or ldquoMars van Krevelen mechanismrdquo is started by H
abstraction from the methyl group of propene This results in the formation of a π-allyl species that is
positively charged The π-allyl species is then attacked by the nucleophilic Mn+-O2- center A second H
abstraction results in the formation of acrolein Subsequently H atoms are transferred to adjacent Mn+-O2-
centers that form M(n-1)+-OH centers The reduced metal sites are reoxidzied by gaseous oxygen The
formation of propionaldehyde and acetone from propene via a electrophilic mechanism and the formation
of acrolein via a nucleophilic mechanism was calculated by Li et al [163164] for a V4O11- cluster In the
case of acrolein and propionaldehyde two vanadium centers were involved The fact that the acrolein
selectivity remained relatively constant with increasing temperature suggests that acrolein may be formed
by the nuclephilic mechanism with π-allyl stabilization (Figure 7-15 right) The selectivities towards all
other oxygenates decreased significantly with increasing temperature because the impact of electrophilic
oxygen from the gas phase increases at elevated temperature
Nevertheless acrolein was not the major product of catalytic propene oxidation on VxOySBA-15
According to Figure 7-17 reaction pathway C the oxidation to propionaldehyde and acetaldehyde was
enhanced on VxOySBA-15 samples Thus more reactive electrophilic than nuclephilic oxygen species
were present The origin of electrophilic oxygen may be a consequence of the re-oxidation of reduced
vanadium centers with molecular oxygen Recently Kontratenko et al [165] reported that Vn+middotmiddotmiddotOmiddot-
species are detectable by EPR after the re-oxidation of reduced vanadium centers on VOxMCM41 These
146
Vn+middotmiddotmiddotOmiddot- oxygen species reacted rapidly with propene [165] Using highly disperse VxOySiO2 and bulk
VxOy vanadium oxides Kontratenko et al [165166] showed that the selectivity towards propene was
improved by using N2O instead of oxygen in the reaction of propane to propene Hence more
nucleophilic oxygen formed during the re-oxidation of reduced VxOyMCM41 with N2O than with O2
[165] Thus future investigations with other oxidizing agents like N2O which may enhance the
selectivity of acrolein during propene oxidation on VxOySBA-15 catalysts would be desirable
733 Impact of vanadium loading on the catalytic performance of VxOySBA-15
The reaction rate of propene conversion and acrolein formation per gram V was enhanced for 77 wt
VxOySBA-15 in contrast to 14 wt and 41 wt VxOySBA-15 Conversely the vanadium oxide
structure of the dehydrated 41 wt and 77 wt VxOySBA-15 samples showed no distinct differences
during temperature programmed reaction in propene However the arrangement of [V2O7] units may be
slightly different on 77 wt VxOySBA-15 from that on 41 wt VxOySBA-15 This may not be
resolved with the spectroscopic methods used It seems likely that the local vanadium density on 77 wt
VxOySBA-15 may be higher and areas with high and low vanadium dispersion may exist A higher
vanadium density would imply that more disperse vanadium centers than the proposed [V2O7] dimers
may be involved in the catalytic process More than two vanadium centers seem likely to facilitate redox
mechanism discussed above which may explain the increased acrolein formation on 77 wt
VxOySBA-15 A similar increased acrolein formation was reported by Zhao et al [16] for the oxidation
of propene to acrolein over vanadium oxides supported on Al2O3 with high vanadium loading but not for
vanadium oxides supported on SiO2 Nevertheless an increased number of adjacent [V2O7] units may
explain the increased activity of 77 wt VxOySBA-15 Furthermore the decreasing activity in repeated
or long term measurements may be explained by a different arrangement of [V2O7] units For instance V-
(OH)-V bonds between the [V2O7] units may exist that decrease with time In contrast to acrolein
formation vanadium loading of VxOySBA-15 samples had only minor effects on the observed
selectivities towards the different reaction pathways (Figure 7-17) Increasing the vanadium content on
SBA-15 facilitated only the consecutive oxidation of the C3 aldehydes Hence decreasing the vanadium
loading of VxOySBA-15 does not change the basic reaction pathways of propene oxidation on
VxOySBA-15
734 Selective oxidation of propene to acrolein on isolated ldquoVO4rdquo centers
The selective oxidation towards acrolein was observed with 18-25 selectivity independent of the
vanadium loading Regarding the concept of ldquosite isolationrdquo proposed by Grasselli et al [167] at least two
available oxygen sites must be present for the stoichiometric reaction of propene to acrolein and water
Moreover the reaction involves two hydrogen abstraction steps from the methyl group of the propene
which requires at least two availablerdquoV-Ordquo functionalities An ordered dimeric [V2O7] structure was
proposed for higher loaded 41 wt and 77 wt VxOySBA-15 and thus the formation of acrolein seems
feasible Conversely an isolated tetrahedral [VO4] structure may be present on 14 wt VxOySBA-15
147
because of the high UV-Vis edge energy of 39 eV In the case of isolated [VO4] units the oxygen sites
involved in the reaction must originate from the same vanadium center Therefore different ldquoV-Ordquo bonds
located at the same vanadium center must be involved Zhao et al [158] proposed the participation of the
V-O-Si bond in the oxidation process of propene However the low reducibility of 14 wt
VxOySBA-15 after the catalytic reaction observed in this work (Chapter 8) indicates a high strength of
the V-O-Si bond Thus this bond may not be involved in the reaction process In consequence of an
inactive V-O-Si bond different sources of ldquoV-Ordquo must be present No clear evidence about the nature of
this source can be given based on the results obtained in this work but two options seem likely The high
UV-Vis edge energy of 39 eV after propene oxidation clearly points to isolated vanadium species In this
case the number of V-O-Si bonds must be lower than 3 to explain the reaction without a rupture of
V-O-Si bonds in the case of isolated vanadium centers Therefore other ldquoV-Ordquo sites may be involved in
the reaction eg V-O- V=O or V-OH groups Another explanation may be that the proposed isolated
vanadium tetrahedrons are in spatial proximity similar to dimeric vanadium centers proposed for 77 wt
VxOySBA-15 This allows a reaction mechanism involving two vanadium sites eg two V=O sites This
assumption is corroborated by the fact that the dimeric [V2O7] model structure was suitable to describe
the experimental Fourier transformed EXAFS obtained for 14 wt VxOySBA-15 after reaction in
propene and oxygen The latter explanation is preferred here because more than one vanadium center
may enable a better electron transfer during the catalytic reaction
735 Elucidation of structure-activity correlations with respect to other model systems
The observed selectivities towards the oxygenated products of 77 wt VxOySBA-15 were not
significantly different from those obtained for bulk V2O5 Therefore similar active centers may be present
on the surface of VxOySBA-15 and of bulk V2O5 catalysts Moreover a significant influence of the
support material was excluded Compared to other supports (eg Al 2O3) SBA-15 exhibits only few weak
acidic centers that would interact with the rather basic propene molecule [22168] Mostly an increase of
the acetic centers was observed if vanadium oxides were added to the SiO2 supports Assuming similar
active centers for V2O5 and high loaded VxOySBA-15 may explain the small differencs in the
selectivities observed between bulk and supported vanadium oxides Regarding the structure activity
correlations of more complex mixed metal catalysts eg MoVTe this result indicates that structural
complexity of vanadium sites in selective propene oxidation may play only a minor role and that chemical
complexity may be more important Hence the presence of different metal sites will be required to
enhance the catalytic performance of vanadium This is in contrast to results reported for supported
molybdenum model catalysts For MoxOySBA-15 [8] and MoO3VGCNF [9] catalysts an increased
catalytic performance was observed for the oxidation of propene towards acrolein For these molybdenum
systems the structural complexity of the molybdenum oxides was more important than the chemical
complexity In the next stage of model catalysts supported mixed metal oxides systems should be
investigated in more detail to reveal the impact of chemical and structural complexity on the catalytic
performance The results obtained for VxOySBA-15 model catalysts indicate that addition of vanadium
148
sites to other supported transition metal host structures will only improve acrolein selectivity if the
vanadium sites are in cooperation with the transition metal oxide structure during catalytic reaction
Recently heteropolyoxomoybdates containing vanadium supported on SBA-15 were described [10]
These systems seem promising to derive further structure functionality relationships addressing the role
of vanadium and molybdenum during selective propene oxidation
74 Summary
In situ UV-Vis-DRS XAS and Raman measurements showed that the dehydrated VxOySBA-15
structure mainly persisted under catalytic propene oxidizing conditions Moreover the dehydrated
VxOySBA-15 structure was observed even when hydrated VxOySBA-15 samples were used for catalytic
measurements or when small amounts of water vapor (08 Vol) were added to the reaction mixture
Apparently the SBA-15 support stabilizes the dehydrated VxOySBA-15 structure under catalytic
conditions Temperature programmed reaction (5 propene and 5 oxygen in He) on hydrated
VxOySBA-15 samples showed that a structural transformation (dehydration) proceeded similar as
observed under dehydrating conditions in 20 O2 in He A wider V-V distance distribution was
determined for 41 wt and 77 wt VxOySBA-15 from XAFS measurements after propene oxidation
Hence a small decrease of the structural order may have occurred during propene oxidation Conversely
an increase of the V-V contributions or V-Si contributions to the FT(χ(k)k3) was observed for 14 wt
VxOySBA-15
The onset of catalytic activity was in the range of 500-520 K The onset was accompanied by a blue shift
of the UV-Vis edge energy The blue shift may be caused by the formation of additional V-O-Si bonds to
the SBA-15 support Therefore V-OH bonds may have reacted with the propene molecule and residual
Si-OH groups may have formed V-O-Si bonds during the re-oxidation of the reduced vanadium centers
The V-O-Si bond formation was an irreversible process The blue shift of the UV-Vis edge energy in the
temperature range of 500-600 K correlated with an increased formation of oxygenated reaction products
A comparable blue shift and increased aldehyde formation was not observed in repeated measurements
During the catalytic oxidation of propene mainly the following products were observed acrolein
propionaldehyde acetaldehyde acetone acetic acid CO and CO2 Three parallel reaction pathways were
suggested from these reaction products The main reaction pathway proceeds via the formation of
propionaldehyde and acetaldehyde The second reaction pathway proceeds via the formation of acrolein
A third reaction pathway with low selectivity proceeds via the formation of acetone and acetic acid CO
and CO2 formed cannot be ascribed to a specific reaction pathway The different kinds of reaction
products formed suggest that nucleophilic and electrophilic oxygen species may be present during
catalytic propene oxidation on VxOySBA-15
149
No significant differences in catalytic performance were observed using dehydrated (653 K 1 h 20 O2
in He) and hydrated VxOySBA-15 samples Nevertheless a slight increase of acetone and acetic acid
fomation was observed for catalytic measurements that were performed using the hydrated VxOySBA-15
samples Hence more V-OH groups than present on dehydrated VxOySBA-15 may form during
decomposition of hydrated VxOySBA-15 in propene and oxygen
The catalytic activity of 77 wt VxOySBA-15 recalcined for 12 h at 843 K was significantly lower A
strong structural distortion and an increased oxygen conversion were detected for this sample The
structural disorder of recalcined 77 wt VxOySBA-15 was ascribed to missing HO-Si binding sites for
vanadium centers that interacted with the propene molecule
Vanadium loading of VxOySBA-15 had only a minor effect on the oxygenate selectivities determined
The selectivity towards acrolein and propionaldehyde decreased and the selectivity towards acetaldehyde
acetic acid and CO increased with increasing vanadium loading on SBA-15 Furthermore the
consecutive oxidation of the C3 aldehydes increased with increasing vanadium loading The oxygenate
selectivities determined for 77 wt VxOySBA-15 resembled those of bulk V2O5 Therefore similar
active vanadium oxide centers may be present on VxOySBA-15 and V2O5 VxOySBA-15 showed no
reduction under catalytic conditions in contrast to bulk V2O5
150
151
8 Investigation of reducibility and re-oxidation of
VxOy-SBA-15 catalysts
81 Introduction
Catalytic measurements of VxOySBA-15 showed that the average valence of the vanadium oxide remains
V5+ under catalytic conditions Similar observations were reported for MoxOySBA-15 catalysts [10]
MoxOySBA-15 catalysts showed a low reducibility even under reducing conditions in propene and H2
(773 K) The low reducibility (Mo6+ to Mo58+) was assigned to a stabilizing effect of the SiO2 support
[10] However in the previous chapter absorption bands at wavelengths longer than 500 nm observed
during the temperature programmed reaction with 5 propene at 636 K give rise to the conclusion that
the disperse vanadium oxide phase is reducible with propene at lower temperatures A reduction of the
vanadium oxide phase was observed for high and low loaded VxOySBA-15 respectively The
observation of reduced disperse vanadium oxide phases on SiO2 is in contrast to results reported by Zhao
[158] Zhao concluded from Raman and UV-Vis-DR measurements (3 propene 623 K) that disperse
tetrahedral [VO4] species present on SiO2 were not reduced with propene Only a reduction of V2O5 nano
particles present at higher loadings occurred [158] Except for the work by Zhao [158] no report was
found in the literature that addresses the reduction of VxOySiO2 with propene Ovsitser et al [29]
reported for VxOyMCM that under reducing conditions in hydrogen and propane at 773 K absorption
bands in the range of 400-800 nm appear in the UV-Vis-DR spectra These were assigned to reduced
vanadium centers They determined a fast re-oxidation (~ 5 s) of the reduced vanadium centers and a
slower ( ~ 5 min) reduction kinetic from isothermal experiments at 773 K (change of propane and oxygen
containing gas atmospheres) Using oxygen as oxidizing agent they observed fully oxidized vanadium
centers under propane oxidizing conditions [29] Nevertheless most reports in the literature describe the
formation of reduced vanadium centers on VxOySiO2 with a disperse vanadium oxide structure In these
investigations the reduction of the vanadium centers was conducted using hydrogen or vacuum
[22242544] It was proposed from H2-TPR measurements combined with ESR measurements (up to
1200-1300 K) that the vanadium centers in VxOySiO2 can be reduced to V4+ and V3+ [25] For samples
which were reduced at lower temperatures Du et al [22] concluded from XAFS measurements that only
V4+ centers are present after reduction in hydrogen at 773 K Venkov et al [44] inferred using FTIR
investigations with CO and NO as probe molecules that V3+ and V4+ with two different coordinative
vacancies are present after reduction in H2 and after evacuation Different types of V4+ centers were
reported by Berndt et al [24] They discussed the presence of V4+Ox centers (two different sites in and
outside the pores of the MCM material) and acidic V4+5+O(OH)x(OSiequiv)3-x centers [24]
152
In summary no clear picture of the reduced vanadium centers on VxOySiO2 was obtained from reports
that discuss the role of reduced vanadium centers on silica material Therefore it was intended to further
elucidate the valence state and the structure of the VxOySBA-15 model catalysts under changing
oxidative (oxygen and propene together with oxygen) and reducing (propene) conditions
153
82 Results and discussion
821 Local structure of VxOySBA-15 under reducing conditions
UV-Vis-DRS investigations (Chapter 729 Figure 7-19) showed that temperature programmed
treatment of dehydrated 14 wt and 77 wt VxOySBA-15 in propene resulted in the formation of
reduced vanadium oxide phases on the SBA-15 support In situ XAS measurements were conducted to
determine the nature of the reduced vanadium oxide phases Dehydrated 77 wt VxOySBA-15 was
treated in 5 propene in He at 673 K for 1 h and 723 K for 1 h The V K edge XANES χ(k)k3 and
FT(χ(k)k3) of 77 wt VxOySBA-15 and of the bulk vanadium oxide references V3O7 VO2(B) and
V2O3 are depicted in Figure 8-1 Compared to the XANES spectrum recorded after dehydration a change
of the XANES structure a shift of the absorption edge and a significant decrease of the pre-edge peak
height from 073 to 032 (673 K) and 020 (723 K) were observed (Figure 8-1 left) The XANES features
after reduction of dehydrated 77 wt VxOySBA-15 at 673 K resembled those of the VO2(B) reference
Thus indicating a reduction towards V4+ The intensity of the first XANES feature increased with
increasing temperature (723 K) and the pre-edge peak height decreased to 020 In addition to V4+ V3+
centers may have formed After reduction of 77 wt VxOySBA-15 no similarity of the χ(k)k3 and the
FT(χ(k)k3) with that of bulk references was observed (Figure 8-1 middle right) The oscillation in the
χ(k)k3 of reduced 77 wt VxOySBA-15 was strongly damped compared to that of dehydrated 77 wt
VxOySBA-15
0
20
40
4 6 8 10
χ(k)
k3
3
A
B
C
D
E
F
k [Aring-1]
0
2
4
6
55 555 56
Nor
mal
ized
Abs
orpt
ion
Photon Energy [keV]
A
B
C
D
E
F
073
020
032
049
030
012
01
02
03
04
05
0 2 4 6
FT
(χ(k
)k3 )
R [Aring]
A
B
C
D
E
F
Figure 8-1 V K edge XANES spectra (left) χ(k)k3 (middle) and FT(χ(k)k3) (right) recorded at 298 K (A) dehydrated 77 wt VxOySBA-15 (623 K 20 O2) (B) dehydrated 77 wt VxOySBA-15 (623 K 20 O2) after reaction in 5 propene in He at 723 K (C) dehydrated 77 wt VxOySBA-15 (623 K 20 O2) after reaction in 5 propene in He at 673 K (D) V3O7 (E) VO2(B) (F) V2O3
154
Variation in the positions of the oscillation in the χ(k)k3 of reduced 77 wt VxOySBA-15 indicate
structural transformations compared to the dehydrated 77 wt VxOySBA-15 structure This
interpretation was corroborated by the damped FT(χ(k)k 3) of 77 wt VxOySBA-15 after reduction
(Figure 8-1 right) An overall reduction of the FT(χ(k)k3) of reduced 77 wt VxOySBA-15 suggests a
strong structural distortion The maximum of the first signal in the FT(χ(k)k3) due to V-O interactions
shifted to longer distances The second signal in the FT(χ(k)k3) increased with increasing temperature
This signal cannot be assigned unambiguously to a specific contribution (V-V V-O V-Si) but the
increase implies structural changes in the second coordination sphere of the absorbing vanadium centers
during reduction The low similarity of the χ(k)k3 and FT(χ(k)k3) of 77 wt VxOySBA-15 after
reduction with those of bulk vanadium oxide references with 5- and 6-fold coordination of the vanadium
atoms showed that the reduced vanadium centers in 77 wt VxOySBA-15 maintained their tetrahedral
coordination A XANES analysis using the pre-edge peak area and centroid energy (explained in more
detail in Chapter 524) according to Chaurand et al [94] was employed for a more precise identification
of the coordination and the oxidation state of the vanadium centers The pre-edge peak area of V2O5 was
normalized to the same value (080) as reported by Charaund et al [94] The pre-edge peak areas of all
other samples measured in this work were referred to the normalized V2O5 pre-edge peak area
(parameters are listed in Table 10-4 appendix) The resulting graph is depicted in Figure 8-2 The
parameters reported by Charaund et al [94] were slightly different compared to the parameters
determined here This effect was assigned to lower resolution in the XANES region in this work
35 40 45 50 55 6000
02
04
06
08
10(P
y) V5++(O
h) V4+
(Py) V4+
(Py) V5+
(Oh) V4+
(Oh) V5+
(Oh) V3+
V5+
square pydramids
V5+
distorted octrahedrons
V5+
chains of tetrahedrons
V5+
isolated and dimeric tetrahedrons
V5+
square pydramids + tetrahedrons
hydrated 77 wt VxO
ySBA-15
dehydrated 77 wt VxO
ySBA-15
Chaurand et al
dehydrated 77 wt VxO
ySBA-15
673 K 5 propene
dehydrated 77 wt VxO
ySBA-15
723 K 5 propene
V3+ V4+ V46+ vanadium oxidesNor
mal
ized
Pre
-edg
e P
eak
Are
a
Centroid Energy [eV]
(Td) V5+
Figure 8-2 Normalized pre-edge peak areas (referred to the area of V2O5 that was normalized to 080) versus centroid energy of vanadium reference compounds and 77 wt VxOySBA-15 after various treatments Additionally the values reported by Chaurand et al [94] are shown Dashed rings refer to the coordination of absorbing vanadium centers (Oh = octrahedral Py = pyramidal Td = tetrahedral) Detailed parameters are listed in Table 10-4 in the appendix
155
Comparing the values depicted for V5+ references a good identification of the coordination of the
absorbing vanadium centers was possible from the horizontal energy shift of the centroid energy Even a
differentiation of various connectivities was feasible In the case of tetrahedral V5+ references a shift of
25 eV was observed between the centroid energy of references built of isolated and dimeric tetrahedrons
and references that are comprised of chainlike tetrahedrons An energy shift of 05 eV was observed
between the centroid energy of V2O5 (layered arrangement of square pyramids) and [V2O6] vanadate
references (chains of square pyramids) A decrease of the average valence resulted in a decreasing pre-
edge peak area and energy shift The normalized pre-edge peak areas determined for reduced
VxOySBA-15 were smaller than those of vanadium oxide references with average vanadium valence
lower than +5 Hence mainly V4+ centers may be present after reduction at 623 K After reduction at
723 K a mixture of V4+ and V3+ may be present Tetrahedral V4+ references were not available in this
work which made the assignment of coordination and average valence difficult Figure 8-2 The centroid
energies of 45 eV and 40 eV suggest that no octahedral V4+ vanadium oxide centers (55 eV) were
present in reduced 77 wt VxOySBA-15
In situ investigations were employed to determine the temperature range where the reduction of vanadium
centers of dehydrated 77 wt VxOySBA-15 occured Figure 8-3 depicts the evolution of the V K edge
XANES spectra and the evolution of the water ion current (me 18) during temperature programmed
reduction in 5 propene in He from 298 K to 723 K A small increase of the ion current me 18 was
observed in the range of 300-330 K In this range no structural changes were observed in the XANES
spectra A change in the XANES structure and the pre-edge peak height was observed above 520 K The
decrease of the pre-edge peak height was correlated with the formation of water in the gas phase (Figure
8-3 right) Therefore the decreasing pre-edge peak height was due to the reduction of the vanadium
oxide phase on SBA-15 The water ion current (me 18) remained constant above 650 K indicating that
the reduction was not completed The onset of reduction of 77 wt VxOySBA-15 at 520 K coincidenced
with the onset of catalytic activity during the temperature programmed reaction in 5 propene and 5 O2
(Chapter 7)
00
05
10
55
555
56
300400
500 600
700
Photon Energy [keV]Temp [K]
Nor
mal
ized
Abs
orpt
ion
02
04
06
8E-012
9E-012
1E-011
11E-011
12E-011
300 400 500 600 700
Nor
mal
ized
Pre
-edg
e P
eak
Hei
ght
Temperature [K]
Ion Current m
e 18 (H2 O
) [A]
Figure 8-3 V K edge XANES spectra (left) and pre-edge peak height and water ion current me 18 (right) during the temperature programmed reaction of dehydrated (623 K 20 O2 in He) 77 wt VxOySBA-15 in 5 propene in He (298-723 K 5 Kmin)
156
Figure 8-4 (left) depicts the in situ UV-Vis-DR spectra of dehydrated 77 wt VxOySBA-15 during the
temperature programmed reaction in 5 propene With increasing temperature a decrease of the
maximum intensity at 310 nm together with a wavelength shift of the absorption maximum to 295 nm
was observed An increase in intensity was observed in the UV-Vis-DR spectra for wavelengths longer
than 400 nm An increase at longer wavelength is indicative of d-d transitions of reduced vanadium
species The blue shift of the absorption band located at ~ 300 nm together with the increasing d-d
absorption bands indicated a reduction of the vanadium oxide species In order to follow the formation of
reduced vanadium centers with increasing temperature the wavelength at 700 nm was chosen for
monitoring For normalization the intensity at 700 nm was referred to the maximum intensity at
approximately 300 nm in the UV-Vis spectra recorded at 298 K after dehydration in 20 O2 The
normalized intensity at 700 nm was denoted as ldquorelative F(Rinfin) at 700 nmrdquo The evolution of relative
F(Rinfin) at 700 nm and the water ion current me 18 are shown in Figure 8-4 (right) An increased water
formation was observed between 300 and 340 K similar to the in situ XAS measurements In this
temperature range no change in the UV-Vis-DR spectra was detected A moderate increase in intensity
lt 3 at 700 nm occured for temperatures in the range of 340-520 K At temperatures higher than 520 K
a pronounced increase of up to 15-20 in relative F(Rinfin) at 700 nm was detected in the UV-Vis-DR
spectra This increase was accompanied by an increased formation of water The rising intensity above
520 K was ascribed to the formation of reduced vanadium centers considering the results obtained from
the XAS measurements The small increase in intensity at 700 nm below 520 K may be due to the
reduction of the residual V2O5 phase or the formation of carbonaceous species
300 400 500 600 700 800
0
5
10
15
700 nm
dehydrated VxO
ySBA-15 298 K
675 K 5 propene
F(R
infin)
Wavelength [nm]
300 350 400 450 500 550 600 650
0
5
10
15
Rel
ativ
e F
(Rinfin)
(700
nm
) [
]
Temperature [K]
6x10-12
7x10-12
8x10-12
9x10-12
1x10-11
1x10-11
Ion Current m
e 18 (H2 O
) [A]
A
Figure 8-4 In situ UV-Vis-DR spectra (left) and absorption at 700 nm (relative to the maximum intensity determined in the absorption spectra at 298 K after dehydration) together with the water ion current me 18 (right) during the temperature programmed reaction of dehydrated (623 K 20 O2 in He) 77 wt VxOySBA-15 in 5 propene in He (298-673 K 4 Kmin) The arrows on the left side indicate the evolution of the spectra during temperature treatment
157
822 Local structure and reactivity of VxOySBA-15 under changing reaction conditions
In order to further investigate structure and catalytic performance of 77 wt VxOySBA-15 under
changing reaction conditions isothermal switching experiments were performed at 673 K The gas phase
was rapidly changed between reducing (5 propene) and oxidizing conditions (5 propene and 5
oxygen) Prior to the switching experiment 77 wt VxOySBA-15 was treated for 20 min in 5 propene
at 673 K This treatment caused a reduction of 77 wt VxOySBA-15 that is visible by an increased
intensity at longer wavelengths (gt 400 nm relative F(Rinfin) at 700 nm ~ 20) After the initial reduction of
77 wt VxOySBA-15 oxygen was added to the propene feed for ~ 30 min The structure of 77 wt
VxOySBA-15 during re-oxidation was monitored by fast UV-Vis-DRS scans (~ 26 sec) and the gas phase
was monitored by mass spectroscopy A quantitative gas phase analysis was conducted with a gas
chromatograph 15 min and 24 min after changing to oxidizing conditions (5 propene and 5 oxygen)
At the end of the re-oxidation phase UV-Vis-DR scans with a better resolution were recorded (~ 4 min
scan time) The resulting UV-Vis-DR spectra after three reducing (5 propene) and oxidizing (5
propene and 5 oxygen) reaction cycles (each ~ 30-35 min) are depicted in Figure 8-5 (left) After the
first re-oxidation the UV-Vis-DR spectrum of 77 wt VxOySBA-15 resembled those recorded under
catalytic conditions at 673 K (Chapter 7) Thus after re-oxidation the vanadium oxide structure of 77
wt VxOySBA-15 corresponded to the dehydrated VxOySBA-15 structure (ldquoordered [V2O7]rdquo) The
average V valence was +5 after re-oxidation Switching the gas phase back to reducing conditions
resulted again in an increase of the intensity of the absorption bands at longer wavelengths and thus a
reduction of 77 wt VxOySBA-15 was observed
0 5 10 15 20 25 30 350
5
10
15
20
initial 5 propene A 5 propene + 5 O
2
B 5 propene C 5 propene + 5 O
2
D 5 propene E 5 propene + 5 O
2
Rel
ativ
e F
(Rinfin)
(700
nm
) [
]
Time [min]
0
13
5
10
220 800400 600
F(R
infin)
)
Wavelength [nm]
initial 5 propene
A 5 propene + 5 O2 B 5 propene C 5 propene + 5 O2
D 5 propene E 5 propene + 5 O2
Figure 8-5 Left UV-Vis-DR spectra of dehydrated (623 K 20 O2 in He) 77 wt VxOySBA-15 recorded at 673 K after several reducing (5 propene) and oxidizing (5 propene and 5 oxygen) reaction cycles Right Evolution of the absorption at 700 nm (relative to the maximum intensity determined in the absorption spectra at 298 K after dehydration) during the reducing (5 propene) and oxidizing (5 propene and 5 oxygen) reaction cycles at 673 K The gas phase was changed after 39 min in each reaction cycle
158
The relative F(Rinfin) at 700 nm was only 10-12 after 35 min in reducing conditions after the first re-
oxidation of 77 wt VxOySBA-15 This was significantly lower than the relative F(Rinfin) at 700 nm of
20 obtained after the initial reduction Hence less centers could be reduced after re-oxidation under
catalytic conditions Repeating the oxidative and reducing treatments resulted in similar UV-Vis-DR
spectra of 77 wt VxOySBA-15 Thus a reversible re-oxidation and reduction occurred after the initial
re-oxidation of 77 wt VxOySBA-15 In order to follow the reduction and re-oxidation processes the
relative absorption at 700 nm was monitored during the switching experiments (Figure 8-5 right)
Independent of the initial degree of reduction the relative intensity at 700 nm decreased rapidly after
switching to oxidative catalytic conditions (Figure 8-5 right curve ACE) Re-oxidation was completed
after approximately 3 min After each re-oxidation a small increase in the relative intensity at 700 nm of
15-30 was detected Therefore part of the reduced vanadium centers may not be re-oxidized under
catalytic conditions It seemed likely that small fractions of reduced crystalline vanadium oxide phases
formed on the SBA-15 support In contrast to the rapid decay of the relative intensity at 700 nm during
the re-oxidation cycle only a moderate increase of the relative intensity at 700 nm was observed for the
second and the third reduction cycle (Figure 8-5 right curve BD) Moreover the reduction process
seemed not to be finished in the time interval chosen because no maximum or constant value of the
relative intensity at 700 nm was observed Therefore re-oxidation of reduced vanadium centers on
77 wt VxOySBA-15 was considerably faster than reduction
The corresponding concentrations of the major reaction products (CO2 CO acrolein and acetaldehyde)
determined at the beginning and the end of each re-oxidation in catalytic conditions are depicted in
Figure 8-6 together with the corresponding propene and oxygen conversions At the beginning of the first
re-oxidation cycle an increased formation of CO2 acrolein and acetaldehyde was observed compared to
the end of this cycle and the other two reaction cycles
1-start 1-end 2-start 2-end 3-start 3-end03
04
05
002
004
006
10152025
CO2
CO
Con
cent
ratio
n [V
ol
]
acetaldehyde acrolein
3nd
cycle2nd
cycle
propene oxygen
Con
vers
ion
[]
1st
cycle
Figure 8-6 Propene and oxygen conversion and concentration of major reaction products after several oxidizing (5 propene and 5 oxygen) reaction cycles (Figure 8-5) Refer to text for experimental details
159
Conversely an increase of CO formation was observed after each re-oxidation cycle In order to
elucidate whether the increased formation of reaction products was correlated with structural changes a
more detailed evolution of the structure and the gas phase composition during the first and the second re-
oxidation cycle is depicted in Figure 8-7 Oxygen was added after 39 min to the propene feed in each
cycle Adding oxygen to the reaction gas mixture an increase of the ion currents of the reaction products
was observed directly in both re-oxidation cycles (Figure 8-7 middle) A pronounced CO2 formation in
both re-oxidation cycles was detected that decreased to a constant level after 2 min The CO2 formed in
the initial phase was assigned to the combustion of carbonaceous species that may have formed during the
reduction Comparing the evolution of the ion currents of water (me 18) and acrolein (me 56) during the
first and the second re-oxidation cycle a decrease of the ion currents with increasing time was observed
during first re-oxidation cycle Figure 8-7 (bottom left) depicts the in situ UV-Vis-DR spectra recorded
during re-oxidation In the initial phase of the first re-oxidation cycle a decrease of the absorption at
longer wavelengths was observed in the UV-Vis-DR spectra Furthermore a broadening of the main
absorption band around 300 nm and a shift of the maximum from 300 nm to 315 nm were observed in the
first minute after switching to catalytic conditions With increasing time a blue shift of the absorption
maximum from 315 nm to 300 nm occurred that was accompanied by a narrowing of the absorption band
This process resembled the blue shift that was observed during temperature programmed reaction of
VxOySBA-15 in 5 propene and 5 oxygen Apparently before the final oxidized state under catalytic
conditions was reached an intermediate structure of the vanadium oxide phase was present The
transformation of the vanadium oxide structure was irreversible because similar changes in the UV-VIS-
DR spectra were not observed in the second re-oxidation cycle (Figure 8-7 bottom right) Only a
decrease of the intensity of the absorption at longer wavelengths was detected in the UV-Vis-DR spectra
recorded in the second re-oxidation cycle
In the previous chapter it was discussed that during propene oxidation some of the V-O-X (X= OHSi or
V) bonds changed in the initial phase of the temperature programmed propene oxidation The structural
change indicated by a blue shift in the UV-Vis-DR spectra was accompanied by a small increase in
catalytic activity In the first phase of the catalytic reaction the re-oxidation of the reduced vanadium
centers which form during catalytic reaction may be enhanced by the presence of Si-OH groups Reduced
vanadium centers may form Si-O-V bonds with adjacent silanol groups A similar interpretation may
explain the observations during the first re-oxidation of the reduced vanadium centers in 77 wt
VxOySBA-15 Launay et al [26] discussed an exchange of hydroxyl groups between supported vanadium
centers and silanol groups during re-oxidation of reduced VxOySiO2 samples Launay et al showed using
IR measurements that during reduction (16 h vacuum 210-5 mbar 853 K) the number of V-OH bonds
decreases [26] After re-oxidation of the sample in oxygen (853 K 6 h) they detected again the
characteristic IR bands of the V-OH stretching vibration They proposed that vanadium centers in the
proximity of strained D2 defects of the silica surface transfer the OH group from V-OH to the silica
surface [26] Furthermore Launay et al [26] proposed that some of the previously reacted V-OH groups
were restored during re-oxidation of the vanadium oxide phase
160
0
5
10
15
20
0 5 10 15 20 25 30
Time [min]
Rel
ativ
e F
(Rinfin)
(700
nm
) [
]
0
5
10
15
20
0 5 10 15 20 25 30
Time [min]
Rel
ativ
e F
(Rinfin)
(700
nm
) [
]
0 5 10 15 20 25 30
Nor
mal
ized
Ion
Cur
rent
Time [min]
me 32 (O2)
me 18 (H2O)
me 44 (CO2)
me 56 (acrolein)
0 5 10 15 20 25 30
Nor
mal
ized
Ion
Cur
rent
Time [min]
me 32 (O2)
me 18 (H2O)
me 44 (CO2)
me 56 (acrolein)
300 400 5000
5
10
15
39 min 43 min 48 min 56 min 65 min 32 min
F(R
infin)
Wavelength [nm]
300 400 5000
5
10
15
F(R
infin)
Wavelength [nm]
39 min 43 min 56 min 65 min 338 min
Figure 8-7 UV-Vis-DR spectra of dehydrated 77 wt VxOySBA-15 (623 K 20 O2 in He) recorded during the first (left) and the second (right) re-oxidation (5 propene 5 O2) cycle at 673 K Top Evolution of the absorption at 700 nm (relative to the maximum intensity determined in the absorption spectra at 298 K after dehydration) Middle Evolution of MS ion currents Bottom in situ UV-Vis-DR spectra The gas phase was changed after 39 min in each reaction cycle
161
During re-oxidation of the vanadium centers a transfer of a hydroxyl group from a silanol group back to
the vanadium oxide center was proposed [26] Such a mechanism would explain the broadening of the
absorption band at 300 nm in the UV-Vis-DR spectra of 77 wt VxOySBA-15 in the initial phase of the
first re-oxidation (Figure 8-7 (bottom left)) The blue shift of the absorption band at 300 nm to lower
values after the initial broadening was interpreted to be caused by the reaction of V-OH and Si-OH
centers to V-O-Si bonds during the catalytic cycle
The results reported by Launay et al [26] give rise to the question of which V-O bonds may be involved
in the reduction process of the vanadium centers To decide which V-O bond is involved in the reduction
a comparison of 14 wt and 77 wt VxOySBA-15 was made The following bonds present in the
supported vanadium oxide cluster may be involved in the reduction process (i) V-OH (ii) V=O (iii) V-
O-V and (iv) V-O-Si First it seems likely that terminal V-OH bonds (i) will more readily react than the
other bonds because they are easily accessible for the propene molecule Second a participation of the
V=O bond (ii) in the reduction process seems not likely because of the high bond strength of this V=O
double bond Another set of bonds are the V-O-V bonds (iii) or V-O-Si bonds (iv) The latter (V-O-Si)
were often proposed to participate in the selective methanol oxidation [21169] The high UV-Vis-DR
edge energy of 14 wt VxOySBA-15 showed that this sample exhibits more isolated than dimeric
vanadium centers whereas 77 wt VxOySBA-15 exhibits mainly dimeric tetrahedral [V2O7] vanadium
centers Therefore a higher amount of V-O-V bonds involved in the reduction will result in a higher
degree of reduction of 77 wt VxOySBA-15
Figure 8-8 (left) depicts the normalized UV-Vis-DR spectra of dehydrated 14 and 77 wt
VxOySBA 15 recorded at 298 K after reduction in 5 propene at 636 K A similar increase of the
absorption at longer wavelengths (gt 400 nm) was observed for both samples Apparently a comparable
degree of reduction of the vanadium centers in 14 wt and 77 wt VxOySBA-15 was present after this
treatment Conversely a different degree of reduction was observed for a reduction performed in 5
propene after a treatment under catalytic conditions at 673 K (Figure 8-8 right) Only a minor increase
of the absorption above 400 nm was observed in the UV-Vis-DR spectrum of 14 wt VxOySBA-15
after 70 min The increase in absorption above 400 nm determined in the UV-Vis-DR spectrum of
77 wt VxOySBA-15 was significantly higher Thus treatment of VxOySBA-15 in propene and oxygen
changed the reducibility of the vanadium centers present on SBA-15 V-OH and V-O-V bonds may be
involved in the reduction of 14 and 77 wt dehydrated VxOySBA-15 because a similar and rather high
degree of reduction was observed for both samples after reduction in 5 propene UV-Vis-DRS
measurements indicated that V-OHSi-OH groups reacted to V-O-Si bonds during catalytic treatment of
VxOySBA-15 It appeared that more V-OH and silanol groups were left on low loaded 14 wt
VxOySBA-15 Therefore more V-O-Si bonds per vanadium center may be formed in this sample under
catalytic conditions Accordingly the decreased number of V-OH groups in ldquoreactedrdquo 14 wt
VxOySBA-15 compared to dehydrated 14 wt VxOySBA-15 may explain its lower reducibility This
interpretation was corroborated by the stronger shift of the UV-Vis edge energy (Eg) observed after
catalytic treatment The blue shift was assigned to the formation of V-O-Si bonds
162
02
04
06
08
10
400 600 800
Nor
mal
ized
F(R
infin)
Wavelength [nm]
After reduction at 636 K
recoded 298 K
14 wt VxOySBA-1577 wt VxOySBA-15
02
04
06
08
10
400 600 800
Nor
mal
ized
F(R
infin)
Wavelength [nm]
recorded at 673 K
initial 5 propene and 5 O2
35min 5 propene
14 wt VxOySBA-15
77 wt VxOySBA-15
Figure 8-8 UV-Vis-DR spectra recorded at 298 K after reduction of dehydrated VxOySBA-15 in 5 propene in He at 623 K (left) and UV-Vis-DR spectra recorded at 673 K after reduction in 5 propene at 623 K of VxOySBA-15 that was treated for 35 min in 5 propene and 5 O2 in He at 673 K prior to reduction (Right)
The UV-Vis edge energy of 77 wt VxOySBA-15 shifted from 341 eV to 356 eV (∆Eg~ plusmn005 eV)
and the Eg of the low loaded 14 wt VxOySBA-15 shifted from 36 eV to 39 eV (∆Eg~ plusmn01 eV)
Therefore the reduction which was observed after catalytic treatment involved mainly the V-O-V bonds
Thus the degree of reduction observed in the UV-Vis-DR spectra was higher for ldquoreactedrdquo 77 wt
VxOySBA-15 than for ldquoreactedrdquo 14 wt VxOySBA-15 In order to obtain a more detailed picture of the
vanadium oxide structure present on the SBA-15 support XAFS measurements were conducted after a
similar switching experiment as conducted with UV-Vis-DRS (Figure 8-5) The V K edge XANES
χ(k)k3 and FT(χ(k)k3) of 77 wt VxOySBA-15 after dehydration and of 77 wt VxOySBA-15
which was reduced for 30 min after the switching experiment are depicted in Figure 8-9 For comparison
the V K edge XANES χ(k)k 3 and FT(χ(k)k3) of 77 wt VxOySBA-15 after reduction at 723 K in 5
propene are shown
05
10
55 555 56
Nor
mal
ized
Abs
orpt
ion
Photon Energy [keV]
dehydrated reduced 723 K reduced after catalytic treatment
05
10
55 555 56
Nor
mal
ized
Abs
orpt
ion
Photon Energy [keV]
fit experiment
dehydrated
reduced 723 K 002
004
006
0 2 4 6
R [Aring]
FT
(χ(k
)k3 )
dehydrated reduced 723 K reduced after catalytic treatment
Figure 8-9 V K edge XANES (left) LC XANES fit (middle) and FT(χ(k)k3) of 77 wt VxOySBA-15 after dehydration (623 K 20 O2 in He) reduction (723 K 5 propene in He) and after the switching experiment at 673 K under reducing catalytic reducing catalytic and finally reducing conditions (673 K reducing conditions 5 propene in He catalytic conditions 5 propene and 5 O2 in He)
163
The in situ spectra at 673 K were omitted because of the high noise level of the spectra The XANES
spectrum of 77 wt VxOySBA-15 recorded after the switching experiment resembled more the spectrum
of dehydrated 77 wt VxOySBA-15 than the spectrum recorded after reduction at 723 K in 5 propene
Therefore the majority of the vanadium centers in the dehydrated structure were present as V5+ centers
In order to estimate the number of reduced centers a least square XANES fit was conducted The
XANES spectra of dehydrated and reduced 77 wt VxOySBA-15 (723 K 1 h propene) were used for
refinement A good agreement of the experimental and the theoretical XANES spectrum was obtained
(Figure 8-9 middle) The residual of the refinement was 16 Accordingly the refinement employed
showed approximately 33 of the vanadium centers were reduced and 67 remained in the dehydrated
state The FT(χ(k)k 3) of 77 wt VxOySBA-15 which was reduced after the switching experiment is
depicted in Figure 8-9 (right) Compared to the FT(χ(k)k3) of dehydrated 77 wt VxOySBA-15 a
strong reduction of the FT(χ(k)k3) in the range of 1-2 Aring was observed Hence a strong structural
distortion in the first V-O coordination sphere may have occured The first signal above 2 Aring was slightly
enhanced and the second signal which is due to the second V-V coordination sphere was significantly
reduced compared to the FT(χ(k)k3) of dehydrated 77 wt VxOySBA-15 Therefore a lower number of
V-O-V bonds may be present after reduction of the catalytically treated 77 wt VxOySBA-15 sample
This corroborates that mainly the V-O-V bonds were affected by the reduction of the vanadium centers of
ldquoreactedrdquo 77 wt VxOySBA-15
Therefore an increasing number of V-O-Si bonds may change the reducibility of the supported vanadium
oxide phase VxOySBA-15 samples with an increased number of V-O-Si bonds are then less reducible
than the initial dehydrated VxOySBA-15 phase before the catalytic measurements In order to investigate
the reduction at 673 K of dehydrated and ldquoreactedrdquo 77 wt VxOySBA-15 isothermal experiments with
changing gas phase compositions were conducted In a first experiment the dehydrated 77 wt
VxOySBA-15 sample was heated to 673 K in 20 O2 Except for a temperature induced broadening of
the absorption band no change was observed After 15 h in 20 O2 the gas phase was switched to 5
propene for 1 h This treatment was followed by switching to 20 O2 for 35 min 5 propene for 1 h and
finally to 5 propene and 5 oxygen for 35 min The spectra recorded after each treatment procedure are
depicted in Figure 8-10 (left) In contrast to the temperature programmed reaction shown in Figure 8-4
the intensity of the absorptions bands of wavelengths longer than 500 nm was smaller (13) after
reduction under isothermal conditions The maximum of the absorption shifted from 310 nm to 291 nm
during the first reduction After re-oxidation in 20 O2 the maximum in the UV-Vis-DR spectra shifted
to 300 nm during the second reduction to 293 nm and finally after switching to catalytic conditions the
absorption maximum in the UV-Vis-DR spectra was detected at 296 nm The relative intensity at 700 nm
which was assigned to reduced vanadium centers was approximately 10-13 after the reduction cycles
For the first re-oxidation of 77 wt VxOySBA-15 in 20 O2 a reversible transition to the initial
absorption maximum at 310 nm was expected Conversely only a shift of the absorption band to 300 nm
was observed after the first re-oxidation cycle in 20 O2
164
0
15
5
10
220 800400 600
F(R
infin)
)
Wavelength [nm]
initial 20 O2
cycle 1 5 propene cycle 1 20 O2 cycle 2 5 propene cycle 2 5 propene + 5 O2
0
15
5
10
220 800400 600
F(R
infin)
)
Wavelength [nm]
initial 5 propene + 5 O2
cycle 1 5 propene cycle 1 5 propene + 5 O2
cycle 2 5 propene cycle 2 5 propene + 5 O2
Figure 8-10 In situ UV-Vis DR spectra of dehydrated 77 wt VxOySBA-15 (20 O2 in He 623 K) at 673 K after changing the gas phase composition starting with 20 O2 in He (left) or 5 propene and 5 O2 in He (right) as the initial gas mixture
In this time formation of small amounts of propene oxidation products was observed because it took
several seconds to purge oxygen out of the in situ cell This short time of catalytic reaction may have
inhibited the reversible recovery of V-OH centers Nevertheless after re-oxidation in 20 O2 the
absorption band exhibited a lower UV-Vis edge energy (longer wavelength) than the absorption band
recoded after re-oxidation under catalytic conditions Hence at least some V-OH groups were recovered
In a second switching experiment dehydrated 77 wt VxOySBA-15 was heated in 5 O2 and 5
propene to 673 K After 30 min under catalytic conditions the reaction gas was changed to 5 propene
for 70 min This treatment was followed by subsequent changes between reducing and catalytic
conditions The resulting spectra after each treatment are depicted in Figure 8-10 (right) Comparing the
maximum absorption in the UV-Vis-DR spectra only minor changes were observed after the respective
treatments In the initial UV-Vis-DR spectrum the absorption maximum was at 300 nm and shifted to
297 nm after switching to propene Repeated re-oxidation shifted the maximum in the UV-Vis-DR
spectra to 298 nm and then to 295 nm after another reductive treatment After the final re-oxidation it was
at 297 nm
Figure 8-11 depicts the evolution of the relative F(Rinfin) at 700 nm 1 to follow the reduction process during
the respective treatments The gas phase was changed 39 min after starting to record the fast UV-Vis-DR
spectra Re-oxidation was finished independent of the initial degree of reduction after 3 minutes Re-
oxidation in 20 O2 resulted in a decrease to almost no intensity of F(Rinfin) at 700 nm whereas after re-
oxidation in 5 propene and 5 oxygen a relative F(Rinfin) at 700 nm of 2-4 was detected The increase
in relative F(Rinfin) at 700 nm during reduction was comparable to the moderate increase observed in the
experiment discussed (Figure 8-5 right) for samples re-oxidzied prior to the reduction under catalytic
conditions However for VxOySBA-15 (re)oxidized in 20 O2 a different evolution of the relative F(Rinfin)
at 700 nm was observed during the reduction in propene (Figure 8-11 left)
1 ldquorelative F(Rinfin) at 700 nmrdquo The intensity at 700 nm was referred to the maximum intensity at approximately 300 nm in the UV-Vis
spectra recorded at 298 K after dehydration of VxOySBA-1 in 20 O2
165
0 10 20 30 40 50 60 70
0
2
4
6
8
10
12
14initial 20 O
2
cycle 1 5 propene cycle 1 20 O
2
cycle 2 5 propene cycle 2 5 propene + 5 O
2
Rel
ativ
e F
(Rinfin)
(700
nm
) [
]
Time [min]
0 10 20 30 40 50 60 700
2
4
6
8
10
12
14initial 5 propene + 5 O
2
cycle 1 5 propene cycle 1 5 propene + 5 O
2
cycle 2 5 propene cycle 2 5 propene + 5 O
2
Rel
ativ
e F
(Rinfin)
(70
0 nm
) [
]
Time [min]
Figure 8-11 Evolution of the relative absorption at 700 nm (relative to the maximum intensity determined in the absorption spectra at 298 K after dehydration) derived from the in situ UV-Vis DR spectra of dehydrated 77 wt VxOySBA-15 (20 O2 in He 623 K) at 673 K after changing the gas phase composition starting with 20 O2 in He (left) or 5 propene and 5 O2 in He (right) as initial gas mixture
In the initial time interval (5 min - 10 min) after switching to reducing conditions only a small increase in
relative F(Rinfin) at 700 nm was observed The relative F(Rinfin) at 700 nm remained constant during the first
5 min After 5 min (10 min absolute) an increase of the relative absorption at 700 nm was detected which
was damped after 15 min (~ 25 min absolute) The increase in relative absorption at 700 nm for the first
and the second reduction cycle was comparable during the first 15 min after switching to propene After
15 min a smaller increase of the relative absorption at 700 nm was observed for the second reduction
cycle Evolution of the structure and gas phase composition during the first reduction cycle of dehydrated
and ldquoreactedrdquo 77 wt VxOySBA-15 is depicted in Figure 8-12 In the first 3 min after switching to
propene a pronounced formation of oxidation products was observed (CO2 acrolein water and C3H6O)
for dehydrated 77 wt VxOySBA-15 The ion currents decreased significantly after 3 min (CO2
acrolein and C3H6O) or reached a constant value in the case of water (Figure 8-12 middle left) Hence
in the initial phase of the reduction oxygen originating from the vanadium oxide phase may have reacted
with propene In the first 5 min after switching to propene a constant relative F(Rinfin) at 700 nm was
observed (Figure 8-12 top left) The in situ UV-Vis-DR spectra recorded during the addition of propene
are depicted in Figure 8-12 bottom left During the first two scans (39 min-52 min) a blue shift of the
absorption maximum from 310 nm to 300 nm was observed in the UV-Vis DR spectra The UV-Vis-DR
spectra recorded during the next 5 min (52-108 min) remained unchanged After 108 min a slow shift of
the absorption maximum from 300 nm to 291 nm was observed in the UV-Vis-DR spectrum This shift
was accompanied by an increase of the absorption at 700 nm The intermediate absorption spectra
(52-108 min) resembled those recorded under catalytic conditions Presumably a similar V coordination
sphere must be present V-O-Si bonds may have formed from reacted V-OH Interestingly the V-OH
groups were recovered after re-oxidation in 20 O2 which is in contrast to catalytic conditions A similar
shift of the absorption maximum was not observed in the in situ UV-Vis-DR spectra of ldquoreactedrdquo 77 wt
VxOySBA-15 during the first reduction cycle
166
0
2
4
6
8
100 5 10 15 20 25
Time [min]
Rel
ativ
e F
(Rinfin)
(700
nm
) [
]
0
2
4
6
8
100 5 10 15 20 25
Time [min]
Rel
ativ
e F
(Rinfin)
(700
nm
) [
]
0 5 10 15 20
me 41 (propene)
me 58 (C3H
6O)
me 56 (acrolein)
me 44 (CO2)
me 18 (H2O)
Nor
mal
ized
Ion
Cur
rent
Time [min]
me 32 (O2)
0 5 10 15 20 25
Nor
mal
ized
Ion
Cur
rent
Time [min]
me 32 (O2)
me 18 (H2O)
me 44 (CO2)
me 56 (acrolein)
me 58 (C3H
6O)
me 41 (propene)
250 300 350 400 4500
5
10
15
F(R
infin)
Wavelength [nm]
0 min 39 min 52 min 108 min 256 min 646 min
250 300 350 400 4500
5
10
15
F(R
infin)
Wavelength [nm]
0 min 39 min 52 min 108 min 256 min 641 min
Figure 8-12 UV-Vis-DR spectra of dehydrated 77 wt VxOySBA-15 (623 K 20 O2 in He) recorded during the first reducing (5 propene) cycle at 673 K starting with 20 O2 in He (left side) or 5 propene and 5 O2 in He (right side) as the initial gas mixture Top Evolution of absorption at the 700 nm (relative to the maximum intensity determined in the absorption spectra at 298 K after dehydration) Middle Evolution of the MS ion currents Bottom in situ UV-Vis-DR spectra The gas phase was changed after 39 min in each reaction cycle
167
For ldquoreactedrdquo 77 wt VxOySBA-15 the absorption maximum in the in situ UV-Vis-DR spectra
remained at 297 nm during the reduction and re-oxidation cycles (Figure 8-12 bottom right) Switching
the gas phase from catalytic conditions to propene resulted in a small increase of the ion currents of the
reaction products formed in the first minute (~ 5 min absolute) Between 5 and 7 min a decay of theses
ion currents was observed The decay was slower than the decreasing ion current of oxygen (me 32)
Thus oxygen originating from the sample may have reacted with propene
83 Concluding remarks on the structural evolution of VxOySBA-15 under dehydrating catalytic or reducing conditions
Figure 8-13 shows the proposed structural transformations deduced from the in situ UV-Vis-DRS and
XAS investigations performed under reducing oxidizing or catalytic conditions
[O3Si][SiO3]
OO
V5+
OV
5+
OHO
OHOH
OH
[O3Si][SiO3]
OO
V5+
OV
5+
OO
OH
[O3Si]O
[O3Si][SiO3]
OO
V5+
OV
5+
OO
O
[SiO3]
OH
[O3Si]
OH
[O3Si]
OH
[O3Si]
O
[O3Si]
[O3Si][SiO3]
V4+
(O)V
3+
OO
O
[SiO3]
OH
+[O3Si]
V4+
O
O
[SiO3][O3Si]O
[SiO3]
V4+
OO
OHO-
[SiO3]
O
(O)V5+
OH
OH
[O3Si]
[O3Si]
V4+
OH
OH
[SiO3]
O-+
[O3Si]O
[O3Si][SiO3]
OO
V5+
OV
5+
OO
O
[SiO3]
[O3Si] [O3Si]
O
OH V5+
O
OHOH
[O3Si]
[O3Si][O3Si]
O
O V5+
O
OHOH
[O3Si]
+
OH
[O3Si]
OH
[O3Si]
OH
[O3Si]
OH
[O3Si]
OH
[O3Si]
[O3Si] [O3Si]
O V4+
O
OH
[SiO3]
O-OH
[O3Si]
OH
[O3Si]
OH
[O3Si]
OH
[O3Si]
OH
[O3Si][O3Si]
OH V4+
O
OHO
[SiO3][O3Si][O3Si]
O
O V5+
O
[O3Si][O3Si]
O
O V5+
O
O
[SiO3]
OH
[O3Si]
OH
[O3Si]
reduction
not likely
high and medium V loadings of V xOySBA-15
low V loadings of V xOySBA-15
dehydrated 20 O25 propene and 5 oxygen 5 propene5 propene
V3+ + V4+
V4+=O
V-OH
V-O-
micro-V2O5
reduced micro-V2O5
+reduced micro-V2O5
+
+reduced micro-V2O5
+
[O3Si] [O3Si]
O V3+
O
OH
[SiO3]
V-OH
V4+=O
Figure 8-13 Simplified scheme of the structural changes during dehydrating catalytic or reducing condition
168
The dehydrated VxOySBA-15 structure was obtained from thermal treatment in oxygen containing
atmospheres in the temperature range from 550-723 K The dehydrated structure consists of an ordered
arrangement of dimeric tetrahedral [V2O7] vanadium oxide units present on the SBA-15 support The
proposed structure is discussed in more detail in Chapter 5 With decreasing vanadium loading isolated
tetrahedral [VO4] units besides dimeric tetrahedral [V2O7] vanadium oxide units may be present on the
support Because Si-OH groups were still detectable after dehydration (550-723 K) the number of
V-O-Si bonds to the support are presumably one per vanadium center in the case of high loaded
VxOySBA-15 and one or two per vanadium center in the case of low loaded VxOySBA-15 The
remaining vanadium oxygen bonds may be present as V=O or as V-OH referring to IR investigations
reported by Launay et al [2627141] The presence of V-OH bonds seems likely because the H+ ensures
the charge compensation of the vanadium oxide clusters
A reduction of vanadium centers of VxOySBA-15 was observed for temperatures higher than 520 K after
applying reducing conditions to dehydrated VxOySBA-15 samples A rather low V K edge pre-egde peak
height indicated the formation of V4+ and V3+ vanadium centers after reduction in propene at 723 K
(Figure 8-2) A low similarity with the XAS spectra of octahedral vanadium oxide references with an
average oxidation state less than +5 was observed (Figure 8-1) Hence the reduced vanadium centers of
VxOySBA-15 may exhibit a 4- or 5-fold V-O coordination symmetry Whether reduced vanadium centers
with double bonds (V4+=O) were present could not be determined Reduced V4+ and V3+ vanadium
centers require a compensation of the highly negative charge present A high negative charge of reduced
vanadium centers must be present in the reduced dimeric or isolated vanadium oxide clusters with 4- or
5-fold coordinated V-O vanadium centers Such a negative charge cannot be easily compensated for
supported vanadium oxide clusters that are anchored to the support Conversely for bulk vanadium oxide
references charge compensation may be given by positively charged cations or by aggregation to larger
vanadium oxide clusters resulting typically in a higher coordination (eg octahedral V3+ centers in V2O3
or Mg2VO4) However the latter process seems not likely for the vanadium centers linked to the support
The lacking possibilities for charge compensation may explain the fast re-oxidation of the reduced
vanadium oxide centers It still remains unknown how and which oxygen ligands stabilize the vanadium
oxide structure of reduced vanadium centers Formation of V-OH groups may be suited to reduce the
negative charge but Launay et al [26] showed that these centers were removed during reduction in
vacuum Comparable to the results reported by Launay et al [26] a reversible re-oxidation in 20
oxygen was possible together with the recovery of some of the removed V-OH groups (Figure 8-10 left)
The mechanism behind this process remains unclear because direct observation of the V-OH and Si-OH
was not possible with the spectroscopic methods employed Nevertheless the reversible exchange of
hydroxyl groups with the SBA-15 support indicates a dynamic interaction Therefore investigations
addressing the reduction in hydrogen and reversibility of the reoxidation of VxOySBA-15 would be of
interest Unfortunately the temperature range above 750 K where a reduction in hydrogen proceeds [22]
was not feasible with the in situ UV-Vis-DR set up used here The reduction in hydrogen instead of in
propene would not be disturbed by catalytic processes with residual oxygen that may change the V-O
coordination sphere
169
A very different reduction behavior occurred for VxOySBA-15 treated under catalytic conditions (5
propene and 5 oxygen) prior to reduction in propene A blue shift of the absorption band in the UV-Vis-
DR spectra was detected during this treatment This change in the UV-Vis-DR spectra was assigned to
the formation of V-O-Si bonds This interpretation was corroborated by the fact that the blue shift was
larger in the case of low vanadium loadings (lower number V-O-V bonds) that Si-OH groups were not
detectable after such a treatment of dehydrated 77 wt VxOySBA-15 and that significant changes were
not determined in the XAFS refinements In the case of changes of the V-O-V bonds it would be
expected that almost no blue shift would be observed for 14 wt VxOySBA-15 Furthermore a
significant change in the V-V interaction in the XAFS refinements would be expected for 77 wt
VxOySBA-15 The unchanged Raman band at ~1040 cm-1 that was observed during the temperature
programmed reaction in propene and oxygen showed that no change of the V=O bond occurred (Chapter
7) The increased number of V-O-Si centers on the support resulted in a lower reducibility of the
supported vanadium oxide centers (Figure 8-8) This effect was more pronounced for low loaded
14 wt VxOySBA-15 This corroborated the assumption that on this sample more V-O-Si bonds were
formed The low reduction observed for 14 wt VxOySBA-15 (Figure 8-8) may be due to reduced
dimeric centers that may be present besides isolated vanadium centers after dehydration Hence
O=V5+-(OSi)x centers were not reducible The observed reduction of 77 wt VxOySBA-15 was assigned
to the reduction at the V-O-V bonds in the [V2O7] dimer It was estimated from a XANES analysis that
approximately 33 of the vanadium centers were reduced in ldquoreactedrdquo 77 wt VxOySBA-15 A similar
conclusion that V-O-Si bonds were not reducible (reduction with H2) in contrast to V-OH or V-O-V
bonds was proposed by Grubert et al [170] Therefore mainly the V-O-V bonds are involved in the
reduction of the ldquoreactedrdquo VxOySBA-15 samples
The nano crystalline V2O5 phases on 77 wt VxOySBA-15 were not responsible for the observed
changes in the UV-Vis-DR absorption bands Similar changes were observed for 14 wt VxOySBA-15
where no V2O5 was detectable However an increasing formation of reduced crystalline vanadium oxide
centers may explain the increasing formation of CO and the decreasing formation of acetaldehyde during
the isothermal switching experiments (Figure 8-6)
The results obtained suggest that a different interaction of the vanadium oxide phase with propene
proceeds during the catalytic propene oxidation compared to reducing conditions This may be due to the
formation of V-O-CxHy or Si-O-CxHy intermediate species which change the re-oxidation The blue shift
of the absorption bands in the UV-Vis-DR spectra was irreversible Hence adjacent silanol groups may
be involved in the initial phase of re-oxidation in propene and oxygen Surprisingly a similar irreversible
reaction of vanadium centers and silanol groups was not observed during re-oxidation of reduced
VxOySBA-15 catalysts in 20 O2
170
84 Summary
In situ UV-Vis-DRS and in situ XAS measurements showed that the vanadium oxide phase on
VxOySBA-15 exhibits a dynamic reduction and re-oxidation behavior Disperse dimeric and isolated
vanadium centers present after dehydration of VxOySBA-15 were reduced to V4+ and V3+ using propene
as the reducing agent A re-oxidation in 20 O2 resulted in a reversible oxidation of the reduced
vanadium oxide phase to the initial dehydrated VxOySBA-15 with an average valence of +5 The
reduction behavior was independent of the vanadium loading of VxOySBA-15
Conversely a significantly lower reducibility was observed for VxOySBA-15 treated under catalytic
conditions in propene and oxygen The lower reducibility was ascribed to the formation of additional
V-O-Si bonds to the support V-O-Si bonds were not involved during the reduction in propene This was
corroborated by a lower reducibility of the ldquoreactedrdquo low loaded 14 wt VxOySBA-15 compared to
ldquoreactedrdquo high loaded 77 wt VxOySBA-15 The higher reducibility of 77 wt VxOySBA-15 was
attributed to the presence of V-O-V bonds in the sample
The high tendency of partially reduced disperse vanadium oxide phases to re-oxidize rapidly even in the
presence of low amounts of oxygen was explained by a missing charge compensation for reduced 4- or
5-fold V+4 and V3+ centers anchored to SBA-15 Anchoring of disperse dimeric and isolated vanadium
oxide clusters to the SBA-15 support inhibits the formation of larger clusters with higher coordination
that may stabilize reduced vanadium oxide centers
171
9 General conclusions on VxOySBA-15 model catalysts
91 Introduction
The objective of the present work was investigating of VxOySBA-15 model catalysts for the selective
oxidation of propene Detailed analysis of the preparation and the hydration and dehydration processes
were performed prior to catalytic testing The grafting anion exchange method chosen allowed the
preparation of highly disperse VxOySBA-15 samples without formation of V2O5 during the preparation
process Three different VxOySBA-15 samples with vanadium loadings in the range of 14 wt-77 wt
(03 Vnm2 ndash 24 Vnm2) were synthesized In situ UV-Vis-DR and XAS measurements were performed
to investigate the vanadium oxide structure Comparison with spectra of vanadium oxide references
allowed developing suitable model structures for the hydrated and dehydrated state The proposed
theoretical model structures were refined successfully to the experimental Fourier transformed EXAFS of
VxOySBA-15 Hydration and dehydration processes were studied with various in situ methods
Furthermore the impact of water on the dehydration process was determined The measurements
performed provided a detailed knowledge on the structural properties of VxOySBA-15 under oxidizing
conditions (20 O2 in He) After characterization under oxidizing conditions the structural evolution
under catalytic (5 propene and 5 O2 in He) and reducing (5 propene in He) conditions was
investigated together with monitoring of the gas phase composition In addition the catalytic performance
(propene conversion gas phase composition and selectivity of the reaction products formed) was
determined in a laboratory fixed bed reactor The major results and conclusions obtained are summarized
below The conclusions presented below demonstrate the potential of VxOySBA-15 as a model catalyst
for the selective oxidation of propene to acrolein The bare SBA-15 support showed no catalytic activity
Therefore it was possible to deduce structure-activity relations that can be assigned to the role of
vanadium oxide during the selective propene oxidation
92 Hydrated state of VxOySBA-15
The hydrated state of VxOySBA-15 was observed under ambient conditions in the presence of water A
suitable structural model was developed on the basis of UV-Vis-DRS and XAS experiments The model
structure of the hydrated state consisted of small clusters of vanadium oxide centers exhibiting a square
pyramidal coordination The UV-Vis-edge energy indicated that a two-dimensional and chainlike
extension of the vanadium oxide species on the SBA-15 was present similar to V2O62- vanadate
structures In situ spectroscopic experiments showed that the hydrated VxOySBA-15 structure was not
stable at elevated temperatures under oxidizing and under catalytic conditions
172
In situ measurements were conducted to obtain a detailed knowledge on the coordination of vanadium
centers in hydrated VxOySBA-15 and on the formation of hydrated VxOySBA-15 A smaller amount of
Si-OH groups in VxOySBA-15 compared to SBA-15 suggests that V-O-Si bonds were present in the
hydrated state of VxOySBA-15 Various time scales until a fully hydrated state was observed were
recorded for freshly prepared (weeks) and for dehydrated VxOySBA-15 (hours) Hence more V-O-Si
bonds may be present in freshly prepared VxOySBA-15 The hydrolysis of additional V-O-Si bonds
during hydration would explain the larger time scale observed for a full hydration of VxOySBA-15 The
vanadium centers in the hydrated state are coordinated by V-O-V V-OH and VmiddotmiddotH2O groups A
decomposition temperature below 440 K of the hydrated state indicates a rather weak bond of the
coordinated water species to the vanadium centers Apparent activation energies in the range of
70-90 kJmol were determined for the water desorption The apparent activation energies for the
desorption process of hydrated VxOySBA-15 increased with vanadium loading and storage time With
increasing time of storage a ldquogrowthrdquo of the hydrated VxOySBA-15 structure on high loaded 77 wt
VxOySBA-15 was observed This ldquogrowthrdquo was accompanied by an increased formation of V-V
interactions and a stronger interaction of coordinated water with the hydrated vanadium oxide species
The formation of V2O5middotnH2O gel like structures seemed likely In addition to the formation of the
dehydrated VxOySBA-15 structure the formation of V2O5 was observed during thermal decomposition of
these V2O5middotnH2O gel like structures
93 Dehydrated state of VxOySBA-15
The dehydrated VxOySBA-15 structure formed at temperatures above 440 K during thermal treatment of
hydrated VxOySBA-15 in 20 O2 The UV-Vis-DRS and XAFS spectra of dehydrated VxOySBA-15
showed similarity with those of vanadium oxide references exhibiting a dimeric or chainlike structure of
VOx tetrahedrons Therefore a model structure based on an ordered arrangement of adjacent [V2O7] units
was proposed for dehydrated VxOySBA-15 This theoretical model structure was refined successfully to
the experimental Fourier transformed EXAFS of all three VxOySBA-15 samples employed
Dehydration of hydrated VxOySBA-15 was accompanied by an increased amount of water in the gas
phase Structural rearrangement processes to the final structure of dehydrated VxOySBA-15 were
observed between 440 K and 550 K No intermediate structures were formed The number of dispersed
VxOy centers in the dehydrated state correlated significantly with the number of available Si-OH sites
Formation of V2O5 will be likely if the amount of vanadium centers exceeds the number of Si-OH groups
Therefore the presence of at least one V-O-Si bond per vanadium center or dimeric unit seems to be a
prerequisite for the formation of dehydrated tetrahedral vanadium centers Formation of three V-O-Si
bonds per vanadium site to the support seemed not likely because even for high vanadium loadings not all
Si-OH groups of SBA-15 reacted to V-O-Si bonds during dehydration at moderate temperatures of 723 K
Therefore V-OH groups may be present in dehydrated VxOySBA-15 For low VSi-OH ratios
(lt 05 Vnm2) the formation of isolated besides dimeric vanadium centers seemed likely The formation
173
of the dehydrated state was observed to be independent of the presence of water during the thermal
treatment
Small V2O5 aggregates formed on high loaded 77 wt VxOySBA-15 during dehydration and were able
to re-disperse on the support under calcination conditions The re-dispersion effect was observed for
vanadium loadings near the maximum surface coverage in the range of 24 Vnm2
94 Structure of VxOySBA-15 catalysts under reducing and under catalytic conditions
It was shown from Raman and UV-Vis-DRS measurements that the vanadium oxide structure under
propene oxidizing conditions corresponds mainly to the dehydrated VxOySBA-15 state Only minor
structural changes compared to the dehydrated state were observed in the V K edge XANES and EXAFS
spectra of VxOySBA-15 after reaction in propene and oxygen The observed changes affected the V-V
interactions slightly XAFS measurements showed that minor structural distortions may be present in the
second (V-V) coordination sphere Changes in the UV-Vis edge energy indicated that V-O-Si bonds
formed in the initial phase of the reaction with propene in the presence of oxygen V-OH groups may
have reacted with Si-OH groups to V-O-Si bonds For high loaded 77 wt VxOySBA-15 a decrease of
the Si-OH groups was detected in the 29Si MAS-NMR spectrum that was not observed under dehydrating
conditions This suggests that Si-OH groups reacted with the vanadium centers Furthermore the UV-Vis
edge energy shift observed in the UV-Vis-DR spectra was more distinct for 14 wt VxOySBA-15 than
for high loaded 77 wt VxOySBA-15 More V-O-V bonds were determined for 77 wt VxOySBA-15
Therefore V-OH rather than V-O-V bonds may be involved in the V-O-Si bond formation The
formation of V-O-Si bonds should be visible in the Raman spectra According to the theoretical
calculation [171] an increase in the region 873-962 cm-1 (Si-O-V out of phase interface mode) and in the
region 1020-1080 cm-1 (in phase mode) was expected However the data quality of the recoded spectra
was not sufficient to resolve these changes More detailed investigations would be desirable Further
measurements of changes of the V-OH groups with IR spectroscopy and of the Si-OH groups with in situ
NMR spectroscopy may elucidate the reaction observed
In addition to the structural characterization under catalytic conditions the reducibility of dehydrated
VxOySBA-15 catalysts was tested using propene as reducing agent Dehydrated VxOySBA-15 samples
were reducible independent of the vanadium loading XANES spectra suggest the formation of tetrahedral
or square pyramidal V4+ and V3+ centers In oxidizing conditions a complete re-oxidation of the reduced
vanadium species of VxOySBA-15 proceeded without formation of additional V-O-Si bonds In contrast
to the reduction of dehydrated VxOySBA-15 a lower reducibility was observed for VxOySBA-15
samples treated under propene oxidizing conditions prior to the reduction The reducibility was lower for
ldquoreactedrdquo 14 wt VxOySBA-15 than for ldquoreactedrdquo 77 wt VxOySBA-15 Therefore V-O-Si bonds
formed during catalytic reaction might not be involved in the reduction process Conversely V-O-V
bonds present in 77 wt VxOySBA-15 may be involved The changed reducibility of VxOySBA-15
174
under catalytic conditions is of great interest given that TPR experiments are commonly used to elucidate
the redox properties of vanadium oxide catalysts The reducibility cannot be deduced from the initial
dehydrated state of VxOySBA-15 This knowledge has to be considered for further TPR experiments with
VxOySBA-15
95 Catalytic performance of VxOySBA-15
In addition to elucidating the structure and reducibility of V xOySBA-15 a functional characterization
was performed The catalytic performance during propene oxidation was investigated using a laboratory
reactor The formation of selective oxidation products like acrolein propionaldehyde acetaldehyde
acetone and acetic acid was observed together with the formation of CO2 and CO Three major reaction
pathways existed for propene oxidation [35] First propene was selectively oxidized to acrolein with 18-
25 selectivity Second propene was oxidized to propionaldehyde and acetaldehyde and third propene
was oxidized to acetone and acetic acid The reaction products formed during the selective oxidation of
propene suggest that different oxygen species are involved In accordance with the literature [162]
formation of acrolein is ascribed to the presence of nucleophilic oxygen (O2-) that attacks propene at the
methyl group The formation of the other reaction products is ascribed to electrophilic oxygen (O2 O-
and O2) that attack propene at the C=C bond The origin of electrophilic oxygen may be a consequence of
the re-oxidation of reduced vanadium centers with molecular oxygen Thus future investigations with
other oxidizing agents like N2O which may enhance the selectivity for acrolein during propene oxidation
on VxOySBA-15 catalysts would be desirable The formation of acetone and acetic acid suggested that
V-OH groups were involved in propene oxidation For temperatures above 500 K the UV-Vis edge
energy shift indicated a reaction of V-OH to V-O-Si bonds Experiments at temperatures below 500 K
therefore may provide more information about the role of V-OH groups in propene oxidation
Furthermore the influence of high water content (gt 20 Vol) was not investigated in this work
Increasing the amount of water in the reaction atmosphere to a high content may increase the number of
V-OH groups Thus investigations with high water content seem promising to investigate the role of V-
OH groups in selective propene oxidation
Higher vanadium loading of VxOySBA-15 facilitated the consecutive reactions of the primary C3
aldehydes to C2 oxygenates and CO The amount of electrophilic oxygen may increase with higher
vanadium loading on SBA-15 However when combining the selectivities of the oxidation to the C3
aldehydes and the selectivity of the consecutive reactions of the respective reaction pathway no
significant difference was observed with vanadium loading Therefore decreasing the vanadium loading
of VxOySBA-15 does not alter the fundamental reaction pathways of the propene oxidation Conversely
a twice as high propene conversion rate and 40 higher acrolein formation rate per V site was observed
for 77 wt VxOySBA-15 compared to 41 wt and 14 wt VxOySBA-15 The same reaction rates
were determined for 41 wt and 14 wt VxOySBA-15 The increase in these reaction rates is attributed
to a higher density of adjacent [V2O7] units on 77 wt VxOySBA-15 Thus either the C-H abstraction
175
step or the electron transfer process during propene oxidation to acrolein may be facilitated due to the
increased number of neighboring vanadium sites
The reaction orders determined for the formation of acrolein were zero for oxygen and 05 for propene
The reaction order of 05 for propene could not be assigned unambiguously to a specific reaction
mechanism The zero reaction order for oxygen indicates that a fast re-oxidation of the vanadium centers
involved proceeds during the propene oxidation This interpretation is corroborated by the fact that the
average vanadium valance of VxOySBA-15 remained +5 during propene oxidation Furthermore UV-
Vis-DRS experiments with alternating reducing and oxidizing conditions showed that the re-oxidation
process of VxOySBA-15 is considerably faster than the reduction
96 Structure-activity correlations deduced from a comparison of VxOySBA-15 with bulk V2O5
Reduced vanadium oxide phases (ie V4O9 and VO2 (B)) were observed during the reaction of propene
and oxygen on V2O5 The formation of reduced vanadium phases may be caused by the participation of
mobile bulk oxygen species in the catalytic process (Chapter 2) Such mobile bulk oxygen species may
be required for the re-oxidation step in selective oxidation reactions (Mars van Krevelen mechanism)
However for VxOySBA-15 an average valance of V5+ was observed during catalytic oxidation of
propene although VxOySBA-15 exhibits no accessible mobile oxygen species Hence mobile bulk
oxygen species are not required for a fast re-oxidation of reduced vanadium species during the propene
oxidation Therefore the oxygen mobility in V2O5 is a consequence of its bulk structure but not a
prerequisite for the catalytic performance of vanadium oxides in selective oxidation reactions
The observed reaction products and selectivities detected during propene oxidation on VxOySBA-15
were not significantly different from those observed with bulk V2O5 (Chapter 2) Therefore basically the
same reaction steps may occur This suggests that similar active centers are present on the surface of
SBA-15 supported and bulk V2O5 during propene oxidation Similar active centers can be explained by
similar structural motifs of vanadium oxide clusters on the surface or they may be assigned to intrinsic
properties of the vanadium sites eg electronic and redox properties The latter is corroborated by the fact
that even 14 wt VxOySBA-15 for which isolated [VO4] units may be present showed basically the
same reaction pathways for the selective oxidation of propene with oxygen as bulk V2O5 (V4O9)
Apparently no change in the reaction pathways was observed when VxOySBA-15 model catalysts
consisting of small tetrahedral units with low extension were compared to structurally more complex
bulk V2O5 Moreover even an increase in the structural complexity among the VxOySBA-15 model
catalyst deduced from the increasing number of adjacent and connected tetrahedral vanadium centers did
not change significantly the reaction pathways for propene oxidation Only a decrease in acrolein
selectivity from 25 to 18 was observed with increasing loading which was assigned to consecutive
reactions of the primary aldehydes Hence the selectivity towards acrolein formation of vanadium oxide
centers seems to be independent on the vanadium oxide structure for the ldquobinaryrdquo V5+ catalysts
176
investigated here Thus structural complexity of the vanadium oxide structure seems to have only a
minor impact on the propene oxidation reaction over VxOySBA-15 model catalysts and bulk V2O5
97 Structure-activity correlations with respect to complex mixed metal oxide catalysts
The objective of the present work was elucidating structure-activity correlations of VxOySBA-15 model
catalysts for the selective oxidation of propene to acrolein The results obtained showed that supporting
vanadium oxide on SBA-15 enhanced the activity compared to bulk V2O5 while selectivity towards the
desired product acrolein remained similar The increase in activity is assigned to an increased number of
accessible surface sites on VxOySBA-15 catalysts Among the VxOySBA-15 samples 77 wt
VxOySBA-15 exhibited a superior activity Conversely almost the same selectivity towards acrolein was
observed Hence a higher density of active vanadium sites possibly with a higher connectivity than
isolated or dimeric vanadium units may facilitate the acrolein formation
However the low changes in acrolein selectivity suggested that the structural complexity of the vanadium
oxide phase of VxOySBA-15 and bulk V2O5 had only a minor impact on the propene oxidation
Presumably metal sites with a different character may be required which reduce and control the
unselective character of the active vanadium sites eg Mo Te W Such an interpretation suggests that
these metal sites in highly active bulk catalysts eg MoVNbTe may work as moderator for the vanadium
sites involved in the reaction Thus vanadium sites may increase the activity but the cooperation of
vanadium with other metal sites may be required to obtain a high selectivity In this case the chemical
complexity must be increased in order to improve the catalytic performance of vanadium sites in the
selective oxidation of propene towards acrolein However vanadium is mostly the minor component in
highly active mixed metal catalyst Therefore from the point of view of possible cooperating metal sites
like Mo it would be of interest whether certain host structures thus structural complexity must be
present to improve activity and selectivity of mixed metal oxide catalysts Hence in the next generation
of SBA-15 supported metal oxides mixed metal oxide systems eg Mo and V seem promisingly
The minor role of structural complexity of the vanadium oxide phase of VxOySBA-15 and bulk V2O5 on
selective propene oxidation is interesting and will need further investigation With respect to the variety
of structural configurations that are possible for vanadium oxide structures new model systems which
exhibit more complex vanadium oxide structures must be employed Moreover the structural complexity
of vanadium oxide sites in highly active ldquoMoVTerdquo catalysts may be higher than the structural complexity
provided by the VxOySBA-15 model system Changing the support material may be one opportunity to
obtain different vanadium oxide structures compared to that observed for VxOySBA-15 Nevertheless
the support material itself should not be active for propene oxidation like Nb2O5 Non-oxidic materials
like carbon or less active oxides like MgO or Ta2O5 may be more likely as possible support material
177
178
179
10 Appendix
101 Physisorption small angle XRD and CHNS results of SBA-15 and VxOySBA-15 samples
Table 10-1 Lattice plane distance (d100) and cell parameter (a0) determined from the 100 diffraction in the small angle XRD powder patterns BET surface area (SBET) C parameter (CBET) and BJH pore size (dporeBJH) pore volume (Vpore) and the SBA-15 channel wall thickness (dwall determined from a0-dporeBJH) of the initial bare and the functionalized VxOySBA-15 samples () sample prepared via the ion exchange method in Figure 4-1 () sample prepared by wet impregnation with a NH4VO3 solution () sample prepared by incipient wetness using a (NH4)6V10O28 solution
Sample
d100 [nm] a0 [nm] dporeBJH [nm] dwall [nm] (BJH)
Vpore [mlg] (BJH)
SBET [m2g-1] CBET
bare func bare func bare func bare func bare func bare func bare func
30 wt VxOySBA-15
102 100 118 115 80 71 38 44 078 067 751 522 148 186
57 wt VxOySBA-15
104 104 120 120 80 92 4 28 082 081 768 403 166 131
50 wt VxOySBA-15
103 102 119 118 80 70 39 48 066 050 639 270 166 180
77 wt VxOySBA-15
105 102 122 118 80 80 42 38 085 057 818 386 144 153
41 wt VxOySBA-15
100 99 115 114 70 70 45 44 067 057 607 427 146 155
14 wt VxOySBA-15
102 100 117 116 80 70 37 46 085 071 749 542 132 164
Table 10-2 CHN element content of bare SBA-15 SBA-15-APTES and calcined VxOySBA-15 samples () samples prepared via the ion exchange method in Figure 4-1 () sample prepared by wet impregnation with a NH4VO3 solution () sample prepared by incipient wetness using a (NH4)6V10O28 solution
Sample
bare SBA-15
[wt]
VxOy SBA-15 [wt]
APTESSBA-15 [wt]
APTESSBA-15 APTESSBA-15
C H C H N C H mmol N g Nnm2 (bare
SBA-15)
30 wt VxOySBA-15 01 10 02 09
57 wt VxOySBA-15 01 08 02 07
50 wt VxOySBA-15 20 06 00 04 16 48 15 114 11
77 wt VxOySBA-15 01 10 01 09 27 87 22 193 14
41 wt VxOySBA-15 01 00 01 11 19 72 17 136 13
14 wt VxOySBA-15 01 05 00 09 49 148 35 350 28
Appendix
180
102 Information Vanadium oxide and vanadate references
Table 10-3 Origin and theoretical XRD phases that match the experimental XRD powder pattern of the vanadium oxide references used
Sample Purchaser Synthesized Reference for Theoretical Structure
Ca3V2O8 Synthesized
(TU Berlin AK Ressler) [172]
Mg3V2O8 Synthesized
(TU Berlin AK Ressler) [67]
Na3VO4 Aldrich 9998 no explicit phase
m-Mg2V2O7 Synthesized
(TU Berlin AK Ressler) [69]
K3VO4 Alfa Aesar 999 no explicit phase
Ca2V2O7 Synthesized
(TU Berlin AK Ressler) [173]
t-Mg2V2O7 Synthesized
(TU Berlin AK Ressler) [139]
NaVO3 Aldrich 999 [174]
KVO3 Alfa Aesar 999 [175]
NH4VO3 Fluka 99 [138]
CaV2O6 Synthesized
(TU Berlin AK Ressler) [176]
(NH4)6V10O28 Synthesized
(TU Berlin AK Ressler) [177]
Mg3V10O28 middotxH2O Synthesized
(TU Berlin AK Ressler) [66]
MgV2O6 Synthesized
(TU Berlin AK Ressler) [68]
V2O5 Alfa Aesar 998 [140]
VO2(B) Synthesized
(TU-Berlin AK Lerch) [71]
V3O7 Synthesized
(TU-Berlin AK Lerch) [178]
V2O3 Synthesized
(TU-Berlin AK Lerch) [179]
181
103 Baselines of white reflectance standard measured in the in situ UV-Vis-DR cells used
0
100
20
40
60
80
200 800400 600Wavelength [nm]
Ref
lect
ion
[]
Integration SphereMgO (ABCR)
Figure 10-1 Baseline measured in the UV-Vis-DR spectrometer using the standard integration sphere
0
4
1
2
3
200 800400 600Wavelength [nm]
Ref
lect
ion
[]
Praying MantisTM Cell MgO (ABCR)
SBA-15
Figure 10-2 Baselines measured in the UV-Vis-DR spectrometer using the Praying MantisTM cell
182
104 In situ Raman measurements during dehydration
200 400 600 800 1000 12000
3000
6000
9000298 Kafter
773 K623 K
523 K
453 K
423 K
393 K
363 K
333 K298 K
inte
nsity
raman shift [cm-1]
3 mW 514 nm
267
521706 1037
269
522 705 1020
270
528 702 1023
273
5291026697
270 357
528
525
1037272
524 710 1038274
529 696 1037995
1034529
7051041
287
995
409
200 400 600 800 1000 1200500
1000
1500
2000
2500
3000
3500
4000
298 KH
2O
298 K
623 K
523 K
453 K
423 K
393 K
363 K
333 K
298 K
513
513710
702
707
1037
1037
inte
nsity
raman shift [cm-1]
1025
1027
1023
1032
1028
1035
1040
707
700
702
698
704514
407265
266
265
264
264
263
264
263
264521
515
513
518
521
514 nm 3mW
Figure 10-3 In situ Raman spectra during dehydration in a ldquodryrdquo (left) and a water saturated atmosphere (right) 20 O2 and 80 N2 (and ~ 45 H2O) 25 mlmin ndash 50 mlmin
105 Usable spectral range of the χ(k)k3 determined from in situ XAFS spectra
00
50
100
150
200
00
-50
4 6 8 10
χ(k)
k3
k [Aring-1]
EXAFS scan 723 K
EXAFS scan 298 K
QEXAFS scan 723 K
Figure 10-4 Usable spectral range of EXAFS and QEXAFS scans used for measurements of 77 wt VxOySBA-15 under catalytic conditions (5 propene and 5 O2 in He 40 mlmin)
183
106 Supporting data chapter 7
560 630 700 77000
01
02
03
04
01
02
03
04
01
02
03
04
05560 630 700 770
Sel
ectiv
ity
Temperature [K]
CO2
CO acetaldehyde propionaldehyde aceton acrolein acetic acid
UV-Vis-DR cell
SiO2 tube reactor
Sel
ectiv
ity
Sel
ectiv
ity
XAS cell
Figure 10-5 Product selectivities determined in the different measurement cells during the temperature programmed propene oxidation using a dehydrated 77 wt VxOySBA-15
550 575 600 625 650 675 700 725
000
005
010
015
020
Run 1
Run 2
acetaldehyde propionealdehyde acetone acrolein acetic acid
Con
cent
ratio
n [V
ol
]
Temperature [K]
000
005
010
015
020
Con
cent
ratio
n [V
ol
]
Figure 10-6 Product concentration during propene oxidation (5 O2 and 5 propene in He) of 77 wt VxOySBA-15 for subsequent temperature programmed reactions
184
-10 -05 00 05 10 15-8
-7
-6
-5
-4
-3 673 K
y(563)=06x-73 R=0999
y(673)=06x-50R=0996
y(633)=06x-61R=0992
ln(R
ate
Acr
olei
n) [m
olpr
open
e(g
catm
in)]
ln(c(C3H
6)) [molm3]
633 K 713 K
y(713)=08x-43R=0998
563 K
00 05 10 15-75
-70
-65
-60
-55
-50
-45
-40
-35
-30
633 K
y(563)=02x-70R=091
y(713)=05x-42R=099
y(673)=03x-48R=095
y(633)=02x-58R=088
ln(R
ate
Acr
olei
n) [m
olpr
open
e(g ca
tmin
)]
ln(c(O2)) [molm3]
673 K 713 K
563 K
Figure 10-7 Determination of the reaction order for propene (left) and oxygen (right) for the acrolein formation on 77 wt VxOySBA-15
-10 -05 00 05 10 15-10
-9
-8
-7
-6
-5
633 K
y(714)=06x-63 R=099
y(673)=05x-67 R=098
y(633)=05x-74 R=097
ln(R
ate
Acr
olei
n) [m
olpr
open
e(g
catm
in)]
ln(c(C3H
6)) [molm3]
673 K 714 K
563 K
y(563)=06x-86 R=098
00 05 10 15-10
-9
-8
-7
-6
-5
633 K
y(563)=-01x-8 R=099
y(714)=-01x-56 R=096
y(673)=00x-61 R=097
y(633)=-01x-68 R=098
ln(R
ate
Acr
olei
n) [m
olpr
open
e(g
catm
in)]
ln(c(O2)) [molm3]
673 K 714 K
( )
( )
( )
( )
563 K
Figure 10-8 Determination of the reaction order for propene (left) and oxygen (right) for the acrolein formation on 14 wt VxOySBA-15
185
107 Results of the analysis of the V K edge pre-edge feature
Table 10-4 Results of the analysis of the pre-edge feature determined from the normalized V K edge XANES spectra ( Chapter 8 Figure 8-2) Energy position at maximum intensity relative to V K edge (5645 keV) height of pre-edge peak at maximum intensity (PH) centroid energy and energy position of the individual components relative to V K edge (5645 keV) determined and total area of pre-edge peak from peak refinement according to Chaurand et al [94] (Section 524 Figure 5-4 right) product of pre-edge peak height and total area average V-O bond length from the literature (Table 10-3) and beamline used at Hasylab
Sample E PH
Component positon [eV] Total Area
Centroid RV-O PHmiddot Area
Beam-line
[ eV] 1 2 3 [eV] [Aring]
Ca3V2O8 470 108 470 331 497 206 471 170 223 A
Mg3V2O8 470 103 474 342 589 210 480 173 216 A
Na3VO4 470 105 473 342 530 201 469
A
m-Mg2V2O7 480 092 483 351 613 206 482 171 189 A
K3VO4 480 100 478 323 698 218 499
A
Ca2V2O7 490 083 483 310 605 184 492 177 152 A
t-Mg2V2O7 490 088 492 321 710 234 507 172 206 A
NaVO3 490 077 492 333 706 232 512 172 179 A
KVO3 490 086 487 309 699 234 498 174 201 A
NH4VO3 490 080 486 320 698 216 502 172 173 A
CaV2O6 520 075 517 359 672 180 545 182 135 A
(NH4)6V10O28 530 052 528 345 729 134 556 192 070 A
Mg3V10O28 530 055 525 339 731 136 547 192 075 A
MgV2O6 530 064 520 335 647 169 544 183 108 A
V2O5 540 057 301 532 683 189 594 183 108 A
hydrated VxOySBA-15
560 057 555 389 741 165 564
094 A
dehydrated VxOySBA-15
540 074 536 343 705 221 523
164 A
reduced 673 K VxOySBA-15
517 032 544 388
100 448
032 A
reduced 723 K VxOySBA-15
424 020 382 537 199 069 398
014 A
VO2(B) 526 030 395 550 757 114 542
034 C
V3O7 517 049 426 519 728 177 553
086 C
V2O3 519 012 087 258 466 032 399
004 C
186
108 Results from XRD refinements
monoclinic Mg2V2O7 (Sample B Figure 2-2)
R-Values [] Rexp 349 Rwp 622 Rp 471 GOF 178 Quantitative Analysis - Rietveld Phase 1 ICSD 2321 282(22) wt Phase 2 ICSD 93603 9718(22) wt Phase 1 ICSD 2321 [139] R-Bragg [] 2092
Spacegroup 1P Crystallite Size [nm] (Lorentzian) 266(46) Lattice parameters a (Aring) 13968(19) b (Aring) 5641(12) c (Aring) 48838(86) alpha (deg) 8113(11) beta (deg) 10583(12) gamma (deg) 13008(13) Phase 2 ICSD 93603 [69] R-Bragg [] 3255 Spacegroup P121c1 Crystallite Size [nm] (Lorentzian) 10169(60) Lattice parameters a (Aring) 660368(41) b (Aring) 841165(51) c (Aring) 948087(57) beta (deg) 1006372(10)
triclinic Mg2V2O7
R-Values[] Rexp 382 Rwp 680 Rp 512 GOF 178 Quantitative Analysis - Rietveld Phase 1 ICSD 2321 9600(35) wt Phase 2 ICSD 93603 400(35) wt Phase 1 ICSD 2321 [139] R-Bragg [] 2703
Spacegroup 1P Crystallite Size [nm] (Lorentzian) 1821(16) Lattice parameters a (Aring) 1377974(43) b (Aring) 541704(18) c (Aring) 492857(16) alpha (deg) 8137459(73) beta (deg) 10683011(74) gamma (deg) 13034723(69) Phase 2 ICSD 93603 [69] R-Bragg [] 2059 Spacegroup P121c1 Crystallite Size [nm] (Lorentzian) 193(31) Lattice parameters a (Aring) 6681(10) b (Aring) 8236(13) c (Aring) 9472(12) beta (deg) 9993(16)
187
MgV2O6 (Sample D Figure 2-2)
R-Values [] Rexp 351 Rwp 953 Rp 639 GOF 271 Phase ICSD 10391 [68] R-Bragg [] 7395 Spacegroup C12m1 Crystallite Size [nm] (Lorentzian) 1487(17) Strain (Gaussian) 00815(29) Lattice parameters a (Aring) 928049(49) b (Aring) 348887(18) c (Aring) 672976(36) beta (deg) 11173192(82)
Mg3V2O8
R-Values [] Rexp 264 Rwp 552 Rp 417 GOF 209 Phase ICSD 21085 [67] R-Bragg [] 2672 Spacegroup Cmca Crystallite Size [nm] (Lorentzian) 2042(27) Strain (Gaussian) 01085(16) Lattice parameters a (Aring) 606620(27) b (Aring) 1144485(50) c (Aring) 831868(36)
Mg3V10O28middotx H2O
R-Values [] Rexp 238 Rwp 1022 Rp 730 GOF 429 Phase Mg3V10O28middot28 H2O [66] R-Bragg [] 6247
Spacegroup 1P Crystallite Size [nm] (Lorentzian) 903(21) Strain (Gaussian) 000(14) Lattice parameters a (Aring) 1052751(64) b (Aring) 1074262(71) c (Aring) 213503(13) alpha (deg) 898932(68) beta (deg) 976450(62) gamma (deg) 1043959(66)
188
5049484746454443424140393837363534333231302928272625242322212019181716151413121110
700
600
500
400
300
200
100
0
-100
-200
-300
V4O9 8407 V2O5 1593
2 θ [deg]
Inte
nsity
Figure 10-9 Experimental Cu Kα XRD powder pattern of V4O9 determined in 5 propene in He (56 mlmin) (dotted black) at 598 K together with the XRD structure refinement of the corresponding phases (solid red) and the differential plot (solid grey)
Experimental XRD pattern of V4O9 determined during reduction of V2O5 in 5 propene in He
(56 mlmin) at 598 K
R-Values [] Rexp 1335 Rwp 3434 Rp 2742 GOF 257 Quantitative Analysis ndash Rietveld Phase 1 V4O9 Kijima 8407(90) wt Phase 2 V2O5 1593(90) wt Phase 1 V4O9 Kijima [56] R-Bragg [] 22440 Spacegroup Cmcm Crystallite Size [nm] (Lorentzian) 494(50) Strain (Gaussian) 1652(75) Lattice parameters a (Aring) 103877(47) b (Aring) 81717(28) c (Aring) 167118(21) Phase 2 V2O5 [140] R-Bragg [] 24828 Spacegroup Pmmn Crystallite Size [nm] (Lorentzian) 10000(870000) Strain (Gaussian) 280(29) Lattice parameters a (Aring) 11598(11) b (Aring) 35435(33) c (Aring) 43870(46)
189
Bibliography
[1] Centi G Cavani F Trifirograve F Selective Oxidation by Heterogeneous Catalysis Kluwer
Academic Plenum Publishers New York 2001 p 1
[2] Arpe H-J Industrielle Organische Chemie bedeutende Vor- und Zwischenprodukte 6th ed Wiley-VCH Weinheim Germany 2007 p 317
[3] Lin M M Selective oxidation of propane to acrylic acid with molecular oxygen Appl Catal A 2001 207 (1-2) 1-16
[4] Kniep B L Ressler T Rabis A Girgsdies F Baenitz M Steglich F Schloumlgl R Rational Design of Nanostructured CopperndashZinc Oxide Catalysts for the Steam Reforming of Methanol Angew Chem Int Ed 2004 43 (1) 112 ndash115
[5] Bettahar M M Costentin G Savary L Lavalley J C On the partial oxidation of propane and propylene in mixed metal oxide catalysts Appl Catal A 1996 145 (1-2) 1-48
[6] Schloumlgl R Active Sites for Propane Oxidation Some Gerneric Considerations Top Catal 2011 54 (10-12) 627-638
[7] Ressler T Solid-state kinetics and catalytic behavior of selective oxidation catalysts from time-resolved XAFS investigations Catal Today 2009 145 (3-4) 258ndash266
[8] Ressler T Walter A Huang Z-D Bensch W Structure and properties of a supported MoO3ndashSBA-15 catalyst for selective oxidation of propene J Catal 2008 254 (2) 170ndash179
[9] Ressler T Walter A Scholz J Tessonnier J-P Su D S Structure and properties of a Mo oxide catalyst supported on hollow carbon nanofibers in selective oxidation J Catal 2010 271 (2) 305ndash314
[10] Ressler T Dorn U Walter A Schwarz S Hahn A H P Structure and properties of PVMo11O40 heteropolyoxomolybdate supported on silica SBA-15 as selective oxidation catalyst J Catal 2010 275 (1) 1ndash10
[11] Bruumlckner W Oppermann H Reichelt W Terukow J I Abramowitsch F Wolf E Vanadiumoxide Darstellung Eigenschaften Anwendung Akademie-Verlag Berlin 1983 pp 13ndash17
[12] Dinse A Khennache S Frank B Hess C Herbert R Wrabetz S Schloumlgl R Schomaumlcker R Oxidative dehydrogenation of propane on silica (SBA-15) supported vanadia catalysts A kinetic investigation J Mol Catal A 2009 307 (1-2) 43ndash50
[13] Sugiyama S Hirata Y Osaka T Mogria T Nakagawa K Sotowa K-I 51V MAS NMR and XAFS Evidences for Redox of Magnesium Pyro- and Ortho-Vanadates on the Oxidative Dehydrogenation of Propane J Ceram Soc Jpn 2007 115 (10) 667ndash671
[14] Centi G Cavani F Trifirograve F Selective Oxidation by Heterogeneous Catalysis Kluwer Academic Plenum Publishers New York 2001 pp 203-283
190
[15] Loacutepez Nieto J M Kremenic G Fierro J L G Selective Oxidation of Propene over Supported Vanadium Oxide Catalysts Appl Catal A 1990 61 (1) 235ndash251
[16] Zhao C Wachs I E Selective oxidation of propylene over model supported V2O5 catalysts Influence of surface vanadia coverage and oxide support J Catal 2008 257 (1) 181ndash189
[17] Bauer G Guumlther V Hess H Otto A Roidl O Roller H Sattelberger S Vanadium and Vanadium Compounds In Ullmannrsquos Encyclopedia of Industrial Chemistry Wiley-VCH Weinheim Germany 2005 doi10100214356007a27_367
[18] Weckhuysen B M Keller D E Chemistry spectroscopy and the role of supported vanadium oxides in heterogeneous catalysis Catal Today 2003 78 (1-4) 25ndash46
[19] Bartholomew C H Farrauto R J Fundamentals of Industrial Catalytic Processes 2nd ed Wiley-VCH Hoboken NJ 2006 pp 580ndash583
[20] Hess C Hoefelmeyer J D Tilley T D Bell A T Partial oxidation of methanol over highly dispersed vanadia supported on silica SBA-15 Catal Lett 2005 105 (1-2) 1ndash8
[21] Bronkema J L Bell A T Mechanistic Studies of Methanol Oxidation to Formaldehyde on Isolated Vanadate Sites Supported on MCM-48 J Phys Chem C 2007 111 (1) 420ndash430
[22] Du G Lim S Pinault M Wang C Fang F Pfefferle L Haller G L Synthesis characterization and catalytic performance of highly dispersed vanadium grafted SBA-15 catalyst J Catal 2008 253 (1) 74ndash90
[23] Gao X Bare S R Weckhuysen B M Wachs I E In Situ Spectroscopic Investigation of Molecular Structures of Highly Dispersed Vanadium Oxide on Silica under Various Conditions J Phys Chem B 1998 102 (52) 10842ndash10852
[24] Berndt H Martin A Bruumlckner A Schreier E Muumlller D Kosslick H Wolf G-U Luumlcke B Structure and Catalytic Properties of VOxMCM Materials for the Partial Oxidation of Methane to Formaldehyde J Catal 2000 191 (2) 384ndash400
[25] Forneacutes V Loacutepez C Loacutepez H H Martiacutenez A Catalytic performance of mesoporous VOxSBA-15 catalysts for the partial oxidation of methane to formaldehyde Appl Catal A 2003 249 (2) 345ndash354
[26] Launay H Loridant S Nguyen D L Volodin A M Dubois J L Millet J M M Vanadium species in new catalysts for the selective oxidation of methane to formaldehyde Activation of the catalytic sites Catal Today 2007 128 (3-4) 176ndash182
[27] Nguyen L D Loridant S Launay H Pigamo A Dubois J L Millet J M M Study of new catalysts based on vanadium oxide supported on mesoporous silica for the partial oxidation of methane to formaldehyde Catalytic properties and reaction mechanism J Catal 2006 237 (1) 38ndash48
[28] Gruene P Wolfram T Pelzer K Schloumlgl R Trunschke A Role of dispersion of vanadia on SBA-15 in the oxidative dehydrogenation of propane Catal Today 2010 157 (1-4) 137ndash142
[29] Ovsitser O Cherian M Kondratenko E V In-Situ UVvis and Transient Isotopic Analysis of the Role of Oxidizing Agent in the Oxidative Dehydrogenation of Propane over Silica-Supported Vanadia Catalysts J Phys Chem C 2007 111 (24) 8594ndash8602
[30] Wachs I E Weckhuysen B M Structure and reactivity of surface vanadium oxide species on oxide supports Appl Catal A 1997 157 (1-2) 67ndash90
191
[31] Muylaert I Van Der Voort P Supported vanadium oxide in heterogeneous catalysis elucidating the structurendashactivity relationship with spectroscopy Phys Chem Chem Phys 2009 11 (16) 2826ndash2832
[32] Hess C Hoefelmeyer J D Tilley T D Spectroscopic Characterization of Highly Dispersed Vanadia Supported on SBA-15 J Phys Chem B 2004 108 (28) 9703ndash9709
[33] Hanke W Bienert R Jerschkewitz H-G Untersuchungen an katalytisch aktiven Oberflaumlchenverbindungen Herstellung und Untersuchung von Vanadinoxid-Phasen auf SiO2 Z Anorg Allg Chem 1975 414 (2) 109ndash129
[34] Xie S Iglesia E Bell A T Effects of Hydration and Dehydration on the Structure of Silica-Supported Vanadia Species Langmuir 2000 16 (18) 7162ndash7167
[35] Morey M Davidson A Eckert H Stucky G Pseudotetrahedral O32VO Centers Immobilized on the Walls of a Mesoporous Cubic MCM-48 Support Preparation Characterization and Reactivity toward Water As Investigated by 51V NMR and UVndashVis Spectroscopies Chem Mater 1996 8 (2) 486ndash492
[36] Thomson Reuters (formerly ISI) Web of Knowledge database httpwwwisiwebofknowledge com (accessed Jan 2011)
[37] Keller D E Koningsberger D C Weckhuysen B M Molecular Structure of a Supported VO4 Cluster and Its Interfacial Geometry as a Function of the SiO2 Nb2O5 and ZrO2 Support J Phys Chem B 2006 110 (29) 14313ndash14325
[38] Chlosta R Tolzov-Muumlller G Schloumlgl R Hess C Nature of dispersed vanadium oxide influence of the silica support structure and synthesis methods Catal Sci Technol 2011 doi 101039c1cy00062d
[39] Molinari J E Wachs I E Presence of Surface Vanadium Peroxo-oxo Umbrella Structures in Supported Vanadium Oxide Catalysts Fact or Fiction J Am Chem Soc 2010 132 (36) 12559ndash12561
[40] Schraml-Marth M Wokaun A Pohl M Krauss H-L Spectroscopic Investigation of the Structure of Silica-supported Vanadium Oxide Catalysts at Submonolayer Coverages J Chem Soc Faraday Trans 1991 87 (16) 2635ndash2646
[41] Walter A Herbert R Hess C Ressler T Structural characterization of vanadium oxide catalysts supported on nanostructured silica SBA-15 using X-ray absorption spectroscopy Chem Cent J 2010 4 3
[42] Haumlvecker M Cavalleri M Herbert R Follath R Knop-Gericke A Hess C Hermann K Schloumlgl R Methodology for the structural characterisation of VxOy species supported on silica under reaction conditions by means of in situ O K-edge X-ray absorption spectroscopy Phys Status Solidi B 2009 246 (7) 1459ndash1469
[43] Cavalleri M Hermann K Knop-Gericke A Haumlvecker M Herbert R Hess C Oestereich A Doumlbler J Schloumlgl R Analysis of silica-supported vanadia by X-ray absorption spectroscopy Combined theoretical and experimental studies J Catal 2009 262 (2) 215ndash223
[44] Venkov T V Hess C Jentoft F C Redox Properties of Vanadium Ions in SBA-15-Supported Vanadium Oxide An FTIR Spectroscopic Study Langmuir 2007 23 (4) 1768ndash1777
[45] Rozanska X Kondratenko E V Sauer J Oxidative dehydrogenation of propane Differences between N2O and O2 in the reoxidation of reduced vanadia sites and consequences for selectivity J Catal 2008 256 (1) 84ndash94
192
[46] Novakova E K Veacuterdrine J C Propane Selective Oxidation to Propene and Oxygenates on Metal Oxides In Metal Oxides Chemistry and Applications Fierro J L G Ed CRC Press Boca Raton FL 2006 pp 413ndash461
[47] Ressler T Solid-state kinetics and catalytic behavior of selective oxidation catalysts from time-resolved XAFS investigations Catal Today 2009 145 (3-4) 258ndash266
[48] Loacutepez Nieto J M Kremenic G Fierro J L G Selective Oxidation of Propene over Supported Vanadium Oxide Catalysts Appl Catal 1990 61 (1) 235ndash251
[49] Centi G Cavani F Trifirograve F Selective Oxidation by Heterogeneous Catalysis Kluwer Academic Plenum Publishers New York 2001 p 234
[50] Patel D Andersen P J Kung H H Oxidative Dehydrogenation of Butane over Orthovanadates J Catal 1990 125 (1) 132ndash142
[51] Solsona B Dejoz A Vaacutezquez M I Maacuterquez F Loacutepez Nieto J M SiO2-supported vanadium magnesium mixed oxides as selective catalysts for the oxydehydrogenation of short chain alkanes Appl Catal A 2001 208 (1-2) 99ndash110
[52] Siew Hew Sam D Soenen V Volta J C Oxidative Dehydrogenation of Propane over V---Mg---O Catalysts J Catal 1990 123 (2) 417ndash435
[53] Cavani F Ballarini N Cericola A Oxidative dehydrogenation of ethane and propane How far from commercial implementation Catal Today 2007 127 (1-4) 113ndash131
[54] Kung H H Kung M C Oxidative dehydrogenation of alkanes over vanadium-magnesium-oxides Appl Catal A 1997 157 (1-2) 105ndash116
[55] Gao X Ruiz P Xin Q Guo X Delmon B Preparation and characterization of three pure magnesium vanadate phases as catalysts for selective oxidation of propane to propene Catal Lett 1994 23 (3-4) 321ndash337
[56] Kijima N Toba M Yoshimura Y A Chemical Potential Diagram and an In-situ X-ray Diffraction Analysis of a VndashMgndashO Catalyst Used in the Oxidative Dehydrogenation of n-Butane Catal Lett 2009 127 (1-2) 63ndash69
[57] Sugiyama S Hirata Y Osaka T Mogria T Nakawa K Sotowa K-I 51V MAS NMR and XAFS Evidences for Redox of Magnesium Pyro- and Ortho-Vanadates on the Oxidative Dehydrogenation of Propane J Ceram Soc Jpn 2007 115 (10) 667ndash671
[58] Balderas-Tapia L Hernaacutendez-Peacuterez I Schacht P Coacuterdova I R Aguilar-Riacuteos G G Influence of reducibility of vanadiumndashmagnesium mixed oxides on the oxidative dehydrogenation of propane Catal Today 2005 107-108 371ndash376
[59] Ballarini N Battisti A Cavani F Cericola A Cortelli C Ferrari M Trifirograve F Arpentinier P The combination of propane partial oxidation and of WGS reaction in a single catalytic bed and the self-adapting catalytic properties of vanadium oxide catalyst Appl Catal A 2006 307 (1) 148ndash155
[60] Haber J Witko M Tokarz R Vanadium pentoxide I Structures and properties Appl Catal A 1997 157 (1-2) 3ndash22
[61] Colpaert M N Clauws P Fiermans L Vennik J Thermal and low energy electron bombardment induced oxygen loss of V2O5 single crystals Transition into V6O13 Surf Sci 1973 36 (2) 513ndash525
193
[62] Colpaert M N Exploratory Study of Catalytic Oxidation Reactions on Vanadium Pentoxide Single Crystals Z Phys Chem (Frankfurt) 1973 84 (1-4) 150ndash156
[63] Andersson A An Oxidized Surface State Model of Vanadium Oxides and Its Application to Catalysis J Solid State Chem 1982 42 (3) 263ndash275
[64] Yamazaki S Li C Ohoyama K Nishi M Ichihara M Ueda H Ueda Y Synthesis structure and magnetic properties of V4O9 ndash A missing link in binary vanadium oxides J Solid State Chem 2010 183 (7) 1496ndash1503
[65] Holgado J P Soriano M D Jimeacutenez-Jimeacutenez J Concepcioacuten P Jimeacutenez-Loacutepez A Caballero A Rodriacuteguez-Castelloacuten E Loacutepez Nieto J M Operando XAS and Raman study on the structure of a supported vanadium oxide catalyst during the oxidation of H2S to sulphur Catal Today 2010 155 (3-4) 296ndash301
[66] Iida A Ozeki T Mg2Na2V10O28middot20H2O and Mg3V10O28middot28H2O Acta Crystallogr Sect C 2004 C60 i43ndashi46
[67] Krishnamachari N Calvo C Refinement of the Structure of Mg3(VO4)2 Can J Chem 1971 49 (10) 1629ndash1637
[68] Ng H N Calvo C Crystal Structure of and Electron Spin Resonance of Mn2+ in MgV2O6 Can J Chem 1972 50 (22) 3619ndash3624
[69] Nielsen U G Jakobsen H J Skibsted J Norby P Crystal structure of α-Mg2V2O7 from synchrotron X-ray powder diffraction and characterization by 51V MAS NMR spectroscopy J Chem Soc Dalton Trans 2001 21 3214ndash3218
[70] Ulikaacute L Thermal Decomposition of Decavanadates of Bivalent Metals J Therm Anal Calorim 1980 18 (1) 127ndash136
[71] Oka Y Yao T Yamamoto N Ueda Y Hayashi A Phase Transition and V4+-V4+ Pairing in VO2(B) J Solid State Chem 1993 105 (1) 271ndash278
[72] Kim Y H Lee H-I Redox Property of Vanadium Oxide and Its Behavior in Catalytic Oxidation Bull Korean Chem Soc 1999 20 (12) 1457ndash1463
[73] Kijima N Toba M Yoshimura Y A Chemical Potential Diagram and an In-situ X-ray Diffraction Analysis of a VndashMgndashO Catalyst Used in the Oxidative Dehydrogenation of n-Butane Catal Lett 2009 127 (1-2) 63ndash69
[74] Bruumlckner W Oppermann H Reichelt W Terukow J I Abramowitsch F Wolf E Vanadiumoxide Darstellung Eigenschaften Anwendung Akademie-Verlag Berlin 1983 pp 13ndash17
[75] Schiebold E Uumlber die Kristallstruktur des Periclas Z Kristallogr 1921 56 430-435
[76] Ruumldorff W Reuter B Die Struktur der Magnesium- und Zink-Vanadinspinelle Beitrag zur Struktur der Spinelle Z Anorg Allg Chem 1947 253 (3-4) 194ndash208
[77] Reuter B Aust R Colsmann G Neuwald Ch Uumlber Oxidsysteme mit Uumlbergangsmetallionen in verschiedenen Oxydationsstufen XIX Darstellung und Eigenschaften Vanadium(II)-haltiger und damit n-leitender Vanadium(III)-Spinelle Z Anorg Allg Chem 1983 500 (5) 188ndash198
[78] Bosch H Kip B J Van Ommen J G Gellings P J Factors Influencing the Temperature-programmed Reduction Profiles of Vanadium Pentoxide J Chem Soc Faraday Trans 1 1984 80 (9) 2479ndash2488
194
[79] Theacuteobald F Cabala R Bernard J C R Acad Sci Paris 1969 269 1209ndash1212
[80] Burrows A Kiely C J Perregaard J Hoslashjlund-Nielsen P E Vorbeck G Calvino J J Loacutepez-Cartes C Structural characterisation of a VMgO catalyst used in the oxidative dehydrogenation of propane Catal Lett 1999 57 (3) 121ndash128
[81] Soenen V Herrmann J M Volta J C In Situ Electrical Characterization of Magnesium Vanadate Reference Phases (meta-MgV2O6 pyro-Mg2V2O7 and ortho-Mg3V2O8) Used in Oxidative Dehydrogenation of Propane to Propene J Catal 1996 159 (2) 410ndash417
[82] Zhao D Feng J Huo Q Melosh N Fredrickson G H Chmelka B F Stucky G D Triblock Copolymer Syntheses of Mesoporous Silica with Periodic 50 to 300 Angstrom Pores Science (Washington DC) 1998 279 (5350) 548ndash552
[83] Schreiber A Ketelsen I Findenegg G H Melting and freezing of water in ordered mesoporous silica materials Phys Chem Chem Phys 2001 3 (7) 1185ndash1195
[84] Adaptation from Harris D C Exploring Chemical Analysis Freeman New York 1997 Home Page httparchivesevergreeneduwebpagescurricular20002001MANDM2000Handouts Labs Chemistrylab6xhtm (accessed July 2008)
[85] FEFF Home Page httpleonardophyswashingtonedufeff (accessed May 2011)
[86] Koningsberger D C Prins R Eds X-ray Absorption principles applications techniques of EXAFS SEXAFS and XANES Wiley New York 1988
[87] Weckhuysen B M Ed In-situ spectroscopy of catalysts American Scientific Publishers California 2004 Chapters 6 7 9
[88] Rehr J J Booth C H Bridges F Zabinsky S I X-ray-absorption fine structure in embedded atoms Phys Rev B Condens Matter 1994 49 (17) 12347ndash12350
[89] Rehr J J Albers R C Theoretical approaches to x-ray absorption fine structure Rev Mod Phys 2000 72 (3) 621ndash654
[90] Ressler T Jentoft R E Wienold J Guumlnter M M Timpe O In Situ XAS and XRD Studies on the Formation of Mo Suboxides during Reduction of MoO3 J Phys Chem B 2000 104 (27) 6360ndash6370
[91] Ressler T WinXAS a program for X-ray absorption spectroscopy data analysis under MS-Windows J Synchrotron Radiat 1998 5 (2) 118ndash122
[92] Ressler T Brock S L Wong J Suib S L Multiple-Scattering EXAFS Analysis of Tetraalkylammonium Manganese Oxide Colloids J Phys Chem B 1999 103 (31) 6407ndash6420
[93] Press W H Teukolsky S A Vetterling W T Flannery B P Numerical Recipes The Art of Scientific Computing 3rd ed Cambridge University Press New York 2007 (wwwnrcom)
[94] Chaurand P Rose J Briois V Salome M Proux O Nassif V Olivi L Susini J Hazemann J-L Bottero J-Y New Methodological Approach for the Vanadium K-Edge X-ray Absorption Near-Edge Structure Interpretation Application to the Speciation of Vanadium in Oxide Phases from Steel Slag J Phys Chem B 2007 111 (19) 5101ndash5110
[95] Weckhuysen B M Van der Voort P Catana G Eds Spectroscopy of transition metal ions on surfaces Leuven University Press Leuven Belgium 2000 pp 221ndash268
[96] Kober F Grundlagen der Komplexchemie Salle Frankfurt am Main 1979
195
[97] Woodward P M Mizoguchi H Kim Y-I Stoltzfus M W The Electronic Structure of Metal Oxides In Metal oxides chemistry and applications Fierro J L G Ed Taylor amp Francis Boca Raton FL 2006 pp 133ndash193
[98] Kortuumlm G Reflexionsspektroskopie Grundlagen Methodik Anwendungen Springer Berlin 1969
[99] Delgass W N Diffuse reflectance and photoacoustic spectroscopies In Spectroscopy in heterogeneous catalysis Academic Press New York 1979 pp 86ndash131
[100] Gao X Wachs I E Investigation of Surface Structures of Supported Vanadium Oxide Catalysts by UV-vis-NIR Diffuse Reflectance Spectroscopy J Phys Chem B 2000 104 (6) 1261ndash1268
[101] Barrett E P Joyner L G Halenda P P The Determination of Pore Volume and Area Distributions in Porous Substances I Computations from Nitrogen Isotherms J Am Chem Soc 1951 73 (1) 373
[102] Massiot D Fayon F Capron M King I Le Calveacute S Alonso B Durand J-O Bujoli B Gan Z Hoatson G Modelling one- and two-dimensional solid-state NMR spectra Magn Reson Chem 2002 40 (1) 70ndash76
[103] Thielemann J Synthesis Characterization and in situ Catalysis of Silica SBA-15 Supported Molybdenum Oxide Model Catalysts Dissertation Technical University Darmstadt 2011
[104] Vansant E F Van Der Voort P Vrancken K C Characterization and chemical modification of the silica surface studies in surface science and catalysis 93 Elsevier Amsterdam 1995 pp 93ndash126
[105] Fitzer E Fritz W Technische Chemie Einfuumlhrung in die chemische Reaktionstechnik 3rd ed Springer Berlin 1989 pp 42ndash49
[106] NIST chemistry WebBook database httpwebbooknistgovchemistry (accessed Aug 2010)
[107] Asatryan R da Silva G Bozzelli J W Quantum Chemical Study of the Acrolein (CH2CHCHO) + OH + O2 Reactions J Phys Chem A 2010 114 (32) 8302ndash8311
[108] Olthof B Khodakov A Bell A T Iglesia E Effects of Support Composition and Pretreatment Conditions on the Structure of Vanadia Dispersed on SiO2 Al2O3 TiO2 ZrO2 and HfO2 J Phys Chem B 2000 104 (7) 1516ndash1528
[109] Hardcastle F D Wachs I E Determination of Vanadium-Oxygen Bond Distances and Bond Orders by Raman Spectroscopy J Phys Chem 1991 95 (13) 5031ndash5041
[110] Sing K S W Everett D H Haul R A W Moscou L Pierotti R A Rouqueacuterol J Siemieniewska T Reporting physisorption data for gassolid systems with Special Reference to the Determination of Surface Area and Porosity Pure Appl Chem 1985 57 (4) 603ndash619
[111] Herbert R Synthesis Characterization and Catalysis of Nanostructured Vanadia Model Catalysts for Partial Oxidation of Propane Dissertation Technical Universiy Berlin 2008
[112] Van Der Voort P Ravikovitch P I De Jong K P Benjelloun M Van Bavel E Janssen A H Neimark A V Weckhuysen B M Vansant E F A New Templated Ordered Structure with Combined Micro- and Mesopores and Internal Silica Nanocapsules J Phys Chem B 2002 106 (23) 5873ndash5877
196
[113] Meyen V Cool P Vansant E F Kortunov P Grinberg F Kraumlger J Mertens M Lebedev O I Van Tendeloo G Deposition of vanadium silicalite-1 nanoparticle on SBA-15 materials Structural and transport characteristics of SBA-VS-15 Micropor Mesopor Mat 2007 99 (1-2) 14ndash22
[114] Keller D E Visser T Soulimani F Koningsberger D C Weckhuysen B M Hydration effects on the molecular structure of silica-supported vanadiumoxide catalysts A combined IR Raman UVndashvis and EXAFS study Vib Spectrosc 2007 43 (1) 140ndash151
[115] Hess C Wild U Schloumlgl R The mechanism for the controlled synthesis of highly dispersed vanadia supported on silica SBA-15 Micropor Mesopor Mat 2006 95 (1-3) 339ndash349
[116] Liu W Lai S Y Dai H Wang S Sun H Au C T Oxidative dehydrogenation of n-butane over mesoporous VOxSBA-15 catalysts Catal Lett 2007 113 (3-4) 147ndash154
[117] Hess C Tzolova-Muumlller G Herbert R The Influence of Water on the Dispersion of Vanadia Supported on Silica SBA-15 A Combined XPS and Raman Study J Phys Chem C 2007 111 (26) 9471ndash9479
[118] Hess C Direct correlation of the dispersion and structure in vanadium oxide supported on silica SBA-15 J Catal 2007 248 (1) 120ndash123
[119] Oyama S T Went G T Lewis K B Bell A T Somorjai G A Oxygen Chemisorption and Laser Raman Spectroscopy of Unsupported and Silica-Supported Vanadium Oxide Catalysts J Phys Chem B 1989 93 (18) 6786ndash6790
[120] Keller D E Koningsberger D C Weckhuysen B M Elucidation of the Molecular structure of Hydrated Vanadium Oxide Species by X-ray Absorption Spectroscopy Correlation between the VmiddotmiddotmiddotV coordination number and distance and the point of zero charge of the support oxide Phys Chem Chem Phys 2006 8 (41) 4814ndash4824
[121] Keller D E Airaksinen S M K Krause A O Weckhuysen B M Koningsberger D C Atomic XAFS as a Tool To Probe the Reactivity of Metal Oxide Catalysts Quantifying Metal Oxide Support Effects J Am Chem Soc 2007 129 (11) 3189ndash3197
[122] Keller D E Weckhuysen B M Koningsberger D C Application of AXAFS Spectroscopy to Transition-Metal Oxides Influence of the Nearest and Next Nearest Neighbour Shells in Vanadium Oxides Chem Eur J 2007 13 (20) 5845ndash5856
[123] Tanaka T Yamashita H Tsuchitani R Funabiki T Yoshida S X-Ray absorption (EXAFSXANES) study of supported vanadium oxide catalysts Structure of surface vanadium oxide species on silica and γ-alumina at a low level of vanadium loading J Chem Soc Faraday Trans 1 1988 84 (9) 2987ndash2999
[124] Keller D E de Groot F M F Koningsberger D C Weckhuysen B M ΛO4 Upside Down A New Molecular Structure for Supported VO4 Catalysts J Phys Chem B 2005 109 (20) 10223ndash10233
[125] Sojka Z Bozon-Verduraz F Che M UVndashVisndashNIR and EPR Spectroscopies In Handbook of heterogeneous catalysis 2nd ed Ertl G Knoumlzinger H Schuumlth F Weitkamp J Eds Wiley-VCH Weinheim Germany 2008 Vol 2 pp 1039ndash1065
[126] Weckhuysen B M Van Der Voort P Catana G Eds Spectroscopy of transition metal ions on surfaces Leuven University Press Leuven Belgium 2000 Chapter 4 pp 244ndash254
[127] Weber R S Effect of Local Structure on the UV-Visible Absorption Edges of Molybdenum Oxide Clusters and Supported Molybdenum Oxides J Catal 1995 151 (2) 470ndash474
197
[128] Tian H Roberts C A Wachs I E Molecular Structural Determination of Molybdena in Different Environments Aqueous Solutions Bulk Mixed Oxides and Supported MoO3 Catalysts J Phys Chem C 2010 114 (33) 14110ndash14120
[129] Ross-Medgaarden E I Wachs I E Structural Determination of Bulk and Surface Tungsten Oxides with UVminusvis Diffuse Reflectance Spectroscopy and Raman Spectroscopy J Phys Chem C 2007 111 (41) 15089ndash15099
[130] Haaszlig F Adams A H Buhrmester T Schimanke G Martin M Fuess H X-Ray absorption and X-ray diffraction studies on molybdenum doped vanadium pentoxide Phys Chem Chem Phys 2003 5 (19) 4317-4324
[131] Wong J Lytle F W Messmer R P Maylotte D H K-edge absorption spectra of selected vanadium compounds Phys Rev B Condens Matter 1984 30 (10) 5596ndash5610
[132] Centi G Perathoner S Trifiro F Aboukais A Aissi C F Guelton M Physicochemical characterization of V-silicalite J Phys Chem 1992 96 (6) 2617ndash2629
[133] So H Pope M T Origin of some charge-transfer spectra Oxo compounds of vanadium molybdenum tungsten and niobium including heteropoly anions and heteropoly blues Inorg Chem 1972 11 (6) 1441ndash1443
[134] Ronde H Snijder J G The position of the VO3minus4 charge-transfer transition as a function of the
V---O distance Chem Phys Lett 1977 50 (2) 282ndash283
[135] Lazukova N I Gubanov V A Mokerov V G Electronic Absorption Spectra of V2O5 Int J Quantum Chem 1977 12 (5) 915-923
[136] Avdeev V I Zhidomirov G M Modeling the active centers of V2O5SiO2 and V2O5TiO2 supported catalysts DFT theoretical analysis of optical properties J Struct Chem+ 2005 46 (4) 577ndash590
[137] Thielemann J P Ressler T Walter A Tzolova-Muumlller G Hess C Structure of molybdenum oxide supported on silica SBA-15 studied by Raman UVndashVis and X-ray absorption spectroscopy Appl Catal A 2011 399 (1-2) 28ndash34
[138] Hawthorne F C Calvo C The crystal chemistry of the M+VO3 (M+= Li Na K NH4 Tl Rb
and Cs) pyroxenes J Solid State Chem 1977 22 (2) 157ndash170
[139] Gopal R Calvo C Crystal Structure of Magnesium Divanadate Mg2V2O7 Acta Crystallogr Sect B 1974 B30 (10) 2491ndash2493
[140] Enjalbert R Galy J A Refinement of the Structure of V2O5 Acta Crystallogr Sect C 1986 C42 1467ndash1469
[141] Launay H Loridant S Pigamo A Dubois J L Millet J M M Vanadium species in new catalysts for the selective oxidation of methane to formaldehyde Specificity and molecular structure dynamics with water J Catal 2007 246 (2) 390ndash398
[142] Baltes M Cassiers K Van Der Voort P Weckhuysen B M Schoonheydt R A Vansant E F MCM-48-Supported Vanadium Oxide Catalysts Prepared by the Molecular Designed Dispersion of VO(acac)2 A Detailed Study of the Highly Reactive MCM-48 Surface and the Structure and Activity of the Deposited VOx J Catal 2001 197 (1) 160ndash171
[143] Jehng J-M Deo G Weckhuysen B M Wachs I E Effect of water vapor on the molecular structures of supported vanadium oxide catalysts at elevated temperatures J Mol Catal A 1996 110 (1) 41ndash54
198
[144] Pentildea M L Dejoz A Forneacutes V Rey F Vaacutezquez M I Loacutepez Nieto J M V-containing MCM-41 and MCM-48 catalysts for the selective oxidation of propane in gas phase Appl Catal A 2001 209 (1-2) 155ndash164
[145] Luan Z Bae J Y Kevan L Vanadosilicate Mesoporous SBA-15 Molecular Sieves Incorporated with N-Alkylphenothiazines Chem Mater 2000 12 (10) 3202ndash3207
[146] Dzwigaj S El Malki E M Peltre M-J Massiani P Davidson A Che M Effect of calcinationrehydration treatments on the environment of V in β zeolite Top Catal 2000 11-12 (1-4) 379ndash390
[147] Zhuravlev L T The surface chemistry of amorphous silica Zhuravlev model Colloids Surf A 2000 173 (1-3) 1ndash38
[148] Abello L Husson E Repelin Y Lucazeau G Structural Study of Gels of V2O5Vibrational Spectra of Xerogels J Solid State Chem 1985 56 (3) 379ndash389
[149] Knoumltziger H Taglauer E Toward Supported Oxide Catalysts via Solid-Solid Wetting Catalysis 1993 10 1ndash40
[150] Wang C-B Cai Y Wachs I E Reaction-Induced Spreading of Metal Oxides onto Surfaces of Oxide Supports during Alcohol Oxidation Phenomenon Nature and Mechanisms Langmuir 1999 15 (4) 1223ndash1235
[151] Van Der Voort P White M G Mitchell M B Verberckmoes A A Vansant E F The effect of water on the structure of supported vanadium oxide structures An FT-RAMAN in situ DRIFT and in situ UV-VIS diffuse reflectance study Spectrochim Acta Part A 1997 53 (12) 2181ndash2187
[152] Atanasov M Adamsky H Eiffert K Valence Stabilization Mixed Crystal Chemistry and Electronic Transitions in Tetrahedral Oxo and Hydroxo Cr(IV) Mn(V) and Fe(VI) Clusters A Theoretic Investigation J Solid State Chem 1997 128 (1) 1ndash16
[153] Liu T-C Forissier M Coudurier G Veacutedrine J C Properties of Molybdate Species Supported on Silica J Chem Soc Faraday Trans 1 1989 85 (7) 1607ndash1618
[154] Hess C Nanostructured Vanadium Oxide Model Catalysts for Selective Oxidation Reactions ChemPhysChem 2009 10 (2) 319ndash326
[155] Dinse A Frank B Hess C Habel D Schomaumlcker R Oxidative dehydrogenation of propane over low-loaded vanadia catalysts Impact of the support material on kinetics and selectivity J Mol Catal A 2008 289 (1-2) 28ndash37
[156] Liu Y-M Feng W-L Li T-C He H-Y Dai W-L Huang W Cao Y Fan K-N Structure and catalytic properties of vanadium oxide supported on mesocellulous silica foams (MCF) for the oxidative dehydrogenation of propane to propylene J Catal 2006 239 (1) 125ndash136
[157] Liu Y-M Cao Y Yi N Feng W-L Dai W-L Yan S-R He H-Y Fan K-N Vanadium oxide supported on mesoporous SBA-15 as highly selective catalysts in the oxidative dehydrogenation of propane J Catal 2004 224 (2) 417ndash428
[158] Zhao C Operando spectroscopic and kinetic study of the selective oxidation of propylene to acrolein over well-defined supported vanadium oxide catalysts Dissertation Lehigh University Pennsylvania 2007
httpproquestumicompqdlinkdid=1417810771ampFmt=7ampclientId=79356ampRQT=309ampVName=PQD (accessed 08072011)
199
[159] Li M Shen J Microcalorimetric Adsorption Characterizations of Supported Vanadia Catalysts for Selective Oxidation of Propylene to Acetone J Catal 2002 205 (2) 248ndash258
[160] Yoshida S Magatani Y Noda S Funabiki T Partial Oxidation of Propene over UV-irradiated Vanadium Oxide supported on Silica J Chem Soc Chem Commun 1981 12 601ndash602
[161] Jackson S D Hargreaves J S J Eds Metal oxide catalysis Wiley-VCH Weinheim Germany 2009 Vol 2 pp 178-179
[162] Grzybowska-Świerkosz B Thirty years in selective oxidation on oxides what have we learned Top Catal 2000 1112 (1-4) 23ndash42
[163] Li S Mirabal A Demuth J Woumlste L Siebert T A Complete ReactantndashProduct Analysis of the Oxygen Transfer Reaction in [V4O11middotC3H6]
ndash A Cluster Complex for Modeling Surface Activation and Reactivity J Am Chem Soc 2008 130 (50) 16832ndash16833
[164] Li H-B Tian S X Yang J Propene Oxidation with the Anionic Cluster V4O11ndash Selective
Epoxidation Chem Eur J 2009 15 (41) 10747-10751
[165] Kondratenko E V Bruumlckner A On the nature and reactivity of active oxygen species formed from O2 and N2O on VOxMCM-41 used for oxidative dehydrogenation of propane J Catal 2010 274 (1) 111ndash116
[166] Kondratenko E V Ovsitser O Radnik J Schneider M Kraehnert R Dingerdissen U Influence of reaction conditions on catalyst composition and selectivenon-selective reaction pathways of the ODP reaction over V2O3 VO2 and V2O5 with O2 and N2O Appl Catal A 2007 319 98ndash110
[167] Grasselli R K Genesis of site isolation and phase cooperation in selective oxidation catalysis Top Catal 2001 15 (2-4) 93ndash101
[168] Liu Y-M Cao Y Zhu K-K Yan S-R Dai W-L He H-Y Fan K-N Highly efficient VOxSBA-15 mesoporous catalysts for oxidative dehydrogenation of propane Chem Commun 2002 (23) 2832ndash2833
[169] Goodrow A Bell A T A Theoretical Investigation of the Selective Oxidation of Methanol to Formaldehyde on Isolated Vanadate Species Supported on Silica J Phys Chem C 2007 111 (40) 14753ndash14761
[170] Grubert G Rathousky J Schulz-Ekloff G Wark M Zukal A Reducibility of vanadium oxide species in MCM-41 Micropor Mesopor Mat 1998 22 (1-3) 225ndash236
[171] Doumlbler J Pritzsche M Sauer J Vibrations of Silica Supported Vanadia Variation with Particle Size and Local Surface Structure J Phys Chem C 2009 113 (28) 12454ndash12464
[172] Gopal R Calvo C The structure of Ca3(VO4)2 Z Kristallogr 1973 137 (1) 67ndash85
[173] Trunov V K Velikodnyi Yu A Murasheva E V Zhuravlev V D The crystal structure of calcium pyrovanadate Dokl Akad Nauk 1983 270 886
[174] Marumo F Isobe M Iwai S Kondo Y α form of sodium metavanadate Acta Crystallogr Sect B 1974 B30 (6) 1628ndash1630
[175] Petrasova M Madar J Hanic F Crystal structure of potassium metavanadate Chem Zvesti 1958 12 410ndash418
200
[176] Bouloux J C Perez G Galy J Structure cristalline des metavanadates CaV2O6 et CdV2O6 alpha La transformation polymorphique CdV2O6 alpha - CdV2O6 betha Bull Soc Fran Miner et cristallogr 1972 V95 130ndash133
[177] Eglmeier C Range K-J Kleynhans A Heyns A M H36N6O34V10 S Afr J Chem 1993 46 7ndash13
[178] Waltersson K Forslund B Wilhelmi K-A Andersson S Galy J Structural Crystallography and Crystal Chemistry Acta Crystallogr Sec B 1974 30 (11) 2644-2652
[179] Natl Bur Stand (US) Monograph 1983 25 (20) 108
201
Table Captions
Table 1-1 Commercially important selective oxidations with catalysts containing vanadium [18] 3
Table 2-1 Preparation details of the synthesized magnesium vanadate samples 13
Table 2-2 UV-Vis edge energies (Eg) and low energy LMCT band positions extracted from UV-Vis-DR spectra in Figure 2-4 17
Table 2-3 Catalytic performance of the magnesium vanadate phases compared to V2O5 during the selective oxidation of propene
(40 mlmin 5 O2 and 5 propene in He) 22
Table 3-1 Standard enthalpy of formation ∆Hf0 for selected compounds in the gas phase 50
Table 3-2 Parameters used to estimate the mass and heat transfer 50
Table 4-1 BET surface area (SBET) and vanadium content of the calcined VxOySBA-15 samples () sample prepared via the ion
exchange method in Figure 4-1 () sample prepared by wet impregnation with a NH4VO3 solution () sample prepared by
incipient wetness using a (NH4)6V10O28 solution The values in brackets refer to the V content determined by RFA) 52
Table 5-1 Absorption band position and UV-Vis edge energy determined from UV-Vis-DR spectra of vanadium oxide reference
compounds (Figure 5-1 left) together with the assumed covalent V-O-V bond (CVB) number (reference of the theoretical structure
which matched the experimental XRD powder pattern Table 10-3 appendix) Values in brackets refer to measurements in in situ
cell 66
Table 5-2 Absorption band position and UV-Vis edge energy determined from the UV-Vis-DR spectra of hydrated and dehydrated
VxOySBA-15 samples (Figure 5-1 right) together with the calculated covalent V-O-V bond (CVB) number Values in brackets
refer to diluted samples (F(Rinfin)max~ 1-2) 67
Table 5-3 Type and number (N) of atoms at distance R from the absorbing V atom in a model system assuming an ordered
arrangement of V2O7 units (Figure 5-9 right) compared to experimental distances and XAFS disorder parameters (σ2) The
parameters were obtained from the refinement of this model structure to the experimental V K edge XAFS FT(χ(k)k 3) of
dehydrated VxOySBA-15 (77 wt) t-Mg2V2O7 and NH4VO3 (k range from 27-105 Aring-1 R range 084-362 Aring Nind = 16 E0 = 0
eV in all cases fit residual 39 (dehydrated VxOySBA-15) (Nfree = 8) 107 (t-Mg2V2O7) (Nfree = 7) 147 (NH4VO3) (Nfree = 5))
(subscript c indicates parameters that were correlated in the refinement subscript f indicates parameters that were fixed in the
refinement) Confidence limits and significance to the fit parameters are given in Table 5-4 75
Table 5-4 V K edge XAFS parameters (Z for distances R and disorder parameter σ2) obtained from three different procedures of
fitting a model structure (ie ldquoordered V2O7 dimersrdquo on SiO2 support) to the experimental XAFS FT(χ(k)k 3) of dehydrated
VxOySBA-15 (77 wt ) (details of fit given in Table 5-3) together with confidence limits (plusmn z referring to 95 of fit residual) and
significance parameters F (details given in text) 76
Table 5-5 Type and number (N) of atoms at distance R from the absorbing V atom in a model system assuming an ordered
arrangement of [V2O7] units (Figure 5-9 right) compared to experimental distances and XAFS disorder parameters (σ2) The
parameters were obtained from the refinement of this model structure to the experimental V K edge XAFS FT(χ(k)k 3) of
dehydrated VxOySBA-15 with different V loadings (ie 77 wt 41 wt 14 wt ) (Figure 5-9 left) (k range from 27-105 Aring-1
R range 084-362 Aring Nind = 16 Nfree = 8 E0 = 0 eV in all cases fit residual 38 (77 wt) 70 (41 wt) 56 (14 wt)) (subscript c
indicates parameters that were correlated in the refinement subscript f indicates parameters that were fixed in the refinement)
Confidence limits and significance of fit parameters correspond to those given in Table 5-4 for the 77 wt sample 80
202
Table 5-6 V K edge XAFS parameters (Z for distances R and disorder parameter σ2) obtained from two different procedures of
fitting a model structure (ie V2O5) to the experimental XAFS FT(χ(k)k 3) of the V2O5 reference together with confidence limits (plusmn
z referring to 95 of fit residual) and significance parameter F (details given in text) 84
Table 5-7 V K edge XAFS parameters (Z for distances R and disorder parameter σ2) obtained from four different procedures of
fitting a model structure (ie V2O5) to the experimental XAFS FT(χ(k)k 3) of hydrated VxOySBA-15 (77 wt) (details of fit given
in Table 5-8) together with the confidence limits (plusmn z referring to 95 of fit residual) and the significance parameter F (details
given in text) 86
Table 5-8 Type and number (N) of atoms at distance R from the V atoms in a V2O5 system compared to the experimental distances
and the XAFS disorder parameter (σ2) The parameters were obtained from the refinement of a reduced V2O5 model structure (ICSD
60767 [140]) to the experimental V K edge XAFS FT(χ(k)k 3) of hydrated VxOySBA-15 (77 wt) and bulk V2O5 (k range from
27 - 110 Aring-1 R range 09 - 38 Aring E0 (VxOySBA-15) = 00 eV E0 (V2O5) = 00 fit residual 86 (VxOySBA-15) and 125 (V2O5)
Nind = 17 Nfree = 8) (subscript c indicates parameters that were correlated in the refinement) Confidence limits and significance of
the fit parameters are given in Table 5-787
Table 6-1 Apparent activation energies of water desorption Ed determined from the plot of ln(Tmax2β) as a function of 1Tmax
(Figure 6-6) freshly calcined sample two year old sample 96
Table 6-2 UV-Vis edge energy Eg of hydrated VxOySBA-15 samples determined after various rehydration procedures Dehydration
treatments as described in Figure 6-9 101
Table 6-3 Experimental distances (R) and XAFS disorder parameters (σ2) for different type and number (N) of atoms at distance R
from the absorbing V atom in a model system assuming an ordered arrangement of [V2O7] units (Chapter 5) Parameters were
obtained from the refinement of this model structure to the experimental V K edge XAFS FT(χ(k)k 3) of dehydrated 77 wt
VxOySBA-15 at various stages of aging (k range from 27-105 Aring-1 R range 083-362 Aring Nind = 16 E0 = 0 eV in all cases (subscript
c indicates parameters that were correlated in the refinement subscript f indicates parameters that were fixed in the refinement)
Dehydration was conducted in 20 O2 in He 104
Table 6-4 Experimental distances and XAFS disorder parameters (σ2) for different type and number (N) of atoms at distance R
from the absorbing V atom in a model system assuming an ordered arrangement of [V2O7] units (Chapter 5) Parameters were
obtained from the refinement of this model structure to the experimental V K edge XAFS FT(χ(k)k 3) of dehydrated 77 wt
VxOySBA-15 (k range from 27-105 Aring-1 R range 083-362 Aring Nind = 16 E0 = 0 eV in all cases (subscript c indicates parameters
that were correlated in the refinement subscript f indicates parameters that were fixed in the refinement) Dehydration in the 1st and
2nd cycle was conducted in 20 O2 in He and in 10 O2 (and 16 H2O) in He in the 3rd dehydration cycle 106
Table 6-5 UV-Vis edge energies Eg determined from the UV-Vis-DR spectra recorded at 298 K after different dehydration cycles
(details given in Figure 6-14) The samples were diluted with SBA-15 (13 (SBA-15 77 wt VxOySBA-15) and 11 (SBA-15
14 wt or 41 wt VxOySBA-15)) 107
Table 7-1 Propene conversion and selectivity for propene oxidation over vanadium and molybdenum oxides supported on SiO2 115
Table 7-2 Experimental distances (R) XAFS disorder parameters (σ2) and coordination numbers (N) for different types of atom in
a model system assuming an ordered arrangement of [V2O7] units (Chapter 5) Parameters were obtained from the refinement of this
model structure to the experimental V K edge XAFS FT(χ(k)k 3) of dehydrated 14 wt and 77 wt VxOySBA-15 (k range from
27-105 Aring-1 R range 083-362 Aring Nind = 16 E0 = 0 eV in all cases (subscript c indicates parameters that were correlated in the
refinement subscript f indicates parameters that were fixed in the refinement) Dehydration was conducted in 20 O2 in He at 623
K for 1 h and propene oxidation at 723 K for 1 h (5 O2 and 5 propene in He) 118
Table 7-3 Experimental distances (R) XAFS disorder parameters (σ2) and coordination numbers (N) for different types of atom in
a model system assuming an ordered arrangement of [V2O7] units (Chapter 5) Parameters were obtained from the refinement of this
model structure to the experimental V K edge XAFS FT(χ(k)k 3) of dehydrated 14 wt and 77 wt VxOySBA-15 (k range from
203
27-105 Aring-1 R range 083-362 Aring Nind = 16 E0 = 0 eV in all cases (subscript c indicates parameters that were correlated in the
refinement subscript f indicates parameters that were fixed in the refinement) Dehydration was conducted in 20 O2 in He at 623
K and propene oxidation at 723 K (5 O2 and 5 propene in He 08 H2O) 123
Table 7-4 Experimental distances and XAFS disorder parameters (σ2) for different types of atom at distance R from the absorbing
V atom in a model system assuming an ordered arrangement of [V2O7] units (Chapter 5) Parameters were obtained from the
refinement of this model structure to the experimental V K edge XAFS FT(χ(k)k 3) of dehydrated 77 wt VxOySBA-15 (k range
from 27-105 Aring-1 R range 083-362 Aring Nind = 16 E0 = 0 eV in all cases (subscript c indicates parameters that were correlated in the
refinement subscript f indicates parameters that were fixed in the refinement) Recalcination was conducted in 20 O2 in He at 768
K for 8 h and propene oxidation at 723 K (5 O2 and 5 propene in He) 131
Table 7-5 Product selectivities and propene conversion of 77 wt VxOySBA-15 at 673 K after 8-12 h (Figure 7-13 (right)) (A)
dehydrated sample 653 K 1 h 20 O2 in He (B) hydrated sample (C) hydrated sample and 08 H2O in the reaction gas (D)
ldquorecalcinedrdquo sample 843 K 12 h 20 O2 in He (rate [micromolpropene(gmiddots)] g=mv or mcat GHSV gas hour space velocity referred to
a 08 ml reactor volume and a 20-75 mlmin volume flow) 134
Table 7-6 Product selectivities and propene conversion of dehydrated 14-77 wt VxOySBA-15 (653 K 1 h 20 O2) at 673 K
after 8-12 h (1 rate [micromolpropene(gmiddots)] 2 GHSV gas hour space velocity referred to 08 ml reactor volume and 20-75 mlmin volume
flow3 ball milled V2O5 + SBA-15 4 at 643 K 6 at 684 K) 137
Table 10-1 Lattice plane distance (d100) and cell parameter (a0) determined from the 100 diffraction in the small angle XRD powder
patterns BET surface area (SBET) C parameter (CBET) and BJH pore size (dporeBJH) pore volume (Vpore) and the SBA-15 channel wall
thickness (dwall determined from a0-dporeBJH) of the initial bare and the functionalized VxOySBA-15 samples () sample prepared
via the ion exchange method in Figure 4-1 () sample prepared by wet impregnation with a NH4VO3 solution () sample
prepared by incipient wetness using a (NH4)6V10O28 solution 179
Table 10-2 CHN element content of bare SBA-15 SBA-15-APTES and calcined VxOySBA-15 samples () samples prepared via
the ion exchange method in Figure 4-1 () sample prepared by wet impregnation with a NH4VO3 solution () sample prepared
by incipient wetness using a (NH4)6V10O28 solution 179
Table 10-3 Origin and theoretical XRD phases that match the experimental XRD powder pattern of the vanadium oxide references
used 180
Table 10-4 Results of the analysis of the pre-edge feature determined from the normalized V K edge XANES spectra ( Chapter 8
Figure 8-2) Energy position at maximum intensity relative to V K edge (5645 keV) height of pre-edge peak at maximum intensity
(PH) centroid energy and energy position of the individual components relative to V K edge (5645 keV) determined and total area
of pre-edge peak from peak refinement according to Chaurand et al [94] (Section 524 Figure 5-4 right) product of pre-edge
peak height and total area average V-O bond length from the literature (Table 10-3) and beamline used at Hasylab 185
204
Figure Captions
Figure 1-1 Main structural configurations of the vanadium oxide phase on silica supports discussed in literature 4
Figure 1-2 The number of papers that are found in the ISI web of Knowledge database using the keywords vanadium silica and
catalyst [] 5
Figure 2-1 Experimental Cu Kα XRD powder patterns of the synthesized magnesium vanadate phases (dotted black) together with
the XRD structure refinement of the corresponding phase (solid red) and the differential plot (solid grey) 15
Figure 2-2 Structure motifs of the magnesium vanadate phases and the color of the respective powder 16
Figure 2-3 V K edge XANES (right) and Fourier transformed χ(k)k 3 (left) of the as prepared magnesium vanadates 16
Figure 2-4 Left UV-Vis-DR absorption spectra of the as-prepared magnesium vanadate phases and differrent sample batches (Table
2-1) Right picture of the different colored samples batches of the monoclinic Mg2V2O7 phase (AB) and MgV2O6 (CD) phase
(lines are the same as on the left side) 17
Figure 2-5 Evolution of Cu Kα XRD patterns during thermal treatment of Mg3V10O2828H2O (323-773 K 20 O2 in He) together
with the ion current (H2O) measured during in situ XRD 18
Figure 2-6 Selected in situ powder pattern during treatment in 5 propene and 5 oxygen in He (temperature range from 300 K to
673 K) of monoclinic Mg2V2O7 (left) and V2O5 (right) the diffraction at ~189 deg2θ originates from the sample holder 19
Figure 2-7 UV-Vis-DR absorption spectra (left) and V K edge XANES spectra (right) of monoclinic Mg2V2O7 and V2O5 before and
after treatment in 5 propene and 5 oxygen in He (temperature range from 300 K to 653 K) glitch at 850 nm originates from
detector change 20
Figure 2-8 Left Evolution of relative absorption at 700 nm (compared to maximum intensity in the respective spectrum) of the UV-
Vis-DR absorption spectra of magnesium vanadate phases and V2O5 Right evolution ion currents (CO2 water and acrolein)
measured during in situ UV-Vis-DR studies (thermal treatment in 5 propene and 5 oxygen in He) 21
Figure 2-9 Propene conversion and selectivity of the magnesium vanadate phases and V2O5 in 5 propene and 5 oxygen in He at
673-683 K 22
Figure 2-10 Selected in situ powder pattern during treatment in 5 propene in He (temperature range from 300 K to 673 K) of
monoclinic Mg2V2O7 (left) and V2O5 (right) the diffraction at ~189 deg2θ originates from the sample holder 23
Figure 2-11 UV-Vis-DR absorption spectra (left) and V K edge XANES spectra (right) of monoclinic Mg2V2O7 and V2O5 before
and after treatment in 5 propene in He (temperature range from 300 K to 653 K) glitch at 850 nm originates from detector
change 24
Figure 2-12 Left Evolution of the relative absorption at 700 nm (compared to the maximum intensity in the respective spectrum) in
the UV-Vis-DR absorption spectra of the magnesium vanadate phases and V2O5 Right Evolution of the ion currents (CO2 water
and acrolein) measured during in situ UV-Vis-DR studies (thermal treatment in 5 propene in He) 24
Figure 2-13 The XRD powder pattern of Mg3V2O8 before (grey) and after (black) treatment in 5 propene in He (300-773 K)
together with the structure motif of the possible Mg2-xV1+xO4 spinel type phases 25
205
Figure 2-14 (100) plane of the phases formed during the reduction and oxidation of V2O5 in the presence of propene at elevated
temperatures (left V2O5 Pmmn [140] middle V4O9 Cmcm [64] right VO2(B) C12m1 [71]) triangles indicate location of distorted
octahedrons with V-O distances between 23 Aring and 28 Aring 26
Figure 2-15 Scheme of the triclinic Mg2V2O7 structure (lines indicate connections between tetrahedral V2O74- units when the first
V-O coordination sphere is extended from 23 Aring to 3Aring) 28
Figure 3-1 Left excitation process of the photoelectron middle scattering process of the photoelectron right typical V K edge
spectrum 35
Figure 3-2 XAS data reduction left extraction of the χ(k) middle k3 weighted χ(k) right Fourier transformed k3 weighted χ(k) 36
Figure 3-3 Left in situ transmission XAS cell right typical configuration of transmission beamlines 37
Figure 3-4 Left Praying MantisTM set up right illustration of specular and diffuse reflection 40
Figure 3-5 Left schematic drawing of the Praying MantisTM in situ UV-Vis-DR cell right picture of the in situ UV-Vis-DR cell
The position of the optional thermocouple that was used to determine the sample temperature is marked as dashed line 41
Figure 3-6 Example for the determination of the UV-Vis edge energy Eg of V2O5 42
Figure 3-7 Drawing of the used double GC setting 45
Figure 3-8 Simplified flow chart of the measurement set up used in the laboratory 46
Figure 3-9 Picture of the furnace and reactor used for quantitative measurements 47
Figure 4-1 Simplified reaction scheme of the APTES grafting and ion exchange ((NH4)6V10O28middotxH2O precursor) preparation process
of VxOySBA-15 samples 51
Figure 4-2 Raman spectra (left middle) and UV-Vis-DRS spectra (right) of the uncalcined VxOySBA-15 samples and selected
vanadate references (A) SBA-15 (B) 30 wt VxOySBA-15 incipient wetness (C) 8 wt V (NH4)6V10O28middotxH2O mixed with
SBA-15 (Crsquo) (NH4)6V10O28middotH2O (D) 57 wt VxOySBA-15 wet impregnation (E) 8 wt V NH4VO3 mixed with SBA-15 (Ersquo)
NH4VO3 (F) APTES functionalized SBA-15 (G) 50 wt VxOySBA-15 ion exchange (H) 41 wt VxOySBA-15 ion exchange
(I) 14 wt VxOySBA-15 ion exchange 53
Figure 4-3 V K edge XANES spectra (left) χ(k)k 3 (middle) and FT(χ(k)k 3) (right) of the uncalcined VxOySBA-15 samples and
selected vanadate references (A) (NH4)6V10O28middotxH2O (B) NH4VO3 (C) 57 wt VxOySBA-15 wet impregnation (D) 30 wt
VxOySBA-15 incipient wetness (E) 50 wt VxOySBA-15 ion exchange (F) 41 wt VxOySBA-15 ion exchange (G) 14 wt
VxOySBA-15 ion exchange 54
Figure 4-4 XRD powder patterns (Cu Kα) of the calcined VxOySBA-15 samples bare SBA-15 and a physical mixture of ball
milled V2O5 and SBA-15 (8 wt V) 55
Figure 4-5 Raman (left middle) and UV-Vis-DRS spectra (right) of the calcined VxOySBA-15 samples and selected vanadium
oxide references (A) 30 wt VxOySBA-15 incipient wetness (B) 57 wt VxOySBA-15 wet impregnation (C) 77 wt
VxOySBA-15 ion exchange (D) 41 wt VxOySBA-15 ion exchange (E) 14 wt VxOySBA-15 ion exchange (samples diluted
11 or 12 with SBA-15 for UV-Vis-DRS measurments) 56
Figure 4-6 V K edge XANES spectra (left) χ(k)k 3 (middle) and FT(χ(k)k 3) (right) of the calcined and dehydrated VxOySBA-15
samples (20 O2 in He 623 K) (A) 57 wt VxOySBA-15 wet impregnation (B) 30 wt VxOySBA-15 incipient wetness (C) 77
wt VxOySBA-15 ion exchange (D) 41 wt VxOySBA-15 ion exchange (E) 14 wt VxOySBA-15 ion exchange 57
206
Figure 4-7 N2 adsorption (open symbols) and desorption (filled symbols) isotherms Left initial SBA-15 (grey same symbols as
VxOySBA-15 samples) and calcined VxOySBA-15 samples prepared via the graftingion exchange method (colored squares 14
wt V triangles 41 wt V circles 77 wt V) The inset depicts the small angle XRD powder patterns of the calcined 77 wt
VxOySBA-15 sample and the initial SBA-15 Right initial SBA-15 (black squares) SBA-15-APTES after calcination (blue
circles) and calcined 77 wt VxOySBA-15 (red triangles) The inset depicts the respective pore size distributions obtained from
the adsorption isotherm (BJH model) 58
Figure 4-8 top REM images of the calcined 77 wt VxOySBA-15 sample middle TEM images of the initial SBA-15 bottom
TEM images of the calcined 77 wt VxOySBA-15 sample 59
Figure 5-1 Left UV-Vis-DR spectra of vanadium reference compounds (Mg3V2O8 ( ) m-Mg2V2O7 ( ) t-Mg2V2O7 ( )
MgV2O6 ( ) Mg3V10O28middotxH2O ( ) V2O5 ( )) and 77 wt VxOySBA-15 in the hydrated ( ) and dehydrated ( )
state Right UV-Vis-DR spectra of VxOySBA-15 with different loading in the hydrated and dehydrated state (14 wt ( ) 41
wt ( ) 77 wt ( )) 65
Figure 5-2 Left Covalent V-O-V bond number (CVB) versus UV-Vis edge energy (Eg) of vanadium oxide reference compounds
(Na3VO4 ( ) K3VO4 ( ) Ca3V2O8 () Mg3V2O8 () m-Mg2V2O7 () Ca2V2O7 ( ) t-Mg2V2O7 () NaVO3 (diams) NH4VO3
( ) KVO3 ( ) CaV2O6 () MgV2O6 () Mg3V10O28middotxH2O ( ) (NH4)6V10O28middotxH2O ( ) V2O5 ( ) grey symbols refer to
measurements in in situ cell) right UV-Vis edge energy versus average V-O bond length in the first coordination sphere of
vanadium references exhibiting a tetrahedral coordination 68
Figure 5-3 V K edge XANES spectra of hydrated and dehydrated VxOySBA-15 samples with different vanadium loadings (14
wt 41 wt and 77 wt) V K edge compared to the spectra of various V5+ reference compounds (dotted line refers to 77 wt
dehydrated VxOySBA-15) 70
Figure 5-4 Left Correlation of the product of the V K edge pre-edge peak intensity and area versus average V-O bond length R in
the first coordination sphere (Ca3V2O8 () Mg3V2O8 () m-Mg2V2O7 () Ca2V2O7 ( ) t-Mg2V2O7 () NaVO3 (diams) NH4VO3
( ) KVO3 ( ) CaV2O6 () MgV2O6 () Mg3V10O28middotxH2O ( ) (NH4)6V10O28middotxH2O ( ) V2O5 ( )) right subtraction of the
background from V K edge pre-edge peak of 77 wt VxOySBA-15 (top) and an example of the peak fit to the background
corrected signal (bottom) The pre-edge peak heights for VxOySBA-15 are indicated as lines (Refer to text and Table 10-4 for
details) 72
Figure 5-5 left V K edge χ(k) of dehydrated VxOySBA-15 with different vanadium loadings (14 wt 41 wt and 77wt ) and
NH4VO3 middle right V K edge FT(χ(k)k 3) of dehydrated VxOySBA-15 (77 wt dotted) compared to those of various
references 73
Figure 5-6 Experimental (solid) V K edge FT(χ(k)k 3) of the NH4VO3 (right) and the Mg2V2O7 (left) reference together with a
theoretical XAFS function (fitting results are given in Table 5-3) Also shown are the Fourier transformed χ(k)k 3 of the individual
scattering paths together with the corresponding coordination number in brackets 74
Figure 5-7 Experimental (solid) V K edge FT(χ(k)k 3) of dehydrated VxOySBA-15 (77 wt) together with theoretical XAFS
functions (left ldquoisolated VO4rdquo model middle addition of a V-Si path to the ldquoisolated VO4rdquo model right addition of support oxygen
to ldquoisolated VO4rdquo model) Insets show the [VO4] tetrahedron (left) and a schematic representation of the V-Si path employed
(middle) Also shown are the Fourier transformed χ(k)k 3 of the individual scattering paths together with the corresponding
coordination number in brackets 77
Figure 5-8 Experimental (solid) V K edge FT(χ(k)k 3) of dehydrated VxOySBA-15 (77 wt) together with a theoretical XAFS
function (ie ldquoordered arrangement of V2O7rdquo model) Fit results are given in Table 5-3 The inset shows a schematic representation
of the arrangement of V2O7 units in Mg2V2O7 Also shown are the Fourier transformed χ(k)k 3 of the individual scattering paths
together with corresponding coordination number in brackets 78
207
Figure 5-9 left Experimental (solid) V K edge FT(χ(k)k 3) of dehydrated VxOySBA-15 (14 wt 41 wt and 77 wt) together
with a theoretical XAFS function The fit results are given in Table 5-5 right Schematic structural representation of dehydrated
VxOySBA-15 The most prominent distances employed in the XAFS refinement procedure are indicated 79
Figure 5-10 V K edge FT(χ(k)k 3) of hydrated VxOySBA-15 (77 wt) compared to those of various references (eg V2O5 and
MgV2O6) and the FT(χ(k)k 3) and χ(k)k 3 of hydrated VxOySBA-15 samples with different vanadium loadings (14 wt 41 wt
and 77 wt) 83
Figure 5-11 Experimental (solid) V K edge FT(χ(k)k3) of V2O5 (left) together with theoretical XAFS functions (V2O5 model red
lines refer to the V-O scattering path black lines refer to the V-V scattering paths) and a representation of the structural V2O5 model
(right) Prominent distances employed in the XAFS refinement procedure are indicated 84
Figure 5-12 Experimental (solid) V K edge FT(χ(k)k 3) of hydrated VxOySBA-15 (77 wt) together with theoretical XAFS
functions The procedures refer to the subsequent reduction of the theoretical V2O5 model Details are provided in the text and the fit
results are given in Table 5-7 Also shown are the Fourier transformed χ(k)k 3 of the individual scattering paths together with the
corresponding coordination number in brackets 85
Figure 5-13 left Experimental (solid) V K edge FT(χ(k)k 3) of hydrated VxOySBA-15 (77 wt) (top) and of V2O5 (bottom)
together with the theoretical XAFS functions Right A representation of the reduced V2O5 model structure used for the refinement
The most prominent distances employed in the XAFS refinement procedure are indicated 87
Figure 6-1 Left UV-Vis-DR spectra of 77 wt VxOySBA-15 dehydrated at different temperatures All spectra were recorded at
298 K Right V K edge FT(χ(k)k 3) of 77 wt VxOySBA-15 after different dehydration procedures The dehydration was
performed in 20 O2 in He 90
Figure 6-2 Left in situ UV-Vis-DR spectra of the 14 wt VxOySBA-15 sample and the water ion current me 18 (554 K 4 Kmin
20 O2 in He) during dehydration The inset shows the 2D spectra depicted in the 3D color map Right V K edge in situ XANES
spectra during dehydration of the 77 wt VxOySBA-15 sample (623 K 5 Kmin 20 O2 in He E4 Beamline) 91
Figure 6-3 Evolution of the V K pre-edge peak height () and energy position () together with the resulting concentration of the
hydrated () and dehydrated () phase of 77 VxOySBA-15 derived from the XANES spectra depicted in Figure 6-2 right (623 K
5 Kmin 20 O2 in He E4 beamline) 92
Figure 6-4 V K edge pre-edge peak height as a function of average V-O bond length (left) and relative energy position and centroid
energy (right) of vanadium oxide reference compounds measured at A1 beamline The values determined for dehydrated and
hydrated 77 wt VxOySBA-15 are indicated as lines (symbols as in Figure 5-4 Chapter 524 details Table 10-4) 93
Figure 6-5 Left Thermograms of bare and VxOySBA-15 samples Right normalized relative mass loss detected for the observed
steps derived from the thermograms (left side) 95
Figure 6-6 Left TG and DTG signals recorded for 77 wt VxOySBA-15 (10 Kmin 623 K) location of Tmax is indicated right
plot of ln(Tmax2β) as a function of 1Tmax for bare SBA-15 and 77 wt VxOySBA-15 97
Figure 6-7 Left A picture of different types of silanol groups of silica materials right 29Si CP-MAS-NMR of bare and 77 wt
VxOySBA-15 treated at different temperatures (A) bare SBA-15 (B) hydrated 77 wt VxOySBA-15 (C) dehydrated 77 wt
VxOySBA-15 (653 K 1 h) (D) calcined 77 wt VxOySBA-15 (843 K 12 h) The red curve is the envelope of the Gaussian
deconvolution 98
Figure 6-8 Left V K edge XANES spectra (inset) pre-edge peak height and water ion current during rehydration of dehydrated 77
wt VxOySBA-15 (298 K 16 Vol H2O) Right UV-Vis edge energy and water ion current during rehydration of dehydrated 77
wt VxOySBA-15 (298 K 13 Vol H2O) 99
208
Figure 6-9 FT(χ(k)k 3) of 77 wt VxOySBA-15 (left) and UV-Vis-DR spectra of 14 wt VxOySBA-15 (right) after various
hydration and dehydration cycles as prepared (A) first dehydration at 623 K XAS 554 K UV-Vis-DRS 30 min (B) first
rehydration 13-16 Vol 60-90 min (C) second dehydration at 723 K XAS 634 K UV-Vis-DRS 1 h (D) second rehydration
13-16 Vol 60 min (E) The line types on right side refer to the same procedure as on the left side 100
Figure 6-10 Left FT(χ(k)k 3) of differently hydrated 77 wt VxOySBA-15 and V2O5 Right result of the least-squares fit
( ) using the V K edge XANES spectra of dehydrated and rehydrated 77 wt VxOySBA-15 ( ) recorded after the
first de-rehydration cycle (Figure 6-9 left) to the experimental XANES spectrum ( )of two week old as-prepared 77 wt
VxOySBA-15 101
Figure 6-11 UV-Vis-DR spectra of 77 wt VxOySBA-15 (left) and 14 wt VxOySBA-15 (right) as-prepared (14 wt)
hydrated after calcination (77 wt) ( ) dehydrated as-prepared sample ( ) hydrated one year old sample
( ) dehydrated one year old sample ( ) dehydration parameters 20 O2 in He 554 K 30 min all spectra recorded at
298 K 102
Figure 6-12 left Raman spectra of (A) a 3 wt V V2O5SBA-15 mixture (1064 nm 100 mW) and (B) SBA-15 and in situ spectra
(514 nm 6 mW) during dehydration of (C) one year old 77 wt VxOySBA-15 at 723 K (20 O2 in N2) and (D) a 77 wt
VxOySBA-15 sample that is dehydrated at 623 K (20 O2 in N2) after recalcination at 823 K for 12 h in a muffle furnace (spectra
C-D 514 nm 6 mW) right least square fit ( ) of three Gaussian functions ( ) to the UV-Vis-DR spectrum ( ) of
dehydrated one year old 77 wt VxOySBA-15 (554 K 30 min 20 O2 in He) 103
Figure 6-13 Left V K edge FT(χ(k)k 3) of 77 wt VxOySBA-15 after different dehydration procedures 623 K 10 O216 Vol
H2OHe (A) 623 K 10 O2He (B) 298 K 10 O2He (C) and 1st dehydration cycle (623 K 20 O2He) 298 K (D) Right in situ
UV-Vis-DR spectra of the 14 wt VxOySBA-15 sample during dehydration together with water ion current me 18 (554 K
4 Kmin13 Vol H2O 20 O2 in He) The inset shows the 2D spectra recorded at 86 min and 113 min 105
Figure 6-14 UV-Vis-DR spectra recorded at 298 K after different dehydration cycles 1st dehydration at 554 K for 30 min ( )
2nd dehydration at 634 K for 1 h ( ) 3nd dehydration at 554 K for 30 min (13 Vol H2O) and 15 min (ldquodryrdquo) ( ) The
samples were diluted with SBA-15 (13 (SBA-15 77 wt VxOySBA-15) and 11 (SBA-15 14 or 41 wt VxOySBA-15)) 107
Figure 6-15 Schematic drawing of assumed dynamic structural transformations of supported vanadium oxide phase on SBA-15
during hydration and dehydration 108
Figure 7-1 V K edge XANES (left) FT(χ(k)k 3) (middle) and UV-Vis-DR spectra (right) recorded at 298 K after dehydration
(solid line 623 K 1 h 20 O2 in He) and after propene oxidation (dashed line 673 K (UV-Vis) and 723 K (XAS) 1 h 5 O2 and
5 propene in He) (A) 77 wt (B) 41 wt and (C) 14 wt VxOySBA-15 117
Figure 7-2 Top and middle in situ UV-Vis-DR spectra of dehydrated VxOySBA-15 (623 K 1 h 20 O2 in He) and the evolution of
the ion current me 56 (acrolein) during the temperature programmed reaction (A) 77 wt VxOySBA-15 (675 K 5 O2 and 5
propene in He 1st run) (B) 14 wt VxOySBA-15 (634 K 5 O2 and 5 propene in He 1st run) (C) 77 wt VxOySBA-15 (675
K 1 h 5 O2 and 5 propene in He 2nd run) (D) 77 wt VxOySBA-15 (675 K 5 O2 in He) Bottom Evolution of the ion
current me 56 for the 1st and 2nd measurement run All measurements were performed with 4 Kmin 119
Figure 7-3 In situ UV-Vis-DR spectra of 77 wt VxOySBA-15 (right) and 14 wt VxOySBA-15 (left) recorded at 636 K and at
298 K after reaction in 5 propene and 5 O2 in He dehydrated sample (554 K 20 O2) (solid line black) hydrated sample
(dashed and dotted line red) and hydrated sample with water (08 Vol) in the reaction mixture (dotted line blue) 121
Figure 7-4 In situ V K edge FT(χ(k)k 3) of 77 wt VxOySBA-15 (right) and 14 wt VxOySBA-15 (left) recorded at 723 K and
at 298 K after reaction in 5 propene and 5 O2 in He dehydrated sample (554 K 20 O2) (solid line black) hydrated sample
(dashed and dotted line red) and hydrated sample with water (08 Vol) in the reaction mixture (dotted line blue) 121
209
Figure 7-5 Evolution of the recorded MS ion currents (left top) and the V K edge pre-edge peak height () and energy position
() (left bottom relative to 5465 keV) and the phase fraction for the hydrated () and dehydrated () vanadium oxide structure
obtained from a PCA (left bottom) of the V K edge XANES spectra (right top) that were recorded during the temperature
programmed reaction (5 O2 and 5 propene in He 298-723 K 5 Kmin) of 77 wt hydrated VxOySBA-15 FT(χ(k)k 3)
(QEXAFS scans) of a comparable measurement are shown on the right side (bottom) 122
Figure 7-6 Left in situ UV-Vis-DR spectra of dehydrated 77 wt VxOySBA-15 (623 K 1 h) after subsequent treatment at 675 K
in (1) oxygen (2) propene and oxygen and (3) oxygen Right 29Si CP-MAS-NMR of SBA-15 and 77 wt VxOySBA-15 treated
at different temperatures (A) SBA-15 (B) dehydrated 77 wt VxOySBA-15 (653 K 1 h) (C) dehydrated 77 wt VxOySBA-15
(653 K 1 h) after propene oxidation (5 propene and 5 O2 in He 673 K 1 h) The red curve is the sum of the Gaussian functions
used for the profile refinement 124
Figure 7-7 Left In situ UV-Vis-NIR-DR spectra of dehydrated (dashed line) 14 wt and 77 wt VxOySBA-15 (623 K) after 1st
(solid line) and 2nd (dashed and dotted line) catalytic measurement (675 K 5 O2 and 5 propene in He) Right in situ Raman
spectra of dehydrated 77 wt VxOySBA-15 (723 K 20 O2 in N2) in 5 O2 and 5 propene in N2 514 nm 6 mW 126
Figure 7-8 Left in situ Raman spectra of hydrated 77 wt VxOySBA-15 during propene oxidation 5 O2 and 5 propene in N2
514 nm 6 mW Right Comparison of the in situ Raman spectra of hydrated and dehydrated 77 wt VxOySBA-15 during propene
oxidation at 473 K and 523 K 127
Figure 7-9 Propene conversion and oxygenate selectivity (left) Propene conversion rate referred to the sample mass and product
selectivities determined in the different measurement cells during the temperature programmed propene oxidation using dehydrated
77 wt VxOySBA-15 (right) 128
Figure 7-10 Propene conversion during propene oxidation (5 O2 and 5 propene in He) on 14 wt VxOySBA-15 (right) and 77
wt VxOySBA-15 (left) (A) dehydrated sample 653 K 1 h 20 O2 in He (B) dehydrated sample 763 K 1 h 20 O2 in He (C)
ldquorecalcinedrdquo sample 843 K 12 h 20 O2 in He (D) ldquomultisteprdquo sample (i) 843 K 12 h 20 O2 in He (ii) 298 K 24 h 20 O2
and 2 H2O in He 653 K 1 h 20 O2 in He (E) hydrated sample (F) hydrated sample and 08 H2O in the reaction gas (G)
physical mixture of V2O5 and SBA-15 (8 wt V) (H) physical mixture of ldquoball milledrdquo V 2O5 and SBA-15 (8 wt V)
Approximately 08-09 mg V was used for all measurements 130
Figure 7-11 V K edge XANES spectra (left) and FT(χ(k)k 3) (right) of 77 wt VxOySBA-15 recorded at 298 K after
ldquorecalcinationrdquo at 768 K for 8 h in 20 O2 in helium (A) and after a temperature programmed propene oxidation at 723 K 5 O2
and 5 propene in He (B) 131
Figure 7-12 Propene conversion and oxygenate selectivity during propene oxidation (5 O2 and 5 propene in He) of 77 wt
VxOySBA-15 for different treatments During subsequent temperature programmed reactions (left) and under isothermal conditions
at 673 K (right) 133
Figure 7-13 Oxygenate selectivity versus propene conversion determined after 8-12 h at 673 K (left) for 77 wt VxOySBA-15 and
comparision of the product selectivities for similar propene conversion (right) (A) dehydrated sample 653 K 1 h 20 O2 in He
(B) hydrated sample (C) hydrated sample and 08 H2O in the reaction gas (D) ldquorecalcinedrdquo sample 843 K 12 h 20 O2 in He
(Details Table 7-5) 133
Figure 7-14 UV-Vis-DR spectra of dehydrated (623 K 20 O2 in He) 14 wt (right) and 77 wt (left) VxOySBA-15 recorded at
298 K after dehydration (solid line) and propene oxidation (dotted line) at 675 K for 4 h 135
Figure 7-15 Left top Propene conversion and oxygenate selectivity during propene oxidation (5 O2 and 5 propene in He) of
dehydrated 14-77 wt VxOySBA-15 under isothermal conditions at 673 K (right) Left bottom and right Propene conversion and
product selectivity of dehydrated 14-77 wt VxOySBA-15 during the temperature programmed reaction in propene and oxygen
(5 O2 and 5 propene in He) (symbols on right side circle=CO square=CO2 closed triangle up=acrolein open triangle
up=acetaldehyde open triangle down=propionaldehyde half filled triangle= acetone closed star=acetic acid) 136
210
Figure 7-16 Oxygenate selectivity versus propene conversion determined after 8-12 h at 673 K (left top) for dehydrated 14-77
wt VxOySBA-15 Comparison of propene and oxygen conversions (right top) and product selectivities corresponding to the
conversions shown (bottom) (Table 7-6) 137
Figure 7-17 Main oxygenate products of the partial oxidation of propane and propene [35] 138
Figure 7-18 Propene and oxygen conversion reacted ratio of oxygenpropene and product selectivities for (hydrated) 14 wt and
77 wt VxOySBA-15 as a function of the initial oxygen to propene ratio in the reaction gas at 633 K (Vol O2 Vol propene ~
25 55 755 105 575 525 and 51) 141
Figure 7-19 UV-Vis-DR spectra of dehydrated 14 wt (right) and 77 wt VxOySBA-15 (left) recorded at 298 K after
temperature programmed reaction in various oxygenpropene mixtures in He at 636 K after dehydration 554 K 20 O2 (dotted
grey) 55 (dotted red) 15 (dashed black) 51 (dashed and dotted blue) and 05 (solid black) 143
Figure 8-1 V K edge XANES spectra (left) χ(k)k 3 (middle) and FT(χ(k)k 3) (right) recorded at 298 K (A) dehydrated 77 wt
VxOySBA-15 (623 K 20 O2) (B) dehydrated 77 wt VxOySBA-15 (623 K 20 O2) after reaction in 5 propene in He at 723
K (C) dehydrated 77 wt VxOySBA-15 (623 K 20 O2) after reaction in 5 propene in He at 673 K (D) V3O7 (E) VO2(B) (F)
V2O3 153
Figure 8-2 Normalized pre-edge peak areas (referred to the area of V2O5 that was normalized to 080) versus centroid energy of
vanadium reference compounds and 77 wt VxOySBA-15 after various treatments Additionally the values reported by Chaurand
et al [94] are shown Dashed rings refer to the coordination of absorbing vanadium centers (Oh = octrahedral Py = pyramidal Td =
tetrahedral) Detailed parameters are listed in Table 10-4 in the appendix 154
Figure 8-3 V K edge XANES spectra (left) and pre-edge peak height and water ion current me 18 (right) during the temperature
programmed reaction of dehydrated (623 K 20 O2 in He) 77 wt VxOySBA-15 in 5 propene in He (298-723 K 5 Kmin) 155
Figure 8-4 In situ UV-Vis-DR spectra (left) and absorption at 700 nm (relative to the maximum intensity determined in the
absorption spectra at 298 K after dehydration) together with the water ion current me 18 (right) during the temperature programmed
reaction of dehydrated (623 K 20 O2 in He) 77 wt VxOySBA-15 in 5 propene in He (298-673 K 4 Kmin) The arrows on
the left side indicate the evolution of the spectra during temperature treatment 156
Figure 8-5 Left UV-Vis-DR spectra of dehydrated (623 K 20 O2 in He) 77 wt VxOySBA-15 recorded at 673 K after several
reducing (5 propene) and oxidizing (5 propene and 5 oxygen) reaction cycles Right Evolution of the absorption at 700 nm
(relative to the maximum intensity determined in the absorption spectra at 298 K after dehydration) during the reducing (5
propene) and oxidizing (5 propene and 5 oxygen) reaction cycles at 673 K The gas phase was changed after 39 min in each
reaction cycle 157
Figure 8-6 Propene and oxygen conversion and concentration of major reaction products after several oxidizing (5 propene and
5 oxygen) reaction cycles (Figure 8-5) Refer to text for experimental details 158
Figure 8-7 UV-Vis-DR spectra of dehydrated 77 wt VxOySBA-15 (623 K 20 O2 in He) recorded during the first (left) and the
second (right) re-oxidation (5 propene 5 O2) cycle at 673 K Top Evolution of the absorption at 700 nm (relative to the
maximum intensity determined in the absorption spectra at 298 K after dehydration) Middle Evolution of MS ion currents
Bottom in situ UV-Vis-DR spectra The gas phase was changed after 39 min in each reaction cycle 160
Figure 8-8 UV-Vis-DR spectra recorded at 298 K after reduction of dehydrated VxOySBA-15 in 5 propene in He at 623 K (left)
and UV-Vis-DR spectra recorded at 673 K after reduction in 5 propene at 623 K of VxOySBA-15 that was treated for 35 min in
5 propene and 5 O2 in He at 673 K prior to reduction (Right) 162
Figure 8-9 V K edge XANES (left) LC XANES fit (middle) and FT(χ(k)k 3) of 77 wt VxOySBA-15 after dehydration (623 K
20 O2 in He) reduction (723 K 5 propene in He) and after the switching experiment at 673 K under reducing catalytic
211
reducing catalytic and finally reducing conditions (673 K reducing conditions 5 propene in He catalytic conditions 5 propene
and 5 O2 in He) 162
Figure 8-10 In situ UV-Vis DR spectra of dehydrated 77 wt VxOySBA-15 (20 O2 in He 623 K) at 673 K after changing the
gas phase composition starting with 20 O2 in He (left) or 5 propene and 5 O2 in He (right) as the initial gas mixture 164
Figure 8-11 Evolution of the relative absorption at 700 nm (relative to the maximum intensity determined in the absorption spectra
at 298 K after dehydration) derived from the in situ UV-Vis DR spectra of dehydrated 77 wt VxOySBA-15 (20 O2 in He 623
K) at 673 K after changing the gas phase composition starting with 20 O2 in He (left) or 5 propene and 5 O2 in He (right) as
initial gas mixture 165
Figure 8-12 UV-Vis-DR spectra of dehydrated 77 wt VxOySBA-15 (623 K 20 O2 in He) recorded during the first reducing
(5 propene) cycle at 673 K starting with 20 O2 in He (left side) or 5 propene and 5 O2 in He (right side) as the initial gas
mixture Top Evolution of absorption at the 700 nm (relative to the maximum intensity determined in the absorption spectra at 298
K after dehydration) Middle Evolution of the MS ion currents Bottom in situ UV-Vis-DR spectra The gas phase was changed
after 39 min in each reaction cycle 166
Figure 8-13 Simplified scheme of the structural changes during dehydrating catalytic or reducing condition 167
Figure 10-1 Baseline measured in the UV-Vis-DR spectrometer using the standard integration sphere 181
Figure 10-2 Baselines measured in the UV-Vis-DR spectrometer using the Praying MantisTM cell 181
Figure 10-3 In situ Raman spectra during dehydration in a ldquodryrdquo (left) and a water saturated atmosphere (right) 20 O2 and 80
N2 (and ~ 45 H2O) 25 mlmin ndash 50 mlmin 182
Figure 10-4 Usable spectral range of EXAFS and QEXAFS scans used for measurements of 77 wt VxOySBA-15 under catalytic
conditions (5 propene and 5 O2 in He 40 mlmin) 182
Figure 10-5 Product selectivities determined in the different measurement cells during the temperature programmed propene
oxidation using a dehydrated 77 wt VxOySBA-15 183
Figure 10-6 Product concentration during propene oxidation (5 O2 and 5 propene in He) of 77 wt VxOySBA-15 for
subsequent temperature programmed reactions 183
Figure 10-7 Determination of the reaction order for propene (left) and oxygen (right) for the acrolein formation on 77 wt
VxOySBA-15 184
Figure 10-8 Determination of the reaction order for propene (left) and oxygen (right) for the acrolein formation on 14 wt
VxOySBA-15 184
Figure 10-9 Experimental Cu Kα XRD powder pattern of V4O9 determined in 5 propene in He (56 mlmin) (dotted black) at 598
K together with the XRD structure refinement of the corresponding phases (solid red) and the differential plot (solid grey) 188

Abstract
The objective of the present work was elucidating structure-activity relationships concerning the individual role of vanadium sites in selective propene oxidation Two suitable vanadium oxide model catalyst systems were employed vanadium oxides supported on SBA-15 ldquoVxOySBA-15rdquo and various magnesium vanadate phases Detailed investigations on the preparation thermal stability structure and structural evolution under reducing and propene oxidizing condition were conducted Various in situ methods were used eg UV-Vis-DRS X-ray absorption spectroscopy Raman spectroscopy and X-ray powder diffraction These were combined with online MS gas phase analysis Catalytic characterization of the model catalysts was performed using quantitative GC gas phase analysis
In a first investigation magnesium vanadate phases Mg3V10O2828H2O MgV2O6 monoclinic and triclinic Mg2V2O7 and Mg3V2O8 were prepared and compared with V2O5 Besides Mg3V10O2828H2O all oxides were stable enough to be used for reaction tests No significant structural changes or reduction of the bulk phase during propene oxidation occurred for the magnesium vanadates up to 673 K Conversely V2O5 was reduced to VO2(B) under reaction conditions and V4O9 was formed as intermediate phase Catalytic performance of the magnesium vanadates was lower compared to that of V2O5 The highest propene conversions were measured for monoclinic Mg2V2O7 Only marginal differences in selectivity towards oxygenated products such as acrolein were observed for the different magnesium vanadate phases Compared to V2O5 total oxidation was increased while mainly acrolein was formed as partial oxidation product In situ UV-Vis-DRS revealed that the catalytic performance correlated with the reducibility of the magnesium vanadate catalysts
Second part Emphasis of the present work was placed on the investigation of selective propene oxidation over VxOySBA-15 model catalysts Preparation of highly disperse VxOySBA-15 samples without formation of V2O5 during the preparation process was possible using a grafting anion exchange method Three different VxOySBA-15 samples with vanadium loadings in the range of 14 wt-77 wt (03 Vnm2 ndash 24 Vnm2) were synthesized A hydrated state of VxOySBA-15 was present at ambient temperatures of 300 K in humid atmospheres The hydrated state consisted of polymerized vanadium oxide units with square pyramidal coordination of the vanadium centers Thermal treatment in oxygen and water saturated atmospheres resulted in dehydration loss of coordinated water and the direct formation of the dehydrated state of VxOySBA-15 above 440 K The dehydrated state of VxOySBA-15 was described by an ordered arrangement of dimeric vanadium oxide units with tetrahedral coordination of the vanadium centers In situ spectroscopic measurements revealed that the dehydrated VxOySBA-15 structure corresponds to the vanadium oxide structure during selective propene oxidation Formation of additional V-O-Si bonds to the support during catalytic reaction was deduced Moreover catalytic reaction in propene and oxygen lowered the reducibility of the vanadium centers in VxOySBA-15 using propene as reducing agent Vanadium loading had only minor impact on the catalytic performance of VxOySBA-15 Besides formation of CO2 and CO mainly formation of acrolein propionaldehyde acetaldehyde and acetic acid was observed No significant change in product selectivites was observed compared to V2O5 reference Hence similar active vanadium oxides centers may be present on VxOySBA-15 and bulk V2O5 Conversely to V2O5 the average vanadium valence of VxOySBA-15 was V5+ during propene oxidation independent of the initial oxygen to propene ratio Dynamic investigations in changing reducing and catalytic condition and a reaction order of zero for oxygen during propene oxidation showed that VxOySBA-15 exhibited a fast re-oxidation of the vanadium centers during propene oxidation
Zusammenfassung
Das Ziel dieser Arbeit war die Erstellung von geeigneten Struktur-Aktivitaumlts-Beziehungen von Vanadiumzentren in der selektiven Oxidation von Propen Dafuumlr wurden zwei Modelsysteme auf Basis von Vanadiumoxiden untersucht Auf SBA-15 getraumlgerte Vanadiumoxide ldquoVxOySBA-15rdquo und verschiedene Magnesiumvanadat-Phasen Diverse analytische Methoden wurden genutzt um die Praumlparation die Vanadiumoxid-Struktur und die Entwicklung der Vanadiumoxid-Struktur unter reduzierenden und Propen-oxidierenden Bedingungen zu verfolgen Es wurden unter anderem in situ UV-Vis-DRS Roumlntgenabsorptionsmessungen Raman-Messungen sowie Roumlntgendiffraktionsmessungen angewendet Gleichzeitig wurde die Zusammensetzung der Gasphasen mittels online Massenspektrometrie untersucht Zusaumltzlich erfolgte eine quantitative katalytische Charakterisierung der Modell-Katalysatoren mittels Gaschromatographie
Im ersten Teil der Arbeit wurden Magnesiumvanadat-Phasen hergestellt Mg3V10O2828H2O MgV2O6 monoklines und triklines Mg2V2O7 sowie Mg3V2O8 Diese wurden mit V2O5 verglichen Auszliger Mg3V10O2828H2O waren alle untersuchten Oxide thermisch stabil und konnten fuumlr Reaktionstests verwendet werden Fuumlr die untersuchten Magnesiumvanadat-Phasen wurde keine Reduktion unterhalb von 673 K beobachtet Im Gegensatz dazu wurde V2O5 zu VO2(B) unter katalytischen Bedingungen reduziert V4O9 wurde als Zwischenphase gebildet Die gemessene katalytische Aktivitaumlt der Magnesiumvanadat-Phasen war deutlich niedriger als die von V2O5 Innerhalb der Magnesiumvanadat-Phasen zeigte monoklines Mg2V2O7 die houmlchste Aktivitaumlt Die gemessenen Produktselektivitaumlten zwischen den Magnesiumvanadat-Phasen unterschieden sich nur geringfuumlgig Gegenuumlber V2O5 fand eine erhoumlhte Totaloxidation von Propen statt Weiterhin wurde hauptsaumlchlich Acrolein als Partialoxidations Produkt von Propen gebildet In situ UV-Vis-DRS Messungen zeigten dass die katalytische Aktivitaumlt der Magnesiumvanadat-Phasen mit der Reduzierbarkeit der Vanadiumzentren korrelierte
Im zweiten Teil dem Mittelpunkt dieser Arbeit wurden VxOySBA-15 Modell Katalysatoren fuumlr die selektive Oxidation von Propen untersucht Die Herstellung von hoch dispersen Vanadiumoxid-Strukturen auf dem SBA-15 Traumlger ohne die Bildung von kristallinen V2O5-Phasen war mittels einer speziellen Ionen-Austausch Prozedur moumlglich Es wurden drei Proben mit Vanadium-Beladungen im Bereich von 14 wt-77 wt (03 Vnm2 ndash 24 Vnm2) hergestellt Bei niedrigen Temperaturen von 300 K und in wassergesaumlttigten Atmosphaumlren lag eine hydratisierte Phase von VxOySBA-15 vor Die Vanadiumoxid-Struktur der hydratisierten Phase besteht aus kondensierten Vanadiumoxideinheiten mit quadratisch planarer Koordination der Vanadiumzentren Thermische Behandlung in sauerstoffhaltigen Atmosphaumlren fuumlhrte zu einer Dehydratation der hydratisierten Phase Fuumlr Temperaturen houmlher 440 K bildete sich die dehydratisierte Struktur von VxOySBA-15 unter der Abspaltung von koordiniertem Wasser aus Die Vandiumoxid-Struktur der dehydratisierten Phase konnte durch eine regelmaumlszligige Anordnung von benachbarten dimeren Vanadiumoxideinheiten beschrieben werden Dabei sind die Vanadiumzentren in der dehydratisierten Phase tetraedisch koordiniert In situ spektroskopische Messungen haben gezeigt dass die dehydratisierte Phase der Vanadiumoxid-Phase unter katalytischen Bedingungen entspricht Waumlhrend der Propenoxidation bilden sich zusaumltzliche V-O-Si-Bindungen aus Weiter aumlndert sich die Reduzierbarkeit der Vanadiumzentren in VxOySBA-15 nachdem diese katalytischen Reaktionsbedingungen ausgesetzt waren Die Vanadiumbeladung hatte nur einen geringen Einfluss auf die katalytischen Eigenschaften von VxOySBA-15 Neben der Bildung von CO2 und CO wurde die Bildung von Acrolein Propionaldehyd Acetaldehyd und Essigsaumlure beobachtet Gegenuumlber einer V2O5 Referenz wurden nur geringe Unterschiede in den gemessene Selektivitaumlten der Reaktionsprodukte der Propenoxidation festgestellt Daher wird vermutet dass sowohl auf VxOySBA-15 als auch auf V2O5 aumlhnliche aktive Zentren auf der Oberflaumlche vorliegen muumlssen Im Gegensatz zu V2O5 war die mittlere Vanadiumvalenz +5 waumlhrend der Oxidation von Propen Untersuchungen mit wechselnden reduzierenden und oxidierenden Gasatmosphaumlren und eine Reaktionsordnung nullter Ordnung fuumlr Sauerstoff zeigten dass eine schnelle Re-Oxidation der Vanadiumzentren waumlhrend der Propenoxidation stattfindet
Danksagung
Zunaumlchst bedanke ich mich bei den drei Gutachtern dieser Arbeit Prof Dr Thorsten Ressler fuumlr die
interessante wissenschaftliche Fragestellung die exzellente fachliche Betreuung die mit dieser Arbeit
verbunden war und stete Diskussionsbereitschaft waumlhrend meiner Promotionszeit Bei Prof Dr Christian
Hess bedanke ich mich fuumlr seine Unterstuumltzung die Moumlglichkeit zur Durchfuumlhrung von in situ Raman
Experimenten in seinem Arbeitskreis hilfreiche Diskussionen und die Uumlbernahme des Zweitgutachtens
Prof Dr Thomas Friedrich danke ich fuumlr die Uumlbernahme des Pruumlfungsvorsitzes
Herrn Dr Jan Dirk Epping danke ich fuumlr Durchfuumlhrung und Auswertung der Festkoumlrper NMR
Messungen Dr Joumlrg Thielemann danke ich fuumlr die Durchfuumlhrung und Unterstuumltzung bei den in situ
Raman Messungen Fuumlr die Aufnahme der Elektronenmikroskopbilder danke ich den Mitarbeitern des
ZELMI an der TU Berlin Herrn Harald Link moumlchte ich fuumlr die durchgefuumlhrten ICP-OES Messungen
danken Dr Elisabeth Irran danke ich fuumlr die Aufnahme und Hilfe bei der Auswertung der Einkristall-
Roumlntgenmessungen
Semiha Schwarz danke ich fuumlr Unterstuumltzung bei der Synthese von SBA-15 und VxOySBA-15 und die
vielen TG Messungen Weiter bedanke ich mich bei ihr auch fuumlr die herzliche Atmosphaumlre und die vielen
nicht fachlichen Gespraumlche die das Arbeiten so angenehm gemacht haben Bei Dr Astrid Juumlrgensen
bedanke ich mich fuumlr die Aufnahme der zahlreichen Diffraktogramme und die durchgefuumlhrten RFA
Messungen sowie fuumlr ihre Unermuumldlichkeit beim Korrekturlesen dieser Arbeit Auch allen weiteren
Mitgliedern des Arbeitskreises danke ich die stets Diskussionsbereitschaft gezeigt haben und mich bei
der Durchfuumlhrung der zahlreichen Messungen auf vielfaumlltige Weise unterstuumltzt haben Dr Thomas
Christoph Roumldel Alexander Hahn Dr Anne Dennstedt Gregor Koch Juliane Scholz Alexander Muumlller
Rafael Zubrzycki und Sigrid Imme Ich danke auch Mateusz Jastak Jacek Kozuch und Udo Dorn die
mich im Rahmen ihrer Praktika waumlhrend der Synthese der Magnesiumvanadate und Vanadium-
Referenzen unterstuumltzt haben Weiter moumlchte ich mich auch bei Alper Uumlnal und Dr Ingo Piotrowski
bedanken fuumlr ihre hilfreichen Ratschlaumlge zur Synthese Auch allen weiteren Mitgliedern des Instituts fuumlr
Chemie der TU Berlin die diese Arbeit unterstuumltzt haben und nicht weiter namentlich genannt sind
danke ich
Besonders bedanke ich mich auch bei DESY und dem Hasylab in Hamburg und ANKA in Karlsruhe fuumlr
die Erteilung von Messzeit und die finanzielle Unterstuumltzung Weiter bedanke ich mich bei der Deutschen
Forschungsgemeinschaft (DFG) und dem Beirat der Zentralen Frauenbeauftragten der TU Berlin fuumlr die
finanzielle Unterstuumltzung
Stephan Rau und meiner Familie danke ich fuumlr den Ruumlckhalt und die stete Motivation zu dieser Arbeit
IX
Contents
Abstract XI
Zusammenfassung XIII
Danksagung XV
Contents IX
1 Introduction 1
11 Motivation 1
12 Vanadium oxides in catalysis 3
13 Supported vanadium oxides in catalysis 3
14 Outline of the work 6
Part I Spectroscopic and catalytic investigations of magnesium vanadate model
catalysts and V2O5 for selective propene oxidation
2 Magnesium vanadate model systems and V2O5 during selective propene oxidation 11
21 Introduction 11
22 Experimental 12
221 Sample preparation 12
222 Powder X-ray diffraction (XRD) 13
223 UV-Vis Diffuse reflectance spectroscopy (UV-Vis-DRS) measurements 13
224 X-ray absorption spectroscopy (XAS) 14
225 Quantitative catalysis measurements 14
23 Results and discussion 14
231 Ex situ structural characterization of prepared samples 14
232 Structure and reactivity of V2O5 and m-Mg2V2O7 under catalytic conditions 18
233 Catalytic performance of the magnesium vanadates and V2O5 21
234 Structural evolution of V2O5 and m-Mg2V2O7 under reductive conditions 23
235 Correlations of structure reducibility and catalytic activity of V2O5 26
236 Correlations of structure reducibility and catalytic activity of the magnesium vanadate system 27
237 Comparison of the magnesium vanadate system and V2O5 28
24 Summary 29
X
Part II Spectroscopic and catalytic investigations of VxOySBA 15 model catalysts for
selective propene oxidation
3 Fundamentals and experimental details 33
31 Catalyst preparation 33
32 Catalyst characterization 34
321 X-ray absorption spectroscopy (XAS) 34
322 UV-Vis Diffuse reflectance spectroscopy measurements 39
323 Powder X-ray diffraction (XRD) 42
324 Physisorption measurements 42
325 Elemental analysis 43
326 Solid state NMR 43
327 Raman spectroscopy 43
328 Thermal analysis 44
329 Electron microscopy 44
33 Catalytic characterization 45
331 Quantitative measurements ndash gas chromatography 45
332 Laboratory fixed bed reactor 47
333 Calculation of conversion selectivity carbon balance and reaction rate 47
334 Estimation of mass and heat transport limitations 49
4 Comparison of various preparation methods for the synthesis of supported vanadium oxide catalysts 51
41 Introduction 51
42 Results and discussion 51
421 Surface area and vanadium content of the VxOySBA-15 samples 51
422 Structural characterization of the uncalcined VxOySBA-15 samples 52
423 Vanadium dispersion in the calcined VxOySBA-15 samples 55
424 Characterization of the SBA-15 support of the VxOySBA-15 samples prepared by the ion exchange method 57
43 Summary 60
5 Structural characterization of hydrated and dehydrated VxOySBA-15 63
51 Introduction 63
52 Results and discussion 65
521 UV-Vis-DR spectra of VxOySBA-15 compared to those of V5+ references 65
522 Correlation of the UV-Vis-DRS edge energy Eg with the local structure of vanadium oxide references 67
523 UV-Vis Eg- indicator for the local structure of hydrated and dehydrated VxOySBA-15 69
524 XANES analysis ndash coordination and distortion of V species in VxOySBA-15 70
525 Local structure of dehydrated VxOySBA-15 ndash Comparison to V oxide references 72
XI
526 Local structure of higher connected tetrahedral vanadium oxide cluster - XAFS refinement of a reference based model structure 74
527 Local structure of dehydrated VxOySBA-15 ndash XAFS refinement of ldquoVO4ldquo based model structures 76
528 Local structure of dehydrated VxOySBA-15 ndash XAFS refinement of ldquoV2O7ldquo based model structures 78
529 Schematic structural representation of dehydrated VxOySBA-15 79
5210 Limitations of the XAFS analysis of dehydrated VxOySBA-15 81
5211 Local structure of hydrated VxOySBA-15 - Comparison to V oxide references 82
5212 Local structure of a square pyramidal vanadium oxide cluster - XAFS refinement of a ldquoV 2O5ldquo model structure 83
5213 Local structure of hydrated VxOySBA-15 ndash XAFS refinement of a ldquoV2O5ldquo based model structure 85
53 Summary 88
6 Dynamic changes in the local structure of VxOySBA-15 model catalysts in oxidative and water saturated atmospheres 89
61 Introduction 89
62 Results and discussion 90
621 Impact of pretreatment temperature on dehydrated VxOySBA-15 phase 90
622 Dehydration process investigated by in situ UV-Vis-DRS 91
623 Dehydration process investigated by in situ XAS 92
624 Dehydration of the silica SBA-15 support 94
625 Determination of the apparent activation energy of water desorption - ED 96
626 Types of silanol groups on the SiO2 support ndash 29Si CP-MAS-NMR 97
627 The hydration process 99
628 Reversibility of hydration and dehydration processes 100
629 Impact of aging on the structure of VxOySBA-15 101
6210 Dehydration in water saturated atmospheres 105
63 Concluding remarks on the hydration and dehydration of VxOySBA-15 108
631 Coordination of hydrated VxOySBA-15 108
632 Impact of coordinated water on hydrated VxOySBA-15 109
633 Formation of dehydrated VxOySBA-15 110
634 Formation of V2O5 crystallites versus dispersion during dehydration 111
635 Number of V-O-Si bonds ndash Is a O=V[O-Si]3 species possible 112
636 Effect of water on the dehydration process 112
64 Summary 114
7 Structural evolution and reactivity of VxOySBA-15 catalysts under propene oxidizing conditions 115
71 Introduction 115
72 Results and discussion 117
721 Local structure of VxOySBA-15 under propene oxidation 117
XII
722 Impact of pretreatment procedure and water vapour on the local structure of VxOySBA-15 during propene oxidation 120
723 Discussion of possible origins of the UV-Vis edge energy shift during propene oxidation 124
724 Enhanced reactivity of 77 wt VxOySBA-15ndashImpact of V2O5 and carbonaceous species 126
725 Evaluation of the different reactor types for quantitative catalytic measurements 128
726 Impact of the pretreatment procedure on the catalytic performance of VxOySBA-15 129
727 Impact of the vanadium loading on the catalytic performance of VxOySBA-15 135
728 The influence of the oxygen and propene concentration on the catalytic performance of VxOySBA-15 140
729 The influence of the oxygen to propene ratio on the structure of VxOySBA-15 143
73 Concluding remarks on the catalytic performance and the structural evolution of VxOySBA-15 during catalytic propene oxidation 144
731 Structural evolution of VxOySBA-15 during propene oxidation 144
732 Catalytic performance of VxOySBA-15 during propene oxidation 145
733 Impact of vanadium loading on the catalytic performance of VxOySBA-15 146
734 Selective oxidation of propene to acrolein on isolated ldquoVO4rdquo centers 146
735 Elucidation of structure-activity correlations with respect to other model systems 147
74 Summary 148
8 Investigation of reducibility and re-oxidation of VxOy-SBA-15 catalysts 151
81 Introduction 151
82 Results and discussion 153
821 Local structure of VxOySBA-15 under reducing conditions 153
822 Local structure and reactivity of VxOySBA-15 under changing reaction conditions 157
83 Concluding remarks on the structural evolution of VxOySBA-15 under dehydrating catalytic or reducing conditions 167
84 Summary 170
9 General conclusions on VxOySBA-15 model catalysts 171
91 Introduction 171
92 Hydrated state of VxOySBA-15 171
93 Dehydrated state of VxOySBA-15 172
94 Structure of VxOySBA-15 catalysts under reducing and under catalytic conditions 173
95 Catalytic performance of VxOySBA-15 174
96 Structure-activity correlations deduced from a comparison of VxOySBA-15 with bulk V2O5175
97 Structure-activity correlations with respect to complex mixed metal oxide catalysts 176
10 Appendix 179
101 Physisorption small angle XRD and CHNS results of SBA-15 and VxOySBA-15 samples 179
102 Information Vanadium oxide and vanadate references 180
103 Baselines of white reflectance standard measured in the in situ UV-Vis-DR cells used 181
XIII
104 In situ Raman measurements during dehydration 182
105 Usable spectral range of the χ(k)k3 determined from in situ XAFS spectra 182
106 Supporting data chapter 7 183
107 Results of the analysis of the V K edge pre-edge feature 185
108 Results from XRD refinements 186
Bibliography 189
Table Captions 201
Figure Captions 204
XIV
1
1 Introduction
11 Motivation
Heterogeneously catalyzed reactions play a fundamental role in the production of fuels and a wide range
of chemical products Approximately 60 of industrial chemicals and intermediates are produced via
selectively catalyzed oxidation reactions [1] One important industrial process is the selective oxidation of
propene towards acrolein and acrylic acid (37 million tons per year [2]) The major production process is
a two stage reaction using propene as feedstock [3] First propene is oxidized to acrolein using bismuth
molybdate based catalysts Second acrolein is oxidized to acrylic acid using molybdenum based oxide
catalysts mixed with other transition metals such as vanadium and tungsten The total yield of acrylic acid
of this process is 87 [3] Increasing the total yield of industrial processes like the production of acrylic
acid is of great interest because natural resources like crude oil are saved and costs are lowered
Therefore new catalysts with improved activity and high selectivity towards the desired products are
sought
Industrial research is mostly based on chemical intuition and ldquotrial and errorrdquo methods which involve
testing of a large number of catalysts Another approach in research is a rational catalyst design [4] that
involves a deeper understanding of the complexity of active catalysts In addition to catalytic testing the
objective of these studies is to elucidate the properties of well chosen model catalysts Properties like
chemical composition electronic structure coordination of metal sites and surface and bulk structures
are investigated The aim is to derive structure-activity relationships that enlighten how the catalytic
performance correlates with these properties Furthermore this knowledge is used to develop new and
improved model catalysts However the required structure-activity relationships are not sufficiently
understood for the majority of heterogeneous catalysts
The development of new catalysts that use propane instead of propene as initial feed for the acrylic acid
synthesis [356] attracted much attention in the past decades Highly active mixed metal oxide catalysts
for the direct oxidation of propane to acrylic acid exhibit complex structures and compositions eg Mo
V W Te and Nb oxides [456] With respect to structure-activity relationships it is crucial to
understand how structure and individual metal sites influence the catalytic performance However
changing the composition of these active mixed metal oxides will mostly induce a change in the structure
as well Therefore the superior catalytic performance of these active bulk mixed metal oxides cannot be
assigned unambiguously to the functionality of individual metal centers or particular structure motifs
Hence it is difficult to distinguish between chemical and structural complexity In order to reduce the
number of variables that affect the catalytic performance suitable model systems exhibiting a lower
complexity are sought [7] Two approaches seem feasible Model systems with either plain composition
and structural variety [89] or model systems exhibiting structural invariance and a suitable
2
compositional variety [10] are promisingly Binary metal oxides constitute rather simple model systems
for the former case The present work focused on vanadium oxides as binary metal oxides
Although a huge structural variety exists among binary vanadium oxides [11] V2O5 was found to be the
only stable binary V5+ oxide Therefore two approaches for vanadium oxide based model catalysts were
chosen in the present work In a first approach ternary vanadium oxides were sought as model catalysts
to extend the range of available bulk vanadium oxides Magnesium vanadates were chosen because no
additional possibly active ldquometal sitesrdquo are introduced Furthermore magnesium vanadate systems exhibit
a variety of structural motifs (octahedral and tetrahedral coordination of V5+) which makes them very
suitable as structural model systems In a second approach silica supported vanadium oxides were chosen
as model systems Supporting metal oxides on silica may enable the stabilization of particular metal
structures that are not stable and thus not available under in situ conditions otherwise It was shown
recently that hexagonal MoO3 supported on mesoporous silica (SBA-15) is stabilized up to 773 K under
reaction conditions [8] Furthermore silica supports exhibit a large surface area no activity for catalytic
reactions and rather weak interactions with the supported metal oxides In addition to bulk model
systems supported metal oxide catalysts exhibit high dispersions and an improved surface to bulk ratio
Hence the need for differentiating between bulk and surface structures is avoided
Both model systems chosen were previously investigated in the selective oxidation of propane to propene
[5121314] However few investigations addressed the selective oxidation of propene towards acrolein
Here selective oxidation of propene was chosen as model reaction because many Mo [7-10] or V [1516]
mixed transition metal oxide model systems are active for this reaction Understanding the correlations of
structure and reactivity of these simple ldquobinaryrdquo model systems with different metal sites thus may help
to understand the complexity of highly active mixed transition metal catalysts
3
12 Vanadium oxides in catalysis
Only 3-5 of the vanadium consumption is due to the use of vanadium compounds in catalysis [1718]
Vanadium is mainly used as alloying element in the steel and metal industry Nevertheless vanadium
based oxide catalysts mainly V2O5 play an important role in selective oxidation reactions Some
important chemical processes that are based on vanadium containing metal oxide catalysts are
summarized in Table 1-1
Table 1-1 Commercially important selective oxidations with catalysts containing vanadium [1819]
Industrial process Catalyst material World production 2002
product (Mty)
Oxidation of SO2 to SO3 production of sulfuric acid V2O5 gt 100
Selective reduction NH3 to NOx V2O5WO3TiO2 -
Oxidation of benzene to maleic anhydride V2O5 14
Oxidation of butane to maleic anhydride VP oxides
Oxidation of naphthalene to phthalic anhydride VMo oxides and V-K oxides on
SiO2 22 Oxidation of o-xylene to phthalic anhydride VTi oxides
Oxidation of acrolein to acrylic acid VMoW oxides 38
Oxidation of methacrolein to methacrylic acid VMoW oxides 24
13 Supported vanadium oxides in catalysis
Supported vanadium oxides constitute model systems that are employed for the elucidation of
fundamental knowledge on structure and reactivity of many heterogeneous oxidation reactions The most
important reactions discussed are the selective oxidation of methanol [20212223] and methane
[24252627] to formaldehyde and the oxidative dehydrogenation of propane to propene [122829]
Typical supports are SiO2 Al2O3 ZrO2 TiO2 and Nb2O5 [1630] In the past decades many investigations
were performed that concern the impact of the respective support material on the structure of the
supported vanadium oxide phase and the catalytic performance However fundamental aspects
concerning the vanadium oxide structure and the reactivity of supported vanadium oxide catalysts are still
discussed intensively in the literature A general introduction into the main topics discussed is provided
by reviews from Wachs et al [30] Keller et al [18] and Muyalert et al [31] A brief summary of the
proposed vanadium oxide structures of VxOySiO2 catalysts under various conditions will be given below
Figure 1-1 depicts the vanadium oxide structures present on silica supports that are proposed and
discussed in the literature The structure of VxOySiO2 catalysts depends mainly on the vanadium oxide
dispersion (Figure 1-1) Crystalline V2O5 is present at high vanadium coverages The vanadium coverage
where a monolayer of disperse vanadium oxide structures is achieved is well below the theoretical
maximum monolayer coverage (7-8 Vnm2) [30] This is in contrast to other support materials like Al2O3
The maximum dispersion that can be obtained without the formation of detectable V2O5 crystallites is
approximately 25 Vnm2 and is typically reported for mesoporous silica supports with high surface areas
such as SBA-15 or MCM materials [233132]
4
V
O
OO
O
Si Si Si
V
O
O O
OH
Si Si
V
O
O OH
OH
Si
V
O
O O
O
Si
V
O
OO
O
Si Si
V
O
OO
SiSi
V
O
OOH
O
Si
V
O
OHO
Si
V
O
OO
O
Si Si
V
O
OO
Si
V
O
O
Si
OX
V
O
O
H2O
O
Si
V
O
OH2
O
Si
OH OH
SiH3
OH
SiH3
OH
V loading gt 25 Vnm2
V loading lt 25 Vnm2 deydrated state
4-fold coordination
hydrated state
5- and 6-fold coordination
∆∆∆∆ T
298 K H2O
isolated vanadyl sites
dimeric sites
oligomeric sites
small hydrated clusters
larger hydrated centers
V2O5 nH2O gels
H2O
∆ T
crystalline V 2O5
Figure 1-1 Main structural configurations of the vanadium oxide phase on silica supports discussed in literature
First attempts to characterize the structure of highly dispersed vanadium oxide phases on SiO2 were
reported by Hanke et al [33] in 1975 They proposed that after thermal treatment of VxOySiO2 samples
chainlike vanadium oxide species with tetrahedral coordination of the vanadium centers form on SiO2
These vanadium species are transformed reversibly into octahedrally coordinated vanadium centers in the
presence of water at ambient temperature The described tetrahedral structure corresponds to the
dehydrated state and the octahedral structure corresponds to the hydrated state according to the literature
[31] Since the early 1990rsquos the number of publications that address the structure of the disperse
vanadium oxide phases present on VxOySiO2 catalysts increased significantly (Figure 1-2) This is
ascribed to the development and the improvement of in situ spectroscopic methods such as Raman
spectroscopy UV-Vis-DRS EPR NMR XAS IR spectroscopy and XPS that are mainly used to
characterize VxOySiO2 samples
The hydrated state is proposed to consist of small square pyramidal [34] or pseudo octrahedral [35]
coordinated vanadium centers (Figure 1-1 right) With increasing coordination of water to the hydrated
vanadium oxide phase Xie et al [34] reported the formation of V2O5nH2O gels that transform into V2O5
clusters during thermal treatment Conversely other authors assumed a reversible transformation of the
highly dispersed hydrated state into the dehydrated state and vice versa for VxOySiO2 samples [35]
5
1950 1960 1970 1980 1990 2000 2010
5
10
15
20
25
30
ISI web of Knowledge 31012011keywords vanadium silica catalyst(404 records)
Num
ber
of p
uplic
atio
ns
Year
Figure 1-2 The number of papers that are found in the ISI web of Knowledge database using the keywords vanadium silica and catalyst [36]
All reports that discuss the structure of the highly dispersed dehydrated state propose that tetrahedrally
coordinated vanadium centers are present on the silica support (Figure 1-1 left) However structure
connectivity and bonding of the tetrahedral units to the SiO2 support are still under debate [373839]
Mainly isolated ldquoVO4rdquo structures are reported for the dehydrated state of VxOySiO2 These isolated
vanadium oxide sites can be attached via three Si-O-V bonds to the silica support [39] Launay et al [26]
and others [24] concluded from the presence of V-OH groups in the dehydrated state that only two bonds
to the support are present Keller et al [37] proposed ldquoumbrella modelsrdquo in which the isolated ldquoVO4rdquo
centers have either two V-OH bonds or a peroxo group (V-O2) In contrast to reports that propose isolated
vanadium oxides as the major phase in the dehydrated state the formation of dimeric or chainlike VxOy
structures with tetrahedral coordination of the vanadium centers was discussed Schraml-Marth et al [40]
concluded that isolated vanadium centers will be present only at very low vanadium loadings They
reported the formation of dimeric units or chains with V-O-V bonds for medium vanadium loadings The
formation of the V-O-V bond was explained by a lack of ldquosterically suitablerdquo Si-OH groups that are
needed to form V-O-Si bonds [40] Very recently Hess et al concluded on the basis of XAS [41]
NEXAFS [4243] and IR spectroscopy (using NO as probe molecule) [44] investigations that similar
dimeric vanadium centers are present on SBA-15 Based on the results of Raman measurements Hess et
al [38] proposed that the dimeric [V2O7]x units exhibit V-OH groups
The dehydrated state is often assumed to be the active vanadium oxide phase under catalytic conditions
The role of V-O-support V=O V-OH V-O2 and V-O-V bonds in the catalytic mechanism (eg H
abstraction from the organic reactant) is still under discussion Bell [21] and others [16] proposed that the
V-O-support bond plays a fundamental role in the selective oxidation of methanol to formaldehyde and
other reactions They assign the low activity (TOF) of VxOySiO2 compared to other support materials
(Al 2O3 ZrO2 TiO2 Ta2O5 CeO2 and Nb2O5) to the ldquohigh electronegativity of the Si cationsrdquo [16]
6
Conversely calculations by Rosanska et al [45] showed that a reaction mechanism involving vanadyl
groups (V=O) or peroxo groups (V-O2) is also feasible in the ODP of propane No differences between
isolated and dimeric VxOysupport species were determined by Rosanska et al [45] V-O-V bonds were
proposed to be irrelevant for the selective oxidation of hydrocarbons because no increase of the TOF was
observed with increasing vanadium loading (V-O-V bonds) [31] However the results of the vanadium
oxide structure in the dehydrated state of VxOySiO2 reported in the literature are very ambiguous With
respect to structure activity relationships more detailed knowledge on the structure of supported
VxOySiO2 will be required to reveal the active vanadium oxide phase under catalytic conditions
More detailed introductions concerning the topic of the respective chapter and to the magnesium vanadate
system will be provided in front of each chapter
14 Outline of the work
The objective of the present work was the investigation of suitable vanadium oxide model systems for the
selective oxidation of propene to acrolein In addition to V2O5 magnesium vanadate systems and silica
supported vanadium oxide catalysts with different vanadium loading were chosen as model catalysts
Prior to investigating the catalysts under catalytic conditions a detailed characterization of the vanadium
oxide structures was performed The focus of this work was on supported vanadium oxide catalysts
denoted as VxOySBA-15 A brief outline of the work is given below
Part I (Chapter 2) Magnesium vanadates and V2O5 are discussed as model catalysts for the selective
oxidation of propene
Magnesium vanadate phases (Mg3V10O28middot28H2O Mg2V2O7 MgV2O6 and Mg3V2O8) with
different structural motifs were synthesized The structural evolution of thermally stable
maganesium vanadates and V2O5 under oxidizing reducing and propene oxidation conditions
was investigated in situ using UV-Vis-DRS XAS and XRD In addition the catalytic
performance during propene oxidation was determined in a fixed bed reactor Correlations of
reducibility and the vanadium oxide structure with the catalytic performance are described
7
Part II (Chapter 3-9) SBA-15 supported vanadium oxides are discussed as model catalysts for the
selective oxidation of propene
Chapter 3 A short introduction to the fundamentals of X-ray absorption spectroscopy and
UV-Vis-DR spectroscopy is given Furthermore the experimental details about the preparation
of SBA-15 and VxOySBA-15 and the various measurements performed are described
Chapter 4 Three different preparation methods were evaluated for the preparation of supported
vanadium oxide catalysts During preparation the evolution of the vanadium oxide structure was
monitored using spectroscopic methods The SBA-15 support was characterized with XRD
physisorption measurements and electron microscopy Three vanadium loadings in the range of
14-77 wt V (03-24 Vnm2) were chosen for further structural and catalytic characterization
Chapter 5 Elucidation of the hydrated and dehydrated vanadium oxide structure present on
SBA-15 was performed using UV-Vis-DRS and XAS spectroscopy Theoretical model structures
which were suitable to describe the experimental data were employed
Chapter 6 Hydration and dehydration processes of the vanadium oxide structure were
investigated in situ using various spectroscopic methods In addition the dehydration of the
SBA-15 support was investigated Aging effects and re-dispersion of crystalline V2O5 species to
disperse vanadium oxide species were observed The impact of water on the dehydration process
was probed
Chapter 7 The evolution of the structure of VxOySBA-15 catalysts and the composition of the
gas phase were investigated in situ under propene oxidation conditions Reliable catalytic results
were obtained from measurements in a laboratory fixed bed reactor The catalytic performance
during propene oxidation was investigated as a function of thermal treatment and vanadium
loading
Chapter 8 Reducibility in propene and re-oxidation of VxOySBA-15 in oxygen and under
catalytic conditions was followed by in situ UV-Vis-DRS and XAS Changing interactions of the
vanadium oxide phase and the SiO2 support were observed as a result of the catalytic reaction in
propene and oxygen
Chapter 9 General conclusions that were deduced from the VxOySBA-15 model system with
respect to structure activity relationships are provided
8
Introduction
9
MAGNESIUM VANADATE MODEL CATALYSTS AND V2O5
Part I
Spectroscopic and catalytic
investigations of magnesium vanadate
model catalysts and V2O5 for selective
propene oxidation
10
11
2 Magnesium vanadate model systems and V2O5 during
selective propene oxidation
21 Introduction
Vanadium based mixed transition metal oxide catalysts play an important role in selective oxidation
catalysis of light alkanes and alkenes with gas phase oxygen [516246] However the most active and
selective catalysts for such reactions exhibit complex structures and compositions
eg MoV(SbTe)NbO catalysts [51446] For the development of improved catalysts it is essential to
understand the specific role of vanadium in oxidation catalysis Besides lsquotrial and errorrsquo approaches
model system based studies are employed The latter allow disentangling of the individual effects of
chemical composition coordination and electronic structure of the transition metal oxide The focus of
the present work was to investigate the influence of structural motifs on the catalytic behavior of
vanadium oxides Selective oxidation of propene was chosen as model reaction because many Mo [47] or
V [1648] mixed transition metal oxide model systems are active for this reaction Finding correlations
between these model systems may help to understand the complexity of highly active mixed transition
metal catalysts
Here vanadium oxide based model systems exhibiting an average vanadium valence of V5+ were
employed Only V2O5 was found as stable binary V5+ oxide Therefore ternary vanadium oxides were
sought to extent the range of available oxides In order to avoid the introduction of a second ldquopossibly
activerdquo metal atom (Fe Cr Zn Pb Cuhellip) alkali and alkali earth vanadates were preferred However
most alkali (Na K) orthovanadates are sensitive towards hydration which makes them unsuitable
Furthermore alkali earth vanadates tend to form carbonates which may be stable and may not decompose
at reaction temperatures [4950] Typical carbonate decomposition temperatures are 1098 K for CaCO3
and 1723 K for BaCO3 Only MgCO3 decomposes at a lower temperature of 623 K Therefore different
magnesium vanadate phases were synthesized as ternary vanadium oxide phases Magnesium vanadate
systems exhibit a variety of structural motifs (octahedral and tetrahedral coordination of V5+) which
makes them very suitable as structural model systems
Reports on the catalytic performance of magnesium vanadates in propene oxidation are rarely found in
literature [5152] Supported vanadium oxide and magnesium vanadate catalysts are mostly used for
oxidative dehydrogenation (ODH) of light alkanes In this field activity and selectivity of vanadium
oxide catalysts is still a controversial issue [53] A summary of the concepts is provided by Centi et al
[14] and Bettahar et al [5] The influence of geometry between the vanadium oxide unit and the
hydrocarbon [54] the redox properties [55565758] and other aspects are reviewed For the selective
propene oxidation similar correlations as found for the ODH of propane may be present
12
V2O5 was measured in addition to the magnesium vanadates V2O5 is often used as a reference compound
It is active but less selective for propene oxidation and other reactions like the ODH of propane
[515859] Haber et al [60] and other authors discussed the catalytic behavior of V2O5 on the basis of
theoretical calculations and in situ measurements They proposed V6O13 and V4O9 intermediates to be
present under reducing and catalytic conditions [60616263] In contrast Yamazaki et al [64] and
Holdago et al [65] only detected V4O9 phases under sulfur and H2S oxidizing conditions The important
role of the nature and the valence of reduced vanadium oxide phases in oxidation catalysis of V2O5 was
shown by Ballarini et al for the ODH reaction [59] However a detailed knowledge of structure activity
correlations under in situ propene oxidizing conditions remains scarce Hence a detailed in situ analysis
was performed to investigate the kind of binary vanadium oxide phase present under catalytic propene
oxidation
22 Experimental
221 Sample preparation
Mg3V2O8 (magnesium orthovanadate) MgV2O6 (magnesium metavanadate) and Mg2V2O7 (magnesium
pyrovanadate) where synthesized according to Delmon et al [55] via a citrate method Mg(NO3)2middot6H2O
(Fluka 99 ) and NH4VO3 (Fluka 99 ) were used as metal precursors in the concentrations required
for the desired MgV ratio The salts were dissolved in 500 ml water The mixture was heated at 363 K
for 2 h until a clear yellow solution was obtained After cooling to 300 K 2 ml of 65 HNO3 were added
to avoid precipitation Subsequently citric acid (three negative charges per molecule Roth 995) was
added to neutralize the positive charges of Mg2+ and V5+ Water was removed by evaporation in two steps
to avoid the formation of NOx gases (200 mbar and 343 K 30 mbar and 363 K) The resulting amorphous
solid was calcined in two steps 18 h at 653 K and 6-85 h at 823-1023 K either in a muffle furnace or an
open tube furnace depending on the resulting phase (Table 2-1) Calcination of the precursor was
performed in several batches due to the small size of the crucibles Batches exhibiting the same structural
characteristics were mixed and homogenized
Mg3V10O28middot28H2O (magnesium decavanadate) was synthesized according to Iida and Ozeki [66] V2O5
(364 g 201 mmol) was dissolved in 450 ml of a H2O2H2O mixture (50 ml 30 H2O2 and 400 ml H2O)
resulting in a red solution Afterwards a solution of Mg(CH3COO)2middot4H2O (268 g 1250 mmol) in 15 ml
water was added and the color of the mixture changed to orange The amount of water was slowly
reduced by evaporation (363 K 30-40 mbar 15 h) to 100 ml Acetone was added drop wise to the
remaining solution (100 ml 30 min) The resulting precipitate was filtered washed with acetone and
dried under reduced pressure The solid phase was recrystallized by dissolving the powder in a few ml of
water and then storing the solution in a closed bottle in the refrigerator Deep orange crystals were
obtained
13
V2O5 (vanadiumpentoxide) was used as purchased (Alfa Aesar 998) Phase purity was confirmed by
XRD The V2O5 structure proposed by Enjalbert et al [140] matched the experimental XRD pattern and
was used for structure refinement
All samples were stored under ambient conditions (298 K air)
Table 2-1 Preparation details of the synthesized magnesium vanadate samples
Magnesium vanadate phase Furnace type Crucible Temperature [K]
Time second step [h]
Mg3V2O8 muffle and tube furnace ceramic quartz 1023 6
m-Mg2V2O7 (Batch A) muffle furnace ceramic 923 6
m-Mg2V2O7 (Batch B) muffle furnace ceramic with cover 823-923 85
t-Mg2V2O7 tube furnace quartz 1023 6
MgV2O6 (Batch C) muffle furnace ceramic 923 6
MgV2O6 (Batch D) tube furnace quartz 923 6
222 Powder X-ray diffraction (XRD)
Ex situ XRD measurements were carried out on an XPert PRO MPD diffractometer (θ-θ geometry)
using Cu K alpha radiation and a solid-state multi-channel PIXcelreg detector Wide angle scans
(5deg le 2θ le 90deg variable slits) were collected in reflection mode The sample was prepared on a silicon
sample holder Data analysis was performed using the software package Topas 3 and Diffrac Plus
Evaluation 2003 (Bruker AXS) For phase identification a phase analysis was performed using the PDF
and ICSD databases To verify the structures found a refinement was performed using a fundamental
parameter approach Only the cell parameters (abcαβγ) of the corresponding theoretical structures a
background function and the size and strain parameters were refined In situ XRD measurements were
conducted on a STOE diffractometer (θ-θ Mode) using an Anton Paar in situ cell Thermal stability tests
were conducted in 20 O2 in He (total flow 100 mlmin) in a temperature range from 293 K to 773 K
Reaction tests were performed in 5 propene and 5 O2 in He in the temperature range from 323 K to
673 K (5 Kmin total flow 56 mlmin) The gas phase composition at the cell outlet was continuously
monitored using a non-calibrated mass spectrometer in a multiple ion detection mode (Pfeiffer Omnistar)
Phase analysis was performed using the WinXPOW software package (STOE) After reaction all samples
were measured ex situ (see above)
223 UV-Vis Diffuse reflectance spectroscopy (UV-Vis-DRS) measurements
UV-Vis-DRS measurements were conducted in a Jasco-V670 UV-VIS-NIR spectrometer using an ex situ
integration sphere and a Praying MantisTM in situ cell (Harrick Scientific Products Inc) MgO (ABCR)
was used as reflectance standard To avoid sintering effects the samples were diluted with MgO for in situ
measurements Thermal stability tests were conducted in 20 O2 and He (total flow 50 mlmin) in a
temperature range from 293 K to 657 K using a heating rate of 4 Kmin Reaction tests were performed in
14
5 propene and 5 O2 in He in the temperature range from 293 K to 657 K (4 Kmin total flow
40 mlmin) The gas atmosphere was analyzed using a non-calibrated mass spectrometer in a multiple ion
detection mode (Pfeiffer Omnistar) A linear correction (Tsample = 085 T holder + 2 [degC]) was applied to the
sample holder temperature which was obtained by a separate measurement using a thermocouple placed
in the sample powder bed
224 X-ray absorption spectroscopy (XAS)
Ex situ transmission XAS experiments at the V K edge (5465 keV) were performed at the XAS beamline
C at HASYLAB using a Si (111) double crystal monochromator Powders were pressed with a force of
1 ton into a 13 mm diameter pellet resulting in an edge jump at the V K edge of ∆microx ~ 1 X-ray absorption
fine structure (XAFS) analysis was performed using the software package WinXAS v32 [91]
Background subtraction and normalization were carried out by fitting a linear polynomial to the pre-edge
and a 3rd degree polynomial to the post-edge region of an absorption spectrum respectively The extended
X-ray absorption fine structure (EXAFS) χ(k) was extracted by using cubic splines to obtain a smooth
atomic background χ(k) The FT(χ(k)k3) often referred to as pseudo radial distribution function was
calculated by Fourier transformation of the k3-weighted experimental χ(k) function multiplied by a
Bessel window into R space
225 Quantitative catalysis measurements
Quantitative catalysis measurements were performed using either the UV-Vis-DR in situ cell or a fixed
bed laboratory reactor connected to an online gas chromatography system (Varian CP-3800) and a non
calibrated mass spectrometer (Pfeiffer Omnistar) Hydrocarbons and oxygenated reaction products were
analyzed using a Carbowax 52CB capillary column connected to an Al2O3MAPD capillary column or a
fused silica restriction (25 m x 032 mm) each connected to a flame ionization detector (FID) Reactant
gas flow rates of oxygen propene and helium were adjusted through separate mass flow controllers to a
total flow of 40 mlmin A mixture of 5 propene and 5 oxygen in He was used for catalytic tests in the
range of 295-683 K Boron nitride (Alfa Aesar 995 ) was used as diluent
23 Results and discussion
231 Ex situ structural characterization of prepared samples
The synthesized samples were investigated using X-ray powder diffraction (XRD) for phase identification
and structure refinement Figure 2-1 shows the detected XRD powder pattern of the phases obtained
together with the theoretical pattern from structure refinement (Appendix 108) For Mg3V2O8 [67] and
MgV2O6 [68] only a single phase was detected For Mg2V2O7 a monoclinic [69] and a triclinic [139]
phase were synthesized depending on the calcination temperature and furnace type (Table 2-1) Each
phase was obtained with a phase purity of more than 95 wt
15
experiment refinement difference
80 70 60 50 40 30 20 10
80 70 60 50 40 30 20 10
80 70 60 50 40 30 20 10
80 70 60 50 40 30 20 10
38 34 30 26 22 18 14 10 6
2 θ [deg]
Inte
nsity
In
tens
ity
Inte
nsity
In
tens
ity
Inte
nsity
Mg3V2O8
monoclinic - Mg2V2O7 (gt 95 wt)
triclinic - Mg2V2O7 (gt 95 wt)
MgV2O6
Mg3V10O28bull28 H2O
Figure 2-1 Experimental Cu Kα XRD powder patterns of the synthesized magnesium vanadate phases (dotted black) together with the XRD structure refinement of the corresponding phase (solid red) and the differential plot (solid grey)
16
a
bc
a
bc
a
b
ca
b
c
abc
abc
ab
ca
b
c
Mg3V10O28bull28 H2O
corner and edge sharing octahedrons
MgV2O6
corner and edge sharing square pyramids
triclinic
Mg2V2O7
corner sharing tetrahedrons
monoclinic
Mg2V2O7
corner sharing tetrahedrons
Mg3V2O8
isolated tetrahedrons
a
bc
a
bc
Figure 2-2 Structure motifs of the magnesium vanadate phases and the color of the respective powder
For the magnesium decavandate a phase refinement of the powder pattern was not satisfactory However
single crystal analysis (data not reported here) yielded the same Mg3V10O2828H2O structure as reported
by Iida et al [66] The observed deviations are explained by different crystal water content due to
grinding of the sample A representation of the synthesized magnesium vanadate phases together with a
picture of the colored powders is depicted in Figure 2-2 In addition to the XRD patterns XAS spectra of
all samples were recorded XAS is more sensitive to changes in the local structure and permits a more
detailed determination of average valence coordination and structural disorder of the absorbing
vanadium center All three characteristics might change during reaction The XANES and EXAFS spectra
are shown in Figure 2-3 Comparison of position height and area of the observed pre-edge peaks as
reported by Wong et al [131] indicated that all samples and the V2O5 reference had an average valence
of +5 UV-Vis diffuse reflectance spectroscopy (UV-Vis-DRS) is more sensitive towards partial
reduction processes than XAS or XRD
FT
(χ(k
)k3 )
01
02
03
0 2 4 6
R [Aring]
Mg3V2O8
m- Mg2V2O7
t- Mg2V2O7
MgV2O6
Mg3V10O28bull28 H2O
20
40
55 555 56 565
Nor
mal
ized
Abs
orpt
ion
Photon Energy [keV]
Mg3V2O8
m- Mg2V2O7
t- Mg2V2O7
MgV2O6
Mg3V10O28bull28 H2O
Figure 2-3 V K edge XANES (right) and Fourier transformed χ(k)k3 (left) of the as prepared magnesium vanadates
17
0
1
2
3
4
225 800 400 600
F(R
infin)
Wavelength [nm]
C
D
A B
A C
B D
Mg3V10O28bull28 H2O
Mg3V2O8
m- Mg2V2O7
t- Mg2V2O7
MgV2O6
Figure 2-4 Left UV-Vis-DR absorption spectra of the as-prepared magnesium vanadate phases and differrent sample batches (Table 2-1) Right picture of the different colored samples batches of the monoclinic Mg2V2O7 phase (AB) and MgV2O6 (CD) phase (lines are the same as on the left side)
The UV-Vis-DR spectra of all samples are shown in Figure 2-4 Only LMCT transitions were visible
which are located at wavelengths lower than 600 nm Vanadium valences of V4+ V3+ would generate
intervalence and d-d transitions at longer wavelengths The absence of such bands matched the average
valence of V+5 observed in XAS Differences between the respective sample batches considerably
affected the UV-Vis-DR spectra As shown in Figure 2-4 right different sample batches of the prepared
MgV2O6 and m-Mg2V2O7 did not have the same color To gain information about the electronic structure
UV-Vis edge energies [99100127] and low energy LMCT band positions were determined The
differences in Eg value and the low energy LMCT band position (Table 2-2) between the samples batches
was ~ 02 eV This was more than the deviations achieved by simple dilution of the sample with the
reflectance standard (lt 01 eV) In XAS a damped XANES and EXAFS were observed for samples A and
C compared to sample B and D (Figure 2-4 right) XRD structure refinement resulted in poor residuals
(GOF RBragg) for sample C (Figure 2-4 right)
Table 2-2 UV-Vis edge energies (Eg) and low energy LMCT band positions extracted from UV-Vis-DR spectra in Figure 2-4
Sample Low energy LMCT [nm] Low energy LMCT [eV] Eg [eV]
Mg3V2O8 336 373 344
m-Mg2V2O7 (Batch A) 330 376 329
m-Mg2V2O7 (Batch B) 315 392 347
MgV2O6 (Batch D) 376 330 290
MgV2O6 (Batch C) 396 313 273
t-Mg2V2O7 385 322 285
Mg3V10O28middot28 H2O ~ 400 ~ 31 235
18
Apparently structural disorder in the samples had a pronounced effect on the UV-Vis-DR spectra and
thus an unambiguous assignment of the structures in the spectra was difficult Therefore UV-Vis-DR
spectroscopy was used to follow changes during temperature programmed reactions qualitatively and was
combined with XRD and XAS analysis of the samples before and after reaction
Structural stability of the magnesium vanadate phases in oxygen containing atmosphere at elevated
temperatures was tested using in situ XRD and in situ UV-Vis-DRS (20 O2 300-773 K) Apart from
Mg3V10O28middot28H2O all phases and reference V2O5 were stable The magnesium decavanadate decomposed
to V2O5 and MgV2O6 as shown in Figure 2-5 Water was released in three endothermic steps (the first
one (298-320 K) not shown in Figure 2-5) During the second (320-450 K) and third water (450-500 K)
releasing step the detected reflexes decreased strongly in the XRD pattern Apparently this water
stabilized the tertiary structure between the different decavanadate units [70] Above 600 K crystalline
V2O5 and MgV2O6 phases were formed by exothermic decomposition Due to its low thermal stability
Mg3V10O28middot28 H2O was not used for further experiments During thermal treatment of all other phases in
the in situ UV-Vis-DR cell only a reversible red shift of the UV-Vis edge energy Eg (010 ndash 025 eV) was
observed without any structural changes
400500
600700
Normalized Ion Current me 18 au
Temperature [K
]
Figure 2-5 Evolution of Cu Kα XRD patterns during thermal treatment of Mg3V10O2828H2O (323-773 K 20 O2 in He) together with the ion current (H2O) measured during in situ XRD
232 Structure and reactivity of V2O5 and m-Mg2V2O7 under catalytic conditions
The structural characterization of the magnesium vanadate phases and V2O5 (as active V+5 reference)
during selective propene oxidation was conducted in situ using XRD and UV-Vis-DRS combined with
online gas phase analysis For quantitative analysis of the reaction gas mixture a gas chromatograph was
used Because of the long measurement times of ~ 22 min the gas phase was also monitored and analyzed
qualitatively by a non-calibrated mass spectrometer to gain sufficient time resolution During the
temperature programmed reaction none of the magnesium vanadate phases showed any significant
structural changes in the XRD measurements Therefore only m-Mg2V2O7 and V2O5 will be compared
19
and discussed in detail In situ XRD patterns of both samples are depicted in Figure 2-6 As mentioned
before no additional phases were detected during measurement of m-Mg2V2O7 This is in contrast to the
V2O5 reference sample (Figure 2-6 right) The initial V2O5 (space group Pmmn [140]) phase was
reduced to VO2(B) (space group C12m1 [71]) at temperatures above 623 K The mixed valence phase
V4O9 [64] was observed as intermediate phase In contrast for the reduction in hydrogen V6O13 was
reported as the main intermediate phase [72] Yamazaki et al described this metastable (V4+O)2V5+
2O7
phase (V4O9) as an orthorhombic Cmcm structure V4O9 was detected during the reduction of V2O5 into
VO2(B) with sulfur Yamazaki et al [64] assumed a different reaction mechanism because no V6O13 was
detected They concluded that during the reduction of V2O5 to V4O9 oxygen point defects are formed
while the transformation of V2O5 into V6O13 proceeds via shearing of the structure
According to the data from the vanadium oxide phase diagram the formation of a reduced vanadium
oxide phase at 673 K would only be expected thermodynamically at low oxygen content (equilibrium
pressure p(O2) lt 1 Pa) [7374] Thus the presence of reduced vanadium oxide phases was not expected
under reaction conditions (p(O2) ~ 5 kPa) However the phase diagram only considers the oxygen
pressure dependence of the binary vanadium oxide system at thermodynamic equilibrium and neglects the
reducing potential of the reactants (propene CO) Due to the long residence times in the in situ XRD cell
very high oxygen conversions (gt 99 650-673 K) were detected This caused increased total oxidation
and the formation of CO Therefore the formation of reduced vanadium oxide phases appears likely For
the magnesium vanadate system the oxygen equilibrium pressures where a reduction into the Mg2VO4 or
MgV2O4 phases and MgO is thermodynamically favorable are much lower than for V2O5 (p(O2) lt 1 Pa)
According to the magnesium vanadate phase diagram calculated by Kijima et al [73] this oxygen
equilibrium pressure is approximately 810-10 Pa (673 K) Apparently no reduction of the bulk phases
seemed feasible concerning the low oxygen conversions detected in the employed temperature range
during the in situ XRD experiments (Figure 2-6 left)
10
20
30
40
50
15 20 25 30 35 40 45 502 θ [deg]
Nor
mal
ized
Inte
nsity
323 K before
323 K after
673 K
648 K
623 K 20
40
60
20 30 40 50
2 θ [deg]
323 K before
323 K after
673 K
648 K
623 K
598 K V2O5
V2O5
V4O9+V2O5
VO2(B)
VO2(B)
V4O9+VO2(B) +V2O5
Nor
mal
ized
Inte
nsity
Figure 2-6 Selected in situ powder pattern during treatment in 5 propene and 5 oxygen in He (temperature range from 300 K to 673 K) of monoclinic Mg2V2O7 (left) and V2O5 (right) the diffraction at ~189 deg2θ originates from the sample holder
20
UV-Vis-DRS measurements were conducted in addition to XRD measurements The spectra of V2O5 and
m-Mg2V2O7 before and after reaction under propene oxidizing conditions from 298 K to 653 K are shown
in Figure 2-7 together with the corresponding V K edge XANES spectra For V2O5 the XANES changed
significantly The pre-edge peak decreased and the edge energy shifted to a lower value which indicates
reduction of the sample This reduction was observed as a prolonged absorption region in the UV-Vis-DR
spectrum (500-2500 nm) XRD analysis after reaction showed a mixture of V2O5 V4O9 and VO2 phases
Thus the observed absorption bands gt 500 nm were ascribed to a mixture of d-d and intervalence charge
transfer transitions originating from the reduced V4+ oxidation state Similar to the XRD results no
distinct changes were detected in the XANES spectra of the m-Mg2V2O7 phase Small absorption bands
between 500 nm and 1000 nm occurred in the UV-Vis-DR spectra of m-Mg2V2O7 samples after propene
oxidation These bands were attributed to small fractions of reduced magnesium vanadate phases present
at the surface An overall reduction of the magnesium vanadate phases is not very likely considering the
phase diagram [73] as discussed above However UV-Vis-DRS spectroscopy is much more sensitive
towards partial reduction than XRD and XAS Furthermore reduction and re-oxidation kinetics of the
involved vanadium centers during the oxidation of propene play an important role [162] Thus the
reduction step of the involved vanadium oxide center may be slower than the re-oxidation step of this
center during propene oxidation This would cause partially reduced vanadium centers on the surface
during the propene oxidation
05
10
15
20
5475 55 5525 555
Nor
mal
ized
Abs
orpt
ion
Photon Energy [keV]
before reaction after reaction
m- Mg2V2O7
V2O5
V2O5 before V2O5 after m-Mg2V2O7 before m-Mg2V2O7 after
02
04
06
08
10
500 1000 1500 2000 2500
Nor
mal
ized
F(R
infin)
Wavelength [nm]
700 nm
Figure 2-7 UV-Vis-DR absorption spectra (left) and V K edge XANES spectra (right) of monoclinic Mg2V2O7 and V2O5 before and after treatment in 5 propene and 5 oxygen in He (temperature range from 300 K to 653 K) glitch at 850 nm originates from detector change
In order to compare the reduction process of all magnesium vanadates the intensity at 700 nm relative to
the normalized absorption maximum in the applied temperature range is depicted in Figure 2-8 left The
wavelength at 700 nm was chosen because it is in the range where d-d absorption bands are located Thus
it is representative for reduced vanadium species Moreover the wavelength of 700 nm is located before
the wavelength of detector change (850 nm) in the UV-Vis instrument In the spectra of the two
pyrovanadate phases (m- and t-Mg2V2O7) a small increase in the intensity at 700 nm was detected It was
assumed that these phases were slightly reduced under catalytic conditions Comparing the evolution of
21
the gas phase of m-Mg2V2O7 and V2O5 the formation of oxidation products (water carbon dioxide
acrolein) was observed above 570 K for both samples (Figure 2-8 right) Apparently the onset of
acrolein formation for V2O5 coincidences with the increase in absorption at 700 nm and the appearance of
the V4O9 phase in the XRD pattern Interestingly a significant decrease of acrolein and increase of water
and CO2 in the gas phase was observed above 635 K Comparing this with the detected structural
transformations in XRD (Figure 2-6 right) it was assumed that apart from V4O9 formation a further
reduction towards VO2(B) occurred The formation of VO2(B) seemed to increase the rate of total
oxidation of propene
300 350 400 450 500 550 600 650
00
01
02
03
04
05
Mg3V
2O
8
MgV2O
6
m-Mg2V
2O
7
V2O
5
t-Mg2V
2O
7
Rel
ativ
e F
(Rinfin)
(700
nm)
Temperature [K]300 400 500 600
00
03
06
09
Temperature [K]
me
18
03
06
09
H2O
m-Mg2V
2O
7
V2O
5
me
44
03
06
09
CO2
acrolein
Nor
mal
ized
Ion
Cur
rent
me
56
Figure 2-8 Left Evolution of relative absorption at 700 nm (compared to maximum intensity in the respective spectrum) of the UV-Vis-DR absorption spectra of magnesium vanadate phases and V2O5 Right evolution ion currents (CO2 water and acrolein) measured during in situ UV-Vis-DR studies (thermal treatment in 5 propene and 5 oxygen in He)
233 Catalytic performance of the magnesium vanadates and V2O5
Compared to V2O5 all magnesium vanadate samples showed differential conversions (~ 1) Moreover
quantitative measurements were conducted in a laboratory fixed bed reactor at 673-684 K (Table 2-3)
which allowed the use of a larger sample mass to increase the conversion Comparing the conversions of
the magnesium vanadate phases different activities were detected Taking the rate of propene conversion
per gram catalyst as indicator for the activity the following dependence was found V2O5 gtgt m-Mg2V2O7
gt MgV2O6 gt Mg3V2O8 gtgt t-Mg2V2O7 (no activity) A comparison of the measured selectivities could
only be made qualitatively because no isoconversional conditions were achieved Compared to V2O5
Mg3V2O8 exhibited a low conversion and similar amounts of total oxidation products (CO CO2 Figure
2-9 right) For the two other phases the amounts of total oxidation products were slightly higher than that
of V2O5 The detected amounts of partial oxidation products (oxygenates) were comparable for the
m-Mg2V2O7 and Mg3V2O8 samples
22
V2O
5m-Mg
2V
2O
7MgV
2O
6Mg
3V
2O
8
00
02
04
06
08
10
S
elec
tivity
CO2
CO acetaldehyde propionaldehyde acetone acrolein acetic acid
0
2
4
6
8
10
12
14
propene conversion
Conversion [
]
Figure 2-9 Propene conversion and selectivity of the magnesium vanadate phases and V2O5 in 5 propene and 5 oxygen in He at 673-683 K
Acrolein was formed as the main product (~ 83 of the oxygenates) followed by acetaldehyde (~ 12 of
the oxygenates) Propionaldehyde acetone and acetic acid were detected as minor components For the
MgV2O6 phase the acrolein formation was lower (~ 69 of the oxygenates) and the formation of other
partial oxidation products was slightly higher Hence a lower selectivity towards acrolein formation was
ascribed to this phase For V2O5 the selectivity towards acrolein was lower (~ 38 of the oxygenates) and
significant amounts of partial degradation products such as acetic acid (~ 32 of the oxygenates) were
detected
Table 2-3 Catalytic performance of the magnesium vanadate phases compared to V2O5 during the selective oxidation of propene (40 mlmin 5 O2 and 5 propene in He)
Sample
Fixed bed laboratory reactor in situ UV-Vis-DRS cell
mass [mg]
Xpropene [] 673 K
rate 673 K
sdot
sg
micromol
catalyst
propene mass
[mg] Xpropene []
658 K
rate 658 K
sdot
sg
micromol
catalyst
propene
Mg3V2O8 94 lt 2 lt 03 35 08 03
m-Mg2V2O7 91 7 11 43 07 02
t-Mg2V2O7 92 -- -- 61 11 03
MgV2O6 94 4 06 56 09 02
V2O5 20 11 82 59 12 29
23
234 Structural evolution of V2O5 and m-Mg2V2O7 under reductive conditions
A common explanation of activities and selectivities of magnesium vanadates in the ODH of propane is
the difference in their reduction behavior [5557] Here temperature-programmed reduction (TPR) in
propene (298-673 K 5 propene in 95 He) was used to investigate possible correlations between
catalytic performance and reducibility of magnesium vanadates and V2O5 Comparable to the results
obtained under catalytic conditions almost no reduced phases were detected in the XRD patterns of the
magnesium vanadate phases (Figure 2-10 left) Only at 673 K a small increase in the intensity of the
diffractions around 35 deg2θ and 43 deg2θ was observed These diffractions may be attributed to MgO [75]
and Mg2VO4 [76] which were formed from reduction of m-Mg2V2O7 [73] Due to the low intensity and
the proximity of the characteristic diffractions of all phases a more detailed analysis was not feasible In
the XRD patterns of the other magnesium vanadate phases after reduction at 673 K these diffractions
were not identified Conversely V2O5 was reduced to V2O3 in several steps (Figure 2-10 right) Above
523 K the V4O9 phase was formed which transformed into VO2(B) above 598 K Around 648 K VO2(B)
was further reduced to V2O3 via the formation of other VO2 phases Similar to the results obtained under
catalytic conditions the formation of the reduced phases was explained by the p(O2) - T phase diagram
[73] and the high reduction potential of propene and CO
20 30 40 50
323 K after
673 K
648 K
623 K
323 K before
2 θ [deg]
Nor
mal
ized
Inte
nsity
20 30 40 50
Nor
mal
ized
Inte
nsity
2 θ [deg]
V2O5
V2O5
V4O9+V2O5
VO2+ V2O3
VO2(B)
V4O9+V2O5
V4O9+V2O5
V4O9+V2O5
323 K before
323 K after
673 K
648 K
623 K
598 K
573 K
548 K
523 K
473 K
V2O3
V2O3
Figure 2-10 Selected in situ powder pattern during treatment in 5 propene in He (temperature range from 300 K to 673 K) of monoclinic Mg2V2O7 (left) and V2O5 (right) the diffraction at ~189 deg2θ originates from the sample holder
24
Photon Energy [keV]
05
10
15
20
5475 55 5525 555
before reaction after reaction
Nor
mal
ized
Abs
orpt
ion
m- Mg2V2O7
V2O5
02
04
06
08
10
500 1000 1500 2000 2500
Nor
mal
ized
F(R
infin)
Wavelength [nm]
700 nm V2O5 before V2O5 after m-Mg2V2O7 before
m-Mg2V2O7 after
Figure 2-11 UV-Vis-DR absorption spectra (left) and V K edge XANES spectra (right) of monoclinic Mg2V2O7 and V2O5 before and after treatment in 5 propene in He (temperature range from 300 K to 653 K) glitch at 850 nm originates from detector change
The UV-Vis-DR and XAS spectra of V2O5 and m-Mg2V2O7 before and after the reaction with propene
(298-653 K 5 propene in 95 He) are shown in Figure 2-11 As expected from the XRD analysis
strong absorption bands above 500 nm were measured for V2O5 after the reaction These were assigned to
the reduced vanadium oxide phases V2O3 VO2 (different phases) and V4O9 From the position and height
of the strongly decreased pre-edge peak in the V K edge XANES spectra of V2O5 the average valence
was estimated to be ~ V4+ after the reaction For the m-Mg2V2O7 phase the V K edge XANES spectra did
not change significantly during propene TPR Only a small decrease of the pre-edge peak was noticeable
Apparently the average valence remained V5+ The UV-Vis-DR spectra showed a more pronounced
reduction of the m-Mg2V2O7 phase (Figure 2-11 left) The evolution of the relative absorption at 700 nm
during TPR with propene in the range from 298-653 K for all magnesium vanadates and V2O5 is
presented in Figure 2-12 left
300 350 400 450 500 550 600 650
00
01
02
03
04
05
06 m-Mg2V
2O
7
MgV2O
6
t-Mg2V
2O
7
V2O
5
Mg3V
2O
8
Rel
ativ
e F
(Rinfin)
(700
nm)
Temperature [K]300 400 500 600
03
06
09
acrolein
CO2
H2O
Temperature [K]
me
18
03
06
09
m-Mg2V
2O
7
V2O
5
me
44
03
06
09
Nor
mal
ized
Ion
Cur
rent
me
56
Figure 2-12 Left Evolution of the relative absorption at 700 nm (compared to the maximum intensity in the respective spectrum) in the UV-Vis-DR absorption spectra of the magnesium vanadate phases and V2O5 Right Evolution of the ion currents (CO2 water and acrolein) measured during in situ UV-Vis-DR studies (thermal treatment in 5 propene in He)
25
Except for the Mg3V2O8 phase all samples showed an increased absorption and thus reduction at
elevated temperatures above 400-450 K Relative to the maximum absorption peak the increase of
absorption at 700 nm followed the order V2O5 gtgt t-Mg2V2O7 m-Mg2V2O7 gt MgV2O6 gt Mg3V2O8
(no increase) For V2O5 above 600 K the slope of the curve increased in agreement with the detection of
VO2 in the XRD pattern This increase correlated with an enhanced formation of water CO2 and
acrolein Hence different reaction kinetics may be present when V5+ is fully reduced to V4+ The
evolution of the gas phase during TPR of V2O5 and m-Mg2V2O7 is depicted in Figure 2-12 right For
V2O5 two steps were observed in the formation of water and CO2 The first step occurred between 520 K
and 600 K and correlated with the formation of V4O9 The second step occurred between 600 K and
653 K in agreement with the formation of V4+ and V3+ phases detected in the XRD pattern (Figure 2-10
right) Increased formation of acrolein was only detected during the second step For m-Mg2V2O7 several
steps occurred in the formation of water (me 18) The first step between 300 K and 400 K was ascribed
to dehydration processes Above 450 K a second step was accompanied by the formation of CO2
(me 44) Afterwards the signal for me 18 and 44 slightly increased The CO2 formed may be due to
carbonates which formed during storage of the samples under ambient conditions
10 20 30 40 50
00
02
04
06
08
10
Nor
mal
ized
Inte
nsity
2 θ [deg]
MgO MgV
2O
4
Mg2VO
4
ab
c
Mg2+
V3+
O2-
ab
c
Mg2VO4
MgV2O4
Mg2+
V4+
O2-
Figure 2-13 The XRD powder pattern of Mg3V2O8 before (grey) and after (black) treatment in 5 propene in He (300-773 K) together with the structure motif of the possible Mg2-xV1+xO4 spinel type phases
To reveal the formation of reduced magnesium vanadate phases as predicted from the chemical potential
diagram [73] Mg3V2O8 was reduced at temperatures higher than the reaction temperature of 673 K The
XRD patterns before and after reduction at 773 K are shown in Figure 2-13 New phases were detected
(gt 748 K) which were assigned to MgO [75] and MgV2O4 [77] Mg2VO4 [76] (Figure 2-13) and
MgV2O4 form together with Mg3V2O8 spinel type Mg2-xV1+xO4 phases Hence the formation of these
reduced magnesium vanadate phases under reductive conditions was likely
26
235 Correlations of structure reducibility and catalytic activity of V2O5
The presence of reduced vanadium phases during catalytic propene oxidation was shown for V2O5 In
contrast to the literature [64] here a V4O9 phase was mainly detected at lower temperatures of 593- 648 K
(instead of V6O13) The V4O9 phase was further reduced towards VO2(B) at higher temperatures of 648-
673 K (Figure 2-6 right Figure 2-10 right) Formation of VO2(B) was accompanied by an increased
oxygen conversion and a decreased formation of partial oxidation products (Figure 2-8 right) During
reduction in hydrogen V6O13 was observed as mixed valence vanadium oxide phase [78] This can be
explained via a shearing of the V2O5 structure through the formation of oxygen defects [6071] In
contrast to propene hydrogen is much smaller and more likely to diffuse into the bulk structure of V2O5
Thus the different intermediate structures during reduction in hydrogen or propene may be explained by
the nature of the reducing agent The observed V4O9 is not the same V4O9 phase reported to be formed by
shearing of the V2O5 structure [61626579] The main difference to that phase was the (202) diffraction
at ~ 202 deg2θ Unfortunately this diffraction was not easily distinguishable from the (001) diffraction of
the V2O5 structure (~ 203 deg2θ) In the XRD pattern in Figure 2-10 (598 K) residuals of approximately
16 wt V2O5 may be present next to V4O9 Nevertheless the V4O9 structure reported by Yamazaki et al
[64] was used here because it was verified by structure refinement of the proposed structure to the
experimental powder pattern (Figure 10-9 appendix) For the other reported V4O9 structure [79] only an
indexed file was found in the PDF databases A representation of the vanadium oxide phases formed
during reduction and propene oxidation is depicted in Figure 2-14 Yamazaki et al [64] discussed that
the structure of V4O9 is similar to (VO)2P2O7 structures which are active in many oxidation reactions
[162] Hence it has to be investigated if a specific influence of the proposed structure motifs in this
structure (V5+ tetrahedrons and V4+ V5+ square pyramids and octahedrons) accounts for the catalytic
activity of V2O5 Alternately the formation of V4+ centers together with oxygen defects and mobile bulk
oxygen may be responsible However the formation of V4O9 coincides with the formation of reaction
products during in situ UV-Vis-DR measurements (Figure 2-8) This leads to the conclusion that V2O5 is
not the catalytically relevant vanadium oxide structure under selective propene oxidizing conditions
Moreover the role of lower vanadium valences of binary vanadium oxides in the reaction processes of
propene oxidation has to be investigated in more detail
a b
c
V+4
O-2b
c
V+5
O-2
a b
c
V
O
= RV-Ogt23 Aringlt28 Aring(001)
Figure 2-14 (100) plane of the phases formed during the reduction and oxidation of V2O5 in the presence of propene at elevated temperatures (left V2O5 Pmmn [140] middle V4O9 Cmcm [64] right VO2(B) C12m1 [71]) triangles indicate location of distorted octahedrons with V-O distances between 23 Aring and 28 Aring
27
236 Correlations of structure reducibility and catalytic activity of the magnesium vanadate
system
The in situ experiments indicated that the structure activity correlations of the magnesium vanadate
systems are different from V2O5 during the selective oxidation of propene in the employed temperature
range studied here Compared to V2O5 the bulk structures of the magnesium vanadates were stable under
reducing and propene oxidizing conditions Only for m-Mg2V2O7 a slight reduction was detected at 673 K
in the XRD pattern (Figure 2-10) Deep reduction of the bulk phase was only observed at temperatures
which were higher than the temperature of catalytic propene oxidation at 673 K (Figure 2-13) However
on the surface slight reduction was observed in UV-Vis-DRS of all magnesium vanadate phases (Figure
2-8 Figure 2-12) For non stoichiometric magnesium vanadate phases under reducing conditions
(propane) Burrows et al [80] observed the formation of spinel type Mg2-xV1+xO4 phases on the surface of
the catalysts Thus such structures may be present on the surface including the fact that these structures
were formed under reducing conditions at elevated temperatures (gt 748 K Figure 2-13) Except for the
t-Mg2V2O7 phase magnesium vanadate phases with higher degree of reduction (Figure 2-12) also
showed the higher propene conversion (Figure 2-9) Thus similar to the ODH of propane the activity
may be correlated to the reducibility and the lability of surface anions as proposed by Volta et al [81] for
the oxidative dehydrogenation of alkanes
Otherwise concerning the t-Mg2V2O7 phase there seems to be a more complex correlation between the
magnesium vanadate phases and catalytic activity UV-Vis-DRS showed that the t-Mg2V2O7 phase had
the same reducibility as the m-Mg2V2O7 phase but no activity was observed in the catalytic experiments
(Figure 2-10 Figure 2-12) A similar decrease of activity between those two phases was observed by
Sugiyama et al [57] during the ODH of propane A noticeable difference between the anion structures of
both pyrovanadate phases are very short V-V distances of 33 Aring in the t-Mg2V2O7 phase [139] This
causes a higher distortion of the V2O74-
dimers Moreover there are vanadium oxygen distances between
2 Aring - 3 Aring which implies a higher connectivity of the V2O74-
units than dimers The V2O74-
units seem to
form distorted chains (Figure 2-15) As these chains are not formed via corner sharing tetrahedrons like
in the structure of metavanadates (NH3VO4) the oxygen atoms are strongly coordinated by the vanadium
atom These vanadium centers in t-Mg2V2O7 may interact differently with the gas phase propene and
oxygen molecules which adsorb on the surface Thus a deeper understanding of the catalytic behavior of
those two phases will provide a more profound knowledge of the underlying reaction mechanism
Comparison of the activity and the selectivity of the other magnesium vanadate phases showed that the
same amounts of products were observed for Mg3V2O8 and the m-Mg2V2O7 phase For the m-Mg2V2O7
phase higher conversions were detected Hence the same catalytically active vanadium centers have to be
present in both samples However due to the lower reducibility and lower vanadium to magnesium
content a lower amount of these centers were present in the Mg3V2O8 under catalytic conditions For the
MgV2O6 phase a lower conversion and a decreased formation of acrolein among the oxygenated products
was detected This structure and a higher amount of vanadium in the oxide may allow a different
28
coordination of the reactants on the surface Furthermore other oxidizing species (more electrophilic O-
than nucleophilic O2- [162]) may have formed which are reacting with the propene molecule Examples of
such distinct differences between the various magnesium vanadate phases are not yet found in literature
for the reaction with propene Solonsa et al [51] detected the formation of acrolein solely for the MgV2O6
and the m-Mg2V2O7 phase
a
b
c
Figure 2-15 Scheme of the triclinic Mg2V2O7 structure (lines indicate connections between tetrahedral V2O7
4- units when the first V-O coordination sphere is extended from 23 Aring to 3Aring)
237 Comparison of the magnesium vanadate system and V2O5
Similar to the binary vanadium oxide system (V2O5) the catalytic activity of the ternary magnesium
vanadate system seemed to be correlated with the reducibility of the vanadium oxide species Conversely
if the selectivites of the reaction products were compared more differences were detected between the
magnesium vanadates and V2O5 Especially m-Mg2V2O7 and Mg3V2O8 exhibited an increased total
oxidation of propene compared to V2O5 This was explained by the enhanced basicity of the surface due
to the Mg content in the samples In general propene (considered as basic molecule) will be more readily
adsorbed at acidic centers than at basic centers and oxygenated reaction products (organic acids and
aldehydes) will adsorb more strongly on basic surfaces Thus through the stronger adsorption of the
oxygenated reaction products consecutive reactions such as total oxidation seemed to be favored on
magnesium vanadate catalysts The same concept was used to interpret their superior performance
compared to V2O5 in the ODH of propane However this concept explains only the formation of CO2 and
CO Comparison of the amounts of oxygenated reaction products showed a significantly higher selectivity
towards acrolein for the magnesium vanadate phases (69 - 83 of the oxygenates) than for V2O5
(~ 32 of the oxygenates) For V2O5 an increased formation of partial degradation products was detected
(acetic acid acetaldehyde) Thus a different nature of the oxygen species may be present on the surface
According to general concepts [162] electrophilic oxygen (O-) is proposed to be less selective than
nucleophilic oxygen (O2-) Similar to the concepts reviewed by Gryzybowska et al [162] the oxygen
species present may be correlated with the re-oxidation mechanism of the metal oxide during catalysis
Therefore a low re-oxidation rate of the reduced vanadium species may be present on the binary
vanadium oxide causes a higher amount of unselective O-
29
24 Summary
Various ternary magnesium vanadate phases were synthesized and tested for the selective oxidation of
propene Consistent with the results during ODH of propane the reactivity was correlated with the
reducibility of the surface of the respective magnesium vanadate phase The reactivity followed the order
monoclinic Mg2V2O7 gt MgV2O6 gt Mg3V2O8 Only the triclinic Mg2V2O7 showed no activity for the
selective oxidation of propene The different magnesium vanadate phases showed only marginal
differences in the selectivities towards oxygenated products such as acrolein Compared to measurements
perfomed with V2O5 total oxidation was increased but among the partial oxidation products mainly
acrolein was formed The overall activity of the magnesium vanadate phases was significantly lower than
that of the reference V2O5 In contrast to the magnesium vanadate system a bulk reduction was observed
for V2O5 during the selective oxidation of propene With the onset of catalytic activity formation of the
mixed valence phase V4O9 was observed V4O9 was further reduced to VO2(B) at elevated temperatures
Apparently the measured activities and selectivities of the ternary magnesium vanadate and the binary
vanadium oxide system indicated that apart from the reducibility of the vanadium oxide phases different
catalytic mechanisms may apply In summary the results presented here confirm the suitability of these
vanadium oxides as model systems for studying the influence of vanadium in selective propene oxidation
The formation of reduced phases for both binary and ternary systems is subject of further investigation
30
31
VXOYSBA-15 MODEL CATALYSTS
PART II
Spectroscopic and catalytic
investigations of VxOySBA-15 model
catalysts for selective propene
oxidation
32
33
3 Fundamentals and experimental details
31 Catalyst preparation
Mesoporous silica SBA-15 was prepared according to literature procedures [8283] 10 g poly(ethylene
glycol)-block-poly(propylene glycol)-block-poly(ethylene glycol) triblock copolymer (Aldrich pluronic
P-123) was dissolved in 605 ml water and 33 ml concentrated H2SO4 at 323 K in a water bath After
drop wise addition of 23 g tetraethyl orthosilicate (TEOS) the reaction mixture was stirred for 24 h at
323 K The resulting suspension was heated in a closed bottle to 381 K for 24 h The resulting white
powder was filtered and washed with deionized water and dried at 353 K for 72 h The dry powder was
calcined at 453 K for 4 h and for 12 h at 823 K
The ammonium decavanadate precursor was prepared as follows [84] 1 g NH4VO3 was dissolved in
33 ml water and heated to 343 K for 24 h The remainder was filtered off and 14 ml 50 acetic acid was
added drop wise to the resulting yellow solution After addition of 265 ml ethanol the deep orange
solution was cooled with a mixture of 11 acetone and dry ice The resulting orange powder was filtered
and washed with 1 ml ethanol and 2 ml diethyl ether Structure and phase purity were confirmed by single
crystal XRD analysis and X-ray powder diffraction (data not shown here)
Functionalized SBA-15 was prepared via a grafting ion exchange method described by Hess et al [32]
SBA-15 was heated in vacuum for 24 h and afterwards functionalized by adding
3-aminopropyltriethoxysilane (APTES) to a suspension of SBA-15 in toluene (1 ml APTES 15 ml
toluene 1 g SBA-15) The suspension was stirred under reflux for 24 h After distilling off the solvent
the content was washed with diethyl ether and afterwards filtered and washed in a Soxhlet apparatus with
diethyl ether for 24 h and then dried at room temperature for 72 h The dry powder was stirred in 03 M
HCl for 12 hours The content was filtered again washed with water and dried in air overnight
(functionalized SBA-15) Vanadium oxide supported on SBA-15 was prepared by adding appropriate
amounts of ammonium decavanadate to a suspension of functionalized SBA-15 in water and stirring
under ambient conditions for 12 h After filtration and washing with water the resulting powder was dried
at 323 K for 2 h and calcined at 823 K for 12 hours In comparison to the samples prepared by the
grafting ion exchange method two samples were prepared by incipient wetness and wet impregnation
method For the incipient wetness SBA-15 69 mg of ammonium decavanadate were dissolved in 1 ml
water and added drop wise to 1 g SBA-15 powder After each addition the powder was homogenized and
dried under ambient conditions The resulting powder was calcined at 823 K for 12 hours For wet
impregnation SBA-15 10 g NH4VO3 (Fluka 99) were dissolved in 450 ml water After addition of 5 g
SBA-15 the mixture was stirred at 343 K for 17 h The suspension was filtered hot and the resulting
powder was dried for 1 h at 323 K The powder was heated to 773 K (rate 1 Kmin) and calcined for 3 h
The samples were stored under ambient conditions (298 K air)
34
32 Catalyst characterization
321 X-ray absorption spectroscopy (XAS)
3211 Fundamentals
X-rays are able to penetrate condensed matter After passing through the matter the intensity of the
incident light (I0) is attenuated which can be expressed by Lambertrsquos law (I = I0 exp(-microd)) The
attenuation depends on the sample thickness (d) and the linear absorption coefficient (micro) The absorption
coefficient expressed as mass absorption coefficient refers to the density of a material The dependence
of the (mass) absorption coefficient on the energy of the incident light and the atomic number (Z) of the
absorbing material causes a smooth decay of the absorption coefficient However if the energy of the
incident light reaches the specific binding energy (EB) of tightly bound core electrons (1s 2s 2p levels)
these electrons will be excited to empty states above the Fermi level (Figure 3-1 left) At this energy a
sharp rise in absorption will be detected which is denoted as the absorption edge The absorption edge is
element specific and termed after the ground state of the electron (1s 2s 2 p12 2p32 ) as K LI LII or LIII
edge As a consequence of the absorption process a photoelectron and a core hole at the initial state of the
photoelectron are generated The core hole is refilled by electrons located at higher energy levels The
energy released by this relaxation process can be detected as fluorescence or as Auger and secondary
electrons which are generated The wavelength of the emitted light or the kinetic energy of the released
electrons are element specific
The photoelectron originating from the absorbing atom will interact with the electron density of adjacent
atoms in condensed matter (Figure 3-1 middle) The propagation of the photoelectron away from the
absorbing atom is considered as a spherical wave with a wavelength λ = 2πk with the wavenumber k
defined as
( )Be Eh
h
mk minus
= νπ
2
28 (31)
Where hν is the energy of the incident photon me the mass of the electron and EB the binding energy of
the photoelectron When the outgoing electron wave reaches neighboring atoms it will be scattered back
The resulting incoming spherical electron wave interferes with the outgoing photoelectron wave This
interference influences the absorption coefficient and thus the measured absorption spectra The impact of
the scattering process of the photoelectron on the absorption coefficient can be explained quantum
mechanically The absorption coefficient is proportional to the transition probability of the excited
electron Within a dipole approximation this transition probability is proportional to a function which
depends on the initial and the final state wavefunction of the exited electron (Fermirsquos golden rule) The
initial state is the localized electron in the core level The final state wavefunction is dependent on the
contribution from the outgoing electron wave and the backscattered electron wave (Figure 3-1)
35
Moreover the core hole in the initial state of the electron influences the final state wave function These
different energy depended contributions to the final wavefunction lead to oscillations of the absorption
coefficient that can be extracted from the X-ray absorption spectra
Figure 3-1 Left excitation process of the photoelectron middle scattering process of the photoelectron right typical V K edge spectrum
Typically XAS spectra are recorded in transmission mode The sample is placed between two ion
chambers that measure the intensity of the X-ray radiation Detection with fluorescence radiation or
Auger electrons is also possible in the cases of low element concentration and of light elements
surrounded by a strongly absorbing matrix The spectra are normally recorded from 100 eV before to a
few hundred eV after the absorption edge of the analyzed element in the sample X-ray absorption spectra
can be divided into two sections (Figure 3-1 right) The X-ray absorption near edge structure (XANES)
and the extended X-ray absorption fine structure (EXAFS)
The XANES region is located approximately 50 eV before and after the absorption edge This region
contains information about the electronic properties eg the oxidation state and the local geometry
around the absorbing atom The latter is mostly determined from pre-edge features that are located before
the absorption edge These are caused by dipole andor quadruple transitions of core electrons into empty
or partially filled d states near the Fermi level in transition metal elements For K edges (1s ground state)
dipole transitions are forbidden (Lapportersquos rule) in the case of centrosymmetric configurations
Therefore very symmetrical octahedrally coordinated absorption centers will not show significant pre-
edge features In contrast absorption centers in a strongly distorted environment eg tetrahedral allow a
mixing of d and p states and will show very intense pre-edge features For 3d transition metal elements
(V Cr Mn) the mixing of 3d and 4p states is more likely than for higher d band transition metal elements
(Mo W) After the absorption edge the XANES spectra show specific oscillations which are either due
to transitions to higher unoccupied states or to multiple scattering effects of the photoelectron which is
more dominant Typically this region is used as ldquofingerprintrdquo region in comparison with the spectra of
well characterized references A theoretical description is more difficult than for the EXAFS region but
possible using software codes like Feff 8 [85]
36
00
10
20
0
-10
-20
4 6 8 10
χ(k
)k
3
k [Aring -1]
00
001
002
00
-001
0 2 4 6R [Aring]
FT
[χ(k
)k
3]
00
025
05
075
10
000 5 100
norm
ab
sorp
tion
k [Aring -1]
micro(k)
micro0(k)
∆∆∆∆micro0
Figure 3-2 XAS data reduction left extraction of the χ(k) middle k3 weighted χ(k) right Fourier transformed k3 weighted χ(k)
The EXAFS region at higher energies is dominated by oscillations of the absorption coefficient caused by
scattering of the photoelectron at adjacent atoms The oscillatory part of the measured absorption
coefficient micro(k) can be separated from the atomic absorption of a free atom micro0(k) and is denoted as the
EXAFS function χ(k)
))(1()()( 0 kkmicrokmicro χ+sdot= (32)
The typical steps of XAFS data reduction are depicted in Figure 3-2 For a single scattering event the
EXAFS function can be described theoretically by a single scattering plane-wave approximation which is
well described in the literature [8687] The EXAFS function of an atom in a compound is the sum of all
scattering events caused by the presence of neighboring atoms
))(2sin()()(1
kkRkAk jj
j
j
j ϕχ +=sum=
(33)
with the amplitude
)(acute)(
)(222
2
)(220 kFe
kR
ekSNkA j
k
j
kR
jjj
jσ
λminus
minus
= (34)
The term Nj refers to the number of atoms in the jth coordination shell (coordination numbers) The
fraction term describes the damping of the signal The amplitude reduction term S02 describes the
intensity loss due to relaxation effects on the remaining electrons of the absorber atom caused by the core
hole The intensity loss of the spherical electron wave is considered by the term 1R2 The term
exp(-2Rjλ(k)) considers the finite lifetime of the core hole It is determined by the average free path
length of the photoelectron The term exp(-2k2σ2j) describes the influence of static and thermal disorder
on the amplitude It is determined by the disorder parameter σ2j The Fj(k) function considers the specific
backscattering power of each element and is strongly dependent on k Weighting the EXAFS function
with k allows emphasizes of light (eg oxygen k weight 0) or strong scatterers (eg platinum k weight
3) Typically the EXAFS function is Fourier transformed as shown in Figure 3-2right The envelope of
37
the Fourier transformed EXAFS function corresponds to a pseudo radial distribution around the absorbing
atom However the scattering process causes a phase shift of the electron wave (φ(k) Equation 33)
Therefore all distances in the experimental FT(χ(k)k3) are shifted by 04-05 Aring to lower values
Software codes like FEFF [88] allow the calculation of theoretical scattering paths from suitable
theoretical models The calculated theoretical parameters of the resulting scattering paths (eg N R σ2
E0) can be refined to the experimental XAFS data This allows the determination of local structure
parameters like coordination numbers distances and disorder parameters Modern software codes allow
the consideration of more complex scattering processes like multiple scattering [89]
3212 Experimental details of XAS
In situ transmission XAS experiments were performed at the V K edge (5465 keV) at beamlines E4 C
and A1 at the Hamburg Synchrotron Radiation Laboratory HASYLAB and at the XAFS beamline at
ANKA using a Si (111) double crystal monochromator The energy range used for V K near edge scans
(XANES) and extended XAFS scans (EXAFS) was 54-57 keV (~ 3 minscan) and 54-60 keV
(~ 20 minscan) respectively For fast measurements QEXAFS scans were performed (54-58 keV
~ 25 min) For in situ and ex situ XAFS measurements samples were mixed with BN and PE
respectively and pressed into self-supporting pellets (5 mm and 13 mm in diameter respectively) In
order to obtain an edge jump ∆microx below 10 at the V K edge 25 mg of 77 wt and 41 wt
VxOySBA-15 and 3 mg of 14 wt VxOySBA-15 diluted with BN (~ 15 mg) and 3-6 mg of bulk
vanadium oxides (eg Mg3V2O8 MgV2O6) diluted with PE or wax (~ 100 mg) were employed
Transmission XAS measurements were performed in an in situ cell (Figure 3-3) described previously
[90] Dehydration of VxOySBA-15 was conducted in 20 O2 and He (total flow 40 mlmin) in a
temperature range from 293 K to 623 K or 723 K at a heating rate of 5 Kmin and a holding time of
typically 30-60 min at 623 K Reaction tests were performed in 5 propene and 5 O2 in He in the
temperature range from 293 K to 723 K (5 Kmin total flow 30-40 mlmin) The gas atmosphere was
analyzed using a noncalibrated mass spectrometer in a multiple ion detection mode (Omnistar from
Pfeiffer) Ex situ XAFS measurements were performed in He atmosphere at room temperature
Figure 3-3 Left in situ transmission XAS cell right typical configuration of transmission beamlines
38
X-ray absorption fine structure (XAFS) analysis was performed using the software package WinXAS
v32 [91] Background subtraction and normalization of the extended XAFS scans were carried out by
fitting linear polynomials to the pre-edge and 3rd degree polynomials to the post-edge region of an
absorption spectrum respectively The extended X-ray absorption fine structure (EXAFS) χ(k) was
extracted by using cubic splines to obtain a smooth atomic background micro0(k) The FT(χ(k)k3) often
referred to as pseudo radial distribution function was calculated by Fourier transforming the k3-weighted
experimental χ(k) function multiplied by a Bessel window into R space EXAFS data analysis was
performed using theoretical backscattering phases and amplitudes calculated with the ab-initio multiple-
scattering code FEFF7 [88] EXAFS refinements were performed in R space simultaneously to the
magnitude and the imaginary part of a Fourier transformed k3-weighted experimental χ(k) using the
standard EXAFS formula [92] Structural parameters allowed to vary in the refinement were (i) the
disorder parameter σ2 of selected single-scattering paths assuming a symmetrical pair-distribution
function and (ii) distances of selected single-scattering paths Coordination numbers (CN) E0 shifts and
the amplitude reduction factor S02 were kept invariant in the final fitting procedures To ensure the
statistical significance of parameters during the fitting procedure correlations of specific parameters were
made to reduce the number of free running parameters and to improve the stability of the refinement The
reduction of the parameters was conducted in the following steps First the number of independent
parameters (Nind) was calculated according to the Nyquist theorem Nind = 2π ∆R ∆k + 2 In all cases
the number of free running parameters in the refinements was well below Nind Second confidence limits
were calculated for each individual parameter Third a so-called F test was performed to assess the
significance of the effect of additional fitting parameters on the fit residual The corresponding procedure
was adopted from the well-known library ldquoNumerical Recipes in Crdquo [93]
XANES Analysis was performed in using a shorter range of the XAFS scans Background subtraction and
normalization of the XAFS scans were carried out by fitting linear polynomials to the pre-edge and the
post-edge regions of an absorption spectrum 540-5456 and 552-560 keV respectively Peak height and
energy position (relative to 5465 keV) were determined for the point of maximum intensity of the pre-
edge feature The pre-edge peak area and the centroid energy (relative to 5465 keV) were determined
according to a method described by Chaurand et al [94] In short the section around the absorption edge
(5465 eV) was extracted from the normalized XANES spectra (~ 2 eV before edge ~ 10-150 eV after
edge) The background was fitted by an empirically interpolated function using a cubic spline function
with 12 independently adjustable knots After subtraction of the background the normalized pre-edge
feature was fitted using 2-3 pseudo Voigt functions (GaussLorentz factor was fixed to 07) The centroid
energy was determined from the center of gravity which is obtained from the area weighted energy
positions of the individual pseudo Voigt functions
39
322 UV-Vis Diffuse reflectance spectroscopy measurements
3221 Fundamentals
UV-Vis (200-800 nm) and near-infrared (NIR 800-2500 nm) spectroscopy are used for investigations of
electronic transitions of valence electrons eg in transition metal compounds Electronic excitations of
transition metal compounds may arise from metal centered transitions (MC) where the orbitals involved
are localized at the absorbing metal center In the case of vanadium compounds these are mainly due to
d-d transitions of vanadium centers in the oxidation states of +4 and +3 These transitions are located at
wavelengths higher than 600 nm and are weak for centrosymmetric configurations (octahedral
coordination) because they are forbidden according to the Laporte selection rule (∆ l = plusmn 1) Metal
centered transitions are theoretically well described by Crystal field and Ligand field theory [9596]
Another class of transitions are charge transfer (CT) transitions These are theoretical described by the
molecular orbital (MO) theory The molecular orbitals involved are formed by linear combination of
metal and ligand orbitals The transition takes place between an occupied electronic level located on a
donor atom to an empty level centered on an acceptor atom In the case of highly oxidized transition
metal oxide compounds (d0 configuration) mostly ligand-to-metal charge transfer transitions (LMCT)
appear These are due to a transfer of electron density from the oxygen lone pair orbital to an empty t2 or
e state of the d0 transition metal ion Mostly these transitions are located at a wavelength lower than
600 nm and are very intense (Laporte-allowed) Charge transfer transitions must be described by
molecular orbital theory which makes interpretation more complex than for metal centered transitions An
example for a calculation of the MnO4- ion is provided by Woodward et al [97] Moreover interpretation
of UV-Vis spectra becomes more complex in solid compounds as molecular orbitals tend to overlap and
form electronic band structures
Typically UV-Vis spectra are measured by transmission spectroscopy from liquid phase According to
Lampert-Beerrsquos law quantification can be made by measuring the ratio transmitted light (IT) to incident
light (I0) The resulting absorbance (Aλ) obtained from the transmission spectrum is proportional to the
sample thickness (d) the absorption coefficient (ελ) and the analyte concentration (canalyte)
danalyte
cIT
IA sdotsdot=
minus= λελ
0lg (35)
However in the solid phase light will normally not be transmitted through the sample Hence diffused
reflectance spectroscopy (DRS) is used for powdered samples It is described theoretically by a model
developed by Schuster Kubelka and Munk (denoted as SK or SKM model) In the following a short
introduction will be provided More detailed descriptions are found in the literature [959899]
Due to the fact that the wavelength of incident light has the same dimensions as the illuminated particles
(200-3000 nm) the incident light can be absorbed and scattered from the particles Scattering is mainly
due to specular (regular or mirror like) and diffuse reflectance which is depicted schematically in Figure
40
3-4 Specular reflectance is dependent on the angle of incidence In contrast diffuse reflected light will be
scattered in all directions There are three types of diffuse scattering (i) single scattering (ii) multiple
scattering and (iii) dependent scattering The last one is present when phase coherence exists between
photons scattered from neighboring centers It occurs when the average distance between two scattering
centers is smaller than 2-3 times the particle diameter which is the case for the VxOySiO2 samples
studied here For a theoretical description of dependent scattering the Radiative Transfer theory has to be
employed Schuster Kubelka and Munk simplified the solution of this model with the assumptions
explained below In short the incident light and the scattered light are considered as monochromatic
fluxes in (I) and out (J) of the sample bed These fluxes are connected to apparent absorption (K) and
scattering (S) coefficients These coefficients are related to the diffuse reflected light (remittance or
reflectance) of an infinitely thick sample (Rinfin) that can be determined experimentally
S
K
R
RRF =
infin
infinminus=infin 2
2)1()( with
ref
samplereal
R
RRR
infin
infininfininfin =asymp (36)
Rinfin cannot be determined directly from spectrometric measurements Typically the ratio of the remittance
of a sample related to the remittance of an ideal white standard reference is measured White standards
are MgO BaSO4 Spectralonreg (special Teflon) or the support material of a supported catalyst
The SKM model is only valid if some assumptions are made The incident light has to be diffuse and
monochromatic and the scattered light has to be scattered isotropically Which means that no specular
reflection occurs that is also strongly dependent on the absorption of the sample The sample has to be
infinitely thick which in practice is achieved with 1-5 mm sample thickness Also there must not be any
fluorescence The distribution of the absorbing centers has to be homogenous and the concentration of the
absorbing centers has to be low (F(Rinfin) lt 10) The latter has to be considered if DRS is used
quantitatively However in practice if no quantitative information is needed a better resolution is often
achieved for higher F(Rinfin) values To exclude spectral artifacts like damping of signals or asymmetric
signals a comparison with a diluted sample has to be performed
Figure 3-4 Left Praying MantisTM set up right illustration of specular and diffuse reflection
41
Normally diffuse reflectance spectra are measured in additional cells which are placed into a normal UV-
VIS-Spectrometer All types of measurement cells have in common that they reduce the amount of
specular reflection and mainly collect the diffuse reflected light For in situ measurements typically a
Praying MantisTM configuration (Harrick Scientific Products Inc) is used which allows a horizontal
placement of the sample bed (Figure 3-4) The in situ cell is depicted in Figure 3-5 A disadvantage of
the Praying MantisTM configuration is the low performance and high spectral noise in the UV range (200-
300 nm) because of the high number of optical mirrors Furthermore in the NIR range heat radiation is
detectable
3222 Experimental details of UV-Vis-DRS
UV-Vis-DRS measurements were conducted in a Jasco-V670 UV-Vis-NIR spectrometer using an ex situ
integration sphere or a Praying MantisTM in situ cell (Harrick Scientific Products Inc) as depicted in
Figure 3-5 MgO (ABCR) or pure SBA-15 were used as reflectance standard Samples were measured as
is or diluted with MgO for bulk vanadium oxides or SBA-15 in the case of VxOySBA-15 samples
Pretreatment was conducted in 20 O2 and He (total flow 50 mlmin) in a temperature range from 293 K
to 554-626 K using a heating rate of 4 Kmin Reaction tests were performed in 5 propene and 5 O2 in
He in the temperature range from 293 K to 676 K (4 Kmin total flow 40 mlmin) The gas atmosphere
was analyzed using a non-calibrated mass spectrometer in a multiple ion detection mode (Pfeiffer
Omnistar) and a gas chromatograph (section 331) A linear correction (Tsample = 080 T holder + 1 [degC]) was
applied to the sample holder temperature which was obtained by a separate measurement using a
thermocouple placed in the sample powder bed Figure 3-5
IinIout
Iin
Iout
Gas
inlet
Gas
outlet
Gas
inlet
Gas
outlet
Heating cartridge
sample powder bed
filter fleece
thermo-
couple
furnace control
sample cup block
optional
thermocouple
sample
optional
thermocouple
sample
O-ring viton
SiO2 window
water
cooling
Figure 3-5 Left schematic drawing of the Praying MantisTM in situ UV-Vis-DR cell right picture of the in situ UV-Vis-DR cell The position of the optional thermocouple that was used to determine the sample temperature is marked as dashed line
Data processing and the conversion of the measured spectra to Kubelka Munk units (denoted as KM or
F(Rinfin)) were performed using the spectra manger 20 software package from Jasco UV-Vis edge energies
(Eg) were determined from the spectra according to the procedure described in the literature [100]
Therefore the data was plotted as (F(Rinfin)hν)2 versus energy (eV) A linear function was fitted to the first
intensity increase in the spectrum The intersection of this fit line with the abscissa was used as the Eg
value An example is given in Figure 3-6
42
2 3 4 5 6
0
50
100
150
200
250
linear function
(F(R
infin
hν)2
Energy [eV]
Eg
experimental spectrum
Figure 3-6 Example for the determination of the UV-Vis edge energy Eg of V2O5
323 Powder X-ray diffraction (XRD)
The XRD measurements were made with an XPert PRO MPD diffractometer (θ-θ geometry) using Cu K
alpha radiation and a solid-state multi-channel PIXcelreg detector Wide angle scans (5-90 deg2θ
step=0013 deg2θ time=60 sstep variable slits) were collected in reflection mode The sample was
prepared as a cavity mount using a silicon sample holder The cavity had a diameter of 15 mm and a
depth of ~01 mm and the surface of the holder was cut in such a way that no Si-peaks were detected To
obtain absolute values for the (100) diffraction line of SBA-15 small angle scans (04-60 deg2θ and -04-
40 deg2θ step=0013 deg2θ time=90 sstep fixed slits) were collected in transmission mode with the sample
spread between two layers of Kaptonreg foil For comparison small angle scans (04-60 deg2θ
step=0013 deg2θ time=60 sstep fixed slits) were collected in reflection mode which had a better
resolution of the higher hkl diffraction lines of SBA-15
324 Physisorption measurements
Nitrogen physisorption isotherms were measured at 77 K on a BEL Mini II volumetric sorption analyzer
(BEL Japan Inc) The SBA-15 samples were outgassed under vacuum for about 20 min at 368 K and
16-20 h at 443 K before starting the measurement After outgassing the sample color had turned from
orange to a color between white and grey Data processing was done using the BELMaster V5230
software package The specific surface area was calculated using the standard BrunauerndashEmmettndashTeller
(BET) method in the relative pressure (pp0) range of 005ndash020 with a nitrogen area of 0162 nm2 The
adsorption branch of the isotherm was used to calculate pore size distribution and cumulative pore area
according to the method of Barrett Joyner and Halenda (BJH) [101]
43
325 Elemental analysis
The V content was determined by ICP-OES and X-ray fluorescence analysis (RFA) For ICP-OES
measurements (Jobin Yvon JY 38 Plus) 40-200 mg sample were dissolved in 01 M NaOH using a
100 ml volumetric flask (~ 40 mgL V content) Standard solutions made from V2O5 and SBA-15 were
used for calibration (20- 60 mgL V content) RFA measurements were performed on a PANalytical
AXIOS spectrometer (24 kW model) equipped with a Rh Kα source a gas flow detector and a
scintillation detector Samples were prepared as 13 mm pellets (100 mg sample diluted with 100 mg
wax) Quantification was performed using a standardless analysis which considered the finite thickness of
the sample in the calculation (Super Q 5 software package PANalytical) CHNS Element Analysis was
performed to determine the nitrogen content after APTES funtionalization and the amount of residual
carbon and sulfur content after calcination of SBA-15 and the functionalized SBA-15 samples For
CHNS-measurements a FlashEA 1112 NC Analyzer with CHNS-O configuration (ThermoFinnigan
ThermoElectron) was used The relative error was ~ 2
326 Solid state NMR
The solid state 29Si MAS-NMR-measurements were carried out on a Bruker Avance II spectrometer with
an external magnetic field of 94 T (ie a 1H resonance frequency of 400 MHz) and with a Bruker 4 mm
double resonance-H-X MAS-probe The 29Si resonance frequency was 7946 MHz Between 2000 and
20000 transients were recorded with a relaxation delay of 30 s Proton signals were decoupled during the
acquisition by applying TPPM (Two Pulse Phase Modulation) decoupling The 29Si spectra are referenced
to TMS (tetramethylsilane) using TKS (Tetrakis(trimethylsilyl)silan) as a secondary reference Data
analysis was performed using the software package DMfit by Massiot et al [102] Three Gaussian
functions were refined to the experimental spectrum of the SBA-15 samples The NMR shift was
determined for the bare SBA-15 sample and fixed in the refinement of the VxOySBA-15 samples
Samples treated under reaction atmosphere were prepared in the laboratory reactor and transferred into
the air tight sample containers in a moisture free glovebox
327 Raman spectroscopy
Ex situ Raman spectra were recorded using a FT-RAMAN spectrometer RFS 100 (Bruker) For excitation
a Nd YAG laser was used (1064 nm resolution 1 cm-1) The laser power was 100 mW as measured at
the position of the sample Samples were measured in glass containers For dehydrated VxOySBA-15
samples the sample containers were heated in a sand bath for 12 h at 673 K in a muffle furnace Directly
after the sample containers were taken out of the hot oven (673K) they were closed by melting to avoid
rehydration of the samples
44
In situ Raman spectra were measured at the TU Darmstadt An argon ion laser (Melles Griot) at 514 nm
and a helium neon laser at 632 nm were used for excitation For detection a transmissive spectrometer
equipped with a Pelletier CCD detector (Kaiser Optical HL5R) operated at 233 K was used The spectral
resolution was about 5 cm-1 The laser power was 3 mW for hydrated VxOySBA-15 samples and 3 and
6 mW for dehydrated VxOySBA-15 samples as measured at the position of the sample The powder
samples were introduced into a sample holder developed by Hess and Thielemann [103] The
accumulation time for the spectra was typically 33 min Heating was therefore performed stepwise
Pretreatment and dehydration experiments were conducted in synthetic air (total flow 25-60 mlmin) in a
temperature range from 293 K to 623-823 K Reaction tests were performed in 5 propene and 5 O2 in
N2 in the temperature range from 293 K to 823 K (total flow 70 mlmin) Gas atmosphere was analyzed
using a non-calibrated mass spectrometer in a multiple ion detection mode For in situ experiments
VxOySBA-15 was pressed at 70 MPa and sieved to obtain a particle size between 250 and 355 microm
328 Thermal analysis
Thermogravimetric (TG) and Differential thermal analysis (DTA) measurements were conducted using a
SSC 5200 from Seiko Instruments The gas flow through the sample compartment was kept very low to
avoid mass transport of the light SBA-15 particles out of the sample container It was adjusted to
50 mlmin (20 O2 80 N2) The gas atmosphere was analyzed using a noncalibrated mass
spectrometer in a multiple ion detection mode (Omnistar from Pfeiffer) Heating was conducted with a
rate of 5 Kmin in the range from 303 K to 623 K or 723 K in an aluminum cup For measurements up to
1173 K a corundum cup was used To extract the apparent activation energy of the dehydration step of the
Kieselgel 60 SBA-15 and VxOySBA-15 sample heating rates (β) of 2 4 6 8 and 10 Kmin were used
Before and after heating the furnace temperature was held for 60 min at 303 K and 623 K respectively
The apparent activation energy was determined by a method described by Vansant et al [104] for silica
samples The maximum of the DTA curve (temperature Tmax) was determined and used to calculate the
apparent activation energy for water desorption (ED) using an Arrhenius type linear plot (Equation 37)
CRT
ET D +=minus
maxmax lnln2 β (37)
329 Electron microscopy
Selected samples were measured in a high resolution Hitachi S-4000 scanning electron microscope
(SEM) to estimate particle size and distribution The samples were prepared using a standard sample
holder with carbon stickers The same samples were investigated by transmission electron microscopy
(TEM) on a FEI Tecnai Gsup2 20 S-TWIN instrument The instrument worked with a LaB6 cathode and a
acceleration voltage of 200 kV An EDX (EDAX) r-TEM SUTW detector (Si(Li)) was used for EDX
measurements Measurements on both instruments were performed by ZELMI (Zentraleinrichtung
Elektronenmikroskopie) at the TU Berlin
45
33 Catalytic characterization
331 Quantitative measurements ndash gas chromatography
Quantitative measurements were performed using a laboratory fixed bed reactor or the in situ
spectroscopic cells connected to a non calibrated mass spectrometer (Omnistar from Pfeiffer) and an
online GC system The double GC-system consisted of two connected Varian CP-3800 gas
chromatographs (Figure 3-7) A flow chart is depicted in Figure 3-7 and Figure 3-8 Hydrocarbons and
partial oxidation products were analyzed with the first Varian CP-3800 using a Carbowax 52CB capillary
column (25 m x 032 mm) connected via a Deans switch either to an Al2O3MAPD capillary column
(25 m x 032 mm) or to a fused silica restriction (25 m x 032 mm) each connected to a flame ionization
detector (FID) Permanent gases (O2 N2 CO2 CO) were separated using a Varian CP-3800 ldquoPermanent
Gas Analyzerrdquo with a Hayesep Q (2 m x 18rdquo) and a Hayesep T packed column (05 m x 18rdquo) as
precolumns combined with a back flush by using a 10-fold valve For separation a Hayesep Q packed
column (05 m x 18rdquo) was connected via a molesieve (15 m x 18rdquo) to a thermal conductivity detector
(TCD) Sample delivery tubes after the reaction cell outlet valves and sample loops where constantly
heated to 473 K Mixtures of 1-5 propene and 2-10 oxygen in helium were used for catalytic tests in
the range of 295-770 K Reactant gas flow rates of oxygen (20 O2 (48) in He (50) relative error plusmn 1
Linde Gas Air Liquide) propylene (10 propene (35) in He (50) relative error plusmn 1 Linde Gas) and
helium (60 Air Liquide) were adjusted through separate mass flow controllers to a total flow of 20-
75 mlmin (1013 hPa 273 K) Independent of the reaction gas flow rate the flow rate through the sample
loops was adjusted to 20 mlmin To ensure reproducibility of the measurements the sample gas flow was
stopped for several seconds before injection The injection of sample gas was performed simultaneously
in both gas chromatographs A scan time of approximately 22 min was achieved
Figure 3-7 Drawing of the used double GC setting
46
Pure reaction gases (10 propene or 20 O2 in He Linde) were used for calibration Gas mixtures were
employed for the calibration of CO CO2 (1 Vol in He relative error plusmn 2 Linde Gas) and acrolein
(01 Vol in He relative error plusmn 5 Linde Gas) All other compounds were calibrated using liquid
mixtures which were injected into the split injector using a 1microl syringe Each mixture contained known
concentrations of a solvent (eg pentane or MeOH) and a group of oxygenated products such as acids
(acrylic acid propionic acid acetic acid) aldehydes (acetaldehyde propione aldehyde acetone acrolein)
and alcohols (isopropyl alcohol n-propanol allylalcohol) together with acrolein in each mixture The
measured retention factor of gas phase acrolein and the ratio of the retention factor of the acrolein
standard and the respective analyte in the liquid phase were used to calculate the retention factor of the
analyte in the gas phase Measurement and analysis of the chromatograms was conducted using the
Galaxie Software package from Varian
MFC
COCO2 propene oxygen helium
MFC MFC MFC MFC
saturator
H2O
acrolein
vent
online
mass
spectrometer
N2 purge
reaction
cell
gas
chromatograph
oxygenates
analyzer
(FID)
gas
chromatograph
permanent gas
analyzer
(TCD)
gas mixing station
divider unit (reactorvent)
divider unit
(purgereaction gas)
MFC
tedlar bag
calibration
gas
connector
3-way valve
2-way valve
4-port 2-way valve
neelde valve
Figure 3-8 Simplified flow chart of the measurement set up used in the laboratory
47
332 Laboratory fixed bed reactor
The laboratory fixed bed reactor was made from a SiO2 tube (30 cm length 9 mm inner diameter) which
was placed vertically in a tube furnace The sample was placed on a frit (P3 porosity) in the center of the
isothermal zone of the furnace (Figure 3-9) In addition to the furnace temperature the reactor
temperature was recorded using a thermocouple placed next to the reactor tube Sample mass was 11 mg
for 77 wt 22 mg for 41 wt and 61 mg for 14 wt VxOySBA-15 Boron nitride (Alfa Aesar 200-
300 mg) was used for dilution To ensure differential reaction conditions the reactor was operated at low
propene conversion levels
Figure 3-9 Picture of the furnace and reactor used for quantitative measurements
333 Calculation of conversion selectivity carbon balance and reaction rate
Conversion of propene and selectivity of products were calculated on the basis of mole flows calculated
from the measured volume fractions The calculation of conversion (X) of a key compound (k propene)
and selectivity (S) towards the desired product (p) can be made using the following equations (38 39)
derived from standard text books [105]
Conversion inkn
outkninkn
kX)(
)()(
amp
ampamp minus= (38)
Selectivity )(
)(
)()(
)()(
k
k
knkn
pnpnS
in
in
P νν
sdotminus
minus=
ampamp
ampamp
(39)
48
Instead of the mole fraction flow (namp ) of a compound (i) the measured volume fractions (Vol) of the
reactants were used for calculation Both quantities are proportional if the total pressure (open system)
total volume volume flow (Vamp ) and temperature (473 K GC sample loop) are assumed to be constant
during the measurements ( )()()( iVoliVin propprop ampamp ) The equations used for conversion (310) and carbon
balance (311) are listed below Carbon balances were higher than 095
Conversion inkVol
outkVolinkVol
kX)(
)()( minus= (310)
Carbon balance
in
outoutout
x
out
in
out
HCVol
HCVolCOVolCOVolpxVol
CVol
CVol
)(3
)(3)()())((a
)(
)(
63
632
1
px
sdot
sdot+++sdot=sum
(311)
For calculating the selectivity a detailed knowledge of the reaction network is required for the
determination of the stoichiometric factors However partial oxidation of propene may proceed over a
complex reaction network including consecutive reactions and many side products Therefore some
simplifications were made for calculating the selectivity Instead of stoichiometric factors the fraction of
carbon atoms in a molecule (apn) relative to propene (ak=3) was used Equation 312 was used to ensure
the reliability of the selectivities obtained
( )outin
inout
k
pn
pnkVolkVol
pnVolpnVola
a
S)()(
)()(
minus
minussdot= (312)
sum
sdot
sdot=
1
)(
)(
x k
px
k
pn
pn
pxVola
a
pnVola
a
S (313)
Measurements were only used if reasonable values were calculated for Spn (~ 08-10) Deviations can be
explained by the fact that the analytical GC system used did not permit measuring compounds like
formaldehyde or formic acid which may be formed during the reaction To ensure comparability of the
selectivity obtained all selectivities were calculated using Formula 313 The selectivity therein does not
refer to the propene conversion but to the sum of all measured reaction products
49
Reaction rates for a compound (i) were determined using Formula 314 The catalyst mass refers to the
total mass of the sample used or to the respective mass (mcat) of the transition metal in the sample
(eg V)
60
sdotsdotsdotsdot
=mcat
ii Vm
VVolXr
amp
sg
molri sdot
=][ (314)
334 Estimation of mass and heat transport limitations
To ensure that the quantitative gas phase data were determined in a regime of kinetic control mass
transport and heat transport effects were estimated for propene oxidation reactions
C3H6 (g) + 45 O2 (g) rarr 3 CO2 (g) + 3 H2O (g) ∆HR0 = -1926 kJmol
C3H6 (g) + 3 O2 (g) rarr 3 CO (g) + 3 H2O (g) ∆HR0 = -1077 kJmol
C3H6 (g) + O2 (g) rarr C3H4O (g) + H2O (g) ∆HR0 = -329 kJmol
The selective oxidation of propene towards acrolein was chosen as model reaction for the VxOySBA-15
catalysts Many side reactions eg total oxidation to CO and CO2 are possible for this reaction In the
case of total oxidation the reaction enthalpy (∆HR0) is much higher than for the oxidation to acrolein
Thus an increased heat formation will be observed in the case of propene combustion to CO2 A
calculation of the heat that will occur at 10 propene conversion (assumption that only CO2 is formed) is
shown below The reaction enthalpies were calculated using the parameters in Table 3-1 The parameters
for the mole stream calculation are listed in Table 3-2
mole stream calculation XV
VVolVrn
m
sdotsdot=minus=amp
amp
(315)
heat stream calculation min170 JHnQ R =∆sdot= ampamp (316)
With the calculated heat stream of 17 Jmin the increase of temperature (T) of a 1g material with a heat
capacity (CP) of 1 J(gk) can be calculated
TmCQ P ∆sdotsdot= ampamp (317)
min17KmC
QT
P
=sdot
=∆amp
amp (318)
That the heat formed can be dissipated by the sample gas stream was inferred from the following
calculation A sample gas stream of 40 mlmin was assumed with an estimated density of 05 gcm3
Therefore a mass stream of 20 gmin gas is present The heat capacity (Cp) of the gas was estimated to be
1 JgK Considering these values the sample gas stream can dissipate 20 Jmin which is higher than the
heat of combustion formed Thus heat transport should not disturb the measurements
50
Table 3-1 Standard enthalpy of formation ∆Hf0 for selected compounds in the gas phase
Compound ∆Hf0 Ref
H2O (g) -24183 kJmol [106]
O2 (g) 0 kJmol [106]
CO2 (g) -3935 kJmol [106]
CO (g) -1105 kJmol [106]
C3H6 (g) -204 kJmol [106]
C3H4O (g) -670 kJmol [107]
To ensure that no mass transport limitations due to the mesoporous SBA-15 were present an estimation
based on the Weisz-Prater criterion was conducted The parameters used are listed in Table 3-2
12
1
2 ltltsdot
sdot+=minuspropenepropeneeff
cateffPW cD
rnLC
ρ (319)
Given that the pore diameter dp of 8 nm is much shorter than the particle length of ~ 50 microm Knudsen
diffusion was assumed
3
~p
Kneff
dDD
ν=cong (320)
using the average velocity of propene molecules in the gas phasepropene
B
m
Tk
sdotsdotsdot=
πν 8~ (321)
A resulting Weisz modulus (CW-P) of 011 indicates that the reaction proceeds much slower than the
propene diffusion into the pores of SBA-15 Thus mass transport effects can be neglected
Table 3-2 Parameters used to estimate the mass and heat transfer
Parameter Value Description
L 50 microm particle length
n 1 reaction order
reff (5 Vol 40 mlmin X=10) 136 mol(gs) effective reaction rate
T 673 K reaction temperature
mpropne 710-23g mass of propene molecule
R 8314 J(molK) gas constant
kB 13810-13 JK Boltzmann constant
dp 8 nm pore diameter
Mpropene 42 gmol molarmass of propene
DKn (673 K) 510-8 m2s Knudsen diffusion of propene in SBA-15
cpropene (673 K 5 Vol) 136 10-6 molcm3 propene concentrations
ρcat 2 gcm3 assumed density of SBA-15
mV 22414 moll molar volume of an ideal gas
namp (5 Vol 40 mlmin X=10) 910-6 molmin mole stream of propene
ν~ (673 K) 184 ms average velocity of propene molecules
51
4 Comparison of various preparation methods for the
synthesis of supported vanadium oxide catalysts
41 Introduction
Various methods for the preparation of supported transition metal oxide catalysts are reported in
literature They range from rather simple methods like wet impregnation [840] and incipient wetness
procedures [37108] to multi step reactions where the transition metal precursor is chemically bound to
the support (silica) [32] before the calcination step For all preparation methods the formation of disperse
vanadium oxide structures for calcined VxOySiO2 samples (hydrated and dehydrated state) exhibiting a
vanadium density lower than 25 Vnm2 was reported [2332] Three typical preparation methods were
tested to verify that independent of the preparation method applied the same well dispersed vanadium
oxide structures will be present on the SBA-15 support First samples were prepared by wet
impregnation which means stirring SBA-15 in an aqueous NH4VO3 solution Second samples were
prepared by incipient wetness using an aqueous (NH4)6V10O28middotxH2O solution Third samples were
prepared by a graftingion exchange method introduced by Hess et al [32] (Figure 4-1) For all samples
vanadium coverages below 25 Vnm2 were intended The structure of the prepared samples were
characterized in the calcined (hydrated and dehydrated) and uncalcined state using XRD XAFS Raman
spectroscopy and UV-Vis-DRS Additionally physisorption electron microscopy and small angle XRD
measurements were conducted to detect changes in the mesoporous SBA-15 support
Si OH
Si OH
Si OH
Si OH
Si OH
Si OH
1 (EtO)3Si(CH2)3NH2
2 HCl
Si(CH2)3NH3+Cl
-Si O
Si O
OEt
O
Si(CH2)3NH3+Cl
-Si O
Si O
Si(CH2)3NH3+Cl
-Si O
Si O
1 V10O286-
Si(CH2)3NH3+Si O
Si O
OEt
O
Si(CH2)3NH3+Si O
Si O
Si(CH2)3NH3+Si O
Si O
+ V10O286- VxOySBA-15
823 K 12 h
Figure 4-1 Simplified reaction scheme of the APTES grafting and ion exchange ((NH4)6V10O28middotxH2O precursor) preparation process of VxOySBA-15 samples
42 Results and discussion
421 Surface area and vanadium content of the VxOySBA-15 samples
The results of the vanadium element analysis and the BET surface area determination are listed in Table
4-1 More detailed tables of the physisorption results small angle XRD and CHN element analysis are
provided in the appendix (Table 10-1 Table 10-2) The vanadium dispersion in Table 4-1 was referred to
the BET surface area determined for the calcined VxOySBA-15 samples A similar V dispersion was
52
determined on different samples Therefore the sample names refer to the vanadium content (ICP) of the
samples (eg 77 wt VxOySBA-15)
Table 4-1 BET surface area (SBET) and vanadium content of the calcined VxOySBA-15 samples () sample prepared via the ion exchange method in Figure 4-1 () sample prepared by wet impregnation with a NH4VO3 solution () sample prepared by incipient wetness using a (NH4)6V10O28 solution The values in brackets refer to the V content determined by RFA)
Sample SBET [m2g-1] wt ICP (RFA) mmol V g Vdensity nm2
30 wt VxOySBA-15 522 30 (31) 059 07
57 wt VxOySBA-15 403 57 (57) 112 17
50 wt VxOySBA-15 270 -- (50) (098) (22)
77 wt VxOySBA-15 386 77 (73) 151 (143) 24 (22)
41 wt VxOySBA-15 427 41 (41) 081 11
14 wt VxOySBA-15 542 14 (14) 028 03
422 Structural characterization of the uncalcined VxOySBA-15 samples
In Figure 4-2 the Raman and UV-Vis-DR spectra of the uncalcined vanadium containing SBA-15
samples are depicted The Raman spectrum of the SBA-15 support exhibited a broad band at 490 cm-1
(cyclic tetrasiloxane rings D1 defect mode) and less intense bands at ~ 600 800 and 977 cm-1 (cyclic
trisiloxane rings D2 defect mode) [2332] In the spectrum of the uncalcined 57 wt VxOySBA-15
sample (wet impregnation) additional bands at 930 899 648 496 261 and 212 cm-1 were detected
(Figure 4-2 left D) These were assigned to crystalline NH4VO3 which may be a residual from the
preparation process A broad background in the region 870-1000 cm-1 indicates the presence of a second
vanadium oxide species V-O stretching vibrations of vanadium V5+ compounds are typically located in
this spectral range [109] In the Raman spectrum of the 30 wt VxOySBA-15 sample (incipient wetness)
in Figure 4-2 (left B) two ranges of additional Raman bands were detected (~ 970 cm-1 622-850 cm-1)
Thus a mixture of different vanadium oxide phases may be present on the SBA-15 support The Raman
spectra of the samples prepared by the ion exchange method are shown in Figure 4-2 (middle) together
with the spectra of the SBA-15 support and APTES modified SBA-15 Characteristic Raman bands for
APTES modified SBA-15 (Figure 4-2 middle F) were detected (~ 950 and ~ 1050 cm-1 assigned to C-C
stretching vibrations of the propylammonium group in the grafted APTES group [32]) Hess et al [32]
reported that the decavanadate ion is preserved during the grafting process Indeed characteristic Raman
bands of the decavanadate precursor were detected at 992 658 321 253 221 and 184 cm-1 (Figure 4-2
middle G) for the high loaded uncalcined 50 wt VxOySBA-15 sample (22 Vnm2 similar to sample
77 wt VxOySBA-15) Compared to the spectrum of the bulk V10O286- reference the Raman band at
958 cm-1 was broadened and increased relative to the band at 992 cm-1 With decreasing vanadium
loading the low frequency bands lt 700 cm-1 were not observed in the Raman spectra and the Raman band
at 992 cm-1 decreased significantly For all samples a band around 1040-1050 cm-1 was observed in the
spectra which was assigned to the grafted APTES Due to the broad Raman signal at 960 cm-1 in the
Raman spectra of all uncalcined VxOySBA-15 samples (ion exchange method) more than one vanadium
oxide species may be present
53
250 500 750 1000
Raman shift [cm-1]
Nor
mal
ized
Ram
an In
tens
ity
A
B
C
D
E
250 500 750 1000
Raman shift [cm-1]
Nor
mal
ized
Ram
an In
tens
ity
C
G
H
I
F
A 05
10
15
20
25
30
250 350 450 550
Wavelength [nm]
F(R
infin)
)
F
Crsquo
Ersquo
G
H
D
I
B
Figure 4-2 Raman spectra (left middle) and UV-Vis-DRS spectra (right) of the uncalcined VxOySBA-15 samples and selected vanadate references (A) SBA-15 (B) 30 wt VxOySBA-15 incipient wetness (C) 8 wt V (NH4)6V10O28middotxH2O mixed with SBA-15 (Crsquo) (NH4)6V10O28middotH2O (D) 57 wt VxOySBA-15 wet impregnation (E) 8 wt V NH4VO3 mixed with SBA-15 (Ersquo) NH4VO3 (F) APTES functionalized SBA-15 (G) 50 wt VxOySBA-15 ion exchange (H) 41 wt VxOySBA-15 ion exchange (I) 14 wt VxOySBA-15 ion exchange
The UV-Vis-DR spectra of the uncalcined samples together with the spectra of the bulk references
NH4VO3 and (NH4)6V10O28middotxH2O are depicted in Figure 4-2 (right) For all samples no similarity with
the spectra of the bulk vanadate references was observed Independent of the preparation method similar
absorption bands were recorded in the spectra of all uncalcined VxOySBA-15 samples These absorption
bands were located at 405 nm 335 nm and 264-274 nm The low energy absorption band matches the
maximum in the absorption spectrum of (NH4)6V10O28middotxH2O For the 14 wt VxOySBA-15 sample
prepared via the ion exchange method the band at 405 nm was hardly detectable The UV-Vis edge
energy was determined for the uncalcined VxOySBA-15 samples according to a method described by
Gao and Wachs [100] The UV-Vis edge energy can provide information about the coordination and the
degree of polymerization of the absorbing vanadium species A more detailed introduction and discussion
will be provided in Chapter 5 UV-Vis edge energies in the range of 27-29 eV were determined for the
high loaded sample (50 wt VxOySBA-15) prepared via the ion exchange method and for the samples
prepared via the incipient wetness method For the low loaded 41 and 14 wt VxOySBA-15 samples
prepared via the ion exchange method UV-Vis edge energies in the range of 33-34 eV were determined
In the UV-Vis-DR spectrum of uncalcined 57 wt VxOySBA-15 prepared by wet impregnation (Figure
4-2 right D) two regions of the absorption spectrum could be used to determine the UV-Vis edge
energy UV-Vis edge energies at 28 and 32 eV may be derived from the UV-Vis-DR spectrum
Considering the presence of NH4VO3 in the Raman spectra of this sample the second band may indicate a
NH4VO3 species (UV-Vis edge energy 32 eV) on the support Values in the range of 27-29 eV were an
indicator for a higher polymerized species present on the support exhibiting at least a 5-fold or higher
coordination Values between 32-34 eV were assigned to less polymerized vanadium oxide centers
(small chains or dimers) which exhibit a tetrahedral rather than a square pyramidal coordination of the
absorbing vanadium species
54
2
4
6
55 555 56Photon Energy [keV]
Nor
mal
ized
Abs
orpt
ion
B
C
D
E
F
A
G
20
40
0
4 6 8 10
k [Aring-1]
χ(k)
k3
B
C
D
E
F
A
G
01
02
03
04
0 2 4 6R [Aring]
FT
(χ(k
)k3 )
B
C
D
E
F
A
G
Figure 4-3 V K edge XANES spectra (left) χ(k)k3 (middle) and FT(χ(k)k3) (right) of the uncalcined VxOySBA-15 samples and selected vanadate references (A) (NH4)6V10O28middotxH2O (B) NH4VO3 (C) 57 wt VxOySBA-15 wet impregnation (D) 30 wt VxOySBA-15 incipient wetness (E) 50 wt VxOySBA-15 ion exchange (F) 41 wt VxOySBA-15 ion exchange (G) 14 wt VxOySBA-15 ion exchange
XAFS measurements were conducted to obtain information about the structure of the main vanadium
oxide phase of the uncalcined VxOySBA-15 sample The V K edge XANES spectra the derived χ(k)k3
and the Fourier transformed χ(k)k3 are depicted in Figure 4-3 The XANES spectra of the uncalcined
57 wt (wet impregnation) 30 wt (incipient wetness) and 77 wt (ion exchange) VxOySBA-15
samples were comparable to that of the (NH4)6V10O28middotxH2O reference sample (Figure 4-3 left) In
contrast to the decavanadate reference sample the pre-edge peak was enhanced in the XANES spectra of
the uncalcined VxOySBA-15 samples The χ(k)k3 of the uncalcined 57 wt (wet impregnation)
30 wt (incipient wetness) and 77 wt (ion exchange) VxOySBA-15 samples showed oscillations
similar to the χ(k)k3 of the (NH4)6V10O28middotxH2O reference The amplitude of these oscillations was
decreased (Figure 4-3 middle) After the Fourier transformation of the χ(k)k 3 of the uncalcined 57 wt
(wet impregnation) 30 wt (incipient wetness) and 77 wt (ion exchange) VxOySBA-15 samples
mainly two signals in the range of 1-2 Aring and 3-4 Aring were detected in the envelope of the FT(χ(k)k3)
(Figure 4-3 right not phase shift corrected) The first signal was assigned to V-O scattering
contributions and the second signal was assigned to V-V scattering paths Comparing the FT(χ(k)k3) of
the high loaded uncalcined VxOySBA-15 samples with that of the (NH4)6V10O28middotxH2O reference no direct
similarity was observed The increased V-O signal (1-2 Aring) in the FT(χ(k)k3) of these samples resembled
that of lower coordinated vanadate species like NH4VO3 Therefore a mixture of decavanadate vanadium
centers and lower coordinated vanadium centers may be present on the SBA-15 support With decreasing
vanadium loading the signal at higher distances (3-4 Aring) decreased in the FT(χ(k)k3) of the uncalcined
VxOySBA-15 samples prepared by the ion exchange method The first signal (1-2 Aring) in the FT(χ(k)k3)
of the uncalcined 14 wt and 41 wt VxOySBA-15 samples (ion exchange) was slightly enhanced
compared to the 57 wt and 77 wt VxOySBA-15 samples Nevertheless it was still smaller than in
the FT(χ(k)k3) of most tetrahedral vanadate reference compounds (Chapter 525) like NH4VO3 Thus
vanadium centers exhibiting a strong structural disorder may be present The rather high pre-edge peak in
55
the XANES spectra of the uncalcined 14 wt and 41 wt VxOySBA-15 (ion exchange) suggested that
these vanadium centers may have a tetrahedral coordination (Chapter 524)
423 Vanadium dispersion in the calcined VxOySBA-15 samples
XRD measurements were conducted to exclude the presence of crystalline vanadium oxide phases on the
support after calcination of the VxOySBA-15 samples The resulting powder patterns are depicted in
Figure 4-4 A physical mixture of ball milled V2O5 and SBA-15 was prepared (8 wt V) for reference
The domain size of the V2O5 crystallites was estimated from the integral breadth using the Debye-
Scherrer equation It was approximately 170 Aring ((200) diffraction line 1538 deg2θ) The powder pattern in
Figure 4-4 shows that a mixture of these V2O5 crystallites and SBA-15 still exhibited well resolved and
characteristic diffraction lines of V2O5 Only the 57 wt VxOySBA-15 sample (wet impregnation)
showed characteristic diffraction lines of V2O5 The V2O5 in the sample prepared via wet impregnation
was probably formed by decomposition of NH4VO3 residuals that were detected in the Raman spectra of
the uncalcined 57 wt VxOySBA-15 sample (wet impregnation) (Figure 4-2 left)
20 40 60 80
2 θ [deg]
SBA-15
77 wt VxOySBA-15ion exchange
(8 wt V) ball milled V2O5
mixed with SBA-15
Rel
ativ
e In
tens
ity
20 40 60 80
2 θ [deg]
(8 wt V) ball milled V2O5
mixed with SBA-15
57 wt VxOySBA-15wet impregnation
14 wt VxOySBA-15ion exchange
41 wt VxOySBA-15ion exchange
30 wt VxOySBA-15incipient wetness
Rel
ativ
e In
tens
ity
Figure 4-4 XRD powder patterns (Cu Kα) of the calcined VxOySBA-15 samples bare SBA-15 and a physical mixture of ball milled V2O5 and SBA-15 (8 wt V)
XRD is not sensitive to minority phases of less than 5 phase fraction Therefore Raman spectra of the
calcined VxOySBA-15 samples were recorded In Figure 4-5 (left and middle) the Raman spectra of the
hydrated (as prepared) and the dehydrated (air 673 K 12 h) state of the calcined VxOySBA-15 samples
are depicted together with the Raman spectrum of a physical mixture of V2O5 and SBA-15 (3 wt V)
The spectra of all calcined VxOySBA-15 samples showed characteristic bands for the hydrated state
(1028 706 270 160 cm-1) and dehydrated state (~ 1040 cm-1) of dispersed vanadium oxide centers on
silica supported samples as reported in the literature [2332] Therefore after calcination a disperse
vanadium oxide species may have formed as the majority phase on the SBA-15 support in all samples
Characteristic Raman bands of V2O5 were only detected for the 57 wt VxOySBA-15 sample prepared
via wet impregnation
56
10
20
30
40
50
250 500 750 1000
Nor
ma
lized
Ram
an In
tens
ity
Raman shift [cm-1]
250 500 750 1000
77 wt VxOy-SBA-15 ion exchange
57 wt VxOy-SBA-15 wet impregnation
3 wt VxOy-SBA-15 incipient wetness
SBA-15
physical mixture (3 wt V) V2O5 in SBA-15
77 wt VxOy-SBA-15 ion exchange
57 wt VxOy-SBA-15 wet impregnation
3 wt VxOy-SBA-15 incipient wetness
SBA-15
physical mixture (3 wt V) V2O5 in SBA-15
Raman shift [cm-1]
hydrated state dehydrated state
Nor
ma
lized
Ram
an I
nten
sity
0
4
1
2
3
250 600300 R [Aring] 500
F(R
infin)
Wavelength [nm]
V2O5E
C
D
A
B
dehydrated state
Figure 4-5 Raman (left middle) and UV-Vis-DRS spectra (right) of the calcined VxOySBA-15 samples and selected vanadium oxide references (A) 30 wt VxOySBA-15 incipient wetness (B) 57 wt VxOySBA-15 wet impregnation (C) 77 wt VxOySBA-15 ion exchange (D) 41 wt VxOySBA-15 ion exchange (E) 14 wt VxOySBA-15 ion exchange (samples diluted 11 or 12 with SBA-15 for UV-Vis-DRS measurments)
The characteristic Raman bands of V2O5 were present in the hydrated and dehydrated state of the calcined
57 wt VxOySBA-15 (wet impregnation) Crystalline vanadium oxide phases (determined by Raman
spectroscopy) originating from the preparation method were excluded for samples prepared by the
incipient wetness and ion exchange procedures in the range of V loading employed
UV-Vis-DRS and XAFS play a pronounced role for the structural characterization of the VxOySBA-15
model catalysts as will be discussed in more detail in the following chapters In order to show that for all
preparation methods used similar spectra and thus similar dispersed vanadium oxide species were
obtained all samples were dehydrated and investigated in situ using UV-Vis-DRS and XAFS Figure 4-5
(right) shows the UV-Vis-DR spectra of all calcined VxOySBA-15 samples after dehydration at 554 K
(20 O2 in He) The spectra of all VxOySBA-15 samples exhibited absorption bands with a maximum in
the range of 280 nm (dehydrated 14 wt and 30 wt VxOySBA-15) and 310 nm (dehydrated 41 wt
57 wt and 77 wt VxOySBA-15) These absorption bands were assigned to a highly dispersed
tetrahedral vanadium oxide species (Chapter 521) Furthermore in the spectra of the calcined and
dehydrated VxOySBA-15 samples (except for the 14 wt VxOySBA-15 sample) a small absorption
band at approximately 405 nm was observed This absorption band was significantly pronounced in the
spectrum of the 57 wt VxOySBA-15 sample (wet impregnation) Considering the presence of V2O5 in
the Raman spectrum and XRD pattern of this sample the absorption band at 405 nm was assigned to a
V2O5 phase The absence of characteristic V2O5 Raman bands in the Raman spectra of all other samples
indicate that the slight increase at 405 nm in the UV-Vis-DR spectra was caused by very small amounts
of crystalline V2O5
57
XAFS measurements of dehydrated VxOySBA-15 samples corroborated that the majority vanadium
oxide phase on SBA-15 was a dispersed tetrahedral phase (dehydrated samples Figure 4-6 623 K 20
O2 in He) For all dehydrated VxOySBA-15 samples similar V K edge XANES χ(k)k3 and Fourier
transformed χ(k)k3 were obtained The V2O5 phase present in the 57 wt VxOySBA-15 sample (wet
impregnation) was not visible in the XAFS spectra Therefore the fraction of crystalline V2O5 in 57 wt
VxOySBA-15 was less than 5-10 of the vanadium oxide species present on the (SBA-15) support in this
sample The FT(χ(k)k3) of the dehydrated 57 wt VxOySBA-15 sample prepared by wet impregnation
resembled that of the dehydrated 41 wt and 77 wt VxOySBA-15 samples (Figure 4-6 right) All
three samples showed an increased amplitude at higher distances (3-4 Aring) in the FT(χ(k)k3) The low
loaded 14 wt (ion exchange) and 30 wt (incipient wetness) dehydrated VxOySBA-15 samples
exhibited a comparable envelope of the FT(χ(k)k3) At higher distances (3-4 Aring) the amplitude was
reduced In the UV-Vis-DR spectra (Figure 4-5 right) of these samples the absorption maximum was
shifted from ~ 300 nm to ~ 280 nm compared to the spectra obtained for the higher loaded dehydrated
VxOySBA-15 samples Hence minor differences in the structure of the supported dehydrated vanadium
oxide species may be present in the spectra of the low (14 and 30 wt V) and higher loaded (41-
77 wt V) dehydrated VxOySBA-15 samples A more detailed discussion of these results is given in
Chapter 5
55 555 56
A
B
C
D
Photon Energy [keV]
Nor
mal
ized
Abs
orpt
ion
5
10
15
20
25
0
4 6 8 10
A
B
C
D
E
k [Aring-1]
χ(k)
k3
005
01
015
02
0 2 4 6
A
B
C
D
E
R [Aring]
FT
(χ(k
)k3 )
Figure 4-6 V K edge XANES spectra (left) χ(k)k3 (middle) and FT(χ(k)k3) (right) of the calcined and dehydrated VxOySBA-15 samples (20 O2 in He 623 K) (A) 57 wt VxOySBA-15 wet impregnation (B) 30 wt VxOySBA-15 incipient wetness (C) 77 wt VxOySBA-15 ion exchange (D) 41 wt VxOySBA-15 ion exchange (E) 14 wt VxOySBA-15 ion exchange
424 Characterization of the SBA-15 support of the VxOySBA-15 samples prepared by the ion
exchange method
The graftingion exchange method allowed the preparation of VxOySBA-15 samples exhibiting a disperse
vanadium oxide species even at high vanadium loadings In contrast to the wet impregnation method no
crystalline V2O5 species were present after preparation of a high loaded sample with a vanadium
dispersion of 24 Vnm2 Therefore samples prepared by this method were used for further investigations
58
In order to ensure that the mesoporous SBA-15 support was not affected by the preparation process
physisorption small angle XRD and electron microscopy measurements were conducted before and after
vanadium anchoring
In Figure 4-7 the N2 adsorption and desorption isotherms of SBA-15 and the calcined VxOySBA-15
samples (ion exchange) are depicted A detailed table of the physisorption and small angle XRD results
for all samples is given in the appendix (Table 10-1) The SBA-15 samples exhibited a type IV
physisorption isotherm according to the IUPAC classification [110] This is characteristic for mesoporous
samples (pore diameter (dp) 2-50 nm) The significant decrease at lower pp0 values indicated that
micropores (dp lt 2 nm) were present in all SBA-15 samples (Figure 4-7 left) The BET surface areas
determined for the bare SBA-15 samples ranged from 607 and 818 m2g For all samples a significant
decrease of the BET surface area (30-50) was observed for the calcined VxOySBA-15 samples
compared to the initial SBA-15 samples The characteristic diffractions of the hexagonal SBA-15
structure were detected in the small angle XRD patterns ((100) (110) (200) diffraction) of all samples
(Figure 4-7 left inset) Hence the mesoporous SBA-15 structure remained unaffected by the
preparation The cell parameter determined from the (100) diffraction was slightly decreased (01-04 nm
1-4 ) in the calcined VxOySBA-15 samples compared to the initial SBA-15 material This was
interpreted as a shrinking of the SBA-15 pore structure of the supported samples compared to the initial
SBA-15 samples Herbert [111] showed that a shrinking of ~ 30 of the mesoporous SBA-15 structure
was not an unusual observation This was observed by Herbert for thermal (calcination 923 K 24 h) and
hydrothermal (water 373 K 24 h autoclave) treatment of SBA-15 samples [111] The shrinking did not
affect the shape of the hysteresis of the sorption isotherms of the SBA-15 samples For the 14 wt and
the 41 wt VxOySBA-15 sample the type IV physisorption isotherm was still present
00 02 04 06 08 10 0
200
400
600
Relative Pressure pp0
Ads
orbe
d N
2 V
olum
e [c
m3 (S
TP
)g-1
]
05 1 15 2
Nor
mal
ized
Int
ensi
ty
2 θ [deg]
SBA-15
77 wt V xOySBA-15
(100
)
(110
)
(200
)
00 02 04 06 08 10 0
200
400
600
Relative Pressure pp0
Ads
orbe
d N
2 V
olum
e [c
m3 (S
TP
)g-1
]
2 3 4 5 6 7 8 910 20 30 40
0
50
100
150
200
250
300
dV
pd
dp
dp [nm]
Figure 4-7 N2 adsorption (open symbols) and desorption (filled symbols) isotherms Left initial SBA-15 (grey same symbols as VxOySBA-15 samples) and calcined VxOySBA-15 samples prepared via the graftingion exchange method (colored squares 14 wt V triangles 41 wt V circles 77 wt V) The inset depicts the small angle XRD powder patterns of the calcined 77 wt VxOySBA-15 sample and the initial SBA-15 Right initial SBA-15 (black squares) SBA-15-APTES after calcination (blue circles) and calcined 77 wt VxOySBA-15 (red triangles) The inset depicts the respective pore size distributions obtained from the adsorption isotherm (BJH model)
59
Figure 4-8 top REM images of the calcined 77 wt VxOySBA-15 sample middle TEM images of the initial SBA-15 bottom TEM images of the calcined 77 wt VxOySBA-15 sample
60
For the high loaded 77 wt VxOySBA-15 a second step (pp0 ~ 05) was visible in the desorption
isotherm (Figure 4-7 right) Two different interpretations of this step are feasible A possible origin for
the additional step in the desorption isotherm may be a change of the SBA-15 mesoporous structure
during the ATPES grafting step in the preparation of this sample This argument was excluded because
the shape of the desorption isotherms did not change for the lower loaded 41 wt and 14 wt
VxOySBA-15 samples which were prepared in the same way (Figure 4-7 left) Moreover the
desorption isotherm exhibited only one step if the functionalized SBA-15-APTES sample was calcined
before the ion exchange step For such a sample a decrease of the BET surface area of ~ 53 was
observed Thus the APTES functionalization step decreased the BET surface area but did not change the
SBA-15 pore structure Another explanation for the second step in the desorption isotherm of 77 wt
VxOySBA-15 may be a pore plugging of some of the SBA-15 mesoporous channels by the supported
vanadium oxide phase Similar plugging effects on desorption isotherms were reported by Van der Voort
et al for PHTS SBA-15 materials [112] and Meyen et al for SBA-VS-15 materials [113] The fact that
the vanadium oxide phase at higher loading may plug some of the SBA-15 channels indicated that it was
possible to disperse the vanadium oxide phase into the pores of the SBA-15 using the graftingion
exchange method
That the SBA-15 channel structure was preserved during the preparation process was visible in the
electron microscopy images of the samples (Figure 4-8) In the TEM images of the initial SBA-15 and
the calcined VxOySBA-15 samples a channel structure was detected Some of the TEM images showed
the hexagonal orientation of these channels which is characteristic for SBA-15 (Figure 4-8 middle and
bottom) The wall thickness between the channels was estimated to be 3 nm and the channel diameter was
approximately 6-7 nm for bare SBA-15 For the calcined 77 wt VxOySBA-15 the wall thickness was
estimated to be 3-5 nm and the channel diameter was approximately 5-7 nm The slight decrease of the
channel diameter and the increase of the wall thickness indicates that either Si of the APTES reactant or
vanadium oxide were attached to the channel walls Due to the low element contrast of V and Si this
could not be discriminated However EDX measurements showed that a high vanadium dispersion was
present on the 77 wt VxOySBA-15 sample No areas of higher V content than 11 wt were identified
(3 measurements spot size ~ 30 nm) In order to determine the particle size and morphology SEM
images (Figure 4-8 top) were recorded of 77 wt VxOySBA-15 The main fraction of particles was
typically 30-70 microm long and 10 microm wide
43 Summary
VxOySBA-15 samples were prepared by incipient wetness wet impregnation and a graftingion
exchange method In situ UV-Vis-DRS XAFS and Raman measurements were conducted to determine
the nature of the vanadium oxide species present on SBA-15 Spectroscopic measurements of the
uncalcined VxOySBA-15 samples suggested that mixtures of different vanadium centers were present on
SBA-15 Features corresponding to vanadium oxide centers with higher (5-fold or 6-fold coordination)
61
and lower (4-fold or 5-fold coordination) degree of polymerization were observed in the spectra of the
uncalcined 30 wt -77 wt VxOySBA-15 samples From Raman and XAFS measurements it seems
likely that the higher polymerized vanadium centers may exhibit a structure similar to that of the
decavanadate ion With decreasing vanadium loading the amount of the less polymerized (4-fold or 5-fold
coordination) vanadium oxide centers increased In the spectra of uncalcined 14 wt VxOySBA-15 no
higher polymerized vanadium oxide phases were observed The probability that the lower polymerized
vanadium oxide centers were formed during the preparation was higher for the graftingion exchange
process In addition residuals of crystalline NH4VO3 were detected in the Raman spectrum of the
uncalcined sample prepared via wet impregnation (57 wt VxOySBA-15)
Calcination of the VxOySBA-15 samples yielded well dispersed vanadium oxide centers on SBA-15
Raman spectra of as prepared and thermally treated samples (dehydrated in 20 O2 in He 673 K)
showed characteristic bands for the hydrated and the highly dispersed dehydrated state of supported
vanadium oxides respectively These Raman bands matched those of VxOySiO2 samples reported in the
literature [2332] Therefore the VxOySBA-15 samples investigated here were comparable to highly
disperse VxOySiO2 samples reported in the literature [2332]
No distinct differences resulted from the preparation method employed as observed in the Raman UV-
Vis-DR and XAFS spectra of the VxOySBA-15 samples in the dehydrated state For all samples the
majority phase in the dehydrated state was a highly dispersed tetrahedral vanadium oxide species For the
sample prepared by wet impregnation with an aqueous NH4VO3 solution small amounts of crystalline
V2O5 were detected Therefore samples prepared by this method were not used for further structural
characterization and catalytic reactivity tests Samples prepared by the incipient wetness method were
also not used as model catalysts although only a dispersed vanadium oxide species was detected The
preparation of larger sample batches (5-10 g SBA-15) using this method is impractical and may cause an
inhomogeneous vanadium distribution on the SBA-15 support during the drying process of the uncalcined
samples Therefore the ion exchange method was preferred for sample preparation The calcined
14 wt 41 wt and 77 wt VxOySBA-15 (ion exchange) samples shown in this chapter were used
for structural characterization of the dispersed vanadium oxide species and for catalytic testing
The mesoporous structure of SBA-15 was not affected by the preparation method chosen A decrease of
the BET surface area was observed for all VxOySBA-15 samples Except for the 77 wt VxOySBA-15
sample the characteristic type IV physisorption isotherms were still present after anchoring the vanadium
oxide phase and calcination A second step in the desorption isotherm occurred for the calcined 77 wt
VxOySBA-15 sample Hence the supported vanadium oxide phase may be present inside the SBA-15
channels which causes plugging of some pores on the high loaded sample TEM and small angle XRD
measurements showed that the hexagonal channel structure of SBA-15 was maintained in this sample
62
63
5 Structural characterization of hydrated and
dehydrated VxOySBA-15
51 Introduction
Structural characterization of VxOy supported on SiO2 has been subject of many spectroscopic studies
including IR [44114115] XPS [116117118] Raman [233240117118119] UV-VIS
[233240100118] and EXAFS [21-2337108120121122] A recent review of spectroscopic
investigations and structural characteristics of various supported vanadium oxides has been presented by
Weckhuysen and Keller [18] It is assumed that the structure of supported vanadium oxide depends on
both amount of vanadium and degree of hydration [32] Hence most studies were performed on
VxOySiO2 samples exhibiting low vanadium loading (lt 25 Vnm2) At these loadings a monolayer of
supported VxOy species is assumed and crystalline V2O5 is not detectable [303132] Under ambient
conditions the structure of hydrated vanadium oxide supported on SiO2 resembles that of V2O5
[23117108] Thermal treatment in oxygen results in dehydration of the vanadium oxide species which
will be discussed in detail in Chapter 6 The dehydrated state has been proposed to consist of isolated
ldquoVO 4rdquo tetrahedrons bound to the SiO2 support [2123123124] However V2O7 dimers or further
extended structures supported on SiO2 have not been excluded [40] In total the structure of dehydrated
vanadium oxide species supported on SiO2 remains under debate
Here the combination of the spectroscopic methods UV-Vis-DRS and XAFS was used to elucidate the
structure of hydrated and dehydrated VxOySBA-15 Both methods provide information about the
electronic and geometric structure and they are particularly suitable to study supported catalysts under
reaction conditions
UV-Vis-DR spectroscopy allows the investigation of electronic transitions of valence electrons From the
nature of the observed transitions (CT intervalence d-d) information about the oxidation state and the
geometric configuration can be derived [95125] An example of how UV-Vis-DRS can be used to
identify the oxidation states of supported transition metal oxides like for instance CrxOySiO2 is given by
Weckhuysen et al [126] For the vanadium oxide on SiO2 model system investigated here the vanadium
oxidation state of V5+ can be distinguished from the lower vanadium oxidation states (V3+V4+) by
UV-Vis-DRS Furthermore in the last decade a simple approach for deriving information about the
geometric structure and the degree of polymerization of transition metal oxides (d0 configuration) from
UV-Vis-DR spectra was described by several authors [100127] They observed that the edge energy Eg
of d0 metal oxides is influenced by the coordination of the metal oxide structure and the degree of
polymerization Wachs et al correlated the number of covalent M-O-M bonds around the central
transition metal cation (d0 V Mo W) with the position of the UV-Vis edge energy Eg [100128129] A
64
linear correlation was observed that allowed distinguishing MO5MO6 polymers from MO4 polymers and
isolated MO4 metal oxide structures From this kind of plot Wachs et al [100] concluded that VxOy is
present as an isolated [VO4] tetrahedron in the dehydrated state of VOx on the silica support
Comparable to UV-Vis-DRS it is possible to derive information about the local geometric and electronic
structure from XAFS The average valence for instance can be obtained by comparison with known
reference compounds [130] Moreover Wong et al and Chaurand et al [94131] described how the V
pre-edge peak in the XANES region can be used for deriving information about coordination and valence
of the vanadium oxide species
Elucidating the geometric structure in more detail from XAFS however is often difficult In the
conventional approach theoretical XAFS scattering amplitudes and phases are calculated for a suitable
model structure Subsequently a sum of theoretical XAFS functions is refined to the experimental data
Structural parameters like coordination numbers nearest neighbor distances and disorder parameters may
be determined However more often than not the number of potential parameters exceeds the number of
ldquoindependentrdquo parameters The upper limit may be calculated from Fourier theory and must not be
exceeded Nonetheless it appears that even refinements employing a much smaller number of freely
varied parameters may yield ambiguous structural results The often used Nyquist criteria may not be
sufficient to evaluate a fitting procedure Basically one pair of strongly correlated parameters suffices to
render a seemingly good agreement between experimental data and theoretical model structure
meaningless While this case may be clearly indicated by the correlation matrix of the refinement other
pitfalls may be less obvious Hence procedures are sought that enable evaluating the significance of each
fit parameter individually
This chapter focuses on elucidating the local structure around the vanadium centers in the hydrated and
dehydrated state of VxOySBA-15 model catalysts with different vanadium loadings The UV-Vis-DR and
XANES spectra of the VxOySBA-15 model catalysts and suitable vanadium oxide references were
investigated In addition a detailed XAFS data analysis in particular of higher V-V distances was
performed together with a detailed evaluation of the significance of the fit parameters employed
65
52 Results and discussion
521 UV-Vis-DR spectra of VxOySBA-15 compared to those of V5+ references
In a first approach the UV-Vis-DR spectra of VxOySBA-15 were compared to the spectra of selected
vanadium oxide references (Figure 5-1) All spectra shown were measured in the in situ cell Apparently
both hydrated and dehydrated VxOySBA-15 exhibited only LMCT charge transfer bands which are
located at wavelengths shorter than 500 nm Absorption bands which are due to lower vanadium valences
(V4+ V3+) such as d-d or intervalence transitions were absent Hence the average valence of
VxOySBA-15 is assumed to be +5
0
15
5
10
220 800400 600
F(R
infin)
Wavelength [nm]
0
5
10
220 800400 600
F(R
infin)
Wavelength [nm]
Figure 5-1 Left UV-Vis-DR spectra of vanadium reference compounds (Mg3V2O8 ( ) m-Mg2V2O7 ( ) t-Mg2V2O7 ( ) MgV2O6 ( ) Mg3V10O28middotxH2O ( ) V2O5 ( )) and 77 wt VxOySBA-15 in the hydrated ( ) and dehydrated ( ) state Right UV-Vis-DR spectra of VxOySBA-15 with different loading in the hydrated and dehydrated state (14 wt ( ) 41 wt ( ) 77 wt ( ))
In Table 5-1 the positions of observed absorption bands for V5+ vanadium oxide compounds measured in
a standard integration sphere are listed The values in brackets refer to the positions obtained in the in situ
cell The error for each absorption band position was estimated to be plusmn 5- 10 nm Compared to the spectra
measured in the standard cell the spectra recorded in the in situ cell were less well resolved The positions
of absorption bands at wavelengths longer than 270 nm were similar for both measurement cells
However for wavelengths shorter than 260 nm the positions of the absorption bands were shifted to
longer wavelengths in the in situ cell This may be caused by the significantly lower intensity of the
incident light below 260 nm (Figure 10-1 and Figure 10-2 Appendix) Therefore the insufficient
resolution in the in situ cell has to be considered if the absorption band position in this region is compared
to that of VxOySBA-15 samples Dilution of the samples did not significantly change position and type of
the absorption bands (Table 5-2) The position of the low energy charge transfer band in the UV-Vis-DR
spectra of hydrated VxOySBA-15 was located around 365 nm for all loadings (Figure 5-1 right Table
5-2)
66
Table 5-1 Absorption band position and UV-Vis edge energy determined from UV-Vis-DR spectra of vanadium oxide reference compounds (Figure 5-1 left) together with the assumed covalent V-O-V bond (CVB) number (reference of the theoretical structure which matched the experimental XRD powder pattern Table 10-3 appendix) Values in brackets refer to measurements in in situ cell
Sample Absorption Band [nm] Eg [eV] CVB No
Na3VO4 230 255 290 391 0
K3VO4 272 313 354 0
Ca3V2O8 225 250 297 377 0
Mg3V2O8 271 336 (280-320 plateau) 344 (351) 0
m-Mg2V2O7 273 315 (276 311) 347 (353) 1
Ca2V2O7 261 326 314 2
t-Mg2V2O7 285 385 (293 382) 285 (294) gt 1
NaVO3 225 281 347 314 2
NH4VO3 225 284 357 317 2
KVO3 248 295 371 311 2
CaV2O6 250 272 344 290 3
MgV2O6 240 376 (248 370) 290 (297) 3
Mg3V10O28middotxH2O 250 broad ~ 400 nm (broad ~ 400 nm) 235 5
(NH4)6V10O28middotxH2O 240 370 440 (broad ~ 400 nm) 235 5
V2O5 241 334 390 460 (264 334 390h 468) 235 5
A second absorption band located at ~ 300 nm for the 77 VxOySBA-15 sample was blue shifted with
decreasing V density (~ 293 nm 41wt V 260 nm 14 wt V) A weak shoulder at 460 nm may be
present (Figure 5-1 right) Similar bands were found for references with square pyramidal coordination
(pseudo octahedral) such as V2O5 and MgV2O6 (Table 5-1) An interpretation of the observed bands was
given by Centi et al [132] They reported that the charge transfer band due to the V=O double bond is
observed at ~ 380 nm It can be calculated from the differences in electronegativity between the metal and
the ligand for an octahedral coordination of vanadium oxo compounds [133] However this does not
explain the band at 460 nm According to Centi this charge transfer band is due to ldquodelocalized donor
acceptor sitesrdquo originating from higher ldquoconjugated sites like octahedral VO6 chainsrdquo [132] The
absorption band at 460 nm in the spectra of hydrated VxOySBA-15 was rather weak Thus the structure
of hydrated VxOySBA-15 seems to have a square pyramidal coordination but in contrast to V2O5 it
seems to be less extended
During thermal treatment of hydrated VxOySBA-15 in oxygen (20 O2 in He 554-626 K) a loss of water
and a distinct change in structure were observed (Figure 5-1 Table 5-2) For dehydrated 77 wt
VxOySBA-15 the low energy LMCT band is located at ~ 309 nm and was blue shifted with decreasing
loading of V (~ 285 nm 14 wt V on SiO2) The bands of undiluted crystalline vanadate references with
tetrahedral coordination are located in these regions for instance Na3VO4 NH4VO3 m-Mg2V2O7 and
Mg3V2O8 (Table 5-1) Referring to Centi et al [132] the charge transfer bands of tetrahedral vanadium
oxo compounds are located below 333 nm Therefore a tetrahedral structure of dehydrated VxOySBA-15
is assumed A more distinct determination of the degree of polymerization of the tetrahedral vanadium
oxide species seemed not feasible from comparing only the absorption band positions of the VxOySBA-
15 samples with those of the references The interpretation of the charge transfer bands of solid
compounds remains challenging The interpretation by Centi et al [132] considers the vanadium oxide as
solely molecular a cluster similar to the common interpretation of molecular coordination complexes
67
Table 5-2 Absorption band position and UV-Vis edge energy determined from the UV-Vis-DR spectra of hydrated and dehydrated VxOySBA-15 samples (Figure 5-1 right) together with the calculated covalent V-O-V bond (CVB) number Values in brackets refer to diluted samples (F(Rinfin)max~ 1-2)
Sample Absorption Band [nm] Eg [eV] CVB No
77 wt V hydrated 300 368 (300 368) 276 (274) 35
41 wt V hydrated 293 364 (283 363) 280 (279) 34
14 wt V hydrated 260 365 (260 368) 288 (280) 30
77 wt V dehydrated 309 (302) 343 (337) 10
41 wt V dehydrated 309 (305) 342 (344) 10
14 wt V dehydrated 286 (280) 359 (360) 04
Moreover if this interpretation was sufficient to describe the LMCT absorption bands even though more
than a single transition would occur for an isolated free VO43- ion [134] Calculations may provide more
detailed information about the type and intensity of the absorption bands that can be expected For V2O5
monocrystals Lazukova et al received a good agreement between the experimental and the theoretically
calculated electroreflectivity spectra [135] Ronde et al [134] calculated the position of the charge
transfer band for isolated tetrahedral compounds The range obtained (240-330 nm) agrees well with the
values of tetrahedral vanadate references found here However these results do not allow us to distinguish
unambiguously between different connectivities of tetrahedral vanadium oxide compounds such as
isolated dimeric or chain-like structures One attempt to distinguish different arrangements of supported
vandium oxide clusters was reported by Avdeev et al [136] They concluded that for isolated [VO4]
structures on SiO2 two absorption bands at 238 and 263 nm are present These bands are red shifted to
250-260 nm and 270-290 nm if dimeric tetrahedral compounds are present (V-O-V linkage) These
results match with the absorption bands of dehydrated VxOxSBA-15 with the maximum at 286 and
309 nm found here (Table 5-2) Therefore for all loadings a dimeric tetrahedral structure is present
Avdeev et al [136] attributed an increase in coordination from 4-fold to 5-fold to absorption bands
located at 340 nm in the spectra of hydrated VxOySiO2 samples (here 365 nm Table 5-2) Identifying the
contributions of these transitions in the experimental UV-Vis-DR spectra would provide more detailed
information However considering the broad absorption bands and the insufficient resolution in the UV
range (in situ cell) a reasonable refinement seems not very likely and thus was not performed here
522 Correlation of the UV-Vis-DRS edge energy Eg with the local structure of vanadium
oxide references
To gain more insight into the nature of the dispersed vanadium oxide species present on the support the
UV-Vis edge energy Eg of the LMCT band was correlated with the number of V-O-V bonds in the
measured crystalline vanadium oxide references as reported by Wachs et al [100] The Eg values
obtained are summarized in Table 5-1 and the resulting plot is depicted in Figure 5-2 (left) For clarity
all references were measured undiluted in the integration sphere cell Samples measured in the in situ
Praying MantisTM cell as shown in Figure 5-2 (left) are depicted as grey symbols The linear correlation
of the V-O-V bond number (CVB) with Eg was almost linear (grey line) The t-Mg2V2O7 reference was
not considered in this correlation As discussed in Chapter 236 the connectivity of [V2O7]x polyhedrons
68
may be higher than that of dimers and thus the V-O-V number is larger than one The linear function
obtained here was
CVB = 1374 ndash 372middotEg (plusmn 5 R2=098) (51)
Deviations from the equation found by Wachs et al (CVB = 1403 ndash 395middotEg (plusmn 034)) [100] can be
explained by the larger number of reference compounds used here A second reason was that all samples
were measured undiluted here Compounds like Na3VO4 or K3VO4 tend to dehydrate when they are
diluted which causes significantly lower values for Eg (~ 05 eV) as observed by Wachs et al [100]
Dilution of all other samples with the white reflectance standard caused a shift of Eg in the range of
plusmn 001-008 eV
25 30 35 40
0
1
2
3
4
5
( )
VO4 monomers
V2O
7 dimers
(VO4)
n chains
(VO4-VO
5)
n chains
(VO5)
n doublechains
(VO5VO
6)
n polymers
V-O
-V N
umbe
r
E g [eV]
168 170 172 174 176 178 18030
32
34
36
38
40
UV
-Vis
Edg
e E
nerg
y [e
V]
Average V-O Bond Length [Aring]
isolated VO4
3-
dimeric V2O
7
4-
chains [VO4]x
Figure 5-2 Left Covalent V-O-V bond number (CVB) versus UV-Vis edge energy (Eg) of vanadium oxide reference compounds (Na3VO4 ( ) K3VO4 ( ) Ca3V2O8 () Mg3V2O8 () m-Mg2V2O7 () Ca2V2O7 ( ) t-Mg2V2O7 () NaVO3 (diams) NH4VO3 ( ) KVO3 ( ) CaV2O6 () MgV2O6 () Mg3V10O28middotxH2O ( ) (NH4)6V10O28middotxH2O ( ) V2O5 ( ) grey symbols refer to measurements in in situ cell) right UV-Vis edge energy versus average V-O bond length in the first coordination sphere of vanadium references exhibiting a tetrahedral coordination
The linear correlation (Figure 5-2 left) can be explained according to Weber et al [127] They
concluded in a simplified assumption that ldquothe edge energies of moleculary sized clusters should track
with the extent of spatial delocalization of the molecular orbitals involved in the electronic transition
associated with the UV-visible edgerdquo [127] Hence the energy needed for an electronic transition is
lowered with increasing number of participating molecular orbitals Accordingly the determination of the
UV-Vis edge energy allowed an estimation of the size of the vanadium oxide clusters present in the
VxOySBA-15 samples Relatively high errors (plusmn 5) were obtained for this linear correlation These are
mainly due to the wide range of Eg values determined for isolated tetrahedral compounds (CVB = 1)
Similar spreading of Eg with decreasing CVB number was observed by Wachs et al for W and Mo based
d0 transition metal oxide systems [128129] They concluded that not only the CVB number influences the
Eg position but also the distortion of the coordination polyhedron [128] The effect of the distortion of the
coordination polyhedron seems to be stronger for less polymerized vanadium oxide structures This effect
cannot be explained by the delocalization of molecular orbitals It seems more likely that the average V-O
bond length in the first coordination sphere as indicator for the distortion influences the energy of the
69
LMCT transitions A similar trend was proposed by Ronde et al for the absorption band maxima [134]
Figure 5-2 right shows the edge energy versus the average V-O bond length for several vanadates
exhibiting tetrahedral coordination A decrease of Eg with increasing distortion (average RV-O) was
obtained Moreover the slope of the linear correlation decreased with increasing V-O-V number from
orthovanadate to metavanadate structures For higher coordinated structures exhibiting a V-O-V number
of 3 or 5 no comparable correlation was found Hence only the effect of delocalization determines the
electronic structure of higher polymerized vanadium centers Conversely in lower coordinated tetrahedral
compounds the electronic structure of the vanadium centers is rather described with molecular orbitals
which are present in molecular coordination complexes Moreover it is possible that the electronic
structure of the absorbing vanadium centers is more sensitive towards disturbances of the surrounding
cations than the electronic structure of the vanadium centers in the higher clustered vanadium oxide
anions like V2O62- or V10O28
6- A more detailed explanation was not possible because of the limited data
set of isolated and dimeric tetrahedral vanadium oxide references or missing calculations of the electronic
structure of model compounds However as a result of these contributions (delocalization and distortion)
to the electronic structure of vanadium oxides in tetrahedral coordination an unambiguous discrimination
between dimeric and isolated structures is hardly feasible
523 UV-Vis Eg- indicator for the local structure of hydrated and dehydrated VxOySBA-15
Accordingly the linear correlation of the V-O-V number and the UV-Vis edge energy was used only as
an indicator for the structure of the VxOySBA-15 structures In Table 5-2 the values obtained for
hydrated and dehydrated VxOySBA-15 are listed for all loadings employed The values in brackets refer
to diluted samples No distinct changes were observed with dilution Hence undiluted samples were used
for further reaction experiments as described in the following chapters For the hydrated VxOySBA-15
samples UV-Vis edge energies from 276 to 288 eV were obtained which increased with higher
dispersion of vanadium oxide on the SBA-15 support The CVB numbers were determined to be between
30 and 35 These values supported the observation above that hydrated VxOySBA-15 exhibits a square
pyramidal coordination For dehydrated VxOySBA-15 V-O-V numbers of 10 were obtained for the
41 wt and the 77 wt V on VxOySBA-15 sample which confirmed the dimeric tetrahedral structure
that was indicated by the position of the absorption bands The low loaded 14 wt VxOySBA-15 sample
exhibited a reduced V-O-V number of 03 which suugests an isolated [VO4] structure According to
Weber et al [127] the value of 03 may also indicate a mixture of isolated and dimeric structures on the
support Similar results were recently observed for low loaded MoxOy on SBA-15 samples [137]
The absorption band positions and UV-Vis-DRS edge energies detected here were comparable to those
reported by other authors for vanadium oxides supported on SiO2 in a monolayer coverage [23100]
However mostly an isolated structure was assumed for low loaded dehydrated VxOySBA-15 which is in
contrast to the dimeric structures discussed here Therefore a detailed XAFS analysis was performed on
hydrated and dehydrated VxOySBA-15 to obtain additional information about the local structure around
the V atoms
70
25
05
10
15
20
30
545 55 555 56 565
Nor
mal
ized
Inte
nsity
Photon Energy [keV]
dehydrated 77 wt VSBA-15
dehydrated 41 wt VSBA-15
dehydrated 14 wt VSBA-15
00
20
40
60
00
545 55 555 56 565
Nor
mal
ized
Inte
nsity
Photon Energy [keV]
hydrated 77 wt VSBA-15
V2O5
MgV2O6
CaV2O6
Mg3V10O28 middotH2O
(NH4)6V10O28 middotH2O
00
05
10
15
20
25
30
545 55 555 56 565
Nor
mal
ized
Inte
nsity
Photon Energy [keV]
hydrated 77 wt VSBA-15
hydrated 41 wt VSBA-15
hydrated 14 wt VSBA-15
20
40
00
545 55 555 56 565
Nor
mal
ized
Inte
nsity
Photon Energy [keV]
Mg3V2O8
Dehydrated 77 wt VSBA-15
Ca3V2O8
Na3VO4
K3VO4
00
10
20
30
40
545 55 555 56 565
Nor
mal
ized
Inte
nsity
Photon Energy [keV]
t-Mg2V2O7
Ca2V2O7
m-Mg2V2O7
Dehydrated 77 wt VSBA-15
00
10
20
30
40
545 55 555 56 565
Nor
ma
lized
Inte
nsity
Photon Energy [keV]
NH4VO3
KVO3
NaVO3
Dehydrated 77 wt VSBA-15
Figure 5-3 V K edge XANES spectra of hydrated and dehydrated VxOySBA-15 samples with different vanadium loadings (14 wt 41 wt and 77 wt) V K edge compared to the spectra of various V5+ reference compounds (dotted line refers to 77 wt dehydrated VxOySBA-15)
524 XANES analysis ndash coordination and distortion of V species in VxOySBA-15
The XANES spectra of hydrated VxOySBA-15 are depicted in Figure 5-3 (top left) The spectra
resembled those of vanadium oxide references where the vanadium centers exhibit a distorted octahedral
or distorted square pyramidal coordination (Figure 5-3 top right) The XANES spectra of hydrated
VxOySBA-15 V2O5 MgV2O6 CaV2O6 (NH4)6V10O28middotxH2O and Mg3V10O28middotxH2O all had a pre-edge
peak of similar height Because the pre-edge peak height is determined by the coordination of the
vanadium centers as discussed in more detail below hydrated VxOySBA-15 also appeared to exhibit a
distorted square pyramidal coordination of the V centers During thermal treatment of as-prepared
hydrated VxOySBA-15 in oxygen (20 O2 in He) a loss of water and a distinct change in structure were
observed (discussed in Chapter 6) After thermal treatment dehydrated VxOySBA-15 was cooled to
293 K (20 O2 in He) without exposure to air or water (Figure 5-3 top middle) No changes in the XAFS
71
spectra were observed during cooling Compared to the vanadium oxide references the overall XANES
region of dehydrated VxOySBA-15 resembled those of metavanadate references like NH4VO3 KVO3
and Na3VO4 and distorted pyrovanadate references like t-Mg2V2O7 and Ca2V2O7 (Figure 5-3 bottom) In
the local structure of these references the vanadium centers are tetrahedrally coordinated by four oxygen
atoms Compared to the XANES spectrum of dehydrated VxOySBA-15 NH4VO3 KVO3 and NaVO3
exhibit very similar pre-edge peak heights in their XANES spectra Conversely the pre-edge peaks in the
XANES of Ca3V2O8 K3VO4 Na3VO4 and Mg3V2O8 are much higher than that of dehydrated
VxOySBA-15 (Figure 5-3 bottom right)
More detailed correlations of the position and height of the pre-edge peak with the average valence and
coordination of the vanadium center were described by Wong et al [131] and Chaurand et al [94] Here
a method referring to a report by Wong et al was chosen to investigate the coordination of the absorbing
vanadium centers in the VxOySBA-15 samples Wong et al [131] showed that a plot of the intensity of
the pre-edge peak feature versus a ldquomolecular cage-size parameterrdquo such as the average V-O bond length
results in a linear correlation With increasing distortion in the same coordination and with increasing
coordination number (tetrahedral to octahedral) a decrease of the intensity was observed Thus an
identification of different coordinations of the absorbing vanadium center is possible In contrast to Wong
et al the intensity of the pre-edge peak was not determined by the product of its height and its width at
half height Due to the asymmetry of the observed pre-edge peaks the area was determined by a method
described by Chaurand et al [94] For the analysis the energy range around the pre-edge peak was
extracted from the normalized spectra The increase of the absorption edge was eliminated by using an
empirical background as shown in Figure 5-4 (right) The resulting background corrected signal was
fitted using three pseudo Voigt functions The resulting product of the area and the pre-edge peak height
at peak maximum (PHA) was plotted versus the average bond length (RV-O) of the measured reference
compounds (structure confirmed by XRD refinement Table 10-3 appendix) As shown in Figure 5-4
(left) a linear correlation was obtained The different coordinations (456-fold) are separated by a shift of
the average RV-O of 008-010 Aring The signals of tetrahedral references range from 170 -174 Aring those of
distorted square pyramidal references from 182-183 Aring and that of octahedral references are found at
192 Aring Interestingly the Ca2V2O7 sample which consists of a mixture of distorted square pyramidal and
tetrahedral VOx units (average coordination number 467) fits very well in the linear correlation
Compared to the UV-Vis edge energy no influence of the delocalization of the orbitals involved was
found In contrast to the UV-Vis edge energy it is possible to identify the coordination of the vanadium
centers in the oxide cluster Moreover information about the degree of distortion around the absorbing
vanadium center can be derived
Compared to references the coordination of the vanadium centers in hydrated VxOySBA-15 may be
distorted square pyramidal similar to compounds such as V2O5 and MgV2O6 This has also been observed
by Bell et al [108] Dehydrated VxOySBA-15 seemed to exhibit a coordination and distortion more
similar to references like NH4VO3 and KVO3
72
16 17 18 19 20 2100
05
10
15
20
25
30
octrahedral
square pyramidal
tetrahedral
-H2O
dehydrated VxO
ySBA-15
hydrated VxO
ySBA-15
V K
Pre
Edg
e P
eak
Hei
ght
Are
a
Average V-O Bond Length R [Aring]
-4 -2 0 2 4 6 8 10 12 14 16
00
02
04
06
08 background corrected profile fitted Pseudo Voigt functions fitted lineprofile
Cor
rect
ed A
bsor
ptio
n
Edge shift [eV]
00
02
04
06
08 experimental lineprofile manual interpolated
background
Nor
m a
bsor
ptio
n
Figure 5-4 Left Correlation of the product of the V K edge pre-edge peak intensity and area versus average V-O bond length R in the first coordination sphere (Ca3V2O8 () Mg3V2O8 () m-Mg2V2O7 () Ca2V2O7 ( ) t-Mg2V2O7 () NaVO3 (diams) NH4VO3 ( ) KVO3 ( ) CaV2O6 () MgV2O6 () Mg3V10O28middotxH2O ( ) (NH4)6V10O28middotxH2O ( ) V2O5 ( )) right subtraction of the background from V K edge pre-edge peak of 77 wt VxOySBA-15 (top) and an example of the peak fit to the background corrected signal (bottom) The pre-edge peak heights for VxOySBA-15 are indicated as lines (Refer to text and Table 10-4 for details)
The average V-O bond length around the absorbing vanadium centers was estimated by using the linear
correlation
PHA = 1328 ndash 658middot RV-O (plusmn 7-9 R2=096) (52)
For the hydrated VxOySBA-15 samples RV-O was 188 Aring and for dehydrated VxOySBA-15 RV-O was
177 Aring The latter value suggests the presence of a strongly distorted VOx tetrahedron in the vanadium
oxide structure of dehydrated VxOySBA-15 Both RV-O values were increased compared to the bulk
vanadium oxide references This may be an influence of the high dispersion of the supported vanadium
oxide which may cause a higher distortion
525 Local structure of dehydrated VxOySBA-15 ndash Comparison to V oxide references
In addition to the UV-Vis-DRS experiments and the investigations of the XANES structure a detailed
EXAFS investigation of samples with different V loadings in the hydrated and dehydrated state was
performed In particular the contribution of higher scattering shells to the XAFS signal was analyzed to
possibly reveal the presence of V nearest neighbors in the local structure of vanadium oxide species
supported on SiO2 In the corresponding literature only a few authors present XAFS refinements of
supported vanadium oxide samples [212237114120-122 124] Typically the first V-O coordination
sphere was analyzed by XAFS refinement [2294] A detailed XAFS analysis of higher shells in the
FT(χ(k)k3) has been largely neglected Only Keller et al [37114120-122124] discussed contributions
of higher V-O and V-Si shells located at distances gt 2 Aring They excluded higher V-O-V contributions to
the FT(χ(k)k3) of highly dispersed dehydrated VxOy samples supported on SiO2 or Al2O3
73
0
5
10
15
20
25
4 6 8 10
χ(k)
k3
k [Aring-1]
41 wt VSBA-15
14 wt VSBA-15
77 wt VSBA-15
NH4VO3
01
02
0 2 4 6
R [Aring]
NH 4VO 3
KVO 3
NaVO 3
t-Mg 2V2O7
01
02
03
04
0 2 4 6
R [Aring]
Ca 2V2O7
m-Mg 2V2 O 7
Mg 3 V2 O8
Ca 3V2 O8
FT
(χ(k
)k3 )
FT
(χ(k
)k3 )
dehydrated 77 wt VSBA-15
dehydrated 77 wt VSBA-15
Figure 5-5 left V K edge χ(k) of dehydrated VxOySBA-15 with different vanadium loadings (14 wt 41 wt and 77wt ) and NH4VO3 middle right V K edge FT(χ(k)k3) of dehydrated VxOySBA-15 (77 wt dotted) compared to those of various references
The EXAFS χ(k)k3 of dehydrated VxOySBA-15 with different V loadings are depicted in Figure 5-5
(left) The usable range extended from 27 to 105 Aring-1 The V K edge FT(χ(k)k3) of the dehydrated
VxOySBA-15 sample (77 wt) measured at 293 K are shown in Figure 5-5 FT(χ(k)k3) and χ(k)k3 are
not phase shift corrected Thus the distances in the FT(χ(k)k3) are shifted to lower values by ~ 04 Aring
compared to crystallographic distances
The FT(χ(k)k3) of various vanadium oxide references exhibiting a tetrahedral coordination are compared
to that of dehydrated VxOySBA-15 (Figure 5-5 middle and right) In contrast to the XANES spectra the
FT(χ(k)k3) of Na3VO4 and K3VO4 are not shown The high tendency for dehydration of these
compounds caused a high level of noise in the resulting χ(k)k3 The first V-O peak in the FT(χ(k)k3) at
~ 14 Aring (not phase shift corrected) for all references shown corresponds to a [VO4] tetrahedron in the
respective structures The spectra of the metavanadate structures like NH4VO3 and KVO3 resembled that
of dehydrated VxOySBA-15 most closely In the FT(χ(k)k3) of the pyrovanadate structures like
Mg2V2O7 and Ca2V2O7 and the orthovanadate structures like Ca3V2O8 and Mg3V2O8 the first V-O peak is
significantly higher than in the FT(χ(k)k3) of dehydrated VxOySBA-15 In contrast to the FT(χ(k)k3) of
Mg3V2O8 and the pyrovanadates Ca2V2O7 and monoclinic Mg2V2O7 which exhibit a significant
amplitude at distances above 2 Aring the FT(χ(k)k3) of Ca3V2O8 KVO3 NH4VO3 triclinic Mg2V2O7 and
dehydrated VxOySBA-15 show little amplitude at higher distances Moreover looking at the differences
between the FT(χ(k)k3) of Ca3V2O8 KVO3 NH4VO3 and triclinic Mg2V2O7 the latter two appear to
yield the best agreement with that of dehydrated VxOySBA-15 In all references the low amplitude of the
FT(χ(k)k3) at R gt 2 Aring is characteristic of the local structure around the tetrahedral V centers In
conclusion based on comparing the XANES and FT(χ(k)k3) of dehydrated VxOySBA-15 to those of
potential references NH4VO3 and triclinic Mg2V2O7 have been identified as suitable references to serve
as model systems for a more detailed structural analysis
74
526 Local structure of higher connected tetrahedral vanadium oxide cluster - XAFS
refinement of a reference based model structure
Before we discuss the details of analyzing the XAFS data of dehydrated VxOySBA-15 a suitable analysis
procedure for the higher V-V contributions in the XAFS spectra of the references NH4VO3 and triclinic
Mg2V2O7 was sought As an example and to reduce the number of tables here the application of
confidence limits and F parameter to distinguish analysis fitting procedures is described below for three
refinements of a suitable model structure to the experimental FT(χ(k)k3) of dehydrated VxOySBA-15
00
005
01
00
-005
FT
(χ(k
)k3 )
0 2 4 6
R [Aring]
00
005
00
-005
FT
(χ(k
)k3 )
0 2 4 6
R [Aring]
V-O (2) 2x V-O (1)
V-V (1) V-V (1) V-O (1)
V-O (2)
2x V-O (1) 2x V-V (1)
V+5O-2
Figure 5-6 Experimental (solid) V K edge FT(χ(k)k3) of the NH4VO3 (right) and the Mg2V2O7 (left) reference together with a theoretical XAFS function (fitting results are given in Table 5-3) Also shown are the Fourier transformed χ(k)k3 of the individual scattering paths together with the corresponding coordination number in brackets
The model structure consisted of a tetrahedral coordination of the V center with four oxygen atoms at
~17 Aring (NH4VO3) two vanadium atoms at ~34 Aring (NH4VO3) and 36 Aring (triclinic Mg2V2O7) one oxygen
atom at ~29 Aring (triclinic Mg2V2O7) and one Si atom at ~28 Aring (Table 5-3) Experimental FT(χ(k)k3) of
triclinic Mg2V2O7 and NH4VO3 and the corresponding XAFS refinements are shown in Figure 5-6
Deviations between the theoretical and experimental spectra of triclinic Mg2V2O7 in the range from 2-4 Aring
are caused by several Mg neighbors and nearly linear multiple-scattering paths in triclinic Mg2V2O7 that
contribute in this range These are not sufficiently accounted for by the simplified refinement procedure
used here Similar arguments hold for NH4VO3 The results of the XAFS refinement for dehydrated
VxOySBA-15 NH4VO3 and triclinic Mg2V2O7 are summarized in Table 5-3 Apparently the distorted
[VO4] tetrahedron in NH4VO3 required two different V-O distances to be included in the refinement
while triclinic Mg2V2O7 and dehydrated VxOySBA-15 exhibited a single V-O distance It seems that the
distortion in the [VO4] units of the crystalline reference triclinic Mg2V2O7 could not be resolved by the
XAFS analysis procedure employed Accordingly a lower σ2 was obtained (00013 Aring2) for NH4VO3
compared to those of dehydrated VxOySBA-15 and triclinic Mg2V2O7 (00079 Aring2 and 00058 Aring2
respectively) In contrast a single V-V distance at 347 Aring (CN = 2) sufficed for NH4VO3 (consisting of
chains of [VO4] units) while two V-V distances had to be included for triclinic Mg2V2O7 (consisting of
adjacent [V2O7] units) and dehydrated VxOySBA-15
75
Table 5-3 Type and number (N) of atoms at distance R from the absorbing V atom in a model system assuming an ordered arrangement of V2O7 units (Figure 5-9 right) compared to experimental distances and XAFS disorder parameters (σ2) The parameters were obtained from the refinement of this model structure to the experimental V K edge XAFS FT(χ(k)k3) of dehydrated VxOySBA-15 (77 wt) t-Mg2V2O7 and NH4VO3 (k range from 27-105 Aring-1 R range 084-362 Aring Nind = 16 E0 = 0 eV in all cases fit residual 39 (dehydrated VxOySBA-15) (Nfree = 8) 107 (t-Mg2V2O7) (Nfree = 7) 147 (NH4VO3) (Nfree = 5)) (subscript c indicates parameters that were correlated in the refinement subscript f indicates parameters that were fixed in the refinement) Confidence limits and significance to the fit parameters are given in Table 5-4
N Rmodel [Aring] deh 77 wt t-Mg2V2O7 NH4VO3
Type R [Aring] σ2 [Aring2] R [Aring] σ2
[Aring2] R [Aring] σ2 [Aring2]
V - O 1 163 178 00079 174 00058 169 00013
V - O 1 170 178 c 00079 c 174 c 00058 c 169 00013 c
V - O 2 176 178 c 00079 c 174 c 00058 c 184 00013 c
V - O 1 287 289 00012 f 277 00113 -- --
V - V 1 342 329 00116 333 00148 347 00143
V - V 1 362 360 00116 c 352 00148 347 00143 c
V - Si 1 280 254 0013 -- -- -- --
In the cases of the references a similar σ2 parameter for the V-V contributions of about 0014 Aring2 was
obtained For dehydrated VxOySBA-15 it was slightly decreased (0012 Aring2) The corresponding
confidence limits and significance parameters F are given in Table 5-4 In fitting procedure 1 two V-O
distances in the first V-O shell were allowed to vary independently (both with a CN of 2 and the same σ2)
Moreover E0 was also allowed to vary in fitting procedure 1 Because Nind = 16 and Nfree = 11 the
refinement procedure 1 would be taken as reliable according to the Nyquist criteria However F
parameter of 06 and 09 were obtained with procedure 1 for R and σ2 of the V-O distances Moreover
E0 exhibited a confidence limit of plusmn 025 and F = 04 Apparently fitting procedure 1 already exceeded
the number of meaningful parameters and yielded ambiguous structural parameters On the one hand the
reduced amplitude of the FT(χ(k)k3) of dehydrated VxOySBA-15 compared to that of references
consisting of undistorted [VO4] units (Figure 5-5) suggested the presence of more than one V-O distance
including a short ldquovanadylrdquo V=O distance On the other hand however the resolution in the experimental
FT(χ(k)k3) and the available degree of freedom did not permit refining more than one V-O distance in
the procedure used Therefore the fitting procedure was modified E0 was kept invariant in the refinement
and only one V-O distance at ~175 Aring was used In contrast to procedure 1 procedure 2 yielded
reasonable confidence limits and acceptable F parameters Conversely the σ2 parameter of the V-Si at
25 Aring and the V-O contribution at 29 Aring exhibited rather high confidence limits Apparently both V-O
and V-Si neighbors in the distance range from 25 Aring to 29 Aring are required for a good refinement of the
model structure to the experimental data This is indicated by the confidence limits and F parameters
calculated for the corresponding distances (Table 5-4) Nevertheless the high σ2 obtained for the V-Si
contribution and the rather low σ2 obtained for the V-O at 29 Aring indicate a certain ambiguity of the
corresponding fit results
76
Table 5-4 V K edge XAFS parameters (Z for distances R and disorder parameter σ2) obtained from three different procedures of fitting a model structure (ie ldquoordered V2O7 dimersrdquo on SiO2 support) to the experimental XAFS FT(χ(k)k3) of dehydrated VxOySBA-15 (77 wt ) (details of fit given in Table 5-3) together with confidence limits (plusmn z referring to 95 of fit residual) and significance parameters F (details given in text)
Procedure 1 Procedure 2 Procedure 3
Pair N Z plusmnz F Z plusmnz F Z plusmnz F
R(V - O) 2(4) 175 0008 06 178 0001 -- 178 0001 --
σ2(V - O) 4 00072 00001 -- 00080 00001 -- 00079 00001 --
R(V - O) 2(--) 180 0002 -- -- -- -- -- -- --
R(V - O) 1 289 001 289 001 -- 289 001 --
σ2(V - O) 1 00001 00006 09 00001 00008 -- 00012f -- --
R(V - V) 1 327 002 -- 328 002 -- 329 001 --
σ2(V - V) 1 00125 00006 -- 00128 00007 -- 00116 00007 --
R(V - V) 1 360 002 -- 360 002 -- 360 002 --
R(V - Si) 1 253 001 -- 254 001 -- 254 001 --
σ2(V - Si) 1 00114 0002 04 00120 00013 03 00130 00008 --
E0 - 09 025 04 0f -- -- 0f -- --
Residual 41 38 39
The reason may be a considerable static disorder and thus a broadened V-Si distance distribution
Therefore the σ2 parameter was fixed in the final procedure 3 to a reasonable value which was obtained
empirically This constraint yielded a more reliable confidence limit for the σ2 parameter (plusmn 00008 Aring2) of
the V-Si contribution at 25 Aring (Table 5-4) Calculating and evaluating confidence limits and F tests
permitted us to arrive at a meaningful and reliable fitting procedure Moreover the approach employed
appears to be superior to calculating only the Nyquist criteria In total procedures 2 and 3 worked very
well for the XAFS data analysis of dehydrated VxOySBA-15 and triclinic Mg2V2O7 In contrast the local
structure around V centers in NH4VO3 was best described by assuming two different V-O distances in the
first coordination shell and only one V-V distance at 347 Aring (CN = 2) (Table 5-4) A V-O distance at
28 Aring was found to be insignificant
527 Local structure of dehydrated VxOySBA-15 ndash XAFS refinement of ldquoVO4ldquo based model
structures
After having identified two suitable references as model structures for XAFS refinements to the
experimental FT(χ(k)k3) of dehydrated VxOySBA-15 (Figure 5-5 middle and right) the XAFS
analysis approach chosen shall be described in more detail In addition to using confidence limits and
F tests as introduced above the suitable XAFS fitting procedure was developed stepwise as outlined in
the following
First we started with a common assumption from the literature UV-Vis-DRS or Raman measurements
reported in the literature revealed that dehydration of VxOySBA-15 resulted in a characteristic change
from a distorted square pyramidal to a distorted tetrahedral coordination [23117100] The local structure
of vanadium oxide species supported on SiO2 was assumed to correspond to isolated [VO4] units Hence
in a first tetrahedron approach the theoretical XAFS function of a [VO4] tetrahedron consisting of two
77
slightly different V-O distances was refined to the FT(χ(k)k3) of dehydrated VxOySBA-15 (Figure 5-7
left) Because of the similar height of the pre-edge peak in the XANES (Figure 5-3 bottom left) and the
first V-O peak in the FT(χ(k)k3) phases and amplitudes employed in the refinement were calculated
using the model structure of NH4VO3 (ICSD 1487 [138]) Figure 5-7 (left) shows a good agreement
between theoretical and experimental FT(χ(k)k3) of dehydrated VxOySBA-15 for the first V-O peak
below 2 Aring Naturally the amplitude between 2 Aring and 4 Aring in the FT(χ(k)k3) could not be accounted for
Hence a structural model assuming only isolated [VO4] species cannot adequately describe the local
structure around the V centers in dehydrated VxOySBA-15 Therefore we assumed that higher
coordination shells around the vanadium centers significantly contribute to the FT(χ(k)k3) of dehydrated
VxOy SBA-15 These shells have to be included in the refinement A seemingly expected contribution
may arise from silicon backscatterers in the SiO2 support at distances of less than 30 Aring This has been
proposed previously by Keller et al [120] Thus in extension of the tetrahedron approach a silicon atom
at a V-Si distance of 28 Aring was included in the theoretical model In the corresponding ldquoO3V-O-Sirdquo unit a
Si-O distance of 162 Aring is assumed (Figure 5-7 middle) as it is found in various silicates The result of
the XAFS refinement of the ldquoO3V-O-Sirdquo model to the FT(χ(k)k3) of dehydrated VxOySBA-15 is
depicted in Figure 5-7 (middle) The additional Si backscatterer resulted in a better agreement between
theoretical and experimental FT(χ(k)k3) at distances of about 24 Aring (not phase shift corrected) The
resulting V-Si distance amounted to 254 Aring comparable to the distance obtained by Keller et al (261 Aring
[120]) However it can be seen easily from Figure 5-7 (middle) that the amplitude in the FT(χ(k)k3) of
dehydrated VxOySBA-15 between 24 and 40 Aring is still not accounted for In addition to the V-Si
contributions in the range of 2-3 Aring Keller et al [114] proposed the presence of V-O contributions at 27
Aring which are caused by the oxygen atoms of the SiO2 support
00
005
-005
FT
(χ(k
)k3 )
0 2 4 6R [Aring]
0 2 4 6R [Aring]
0 2 4 6R [Aring]
V-O (2) 2x V-O (1)
V-O (1) V-Si (1)
V-O (2) 2x V-O (1)
V-Si (1) V-O (2) 2x V-O (1)
Figure 5-7 Experimental (solid) V K edge FT(χ(k)k3) of dehydrated VxOySBA-15 (77 wt) together with theoretical XAFS functions (left ldquoisolated VO4rdquo model middle addition of a V-Si path to the ldquoisolated VO4rdquo model right addition of support oxygen to ldquoisolated VO4rdquo model) Insets show the [VO4] tetrahedron (left) and a schematic representation of the V-Si path employed (middle) Also shown are the Fourier transformed χ(k)k3 of the individual scattering paths together with the corresponding coordination number in brackets
78
Thus to simulate this contribution a V-O distance originating from the triclinic Mg2V2O7 [139] at 28 Aring
was added to the refinement The result of the XAFS refinement is shown in Figure 5-7 (right) The
extended refinement procedure resulted in a better agreement between the theoretical XAFS function of
the model structure and the FT(χ(k)k3) of dehydrated VxOySBA-15 However for distances higher than
3 Aring the refinement of the FT(χ(k)k3) of dehydrated VxOySBA-15 was still not sufficient
528 Local structure of dehydrated VxOySBA-15 ndash XAFS refinement of ldquoV2O7ldquo based model
structures
Figure 5-7 shows that an ldquoisolated VO4ldquo model did not properly describe the local structure between 2 Aring
and 4 Aring around vanadium centers in dehydrated VxOySBA-15 Hence considering the results from UV-
Vis-DRS it was assumed that at least ldquoV2O7 dimersrdquo would be needed to achieve a good agreement
between theoretical and experimental XAFS FT(χ(k)k3) [V2O7] units are present in the structures of the
references NH4VO3 and triclinic Mg2V2O7 whose spectra resembled the XANES and EXAFS spectra of
dehydrated VxOySBA-15 (Figure 3 and Figure 5-5) Therefore a V-V scattering path at 34 Aring was
included in the model used for the XAFS refinement This distance corresponds to the V-V distance
between two corner-sharing [VO4] tetrahedrons in ldquoV2O7 dimersrdquo of NH4VO3 and Mg2V2O7 The result of
the corresponding XAFS refinement is shown in Figure 5-8 Apparently a structural model based on
isolated [V2O7] dimers was equally unsuited to describe the local structure around V centers in
dehydrated VxOySBA-15 The agreement between theoretical and experimental FT(χ(k)k3) in the range
from 2 to 4 Aring is still not sufficient (Figure 5-8 left) Also adding a V-Si distance to this ldquoisolated V2O7
dimer modelrdquo only resulted in a minor improvement of the refinement (not shown)
V+5O-2V+5
O-2
00
005
-005
FT
(χ(k
)k3 )
0 2 4 6R [Aring]
0 2 4 6 R [Aring]
0 2 4 6R [Aring]
V-O (2) 2x V-O (1)
V-V (1) V-V (1) V-O (1) V-Si (1)
V-O (2) 2x V-O (1)
V-V (1) V-V (1)
V-O (1)
V-O (2) 2x V-O (1)
V-V (2)
Si
Figure 5-8 Experimental (solid) V K edge FT(χ(k)k3) of dehydrated VxOySBA-15 (77 wt) together with a theoretical XAFS function (ie ldquoordered arrangement of V2O7rdquo model) Fit results are given in Table 5-3 The inset shows a schematic representation of the arrangement of V2O7 units in Mg2V2O7 Also shown are the Fourier transformed χ(k)k3 of the individual scattering paths together with corresponding coordination number in brackets
79
Figure 5-7 and Figure 5-8 (left) clearly show that neither an ldquoisolated VO4rdquo model nor an ldquoisolated
V2O7rdquo model describe the local structure of the majority of V centers in dehydrated VxOySBA-15
properly Hence in the next step an ordered arrangement of neighboring [V2O7] units was assumed
Because of their similar XANES and EXAFS spectra we again referred to NH4VO3 and triclinic
Mg2V2O7 as references [V2O7] units form chains in NH4VO3 with one V-V distance Conversely [V2O7]
units are neighboring but more separated in t-Mg2V2O7 resulting in two distinct V-V distances (ICSD
2321 [139]) Accordingly two additional scattering paths were added to the previous ldquoisolated V2O7rdquo
model These two paths correspond to V-O (28 Aring) and V-V (36 Aring) distances between two neighboring
[V 2O7] units in the structure of t-Mg2V2O7 The result of the corresponding XAFS refinement to the
FT(χ(k)k3) of dehydrated VxOySBA-15 is shown in Figure 5-8 (middle) together with the various V-O
and V-V distances used Apparently assuming neighboring [V2O7] units in an ordered arrangement
supported on SBA-15 yielded a good agreement between theoretical and experimental FT(χ(k)k3) of
dehydrated VxOySBA-15 over the extended R range from 1 Aring to 4 Aring The structural and fitting
parameters obtained from the XAFS refinement to the experimental FT(χ(k)k3) of dehydrated
VxOySBA-15 and triclinic Mg2V2O7 are given in Table 5-3 and Table 5-4 The similar V-O distances V-
V distances and σ2 parameters of dehydrated VxOySBA-15 and t-Mg2V2O7 corroborated our choice of
model system to describe the local structure around V centers in dehydrated VxOySBA-15
00
005
01
015
02
025
03
-005
0 2 4 6
FT
(χ(k
)k3 )
R [Aring]
41 wt VSBA-15
14 wt VSBA-15
77 wt VSBA-15
Figure 5-9 left Experimental (solid) V K edge FT(χ(k)k3) of dehydrated VxOySBA-15 (14 wt 41 wt and 77 wt) together with a theoretical XAFS function The fit results are given in Table 5-5 right Schematic structural representation of dehydrated VxOySBA-15 The most prominent distances employed in the XAFS refinement procedure are indicated
529 Schematic structural representation of dehydrated VxOySBA-15
A schematic structural representation of the ordered arrangement of [V2O7] units in dehydrated
VxOySBA-15 is depicted in Figure 5-9 (right) In contrast to previous results on low loaded (lt 1 Vnm2)
VxOySiO2 samples [21121] it is concluded that isolated [VO4] units are not the major vanadium oxide
species present in the dehydrated VxOySBA-15 samples studied here Of the different loadings studied
80
only the 14 wt VxOySBA-15 sample possessed a vanadium content of less than 05 Vnm2 The three
dehydrated VxOySBA-15 samples exhibited only minor differences in their XANES spectra (Figure 5-3)
FT(χ(k)k3) (Figure 5-9) and XAFS fit results (Table 5-5) Similar results were obtained for a 28 wt
sample prepared by Hess et al [41] Hence in the range of 28ndash 77 wt V on SiO2 the local structure of
the majority of V centers in dehydrated VxOySBA-15 is best described by an ordered arrangement of
neighboring [V2O7] units (Table 5-5 Figure 9) The presence of non-monomeric VxOy species in
dehydrated VxOySBA-15 samples was concluded recently based on NEXAFS studies combined with
theoretical calculations [4243] However the highly dispersed 14 wt VxOySBA-15 sample leaves
some ambiguity Concerning the low CVB number of 04 determined from the UV-Vis edge energy it
may be possible that a lower connectivity of VxOy or even isolated [VO4] tetrahedrons were present on
the SiO2 support In the corresponding refinement (Table 5-5) higher σ2 were obtained for the V-O and
V-V distances and a decreased σ2 for the V-Si distance was obtained for the dehydrated 14 wt
VxOySBA-15 sample compared to samples with higher loadings Thus the low vanadium loading caused
an increased disorder of the VxOy structure motifs on the support Comparing the V-O distances no
significant change was obtained for the different loadings Thus a change of the distortion of the [VO4]
tetrahedrons and the primary structure of dehydrated VxOySBA-15 was not observed with increasing
dispersion Furthermore a decreased amplitude in the FT(χ(k)k3) was observed for the second feature at
higher distances (~ 3-4 Aring)This indicates that the influence of higher V-V distances is less pronounced
Moreover it may be possible that isolated [VO4] tetrahedrons are present on the support together with a
dimeric tetrahedral species
Oxygen and silicon atoms of the SiO2 support are not depicted in the schematic representation shown in
Figure 5-9 (right) In particular Si atoms in the topmost layer of SiO2 belong to the second coordination
sphere of the V centers
Table 5-5 Type and number (N) of atoms at distance R from the absorbing V atom in a model system assuming an ordered arrangement of [V2O7] units (Figure 5-9 right) compared to experimental distances and XAFS disorder parameters (σ2) The parameters were obtained from the refinement of this model structure to the experimental V K edge XAFS FT(χ(k)k3) of dehydrated VxOySBA-15 with different V loadings (ie 77 wt 41 wt 14 wt ) (Figure 5-9 left) (k range from 27-105 Aring-1 R range 084-362 Aring Nind = 16 Nfree = 8 E0 = 0 eV in all cases fit residual 38 (77 wt) 70 (41 wt) 56 (14 wt)) (subscript c indicates parameters that were correlated in the refinement subscript f indicates parameters that were fixed in the refinement) Confidence limits and significance of fit parameters correspond to those given in Table 5-4 for the 77 wt sample
dehyd 77 wt dehyd 41 wt dehyd 14 wt
Type N Rmodel [Aring] R [Aring] σ2 [Aring2] R [Aring] σ2
[Aring2] R [Aring] σ2 [Aring2]
V - O 1 163 178 00079 178 00088 178 001
V - O 1 170 178 c 00079 c 178 00088 c 178 c 001 c
V - O 2 176 178 c 00079 c 178 00088 c 178 c 001 c
V - O 1 287 289 00012 f 290 0003 f 287 0003 f
V - V 1 342 329 00116 330 00119 335 00129
V - V 1 362 360 00116 c 361 00119 c 361 00129 c
V - Si 1 280 254 0013 255 00118 251 00109
81
Previous reports have indicated that V-Si distances may contribute to the experimental FT(χ(k)k3) of
dehydrated VxOySBA-15 [37] Therefore a single V-Si scattering path was included in the refinement of
the ldquoneighboring V2O7rdquo model described above (Figure 5-8 right) The structural parameters and
refinement details are given in Table 5-3 and Table 5-4 Comparing fit residuals confidence limits and F
parameters a significant improvement was observed Concerning the low distance of the V-Si
contribution an angle between V and Si (V-O-Si) of about 90 deg has to be present This may explain the
high average V-O bond length and the distortion of the dehydrated VxOySBA-15 structure as concluded
from the XANES analysis (177 Aring) and XAFS refinement (178 Aring) Apparently both the local structure
in VxOy species and the interaction with the SiO2 support are required to describe the FT(χ(k)k3) of
dehydrated VxOySBA-15 samples
5210 Limitations of the XAFS analysis of dehydrated VxOySBA-15
Eventually the limitations of the XAFS analysis of dehydrated VxOySBA-15 presented here should be
discussed XAFS is not a very sensitive technique with respect to distinguishing and identifying
additional minority species Experimental XAFS spectra are clearly dominated by the signal of the
majority phase Hence the presence of minority vanadium oxide species in dehydrated VxOySBA-15
with concentrations of less than ~5 cannot be excluded Only if the contribution of additional phases
amounts to more than ~5-10 will the distortion of the FT(χ(k)k3) and the deviation from the model
structure assumed be detectable In particular this holds if these minority species happen to be less
ordered than the majority phase
Moreover XAFS is an averaging technique Certainly higher shells should be taken into account
properly and various references should be measured for comparison Even then however it may remain
difficult to distinguish unambiguously between mixtures of various species or structures Hence a more
detailed discussion concerning the vicinity of different vanadium oxide species needs to be performed
Some constraints have to be made when an equal mixture of isolated [VO4] and neighboring [V2O7] units
is assumed for the high dispersion sample First the V-O distances in the first ldquoVO4rdquo shell of the two
species would have to be the same which was obtained by the refinement (Table 5-5) Otherwise a strong
reduction in amplitude of the first V-O peak in the FT(χ(k)k3) caused by destructive interference would
be discernible Secondly isolated [VO4] would not contribute to the FT(χ(k)k3) in the range from 2 Aring to
4 Aring Thus reduction in amplitude and much higher σ2 parameters compared to the t-Mg2V2O7 reference
would be detectable This was not observed in the EXAFS analysis of the dehydrated VxOySBA-15
presented here (Table 5-3 and Table 5-5) A similar statement holds for isolated [V2O7] units or a less
ordered arrangement of neighboring [V2O7] units Both would result in a reduction in the FT(χ(k)k3)
amplitude because of missing contributions in the 2-4 Aring range or destructive interference caused by a
broadened distribution of distances respectively Moreover for isolated or less ordered [V2O7] units a
single V-V distance would suffice to describe the experimental XAFS spectrum However a partial
reduction in amplitude in the range of 2-4 Aring was observed for the low loaded 14 wt dehydrated
82
VxOySBA-15 sample (Figure 5-9 left) Furthermore the refinement procedure employed did not allow
the variation of the σ2 of both vanadium distances independently Thus it cannot be excluded that isolated
VxOy species (besides dimeric) were also present on the dehydrated 14 wt VxOySBA-15 sample
especially if the low CVB number of 03 is taken into account For higher loadings the fitting procedure
has shown that an ordered arrangement of ldquoorderedrdquo dimeric VxOy clusters without the presence of
isolated species is more likely than a mixture of isolated and dimeric vanadium centers This is supported
by an average CVB number of 10 obtained from the UV-Vis edge energy together with the position of
the absorption band at 309 nm (Table 5-2) Eventually higher V-Si distances may have to be considered
in addition to the V-Si distance of ~25 Aring (Table 5-3) However a significant contribution of V-Si
distances in the range above 30 Aring in the FT(χ(k)k3) would require a highly ordered arrangement of
VxOy species on the SiO2 support and a very narrow distance distribution This seems to be unlikely
In summmary assuming a structural arrangement of vanadium centers in dehydrated VxOySBA-15 that
has already been established for reference vanadium oxides (ie t-Mg2V2O7) is simple and results in a
good agreement with experimental data More complex and artificially constructed arrangements of VxOy
species supported on SiO2 may be conceivable but appear to be less likely Both UV-Vis-DRS and XAFS
analysis corroborate a local structure around the majority of V centers in dehydrated VxOySBA-15
similar to the ordered arrangement of neighboring [V2O7] dimers in the structure of t-Mg2V2O7 for
loadings in the range of 28-77 wt dehydrated VxOySBA-15 With increasing dispersion (lt 05 Vnm2)
isolated centers may be present
5211 Local structure of hydrated VxOySBA-15 - Comparison to V oxide references
The EXAFS χ(k)k3 of hydrated VxOySBA-15 (as-prepared) with different V loadings are depicted in
Figure 5-10 left The usable spectral range extended from 27 Aring through 11 Aring-1 for the 77 wt sample
The EXAFS χ(k)k3 of the lower loaded samples was limited to 27 to 105 Aring-1 because of the high noise
level The V K edge FT(χ(k)k3) of hydrated VxOySBA-15 are shown in Figure 5-10 (middle) The
Fourier transformed χ(k)k3 and the V K near edge spectra of hydrated VxOySBA-15 are compared to
those of vanadium oxide references in Figure 5-10 (right) The range of potential model structures
describing the local structure of hydrated VxOySBA-15 can be narrowed down by comparing the
corresponding FT(χ(k)k3) Considering peak positions and relative peak heights in the FT(χ(k)k 3) it
appears that from the references available the FT(χ(k)k 3) of V2O5 and CaV2O6 resemble that of hydrated
VxOySBA-15 However from the detailed comparison the corresponding XANES spectrum of V2O5
seemed to be more suitable than that of CaV2O6 Compared to V2O5 hydrated VxOySBA-15 may possess
a more disordered structure because of the lower intensity in the FT(χ(k)k3) On the one hand the
positions of the various peaks in the XANES of hydrated VxOySBA-15 are similar to that of V2O5
(Figure 5-3 top right) On the other hand the lower peak intensities the FT(χ(k)k 3) are indicative of a
disordered V2O5 like structure of the vanadium oxide species in hydrated VxOySBA-15 (Figure 5-10
right) Therefore the local structure of V2O5 was used for further structure refinement
83
00
50
100
150
200
4 6 8 10
k [Aring-1]
41 wt VSBA-15
14 wt VSBA-15
77 wt VSBA-15
V2O5 χ(
k)k3
005
01
0 2 4 6
R [Aring]
41 wt VSBA-15
14 wt VSBA-15
77 wt VSBA-15
V2O5
FT
(χ(k
)k3 )
01
02
03
0 2 4 6
R [Aring]
77 wt VSBA-15
V2O5
CaV2O6
MgV2O6
(NH4)6V10O28middotH2O
Mg3V10O28middotH2O
FT
(χ(k
)k3 )
Figure 5-10 V K edge FT(χ(k)k3) of hydrated VxOySBA-15 (77 wt) compared to those of various references (eg V2O5 and MgV2O6) and the FT(χ(k)k3) and χ(k)k3 of hydrated VxOySBA-15 samples with different vanadium loadings (14 wt 41 wt and 77 wt)
5212 Local structure of a square pyramidal vanadium oxide cluster - XAFS refinement of a
ldquoV 2O5ldquo model structure
Comparison of the XANES and FT(χ(k)k3) of hydrated VxOySBA-15 with those of various references
identified V2O5 as the most suitable model structure for a detailed EXAFS analysis Therefore a
theoretical XAFS function calculated on the basis of a V2O5 model structure (ICSD 60767 [140]) was
refined to the experimental FT(χ(k)k3) of hydrated VxOySBA-15 Before the ldquolocal V2O5rdquo model was
applied to hydrated VxOySBA-15 the V2O5 model structure was refined to the FT(χ(k)k3) of V2O5 to
validate the procedure chosen Good agreement between the theoretical XAFS function of a V2O5 model
structure and the FT(χ(k)k3) of V2O5 was obtained (Figure 5-11) As described above the validity of the
XAFS analysis approach chosen was evaluated by calculating confidence limits and F parameters (Table
5-6) The model structure employed corresponds to the local structure around V centers in bulk V2O5
(Figure 5-11 right) In fitting procedure 1 three V-O distances (16 Aring 18 Aring and 20 Aring) and two σ2
(one for R = 16 Aring and one for all other V-O distances) in the first V-O shell were allowed to vary
independently Additionally three V-V distances (31 Aring 34 Aring and 36 Aring) with the same σ2 were refined
Moreover E0 was also allowed to vary in fitting procedure 1 Again because of Nind = 17 and Nfree = 10
the refinement procedure 1 would be considered reliable according to the Nyquist criteria Reasonable F
values (F lt 02) were calculated for the V-V distances and the σ2 (V-V) parameter However rather high
confidence limits of the V-O and V-V distances of plusmn 03 Aring and a F parameter of 08 for the first σ2 (V-O)
parameter were obtained with procedure 1 Moreover E0 exhibited a confidence limit of plusmn 05 and
F = 06 Hence fitting procedure 1 clearly exceeds the number of meaningful parameters Therefore the
fitting procedure was modified and the number of free parameters was reduced E0 was kept invariant
again in the refinement and only one σ2 (V-O) parameter was used
84
00
002
004
-002FT
(χ(k
)k3 )
)
00
002
004
-002FT
(χ(k
)k3 )
)
0 2 4 6
R [Aring]
Procedure 2
Procedure 3
Figure 5-11 Experimental (solid) V K edge FT(χ(k)k3) of V2O5 (left) together with theoretical XAFS functions (V2O5 model red lines refer to the V-O scattering path black lines refer to the V-V scattering paths) and a representation of the structural V2O5 model (right) Prominent distances employed in the XAFS refinement procedure are indicated
In contrast to procedure 1 procedure 2 yielded reasonable confidence limits (eg plusmn 001 for V-O
distances) and acceptable F parameters (mostly F=0) The theoretical local structure of V2O5 from
refinement procedure 1 and 2 represents the local structure motif of connected square pyramids in
V2O5 These square pyramids are connected via edges and are within the layers of the V2O5 structure
(Figure 5-11 right) In order to test if it is necessary to assume a layered structure to fully describe the
local structure of crystalline V2O5 the refinement procedure was extended by a fourth V-O distance at
~ 28 Aring (procedure 3) From Table 5-6 it is obvious that a reasonable refinement with low confidence
limits and acceptable F parameters (all F=0) was obtained
Table 5-6 V K edge XAFS parameters (Z for distances R and disorder parameter σ2) obtained from two different procedures of fitting a model structure (ie V2O5) to the experimental XAFS FT(χ(k)k3) of the V2O5 reference together with confidence limits (plusmn z referring to 95 of fit residual) and significance parameter F (details given in text)
Procedure 1 Procedure 2 Procedure 3
Pair N Z plusmnz F Z plusmnz F Z plusmnz F
R(V - O) 1 158 0327 -- 159 0009 -- 159 0008 --
σ2(V - O) 00076 008 08 00077 00004 -- 00081 00003 --
R(V - O) 3 187 013 -- 188 0003 -- 188 0003 --
σ2(V - O) 00087 00004 -- -- -- -- -- -- --
R(V - O) 1 201 013 -- 203 002 01 202 002 --
R(V - O) 1 -- -- -- -- -- -- 272 002 --
R(V - V) 2 313 005 -- 313 001 -- 313 0005 --
σ2(V - V) 00056 00003 -- 00057 00003 -- 00058 00003 --
R(V - V) 2 342 010 02 342 002 -- 342 002 --
R(V - V) 1 364 008 -- 364 001 -- 363 001 --
E0 28 05 06 28f -- -- 28f -- --
Residual 88 87 71
85
Moreover Figure 5-11 shows that the resulting theoretical FT(χ(k)k 3) of V2O5 from procedure 3 was
more similar to the experimental one for intermediate distances (2-3 Aring) than the one obtained from
procedure 2 Evidently the assumption of a layered structure is necessary for a good description of the
local structure of the V centers in crystalline V2O5
5213 Local structure of hydrated VxOySBA-15 ndash XAFS refinement of a ldquoV2O5ldquo based model
structure
Applying the refinement procedure introduced above to hydrated VxOySBA-15 resulted in good
agreement between the theoretical XAFS function of a V2O5 model structure and the FT(χ(k)k3) of
hydrated VxOySBA-15 (Figure 5-12 left) However an increased F parameter and a strongly shifted
V-O distance at 31 Aring with a rather high confidence limit was obtained (Table 5-7 procedure SBA1)
Therefore this distance was not seen as meaningful for describing the local structure of hydrated
VxOySBA-15 The structure of hydrated VxOySBA-15 seems to be less extended than the layered V2O5
structure
00
00
-002
FT
(χ(k
)k3 )
0 2 4 6 0 2 4 6
R [Aring]
0 2 4 6
R [Aring]R [Aring]
Procedure
SBA1
Procedure
SBA3
Procedure
SBA4
Figure 5-12 Experimental (solid) V K edge FT(χ(k)k3) of hydrated VxOySBA-15 (77 wt) together with theoretical XAFS functions The procedures refer to the subsequent reduction of the theoretical V2O5 model Details are provided in the text and the fit results are given in Table 5-7 Also shown are the Fourier transformed χ(k)k3 of the individual scattering paths together with the corresponding coordination number in brackets
Removing the V-O contribution at 28 Aring from the V2O5 model structure resulted in a higher R value of
the refinement (Table 5-7 procedure SBA2) Apparently the local structure of hydrated VxOySBA-15
is similar to that of V2O5 but not identical To improve the structure model used for the refinement of
hydrated VxOySBA-15 the number of V-V distances was reduced In procedure SBA3 the V-V distance
of 342 Aring was neglected This distance is found between two V centers in the V2O5 structure which are
only connected to each other via the corner of [VO5]x square pyramids (Figure 5-11 right) This V-V
distance is not found in the structure of ternary vanadates such as CaV2O6 which are also built from
square pyramidal units like V2O5
86
Table 5-7 V K edge XAFS parameters (Z for distances R and disorder parameter σ2) obtained from four different procedures of fitting a model structure (ie V2O5) to the experimental XAFS FT(χ(k)k3) of hydrated VxOySBA-15 (77 wt) (details of fit given in Table 5-8) together with the confidence limits (plusmn z referring to 95 of fit residual) and the significance parameter F (details given in text)
Procedure SBA1 Procedure SBA2 Procedure SBA3 Procedure SBA4
Pair N Z plusmnz F Z plusmnz F Z plusmnz F Z plusmnz F
R(V - O) 1 162 001 -- 163 001 -- 162 002 -- 163 001 --
σ2(V - O) 00105 00003 -- 00106 00003 -- 00104 00005 -- 00105 00003 --
R(V - O) 3 188 0003 -- 188 0003 -- 188 0004 -- 188 0003 --
R(V - O) 1 197 002 03 197 002 04 198 003 -- 198 002 03
R(V - O) 1(-) 307 006 06 -- -- -- -- -- -- -- -- --
R(V - V) 2 307 001 -- 307 0006 -- 306 001 -- 308 0006 --
σ2(V - V) 00121 00005 -- 00114 00005 -- 00114 00005 -- 00087 00004 --
R(V - V) 1(-) 342 003 01 343 003 02 -- -- -- 333 002 --
R(V - V) 2(1) 366 002 -- 366 002 -- 366 002 -- 360 002 --
E0 0f -- -- 0f -- -- 0f -- -- 0f -- --
Residual 85 100 147 86
As shown in figure Figure 5-12 (middle) and Table 5-7 the reduced refinement procedure SBA3
resulted in a rather weak agreement between the theoretical XAFS function of the model structure and the
FT(χ(k)k3) of hydrated VxOySBA-15 This was expected from the lower similarity found in the XANES
spectra of hydrated 77 wt VxOySBA-15 and CaV2O6 (Figure 5-3 top right) Moreover from the UV-
Vis-DR spectra (Figure 5-2 left ) an average V-O-V number of 30-35 was determined for the hydrated
VxOySBA-15 samples This indicated that the local structure of hydrated VxOySBA-15 was more similar
to square pyramidal [VO5]x chains than to a layered structure of square pyramidal vanadium centers like
in V2O5 (V-O-V number = 5) Therefore the refinement SBA3 was modified by separating the single V-
V distance at ~ 36 Aring with a coordination number of 2 into two individual distances of 34 and 36 Aring each
exhibiting a coordination number of 1 As shown in Figure 5-12 (right) and Table 5-7 this refinement
procedure (SBA4) resulted in a better residual low confidence limits and mostly zero F parameters
Hence it is assumed that the local structure of hydrated VxOySBA-15 can be described by a chain-like
square pyramidal [VO5]x structure However the differences between model structures assumed for the
local structure of V2O5 and hydrated VxOySBA-15 are small As shown in Figure 5-13 (bottom left) it
was possible to describe V2O5 with the reduced structure model applied to hydrated VxOySBA-15
(Figure 5-13 right) Details of the resulting parameters are given in Table 5-8 Higher R values and
increased F parameters (F=06) for the refinement of V2O5 indicate that procedure SBA4 is not sufficient
for describing the V2O5 structure Nevertheless the disorder parameters σ2 for the V-O and V-V scattering
paths used in the XAFS refinement increased for hydrated VxOySBA-15 compared to the V2O5 reference
(Table 5-8) This indicates an increased disorder in the local structure of hydrated VxOy species supported
on SBA-15 compared to bulk V2O5 The structural similarity between hydrated vanadium oxide species
supported on SiO2 and V2O5 has previously been observed by Raman spectroscopy [117] Evidently the
local structure of hydrated VxOySBA-15 used here is very similar to other materials described previously
in the literature [23117]
87
00
002
00
-002
FT
(χ(k
)k3 )
00
002
004
00
-002
0 2 4 6
FT
(χ(k
)k3 )
R [Aring]
77 wt VSBA-15
V2O5
Figure 5-13 left Experimental (solid) V K edge FT(χ(k)k3) of hydrated VxOySBA-15 (77 wt) (top) and of V2O5 (bottom) together with the theoretical XAFS functions Right A representation of the reduced V2O5 model structure used for the refinement The most prominent distances employed in the XAFS refinement procedure are indicated
In addition to the 77 wt VxOySBA-15 samples with lower loadings of 14 wt and 41 wt V were
measured (Figure 5-10) The amplitude of the FT(χ(k)k3) decreased with increasing dispersion
Especially in the range of 2-4 Aring a strong decrease of the amplitude was visible Hence the disorder
increased with decreasing V loading Similar trends were observed in UV-Vis-DR spectra (Table 5-2)
where the average CVB number decreased from 35 to 30 with decreasing loading Therefore a lower
degree of ldquohydrationrdquo was assumed for low loaded 14 wt VxOySBA-15 Apparently the degree of
hydration (V-V contribution) in the hydrated state depends on the vanadium dispersion Conversely in
the range of V loadings from ~ 14 to 77 wt the local structure of dehydrated VxOySBA-15 was largely
independent of the amount of vanadium oxide supported on SBA-15
Table 5-8 Type and number (N) of atoms at distance R from the V atoms in a V2O5 system compared to the experimental distances and the XAFS disorder parameter (σ2) The parameters were obtained from the refinement of a reduced V2O5 model structure (ICSD 60767 [140]) to the experimental V K edge XAFS FT(χ(k)k3) of hydrated VxOySBA-15 (77 wt) and bulk V2O5 (k range from 27 - 110 Aring-1 R range 09 - 38 Aring E0 (VxOySBA-15) = 00 eV E0 (V2O5) = 00 fit residual 86 (VxOySBA-15) and 125 (V2O5) Nind = 17 Nfree = 8) (subscript c indicates parameters that were correlated in the refinement) Confidence limits and significance of the fit parameters are given in Table 5-7
V2O5
hydrated 77 wt VxOySBA-15
Type N Rmodel [Aring] R [Aring] σ2 [Aring2] R [Aring] σ2
[Aring2] V - O 1 158 159 00073 163 00105 V - O 1 178 186 00073c 188 00105 c V - O 2 188 186c 00073 c 188 c 00105 c V - O 1 202 201 (F=06) 00073 c 198 (F=03) 00105 c V - V 2 308 311 00075 308 00087 V - V 1 342 353 (F=02) 00075 c 334 00087 c V - V 1 356 364 00075 c 361 00087 c
88
53 Summary
Both UV-Vis and X-ray absorption spectroscopy are very suitable techniques for studying the local
structure of dispersed metals or metal oxides on various support materials Here the local structure of
vanadium oxide supported on nanostructured SiO2 (SBA-15) was investigated Three samples with
different vanadium loadings (14 wt 41 wt and 77 wt V on SBA-15) were employed
For hydrated VxOySBA-15 a square pyramidal structure similar to V2O5 was assumed to be present
Compared to bulk V2O5 a lower degree of extension and higher distortion of the [VO5] vanadium centers
was inferred from the UV-Vis edge energy position and the XAFS refinement Thermal treatment in air at
623 K resulted in characteristic structural changes of the V oxide species UV-Vis-DRS and XAFS
measurements of dehydrated VxOySBA-15 showed that the local structure could be described by a model
structure consisting of an ordered arrangement of neighboring [V2O7] units in the range of 05-25 Vnm2
This is in good agreement with NEXAFS studies and theoretical calculations that also concluded the
presence of V-O-V bonds in the VxOy species supported on SBA-15 [4243] However at lower loadings
(lt 05 Vnm2) isolated [VO4] tetrahedrons besides dimeric tetrahedral structures may also be present A
similar trend was recently observed for low loaded MoxOySBA-15 samples [137] The influence of the
SiO2 support was not negligible and caused a high distortion of the tetrahedral vanadium oxide cluster in
dehydrated VxOySBA-15
The local structures of dehydrated VxOySBA-15 were found to be mainly independent of the V loading
over the range employed Conversely in hydrated VxOySBA-15 a decrease of the number of V-O-V
contributions in FT(χ(k)k3) and of the structural disorder of the hydrated square pyramidal vanadium
centers with increasing vanadium dispersion was observed A more detailed discussion about the
formation processes of hydrated and dehydrated VxOySBA-15 as a function of time and atmosphere will
be given in the next chapter
In contrast to conventional XAFS analysis an extended approach to evaluate the significance of structural
fitting parameters in XAS data analysis was employed After fitting the theoretical XAFS functions of a
suitable model structure to the experimental data confidence limits and F parameters were calculated to
identify suitable analysis procedures Because the number of parameters often exceeds the number of
ldquoindependentrdquo parameters evaluating the reliability and significance of a particular fitting procedure is
mandatory It was shown that the number of independent parameters (Nyquist) alone was not sufficient to
verify a reliable refinement procedure
89
6 Dynamic changes in the local structure of
VxOySBA-15 model catalysts in oxidative and water
saturated atmospheres
61 Introduction
In the previous chapter the structure of dehydrated and hydrated vanadium oxide supported on SBA-15
was discussed The hydrated structure was proposed to consist of chainlike square pyramidal vanadium
oxide centers The dehydrated vanadium oxide supported on SBA-15 was described by dimeric vanadium
oxide units with tetrahedral coordination of the vanadium centers For lower vanadium loadings
(lt 03 Vnm2) these centers may be present together with isolated tetrahedral centers However these
results represent only a picture of the vanadium oxide structure present on SBA-15 under static
conditions Because these samples were introduced as model catalysts it is crucial to know how the
transformation between the hydrated and dehydrated state proceeds under reaction conditions
In situ investigations of structural changes during thermal treatment have been subject of only a few
reports In situ IR and NIR measurements reported [232740114141142] a decrease of the isolated Si-
OH bonds with increasing vanadium loading The presence of V-OH bands (3660 cm-1) was reported for
hydrated and dehydrated VxOySiO2 samples In situ Raman [3234143] and UV-Vis-DRS [24144]
measurements showed that at temperatures above 473 K characteristic Raman bands and UV-Vis-DRS
absorption bands of the dehydrated state were present independent of the presence of water in the reaction
atmosphere Furthermore it was reported that hydration and dehydration processes were reversible
[2435145] In contrast Xie et al [34] reported the formation of V2O5 crystallites after repeated
hydration and dehydration of samples with dispersed vanadium oxide species below the monolayer
coverage (25 Vnm2) They assumed that V2O5middotnH2O gels were formed during the hydration process
which decomposed to V2O5 clusters and served as ldquonucleirdquo for the growth of crystalline V2O5 Raman
[23] IR [23115141] and MAS NMR [146] measurements indicated that some of the silanol groups of
SiO2 are consumed during formation of the dehydrated state and that the respective tetrahedral vanadium
oxide species is linked via V-O-Si bonds to the support
Given these diverse results on the dehydration process found in the literature it was intended to
investigate the dehydration process of VxOySBA-15 in more detail here Therefore the evolution of the
vanadium oxide structure on SBA-15 was investigated during temperature programmed reaction in
oxygen containing atmospheres using UV-Vis-DRS XAS and Raman spectroscopy Furthermore the
impact of the vanadium loading and the influence of water vapor on the hydration and dehydration
process were investigated
90
62 Results and discussion
621 Impact of pretreatment temperature on dehydrated VxOySBA-15 phase
Various temperatures for the oxygen pretreatment process (dehydration process) were reported in the
literature They range from rather low temperatures of 573 K [35146] and 623 K [32] up to 773 K [23]
853 K [141] and 1073 K [40] Therefore various pretreatment temperatures were tested for dehydration
of the VxOySBA-15 samples In Figure 6-1 the FT(χ(k)k3) and UV-Vis-DR spectra of 77 wt
VxOySBA-15 dehydrated at different temperatures in the range of 554-773 K are shown (20 O2 in He)
The UV-Vis-DR spectra of 77 wt VxOySBA-15 treated at 554 K and 626 K showed only a small blue
shift of a few nm of the UV-Vis absorption edge with increasing temperature (Figure 6-1 left) The blue
shift in the UV-Vis-DR spectra did not affect the average V-O-V number of ~ 1 (dimeric tetrahedrons)
determined from the UV-Vis edge energy The experimental FT(χ(k)k3) of 77 wt VxOySBA-15
treated at 623 K 723 K and 770 K (Figure 6-1 right) showed only minimal differences and they were
simulated successfully using the model structure of dehydrated VxOy (ordered arrangement of [V2O7]
units introduced in Chapter 5) The amplitude of the fist V-O shell at 178 Aring in the FT(χ(k)k3) of
77 wt VxOySBA-15 increased after calcination at 770 K for 8 h compared to dehydration at 623 K for
30 min The disorder parameter σ2 of the V-O scattering path decreased from 00071 Aring2 to 00063 Aring2 with
increasing dehydration temperature (Table 6-3 Table 6-4 page 104 and 106) This indicates a wider V-O
distance distribution and thus a slightly increased structural order of the first V-O coordination sphere
Apparently above a certain temperature the dehydrated state of vanadium oxide on mesoporous SiO2 is
present with only small changes in average V-O bond length and structural order Higher temperatures
than 773 K were not investigated because of the upper temperature limits of the in situ cells used
0
15
5
10
220 600300 400 500
F(R
infin)
Wavelength [nm]
626 K 1 h
554 K 30 min005
01
015
02
0 2 4 6
R [Aring]
FT
(χ(k
)k3 )
623 K 30 min
723 K 1 h
770 K 8 h
Figure 6-1 Left UV-Vis-DR spectra of 77 wt VxOySBA-15 dehydrated at different temperatures All spectra were recorded at 298 K Right V K edge FT(χ(k)k3) of 77 wt VxOySBA-15 after different dehydration procedures The dehydration was performed in 20 O2 in He
91
A more detailed knowledge of the dehydration process was obtained from in situ XAS and UV-Vis-DR
spectra recorded during temperature treatment The UV-Vis-DRS measurements are depicted only for
14 wt VxOySBA-15 and the XAS results only for 77 wt VxOySBA-15 Dehydration experiments
were conducted for all loadings (14 41 77 wt V on SiO2) using both spectroscopic methods The
results were similar for all loadings employed (Figure 6-2)
622 Dehydration process investigated by in situ UV-Vis-DRS
In situ UV-Vis-DR spectra of 14 wt VxOySBA-15 during dehydration and the evolution of the water
ion current (me 18) are depicted in Figure 6-2 left Immediately after starting to heat the sample a
change in the UV-Vis-DR spectra was visible (294-400 K) which was accompanied by an increased
formation of water The intensity of the absorption maximum at ~ 365 nm decreased which caused a blue
shift of the UV-Vis absorption edge A direct correlation between UV-Vis edge energy and vanadium
structure as discussed in Chapter 523 was not made because of the temperature broadening of the UV-
Vis-DR spectra Typically a red shift of the UV-Vis edge energy of 01- 02 eV was observed for V2O5
and magnesium vanadate references during heating to 657 K However the strong blue shift of the UV-
Vis edge energy between 294 K and 400 K indicates that changes in coordination geometry of the
absorbing vanadium centers from square pyramidal to tetrahedral proceeded mainly in this temperature
range A red shift to 286 nm and an increase in intensity were observed for the second absorption band at
260 nm in the UV-Vis-DR spectra At temperatures above 550 K a slight decrease of this band was
detected The increase in intensity of the band at 286 nm was enhanced after the low energy band at
365 nm nearly disappeared In the temperature range (400-540 K) where the absorption band at 286 nm
reached its maximum a second step of water formation was observed
300 350 400 450 500 550 600
250
300
350
400
450
Norm
alized Ion Current m
e 18
0 04 07 10 14 17 21 24 28 31 35 38 42 45
Temperature [K]
Wav
elen
gth
[nm
] 10
20
30
40
250 350
λ [nm]
450 550
F(R
infin)
F(Rinfin)
00
025
05
075
10
00
545 55
555 56
565
300 350
400 450
500 550
600 Nor
mal
ized
Abs
orpt
ion
Photon Energy [keV] Temp [K]
Figure 6-2 Left in situ UV-Vis-DR spectra of the 14 wt VxOySBA-15 sample and the water ion current me 18 (554 K 4 Kmin 20 O2 in He) during dehydration The inset shows the 2D spectra depicted in the 3D color map Right V K edge in situ XANES spectra during dehydration of the 77 wt VxOySBA-15 sample (623 K 5 Kmin 20 O2 in He E4 Beamline)
92
623 Dehydration process investigated by in situ XAS
The V K edge XANES spectra of 77 wt VxOySBA-15 recorded during dehydration (298-623 K
5 Kmin 20 O2 in He) are shown in Figure 6-2 right Similar to the changes observed in the UV-Vis-
DR spectra of 14 wt VxOySBA-15 significant changes were observed directly after starting the
temperature treatment (298-440 K) Apparently the characteristic XANES spectra of hydrated
VxOySBA-15 changed rapidly into a XANES spectrum which was characteristic for the dehydrated state
of VxOySBA-15 (Chapter 524) The strong decrease of the first absorption feature between 5487 and
5497 keV in the spectrum of hydrated VxOySBA-15 was indicative for this transformation In the
temperature range from 298 to 440 K a strong formation of water as reported for the UV-Vis-DRS
mesurement was observed (data not shown) At temperatures above 440 K no distinct changes above the
V absorption edge were detected in the XANES spectra of 77 wt VxOySBA-15
The results of a principal component analysis (PCA) of the XANES spectra are shown Figure 6-3 Two
components were identified to be present in the in situ XANES spectra recorded during the dehydration
This was inferred from the minimum of the indicator value and the RCN product (product of residual
and component number) of the second component Hence dehydration proceeded directly from the
hydrated state to the dehydrated state of VxOySBA-15 and no intermediate phases were formed
Therefore the XANES spectra of hydrated and dehydrated 77 wt VxOySBA-15 were assigned to the
two phases obtained Evolution of the resulting phase fractions is depicted in Figure 6-3 together with the
V K pre-edge peak height and position (referred to V K edge 5465 eV) The pre-edge peak intensity
increased immediately with increasing temperature and reached a constant value at 550 K The intensity
increase seemed to correlate with the increasing fraction of the dehydrated phase during thermal
treatment
321 392 465 533 605 623 623
00
02
04
06
08
10 ramp
Fra
ctio
n of
Pha
se
Temperature [K]
054
056
058
060
062
064
Norm
V K
Pre-edge P
eak Height
555
560
565
570
V K
Pre-edge P
eak Position [eV
]
Figure 6-3 Evolution of the V K pre-edge peak height () and energy position () together with
the resulting concentration of the hydrated () and dehydrated () phase of 77 VxOySBA-15 derived from the XANES spectra depicted in Figure 6-2 right (623 K 5 Kmin 20 O2 in He E4 beamline)
93
16 17 18 19 2004
06
08
10
12
-H2O
hydrated V
xO
ySBA-15
dehydratedV
xO
ySBA-15)
Nor
mV
K P
re e
dge
Pea
k H
eigh
t
Average V-O Bond Length R [Aring]
170 175 180 185 190 195
46
48
50
52
54
56
58
60V
2O
5
tetrahedral
squarepyramidal
octrahedral
peak maximumcentroid energy
dehyd
hyd
Pre
-edg
e P
eak
Pos
ition
[eV
]
Average V-O Bond Lentgh R [Aring]
Figure 6-4 V K edge pre-edge peak height as a function of average V-O bond length (left) and relative energy position and centroid energy (right) of vanadium oxide reference compounds measured at A1 beamline The values determined for dehydrated and hydrated 77 wt VxOySBA-15 are indicated as lines (symbols as in Figure 5-4 Chapter 524 details Table 10-4)
The energy position decreased in the temperature range from 298 K to 440 K and remained constant
above 440 K In contrast to the evolution of the pre-edge peak height no direct correlation of the energy
position with the evolution of the VxOySBA-15 phases was observed
In Chapter 524 the linear correlation between the pre-edge peak height and the average length of V-O
distances was discussed Only the pre-edge peak height was used here and not the product of the pre-edge
peak area and height (Figure 6-4 left) The reason behind this was that the spectra shown in
Chapter 524 were recorded at beamline A1 whereas the spectra shown here were measured at different
beamlines (A1 C E4 Hasylab) Small differences in the resolution of the beamline spectrometer cause
small differences in the XANES spectra For instance the pre-edge peak height of dehydrated 77 wt
VxOySBA-15 was 064 at beamline E4 and 074 at beamline A1 Due to the fact that not all references
shown in Figure 6-4 were available on all beamlines the linear function (52) was not derived for all data
sets and applied to the XANES spectra in Figure 6-2 right (E4 beamline) Nevertheless the pre-edge
peak height showed a linear dependence with the average V-O bond length as depicted in Figure 6-4 left
(beamline A1) Referring to Chapter 524 the pre-edge peak height represents the average bond length
of the V-O distance in the first coordination sphere Given this relation appears that a continuous decrease
of the average bond length took place during the dehydration process However the point where the
vanadium centers in VxOySBA-15 changed from a square pyramidal to a tetrahedral coordination could
not be determined directly from the pre-edge peak height (average V-O bond length) An estimate was
made from the relative energy position of the pre-edge peak Figure 6-4 right depicts the relative energy
position and centroid energy of the pre-edge peak of vanadium reference compounds as a function of the
average V-O bond length In contrast to the pre-edge peak height no linear correlation was found A broad
range of energy positions between 47 eV and 51 eV was detected for tetrahedral compounds
Conversely almost the same energy positions between 52 eV and 55 eV were determined for square
94
pyramidal and distorted octahedral compounds The relative energy position obtained from the maximum
of the pre-edge feature and the centroid energy determined according to Chaurand et al [94] showed the
same dependence Only V2O5 exhibited an increased centroid energy of 60 eV Thus the energy position
is more sensitive towards the coordination of the absorbing vanadium centers than towards the average
bond length
Apparently the energy position of hydrated and dehydrated 77 wt VxOySBA-15 deviated from the
energy positions determined for bulk vanadium oxide references (Figure 6-4 right) Hence energy
position of the absorption edge is affected by more complex factors than only coordination of the
vanadium centers One factor may be a strong influence of the SiO2 support that cannot be neglected
because of the high dispersion of the vanadium oxide clusters However the strong impact of the
vanadium coordination on the energy position allowed determining the point where the square pyramidal
coordination of vanadium centers changes into a tetrahedral coordination during dehydration No
significant change of the energy position of the pre-edge peak was detected for temperatures above 440 K
(Figure 6-3) It seems that the transformation from hydrated to dehydrated VxOySBA-15 was completed
at this temperature This temperature was higher than the transformation temperature determined from the
UV-Vis-DR spectra in Figure 6-2 left (~ 400 K) The increase of the pre-edge peak height at
temperatures above 440 K may reflect the decreasing distortion of the tetrahedral VxOy species A
temperature of 440 K coincidences with the observation of the characteristic Raman band at 1040 cm-1
measured by in situ Raman spectroscopy (data shown in appendix 104 Hess et al [3238115117])
For both methods UV-Vis-DRS and XAS the same results were obtained Moreover the same
dehydration process was inferred for the 14 wt VxOySBA-15 (UV-Vis-DRS data shown) and the
77 wt VxOySBA-15 sample (XAS data shown) Apparently the dehydration process was independent
of the vanadium loading on the SBA-15 support
624 Dehydration of the silica SBA-15 support
The dehydration process of the vanadium oxide species supported on SBA-15 discussed above cannot be
fully understood without knowledge of the processes that occur on the silica support Dehydration
(desorption of physically adsorbed water) and dehydroxylation processes (decomposition of silanol
groups) were reported for pure silica samples Reviews were presented by Zhuravlev et al [147] and
Vansant et al [104] Thermogravimetric (TG) measurements were conducted to compare the dehydration
process of VxOySBA-15 samples with that of bare SBA-15 support Figure 6-5 left depicts the
thermograms for bare SBA-15 14 wt and 77 wt VxOySBA-15 All three curves show the same
progression of mass loss in the temperature range employed Given that a mass loss was already detected
at room temperature (303 K) a holding time of 60 min was adhered before starting to heat After 60 min
at 303 K only an insignificant mass loss was detected After reaching the maximum temperature of
623 K the temperature was held for 30 min
95
Four steps of mass loss were observed in the measured thermograms (Figure 6-5) In the case of pure
silica samples such as SBA-15 they can be ascribed to different stages of dehydration and
dehydroxylation [147] Zhuravlev reviewed the temperature dependent water desorption processes of
various silica samples in vacuum [147] The first mass loss of SBA-15 occurred already at room
temperature (step 1 303 K) According to Zhuravlev [147] it was ascribed to desorption of physically
adsorbed water present in a multilayer coverage on the SiO2 support The second step (step 2) was
detected between 303 K and 380 K In this range an increased water evolution was detected in the gas
phase by online mass spectrometry Water formation in this step was ascribed to physically adsorbed
water in a coverage below one monolayer Increasing temperature led to the third step (step 3) It ranged
from ~ 380 K up to the maximum temperature of 623 K It was accompanied by the fourth step (step 4)
during hold at 623 K According to Zhuravlev [147] the dehydration process of physically adsorbed water
was accompanied by a dehydroxylation process of the silica where the surface silanol groups decompose
to surface siloxane groups (equiv Si ndash O ndash Si equiv) and water A decrease from 46 to ~ 18 OH ndash groupsnm2
was reported for the employed temperature treatment (453-773 K) in vacuum [147] Furthermore the
temperature of 453-463 K was discussed as the characteristic temperature where dehydration (in vacuum)
is complete and a ldquodryrdquo and fully hydroxylated SiO2 surface (maximum Si-OH) is present
Differences in the temperature ranges reported here compared to those reported by Zhuravlev may be due
to deviating measurement methods Here TG experiments with a constant flow of 50 mlmin 20 O2 in
He were conducted The similarity of the thermograms of SBA-15 and VxOySBA-15 did not allow a
discussion of the dehydration of hydrated vanadium oxide species and the dehydration of the SBA-15
support independently from each other
0 20 40 60 80 100 120090
092
094
096
098
100 SBA-15 77 wt V
xO
ySBA-15
14 wt VxO
ySBA-15
Nor
mal
ized
Mas
s
Time [min]
300
350
400
450
500
550
600
650
step 4step 3
step 2
step 1
Tem
perature [K]
77-VOSBA-15 41-VOSBA-15 14-VOSBA-15 SBA-150
1
2
3
4
Rel
ativ
e W
eigt
h Lo
ss [
] (n
orm
aliz
ed to
the
400
m2 g
)
step 1 step 2 step 3 step 4
Figure 6-5 Left Thermograms of bare and VxOySBA-15 samples Right normalized relative mass loss detected for the observed steps derived from the thermograms (left side)
96
A comparison of the relative mass loss is depicted in Figure 6-5 right The mass loss was referred to a
BET surface area of 400 m2g The highest total mass loss of ~ 100 (400 m2g) was detected for
77 wt VxOySBA-15 A total mass loss of ~ 62 (400 m2g) was detected for 41 wt and 14 wt
VxOySBA-15 and a mass loss of 36 (400 m2g) for bare SBA-15 Thus the presence of vanadium on
the SBA-15 support allows the adsorption of a higher amount of water on the same surface area as on
bare SBA-15 Comparing the mass loss of the individual steps showed that step 1 and step 4 seemed to be
independent of the vanadium loading on the catalyst The loss of mass in step 2 and step 3 decreased with
decreasing vanadium loading on SBA-15 Thus in these steps the additional adsorption of water in
hydrated VxOySBA-15 played a pronounced role The temperature range of step 2 was 303-380 K In this
range the structure transformation from the hydrated to the dehydrated state was observed in the UV-Vis-
DR and XANES spectra Hence the additional water compared to bare SBA-15 was adsorbed or bound
in the structure of hydrated VxOySBA-15 The water evolution in step 3 may originate from a further
water evolution from the vanadium oxide species or from the dehydroxylating SBA-15 support Which of
these processes is more likely cannot be determined solely from the thermograms The in situ UV-Vis-
DRS and XAS measurements indicated that in this temperature range (400-600 K) structural changes
were still proceeding These were ascribed to the formation and ordering of the tetrahedral dehydrated
VxOySBA-15 phase
625 Determination of the apparent activation energy of water desorption - ED
The apparent activation energy for step 2 was determined to reveal the effect of the vanadium oxide on
the water desorption process A method according to Vansant et al [104] was chosen The maximum of
the differential thermogravimetry (DTG signal) was used to determine a maximum rate temperature
(Tmax) as a function of the heating rate (β = 246810 Kmin) By using an Arrhenius type plot the
apparent activation energy for water desorption (ED) was determined from these values Figure 6-6 In
addition to bare SBA-15 a measurement of Kieselgel 60 (reference used by Vansant et al [104]) was
conducted Figure 6-6 depicts the Arrhenius plots for the 77 wt VxOySBA-15 sample Desorption
energies are listed in Table 6-1 An apparent desorption energy of 40 kJmol was determined for
Kieselgel 60 in agreement with the values reported by Vansant et al [104]
Table 6-1 Apparent activation energies of water desorption Ed determined from the plot of ln(Tmax
2β) as a function of 1Tmax (Figure 6-6) freshly calcined sample two year old sample
ED [kJmol]
Sample bare silica support VxOxSBA-15
77 wt VxOy-SBA-15 111 plusmn 7 83 plusmn 10 (91 plusmn 7)
41 wt VxOy-SBA-15 -- 72 plusmn 5
14 w VxOy-SBA-15 101 plusmn 12 75 plusmn 7
Kieselgel 60 40 plusmn 9 --
97
Vansant et al [104] compared this value with ldquothe latent vaporization heat of water (∆Hv=41 kJmol)rdquo
and approximated that the ldquodesorption of water can be depicted as vaporization of liquid water out of the
silica poresrdquo However comparing the value obtained for Kieselgel 60 with the one detected for SBA-15
a significantly higher apparent desorption energy was detected for the SBA-15 support (~100-
110 kJmol) This indicated that a pronounced interaction of physically adsorbed water and SBA-15 was
present One possible explanation may be a ldquostrengthening of the hydrogen bondingrdquo of adjacent
hydroxyl groups in small pores [104] This may result in a higher density of surface silanol groups and an
increased interaction of the silanol groups with the physically adsorbed water Therefore the pore
structure of SBA-15 consisting of meso- and micropores could cause the higher desorption energy
Vanadium oxide supported on SBA-15 exhibited a lower apparent desorption energy of 72-83 kJmol
This lower value may be caused either by a decreased surface area and a changed distribution of pores
after APTES functionalization and vanadium grafting or by the pronounced effect of the adsorbed water
to the structure of hydrated samples The comparison of the relative mass losses in Figure 6-5 suggests
that the water evolution in step 2 may be more likely explained by the dehydration of the supported
hydrated vanadium oxide species than by the dehydration of the silica support Therefore the apparent
energy of water desorption is mostly due to loss of water from the hydrated VxOySBA-15 structure
0 20 40 60 80 100 1204000
4200
4400
4600
TG
(m
ass)
[microg]
Time [min]
raw DTG signal smoothed DTG signal
300
400
500
600
700
Tem
perature [K]
Tmax
280x10-3 290x10-3 300x10-3 310x10-3 320x10-390
95
100
105
110
77 wt V 77 wt V 77 wt V 77 wt VxxxxOOOO
yyyySBA-15SBA-15SBA-15SBA-15
linear fit 77 wt V linear fit 77 wt V linear fit 77 wt V linear fit 77 wt VxxxxOOOO
yyyySBA-15SBA-15SBA-15SBA-15
ln (
Tm
ax2 β
)
1Tmax
[1K]
SBA-15 SBA-15 SBA-15 SBA-15 linear fit SBA-15 linear fit SBA-15 linear fit SBA-15 linear fit SBA-15
Figure 6-6 Left TG and DTG signals recorded for 77 wt VxOySBA-15 (10 Kmin 623 K) location of Tmax is indicated right plot of ln(Tmax
2β) as a function of 1Tmax for bare SBA-15 and 77 wt VxOySBA-15
626 Types of silanol groups on the SiO2 support ndash 29Si CP-MAS-NMR
However no direct information about the changes of the SiO2 support was obtained from the TG
measurements Hence 29Si MAS-NMR measurements were conducted for SBA-15 and for hydrated and
dehydrated 77 wt VxOySBA-15 In Figure 6-7 left the possible types of Si atoms that can be
distinguished are depicted schematically Internal Si atoms that are located in SiO4 tetrahedrons are
denoted as Q4 centers and have a chemical shift of -110 ppm Si centers with geminol silanol groups
98
(HO-SiO2-OH) are termed as Q2 centers and they have a chemical shift of -90 ppm In the case of isolated
(HO-SiO3) or vicinal silanol groups (O3Si-OHmiddotmiddotmiddotmiddotmiddotHO-SiO3) a chemical shift of -102 ppm was observed
and the Si centers are denoted as Q3 centers The resulting spectra are depicted in Figure 6-7 right
Approximately 35 of the MAS-NMR signal of bare SBA-15 was due to Si centers exhibiting OH
groups In the MAS-NMR spectrum of hydrated 77 wt VxOySBA-15 the fraction of Si centers with
OH groups decreased to 16 Geminol type Si centers (Q2) were hardly detectable This lower amount of
Si-OH groups suggests that the missing fraction of Si-OH groups may have formed bonds to the hydrated
vanadium centers (Si-O-V) Similar results were reported by Dzwigaj et al [146]
Si
O
Si
Si
OH
OO
O
O
Si
OH
OO
HO
Si
OO
Si
O
SiO
SiO
OO
OH
Si
O
O
Si
OH
Si
Q4Q2Q3
-60 -80 -100 -120 -140
DDDD
CCCC
BBBB
AAAA
Q2Q3Q4
00100
01684
11485
102565
Q4
Q3
Q2
[ppm]
Figure 6-7 Left A picture of different types of silanol groups of silica materials right 29Si CP-MAS-NMR of bare and 77 wt VxOySBA-15 treated at different temperatures (A) bare SBA-15 (B) hydrated 77 wt VxOySBA-15 (C) dehydrated 77 wt VxOySBA-15 (653 K 1 h) (D) calcined 77 wt VxOySBA-15 (843 K 12 h) The red curve is the envelope of the Gaussian deconvolution
Thermal treatment according to the standard dehydration procedure at 653 K (1 h hold 20 O2 in He) did
not significantly change the number of silanol-type Si centers in the sample Differences compared to the
hydrated sample are within the error of the refinement procedure employed Therefore the number of
Si-O-V bond formed did not change during the dehydration process Nevertheless a light yellowish color
was observed for dehydrated 77 wt VxOySBA-15 (653 K 1 h) which may be explained by aging
effects (see below) No signal for Q3 and Q2 type Si centers was detected for a higher dehydration
temperature of 843 K as used in the calcination (823 K 12 h 20 O2 in He) Recalcined 77 wt
VxOySBA-15 exhibited a white color after high temperature treatment A decrease of silanol type Si
centers can be explained by a pronounced dehydroxylation of the silica SBA-15 However this did not
explain the total absence of any silanol type Si centers According to Zhuravlev [147] the number of
silanol groups could be reduced by a thermal treatment at 843 K but a complete dehydroxlation of silica
would only be achieved at temperatures higher than 1173 K (vacuum) Hence in addition to the
dehydroxylation of the SBA-15 support a certain fraction of silanol groups formed Si-O-V bonds with
the vanadium oxides species
99
627 The hydration process
Typically freshly calcined samples changed their color from white to yellow and orange after exposure to
air under ambient conditions This process is denoted as hydration To investigate the hydration process a
rehydration of the dehydrated VxOySBA-15 samples was conducted at room temperature The gases used
were saturated with water for rehydration A water content of 13-16 Vol in the gas phase was
achieved which equals the humidity of ambient air Figure 6-8 left depicts the V K pre-edge peak height
and the water in the gas phase (me 18) as a function of time The inset shows the corresponding XANES
spectra Figure 6-8 right shows the evolution of the UV-Vis edge energy and the water detected in the
gas phase (me 18) Apparently hydration of the vanadium oxide species of dehydrated VxOySBA-15
started immediately after water was detectable in the gas phase During the hydration process a decrease
of the pre-edge peak height and an increase in intensity in the XANES spectra (548-549 keV) was
observed Furthermore after exposure to water a decrease of the UV-Vis edge energy from 34 eV to
28 eV was detected Both the decrease of the V K edge pre-edge peak height and the decreasing UV-Vis
edge energy showed that the hydrated phase of VxOySBA-15 was formed immediately after exposure to
water The transformation was completed after approximately 2-3 minutes indicated by a constant pre-
edge peak height in the XANES spectra The main decrease in the UV-Vis edge energy was reached after
2 min After a longer period of time (60 min) only a small decrease (lt 01 eV) was detected compared to
the value after 2 minutes This rapid transformation during rehydration is explained by the strong
distortion of the vanadium oxide tetrahedrons formed on the SBA-15 support An average V-O distance
of 178 Aring was determined for the VxOySBA-15 samples investigated here Typical average V-O bond
lengths of bulk vanadates are shorter in the range of 170 Aring (Ca3V2O8) to 174 Aring (KVO3) Furthermore a
small Si-O-V distance (253 Aring) was determined by XAFS refinement which may explain the strong
distortion Coordination of an additional ligand (H2O) may cause a decrease in the tension present in the
distorted tetrahdral structure of dehydrated VxOySBA-15 and thus explain the rapid hydration of
dehydrated vanadium centers in VxOySBA-15
210-10
410-10
610-10
0 500 1000 1500 2000
Rel
ativ
e he
ight
of p
re e
dge
peak
a
u
Time sec
Ion Current m
e18 A
00
02
04
06
08
5475 55 5525 555
Abs
orpt
ion
[au
]
Photon Energy keV
3
4
5
6
3
45
6
210-10
410-10
610-10
0 500 1000 1500 2000
Rel
ativ
e he
ight
of p
re e
dge
peak
a
u
Time sec
Ion Current m
e18 A
210-10
410-10
610-10
0 500 1000 1500 2000
Rel
ativ
e he
ight
of p
re e
dge
peak
a
u
Time sec
Ion Current m
e18 A
00
02
04
06
08
5475 55 5525 555
Abs
orpt
ion
[au
]
Photon Energy keV
3
4
5
6
3
45
6
0 100 200 300 400 500 600
27
28
29
30
31
32
33
34
35
normalized ion current m
e 18
Eg
[eV
]
time [sec]
Eg Water
Figure 6-8 Left V K edge XANES spectra (inset) pre-edge peak height and water ion current during rehydration of dehydrated 77 wt VxOySBA-15 (298 K 16 Vol H2O) Right UV-Vis edge energy and water ion current during rehydration of dehydrated 77 wt VxOySBA-15 (298 K 13 Vol H2O)
100
628 Reversibility of hydration and dehydration processes
The reversibility of the structural transformations of hydrated and dehydrated VxOySBA-15 was
investigated in cyclic reaction tests As prepared VxOySBA-15 samples were dehydrated in a 20 O2 in
helium atmosphere (623 K for XAS 554 K for UV-Vis-DRS analysis) and subsequently rehydrated for
05-1 h at ~ 298 K using a saturated gas atmosphere (13-16 Vol H2O in He) A second cycle was
conducted after this first dehydrationrehydration cycle The second dehydration was performed at higher
temperatures (723 K for XAS 634 K for UV-Vis-DRS analysis) Figure 6-9 depicts the FT(χ(k)k3) of
77 wt VxOySBA-15 (XAFS) and UV-Vis-DR spectra of 14 wt VxOySBA-15 measured at ~ 298 K
after the respective treatment Apparently the spectra of dehydrated 77 wt and 14 wt VxOySBA-15
showed no differences when comparing the spectra of the first dehydration cycle with those of the second
dehydration cycle Hence the dehydration process is reversible for the 77 wt and 14 wt
VxOySBA 15 A more detailed discussion will be given below Comparing the results obtained for
hydrated 77 wt and 14 wt VxOySBA-15 minor deviations were observed after each rehydration
cycle As prepared 14 wt VxOySBA-15 showed the lowest intensity of the low energy absorption band
at ~ 360 nm compared to the more intense absorption band at 280 nm Thus a ldquohigher degree of
hydrationrdquo was present in hydrated 14 wt VxOySBA-15 after the first and second rehydration cycles
Furthermore this was corroborated by a decline of the UV-Vis edge energy of the hydrated VxOySBA-15
samples after each rehydration cycle (Table 6-2) A similar trend was observed in the FT(χ(k)k3) of
77 wt VxOySBA-15 The as prepared sample showed a significantly lower amplitude in the range of 2-
4 Aring According to Chapter 5 the amplitude in this range is caused by V-V interactions that are found in
the structure of hydrated 77 wt VxOySBA-15 The higher intensity in the range of 2-4 Aring after the first
rehydration cycle (~ 45 min) may indicate the formation of an increased number of V-O-V bonds
01
02
03
0 2 4 6
FT
(χ(k
)k3 )
R [Aring]
A
B
C
D
E
0
05
1
250 600 300 400 500
F(R
infin)
Wavelength [nm]
Figure 6-9 FT(χ(k)k3) of 77 wt VxOySBA-15 (left) and UV-Vis-DR spectra of 14 wt VxOySBA-15 (right) after various hydration and dehydration cycles as prepared (A) first dehydration at 623 K XAS 554 K UV-Vis-DRS 30 min (B) first rehydration 13-16 Vol 60-90 min (C) second dehydration at 723 K XAS 634 K UV-Vis-DRS 1 h (D) second rehydration 13-16 Vol 60 min (E) The line types on right side refer to the same procedure as on the left side
101
Table 6-2 UV-Vis edge energy Eg of hydrated VxOySBA-15 samples determined after various rehydration procedures Dehydration treatments as described in Figure 6-9
Eg [eV]
Sample as prepared 1 rehydration 2 rehydration
77 wt VxOy-SBA-15 274 271 267
41 wt VxOy-SBA-15 279 276 273
14 wt VxOy-SBA-15 280 279 277
629 Impact of aging on the structure of VxOySBA-15
An increasing V-V signal at 2-4 Aring in the FT(χ(k)k3) was observed in the XAFS spectra of hydrated
77 wt VxOySBA-15 measured at different times Figure 6-10 depicts the FT(χ(k)k3) of hydrated
samples measured after two weeks and after two years following preparation For comparison the
FT(χ(k)k3) of V2O5 and the rehydrated samples are also depicted Rehydration experiments were
conducted using the two week old 77 wt VxOySBA-15 The first signal (V-O tetrahedron) in the
FT(χ(k)k3) of as-prepared 77 wt VxOySBA-15 was asymmetric thus part of the dehydrated phase
was still present A least-squares XANES refinement was conducted to quantify the remaining fraction of
dehydrated phase in the spectrum of the two week old 77 wt VxOySBA-15 Spectra recorded after the
first dehydration and after the first rehydration cycle of 77 wt VxOySAB-15 were used as references
Approximately 18 of the dehydrated phase was present in the spectrum of two week old as-prepared
77 wt VxOySBA-15 A similar trend was observed for 41 wt and 14 wt VxOySBA-15 The
presence of dehydrated VxOySBA-15 two weeks after preparation suggests that hydration of freshly
calcined samples is significantly slower (weeks) than rehydration of dehydrated samples (~ 1 hour)
001
002
003
004
0 2 4 6
FT
(χ(k
)k
3 )
R [Aring]
two weeks oldfirst rehydration
2 years oldV2O5
00
025
05
075
10
545 55 555 56 565
Nor
mal
ized
Abs
orpt
ion
Photon E ngery [keV]
dehydrated VxOySBA-15
hydrated VxOySBA-15
two weeks old VxOySBA-15
Figure 6-10 Left FT(χ(k)k3) of differently hydrated 77 wt VxOySBA-15 and V2O5 Right result of the least-squares fit ( ) using the V K edge XANES spectra of dehydrated and rehydrated 77 wt VxOySBA-15 ( ) recorded after the first de-rehydration cycle (Figure 6-9 left) to the experimental XANES spectrum ( )of two week old as-prepared 77 wt VxOySBA-15
102
Figure 6-11 left shows the UV-Vis-DR spectra of one year old 77 wt VxOySBA-15 and recalcined
77 wt VxOySBA-15 On the right side of Figure 6-11 spectra of 14 wt VxOySBA-15 measured as-
prepared and one year later are depicted (Spectra of 14 wt VxOySBA-15 were normalized because the
as prepared sample was diluted with SBA-15) An increase of the absorption band at 370 nm in the
UV-Vis-DR spectra of the hydrated samples was observed for both loadings In Chapter 5 this band was
assigned to vanadium centers exhibiting a square pyramidal structure Concidering the intensity increase
in the FT(χ(k)k3) of 77 wt VxOySBA-15 at higher distances (2-4 Aring) the increase of the band at
370 nm may be caused by an increased number of ldquohydratedrdquo square pyramidal vanadium centers This
aging effect was interpreted as clustering of hydrated centers on the SBA-15 support Significant changes
of the UV-Vis edge energy in the spectra of hydrated VxOySBA-15 were not detected Thus the average
V-O-V number remained three (chains of square pyramidal centers) and the dispersion of hydrated
vanadium oxide species remained high The extension of the hydrated vanadium oxide species on
SBA-15 seems to be two-dimensional rather than three-dimensional as in the case of vanadium oxide
crystallites
The ldquogrowthrdquo of hydrated VxOy species on SBA-15 during storage raised the question whether aging of
hydrated VxOySBA-15 affected the dehydration of VxOySBA-15 Thermal treatment at 554 K (30 min)
of those differently hydrated VxOySBA-15 samples yielded UV-Vis-DR spectra that were characteristic
for dehydrated VxOySBA-15 (Figure 6-11) However in the case of an one year old 77 wt
VxOySBA-15 a broadening of the absorption band in the UV-Vis-DR spectrum was observed Such
broadening was absent in the UV-Vis-DR spectrum of one year old dehydrated 14 wt VxOySBA-15
0
5
10
15
220 600300 400 500
F(R
infin)
Wavelength [nm] 250 600300 400 500
Wavelength [nm]
F(R
infin)
Figure 6-11 UV-Vis-DR spectra of 77 wt VxOySBA-15 (left) and 14 wt VxOySBA-15 (right) as-prepared (14 wt) hydrated after calcination (77 wt) ( ) dehydrated as-prepared sample ( ) hydrated one year old sample ( ) dehydrated one year old sample ( ) dehydration parameters 20 O2 in He 554 K 30 min all spectra recorded at 298 K
103
Similar broadening effects in the absorption spectra of dehydrated VxOySBA-15 were reported by
Gruene et al [28] They assigned the UV-Vis band at 405 nm to small V2O5 clusters present on SBA-15
because characteristic bands of V2O5 were present in the Raman spectra of these samples (06-31 Vnm2
V on SBA-15) These V2O5 clusters were not detectable by XRD [28] Similar results were obtained for
77 wt VxOySBA-15 (25 Vnm2) here using in situ Raman spectroscopy The Raman spectrum of
dehydrated 77 wt VxOySBA-15 (723 K ~ 1 h) is shown in Figure 6-12 left Apart from a
characteristic Raman signal of the dehydrated VxOySBA-15 species at ~ 1040 cm-1 [2332] several other
Raman bands were detected Comparison with the Raman spectrum of a mechanical mixture of V2O5 and
SBA-15 (~ 3 wt V 298 K) showed that characteristic bands of V2O5 (284 305 407 703 and 994 cm-1)
were present in the spectrum of the one year old VxOySBA-15 sample The amount of V2O5 was
estimated according to Xie et al [34] assuming a 10 times larger cross section for V2O5 compared to the
dispersed tetrahedral species Comparing the intensities of the Raman signal at 995 and 1042 cm-1 shows
that approximately 3 V2O5 have been formed by dehydration of aged 77 wt VxOySBA-15
To investigate the impact of a recalcination on ldquoagedrdquo 77 wt VxOySBA-15 thermal treatment for 12 h
at 823 K in a muffle furnace was conducted After recalcination and dehydration of 77 wt
VxOySBA-15 characteristic V2O5 bands were absent in the Raman spectrum Thus formation of V2O5
clusters on the SBA-15 support during dehydration seems to be a reversible process To estimate the
fraction of V2O5 in the UV-Vis-DR spectra a least-squares refinement using three Gaussian curves was
performed Two Gaussian functions were introduced for the dehydrated phase according to the
calculation of Avdeev et al [136]The Gaussian curves were allowed to vary between 270 and 290 nm
and between 300 and 330 nm A third Gaussian function in the range of 390-430 nm was introduced to
account for V2O5
200 400 600 800 1000 1200
Nor
mal
ized
Inte
nsity
Raman shift [cm-1]
A
B
C
D
5
10
15
250 350 450 550
F(R
infin)
Wavelength [nm]
V2O5
Figure 6-12 left Raman spectra of (A) a 3 wt V V2O5SBA-15 mixture (1064 nm 100 mW) and (B) SBA-15 and in situ spectra (514 nm 6 mW) during dehydration of (C) one year old 77 wt VxOySBA-15 at 723 K (20 O2 in N2) and (D) a 77 wt VxOySBA-15 sample that is dehydrated at 623 K (20 O2 in N2) after recalcination at 823 K for 12 h in a muffle furnace (spectra C-D 514 nm 6 mW) right least square fit ( ) of three Gaussian functions ( ) to the UV-Vis-DR spectrum ( ) of dehydrated one year old 77 wt VxOySBA-15 (554 K 30 min 20 O2 in He)
104
Peak heights were allowed to vary between 0 and 20 Kubelka Munk units and the full band width was
allowed to vary independently for each Gaussian function The resulting refinement yielded a good
agreement between experimental and refined curves as depicted in Figure 6-12 right For the one year
old sample approximately 10 of the area of the UV-Vis-DR signal was caused by V2O5 In dehydrated
77 wt VxOySBA-15 which was recalcined this fraction was reduced to below 1 (Figure 6-11)
However after storage of the recalcined sample for several days the fraction of V2O5 increased again
After 7 days a fraction of 6-7 was determined The real concentrations will be lower because a strong
decrease of intensity was measured below 300 nm in the UV-Vis-DR spectra obtained with the Praying
MantisTM cell Moreover the amount of V2O5 determined from the Raman spectra was lower
In XAFS spectra no significant changes with storage time were observed for dehydrated 77 wt
VxOySBA-15 The FT(χ(k)k3) exhibited a small decrease of the first V-O signal in the range of 16-
20 Aring The disorder parameter of the V-O distance at 178 Aring increased from 00071 Aring2 (Table 6-3) to
00079 Aring2 in two year old dehydrated VxOySBA-15 (Table 6-3) After a treatment of 8 h at 770 K the
amplitude in the FT(χ(k)k3) of two year old dehydrated 77 wt VxOySBA-15 increased The disorder
parameter of the V-O distance at 178 Aring decreased from 00079 Aring2 to 00063 Aring2 A similar trend was
observed for V-V and V-Si contributions The overall increase of the disorder parameters of two year old
77 wt VxOySBA-15 showed that the structure of dehydrated vanadium species was less ordered after
dehydration However all experimental FT(χ(k)k3) of dehydrated 77 wt VxOySBA-15 were
simulated successfully using the dehydrated VxOy model structure (ordered arrangement of [V2O7] Table
6-3) Hence the major vanadium oxide phase in dehydrated 77 wt VxOySBA-15 was still the dimeric
tetrahedral species For the 41 wt VxOySBA-15 a similar aging effect was observed in the UV-Vis-DR
spectra As a consequence of the aging effect discussed above the presence of V2O5 was never fully
excluded for dehydrated 41 wt and 77 wt VxOySBA-15 during further experiments
Table 6-3 Experimental distances (R) and XAFS disorder parameters (σ2) for different type and number (N) of atoms at distance R from the absorbing V atom in a model system assuming an ordered arrangement of [V2O7] units (Chapter 5) Parameters were obtained from the refinement of this model structure to the experimental V K edge XAFS FT(χ(k)k3) of dehydrated 77 wt VxOySBA-15 at various stages of aging (k range from 27-105 Aring-1 R range 083-362 Aring Nind = 16 E0 = 0 eV in all cases (subscript c indicates parameters that were correlated in the refinement subscript f indicates parameters that were fixed in the refinement) Dehydration was conducted in 20 O2 in He
Type (N)
2 weeks old 2 years old recalcined
623 K 30 min 623 K 30 min 770 K 8 h
R [Aring] σ2 [Aring
2] R [Aring] σ
2 [Aring
2] R [Aring] σ
2 [Aring
2]
V-O (4) 178 00071 178 00079 178 00063
V-O (1) 290 00012f 289 00012f 289 00012f V-V (1) 329 00094 329 00116 330 00107
V-V (1) 361 00094c 360 00116c 360 00107c
V-Si (1) 255 00116 254 00130 253 00112
Residual 66 38 59
105
6210 Dehydration in water saturated atmospheres
Because water is a common reactant in propene oxidation its influence on the dehydration was
investigated At moderate temperatures (298 K) and in humid atmospheres the hydrated structure of
VxOySBA-15 was the major vanadium oxide phase present on the support A comparable treatment as
used for dehydration (623 K 20 O2 in He) was employed to investigate the structure that was present at
elevated temperatures in humid atmospheres In addition the helium carrier gas was saturated with water
to obtain a humidity of 13-16 Vol water in the gas phase The UV-Vis-DRS and XAS measurements
were performed after the rehydrationdehydration cycles reported above After the second rehydration the
samples were heated in a water saturated oxygen atmosphere to 623 K (XAS) or 554 K (UV-Vis-DRS)
The in situ spectra recorded at the respective temperatures are shown in Figure 6-13
The FT(χ(k)k3) of 77 wt VxOySBA-15 obtained during treatment with water vapor and after
switching the water off at 623 K is depicted in Figure 6-13 (left) Furthermore the FT(χ(k)k3) measured
at 298 K after thermal treatment is shown together with the FT(χ(k)k3) recorded at 298 K after the first
dehydration in dry atmosphere Apparently no significant differences were observed XAFS refinements
using the ldquodimeric V2O7rdquo model structure yielded good agreement between the experimental and refined
theoretical FT(χ(k)k3) The resulting parameters are listed in Table 6-4 The results obtained during the
thermal treatment at 623 K in the presence of water (3rd dehydration cycle) and the results obtained after
switching the water off at 623 K were similar Further no significant differences were observed after
cooling the sample down The σ2 of the V-O contribution at 178 Aring was slightly enhanced which was
assigned to thermal disorder effects
0 10 20 30 40 50 60 70 80 90 100 110250
300
350
400
450
009 018 028 037 046 055 065 074 083 092 102 111 120
Wav
elen
gth
[nm
]
300
350
400
450
500
550
600
Tem
perature [K]
Norm
alized Ion Current m
e 18
05
10
300 400 500
F(R
infin)
λ [nm]
F(Rinfin)
Time [min]
005
01
0 1 2 3 4 5
R [Aring]
FT
(χ(k
)k3 )
A
B
C
D
Figure 6-13 Left V K edge FT(χ(k)k3) of 77 wt VxOySBA-15 after different dehydration procedures 623 K 10 O216 Vol H2OHe (A) 623 K 10 O2He (B) 298 K 10 O2He (C) and 1st dehydration cycle (623 K 20 O2He) 298 K (D) Right in situ UV-Vis-DR spectra of the 14 wt VxOySBA-15 sample during dehydration together with water ion current me 18 (554 K 4 Kmin13 Vol H2O 20 O2 in He) The inset shows the 2D spectra recorded at 86 min and 113 min
106
Table 6-4 Experimental distances and XAFS disorder parameters (σ2) for different type and number (N) of atoms at distance R from the absorbing V atom in a model system assuming an ordered arrangement of [V2O7] units (Chapter 5) Parameters were obtained from the refinement of this model structure to the experimental V K edge XAFS FT(χ(k)k3) of dehydrated 77 wt VxOySBA-15 (k range from 27-105 Aring-1 R range 083-362 Aring Nind = 16 E0 = 0 eV in all cases (subscript c indicates parameters that were correlated in the refinement subscript f indicates parameters that were fixed in the refinement) Dehydration in the 1st and 2nd cycle was conducted in 20 O2 in He and in 10 O2 (and 16 H2O) in He in the 3rd dehydration cycle
Type (N)
1st dehydration cycle 2nd dehydration cycle 3nd dehydration cycle
298K (30min 623K) 298K (60min 723K) 623K (H2O) 623K (H2O off) 298K (H2O off)
R [Aring] σ2 [Aring
2] R [Aring] σ
2 [Aring
2] R [Aring] σ
2 [Aring
2] R [Aring] σ
2 [Aring
2] R [Aring] σ
2 [Aring
2]
V-O (4) 178 00071 178 00066 179 00079 178 00079 178 00070
V-O (1) 290 00012f 289 00012f 288 00012f 288 00012f 288 00012f V-V (1) 329 00094 330 00095 331 00123 327 00131 330 00129
V-V (1) 361 00094c 361 00095c 361f 00123c 358f 00131c 361 00129c
V-Si (1) 255 00116 253 00114 255 00119 253 00111 253 00133
Residual 66 51 53 78 53
Hence the dehydrated VxOySBA-15 phase was present on the SBA-15 support independent of water in
the gas phase at elevated temperatures In situ XANES spectra and PCA results were similar to those
obtained in the first dehydration cycle in Figure 6-3 (data not shown) In contrast to the XANES spectra
the disorder parameter of the V-V (33 and 36 Aring) and V-Si (25 Aring) contributions in the FT(χ(k)k3)
increased slightly during the dehydration in the presence of water Conversely the disorder parameter of
the V-O contribution at 178 Aring remained constant (Table 6-4)
Figure 6-13 (right) depicts the evolution of the UV-Vis-DR spectra during the dehydration of 14 wt
VxOySBA-15 together with the evolution of the MS ion current of water (me 18) Water addition to the
gas phase was stopped 35 min after reaching the maximum temperature of 554 K (total time 100 min)
Compared to the spectra recorded during dehydration in a dry atmosphere shown in Figure 6-2 left no
distinct changes were observed during thermal treatment of hydrated 14 wt VxOySBA-15 The main
transformation between the hydrated and the dehydrated VxOySBA-15 state was completed between 400
and 440 K It was accompanied by an increased formation of water At elevated temperatures the UV-
Vis-DR spectra resembled those of dehydrated VxOySBA-15 The inset in Figure 6-13 right depicts the
spectra recorded at 554 K in a water saturated atmosphere at 86 min (13 Vol H2O) and in a dry
atmosphere at 113 min After switching the water off only a small blue shift of 3 nm was observed
Compared to the UV-Vis edge energies obtained in the previous dehydration cycles only small changes
were observed for all VxOySBA-15 samples (Table 6-5) The UV-Vis edge energy of dehydrated
41 wt and 14 wt VxOySBA-15 increased after each rehydrationdehydration cycle This may be
caused by a decreasing distortion of the [VO4] tetrahedron or a decreasing V-O-V number (2 to 1 dimeric
to isolated VO tetrahedrons) These two effects cannot be distinguished sufficiently as discussed in
Chapter 5 Comparing UV-Vis-DR spectra of dehydrated VxOySBA-15 recorded at 298 K after several
dehydrationrehydration cycles small changes were observed for the various vanadium loadings
107
Table 6-5 UV-Vis edge energies Eg determined from the UV-Vis-DR spectra recorded at 298 K after different dehydration cycles (details given in Figure 6-14) The samples were diluted with SBA-15 (13 (SBA-15 77 wt VxOySBA-15) and 11 (SBA-15 14 wt or 41 wt VxOySBA-15))
Eg [eV]
Sample 623 K 05 h 20 O2 He
723 K 1 h 20 O2 He
723 K 1 h 20 O2 He 15 Vol H2O
77 wt VxOy-SBA-15 337 340 341
41 wt VxOy-SBA-15 344 345 352
14 w VxOy-SBA-15 360 362 368
Similar spectra were recorded for dehydrated 14 wt VxOySBA-15 after dehydration at 554 K and
634 K After dehydration in a humid atmosphere at 554 K the UV-Vis-DR spectrum was blue shifted by
several nm The UV-Vis edge energy increased from 360 eV to 368 eV and the absorption maximum
shifted from 280 nm to 265 nm This strong blue shift to 265 nm suggests an increased dispersion in the
presence of water during the dehydration process Thus more isolated vanadium oxide centers may have
formed after this treatment Similar blue shifted UV-Vis-DR spectra were recorded for higher loaded
dehydrated VxOySBA-15 A blue shift from 305 nm to 290 nm was detected for 41 wt dehydrated
VxOySBA-15 and from 308 nm to 296 nm for 77 wt VxOySBA-15 (Figure 6-14) According to the
calculation by Avdeev et al [136] the absorption band at 290 nm indicated that the dimeric tetrahedral
VxOySBA-15 species was still present on the support as discussed in Chapter 5 This was also
corroborated by the results obtained from XAFS refinement of the FT(χ(k)k3) of 77 wt dehydrated
VxOySBA-15 However for dehydrated 77 wt VxOySBA-15 a significant increase in absorption
intensity at 405 nm was detected during the third dehydration cycle in a humid atmosphere Hence V2O5
clusters may have formed during this process
0
2
05
1
15
250 600300 400 500
F(R
infin)
Wavelength [nm]
77 wt VxOySBA-15
0
4
1
2
3
250 600300 400 500
F(R
infin)
Wavelength [nm]
41 wt VxOySBA-15
0
12
05
1
250 600300 400 500
F(R
infin)
Wavelength [nm]
14 wt VxOySBA-15
Figure 6-14 UV-Vis-DR spectra recorded at 298 K after different dehydration cycles 1st dehydration at 554 K for 30 min ( ) 2nd dehydration at 634 K for 1 h ( ) 3nd dehydration at 554 K for 30 min (13 Vol H2O) and 15 min (ldquodryrdquo) ( ) The samples were diluted with SBA-15 (13 (SBA-15 77 wt VxOySBA-15) and 11 (SBA-15 14 or 41 wt VxOySBA-15))
108
63 Concluding remarks on the hydration and dehydration of VxOySBA-15
In situ UV-Vis-DRS and XAFS measurements showed that VxOySBA-15 samples changed their
structure dynamically as a function of temperature water content in the gas phase and vanadium loading
Moreover changes in the silanol distribution of the SiO2 support played a pronounced role The scheme
depicted in Figure 6-15 is introduced to summarize and discuss the results presented above
OH
[O3Si][SiO3]
OO
VO
V
OHO
OH
OH
[O3Si][O3Si]
O
OH V
O
OH
V2O5n H2O V2O5mltn H2O or micro-V2O5
hydration 298 K H2O fast
dehydration
550-723 K 05-1 h
dehydration vs crystallization
550-723 K 05-1 h
hydration 298 K H2O
aging
OH
[O3Si][SiO3]
OO
VO
V
OO
OH
calcination
770-843 K 8-12 h
low vanadium loadings lt 05 Vnm2
high and medium V loadings 05-25 Vnm2
hydration 298 K H2O slow
hydration 298 K H2O fast
OH
[O3Si]
OH
[O3Si]
OH
[O3Si]
[SiO4]
[SiO4]
hydrated state dehydrated state
OH
[O3Si]
H2O H2OH2O
[SiO2]
[O3Si]
OH
OV
O
HO
V
O
O
V
O
H2O
OH OH
O
V
O
O
V
OOH
O[SiO3]
OH2
H2OH2O
H2O H2OH2O
OH
[O3Si]
[SiO3]
[O3Si]
OO
VHO
V
OOH
OH
high and medium V loadings 05-25 Vnm2
high and medium V loadings 05-25 Vnm2
Figure 6-15 Schematic drawing of assumed dynamic structural transformations of supported vanadium oxide phase on SBA-15 during hydration and dehydration
631 Coordination of hydrated VxOySBA-15
Under ambient conditions at 298 K and in a humid atmosphere the hydrated state of VxOySBA-15 was
observed A vanadium oxide structure with a square pyramidal coordination of the vanadium centers
similar to the V2O5 and V2O62- vanadate structures was determined from XAFS refinements and the UV-
Vis edge energy position (Chapter 5) However no direct evidence about the kind of oxygen groups
around the absorbing vanadium centers could be derived in this work Four types of oxygen containing
groups seemed possible according to the literature [35] and the results discussed above (i) V-OH (ii)
V-O-Si (iii) V-O-V and (iv) VOH2 Possible configurations are shown in Figure 6-15 First
measurements reported by Schraml-Marth [27] and others [2640114] indicated that V-OH stretching
modes (~ 3660 cm-1) were present in the FT-IR (DRIFT) spectra of hydrated VxOySiO2 samples Second 29Si MAS-NMR measurements showed that fractions of the silanol type Si centers present on SBA-15
109
may have formed bonds (V-O-Si) to the grafted hydrated vanadium oxide centers The third configuration
(iii) involves direct linkages of V-O-V Such V-V distances were determined from the increased signal at
2-4 Aring in the FT(χ(k)k3) of the hydrated VxOySBA-15 samples Furthermore the average V-O-V number
as determined from the UV-Vis edge energy was 3 (connected square pyramidal double chains) Hence
V-O-V bonds between the vanadium oxide centers may be present in the hydrated state As a last possible
configuration (iv) a coordination of water seemed likely (VOH2) The maximum temperature of water
formation was determined from TG experiments to be ~ 323-343 K This is quite low and suggests
weakly bonded water in the structure of hydrated VxOySBA-15 In addition to coordinated water layers
of physically adsorbed water are depicted in Figure 6-15 because a significant mass loss was observed at
303 K in dry atmospheres
632 Impact of coordinated water on hydrated VxOySBA-15
That water molecules play a key role in the coordination of the hydrated vanadium oxide structure was
deduced from in situ UV-Vis-DRS and XAFS measurements The main structural transformation of
hydrated VxOySBA-15 into dehydrated VxOySBA-15 was observed to be independent of the vanadium
loading in a temperature range between 298 K and 440 K It was accompanied by an increased formation
of water Spectra recorded at higher temperatures resembled those of the dehydrated state of
VxOySBA-15 Therefore the majority of water is coordinated in the structure of hydrated VxOySBA-15
The apparent activation energy for water desorption (ED) in this temperature range was determined from
TG experiments to be 70-83 kJmol for VxOySBA-15 (Table 6-1) This was lower than for the pure
SBA-15 support (~ 110 kJmol) and higher than for the Kieselgel 60 silica reference (~ 40 kJmol) On
the one hand Vansant et al [104] explained the low value for Kieselgel 60 by an evaporation process of
physically adsorbed water from the SiO2 surface On the other hand the rather high apparent activation
energy for water desorption determined for pure SBA-15 was explained by an increased number of
micropores of the untreated SBA-15 samples However relating the mass loss observed in this
temperature range to the same surface area it was shown that the detected thus adsorbed water content
on VxOySBA-15 samples decreased with the decreasing vanadium loading Therefore ED in the range of
70-83 kJmol was ascribed to water which was released from the hydrated vanadium oxide structure The
increase in ED with increasing vanadium loading was explained by a coordinative interaction of water
with the vanadium centers on the SBA-15 support Furthermore the apparent activation energy of water
desorption of hydrated VxOySBA-15 increased with increasing time of storage in humid atmosphere
Therefore the coordinative interaction of water with the vanadium centers in hydrated VxOySBA-15 may
increase with ldquosample agerdquo For ldquoagedrdquo hydrated 77 wt VxOySBA-15 more V-V interactions were
detectable in the FT(χ(k)k 3) Moreover the similarity of the FT(χ(k)k3) of hydrated VxOySBA-15 with
that of V2O5 increased A V2O5middot12 H2O gel like structure was proposed by some authors [202334] to be
present in the hydrated state of VxOySiO2 because the Raman spectra of hydrated VxOySiO2 samples
resembled that of V2O5middotnH2O gels [148] Thus the increasing similarity with V2O5 indicates that the
110
vanadium oxide structure of ldquoagedrdquo hydrated 77 wt VxOySBA-15 may be similar to that of V2O5middotnH2O
gels
In summary water is important for the formation and coordination of the vanadium oxide structure of
hydrated VxOySBA-15 The fact that water is rather weakly bond to the vanadium centers causes a low
thermal stability and dehydration of hydrated VxOySBA-15 below temperatures of 440 K
633 Formation of dehydrated VxOySBA-15
At elevated temperatures between 440 and 550 K V K edge XANES spectra of VxOySBA-15 resembled
that of dehydrated VxOySBA-15 (Figure 6-2) A principal component analysis showed that the
transformation of hydrated to dehydrated VxOySBA-15 proceeded directly and that no intermediate
structures were formed Hence only a rearrangement process of the dehydrated vanadium oxide species
on the SBA-15 support occurred at temperatures higher than 440 K The increasing pre-egde peak height
in the V K edge XANES spectra indicate a decreasing distortion of the tetrahedral vanadium oxide
species At temperatures above 550 K only minor changes were observed in the XAFS and UV-Vis-DR
spectra of VxOySBA-15 samples dehydrated in the temperature range from 554 to 723 K The
FT(χ(k)k3) of VxOySBA-15 dehydrated at 723 K showed a slightly decreased disorder parameter σ2
(00066 Aring2) of the first V-O coordination sphere than after dehydration at 623 K (00070 Aring2) This is
explained by a narrower distance distribution which may be a consequence of a slightly enhanced
structural order of the dimeric tetrahedrons on the SBA-15 support (Table 6-4) In the gas phase only a
minor water formation was observed in the temperature range of 440-550 K The observed water content
may be explained by loss of water due to dehydration of V-OH species Schraml-Marth et al [40]
reported a decrease of the V-OH band (~ 3660 cm-1) in DRIFT spectra of VxOySBA-15 samples after
dehydration (573 K) of a rehydrated sample which matches this interpretation In addition to the
dehydration of the vanadium oxide phase a dehydroxylation of the silica support seems possible
[104147] However this interpretation is not preferred because no significant changes in the number of
silanol groups were observed in the 29Si MAS NMR spectra of 77 wt VxOySBA-15 Thus a
dehydration of the vanadium oxide species (V-OH) during the formation of the dehydrated vanadium
oxide centers was assumed in the temperature range of 440-550 K Some authors reported that V-OH
interactions are detectable by IR measurements for VxOySiO2 samples treated at 853 K (12 h O2) [141]
Therefore some of the dehydrated vanadium oxide species may have remained coordinated by hydroxyl
groups (V-OH) above 550 K (Figure 6-15)
Apparently the dehydrated state corresponds to the stable vanadium oxide state of VxOySBA-15 at
elevated temperatures higher than 550 K Thus 550 K will be sufficient as pretreatment temperature to
obtain dehydrated VxOySBA-15 samples
111
634 Formation of V2O5 crystallites versus dispersion during dehydration
Rehydrated VxOySBA-15 could be dehydrated again to the same dimeric tetrahedral structure obtained
after the first dehydration procedure Similar observations were reported by Morey et al and Luan et al
[35145] Conversely Xie et al [34] observed V2O5 formation after repeated hydrationdehydration
cycles They explained this ldquogradual transformationrdquo [34] of the hydrated state into ldquoV2O5rdquo crystals by
the formation of V2O5middotnH2O gels that transform into V2O5 during dehydration (for samples hydrated
longer than 10 min using 3 Vol H2O 298 K) Moreover Xie et al [34] discussed the reversible
hydration of V2O5 crystals formed into V2O5middotnH2O gels as long as these V2O5 crystallites are small
enough so that water can ldquointercalaterdquo into them [34] Lager V2O5 crystals that were present already after
calcination of higher loaded samples were not hydrated [34] The observation of V2O5 after several
hydration and dehydration cycles matches the V2O5 formation (denoted as micro-V2O5 in Figure 6-15) in
77 wt VxOySBA-15 which was dehydrated in water saturated atmospheres or after longer times of
storage Hence dehydration of ldquoagedrdquo 77 wt VxOySBA-15 results in the formation of V2O5 Raman
bands similar to those detected for V2O5 were reported by Abello et al [148] for V2O5middot03H2O gels
Therefore it seems likely that V2O5middotnH2O gels did not transform completely into V2O5 and only a lower
amount of water was intercalated into the structure (denoted as V2O5middotm lt n H2O gels) as depicted in
Figure 6-15
However recalcination of ldquoagedrdquo 77 wt VxOySBA-15 prior to dehydration resulted in an apparent
redispersion of V2O5 (Figure 6-12) into dimeric tetrahedral species Such a redisperion of large V2O5
crystallites seems not very likely considering the well accepted assumption in literature that spreading of
crystalline V2O5 on SiO2 supports is not possible [149 150] Given the low Tammann temperature of
V2O5 of 482 K [150] V2O5 or the vanadium oxide phase in general may be mobile on the SiO2 support
The formation of V2O5 may be explained by the low amount of reactive silanol groups on the SiO2
surface that would anchor the vanadium oxide species to the support Vanadium oxide centers that were
not linked to the SiO2 support will show sintering (V2O5 formation) This was shown by Van Der Voort et
al [151] They prepared 28 wt VxOySiO2 samples via impregnation of VO(acac)2 on Kieselgel 60
calcined at 473 K and at 973 K On samples pretreated at 973 K large amounts of V2O5 were detected
with Raman spectroscopy Van Der Voort et al [151] explained this V2O5 formation by the decreased
number of silanols on the support that induce the dispersion of the vanadium oxide They detected only a
few isolated silanol groups left on the support calcined at 973 K This explains V2O5 formation on
77 wt VxOySBA-15 but not the redispersion of V2O5 formed during the dehydration of aged 77 wt
VxOySBA-15 Following the mechanism discussed above Si-OH centers have to be present on the
support that react with the ldquomobilerdquo vanadium oxide and thus cause redispersion as it was observed
during recalcination A temperature of 843 K and a holding time of 12 h were chosen for recalcination It
is known from the 29Si NMR results that in the hydrated state and after dehydration at 653 K
approximatly 15 of the Si-OH centers were left on 77 wt VxOySBA-15 After calcination of 77 wt
VxOySBA-15 at 843 K no Si-OH signal was detected in the NMR spectrum Thus a reaction of the
vanadium centers with the SBA-15 support occurred The temperature of 843 K used for recalcination is
112
in the range where isolated Si-OH groups start to dehydroxylate into siloxane groups [147] Hence
instead of dehydroxylation of isolated silanol groups into siloxane groups a reaction of these isolated
silanol centers with the vanadium oxide may take place resulting in a redispersion This formation of
more V-O-Si bonds with the support after calcination was considered by the depiction of a second V-O-Si
bond of the dimeric tetrahedral unit in Figure 6-15
Apparently the presence of at least one V-O-Si bond per vanadium center or dimeric unit seems to be a
prerequisite for the formation of the dehydrated tetrahedral vanadium species If the amount of vanadium
centers exceeds the number of Si-OH groups that are sterically suitable to form V-O-Si bonds then the
formation of V2O5 during dehydration seems likely In this case a redispersion of hydrated to dehydrated
VxOySBA-15 is not completely reversible
635 Number of V-O-Si bonds ndash Is a O=V[O-Si]3 species possible
The mechanism discussed above explained the dispersion process of vanadium oxide species on SBA-15
To form the dehydrated state of VxOySBA-15 the dispersed vanadium oxides species have to form at
least one bond (Si-O-V) with the SiO2 support Considering the vanadium density of 25 Vnm2 for
77 wt VxOySBA-15 a linkage of the dispersed species via 3 V-O-Si bonds as claimed by Molinari and
Wachs [39] seemed not very likely Three bonds would be present in an isolated [VO4] tetrahedron To
link this monovanadate to the support three Si-OH centers would be required Assuming a V density of
25 Vnm2 a Si-OH density of 75 OHnm2 would be required for a full dispersion However fully
hydrated silica exhibits a silanol density of only 4-5 OHnm2 [147] Moreover Van der Voort et al [151]
showed that a small fraction of silanol groups was detected even on a VxOySiO2 sample where V2O5
formed Thus a O=V[O-Si]3 species seems not very likely For higher loaded dehydrated VxOySBA-15
samples a condensation of the adjacent tetrahedrons to dimeric species that are linked to the silica via one
or two Si-O-V bonds is assumed This suggestion is corroborated by the detection of dimeric [V2O7] units
with UV-Vis-DRS and XAS Nevertheless the high UV-Vis edge energies determined for 14 wt
VxOySBA-15 (gt 36 eV) indicated that isolated species (VO4) may have formed This seems possible
considering the low vanadium loading of 14 wt VxOySBA-15 (03 Vnm2) However a O=V[O-Si]3
species as proposed by Molinari and Wachs [39] seemed not likely because not all sterically suitable
Si-OH groups may be available to form three V-O-Si bonds Therefore a coordination by the Si-OH
groups of the SBA-15 support is suggested (Figure 6-15) The majority of the V-O-Si bonds formed may
be conserved during hydration of the vanadium oxide species This explains the unchanged number of
Si-OH centers in the hydrated and dehydrated state of VxOySBA-15 detected in the NMR measurements
(Figure 6-7)
636 Effect of water on the dehydration process
As shown in Figure 6-13 the dehydration process was observed even when water was present in the gas
phase Apparently water coordinated to the hydrated structure of VxOySBA-15 was only weakly bound
113
to the vanadium centers In contrast to dehydration in ldquodryrdquo atmospheres the formation of V2O5 was
detected for 77 wt VxOySBA-15 The presence of water may disturb the dehydrationdispersion
process Water may enhance the mobility of vanadium oxide centers on the support and thus accelerate
the sintering process
Moreover a small blue shift of the absorption band was observed for all samples This shift can be
interpreted by different assumptions (i) reduced V4+ centers which exhibit CT absorption bands at lower
wavelengths (ii) stronger distorted VO tetrahedrons (iii) changed oxygen groups (V-O-Si harr V-OH )
and (iv) changed connectivity (dimeric rarr isolated vanadium oxides centers) Assumption (i) seems
unlikely considering the high oxygen content in the gas phase (20 O2) and the fact that no red shift
(ldquoreoxidationrdquo) was detected after switching the water off Assumption (ii) seems not likely because the
average bond length remained constant during the 3rd dehydration cycle (Table 6-4) Referring to
assumption (iii) that the oxygen groups around the vanadium centers changed would indicate that V-OH
groups changed into (V-O-Si) groups In this case O is a stronger ligand than OH A similar behavior
was calculated by Atanasov et al for Cr(IV) Mn(V) and Fe(VI) oxo and hydroxo clusters [152] The
increasing number of V-O-Si bonds suggests that water from the gas phase causes a hydrolysis of the
V-OH bond This assumption was not confirmed by an experimental measurement The last assumption
(vi) that some of the dimeric [V2O7] units transformed into [VO4] units suggests that the V-O-V bond of
the dimeric vanadium species was opened by water in the gas phase This may be possible but seemed not
likely because the low loaded 14 wt sample already consisted of a considerable amount of isolated
vanadium oxide centers and also showed a blue shift of the absorption bands In conclusion the effect of
water on the dehydrated structure remained somewhat ambiguous Here assumption (iii) was preferred
V-OH groups transferred into V-O-Si groups However the dehydration process of VxOySBA-15 in
humid atmospheres did not change significantly compared to the dehydration process in dry atmospheres
The majority of the vanadium centers remained as dimeric tetrahedral species on SBA-15 which was
inferred from the successful XAFS refinements of 77 wt VxOySBA-15 (Table 6-4)
114
64 Summary
In situ UV-Vis-DRS XAFS and Raman measurements were conducted to investigate the evolution of the
vanadium oxide structure and the gas phase during thermal treatment of VxOySBA-15 catalysts in 20
O2 in He Furthermore the effect of water vapor on the VxOySBA-15 structure under ambient conditions
and during thermal treatment was determined
In situ XAFS measurements showed that the hydrated VxOySBA-15 structure transformed directly into
the dehydrated structure during thermal treatment in 20 O2 No intermediate vanadium oxide phase was
detected Water was released from the hydrated VxOySBA-15 structure during the dehydration process
In the temperature range between 298 K and 440 K this water loss was accompanied by the
transformation from a square pyramidal to a tetrahedral coordination of the vanadium centers Only minor
amounts of water were detected for elevated temperatures (440-550 K) A rearrangement and ordering
process of the dimeric tetrahedral vanadium oxide species is suggested in this temperature range For
temperatures higher than 550 K only minor changes were observed in the dehydrated VxOySBA-15
structure (550-723 K) 29Si MAS NMR measurements indicated that the dehydrated and hydrated
vanadium oxide centers are partially linked via Si-O-V bonds to the SBA-15 support
Exposure to water under ambient (humid) conditions resulted in a hydration of the dehydrated
VxOySBA-15 phase within minutes After subsequent dehydration of the rehydrated VxOySBA-15 phase
the dehydrated VxOySBA-15 phase was obtained again These rehydrationdehydration cycles showed
that the observed structural transformations of VxOySBA-15 were reversible and independent of the
amount of vanadium on SBA-15 However ldquoaging effectsrdquo were observed for 77 wt VxOySBA-15 A
clustering of square pyramidal hydrated centers comparable to the formation of V2O5middotnH2O gels was
assumed Dehydration of ldquoagedrdquo 77 wt VxOySBA-15 resulted in the formation of V2O5 crystallites
These crystallites were redispersed successfully under calcination conditions at higher temperatures
(843 K 12 h) For low loaded 14 wt VxOySBA-15 no sample aging was observed in the UV-Vis-DR
spectra
In general formation of the dehydrated phase was independent of the presence of water in the reaction
atmosphere and resulted in the formation of an ordered [V2O7] structure Small amounts of V2O5 formed
on 77 wt VxOySBA-15 Slight changes in the dehydrated VxOySBA-15 species were detected for all
VxOySBA-15 samples after the addition of water during the dehydration process These rearrangements
indicated a transformation of V-OHSi-OH into V-O-Si coordination sites Because water is commonly
present in oxidation reactions like propene oxidation these changes may play a role for the catalytic
performance of VxOySBA-15
115
7 Structural evolution and reactivity of VxOySBA-15
catalysts under propene oxidizing conditions
71 Introduction
The VxOySBA-15 model system was introduced to obtain detailed knowledge on the role of vanadium
sites during propene oxidation Similar investigations were reported for other supported metal oxides
model systems eg MoxOySiO2 [103153] However reaction product selectivities reported for
MoxOySiO2 model catalysts differ from those reported for VxOySiO2 catalysts (Table 7-1) This suggests
different structure-activity correlations during propene oxidation of vanadium in mixed metal oxide
catalysts Structure-reactivity correlations of vanadium oxide catalysts on different supports has been a
controversial issue during the past decades eg for the oxidative dehydrogenation of propane
[2829144154155156157] or for the oxidation of methanol or methane to formaldehyde
[202223141] However only few reports discuss the role of vanadium oxide supported on SiO2 in
selective oxidation of propene to acrolein (Table 7-1) Recently Zhao et al [16158] investigated the
catalytic performance in selective propene oxidation and the structure of vanadium oxide phases
supported on SiO2 Al2O3 Nb2O5 TiO2 and ZrO2 in the range of 573-623 K Compared to vanadium
oxide phases on other support oxides they reported a rather poor activity of the VxOySiO2 catalysts for
the propene oxidation to acrolein Furthermore they concluded that different reaction kinetics and a lower
number of active ldquoVO4rdquo sites [16] were responsible for this poor catalytic activity The kind of reaction
products that are formed during the oxidation of propene over VxOySiO2 catalysts depend on the reaction
conditions applied (Table 7-1) In the presence of high water content in the gas phase increased amounts
of acetone and acetic acid were reported [15159] If no water was added to the initial reaction mixture
high selectivities towards acetaldehyde acetone and acrolein were described [16160]
Table 7-1 Propene conversion and selectivity for propene oxidation over vanadium and molybdenum oxides supported on SiO2
Catalysts Condition ratio
O2propene Conversion C3H6 []
Selectivity towards main products Ref
5 wt V2O5SiO2 473K ~ 12 19 29 acetaldehyde 73 propionaldehyde 268 acrolein
[160]
058 Vnm2 V2O5SiO2
523 K 20 steam 3 18 435 acetone 18 acetic acid 183 COx
[15]
1-8 wt V2O5SiO2
(02-27 Vnm2) 623 K 8-1 02
48-51 acrolein 47-49 acetone 6 acrylic acid
[16158]
10 wt V2O5SiO2
(117 Vnm2) 463 K 25 water
vapor 2 35 95 acetone [159]
58 wt MoO3SiO2 (08 Vnm2)
673 K 23 3 53 propionaldehyde 10 acrolein 8 acetaldehyde 29 COx
[103]
6 wt MoO3SiO2 673 K 1 29 53 propionaldehyde 18 acrolein 21 acetaldehyde 8 COx
[153]
116
Here in situ spectroscopic investigations of vanadium oxides supported on SBA-15 were conducted to
deduce reliable structure-reactivity correlations of VxOySBA-15 under propene oxidizing reaction
conditions These measurements were combined with reaction tests in the in situ cells and a laboratory
fixed bed reactor The dehydrated VxOySBA-15 structure discussed in the previous chapters was used as
initial state for structural characterization of VxOySBA-15 model catalysts under propene oxidizing
conditions In accordance with previous investigations on MoxOySBA-15 [8] and PVMo11O40SBA-15
model catalysts [10] similar reaction conditions were employed (573 K and 723 K 1-75 propene and
1-10 O2 in He)
117
72 Results and discussion
721 Local structure of VxOySBA-15 under propene oxidation
Figure 7-1 depicts the room temperature V K edge XANES the FT(χ(k)k3) and the UV-Vis-DR spectra
of the dehydrated VxOySBA-15 samples (554-623 K 1h 20 O2 in He) before and after temperature
programmed reaction in propene and oxygen (676-723 K 1 h 5 O2 and 5 propene in He ) The V K
edge XANES spectra after reaction were similar to the spectra of the initial dehydrated state of
VxOySBA-15 No changes in the characteristic XANES structure pre-edge peak height and shape were
observed for 41 wt and 77 wt dehydrated VxOySBA-15 (Figure 7-1 left) The spectrum of 14 wt
dehydrated VxOySBA-15 exhibited a slight increase of the amplitude of the XANES after reaction
whereas the pre-edge peak height and shape remained unchanged The same similarity before and after
propene oxidation was observed in the FT(χ(k)k3) of the VxOySBA-15 samples (Figure 7-1 middle)
Only minor differences in the amplitude of the envelope of the FT(χ(k)k3) were detected for all loadings
employed A small decrease of the amplitude at higher distances (2-4 Aring) where V-V interactions are
located was observed for dehydrated 77 wt VxOySBA-15 In contrast an increase of the amplitude
was detected in the same region in the FT(χ(k)k3) of dehydrated 14 wt VxOySBA-15 XAFS
refinements were conducted to reveal that the ldquoordered dimeric tetrahedral model structurerdquo was still
sufficient for describing the experimental FT(χ(k)k3) The resulting parameters for 77 wt and 14 wt
VxOySBA-15 are listed in Table 7-2 (A detailed description of the refinements is given in Chapter 5) A
good agreement of the experimental and theoretical FT(χ(k)k3) was obtained for all samples as indicated
by residuals lower than 8 (Table 7-2)
00
10
20
30
55 555 56
Nor
mal
ized
Abs
orpt
ion
Photon Energy [keV]
A
B
C
V-V
01
02
0 2 4 6
FT
(χ(k
)k3 )
R [Aring]
A
B
C
V-O
V-O V-Si
0
5
10
15
220 600300 400 500
F(R
infin)
Wavelength [nm]
A
C
Figure 7-1 V K edge XANES (left) FT(χ(k)k3) (middle) and UV-Vis-DR spectra (right) recorded at 298 K after dehydration (solid line 623 K 1 h 20 O2 in He) and after propene oxidation (dashed line 673 K (UV-Vis) and 723 K (XAS) 1 h 5 O2 and 5 propene in He) (A) 77 wt (B) 41 wt and (C) 14 wt VxOySBA-15
118
Table 7-2 Experimental distances (R) XAFS disorder parameters (σ2) and coordination numbers (N) for different types of atom in a model system assuming an ordered arrangement of [V2O7] units (Chapter 5) Parameters were obtained from the refinement of this model structure to the experimental V K edge XAFS FT(χ(k)k3) of dehydrated 14 wt and 77 wt VxOySBA-15 (k range from 27-105 Aring-1 R range 083-362 Aring Nind = 16 E0 = 0 eV in all cases (subscript c indicates parameters that were correlated in the refinement subscript f indicates parameters that were fixed in the refinement) Dehydration was conducted in 20 O2 in He at 623 K for 1 h and propene oxidation at 723 K for 1 h (5 O2 and 5 propene in He)
77 wt VxOySBA-15 14 wt VxOySBA-15
dehydrated after propene oxidation dehydrated after propene oxidation
Type ( N) R [Aring] σ2 [Aring2] R [Aring] σ2
[Aring2] R [Aring] σ2 [Aring2] R [Aring] σ2
[Aring2]
V ndash O (1) 178 00067 178 00069 178 001 178 0009
V ndash O (1) 178 c 00067 c 178 c 00069 c 178 c 001 c 178 c 0009 c
V ndash O (2) 178 c 00067 c 178 c 00069 c 178 c 001 c 178 c 0009 c
V ndash O (1) 289 00012 f 289 00012 f 287 0003 f 287 0003 f
V ndash V (1) 333 00098 333 00123 335 00129 333 00089
V ndash V (1) 361 00098 c 360 00123 c 361 00129 c 356 00089 c
V ndash Si (1) 254 00088 254 00923 251 00109 252 00103
Residual 40 40 56 79
Accordingly the dehydrated vanadium oxide structure was still present on the SBA-15 support after
propene oxidation Compared to the parameters obtained from a refinement to the initial FT(χ(k)k3) of
dehydrated 77 wt VxOySBA-15 the disorder parameter σ2 of the V-V distances at 33 and 36 Aring
increased during propene oxidation from 00098 to 00123 Aring2 Small rearrangements of the [V2O7]
dimers which cause a wider distance distribution as a consequence of a slightly decreased structural
disorder may have occurred during propene oxidation Another reason for a wider distribution of the V-V
distances may be a transformation of small fractions of the dimeric vanadium oxide centers into isolated
tetrahedral vanadium oxide centers In contrast to 77 wt VxOySBA-15 the V-V disorder parameter σ2
of 14 wt VxOySBA-15 was decreased after propene oxidation The narrower V-V distance distribution
and may be explained by an increased structural order Additionally it seems possible that the number of
V-O or V-Si contributions increased at distances higher than 2 Aring However the disorder parameters σ2 of
the V-O and V-Si distances showed no significant changes for 14 wt and 77 wt VxOySBA-15 after
propene oxidation (Table 7-2)
Distinct changes were detected In the UV-Vis-DR spectra of dehydrated VxOySBA-15 recorded before
and after exposure to catalytic conditions (Figure 7-1 right) In the UV-Vis-DR spectra that were
measured at 298 K after temperature programmed reaction in propene and oxygen a blue shift of the
absorption maximum and a decrease of the maximum intensity at 300 nm were observed The UV-Vis
edge energy of 77 wt VxOySBA-15 shifted from 341 eV to 356 eV (∆Eg~ plusmn005 eV) and that of
41 wt VxOySBA-15 from 342 eV to 362 eV (∆Eg~ plusmn005 eV) Eg of low loaded 14 wt
VxOySBA-15 shifted from 36 eV to 39 eV (∆Eg~ plusmn01 eV) A UV-Vis edge energy of 36 eV would be
indicative for the presence of isolated and dimeric tetrahedral vanadium centers For low loaded
dehydrated 14 wt VxOySBA-15 a UV-Vis edge energy of 39 eV suggests that isolated centers may be
present predominately
119
300 350 400 450 500 550 600
250
300
350
400
450
500
0 036 072 11 14 18 21 25 29 32 36 39 43
Temperature [K]
Wav
elen
gth
[nm
]
Norm
alized Ion Current m
e 56
250 300 350 400 450 5000
1
2
3
4
F(R
infin)
Wavelength [nm]
F(Rinfin)
B
300 350 400 450 500 550 600 650
250
300
350
400
450
500
Norm
alized Ion Current m
e 56
0 12 24 36 48 60 71 83 95 11 12 13 14
Temperature [K]
Wav
elen
gth
[nm
]
250 300 350 400 450 5000
2
4
6
8
10
12
14
F(R
infin)
Wavelength [nm]
F(Rinfin)
A
300 350 400 450 500 550 600 650
250
300
350
400
450
500
0 12 24 36 48 60 71 83 95 11 12 13 14
Temperature [K]
Wav
elen
gth
[nm
]
Norm
alized Ion Current m
e 56
250 300 350 400 450 5000
2
4
6
8
10
12
F(R
infin)
Wavelength [nm]
F(Rinfin)
C
300 350 400 450 500 550 600 650
250
300
350
400
450
500
Temperature [K]
Wav
elen
gth
[nm
]
0 13 25 38 50 63 75 88 10 11 13 14 15
300 400 5000
2
4
6
8
10
12
14
F(R
infin)
Wavelength [nm]
F(Rinfin)
D
300 350 400 450 500 550 600 650
10x10-12
20x10-12
30x10-12
77 wt VxO
ySBA-15
Run1 Run2
Ion
Cur
rent
me
56
[A]
Temperature [K]
300 350 400 450 500 550 600 650
60x10-13
12x10-12
18x10-1214 wt V
xO
ySBA-15
Run1 Run2
Ion
Cur
rent
me
56
[A]
Temperature [K]
Figure 7-2 Top and middle in situ UV-Vis-DR spectra of dehydrated VxOySBA-15 (623 K 1 h 20 O2 in He) and the evolution of the ion current me 56 (acrolein) during the temperature programmed reaction (A) 77 wt VxOySBA-15 (675 K 5 O2 and 5 propene in He 1st run) (B) 14 wt VxOySBA-15 (634 K 5 O2 and 5 propene in He 1st run) (C) 77 wt VxOySBA-15 (675 K 1 h 5 O2 and 5 propene in He 2nd run) (D) 77 wt VxOySBA-15 (675 K 5 O2 in He) Bottom Evolution of the ion current me 56 for the 1st and 2nd measurement run All measurements were performed with 4 Kmin
120
In situ UV-Vis-DR spectra were recorded during temperature programmed reaction (298-675 K 4 Kmin
5 O2 and 5 propene in He) to determine the temperature where the blue shift occurred The resulting
UV-Vis-DR spectra together with the evolution of the acrolein ion current (me 56) are depicted in
Figure 7-2 for dehydrated 77 wt and 14 wt VxOySBA-15 For reference a measurement in 5 O2
was conducted to ensure that the blue shift occurred only under catalytic conditions (Figure 7-2 D) In
those spectra a reversible temperature induced red shift of the UV-Vis edge energy and the absorption
maximum was observed In the spectra recoded in a 5 O2 and 5 propene atmosphere the blue shift of
the absorption maximum started at 500 K and finished approximately at 550 K for dehydrated 77 wt
VxOySBA-15 (Figure 7-2 A) Interestingly the beginning of the blue shift of the UV-Vis-DR absorption
band coincided with the onset of acrolein formation at 500 K (and other aldehydes that are not shown)
detected in the online mass spectrometer The range where the blue shift was mainly observed shifted to
530-600 K for dehydrated 14 wt VxOySBA-15 (Figure 7-2 B) The onset of acrolein formation was at
520 K A second temperature programmed measurement was conducted subsequently to the first
measurement of dehydrated 77 wt VxOySBA-15 to investigate if the onset of the catalytic activity was
reproducible No change was observed in the in situ UV-Vis-DR spectra of 77 wt VxOySBA-15
except for a temperature induced broadening of the absorption band (Figure 7-2 C) The onset
temperature of acrolein formation was still at 500 K but the increase of the ion current (me 56) was
significantly lower than in the first measurement For a better comparison the ion currents of the first and
second measurement are shown in Figure 7-2 (bottom) A propene conversion of ~ 8 was detected
directly after reaching 675 K for both measurements of 77 wt VxOySBA-15 Furthermore the
selectivity towards acrolein decreased from 18 in the first measurement to 14 in the second
measurement Such a pronounced difference in the acrolein formation between the initial and a second
measurement was not observed for dehydrated 14 wt VxOySBA-15 The results presented above show
that the temperature range where the blue shift in the UV-Vis-DR spectra of dehydrated 77 wt
VxOySBA-15 occurred (500-600 K) coincided with an increased formation and selectivity of acrolein and
other aldehydes Possible explanations for the blue shift observed and of the increased activity of
dehydrated 77 wt VxOySBA-15 will be discussed in Section 723
722 Impact of pretreatment procedure and water vapour on the local structure of
VxOySBA-15 during propene oxidation
In the previous chapter it was shown that the dehydrated VxOySBA-15 structure was present at elevated
temperatures even in the presence of water in the reaction atmosphere The influence of different reaction
conditions like pretreatment in oxygen and water vapor on the local structure of VxOySBA-15 during
propene oxidation were investigated here Three experiments were performed First the sample was
dehydrated (554-623 K 1 h 20 O2 in He) prior to the temperature programmed reaction in propene and
oxygen (5 propene and 5 O2 in He) Second the hydrated VxOySBA-15 samples were used as initial
phase Third the hydrated VxOySBA-15 samples were used as initial phase and water vapor was added to
121
0
14
5
10
220 500 300 400
Wavelength [nm]
0
5
10
220 300 400
F(R
infin)
Wavelength [nm]
298 K
636 K
F(R
infin)
0
3
1
2
220 500 300 400
Wavelength [nm]
0
1
2
3
220 300 400
F(R
infin)
Wavelength [nm]
636 K
298 K
F(R
infin)
Figure 7-3 In situ UV-Vis-DR spectra of 77 wt VxOySBA-15 (right) and 14 wt VxOySBA-15 (left) recorded at 636 K and at 298 K after reaction in 5 propene and 5 O2 in He dehydrated sample (554 K 20 O2) (solid line black) hydrated sample (dashed and dotted line red) and hydrated sample with water (08 Vol) in the reaction mixture (dotted line blue)
the reaction mixture (~ 08 Vol) In this experiment water vapor was switched off while cooling the
samples to 298 K The UV-Vis-DR spectra of 14 wt and 77 wt VxOySBA-15 for the different
temperature programmed reactions are shown in Figure 7-3 Apparently no difference can be detected in
the UV-Vis-DR spectra recorded in situ at 636 K and at 298 K after reaction The dehydrated
VxOySBA-15 state was present for all three treatments Similar results were obtained from V K edge
XAFS measurements Figure 7-4 depicts the FT(χ(k)k3) of 77 wt VxOySBA-15 recorded at 723 K
and 298 K for the different temperature programmed reactions Again no significant difference was
observed in the FT(χ(k)k3) of 77 wt VxOySBA-15 for the different treatments employed Figure 7-5
depicts the in situ XAFS spectra for 77 wt VxOySBA-15 (3rd procedure hydrated VxOySBA-15
water) to show that a similar evolution of XAFS spectra was observed as described for the dehydration
processes in Chapter 623
00
0025
005
0075
-0025
0 2 4 6
R [Aring]
FT
(χ(k
)k3 )
723 K
00
0025
005
0075
-0025
0 2 4 6
R [Aring]
FT
(χ(k
)k3 )
)
298 K
Figure 7-4 In situ V K edge FT(χ(k)k3) of 77 wt VxOySBA-15 (right) and 14 wt VxOySBA-15 (left) recorded at 723 K and at 298 K after reaction in 5 propene and 5 O2 in He dehydrated sample (554 K 20 O2) (solid line black) hydrated sample (dashed and dotted line red) and hydrated sample with water (08 Vol) in the reaction mixture (dotted line blue)
122
002
004
006
0 1 2 3 4 300400
500600
700
FT
(χ(k
)k3 )
R [Aring]
00
025
05
075
10
00
55
555
56
400500
600700
Nor
mal
ize
d A
bsor
ptio
n
00
02
04
06
08
10
300 400 500 600 700
Temperature [K]
Nor
mal
ized
Ion
Cur
rent
me 18 (H2O)
me 44 (CO2)
me 56 (acrolein)
300 400 500 600 700
00
02
04
06
08
10
Fra
ctio
n of
Pha
se
Temperature [K]
560
565
570 V K
Pre-E
dge Peak P
osition [eV] 054
057
060
063
066
Norm
V K
Pre-E
dge Peak H
eight
Figure 7-5 Evolution of the recorded MS ion currents (left top) and the V K edge pre-edge peak height () and energy position () (left bottom relative to 5465 keV) and the phase fraction for the hydrated () and dehydrated () vanadium oxide structure obtained from a PCA (left bottom) of the V K edge XANES spectra (right top) that were recorded during the temperature programmed reaction (5 O2 and 5 propene in He 298-723 K 5 Kmin) of 77 wt hydrated VxOySBA-15 FT(χ(k)k3) (QEXAFS scans) of a comparable measurement are shown on the right side (bottom)
The XANES spectra the FT(χ(k)k3) MS ion currents and the respective parameters obtained from a
PCA analysis and an analysis of the pre-edge peak height and position are depicted in Figure 7-5
XANES scans were recorded in the standard operation mode of the monochromator crystals to gain a
better signal to noise ratio The FT(χ(k)k3) was extracted from QEXAFS scans that were recorded in a
separate measurement The usable spectral range of the QEXAFS scans was 25-90 Aring-1(Figure 10-4
appendix) Similar to dehydration of 77 wt VxOySBA-15 (Chapter 623 Figure 6-3) two
components involved in the structural transformation were determined by a PCA of the V K edge
XANES spectra The amount of hydrated and dehydrated VxOySBA-15 was determined using the
XANES spectrum of the initial hydrated structure and the XANES spectrum recorded at 723 K The
evolution of the hydrated and dehydrated state was comparable to that observed during dehydration in
20 O2 As depicted in Figure 7-5 the transformation of the hydrated VxOySBA-15 structure into the
dehydrated VxOySBA-15 structure occured in the temperature range from 300 K to 440 K In this
temperature range changes in the XANES were observed and the pre-edge peak position reached its
minimum (Figure 7-5 left bottom) In contrast to Figure 6-3 in Chapter 623 a small increase of the
pre-edge peak position was observed above 500 K The origin of this increase is unclear It may indicate a
change of the coordination sphere (eg type of ligand) around the absorbing vanadium center during
propene oxidation The increase of the pre-edge peak height coincided with the increasing amount of
123
dehydrated VxOySBA-15 phase This was similar to the dehydration of 77 wt VxOySBA-15 Below
550 K only the formation of water (me 18) was detected with the online mass spectrometer An increase
in the ion currents of the reaction products of propene oxidation was observed for temperatures higher
than 550 K Figure 7-5 (left top) depicts the ion currents of water (me 18) CO2 (me 44) and acrolein
(me 56) The formation of reaction products was observed at temperatures where the dehydrated phase
was already present on the support Therefore the dehydrated structure of VxOySBA-15 was the main
vanadium oxide phase present during catalytic propene oxidation The in situ FT(χ(k)k3) of 77 wt
VxOySBA-15 resembled that of the dehydrated phase above 440 K XAFS refinements showed that the
ldquoordered V2O7rdquo model structure was sufficient to describe the experimental FT(χ(k)k3) of 77 wt
VxOySBA-15 recorded at 723 K for all reaction conditions employed Low residuals of 8 acceptable F
parameters and acceptable confidence limits were obtained for all refinements Compared to the
parameters that were obtained after reaction at 298 K only a small increase of the disorder parameters
and small changes of the V-V distances were observed at 723 K The disorder parameter of the V-V
distances increased (~ 0014 Aring2) compared to that determined at 623 K in a 20 O2 atmosphere
(0009 Aring2Table 6-3 Chapter 629) The increased σ2 suggests a wider V-V distance distribution which
may be a consequence of structural rearrangements that occur during the reaction with propene
Nevertheless for all treatments the ordered dimeric [V2O7] model structure was sufficient to describe the
experimental FT(χ(k)k3) of the 77 wt VxOySBA-15 sample under reaction conditions
In conclusion the pretreatment procedure and the presence of water vapor during catalytic reaction did
not affect the local vanadium oxide structure of VxOySBA-15 The same dehydrated VxOySBA-15 state
was present for all treatments employed
Table 7-3 Experimental distances (R) XAFS disorder parameters (σ2) and coordination numbers (N) for different types of atom in a model system assuming an ordered arrangement of [V2O7] units (Chapter 5) Parameters were obtained from the refinement of this model structure to the experimental V K edge XAFS FT(χ(k)k3) of dehydrated 14 wt and 77 wt VxOySBA-15 (k range from 27-105 Aring-1 R range 083-362 Aring Nind = 16 E0 = 0 eV in all cases (subscript c indicates parameters that were correlated in the refinement subscript f indicates parameters that were fixed in the refinement) Dehydration was conducted in 20 O2 in He at 623 K and propene oxidation at 723 K (5 O2 and 5 propene in He 08 H2O)
dehydrated hydrated hydrated dehydrated after reaction
723 K 723 K 723 K 298 K
5 propene 5 O2 5 propene 5 O2 5 prop 5 O2 08 H2O He
Type ( N) R [Aring] σ2 [Aring2] R [Aring] R [Aring] R [Aring] σ2
[Aring2] R [Aring] σ2 [Aring2]
V ndash O (1) 179 00084 178 00084 178 00088 178 00069
V ndash O (1) 179 c 00084 c 178 c 00084 c 178 c 00088 c 178 c 00069 c
V ndash O (2) 179 c 00084 c 178 c 00084 c 178 c 00088 c 178 c 00069 c
V ndash O (1) 291 00012 f 288 00012 f 291 00012 f 289 00012 f
V ndash V (1) 326 00146 330 00165 332 00140 333 00123
V ndash V (1) 359 00146 c 363 00165 c 363 00140 c 360 00123 c
V ndash Si (1) 256 00104 253 00121 255 00105 254 00923
Residual 73 55 49 41
124
723 Discussion of possible origins of the UV-Vis edge energy shift during propene oxidation
In the previous chapter various reasons were discussed that may explain the UV-Vis edge energy shift
observed in the UV-Vis-DR spectra (i) reduced V4+ centers which exhibit CT absorption bands at lower
wavelengths (ii) less distorted VO tetrahedrons (iii) changed oxygen groups (V-O-Si harr V-OH ) and
(iv) changed connectivity (dimeric rarr isolated vanadium centers)
A reduction of tetrahedral V5+ vanadium centers to tetrahedral V4+ or V3+ centers (reason (i)) seems not
very likely because of the unchanged pre-edge peak in the V K edge XANES spectra (Figure 7-1) and the
unchanged Raman band at 1040 cm-1 (Figure 7-7) However a tetrahedral vanadium oxide species with
reduced vanadium centers would exhibit absorption bands in the UV-Vis range with maxima that are blue
shifted compared to the maxima that are detected for V5+ vanadium centers [132] Thus reduced
tetrahedral vanadium centers may be one reason for the blue shift observed in the spectra of the
dehydrated VxOySBA-15 samples during propene oxidation (Figure 7-6) That no reduction of the
tetrahedral vanadium oxide phase occurred during the temperature programmed reaction in propene and
oxygen was investigated by an isothermal UV-Vis-DRS experiment at 675 K Dehydrated 77 wt
VxOySBA-15 was heated to 675 K and held for 15 minutes in 5 O2 in He During the thermal treatment
in 5 O2 in He only a red shift of several nm was detected The exposure of the sample to the reaction
atmosphere at 675 K (5 min 5 O2 and 5 propene) caused an immediate blue shift In order to reveal
whether the blue shift was not caused by reduced vanadium phases the atmosphere was switched to 20
O2 in He to induce a re-oxidation No change in the absorption spectra was observed Thus it was shown
that the blue shift was not caused by the formation of reduced (V4+V3+) tetrahedrally coordinated
vanadium centers
-60 -80 -100 -120 -140
CCCC
BBBB
AAAA
Q2Q3Q4
00100
01684
102565
Q4
Q3
Q2
[ppm]
5
10
15
250 300 350 400 450
F(R
infin)
Wavelength [nm]
1) 5 O2
2) 5 O2 5 propene
3) 20 O2
675 K
Figure 7-6 Left in situ UV-Vis-DR spectra of dehydrated 77 wt VxOySBA-15 (623 K 1 h) after subsequent treatment at 675 K in (1) oxygen (2) propene and oxygen and (3) oxygen Right 29Si CP-MAS-NMR of SBA-15 and 77 wt VxOySBA-15 treated at different temperatures (A) SBA-15 (B) dehydrated 77 wt VxOySBA-15 (653 K 1 h) (C) dehydrated 77 wt VxOySBA-15 (653 K 1 h) after propene oxidation (5 propene and 5 O2 in He 673 K 1 h) The red curve is the sum of the Gaussian functions used for the profile refinement
125
The second reason (ii) that the distortion of the VO tetrahedron decreased was not corroborated by
XAFS refinement results A blue shift of the UV-Vis edge energy would be observed if the average V-O
bond length decreased (Chapter 522 Figure 5-2 right) The parameters in Table 7-2 show clearly that
the average V-O distance and the disorder parameters underwent no significant change
Reason (iii) implies a change of the oxygen ligands induced by the interaction with the propene molecule
In the previous Chapter 6 such an exchange was interpreted by a change of V-OHSi-OH to V-O-Si
groups This interpretation was corroborated by NMR measurements that allowed determining the Si-OH
distribution on the SBA-15 support As shown in Figure 7-7 (right) exclusively Q4 type Si centers and
no Si-OH centers were detectable on the SBA-15 support after the catalytic measurement of dehydrated
77 wt VxOySBA-15 However Gao et al [23] observed a similar decrease of the number of isolated
Si-OH centers with NIR-DR spectroscopy for a 1 VxOySiO2 sample under catalytic (methanol
oxidizing) conditions For the same 1 VxOySiO2 sample they observed a comparable blue shift of the
UV-Vis edge energy from 36 eV to 38 eV as observed here for VxOySBA-15 under catalytic conditions
Gao et al [23] assigned the decrease in Si-OH centers to the formation of Si-O-CxHy species The blue
shift in the UV-Vis-DR spectra was assigned to the formation of isolated 4-fold V-methoxy species [23]
which is in contrast to the interpretation here The feasibility of detecting V-O-CxHy species formed
during propene oxidation at 675 K with UV-Vis-DRS seems not very likely Even though such V-O-CxHy
and Si-O-CxHy species may form as intermediates it is expected that these are oxidized in 20 O2
atmospheres at 675 K and that the blue shift will be reversible Figure 7-7 (left) shows that no change in
the UV-Vis-DR spectra of 77 wt VxOySBA-15 was observed after changing the gas phase from
catalytic conditions to 20 O2 at 675 K Therefore the transformation of V-OH to V-O-Si bonds seems
to be the explanation of the blue shift if it was assumed that the type of oxygen group changed during
propene oxidation Another reason (vi) for the observed blue shift in the UV-Vis-DR spectra may be a
change in the average V-O-V number In this case some of the dimeric centers may transform into
isolated tetrahedral vanadium centers and additional V-O-Si bonds are formed Reason (vi) was
corroborated by the decreasing UV-Vis edge energy determined for dehydrated VxOySBA-15 after the
reaction which indicates a lower connectivity of the vanadium centers (V-O-V number Chapter 522) In
contrast the XAFS measurements showed no clear trend that would support this interpretation The
increase of the disorder parameter of the V-V distances (33 and 36 Aring) for 41 wt and 77 wt
VxOySBA-15 (Table 7-2) may indicate that some of the dimeric tetrahedral vanadium centers
transformed into isolated ones Nevertheless the opposite trend was observed for 14 wt VxOySBA-15
The disorder parameter for the V-V distances of 14 wt VxOySBA-15 decreased after propene oxidation
(Table 7-2) However the transformation of V-OHSi-OH groups to V-O-Si bonds (reason (iii)) rather
than the V-O-V bond rupture (reason (iv)) seems to be the more likely explanation of the blue shift
observed in the UV-Vis-DR spectra This suggestion was corroborated by the fact that the blue shift of
the UV-Vis edge energy observed was larger for 14 wt VxOySBA-15 than for 41 wt and 77 wt
VxOySBA-15 14 wt VxOySBA-15 already exhibits a considerable amount of isolated vanadium
centers and a lower number of V-O-V bonds
126
724 Enhanced reactivity of 77 wt VxOySBA-15ndashImpact of V2O5 and carbonaceous species
In the temperature range where the blue shift of the UV-Vis absorption bands occurred an increased
acrolein formation was detected in the first measurement run of 14 wt and 77 wt VxOySBA-15
(Figure 7-2 A and B) This was visible as a small shoulder in the acrolein ion current detected in the first
measurement run (Figure 7-2 bottom) For 14 wt VxOySBA-15 the ion current at temperatures above
600 K was not higher than in the second run Therefore the increased acrolein formation in the lower
temperature range of 500-600 K may be correlated with the structural rearrangement of the dehydrated
VxOySBA-15 structure in the initial phase of the reaction The increased acrolein formation detected for
77 wt VxOySBA-15 at higher temperatures may be caused by other reasons The presence of V2O5
seems likely for 77 wt VxOySBA-15 in contrast to 14 wt VxOySBA-15 These small fractions of
V2O5 may enhance the reactivity of 77 wt VxOySBA-15 for propene oxidation That bulk V2O5 is
active for the selective oxidation of propene towards acrolein will be discussed in more detail in Chapter
2 The UV-Vis-NIR-DR spectra of 77 wt VxOySBA-15 showed small absorption bands in the NIR
range of the spectra which are indicative for vanadium centers with lower oxidation states Conversely in
the UV-Vis-NIR-DR spectra of 14 wt VxOySBA-15 and of freshly calcined and dehydrated 77 wt
VxOySBA-15 (Figure 7-7 left) such absorption bands were not detected in the NIR range (05-2 eV)
Thus these bands may be caused by V2O5 formed during aging that was reduced under reaction
conditions V2O5 crystallites can be detected very sensitively by Raman spectroscopy Conversely Raman
bands of reduced vanadium oxide species are hardly detectable by Raman spectroscopy [18161]The
cross-section for Raman scattering is near zero for reduced vanadium centers [161] A reversible shift to
1035 cm-1 was detected for the Raman band at 1041 cm-1 which was assigned to temperature depended
effects
200 400 600 800 1000 1200
673 K
623 K
573 K
523 K
473 K
373 K
Inte
nsity
Raman shift [cm-1]
298 K
5 0512 34
0
123
Energy [eV]
0
02
04
06
08
F(R
infin)
4
5
10
Energy [eV]
F(R
infin)
77 wt V
14 wt V
298 K
Figure 7-7 Left In situ UV-Vis-NIR-DR spectra of dehydrated (dashed line) 14 wt and 77 wt VxOySBA-15 (623 K) after 1st (solid line) and 2nd (dashed and dotted line) catalytic measurement (675 K 5 O2 and 5 propene in He) Right in situ Raman spectra of dehydrated 77 wt VxOySBA-15 (723 K 20 O2 in N2) in 5 O2 and 5 propene in N2 514 nm 6 mW
127
Even though (reduced) V2O5 was observed for 77 wt VxOySBA-15 the increased acrolein formation
detected was not assigned to such a phase The amount of V2O5 formed on 77 wt VxOySBA-15 was
estimated to be 3-5 of the vanadium oxide phase (Chapter 629) As discussed later on (Chapter 726)
it was shown by catalytic testing that this amount is too low to explain the increased activity of 77 wt
VxOySBA-15
Carbonaceous species formed during reaction may also enhance the catalytic activity of 77 wt
VxOySBA-15 for the propene oxidation The formation of carbonaceous species in propene atmospheres
was reported by Zhao et al [158] They observed characteristic Raman bands at approximately 1400 cm-1
and 1600 cm-1 in the in situ Raman spectra of 5 and 8 VxOySiO2 catalysts (12 and 27 Vnm2)
recorded at 623 K in 3 propene [158] Such Raman bands were visible in the in situ Raman spectra of
hydrated and dehydrated 77 wt VxOySBA-15 recorded during the temperature programmed reaction in
5 propene and 5 O2 in the range from 298 K to 523 K (Figure 7-8) These bands were not detected at
higher temperatures The Raman bands of carbonaceous species had a significantly lower intensity for
77 wt VxOySBA-15 dehydrated prior to reaction in propene and oxygen (Figure 7-8 right) Hence
intermediates during the dehydration of hydrated VxOySBA-15 may enhance formation of carbonaceous
species The carbon formation observed was not caused by residual carbon from the preparation because a
carbon amount lower than 01 wt was determined by CHN elemental analysis of hydrated VxOySBA-
15 samples Hence the carbon has to be formed by decomposition of propene Nevertheless Raman
bands of the carbonaceous species were not detectable above 573 K This temperature is below the
temperature (600 K) where 77 wt VxOySBA-15 showed an increased activity for acrolein formation
compared to 14 wt VxOySBA-15 Apparently neither V2O5 nor carbonaceous species were responsible
for the enhanced catalytic activity of 77 wt VxOySBA-15 Therefore this effect is assigned to an
intrinsic property of the ldquoordered V2O7rdquo structure of dehydrated VxOySBA-15 present for high vanadium
loadings near the maximum vanadium coverage of disperse vanadium oxide species on SBA-15
250 500 750 1000 1250 1500 1750
500
1000
1500
2000
2500
3000
623 K
573 K
523 K
473 K
363 K
423 K
Inte
nsity
Raman shift [cm-1]
298 K
10
15
20
25
500 1000 1500
Nor
mal
ized
Inte
nsity
Raman shift [cm-1]
473 K ldquohydratedrdquo
523 K ldquohydratedrdquo
473 K ldquodehydratedrdquo
523 K ldquodehydratedrdquo
Figure 7-8 Left in situ Raman spectra of hydrated 77 wt VxOySBA-15 during propene oxidation 5 O2 and 5 propene in N2 514 nm 6 mW Right Comparison of the in situ Raman spectra of hydrated and dehydrated 77 wt VxOySBA-15 during propene oxidation at 473 K and 523 K
128
725 Evaluation of the different reactor types for quantitative catalytic measurements
Prior to the discussion of the results obtained from catalytic reaction tests a short evaluation of the
suitability of the reaction cells used for catalytic measurements will be performed Three different types
of reaction cells were used to characterize the VxOySBA-15 samples under propene oxidizing conditions
Mainly in situ XAS and UV-Vis-DRS cells were used for the structural characterization Catalytic results
obtained in the in situ cells were compared to measurements conducted in a laboratory fixed bed reactor
(SiO2 tube ldquoquartz glassrdquo) Therefore both in situ cells and the reactor were connected to the same online
mass spectrometer and gas chromatograph to allow qualitative and quantitative determination of the
respective gas phase composition The catalytic propene oxidation (5 O2 and 5 propene in He) of
dehydrated 77 wt VxOySBA-15 (20 O2 in He 554-653 K) is used for comparison The propene
conversion and the sum selectivity towards all oxygenated reaction products as a function of temperature
are depicted in Figure 7-9 for all reactors used A more detailed depiction of the selectivities is given in
Figure 10-5 in the appendix The temperature range where acceptable results were obtained was different
for all reactors used For XAFS measurements reliable quantitative results were obtained for temperatures
higher than 673 K The low propene conversion is due to the low sample mass of 24 mg which was
required for the XAFS measurements at the V K edge In contrast to the in situ XAS cell significantly
higher propene conversion was determined in the in situ UV-Vis-DR cell for temperatures above 520 K
because a higher amount of sample could be introduced into the sample holder (189 mg) Temperatures
higher than 673 K were not feasible in the in situ UV-Vis-DR cell Moreover a high deviation of 20 in
temperature between the sample and the sample cup was observed The sample mass in the quartz glass
reactor was adjusted to a propene conversion between 5-10 at 673 K According to the different sample
masses used the rate of propene oxidation and the respective selectivities of the reaction products are
compared in Figure 7-9 (right)
500 600 700 8000
5
10
15
20
25
30
35
40 XAS SiO
2 tube
UV-Vis-DRS
Con
vers
ion
Pro
pene
[]
Temperature [K]
00
02
04
06
08
10
Selectivity O
xygenates
SiO2-Tube UV-Vis-DR XAS SiO
2-Tube
00
02
04
06
08
10676 K
Sel
ectiv
ity
acetic acid acrolein acetone propionaldehyde acetaldehyde CO CO
2
673 K635 K 633 K
0
2
4
6
8
10
12
14
Rate
Rate [micro
molpropene g
cat s]
Figure 7-9 Propene conversion and oxygenate selectivity (left) Propene conversion rate referred to the sample mass and product selectivities determined in the different measurement cells during the temperature programmed propene oxidation using dehydrated 77 wt VxOySBA-15 (right)
129
Rates of propene oxidation relative to the mass of the catalyst were comparable for the temperatures
employed The reaction rate was slightly increased for the UV-Vis-DR cell compared to the fixed bed
reactor at the same temperature (633 K) Reaction rates determined at 673 K in the XAS cell and in the
fixed bed tube reactor were almost the same Nevertheless the selectivities of the reaction products
formed were different for the various reaction cells In contrast to the tube reactor and the UV-Vis-DR
cell no acetic acid was observed in the XAS cell Although the propene conversion of the empty XAS
cell (stainless steel) was low (lt 05 Xpropene 673 K) compared to the sample measurement
(~18 Xpropene 673 K) the cell itself may be active for propene oxidation Therefore the XAS cell was
not suitable for deriving quantitative catalytic results Comparing the catalytic results of the tube reactor
and the UV-Vis-DR cell similar selectivities of the reaction products were detected Compared to the
tube reactor higher selectivities of CO2 and CO were detected whereas lower selectivities of acetic acid
and acetaldehyde were observed in the UV-Vis-DR cell Approximately the same selectivity towards
acrolein was detected for both reaction cells (17 in SiO2 tube reactor 15 in UV-Vis-DR cell)
Therefore some fractions of the partial oxidation products (mainly acetic acid and acetaldehyde) were
reacting to form CO and CO2 in consecutive reactions in the UV-Vis-DR cell These reactions may take
place at the hot sample holder (metal) or at sample locations exhibiting a higher temperature than the
average fraction of the sample In summary comparable catalytic behavior was detected for propene
oxidation conducted in the quartz glass reactor and the UV-Vis-DR cell For clarity and to reduce the
numbers of figures below only the quantitative results obtained in the SiO2 tube (ldquoquartz glassrdquo) reactor
are depicted
726 Impact of the pretreatment procedure on the catalytic performance of VxOySBA-15
In situ spectroscopic measurements showed that a similar vanadium oxide structure was present on the
SBA-15 support under catalytic conditions independent of thermal pretreatment prior to the catalytic runs
or the presence of water vapor The vanadium oxide structure was proposed to be similar to the
dehydrated VxOySBA-15 structure that consists of an ordered arrangement of [V2O7] units and in the
case of 14 wt VxOySBA-15 also of [VO4] vanadium centers Exposure to catalytic conditions resulted
in an increasing structural disorder of the vanadium centers on the support This was observed to be
independent of the vanadium loading for all pretreatment and reaction conditions Hence if a similar
structure is present under catalytic conditions the same catalytic performance will be measured
Evolution of propene conversion as a function of temperature is shown in Figure 7-10 for differently
treated 77 wt and 14 wt VxOySBA-15 The sample mass of VxOySBA-15 with different loading
was adjusted to the same amount of vanadium in the reactor (~ 08-09 mg V) For clarity SBA-15
(105 mg) and boron nitride (240-290 mg) which was used as diluent showed propene conversions below
~ 02 (Table 7-6)
130
500 600 7000
5
10
15
20
25
30
35
40 A B C D E F G H
Con
vers
ion
C3H
6 []
(nor
m t
o 10
5 m
g sa
mpl
e)
Temperature [K]
500 600 7000
10
20
30
40
Con
vers
ion
C3H
6 [
]
(nor
m t
o 60
mg
sam
ple)
Temperature [K]
A C E F
Figure 7-10 Propene conversion during propene oxidation (5 O2 and 5 propene in He) on 14 wt VxOySBA-15 (right) and 77 wt VxOySBA-15 (left) (A) dehydrated sample 653 K 1 h 20 O2 in He (B) dehydrated sample 763 K 1 h 20 O2 in He (C) ldquorecalcinedrdquo sample 843 K 12 h 20 O2 in He (D) ldquomultisteprdquo sample (i) 843 K 12 h 20 O2 in He (ii) 298 K 24 h 20 O2 and 2 H2O in He 653 K 1 h 20 O2 in He (E) hydrated sample (F) hydrated sample and 08 H2O in the reaction gas (G) physical mixture of V2O5 and SBA-15 (8 wt V) (H) physical mixture of ldquoball milledrdquo V2O5 and SBA-15 (8 wt V) Approximately 08-09 mg V was used for all measurements
For the reaction conditions employed in the spectroscopic measurements the same propene conversions
with increasing temperature were observed for differently treated samples (Figure 7-10 curve AEF)
However differences were present when 77 wt VxOySBA-15 was pretreated at 763 K for 1 h (Figure
7-10 left curve B) or recalcined at 843 K for 12 h (Figure 7-10 left curve C) The propene conversion
decreased significantly compared to measurements without a pretreatment procedure (Figure 7-10 left
curve EF) or with a thermal treatment at lower temperature (653 K Figure 7-10 left curve A) Such a
difference was not observed for 14 wt VxOySBA-15 (Figure 7-10 right)
NMR measurements showed that after recalcination of 77 wt VxOySBA-15 almost no Si-OH centers
were detectable (Chapter 626 Figure 6-7) Additionally XAS measurements showed that the
dehydrated vanadium oxide structure was the same as determined for the standard pretreatment procedure
(623 K 05-1 h Chapter 629 Table 6-3) Furthermore in the case of ldquoagedrdquo 77 wt VxOySBA-15
samples a decrease of the structural disorder of the ldquoagedrdquo dehydrated vanadium oxide structure was
observed after recalcination In contrast to the increased structural order of the vanadium oxide phase
after recalcination a significant change in the XAFS spectra was observed if the ldquorecalcinedrdquo sample was
treated under reaction conditions Figure 7-11 depicts the V K edge XANES spectra and the
corresponding FT(χ(k)k3) of ldquorecalcinedrdquo 77 wt VxOySBA-15 after reaction in propene and oxygen
A decrease of the pre-ege peak height from 076 to 063 was detected in the XANES spectra Using the
linear correlation introduced in Chapter 524 an increase of the average V-O distance from 177 to
184 Aring was indicated A reduction of the valence of the vanadium centers which may explain a decrease
of the pre-edge peak was excluded because of the unchanged energy position of the pre-edge peak
maximum in the V K edge XANES (54 eV relative to V K edge at 5465 eV)
131
55 555 56
05
10
15
A
B N
orm
aliz
ed A
bsor
ptio
n
Photon Energy [keV]
00
005
0 2 4 6
R [Aring]
AB
FT
(χ(k
)k3 )
Figure 7-11 V K edge XANES spectra (left) and FT(χ(k)k3) (right) of 77 wt VxOySBA-15 recorded at 298 K after ldquorecalcinationrdquo at 768 K for 8 h in 20 O2 in helium (A) and after a temperature programmed propene oxidation at 723 K 5 O2 and 5 propene in He (B)
Moreover a change in the V-O coordination from 4- to 5-fold seems likely but cannot be distinguished
unambiguously from a distorted 4-fold V-O coordination To show that the dehydrated [V2O7] model
structure was suitable to describe the experimental FT(χ(k)k3) of recalcined 77 wt VxOySBA-15 after
reaction in propene and oxygen an XAFS refinement was conducted The results are summarized in
Table 7-4 Compared to the refinement conducted to the FT(χ(k)k3) after calcination an increase of the
disorder parameters of all scattering paths used was determined A significant increase of the V-V
distances was determined which was accompanied by an increase of the confidence limits For the
disorder parameters determined for the V-Si distance at 25 Aring and for the V-V distances F parameters
higher than 05 were determined After propene oxidation that was conducted after a recalcination
pretreatment (gt 760 K) the vanadium oxide structure was strongly distorted This is in contrast to
samples pretreated below 723 K
Table 7-4 Experimental distances and XAFS disorder parameters (σ2) for different types of atom at distance R from the absorbing V atom in a model system assuming an ordered arrangement of [V2O7] units (Chapter 5) Parameters were obtained from the refinement of this model structure to the experimental V K edge XAFS FT(χ(k)k3) of dehydrated 77 wt VxOySBA-15 (k range from 27-105 Aring-1 R range 083-362 Aring Nind = 16 E0 = 0 eV in all cases (subscript c indicates parameters that were correlated in the refinement subscript f indicates parameters that were fixed in the refinement) Recalcination was conducted in 20 O2 in He at 768 K for 8 h and propene oxidation at 723 K (5 O2 and 5 propene in He)
77 wt VxOySBA-15
dehydrated for 12 h 768 K after propene oxidation
Type ( N) R [Aring] σ2 [Aring2] R [Aring] σ2
[Aring2]
V ndash O (1) 178 00063 179 00108
V ndash O (1) 178 c 00063 c 179 c 00108 c
V ndash O (2) 178 c 00063 c 179 c 00108 c
V ndash O (1) 289 00012 f 293 0003 f
V ndash V (1) 330plusmn002 00010 337plusmn004 00149 (F=06)
V ndash V (1) 360plusmn003 00010 c 373plusmn007 00149 c
V ndash Si (1) 253 00112 252 00190 (F=08)
Residual 59 95
132
Spectroscopic measurement suggested that during the catalytic process V-O-Si bonds were formed The
formation of such bonds to the support would be more likely if Si-OH centers were present As
determined from NMR these centers were almost absent after recalcination of 77 wt VxOySBA-15
Thus the low availability of these centers on recalcined 77 wt VxOySBA-15 causes the high structural
distortion of the vanadium oxide structure because of a lack of binding sites with the support SBA-15
Such a decrease in propene conversion was not observed for low loaded 14 wt VxOySBA-15 This
may be explained by the lower V to surface ratio (03 Vnm2) and the higher surface (40) of this sample
Thus the probability that Si-OH centers remained after the recalcination process was higher Due to the
fact that no comparable NMR or XAFS measurements were performed with recalcined 14 wt
VxOySBA-15 this could not be investigated further That the presence of OH groups either Si-OH or V-
OH was important for obtaining the higher propene conversion was shown by a rehydration experiment
Curve D in Figure 7-10 shows the propene conversion for 77 wt VxOySBA-15 that was pretreated in a
multistep procedure The sample was recalcined for 12 h at 843 K and afterwards rehydrated at 298 K for
24 h with 2 H2O vapor and finally dehydrated for 1 h at 653 K After this multistep treatment the
propene conversion above 600 K was even enhanced compared to 77 wt VxOySBA-15 that was just
dehydrated at 653 K for 1 h
For 77 wt VxOySBA-15 V2O5 may have formed on the SBA-15 support Therefore V2O5 may cause
the increased activity compared to recalcined 77 wt VxOySBA-15 To estimate the reactivity of
crystalline V2O5 compared to 77 wt VxOySBA-15 two physical mixtures of V2O5 and SBA-15 with
8 wt V were prepared The first mixture was prepared using well crystalline V2O5 (domain size gtgt
1000 Aring) and the second with less crystalline V2O5 (Debye-Sherrer domain size ~ 170 Aring) that was treated
in a ball mill Both samples showed an increasing propene oxidation above 650 K (Figure 7-11 left
curve G and H) In contrast to the well crystalline V2O5 sample the ldquoball milledrdquo V2O5 sample showed a
strong increase in the propene conversion above 700 K For higher temperatures the propene conversion
remained constant whereas the oxygen conversion increased to ~ 100 Similar to the results discussed
in Chapter 2 for bulk V2O5 reduced V4+ and V3+ phases may be present Thus ldquonanordquo crystallinerdquo V2O5
formed on SBA-15 may have a similar reactivity at lower temperatures as the dehydrated VxOySBA-15
phase but it is more likely that this phase is reduced to less reactive V4+ and V3+ vanadium oxide phases
at higher temperatures (gt 700 K) Furthermore the reactivity could only be only comparable to 77 wt
VxOySBA-15 if an equal V mass was used for the catalytic measurements In Chapter 629 the amount
of V2O5 formed on ldquoagedrdquo 77 wt VxOySBA-15 was estimated by Raman spectroscopy to be 3 This
would mean that only 02 wt of the V was present as crystalline V2O5 Such a small amount of
crystalline V2O5 would not explain the increased reactivity of 77 wt VxOySBA-15
A second measurement run was conducted to investigate the reproducibility of the increased propene
conversion on 77 wt VxOySBA-15 with ldquomildrdquo or no pretreatment procedure Figure 7-12 depicts the
propene conversion during the first and the second measurement of 77 wt VxOySBA-15 pretreated at
653 K for 1 h or pretreated at 763 K for 1 h
133
500 600 7000
5
10
15
20
25
30
35
40 dehydrated 763 K 1h Run 1 dehydrated 763 K 1h Run 2 dehydrated 653 K 1h Run 1 dehydrated 653 K 1h Run 2
C
onve
rsio
n C
3H6 [
]
(nor
m t
o 10
5 m
g sa
mpl
e)
Temperature [K]
0 2 4 6 8 10 12040
050
060
Sel
ectiv
ity O
xyge
nate
sTime [h]
0
5
10
15
dehydrated 840 K 12 h dehydrated 650 K 1 h hydrated H
2O
hydrated
Con
vers
ion
C3H
6 []
Figure 7-12 Propene conversion and oxygenate selectivity during propene oxidation (5 O2 and 5 propene in He) of 77 wt VxOySBA-15 for different treatments During subsequent temperature programmed reactions (left) and under isothermal conditions at 673 K (right)
Similarly to the UV-Vis-DRS measurements (Figure 7-2 bottom left) the formation of aldehydes
increased for the first run of 77 wt VxOySBA-15 pretreated at 653 K for 1 h (Figure 10-6 appendix)
For 77 wt VxOySBA-15 pretreated at 653 K the conversion of propene was lower in the second run
whereas the conversion increased for 77 wt VxOySBA-15 pretreated at 763 K for 1 h It seems that for
both pretreatment procedures the conversion of propene approached the same value In order to further
investigate this behavior long-term measurements (8-12 h) at 673 K were performed for selected
pretreatment procedures
0 5 10 15 20 25 3000
02
04
06
08
10
A B C D
Sel
ectiv
ity O
xyge
nate
s
Conversion C3H
6 []
A B C D00
02
04
06
08
10
Sel
ectiv
ity
CO2
CO acetaldehyde propionaldehyde acetone acrolein acetic acid
0
2
4
6
8
10
12
14
16
18
20
propene conversion oxygen conversion
Conversion [
]
Figure 7-13 Oxygenate selectivity versus propene conversion determined after 8-12 h at 673 K (left) for 77 wt VxOySBA-15 and comparision of the product selectivities for similar propene conversion (right) (A) dehydrated sample 653 K 1 h 20 O2 in He (B) hydrated sample (C) hydrated sample and 08 H2O in the reaction gas (D) ldquorecalcinedrdquo sample 843 K 12 h 20 O2 in He (Details Table 7-5)
134
In all measurements the propene conversion and the selectivity towards C2 and C3 oxygenates approached
the same values (Figure 7-12 right) These were similar to the values obtained for 77 wt
VxOySBA-15 dehydrated at 653 K for 1 h After the long-term measurements the initial flow rate was
varied (20-75 mlmin ~ 08 ml reactor volume 1500-5625 h-1 GHSV) The resulting selectivity versus
propene conversion is depicted in Figure 7-13 As indicated from the subsequent measurements the
dependence of the selectivity on the propene conversion was similar for all treatment procedures
employed For all treatments of 77 wt VxOySBA-15 an increase of the COx (CO and CO2) formation
was measured with increasing propene conversion Similar product selectivities were obtained for all
treatment procedures for the same propene conversion of 4-5 (Table 7-5) The main difference between
the various treatment procedures was the increase of selectivity towards acetic acid from 7 to 10-13 on
the samples that were not pretreated in oxygen The additional water content in the reaction gas mixture
of 08 Vol did not change the selectivity towards the products formed Interestingly 77 wt
VxOySBA-15 that was recalcined prior to reaction in propene and oxygen showed a significantly
enhanced oxygen conversion of 20 This was more than twice as much as detected for the other
treatment procedures This pretreatment resulted in the lowest propene conversion rate of 77 wt
VxOySBA-15
The same catalytic performance was observed for all treatment procedures This matches the observation
that the same vanadium oxide species were present on the support UV-Vis-DR spectra that were
recorded after 4 h at 673 K in the reaction mixture showed a blue shift of the characteristic absorption
band of the dehydrated tetrahedral VxOySBA-15 phase Furthermore absorption bands below 600 nm
(2 eV) that are indicative for d-d transitions of reduced vanadium oxide phases were detected Some V2O5
phases may have formed that were reduced during the reaction The UV-Vis-DR spectra of subsequent
measurements of 77 wt VxOySBA-15 in propene showed a similar trend (Figure 7-14) The amount of
reduced V slightly increased after a second temperature programmed reaction in propene and oxygen
Conversely absorption bands below 600 nm were absent in the UV-Vis-DR spectra for 14 wt
VxOySBA-15 after propene oxidation of 4 h at 673 K Therefore the dehydrated tetrahedral species was
not reduced
Table 7-5 Product selectivities and propene conversion of 77 wt VxOySBA-15 at 673 K after 8-12 h (Figure 7-13 (right)) (A) dehydrated sample 653 K 1 h 20 O2 in He (B) hydrated sample (C) hydrated sample and 08 H2O in the reaction gas (D) ldquorecalcinedrdquo sample 843 K 12 h 20 O2 in He (rate [micromolpropene(gmiddots)] g=mv or mcat GHSV gas hour space velocity referred to a 08 ml reactor volume and a 20-75 mlmin volume flow)
Treat- Mass GHSV Conversion
[] Rate Selectivity [] C
balance
ment mg [h-1] C3H6 O2 mv mcat CO2 CO Aa Pa Ac Ar AcA ΣC2-
3 []
A 106 4500 44 95 118 9 20 29 15 9 1 17 8 50 995
B 108 5625 48 116 158 12 18 30 15 7 2 16 13 52 997
C 106 4500 41 123 110 8 20 32 14 6 1 17 10 48 1007
D 110 3000 40 203 69 5 20 31 15 6 1 19 7 48 995
135
0
4
1
2
3
5 051234
Energy [eV]
F(R
infin)
)
14 wt VxOySBA-15
0
15
5
10
5 051234
Energy [eV]
F(R
infin)
77 wt VxOySBA-15
reduced V
Figure 7-14 UV-Vis-DR spectra of dehydrated (623 K 20 O2 in He) 14 wt (right) and 77 wt (left) VxOySBA-15 recorded at 298 K after dehydration (solid line) and propene oxidation (dotted line) at 675 K for 4 h
727 Impact of the vanadium loading on the catalytic performance of VxOySBA-15
Figure 7-15 depicts the conversion and the selectivities obtained for all VxOySBA-15 samples during
temperature programmed reaction and during isothermal reaction in 5 propene and 5 oxygen at
673 K The sample mass was adjusted to the same vanadium content in the reactor All samples were
dehydrated in 20 O2 in helium at 653 K for 1 h before temperature programmed reaction in propene and
oxygen The same increase in propene conversion was detected for 14 wt and 41 wt VxOySBA-15
(Figure 7-15 left bottom) Higher 673 K the propene conversion of 77 wt VxOySBA-15 was
significantly increased compared to the propene conversion of 14 wt and 41 wt VxOySBA-15 For
lower temperatures the increase in propene conversion was similar to that of the lower loaded
VxOySBA-15 samples The corresponding products selectivities are depicted in Figure 7-15 (right) For
all vanadium loadings an increase in the formation of COx products was detected (CO2 and CO) with
increasing temperature Approximately the same evolution of the CO2 selectivity was detected for all
VxOySBA-15 samples Conversely the selectivity towards CO increased with increasing vanadium
loading Furthermore mainly acetaldehyde propionaldehyde acetone acrolein and acetic acid (C2 and C3
oxygenated products) were detected for all VxOySBA-15 samples
In contrast to 41 wt and 77 wt VxOySBA-15 only minor amounts of acetic acid were detectable for
14 wt VxOySBA-15 Conversely higher amounts of propionaldehyde were detected for 14 wt
VxOySBA-15 Except for the selectivity towards acrolein and acetaldehyde for 14 wt VxOySBA-15 a
significant drop in the C2 and C3 selectivity oxygenated products was observed with increasing
temperature For a more precise comparison the selectivity versus conversion plots were measured by
varying the initial flow rate of the sample gas stream (20-75 mlmin total volume flow ~ 08 ml reactor
volume 1500-5625 h-1 GHSV) These measurements were conducted after 8-12 h at 673 K to ensure that
no fast changes in the gas phase composition occurred Propene conversion and selectivities determined
were constant after that time for all samples (Figure 7-15 right)
136
500 600 7000
10
20
30
40 77 wt V 41 wt V 14 wt V
Con
vers
ion
[]
Temperature [K]
600 650 700 750
00
01
02
03
04
05
Temperature [K]
Sel
ectiv
ity
00
01
02
03
04
05
Sel
ectiv
ity
00
01
02
03
04
05
06
77 wt V
41 wt V
14 wt V
Sel
ectiv
ity
0 2 4 6 804
05
06
14 wt V 41 wt V 77 wt V
Sel
ectiv
ity O
xyge
nate
s
Time [h]
673 K
2
4
6
8
Con
vers
ion
[]
Figure 7-15 Left top Propene conversion and oxygenate selectivity during propene oxidation (5 O2 and 5 propene in He) of dehydrated 14-77 wt VxOySBA-15 under isothermal conditions at 673 K (right) Left bottom and right Propene conversion and product selectivity of dehydrated 14-77 wt VxOySBA-15 during the temperature programmed reaction in propene and oxygen (5 O2 and 5 propene in He) (symbols on right side circle=CO square=CO2 closed triangle up=acrolein open triangle up=acetaldehyde open triangle down=propionaldehyde half filled triangle= acetone closed star=acetic acid)
A decrease of oxygenate products with increasing propene conversion was observed for all samples
(Figure 7-16 top left) The sum selectivity towars all oxygenates was approximately 10 higher for 14
wt VxOySBA-15 than for 41 wt and 77 wt VxOySBA-15 The single selectivities towards the
products formed were compared at the same propene conversion The detailed results are listed in Table
7-6 and shown Figure 7-16 Interestingly the ratio of the reacted amount of oxygen and the reacted
amount of propene increased from 13 to 20 and 25 with increasing amount of vanadium on SBA-15
respectively Hence different reaction mechanism may proceed on the higher loaded VxOySBA-15
samples
137
Table 7-6 Product selectivities and propene conversion of dehydrated 14-77 wt VxOySBA-15 (653 K 1 h 20 O2) at 673 K after 8-12 h (1 rate [micromolpropene(gmiddots)] 2 GHSV gas hour space velocity referred to 08 ml reactor volume and 20-75 mlmin volume flow3 ball milled V2O5 + SBA-15 4 at 643 K 6 at 684 K)
Sample Mass GHSV2 Conversion []
Rate1 Selectivity [] C balance
[wt V] mg [h-1] C3H6 O2 mv mcat CO2 CO Aa Pa Ac Ar AcA ΣC2-3 []
14 106 3000 37 45 63 09 20 15 12 20 5 25 2 64 994
41 218 3000 36 65 59 24 20 26 17 7 2 23 5 54 999
77 60 5625 36 83 121 93 19 28 15 10 2 18 7 52 997
83 115 3000 26 62 41 32 22 29 16 3 1 20 8 49 1001
V2O54 20 3000 28 60 5 28 28 15 13 2 2 20 13 50 998
SBA-155 105 3000 - - - - - - - - - - - - -
BN6 460 3000 02 03 - 00 33 22 7 - - 22 - 40 100
0 2 4 6 8 10 12 14 16 18 2000
02
04
06
08
10
14 wt 41 wt 77 wt
Sel
ectiv
ity O
xyge
nate
s
Conversion []14 wt 41 wt 77 wt
0
2
4
6
8
10C
onve
rsio
n [
]
propene conversion oxygen conversion
0
1
2
3
[c298K (O
2 )-c633K (O
2 )][c298K (p)-c
633K (p)]
reacted oxygenpropene
14 wt 41 wt 77 wt00
01
02
03
04
05
Sel
ectiv
ity
V Content
CO2 CO acetaldehyde
propionaldehyde acetone acrolein acetic acid
14 wt 41 wt 77 wt00
02
04
06
Sel
ectiv
ity
CO2 acrolein
CO + acetaldehyde + propionaldehyde acetic acid + acetone
Figure 7-16 Oxygenate selectivity versus propene conversion determined after 8-12 h at 673 K (left top) for dehydrated 14-77 wt VxOySBA-15 Comparison of propene and oxygen conversions (right top) and product selectivities corresponding to the conversions shown (bottom) (Table 7-6)
138
The reaction products observed match the reaction products reported in the literature for propene
oxidation on VxOySiO2 samples (Table 7-1) Conversely the product selectivities detected here deviate
from the selectivities reported in the literature (Table 7-1) This difference in the product selectivities
observed may be explained by the different reaction temperatures used and the absence of a high content
of water in the reaction feed In the presence of a high water content in the gas phase typically high
amounts of acetone and acetic acid were reported [15159] If no additional water is introduced high
selectivities towards acetaldehyde acetone and acrolein were reported [16158160] Moreover minor
amounts of acrylic acid were reported [16] Comparing the selectivities towards the reaction products
formed showed that the same selectivity towards CO2 (20) was observed independent of the vanadium
content of the VxOySBA-15 samples The selectivities towards all other reaction products changed with
varying vanadium loading The selectivity towards C3 aldehyde oxygenates (acrolein propionaldehyde
and acetone) was enhanced for 14 wt VxOySBA-15 compared to higher loaded 41 wt and 77 wt
VxOySBA-15 With increasing vanadium loading the selectivity towards the partial degradation products
(C2 oxygenates and CO) increased The amounts of product observed may be explained in a similar way
to those of the selective oxidation of propane and propylene on bulk mixed metal oxide catalysts
(Bettahar et al [5] and Lin et al [3]) A simplified version of the possible reaction pathways (A B and
C) is given in Figure 7-17 Various reaction pathways for selective propene oxidation were discussed by
Bettahar et al [5] and Lin et al [3] Three types of aldehydes (acrolein (B) propionaldehyde (C) and
acetone (A)) seem likely to be formed from the partial oxidation of propene The corresponding alcohols
are possible intermediates [35] The partial degradation products acetaldehyde and acetic acid may form
from the consecutive oxidation of propionaldehyde and acetone
CH3-CH2-CH3
CH2=CH-CH3
CH2=CH-CH2-OH
CH2=CH-CHO + H2O
CH3-CH2-CH2-OH CH3-CH(OH)-CH3
CH3-CH2-CHO + H2O CH3-CO-CH3 + H2O
CH3-COOH + COx + H2O CH2=CH-COOH CH3-CHO + COx + H2O
COx + H2O
A B C
Figure 7-17 Main oxygenate products of the partial oxidation of propane and propene [35]
139
The highest selectivity towards acrolein (25) propionaldehyde (20) and acetone (5) was
determined for 14 wt VxOySBA-15 (Table 7-6 Figure 7-16) With the increase of the vanadium
content in the VxOySBA-15 samples a significant decrease of the propionaldehyde selectivity from 20
to 7-10 was observed This was accompanied by an increase in CO selectivity from 15 to 26-28 and
an increase of the acetaldehyde selectivity from 12 to 15-17 The other reaction products showed less
intense changes in selectivity with increasing vanadium content The selectivity towards acrolein
decreased from 25 to 18 and acetone selectivity decreased from 5 to 2 Conversely acetic acid
selectivity increased from 2 to 7 with increasing vanadium loading The proposed reaction scheme
was suitable to explain the observed product selectivities because the decreased acetone selectivity was
accompanied with an increased formation of acetic acid Furthermore a decrease of propionaldehyde
selectivity was accompanied by an increased formation of acetaldehyde and COx Only CO increased with
the decreasing propionaldehyde selectivity Therefore CO may be the major COx oxidation product from
the consecutive oxidation of propionaldehyde Additionally the CO observed may be formed from
oxidation of acetone to acetic acid because increase of CO selectivity was stronger than increase of
acetaldehyde selectivity In order to determine which reaction pathway of the propene oxidation was
present the selectivities towards propionaldehyde CO and acetaldehyde were combined (Figure 7-16
right bottom) These products represent reaction pathway C Acetone and acetic acid were selectivity
combined to represent reaction pathway A The combined selectivities towards path A and C together
with those towards acrolein (B) and CO2 are depicted in Figure 7-16 (right bottom) Independent of the
vanadium loading approximately the same selectivity was determined towards CO2 formation (20)
The combined selectivity towards path A showed a small increase (7-9) Interestingly the combined
selectivity towards reaction pathway C increased by 6 (47 to 53) whereas the acrolein selectivity
decreased by 7 (25 to 18) with increasing vanadium content Thus the higher vanadium content
mainly shifts the propene oxidation to reaction pathway C Furthermore the probability of a consecutive
reaction of the corresponding C3 aldehydes the formation of acetaldehyde and acetic acid increased with
increasing vanadium content of the VxOySBA-15 samples This increase in consecutive reactions
matches the increased oxygen conversion observed for 41 wt and 77 wt VxOySBA-15
Comparing the rates of propene oxidation per gram vanadium showed that no dependence on the surface
area was determined (Table 7-6) for VxOySBA-15 samples The reaction rate per gram vanadium was
approximately the same for 14 wt (highest surface area) and 41 wt VxOySBA-15 and was twice as
high for 77 wt VxOySBA-15 at 673 K (lowest surface area) Similarly to the rate of propene oxidation
the rate of acrolein formation increased by approximately 40 for 77 wt VxOySBA-15 compared to
41 wt and 14 wt VxOySBA-15 A similar observation was made by Zhao et al [15158] for
VxOyAl 2O3 but not for VxOySiO2 The increased activity of 77 wt VxOySBA-15 may be an effect of
the high density of vanadium centers on the surface or of the presence of small clusters of crystalline
vanadium oxide phases The latter was excluded because reduced vanadium phases were also observed
for 41 wt VxOySBA-15 Thus the high density of vanadium oxide centers on 77 wt VxOySBA-15
may explain the enhanced rate of propene oxidation
140
Additionally propene oxidation rate and product selectivities measured for bulk V2O5 are listed in Table
7-6 These values were not determined after several hours of reaction but from the temperature
programmed reactions using a constant rate (Figure 7-10 curve H and Figure 2-9 Chapter 2)
Apparently no significant changes in the product selectivities were obtained for V2O5 reference
compared to 77 wt VxOySBA-15 Hence similar reaction mechanisms may proceed on the surfaces of
V2O5 and of high loaded 41 and 77 wt VxOySBA-15 The reaction rate of propene oxidation per gram
vanadium was lower for bulk V2O5 This was explained by the higher amount of accessible vanadium
surface sites present on VxOySBA-15 samples
728 The influence of the oxygen and propene concentration on the catalytic performance of
VxOySBA-15
The measurements discussed above showed that similarly to propene oxidation on bulk mixed metal
oxides three reaction pathways can be distinguished for the propene oxidation on VxOySBA-15 catalysts
A second set of experiments intended to investigate the impact of various propene and oxygen
concentrations on the catalytic performance of 14 wt and 77 wt VxOySBA-15 Therefore the
samples were heated with a constant rate to 713 K Measurements were performed at 593 K 633 K
673 K and 713 K (plusmn 4 K) No pretreatment procedure was conducted prior to the temperature
programmed oxidation in propene and oxygen This resulted in an increase of 6 for the acetic acid
selectivity and a slight decrease (3) of the acrolein and propionaldehyde selectivities compared to the
sample pretreated at 653 K (1 h 20 O2 in He) The oxygen to propene ratio was varied from 5 to 05 by
changing the initial propene and oxygen concentrations (Vol O2 Vol propene ~ 25 55 755 105
575 525 and 51) The resulting conversions and selectivities (633 K) are depicted in Figure 7-18 For
clarity the reacted ratio of oxygen and propene is also shown Independent of the initial ratio the ratio of
reacted O2propene remained constant between 20 and 25 for 77 wt VxOySBA-15 and between 14
and 21 for 14 wt VxOySBA-15 Furthermore no drastic changes of the product selectivity were
observed With decreasing O2propene ratio a decrease of the CO selectivity from 33 to 25 was
observed This was accompanied by an increase of the acrolein selectivity from 14 to 18 and a
decrease of the propionaldehyde selectivity from 3 to 1 The change in selectivity for all other
products was below 1 Hence an excess of oxygen in the gas phase may mainly facilitate the oxidation
of acrolein to CO on 77 wt VxOySBA-15
141
479 207 205 156 107 071 0470
2
4
6
8
10
12
0
2
4
6
8
10
1277 wt VxO
ySBA-15 633 K
[c298K (O
2 )-c633K (O
2 )][c298K (p)-c
633K (p)]
conversion propene conversion oxygen reacted ratio oxygenpropene
Con
vers
ion
[]
Initial Ratio O2propene
479 207 205 156 107 071 04700
01
02
03
04
0577 wt V
xO
ySBA-15 633 K
Sel
ectiv
ity
Initial Ratio O2propene
CO2 CO acetaldehyde propionaldehyde
acetone acrolein acetic acid
489 211 209 161 107 073 0480
2
4
6
8
10
0
2
4
6
8
1014 wt V
xO
ySBA-15 633 K
conversion propene conversion oxygen reacted ratio oxygenpropene
[c298K (O
2 )-c633K (O
2 )][c298K (p)-c
633K (p)]
Con
vers
ion
[]
Initial Ratio O2propene
489 211 209 161 107 073 04800
01
02
03
0414 wt V
xO
ySBA-15 633 K
CO2 CO acetaldehyde propionaldehyde
acetone acrolein acetic acid
Sel
ectiv
ity
Initial Ratio O2propene
Figure 7-18 Propene and oxygen conversion reacted ratio of oxygenpropene and product selectivities for (hydrated) 14 wt and 77 wt VxOySBA-15 as a function of the initial oxygen to propene ratio in the reaction gas at 633 K (Vol O2 Vol propene ~ 25 55 755 105 575 525 and 51)
142
The selectivity towards acrolein (25) remained constant with decreasing O2propene ratio for 14 wt
VxOySBA-15 (Figure 7-18) Conversely the selectivity towards propionaldehyde increased This
increase was accompanied by a decrease of the CO2 selectivity from 21 to 15 and of the CO
selectivity from 17 to 12 In the case of 14 wt VxOySBA-15 an oxygen excess may facilitated the
deeper oxidation of propionaldehyde to CO and CO2 These results suggest that an excess of oxygen in
the reaction mixture enhances the content of unselective oxygen species These oxygen species may react
with the C3 aldehydes to form COx The probability that acrolein will be oxidized to COx seems to be
lower than for the oxidation of propionaldehyde This would explain that the acrolein selectivity
decreases on 77 wt VxOySBA-15 where only low amounts of propionaldehyde were detected
According to Grzybowska-Świerkosz [162] gaseous or chemisorbed oxygen species (O2 O2- or O-) may
be responsible for the deep oxidation of propene to COx products
Reaction orders determined for propene and oxygen indicated that the formation of acrolein was mainly
independent of the oxygen content Taking a formal kinetic reaction approach the reaction orders of
propene (m) and oxygen (n) can be obtained from the acrolein reaction rate (Equation 61) Keeping the
concentration of one reactant constant allows determining the reaction order of the other reactant by
measuring the reaction rate of acrolein as a function of its concentration
)()()( 2 propenecOckacroleinr mneff sdot= (71)
rarr [ ] [ ] [ ] [ ])(ln)(lnln)(ln 2 propenecmOcnkacroleinr eff ++= (72)
In the case of a constant oxygen concentration the reaction order for propene was calculated from the
linear function 63 refined to the experimental data The corresponding plots depicted in Figure 10-7 and
Figure 10-8 in the Appendix
[ ] [ ] [ ])(lnln)(ln propenecmkacroleinr eff += (73)
The reaction orders were determined at 633 K to ensure differential conversions below 10 for both
VxOySBA-15 samples Reactions orders of m ~ 05 and n ~ 0 were obtained for 14 wt VxOySBA-15
A slight increase to n = 02 was observed for 77 wt VxOySBA-15 which may be due to the stronger
influence of electrophilic oxygen Similar reaction orders were determined by Zhao et al for VxOySiO2
[158] They interpreted the reaction order of zero for oxygen as an indicator that only V5+ vanadium
centers are the active site Reduced crystalline V2O5 phases were excluded as active centers [158] The
reaction order of 05 for propene cannot be explained unambiguously Typically a reaction order of 05
indicates that the molecule dissociates at the catalyst surface This may be indicative for the necessary H
abstraction step that is discussed in the process of the activation of the propene molecule for further
oxidation to acrolein However this interpretation is highly speculative without further investigating
different kinetic models Nevertheless the reaction order of zero for oxygen indicates that formation of
acrolein was mainly independent of the oxygen content and a fast re-oxidation of the vanadium centers
during catalytic propene oxidation
143
729 The influence of the oxygen to propene ratio on the structure of VxOySBA-15
A reaction order of zero for oxygen in the selective oxidation of propene to acrolein indicated a fast
reoxidation of the vanadium centers involved Therefore the majority of vanadium centers should have
an average oxidation state of V5+ Temperature programmed UV-Vis-DRS measurements were conducted
with 14 wt and 77 wt VxOySBA-15 using various oxygen and propene concentrations to investigate
the major vanadium oxide phase under these conditions The samples were dehydrated at 554 K for 1 h in
20 O2 in He prior to temperature programmed reaction in propene and oxygen The maximum
temperature applied was 626 K Propene to oxygen ratios of 15 55 51 and 50 were investigated The
resulting UV-Vis-DR spectra for 14 wt and 77 wt VxOySBA-15 after reaction are depicted in
Figure 7-19 A significant increase in intensity in the range of 05-30 eV was determined in the UV-Vis-
DR spectra without oxygen in the gas phase during the reaction Absorption bands in this region are
indicative of reduced vanadium centers For all other propene to oxygen ratios approximately the same
UV-Vis-DR spectra were recorded This was even the case for the 15 oxygen to propene ratio UV-Vis
absorption bands below 30 eV were absent and characteristic UV-Vis absorption bands of V5+ tetrahedral
vanadium centers were observed above 3 eV This corroborated that independently of the vanadium
loading the majority of the vanadium centers are V5+ centers A more detailed discussion about the
reduced vanadium oxide state and redox properties of VxOySBA-15 under reaction conditions will be
given in the next chapter
0
15
5
10
5 051234
Energy [eV]
F(R
infin)
77 wt VxOySBA-15
0
4
1
2
3
5 051234
Energy [eV]
F(R
infin)
14 wt VxOySBA-15
Figure 7-19 UV-Vis-DR spectra of dehydrated 14 wt (right) and 77 wt VxOySBA-15 (left) recorded at 298 K after temperature programmed reaction in various oxygenpropene mixtures in He at 636 K after dehydration 554 K 20 O2 (dotted grey) 55 (dotted red) 15 (dashed black) 51 (dashed and dotted blue) and 05 (solid black)
144
73 Concluding remarks on the catalytic performance and the structural evolution of VxOySBA-15 during catalytic propene oxidation
731 Structural evolution of VxOySBA-15 during propene oxidation
XAFS measurements and Raman experiments showed that mainly the dehydrated VxOySBA-15 structure
was present during propene oxidation Compared to the structure obtained after dehydration in 20 O2 a
wider V-V distance distribution was determined from XAFS refinements of 41 wt and 77 wt
VxOySBA-15 after propene oxidation Conversely XAFS measurements showed that the V-V interaction
or V-Si interaction increased for 14 wt VxOySBA-15 A structural transformation comparable to the
dehydration process described in Chapter 6 was observed when hydrated VxOySBA-15 samples were
used for catalytic measurements Raman measurements showed that carbonaceous species were formed
below 573 K during temperature programmed reaction of hydrated VxOySBA-15 in propene oxidizing
conditions For 77 wt VxOySBA-15 thermally treated in 20 O2 at 768 K for 8 h a significant change
compared to the dehydrated state was observed in the XANES spectra and in the FT(χ(k)k3) after
propene oxidation This change may be caused by a strong distortion of the dehydrated ldquoordered V2O7rdquo
structure The average vanadium oxidation state was V5+ for all treatments employed NMR
measurements showed that on dehydrated 77 wt VxOySBA-15 (573 K 1 h 20 O2 in He) no Si-OH
centers were detected after propene oxidation at 673 K (5 O2 and 5 propene in He 1 h)
The characteristic absorption band in the UV-Vis-DR spectra of dehydrated VxOySBA-15 was blue
shifted under propene oxidizing conditions For 77 wt VxOySBA-15 small amounts of reduced
vanadium oxide phases were present under catalytic conditions These were ascribed to partially reduced
V2O5 nano particles present on ldquoagedrdquo VxOySBA-15 samples The blue shift observed occurred for all
VxOySBA-15 samples in the range of 500-600 K In this temperature region an increase of propene
conversion propionaldehyde and acrolein formation was observed compared to a repeated measurement
The onset of catalytic activity (aldehyde formation) was in the range of 500-520 K The blue shift of the
absorption band under propene oxidation conditions (gt 550 K) was observed independent of the initial
VxOySBA-15 structure and the vanadium loading The blue shift may be caused by a reaction of V-OH
groups to Si-O-V groups This reaction would be accompanied by a decrease of Si-OH centers which
matches the decrease of Si-OH centers detected by NMR
Changes in the V-OH and Si-OH concentration were also reported for other oxidation reactions A similar
decrease of Si-OH centers accompanied with a similar blue shift in the UV-Vis-DR spectra was observed
by Gao et al [23] during catalytic methanol oxidation using a 1 VxOySiO2 catalyst Launay et al [26]
observed a decrease of the V-OH IR absorption bands at ~3660 cm-1 on a 21 VxOySiO2 catalyst during
methane oxidation Furthermore Launay et al [26] reported an increased number of V-OH species that
may lead to a better catalytic activity in the methane oxidation to formaldehyde The results reported in
145
the literature imply that the V-OH bond may be involved in the oxidation of propene Li et al [159]
reported that such V-OH centers (ascribed to Broslashnstedt acid centers) are the major active site for the
oxidation of propene to acetone in the presence of water They proposed a ldquoV-O-CH-(CH3)2rdquo as
intermediate [159] Such an intermediate suggests that the V-OH group attacks the C=C double bond of
the propene molecule Moreover the decrease of the Si-OH groups during propene oxidation indicates
reduced vanadium centers left after the desorption of acetone may react with the Si-OH centers to Si-O-V
bonds Another interpretation for the decrease of Si-OH centers may be that not the V-OH bond but the
V-O-V bond or a V-(OH)-V bond reacts with the propene molecule In this case the blue shift in the UV-
Vis-DR spectra would be considerably smaller for low loaded 14 wt VxOySBA-15 than for higher
loaded 41 wt and 77 wt VxOySBA-15 However on 14 wt VxOySBA-15 a lower number of
V-O-V bonds was present and the blue shift increased with decreasing vanadium content Therefore V-
OH bonds seem to be involved in the formation of V-O-Si bonds during propene oxidation
732 Catalytic performance of VxOySBA-15 during propene oxidation
Nevertheless more acrolein and propionaldehyde than acetone were detected in the temperature range
where the blue shift in the UV-Vis absorption spectra occurred (Figure 10-6) The higher concentration
of C3 aldehydes indicates a complex reaction of propene with VxOySBA-15 The formation of acetone
and propionaldehyde may be explained by the attack of electrophilic oxygen on the C=C double bond in
propene which would result in an adsorbed [OC3H6] that is negatively charged In contrast the formation
of acrolein is generally described by a nucleophilic attack of Mn+-O2- to the propene molecule According
to Grzybowska-Świerkosz [162] this redox or ldquoMars van Krevelen mechanismrdquo is started by H
abstraction from the methyl group of propene This results in the formation of a π-allyl species that is
positively charged The π-allyl species is then attacked by the nucleophilic Mn+-O2- center A second H
abstraction results in the formation of acrolein Subsequently H atoms are transferred to adjacent Mn+-O2-
centers that form M(n-1)+-OH centers The reduced metal sites are reoxidzied by gaseous oxygen The
formation of propionaldehyde and acetone from propene via a electrophilic mechanism and the formation
of acrolein via a nucleophilic mechanism was calculated by Li et al [163164] for a V4O11- cluster In the
case of acrolein and propionaldehyde two vanadium centers were involved The fact that the acrolein
selectivity remained relatively constant with increasing temperature suggests that acrolein may be formed
by the nuclephilic mechanism with π-allyl stabilization (Figure 7-15 right) The selectivities towards all
other oxygenates decreased significantly with increasing temperature because the impact of electrophilic
oxygen from the gas phase increases at elevated temperature
Nevertheless acrolein was not the major product of catalytic propene oxidation on VxOySBA-15
According to Figure 7-17 reaction pathway C the oxidation to propionaldehyde and acetaldehyde was
enhanced on VxOySBA-15 samples Thus more reactive electrophilic than nuclephilic oxygen species
were present The origin of electrophilic oxygen may be a consequence of the re-oxidation of reduced
vanadium centers with molecular oxygen Recently Kontratenko et al [165] reported that Vn+middotmiddotmiddotOmiddot-
species are detectable by EPR after the re-oxidation of reduced vanadium centers on VOxMCM41 These
146
Vn+middotmiddotmiddotOmiddot- oxygen species reacted rapidly with propene [165] Using highly disperse VxOySiO2 and bulk
VxOy vanadium oxides Kontratenko et al [165166] showed that the selectivity towards propene was
improved by using N2O instead of oxygen in the reaction of propane to propene Hence more
nucleophilic oxygen formed during the re-oxidation of reduced VxOyMCM41 with N2O than with O2
[165] Thus future investigations with other oxidizing agents like N2O which may enhance the
selectivity of acrolein during propene oxidation on VxOySBA-15 catalysts would be desirable
733 Impact of vanadium loading on the catalytic performance of VxOySBA-15
The reaction rate of propene conversion and acrolein formation per gram V was enhanced for 77 wt
VxOySBA-15 in contrast to 14 wt and 41 wt VxOySBA-15 Conversely the vanadium oxide
structure of the dehydrated 41 wt and 77 wt VxOySBA-15 samples showed no distinct differences
during temperature programmed reaction in propene However the arrangement of [V2O7] units may be
slightly different on 77 wt VxOySBA-15 from that on 41 wt VxOySBA-15 This may not be
resolved with the spectroscopic methods used It seems likely that the local vanadium density on 77 wt
VxOySBA-15 may be higher and areas with high and low vanadium dispersion may exist A higher
vanadium density would imply that more disperse vanadium centers than the proposed [V2O7] dimers
may be involved in the catalytic process More than two vanadium centers seem likely to facilitate redox
mechanism discussed above which may explain the increased acrolein formation on 77 wt
VxOySBA-15 A similar increased acrolein formation was reported by Zhao et al [16] for the oxidation
of propene to acrolein over vanadium oxides supported on Al2O3 with high vanadium loading but not for
vanadium oxides supported on SiO2 Nevertheless an increased number of adjacent [V2O7] units may
explain the increased activity of 77 wt VxOySBA-15 Furthermore the decreasing activity in repeated
or long term measurements may be explained by a different arrangement of [V2O7] units For instance V-
(OH)-V bonds between the [V2O7] units may exist that decrease with time In contrast to acrolein
formation vanadium loading of VxOySBA-15 samples had only minor effects on the observed
selectivities towards the different reaction pathways (Figure 7-17) Increasing the vanadium content on
SBA-15 facilitated only the consecutive oxidation of the C3 aldehydes Hence decreasing the vanadium
loading of VxOySBA-15 does not change the basic reaction pathways of propene oxidation on
VxOySBA-15
734 Selective oxidation of propene to acrolein on isolated ldquoVO4rdquo centers
The selective oxidation towards acrolein was observed with 18-25 selectivity independent of the
vanadium loading Regarding the concept of ldquosite isolationrdquo proposed by Grasselli et al [167] at least two
available oxygen sites must be present for the stoichiometric reaction of propene to acrolein and water
Moreover the reaction involves two hydrogen abstraction steps from the methyl group of the propene
which requires at least two availablerdquoV-Ordquo functionalities An ordered dimeric [V2O7] structure was
proposed for higher loaded 41 wt and 77 wt VxOySBA-15 and thus the formation of acrolein seems
feasible Conversely an isolated tetrahedral [VO4] structure may be present on 14 wt VxOySBA-15
147
because of the high UV-Vis edge energy of 39 eV In the case of isolated [VO4] units the oxygen sites
involved in the reaction must originate from the same vanadium center Therefore different ldquoV-Ordquo bonds
located at the same vanadium center must be involved Zhao et al [158] proposed the participation of the
V-O-Si bond in the oxidation process of propene However the low reducibility of 14 wt
VxOySBA-15 after the catalytic reaction observed in this work (Chapter 8) indicates a high strength of
the V-O-Si bond Thus this bond may not be involved in the reaction process In consequence of an
inactive V-O-Si bond different sources of ldquoV-Ordquo must be present No clear evidence about the nature of
this source can be given based on the results obtained in this work but two options seem likely The high
UV-Vis edge energy of 39 eV after propene oxidation clearly points to isolated vanadium species In this
case the number of V-O-Si bonds must be lower than 3 to explain the reaction without a rupture of
V-O-Si bonds in the case of isolated vanadium centers Therefore other ldquoV-Ordquo sites may be involved in
the reaction eg V-O- V=O or V-OH groups Another explanation may be that the proposed isolated
vanadium tetrahedrons are in spatial proximity similar to dimeric vanadium centers proposed for 77 wt
VxOySBA-15 This allows a reaction mechanism involving two vanadium sites eg two V=O sites This
assumption is corroborated by the fact that the dimeric [V2O7] model structure was suitable to describe
the experimental Fourier transformed EXAFS obtained for 14 wt VxOySBA-15 after reaction in
propene and oxygen The latter explanation is preferred here because more than one vanadium center
may enable a better electron transfer during the catalytic reaction
735 Elucidation of structure-activity correlations with respect to other model systems
The observed selectivities towards the oxygenated products of 77 wt VxOySBA-15 were not
significantly different from those obtained for bulk V2O5 Therefore similar active centers may be present
on the surface of VxOySBA-15 and of bulk V2O5 catalysts Moreover a significant influence of the
support material was excluded Compared to other supports (eg Al 2O3) SBA-15 exhibits only few weak
acidic centers that would interact with the rather basic propene molecule [22168] Mostly an increase of
the acetic centers was observed if vanadium oxides were added to the SiO2 supports Assuming similar
active centers for V2O5 and high loaded VxOySBA-15 may explain the small differencs in the
selectivities observed between bulk and supported vanadium oxides Regarding the structure activity
correlations of more complex mixed metal catalysts eg MoVTe this result indicates that structural
complexity of vanadium sites in selective propene oxidation may play only a minor role and that chemical
complexity may be more important Hence the presence of different metal sites will be required to
enhance the catalytic performance of vanadium This is in contrast to results reported for supported
molybdenum model catalysts For MoxOySBA-15 [8] and MoO3VGCNF [9] catalysts an increased
catalytic performance was observed for the oxidation of propene towards acrolein For these molybdenum
systems the structural complexity of the molybdenum oxides was more important than the chemical
complexity In the next stage of model catalysts supported mixed metal oxides systems should be
investigated in more detail to reveal the impact of chemical and structural complexity on the catalytic
performance The results obtained for VxOySBA-15 model catalysts indicate that addition of vanadium
148
sites to other supported transition metal host structures will only improve acrolein selectivity if the
vanadium sites are in cooperation with the transition metal oxide structure during catalytic reaction
Recently heteropolyoxomoybdates containing vanadium supported on SBA-15 were described [10]
These systems seem promising to derive further structure functionality relationships addressing the role
of vanadium and molybdenum during selective propene oxidation
74 Summary
In situ UV-Vis-DRS XAS and Raman measurements showed that the dehydrated VxOySBA-15
structure mainly persisted under catalytic propene oxidizing conditions Moreover the dehydrated
VxOySBA-15 structure was observed even when hydrated VxOySBA-15 samples were used for catalytic
measurements or when small amounts of water vapor (08 Vol) were added to the reaction mixture
Apparently the SBA-15 support stabilizes the dehydrated VxOySBA-15 structure under catalytic
conditions Temperature programmed reaction (5 propene and 5 oxygen in He) on hydrated
VxOySBA-15 samples showed that a structural transformation (dehydration) proceeded similar as
observed under dehydrating conditions in 20 O2 in He A wider V-V distance distribution was
determined for 41 wt and 77 wt VxOySBA-15 from XAFS measurements after propene oxidation
Hence a small decrease of the structural order may have occurred during propene oxidation Conversely
an increase of the V-V contributions or V-Si contributions to the FT(χ(k)k3) was observed for 14 wt
VxOySBA-15
The onset of catalytic activity was in the range of 500-520 K The onset was accompanied by a blue shift
of the UV-Vis edge energy The blue shift may be caused by the formation of additional V-O-Si bonds to
the SBA-15 support Therefore V-OH bonds may have reacted with the propene molecule and residual
Si-OH groups may have formed V-O-Si bonds during the re-oxidation of the reduced vanadium centers
The V-O-Si bond formation was an irreversible process The blue shift of the UV-Vis edge energy in the
temperature range of 500-600 K correlated with an increased formation of oxygenated reaction products
A comparable blue shift and increased aldehyde formation was not observed in repeated measurements
During the catalytic oxidation of propene mainly the following products were observed acrolein
propionaldehyde acetaldehyde acetone acetic acid CO and CO2 Three parallel reaction pathways were
suggested from these reaction products The main reaction pathway proceeds via the formation of
propionaldehyde and acetaldehyde The second reaction pathway proceeds via the formation of acrolein
A third reaction pathway with low selectivity proceeds via the formation of acetone and acetic acid CO
and CO2 formed cannot be ascribed to a specific reaction pathway The different kinds of reaction
products formed suggest that nucleophilic and electrophilic oxygen species may be present during
catalytic propene oxidation on VxOySBA-15
149
No significant differences in catalytic performance were observed using dehydrated (653 K 1 h 20 O2
in He) and hydrated VxOySBA-15 samples Nevertheless a slight increase of acetone and acetic acid
fomation was observed for catalytic measurements that were performed using the hydrated VxOySBA-15
samples Hence more V-OH groups than present on dehydrated VxOySBA-15 may form during
decomposition of hydrated VxOySBA-15 in propene and oxygen
The catalytic activity of 77 wt VxOySBA-15 recalcined for 12 h at 843 K was significantly lower A
strong structural distortion and an increased oxygen conversion were detected for this sample The
structural disorder of recalcined 77 wt VxOySBA-15 was ascribed to missing HO-Si binding sites for
vanadium centers that interacted with the propene molecule
Vanadium loading of VxOySBA-15 had only a minor effect on the oxygenate selectivities determined
The selectivity towards acrolein and propionaldehyde decreased and the selectivity towards acetaldehyde
acetic acid and CO increased with increasing vanadium loading on SBA-15 Furthermore the
consecutive oxidation of the C3 aldehydes increased with increasing vanadium loading The oxygenate
selectivities determined for 77 wt VxOySBA-15 resembled those of bulk V2O5 Therefore similar
active vanadium oxide centers may be present on VxOySBA-15 and V2O5 VxOySBA-15 showed no
reduction under catalytic conditions in contrast to bulk V2O5
150
151
8 Investigation of reducibility and re-oxidation of
VxOy-SBA-15 catalysts
81 Introduction
Catalytic measurements of VxOySBA-15 showed that the average valence of the vanadium oxide remains
V5+ under catalytic conditions Similar observations were reported for MoxOySBA-15 catalysts [10]
MoxOySBA-15 catalysts showed a low reducibility even under reducing conditions in propene and H2
(773 K) The low reducibility (Mo6+ to Mo58+) was assigned to a stabilizing effect of the SiO2 support
[10] However in the previous chapter absorption bands at wavelengths longer than 500 nm observed
during the temperature programmed reaction with 5 propene at 636 K give rise to the conclusion that
the disperse vanadium oxide phase is reducible with propene at lower temperatures A reduction of the
vanadium oxide phase was observed for high and low loaded VxOySBA-15 respectively The
observation of reduced disperse vanadium oxide phases on SiO2 is in contrast to results reported by Zhao
[158] Zhao concluded from Raman and UV-Vis-DR measurements (3 propene 623 K) that disperse
tetrahedral [VO4] species present on SiO2 were not reduced with propene Only a reduction of V2O5 nano
particles present at higher loadings occurred [158] Except for the work by Zhao [158] no report was
found in the literature that addresses the reduction of VxOySiO2 with propene Ovsitser et al [29]
reported for VxOyMCM that under reducing conditions in hydrogen and propane at 773 K absorption
bands in the range of 400-800 nm appear in the UV-Vis-DR spectra These were assigned to reduced
vanadium centers They determined a fast re-oxidation (~ 5 s) of the reduced vanadium centers and a
slower ( ~ 5 min) reduction kinetic from isothermal experiments at 773 K (change of propane and oxygen
containing gas atmospheres) Using oxygen as oxidizing agent they observed fully oxidized vanadium
centers under propane oxidizing conditions [29] Nevertheless most reports in the literature describe the
formation of reduced vanadium centers on VxOySiO2 with a disperse vanadium oxide structure In these
investigations the reduction of the vanadium centers was conducted using hydrogen or vacuum
[22242544] It was proposed from H2-TPR measurements combined with ESR measurements (up to
1200-1300 K) that the vanadium centers in VxOySiO2 can be reduced to V4+ and V3+ [25] For samples
which were reduced at lower temperatures Du et al [22] concluded from XAFS measurements that only
V4+ centers are present after reduction in hydrogen at 773 K Venkov et al [44] inferred using FTIR
investigations with CO and NO as probe molecules that V3+ and V4+ with two different coordinative
vacancies are present after reduction in H2 and after evacuation Different types of V4+ centers were
reported by Berndt et al [24] They discussed the presence of V4+Ox centers (two different sites in and
outside the pores of the MCM material) and acidic V4+5+O(OH)x(OSiequiv)3-x centers [24]
152
In summary no clear picture of the reduced vanadium centers on VxOySiO2 was obtained from reports
that discuss the role of reduced vanadium centers on silica material Therefore it was intended to further
elucidate the valence state and the structure of the VxOySBA-15 model catalysts under changing
oxidative (oxygen and propene together with oxygen) and reducing (propene) conditions
153
82 Results and discussion
821 Local structure of VxOySBA-15 under reducing conditions
UV-Vis-DRS investigations (Chapter 729 Figure 7-19) showed that temperature programmed
treatment of dehydrated 14 wt and 77 wt VxOySBA-15 in propene resulted in the formation of
reduced vanadium oxide phases on the SBA-15 support In situ XAS measurements were conducted to
determine the nature of the reduced vanadium oxide phases Dehydrated 77 wt VxOySBA-15 was
treated in 5 propene in He at 673 K for 1 h and 723 K for 1 h The V K edge XANES χ(k)k3 and
FT(χ(k)k3) of 77 wt VxOySBA-15 and of the bulk vanadium oxide references V3O7 VO2(B) and
V2O3 are depicted in Figure 8-1 Compared to the XANES spectrum recorded after dehydration a change
of the XANES structure a shift of the absorption edge and a significant decrease of the pre-edge peak
height from 073 to 032 (673 K) and 020 (723 K) were observed (Figure 8-1 left) The XANES features
after reduction of dehydrated 77 wt VxOySBA-15 at 673 K resembled those of the VO2(B) reference
Thus indicating a reduction towards V4+ The intensity of the first XANES feature increased with
increasing temperature (723 K) and the pre-edge peak height decreased to 020 In addition to V4+ V3+
centers may have formed After reduction of 77 wt VxOySBA-15 no similarity of the χ(k)k3 and the
FT(χ(k)k3) with that of bulk references was observed (Figure 8-1 middle right) The oscillation in the
χ(k)k3 of reduced 77 wt VxOySBA-15 was strongly damped compared to that of dehydrated 77 wt
VxOySBA-15
0
20
40
4 6 8 10
χ(k)
k3
3
A
B
C
D
E
F
k [Aring-1]
0
2
4
6
55 555 56
Nor
mal
ized
Abs
orpt
ion
Photon Energy [keV]
A
B
C
D
E
F
073
020
032
049
030
012
01
02
03
04
05
0 2 4 6
FT
(χ(k
)k3 )
R [Aring]
A
B
C
D
E
F
Figure 8-1 V K edge XANES spectra (left) χ(k)k3 (middle) and FT(χ(k)k3) (right) recorded at 298 K (A) dehydrated 77 wt VxOySBA-15 (623 K 20 O2) (B) dehydrated 77 wt VxOySBA-15 (623 K 20 O2) after reaction in 5 propene in He at 723 K (C) dehydrated 77 wt VxOySBA-15 (623 K 20 O2) after reaction in 5 propene in He at 673 K (D) V3O7 (E) VO2(B) (F) V2O3
154
Variation in the positions of the oscillation in the χ(k)k3 of reduced 77 wt VxOySBA-15 indicate
structural transformations compared to the dehydrated 77 wt VxOySBA-15 structure This
interpretation was corroborated by the damped FT(χ(k)k 3) of 77 wt VxOySBA-15 after reduction
(Figure 8-1 right) An overall reduction of the FT(χ(k)k3) of reduced 77 wt VxOySBA-15 suggests a
strong structural distortion The maximum of the first signal in the FT(χ(k)k3) due to V-O interactions
shifted to longer distances The second signal in the FT(χ(k)k3) increased with increasing temperature
This signal cannot be assigned unambiguously to a specific contribution (V-V V-O V-Si) but the
increase implies structural changes in the second coordination sphere of the absorbing vanadium centers
during reduction The low similarity of the χ(k)k3 and FT(χ(k)k3) of 77 wt VxOySBA-15 after
reduction with those of bulk vanadium oxide references with 5- and 6-fold coordination of the vanadium
atoms showed that the reduced vanadium centers in 77 wt VxOySBA-15 maintained their tetrahedral
coordination A XANES analysis using the pre-edge peak area and centroid energy (explained in more
detail in Chapter 524) according to Chaurand et al [94] was employed for a more precise identification
of the coordination and the oxidation state of the vanadium centers The pre-edge peak area of V2O5 was
normalized to the same value (080) as reported by Charaund et al [94] The pre-edge peak areas of all
other samples measured in this work were referred to the normalized V2O5 pre-edge peak area
(parameters are listed in Table 10-4 appendix) The resulting graph is depicted in Figure 8-2 The
parameters reported by Charaund et al [94] were slightly different compared to the parameters
determined here This effect was assigned to lower resolution in the XANES region in this work
35 40 45 50 55 6000
02
04
06
08
10(P
y) V5++(O
h) V4+
(Py) V4+
(Py) V5+
(Oh) V4+
(Oh) V5+
(Oh) V3+
V5+
square pydramids
V5+
distorted octrahedrons
V5+
chains of tetrahedrons
V5+
isolated and dimeric tetrahedrons
V5+
square pydramids + tetrahedrons
hydrated 77 wt VxO
ySBA-15
dehydrated 77 wt VxO
ySBA-15
Chaurand et al
dehydrated 77 wt VxO
ySBA-15
673 K 5 propene
dehydrated 77 wt VxO
ySBA-15
723 K 5 propene
V3+ V4+ V46+ vanadium oxidesNor
mal
ized
Pre
-edg
e P
eak
Are
a
Centroid Energy [eV]
(Td) V5+
Figure 8-2 Normalized pre-edge peak areas (referred to the area of V2O5 that was normalized to 080) versus centroid energy of vanadium reference compounds and 77 wt VxOySBA-15 after various treatments Additionally the values reported by Chaurand et al [94] are shown Dashed rings refer to the coordination of absorbing vanadium centers (Oh = octrahedral Py = pyramidal Td = tetrahedral) Detailed parameters are listed in Table 10-4 in the appendix
155
Comparing the values depicted for V5+ references a good identification of the coordination of the
absorbing vanadium centers was possible from the horizontal energy shift of the centroid energy Even a
differentiation of various connectivities was feasible In the case of tetrahedral V5+ references a shift of
25 eV was observed between the centroid energy of references built of isolated and dimeric tetrahedrons
and references that are comprised of chainlike tetrahedrons An energy shift of 05 eV was observed
between the centroid energy of V2O5 (layered arrangement of square pyramids) and [V2O6] vanadate
references (chains of square pyramids) A decrease of the average valence resulted in a decreasing pre-
edge peak area and energy shift The normalized pre-edge peak areas determined for reduced
VxOySBA-15 were smaller than those of vanadium oxide references with average vanadium valence
lower than +5 Hence mainly V4+ centers may be present after reduction at 623 K After reduction at
723 K a mixture of V4+ and V3+ may be present Tetrahedral V4+ references were not available in this
work which made the assignment of coordination and average valence difficult Figure 8-2 The centroid
energies of 45 eV and 40 eV suggest that no octahedral V4+ vanadium oxide centers (55 eV) were
present in reduced 77 wt VxOySBA-15
In situ investigations were employed to determine the temperature range where the reduction of vanadium
centers of dehydrated 77 wt VxOySBA-15 occured Figure 8-3 depicts the evolution of the V K edge
XANES spectra and the evolution of the water ion current (me 18) during temperature programmed
reduction in 5 propene in He from 298 K to 723 K A small increase of the ion current me 18 was
observed in the range of 300-330 K In this range no structural changes were observed in the XANES
spectra A change in the XANES structure and the pre-edge peak height was observed above 520 K The
decrease of the pre-edge peak height was correlated with the formation of water in the gas phase (Figure
8-3 right) Therefore the decreasing pre-edge peak height was due to the reduction of the vanadium
oxide phase on SBA-15 The water ion current (me 18) remained constant above 650 K indicating that
the reduction was not completed The onset of reduction of 77 wt VxOySBA-15 at 520 K coincidenced
with the onset of catalytic activity during the temperature programmed reaction in 5 propene and 5 O2
(Chapter 7)
00
05
10
55
555
56
300400
500 600
700
Photon Energy [keV]Temp [K]
Nor
mal
ized
Abs
orpt
ion
02
04
06
8E-012
9E-012
1E-011
11E-011
12E-011
300 400 500 600 700
Nor
mal
ized
Pre
-edg
e P
eak
Hei
ght
Temperature [K]
Ion Current m
e 18 (H2 O
) [A]
Figure 8-3 V K edge XANES spectra (left) and pre-edge peak height and water ion current me 18 (right) during the temperature programmed reaction of dehydrated (623 K 20 O2 in He) 77 wt VxOySBA-15 in 5 propene in He (298-723 K 5 Kmin)
156
Figure 8-4 (left) depicts the in situ UV-Vis-DR spectra of dehydrated 77 wt VxOySBA-15 during the
temperature programmed reaction in 5 propene With increasing temperature a decrease of the
maximum intensity at 310 nm together with a wavelength shift of the absorption maximum to 295 nm
was observed An increase in intensity was observed in the UV-Vis-DR spectra for wavelengths longer
than 400 nm An increase at longer wavelength is indicative of d-d transitions of reduced vanadium
species The blue shift of the absorption band located at ~ 300 nm together with the increasing d-d
absorption bands indicated a reduction of the vanadium oxide species In order to follow the formation of
reduced vanadium centers with increasing temperature the wavelength at 700 nm was chosen for
monitoring For normalization the intensity at 700 nm was referred to the maximum intensity at
approximately 300 nm in the UV-Vis spectra recorded at 298 K after dehydration in 20 O2 The
normalized intensity at 700 nm was denoted as ldquorelative F(Rinfin) at 700 nmrdquo The evolution of relative
F(Rinfin) at 700 nm and the water ion current me 18 are shown in Figure 8-4 (right) An increased water
formation was observed between 300 and 340 K similar to the in situ XAS measurements In this
temperature range no change in the UV-Vis-DR spectra was detected A moderate increase in intensity
lt 3 at 700 nm occured for temperatures in the range of 340-520 K At temperatures higher than 520 K
a pronounced increase of up to 15-20 in relative F(Rinfin) at 700 nm was detected in the UV-Vis-DR
spectra This increase was accompanied by an increased formation of water The rising intensity above
520 K was ascribed to the formation of reduced vanadium centers considering the results obtained from
the XAS measurements The small increase in intensity at 700 nm below 520 K may be due to the
reduction of the residual V2O5 phase or the formation of carbonaceous species
300 400 500 600 700 800
0
5
10
15
700 nm
dehydrated VxO
ySBA-15 298 K
675 K 5 propene
F(R
infin)
Wavelength [nm]
300 350 400 450 500 550 600 650
0
5
10
15
Rel
ativ
e F
(Rinfin)
(700
nm
) [
]
Temperature [K]
6x10-12
7x10-12
8x10-12
9x10-12
1x10-11
1x10-11
Ion Current m
e 18 (H2 O
) [A]
A
Figure 8-4 In situ UV-Vis-DR spectra (left) and absorption at 700 nm (relative to the maximum intensity determined in the absorption spectra at 298 K after dehydration) together with the water ion current me 18 (right) during the temperature programmed reaction of dehydrated (623 K 20 O2 in He) 77 wt VxOySBA-15 in 5 propene in He (298-673 K 4 Kmin) The arrows on the left side indicate the evolution of the spectra during temperature treatment
157
822 Local structure and reactivity of VxOySBA-15 under changing reaction conditions
In order to further investigate structure and catalytic performance of 77 wt VxOySBA-15 under
changing reaction conditions isothermal switching experiments were performed at 673 K The gas phase
was rapidly changed between reducing (5 propene) and oxidizing conditions (5 propene and 5
oxygen) Prior to the switching experiment 77 wt VxOySBA-15 was treated for 20 min in 5 propene
at 673 K This treatment caused a reduction of 77 wt VxOySBA-15 that is visible by an increased
intensity at longer wavelengths (gt 400 nm relative F(Rinfin) at 700 nm ~ 20) After the initial reduction of
77 wt VxOySBA-15 oxygen was added to the propene feed for ~ 30 min The structure of 77 wt
VxOySBA-15 during re-oxidation was monitored by fast UV-Vis-DRS scans (~ 26 sec) and the gas phase
was monitored by mass spectroscopy A quantitative gas phase analysis was conducted with a gas
chromatograph 15 min and 24 min after changing to oxidizing conditions (5 propene and 5 oxygen)
At the end of the re-oxidation phase UV-Vis-DR scans with a better resolution were recorded (~ 4 min
scan time) The resulting UV-Vis-DR spectra after three reducing (5 propene) and oxidizing (5
propene and 5 oxygen) reaction cycles (each ~ 30-35 min) are depicted in Figure 8-5 (left) After the
first re-oxidation the UV-Vis-DR spectrum of 77 wt VxOySBA-15 resembled those recorded under
catalytic conditions at 673 K (Chapter 7) Thus after re-oxidation the vanadium oxide structure of 77
wt VxOySBA-15 corresponded to the dehydrated VxOySBA-15 structure (ldquoordered [V2O7]rdquo) The
average V valence was +5 after re-oxidation Switching the gas phase back to reducing conditions
resulted again in an increase of the intensity of the absorption bands at longer wavelengths and thus a
reduction of 77 wt VxOySBA-15 was observed
0 5 10 15 20 25 30 350
5
10
15
20
initial 5 propene A 5 propene + 5 O
2
B 5 propene C 5 propene + 5 O
2
D 5 propene E 5 propene + 5 O
2
Rel
ativ
e F
(Rinfin)
(700
nm
) [
]
Time [min]
0
13
5
10
220 800400 600
F(R
infin)
)
Wavelength [nm]
initial 5 propene
A 5 propene + 5 O2 B 5 propene C 5 propene + 5 O2
D 5 propene E 5 propene + 5 O2
Figure 8-5 Left UV-Vis-DR spectra of dehydrated (623 K 20 O2 in He) 77 wt VxOySBA-15 recorded at 673 K after several reducing (5 propene) and oxidizing (5 propene and 5 oxygen) reaction cycles Right Evolution of the absorption at 700 nm (relative to the maximum intensity determined in the absorption spectra at 298 K after dehydration) during the reducing (5 propene) and oxidizing (5 propene and 5 oxygen) reaction cycles at 673 K The gas phase was changed after 39 min in each reaction cycle
158
The relative F(Rinfin) at 700 nm was only 10-12 after 35 min in reducing conditions after the first re-
oxidation of 77 wt VxOySBA-15 This was significantly lower than the relative F(Rinfin) at 700 nm of
20 obtained after the initial reduction Hence less centers could be reduced after re-oxidation under
catalytic conditions Repeating the oxidative and reducing treatments resulted in similar UV-Vis-DR
spectra of 77 wt VxOySBA-15 Thus a reversible re-oxidation and reduction occurred after the initial
re-oxidation of 77 wt VxOySBA-15 In order to follow the reduction and re-oxidation processes the
relative absorption at 700 nm was monitored during the switching experiments (Figure 8-5 right)
Independent of the initial degree of reduction the relative intensity at 700 nm decreased rapidly after
switching to oxidative catalytic conditions (Figure 8-5 right curve ACE) Re-oxidation was completed
after approximately 3 min After each re-oxidation a small increase in the relative intensity at 700 nm of
15-30 was detected Therefore part of the reduced vanadium centers may not be re-oxidized under
catalytic conditions It seemed likely that small fractions of reduced crystalline vanadium oxide phases
formed on the SBA-15 support In contrast to the rapid decay of the relative intensity at 700 nm during
the re-oxidation cycle only a moderate increase of the relative intensity at 700 nm was observed for the
second and the third reduction cycle (Figure 8-5 right curve BD) Moreover the reduction process
seemed not to be finished in the time interval chosen because no maximum or constant value of the
relative intensity at 700 nm was observed Therefore re-oxidation of reduced vanadium centers on
77 wt VxOySBA-15 was considerably faster than reduction
The corresponding concentrations of the major reaction products (CO2 CO acrolein and acetaldehyde)
determined at the beginning and the end of each re-oxidation in catalytic conditions are depicted in
Figure 8-6 together with the corresponding propene and oxygen conversions At the beginning of the first
re-oxidation cycle an increased formation of CO2 acrolein and acetaldehyde was observed compared to
the end of this cycle and the other two reaction cycles
1-start 1-end 2-start 2-end 3-start 3-end03
04
05
002
004
006
10152025
CO2
CO
Con
cent
ratio
n [V
ol
]
acetaldehyde acrolein
3nd
cycle2nd
cycle
propene oxygen
Con
vers
ion
[]
1st
cycle
Figure 8-6 Propene and oxygen conversion and concentration of major reaction products after several oxidizing (5 propene and 5 oxygen) reaction cycles (Figure 8-5) Refer to text for experimental details
159
Conversely an increase of CO formation was observed after each re-oxidation cycle In order to
elucidate whether the increased formation of reaction products was correlated with structural changes a
more detailed evolution of the structure and the gas phase composition during the first and the second re-
oxidation cycle is depicted in Figure 8-7 Oxygen was added after 39 min to the propene feed in each
cycle Adding oxygen to the reaction gas mixture an increase of the ion currents of the reaction products
was observed directly in both re-oxidation cycles (Figure 8-7 middle) A pronounced CO2 formation in
both re-oxidation cycles was detected that decreased to a constant level after 2 min The CO2 formed in
the initial phase was assigned to the combustion of carbonaceous species that may have formed during the
reduction Comparing the evolution of the ion currents of water (me 18) and acrolein (me 56) during the
first and the second re-oxidation cycle a decrease of the ion currents with increasing time was observed
during first re-oxidation cycle Figure 8-7 (bottom left) depicts the in situ UV-Vis-DR spectra recorded
during re-oxidation In the initial phase of the first re-oxidation cycle a decrease of the absorption at
longer wavelengths was observed in the UV-Vis-DR spectra Furthermore a broadening of the main
absorption band around 300 nm and a shift of the maximum from 300 nm to 315 nm were observed in the
first minute after switching to catalytic conditions With increasing time a blue shift of the absorption
maximum from 315 nm to 300 nm occurred that was accompanied by a narrowing of the absorption band
This process resembled the blue shift that was observed during temperature programmed reaction of
VxOySBA-15 in 5 propene and 5 oxygen Apparently before the final oxidized state under catalytic
conditions was reached an intermediate structure of the vanadium oxide phase was present The
transformation of the vanadium oxide structure was irreversible because similar changes in the UV-VIS-
DR spectra were not observed in the second re-oxidation cycle (Figure 8-7 bottom right) Only a
decrease of the intensity of the absorption at longer wavelengths was detected in the UV-Vis-DR spectra
recorded in the second re-oxidation cycle
In the previous chapter it was discussed that during propene oxidation some of the V-O-X (X= OHSi or
V) bonds changed in the initial phase of the temperature programmed propene oxidation The structural
change indicated by a blue shift in the UV-Vis-DR spectra was accompanied by a small increase in
catalytic activity In the first phase of the catalytic reaction the re-oxidation of the reduced vanadium
centers which form during catalytic reaction may be enhanced by the presence of Si-OH groups Reduced
vanadium centers may form Si-O-V bonds with adjacent silanol groups A similar interpretation may
explain the observations during the first re-oxidation of the reduced vanadium centers in 77 wt
VxOySBA-15 Launay et al [26] discussed an exchange of hydroxyl groups between supported vanadium
centers and silanol groups during re-oxidation of reduced VxOySiO2 samples Launay et al showed using
IR measurements that during reduction (16 h vacuum 210-5 mbar 853 K) the number of V-OH bonds
decreases [26] After re-oxidation of the sample in oxygen (853 K 6 h) they detected again the
characteristic IR bands of the V-OH stretching vibration They proposed that vanadium centers in the
proximity of strained D2 defects of the silica surface transfer the OH group from V-OH to the silica
surface [26] Furthermore Launay et al [26] proposed that some of the previously reacted V-OH groups
were restored during re-oxidation of the vanadium oxide phase
160
0
5
10
15
20
0 5 10 15 20 25 30
Time [min]
Rel
ativ
e F
(Rinfin)
(700
nm
) [
]
0
5
10
15
20
0 5 10 15 20 25 30
Time [min]
Rel
ativ
e F
(Rinfin)
(700
nm
) [
]
0 5 10 15 20 25 30
Nor
mal
ized
Ion
Cur
rent
Time [min]
me 32 (O2)
me 18 (H2O)
me 44 (CO2)
me 56 (acrolein)
0 5 10 15 20 25 30
Nor
mal
ized
Ion
Cur
rent
Time [min]
me 32 (O2)
me 18 (H2O)
me 44 (CO2)
me 56 (acrolein)
300 400 5000
5
10
15
39 min 43 min 48 min 56 min 65 min 32 min
F(R
infin)
Wavelength [nm]
300 400 5000
5
10
15
F(R
infin)
Wavelength [nm]
39 min 43 min 56 min 65 min 338 min
Figure 8-7 UV-Vis-DR spectra of dehydrated 77 wt VxOySBA-15 (623 K 20 O2 in He) recorded during the first (left) and the second (right) re-oxidation (5 propene 5 O2) cycle at 673 K Top Evolution of the absorption at 700 nm (relative to the maximum intensity determined in the absorption spectra at 298 K after dehydration) Middle Evolution of MS ion currents Bottom in situ UV-Vis-DR spectra The gas phase was changed after 39 min in each reaction cycle
161
During re-oxidation of the vanadium centers a transfer of a hydroxyl group from a silanol group back to
the vanadium oxide center was proposed [26] Such a mechanism would explain the broadening of the
absorption band at 300 nm in the UV-Vis-DR spectra of 77 wt VxOySBA-15 in the initial phase of the
first re-oxidation (Figure 8-7 (bottom left)) The blue shift of the absorption band at 300 nm to lower
values after the initial broadening was interpreted to be caused by the reaction of V-OH and Si-OH
centers to V-O-Si bonds during the catalytic cycle
The results reported by Launay et al [26] give rise to the question of which V-O bonds may be involved
in the reduction process of the vanadium centers To decide which V-O bond is involved in the reduction
a comparison of 14 wt and 77 wt VxOySBA-15 was made The following bonds present in the
supported vanadium oxide cluster may be involved in the reduction process (i) V-OH (ii) V=O (iii) V-
O-V and (iv) V-O-Si First it seems likely that terminal V-OH bonds (i) will more readily react than the
other bonds because they are easily accessible for the propene molecule Second a participation of the
V=O bond (ii) in the reduction process seems not likely because of the high bond strength of this V=O
double bond Another set of bonds are the V-O-V bonds (iii) or V-O-Si bonds (iv) The latter (V-O-Si)
were often proposed to participate in the selective methanol oxidation [21169] The high UV-Vis-DR
edge energy of 14 wt VxOySBA-15 showed that this sample exhibits more isolated than dimeric
vanadium centers whereas 77 wt VxOySBA-15 exhibits mainly dimeric tetrahedral [V2O7] vanadium
centers Therefore a higher amount of V-O-V bonds involved in the reduction will result in a higher
degree of reduction of 77 wt VxOySBA-15
Figure 8-8 (left) depicts the normalized UV-Vis-DR spectra of dehydrated 14 and 77 wt
VxOySBA 15 recorded at 298 K after reduction in 5 propene at 636 K A similar increase of the
absorption at longer wavelengths (gt 400 nm) was observed for both samples Apparently a comparable
degree of reduction of the vanadium centers in 14 wt and 77 wt VxOySBA-15 was present after this
treatment Conversely a different degree of reduction was observed for a reduction performed in 5
propene after a treatment under catalytic conditions at 673 K (Figure 8-8 right) Only a minor increase
of the absorption above 400 nm was observed in the UV-Vis-DR spectrum of 14 wt VxOySBA-15
after 70 min The increase in absorption above 400 nm determined in the UV-Vis-DR spectrum of
77 wt VxOySBA-15 was significantly higher Thus treatment of VxOySBA-15 in propene and oxygen
changed the reducibility of the vanadium centers present on SBA-15 V-OH and V-O-V bonds may be
involved in the reduction of 14 and 77 wt dehydrated VxOySBA-15 because a similar and rather high
degree of reduction was observed for both samples after reduction in 5 propene UV-Vis-DRS
measurements indicated that V-OHSi-OH groups reacted to V-O-Si bonds during catalytic treatment of
VxOySBA-15 It appeared that more V-OH and silanol groups were left on low loaded 14 wt
VxOySBA-15 Therefore more V-O-Si bonds per vanadium center may be formed in this sample under
catalytic conditions Accordingly the decreased number of V-OH groups in ldquoreactedrdquo 14 wt
VxOySBA-15 compared to dehydrated 14 wt VxOySBA-15 may explain its lower reducibility This
interpretation was corroborated by the stronger shift of the UV-Vis edge energy (Eg) observed after
catalytic treatment The blue shift was assigned to the formation of V-O-Si bonds
162
02
04
06
08
10
400 600 800
Nor
mal
ized
F(R
infin)
Wavelength [nm]
After reduction at 636 K
recoded 298 K
14 wt VxOySBA-1577 wt VxOySBA-15
02
04
06
08
10
400 600 800
Nor
mal
ized
F(R
infin)
Wavelength [nm]
recorded at 673 K
initial 5 propene and 5 O2
35min 5 propene
14 wt VxOySBA-15
77 wt VxOySBA-15
Figure 8-8 UV-Vis-DR spectra recorded at 298 K after reduction of dehydrated VxOySBA-15 in 5 propene in He at 623 K (left) and UV-Vis-DR spectra recorded at 673 K after reduction in 5 propene at 623 K of VxOySBA-15 that was treated for 35 min in 5 propene and 5 O2 in He at 673 K prior to reduction (Right)
The UV-Vis edge energy of 77 wt VxOySBA-15 shifted from 341 eV to 356 eV (∆Eg~ plusmn005 eV)
and the Eg of the low loaded 14 wt VxOySBA-15 shifted from 36 eV to 39 eV (∆Eg~ plusmn01 eV)
Therefore the reduction which was observed after catalytic treatment involved mainly the V-O-V bonds
Thus the degree of reduction observed in the UV-Vis-DR spectra was higher for ldquoreactedrdquo 77 wt
VxOySBA-15 than for ldquoreactedrdquo 14 wt VxOySBA-15 In order to obtain a more detailed picture of the
vanadium oxide structure present on the SBA-15 support XAFS measurements were conducted after a
similar switching experiment as conducted with UV-Vis-DRS (Figure 8-5) The V K edge XANES
χ(k)k3 and FT(χ(k)k3) of 77 wt VxOySBA-15 after dehydration and of 77 wt VxOySBA-15
which was reduced for 30 min after the switching experiment are depicted in Figure 8-9 For comparison
the V K edge XANES χ(k)k 3 and FT(χ(k)k3) of 77 wt VxOySBA-15 after reduction at 723 K in 5
propene are shown
05
10
55 555 56
Nor
mal
ized
Abs
orpt
ion
Photon Energy [keV]
dehydrated reduced 723 K reduced after catalytic treatment
05
10
55 555 56
Nor
mal
ized
Abs
orpt
ion
Photon Energy [keV]
fit experiment
dehydrated
reduced 723 K 002
004
006
0 2 4 6
R [Aring]
FT
(χ(k
)k3 )
dehydrated reduced 723 K reduced after catalytic treatment
Figure 8-9 V K edge XANES (left) LC XANES fit (middle) and FT(χ(k)k3) of 77 wt VxOySBA-15 after dehydration (623 K 20 O2 in He) reduction (723 K 5 propene in He) and after the switching experiment at 673 K under reducing catalytic reducing catalytic and finally reducing conditions (673 K reducing conditions 5 propene in He catalytic conditions 5 propene and 5 O2 in He)
163
The in situ spectra at 673 K were omitted because of the high noise level of the spectra The XANES
spectrum of 77 wt VxOySBA-15 recorded after the switching experiment resembled more the spectrum
of dehydrated 77 wt VxOySBA-15 than the spectrum recorded after reduction at 723 K in 5 propene
Therefore the majority of the vanadium centers in the dehydrated structure were present as V5+ centers
In order to estimate the number of reduced centers a least square XANES fit was conducted The
XANES spectra of dehydrated and reduced 77 wt VxOySBA-15 (723 K 1 h propene) were used for
refinement A good agreement of the experimental and the theoretical XANES spectrum was obtained
(Figure 8-9 middle) The residual of the refinement was 16 Accordingly the refinement employed
showed approximately 33 of the vanadium centers were reduced and 67 remained in the dehydrated
state The FT(χ(k)k 3) of 77 wt VxOySBA-15 which was reduced after the switching experiment is
depicted in Figure 8-9 (right) Compared to the FT(χ(k)k3) of dehydrated 77 wt VxOySBA-15 a
strong reduction of the FT(χ(k)k3) in the range of 1-2 Aring was observed Hence a strong structural
distortion in the first V-O coordination sphere may have occured The first signal above 2 Aring was slightly
enhanced and the second signal which is due to the second V-V coordination sphere was significantly
reduced compared to the FT(χ(k)k3) of dehydrated 77 wt VxOySBA-15 Therefore a lower number of
V-O-V bonds may be present after reduction of the catalytically treated 77 wt VxOySBA-15 sample
This corroborates that mainly the V-O-V bonds were affected by the reduction of the vanadium centers of
ldquoreactedrdquo 77 wt VxOySBA-15
Therefore an increasing number of V-O-Si bonds may change the reducibility of the supported vanadium
oxide phase VxOySBA-15 samples with an increased number of V-O-Si bonds are then less reducible
than the initial dehydrated VxOySBA-15 phase before the catalytic measurements In order to investigate
the reduction at 673 K of dehydrated and ldquoreactedrdquo 77 wt VxOySBA-15 isothermal experiments with
changing gas phase compositions were conducted In a first experiment the dehydrated 77 wt
VxOySBA-15 sample was heated to 673 K in 20 O2 Except for a temperature induced broadening of
the absorption band no change was observed After 15 h in 20 O2 the gas phase was switched to 5
propene for 1 h This treatment was followed by switching to 20 O2 for 35 min 5 propene for 1 h and
finally to 5 propene and 5 oxygen for 35 min The spectra recorded after each treatment procedure are
depicted in Figure 8-10 (left) In contrast to the temperature programmed reaction shown in Figure 8-4
the intensity of the absorptions bands of wavelengths longer than 500 nm was smaller (13) after
reduction under isothermal conditions The maximum of the absorption shifted from 310 nm to 291 nm
during the first reduction After re-oxidation in 20 O2 the maximum in the UV-Vis-DR spectra shifted
to 300 nm during the second reduction to 293 nm and finally after switching to catalytic conditions the
absorption maximum in the UV-Vis-DR spectra was detected at 296 nm The relative intensity at 700 nm
which was assigned to reduced vanadium centers was approximately 10-13 after the reduction cycles
For the first re-oxidation of 77 wt VxOySBA-15 in 20 O2 a reversible transition to the initial
absorption maximum at 310 nm was expected Conversely only a shift of the absorption band to 300 nm
was observed after the first re-oxidation cycle in 20 O2
164
0
15
5
10
220 800400 600
F(R
infin)
)
Wavelength [nm]
initial 20 O2
cycle 1 5 propene cycle 1 20 O2 cycle 2 5 propene cycle 2 5 propene + 5 O2
0
15
5
10
220 800400 600
F(R
infin)
)
Wavelength [nm]
initial 5 propene + 5 O2
cycle 1 5 propene cycle 1 5 propene + 5 O2
cycle 2 5 propene cycle 2 5 propene + 5 O2
Figure 8-10 In situ UV-Vis DR spectra of dehydrated 77 wt VxOySBA-15 (20 O2 in He 623 K) at 673 K after changing the gas phase composition starting with 20 O2 in He (left) or 5 propene and 5 O2 in He (right) as the initial gas mixture
In this time formation of small amounts of propene oxidation products was observed because it took
several seconds to purge oxygen out of the in situ cell This short time of catalytic reaction may have
inhibited the reversible recovery of V-OH centers Nevertheless after re-oxidation in 20 O2 the
absorption band exhibited a lower UV-Vis edge energy (longer wavelength) than the absorption band
recoded after re-oxidation under catalytic conditions Hence at least some V-OH groups were recovered
In a second switching experiment dehydrated 77 wt VxOySBA-15 was heated in 5 O2 and 5
propene to 673 K After 30 min under catalytic conditions the reaction gas was changed to 5 propene
for 70 min This treatment was followed by subsequent changes between reducing and catalytic
conditions The resulting spectra after each treatment are depicted in Figure 8-10 (right) Comparing the
maximum absorption in the UV-Vis-DR spectra only minor changes were observed after the respective
treatments In the initial UV-Vis-DR spectrum the absorption maximum was at 300 nm and shifted to
297 nm after switching to propene Repeated re-oxidation shifted the maximum in the UV-Vis-DR
spectra to 298 nm and then to 295 nm after another reductive treatment After the final re-oxidation it was
at 297 nm
Figure 8-11 depicts the evolution of the relative F(Rinfin) at 700 nm 1 to follow the reduction process during
the respective treatments The gas phase was changed 39 min after starting to record the fast UV-Vis-DR
spectra Re-oxidation was finished independent of the initial degree of reduction after 3 minutes Re-
oxidation in 20 O2 resulted in a decrease to almost no intensity of F(Rinfin) at 700 nm whereas after re-
oxidation in 5 propene and 5 oxygen a relative F(Rinfin) at 700 nm of 2-4 was detected The increase
in relative F(Rinfin) at 700 nm during reduction was comparable to the moderate increase observed in the
experiment discussed (Figure 8-5 right) for samples re-oxidzied prior to the reduction under catalytic
conditions However for VxOySBA-15 (re)oxidized in 20 O2 a different evolution of the relative F(Rinfin)
at 700 nm was observed during the reduction in propene (Figure 8-11 left)
1 ldquorelative F(Rinfin) at 700 nmrdquo The intensity at 700 nm was referred to the maximum intensity at approximately 300 nm in the UV-Vis
spectra recorded at 298 K after dehydration of VxOySBA-1 in 20 O2
165
0 10 20 30 40 50 60 70
0
2
4
6
8
10
12
14initial 20 O
2
cycle 1 5 propene cycle 1 20 O
2
cycle 2 5 propene cycle 2 5 propene + 5 O
2
Rel
ativ
e F
(Rinfin)
(700
nm
) [
]
Time [min]
0 10 20 30 40 50 60 700
2
4
6
8
10
12
14initial 5 propene + 5 O
2
cycle 1 5 propene cycle 1 5 propene + 5 O
2
cycle 2 5 propene cycle 2 5 propene + 5 O
2
Rel
ativ
e F
(Rinfin)
(70
0 nm
) [
]
Time [min]
Figure 8-11 Evolution of the relative absorption at 700 nm (relative to the maximum intensity determined in the absorption spectra at 298 K after dehydration) derived from the in situ UV-Vis DR spectra of dehydrated 77 wt VxOySBA-15 (20 O2 in He 623 K) at 673 K after changing the gas phase composition starting with 20 O2 in He (left) or 5 propene and 5 O2 in He (right) as initial gas mixture
In the initial time interval (5 min - 10 min) after switching to reducing conditions only a small increase in
relative F(Rinfin) at 700 nm was observed The relative F(Rinfin) at 700 nm remained constant during the first
5 min After 5 min (10 min absolute) an increase of the relative absorption at 700 nm was detected which
was damped after 15 min (~ 25 min absolute) The increase in relative absorption at 700 nm for the first
and the second reduction cycle was comparable during the first 15 min after switching to propene After
15 min a smaller increase of the relative absorption at 700 nm was observed for the second reduction
cycle Evolution of the structure and gas phase composition during the first reduction cycle of dehydrated
and ldquoreactedrdquo 77 wt VxOySBA-15 is depicted in Figure 8-12 In the first 3 min after switching to
propene a pronounced formation of oxidation products was observed (CO2 acrolein water and C3H6O)
for dehydrated 77 wt VxOySBA-15 The ion currents decreased significantly after 3 min (CO2
acrolein and C3H6O) or reached a constant value in the case of water (Figure 8-12 middle left) Hence
in the initial phase of the reduction oxygen originating from the vanadium oxide phase may have reacted
with propene In the first 5 min after switching to propene a constant relative F(Rinfin) at 700 nm was
observed (Figure 8-12 top left) The in situ UV-Vis-DR spectra recorded during the addition of propene
are depicted in Figure 8-12 bottom left During the first two scans (39 min-52 min) a blue shift of the
absorption maximum from 310 nm to 300 nm was observed in the UV-Vis DR spectra The UV-Vis-DR
spectra recorded during the next 5 min (52-108 min) remained unchanged After 108 min a slow shift of
the absorption maximum from 300 nm to 291 nm was observed in the UV-Vis-DR spectrum This shift
was accompanied by an increase of the absorption at 700 nm The intermediate absorption spectra
(52-108 min) resembled those recorded under catalytic conditions Presumably a similar V coordination
sphere must be present V-O-Si bonds may have formed from reacted V-OH Interestingly the V-OH
groups were recovered after re-oxidation in 20 O2 which is in contrast to catalytic conditions A similar
shift of the absorption maximum was not observed in the in situ UV-Vis-DR spectra of ldquoreactedrdquo 77 wt
VxOySBA-15 during the first reduction cycle
166
0
2
4
6
8
100 5 10 15 20 25
Time [min]
Rel
ativ
e F
(Rinfin)
(700
nm
) [
]
0
2
4
6
8
100 5 10 15 20 25
Time [min]
Rel
ativ
e F
(Rinfin)
(700
nm
) [
]
0 5 10 15 20
me 41 (propene)
me 58 (C3H
6O)
me 56 (acrolein)
me 44 (CO2)
me 18 (H2O)
Nor
mal
ized
Ion
Cur
rent
Time [min]
me 32 (O2)
0 5 10 15 20 25
Nor
mal
ized
Ion
Cur
rent
Time [min]
me 32 (O2)
me 18 (H2O)
me 44 (CO2)
me 56 (acrolein)
me 58 (C3H
6O)
me 41 (propene)
250 300 350 400 4500
5
10
15
F(R
infin)
Wavelength [nm]
0 min 39 min 52 min 108 min 256 min 646 min
250 300 350 400 4500
5
10
15
F(R
infin)
Wavelength [nm]
0 min 39 min 52 min 108 min 256 min 641 min
Figure 8-12 UV-Vis-DR spectra of dehydrated 77 wt VxOySBA-15 (623 K 20 O2 in He) recorded during the first reducing (5 propene) cycle at 673 K starting with 20 O2 in He (left side) or 5 propene and 5 O2 in He (right side) as the initial gas mixture Top Evolution of absorption at the 700 nm (relative to the maximum intensity determined in the absorption spectra at 298 K after dehydration) Middle Evolution of the MS ion currents Bottom in situ UV-Vis-DR spectra The gas phase was changed after 39 min in each reaction cycle
167
For ldquoreactedrdquo 77 wt VxOySBA-15 the absorption maximum in the in situ UV-Vis-DR spectra
remained at 297 nm during the reduction and re-oxidation cycles (Figure 8-12 bottom right) Switching
the gas phase from catalytic conditions to propene resulted in a small increase of the ion currents of the
reaction products formed in the first minute (~ 5 min absolute) Between 5 and 7 min a decay of theses
ion currents was observed The decay was slower than the decreasing ion current of oxygen (me 32)
Thus oxygen originating from the sample may have reacted with propene
83 Concluding remarks on the structural evolution of VxOySBA-15 under dehydrating catalytic or reducing conditions
Figure 8-13 shows the proposed structural transformations deduced from the in situ UV-Vis-DRS and
XAS investigations performed under reducing oxidizing or catalytic conditions
[O3Si][SiO3]
OO
V5+
OV
5+
OHO
OHOH
OH
[O3Si][SiO3]
OO
V5+
OV
5+
OO
OH
[O3Si]O
[O3Si][SiO3]
OO
V5+
OV
5+
OO
O
[SiO3]
OH
[O3Si]
OH
[O3Si]
OH
[O3Si]
O
[O3Si]
[O3Si][SiO3]
V4+
(O)V
3+
OO
O
[SiO3]
OH
+[O3Si]
V4+
O
O
[SiO3][O3Si]O
[SiO3]
V4+
OO
OHO-
[SiO3]
O
(O)V5+
OH
OH
[O3Si]
[O3Si]
V4+
OH
OH
[SiO3]
O-+
[O3Si]O
[O3Si][SiO3]
OO
V5+
OV
5+
OO
O
[SiO3]
[O3Si] [O3Si]
O
OH V5+
O
OHOH
[O3Si]
[O3Si][O3Si]
O
O V5+
O
OHOH
[O3Si]
+
OH
[O3Si]
OH
[O3Si]
OH
[O3Si]
OH
[O3Si]
OH
[O3Si]
[O3Si] [O3Si]
O V4+
O
OH
[SiO3]
O-OH
[O3Si]
OH
[O3Si]
OH
[O3Si]
OH
[O3Si]
OH
[O3Si][O3Si]
OH V4+
O
OHO
[SiO3][O3Si][O3Si]
O
O V5+
O
[O3Si][O3Si]
O
O V5+
O
O
[SiO3]
OH
[O3Si]
OH
[O3Si]
reduction
not likely
high and medium V loadings of V xOySBA-15
low V loadings of V xOySBA-15
dehydrated 20 O25 propene and 5 oxygen 5 propene5 propene
V3+ + V4+
V4+=O
V-OH
V-O-
micro-V2O5
reduced micro-V2O5
+reduced micro-V2O5
+
+reduced micro-V2O5
+
[O3Si] [O3Si]
O V3+
O
OH
[SiO3]
V-OH
V4+=O
Figure 8-13 Simplified scheme of the structural changes during dehydrating catalytic or reducing condition
168
The dehydrated VxOySBA-15 structure was obtained from thermal treatment in oxygen containing
atmospheres in the temperature range from 550-723 K The dehydrated structure consists of an ordered
arrangement of dimeric tetrahedral [V2O7] vanadium oxide units present on the SBA-15 support The
proposed structure is discussed in more detail in Chapter 5 With decreasing vanadium loading isolated
tetrahedral [VO4] units besides dimeric tetrahedral [V2O7] vanadium oxide units may be present on the
support Because Si-OH groups were still detectable after dehydration (550-723 K) the number of
V-O-Si bonds to the support are presumably one per vanadium center in the case of high loaded
VxOySBA-15 and one or two per vanadium center in the case of low loaded VxOySBA-15 The
remaining vanadium oxygen bonds may be present as V=O or as V-OH referring to IR investigations
reported by Launay et al [2627141] The presence of V-OH bonds seems likely because the H+ ensures
the charge compensation of the vanadium oxide clusters
A reduction of vanadium centers of VxOySBA-15 was observed for temperatures higher than 520 K after
applying reducing conditions to dehydrated VxOySBA-15 samples A rather low V K edge pre-egde peak
height indicated the formation of V4+ and V3+ vanadium centers after reduction in propene at 723 K
(Figure 8-2) A low similarity with the XAS spectra of octahedral vanadium oxide references with an
average oxidation state less than +5 was observed (Figure 8-1) Hence the reduced vanadium centers of
VxOySBA-15 may exhibit a 4- or 5-fold V-O coordination symmetry Whether reduced vanadium centers
with double bonds (V4+=O) were present could not be determined Reduced V4+ and V3+ vanadium
centers require a compensation of the highly negative charge present A high negative charge of reduced
vanadium centers must be present in the reduced dimeric or isolated vanadium oxide clusters with 4- or
5-fold coordinated V-O vanadium centers Such a negative charge cannot be easily compensated for
supported vanadium oxide clusters that are anchored to the support Conversely for bulk vanadium oxide
references charge compensation may be given by positively charged cations or by aggregation to larger
vanadium oxide clusters resulting typically in a higher coordination (eg octahedral V3+ centers in V2O3
or Mg2VO4) However the latter process seems not likely for the vanadium centers linked to the support
The lacking possibilities for charge compensation may explain the fast re-oxidation of the reduced
vanadium oxide centers It still remains unknown how and which oxygen ligands stabilize the vanadium
oxide structure of reduced vanadium centers Formation of V-OH groups may be suited to reduce the
negative charge but Launay et al [26] showed that these centers were removed during reduction in
vacuum Comparable to the results reported by Launay et al [26] a reversible re-oxidation in 20
oxygen was possible together with the recovery of some of the removed V-OH groups (Figure 8-10 left)
The mechanism behind this process remains unclear because direct observation of the V-OH and Si-OH
was not possible with the spectroscopic methods employed Nevertheless the reversible exchange of
hydroxyl groups with the SBA-15 support indicates a dynamic interaction Therefore investigations
addressing the reduction in hydrogen and reversibility of the reoxidation of VxOySBA-15 would be of
interest Unfortunately the temperature range above 750 K where a reduction in hydrogen proceeds [22]
was not feasible with the in situ UV-Vis-DR set up used here The reduction in hydrogen instead of in
propene would not be disturbed by catalytic processes with residual oxygen that may change the V-O
coordination sphere
169
A very different reduction behavior occurred for VxOySBA-15 treated under catalytic conditions (5
propene and 5 oxygen) prior to reduction in propene A blue shift of the absorption band in the UV-Vis-
DR spectra was detected during this treatment This change in the UV-Vis-DR spectra was assigned to
the formation of V-O-Si bonds This interpretation was corroborated by the fact that the blue shift was
larger in the case of low vanadium loadings (lower number V-O-V bonds) that Si-OH groups were not
detectable after such a treatment of dehydrated 77 wt VxOySBA-15 and that significant changes were
not determined in the XAFS refinements In the case of changes of the V-O-V bonds it would be
expected that almost no blue shift would be observed for 14 wt VxOySBA-15 Furthermore a
significant change in the V-V interaction in the XAFS refinements would be expected for 77 wt
VxOySBA-15 The unchanged Raman band at ~1040 cm-1 that was observed during the temperature
programmed reaction in propene and oxygen showed that no change of the V=O bond occurred (Chapter
7) The increased number of V-O-Si centers on the support resulted in a lower reducibility of the
supported vanadium oxide centers (Figure 8-8) This effect was more pronounced for low loaded
14 wt VxOySBA-15 This corroborated the assumption that on this sample more V-O-Si bonds were
formed The low reduction observed for 14 wt VxOySBA-15 (Figure 8-8) may be due to reduced
dimeric centers that may be present besides isolated vanadium centers after dehydration Hence
O=V5+-(OSi)x centers were not reducible The observed reduction of 77 wt VxOySBA-15 was assigned
to the reduction at the V-O-V bonds in the [V2O7] dimer It was estimated from a XANES analysis that
approximately 33 of the vanadium centers were reduced in ldquoreactedrdquo 77 wt VxOySBA-15 A similar
conclusion that V-O-Si bonds were not reducible (reduction with H2) in contrast to V-OH or V-O-V
bonds was proposed by Grubert et al [170] Therefore mainly the V-O-V bonds are involved in the
reduction of the ldquoreactedrdquo VxOySBA-15 samples
The nano crystalline V2O5 phases on 77 wt VxOySBA-15 were not responsible for the observed
changes in the UV-Vis-DR absorption bands Similar changes were observed for 14 wt VxOySBA-15
where no V2O5 was detectable However an increasing formation of reduced crystalline vanadium oxide
centers may explain the increasing formation of CO and the decreasing formation of acetaldehyde during
the isothermal switching experiments (Figure 8-6)
The results obtained suggest that a different interaction of the vanadium oxide phase with propene
proceeds during the catalytic propene oxidation compared to reducing conditions This may be due to the
formation of V-O-CxHy or Si-O-CxHy intermediate species which change the re-oxidation The blue shift
of the absorption bands in the UV-Vis-DR spectra was irreversible Hence adjacent silanol groups may
be involved in the initial phase of re-oxidation in propene and oxygen Surprisingly a similar irreversible
reaction of vanadium centers and silanol groups was not observed during re-oxidation of reduced
VxOySBA-15 catalysts in 20 O2
170
84 Summary
In situ UV-Vis-DRS and in situ XAS measurements showed that the vanadium oxide phase on
VxOySBA-15 exhibits a dynamic reduction and re-oxidation behavior Disperse dimeric and isolated
vanadium centers present after dehydration of VxOySBA-15 were reduced to V4+ and V3+ using propene
as the reducing agent A re-oxidation in 20 O2 resulted in a reversible oxidation of the reduced
vanadium oxide phase to the initial dehydrated VxOySBA-15 with an average valence of +5 The
reduction behavior was independent of the vanadium loading of VxOySBA-15
Conversely a significantly lower reducibility was observed for VxOySBA-15 treated under catalytic
conditions in propene and oxygen The lower reducibility was ascribed to the formation of additional
V-O-Si bonds to the support V-O-Si bonds were not involved during the reduction in propene This was
corroborated by a lower reducibility of the ldquoreactedrdquo low loaded 14 wt VxOySBA-15 compared to
ldquoreactedrdquo high loaded 77 wt VxOySBA-15 The higher reducibility of 77 wt VxOySBA-15 was
attributed to the presence of V-O-V bonds in the sample
The high tendency of partially reduced disperse vanadium oxide phases to re-oxidize rapidly even in the
presence of low amounts of oxygen was explained by a missing charge compensation for reduced 4- or
5-fold V+4 and V3+ centers anchored to SBA-15 Anchoring of disperse dimeric and isolated vanadium
oxide clusters to the SBA-15 support inhibits the formation of larger clusters with higher coordination
that may stabilize reduced vanadium oxide centers
171
9 General conclusions on VxOySBA-15 model catalysts
91 Introduction
The objective of the present work was investigating of VxOySBA-15 model catalysts for the selective
oxidation of propene Detailed analysis of the preparation and the hydration and dehydration processes
were performed prior to catalytic testing The grafting anion exchange method chosen allowed the
preparation of highly disperse VxOySBA-15 samples without formation of V2O5 during the preparation
process Three different VxOySBA-15 samples with vanadium loadings in the range of 14 wt-77 wt
(03 Vnm2 ndash 24 Vnm2) were synthesized In situ UV-Vis-DR and XAS measurements were performed
to investigate the vanadium oxide structure Comparison with spectra of vanadium oxide references
allowed developing suitable model structures for the hydrated and dehydrated state The proposed
theoretical model structures were refined successfully to the experimental Fourier transformed EXAFS of
VxOySBA-15 Hydration and dehydration processes were studied with various in situ methods
Furthermore the impact of water on the dehydration process was determined The measurements
performed provided a detailed knowledge on the structural properties of VxOySBA-15 under oxidizing
conditions (20 O2 in He) After characterization under oxidizing conditions the structural evolution
under catalytic (5 propene and 5 O2 in He) and reducing (5 propene in He) conditions was
investigated together with monitoring of the gas phase composition In addition the catalytic performance
(propene conversion gas phase composition and selectivity of the reaction products formed) was
determined in a laboratory fixed bed reactor The major results and conclusions obtained are summarized
below The conclusions presented below demonstrate the potential of VxOySBA-15 as a model catalyst
for the selective oxidation of propene to acrolein The bare SBA-15 support showed no catalytic activity
Therefore it was possible to deduce structure-activity relations that can be assigned to the role of
vanadium oxide during the selective propene oxidation
92 Hydrated state of VxOySBA-15
The hydrated state of VxOySBA-15 was observed under ambient conditions in the presence of water A
suitable structural model was developed on the basis of UV-Vis-DRS and XAS experiments The model
structure of the hydrated state consisted of small clusters of vanadium oxide centers exhibiting a square
pyramidal coordination The UV-Vis-edge energy indicated that a two-dimensional and chainlike
extension of the vanadium oxide species on the SBA-15 was present similar to V2O62- vanadate
structures In situ spectroscopic experiments showed that the hydrated VxOySBA-15 structure was not
stable at elevated temperatures under oxidizing and under catalytic conditions
172
In situ measurements were conducted to obtain a detailed knowledge on the coordination of vanadium
centers in hydrated VxOySBA-15 and on the formation of hydrated VxOySBA-15 A smaller amount of
Si-OH groups in VxOySBA-15 compared to SBA-15 suggests that V-O-Si bonds were present in the
hydrated state of VxOySBA-15 Various time scales until a fully hydrated state was observed were
recorded for freshly prepared (weeks) and for dehydrated VxOySBA-15 (hours) Hence more V-O-Si
bonds may be present in freshly prepared VxOySBA-15 The hydrolysis of additional V-O-Si bonds
during hydration would explain the larger time scale observed for a full hydration of VxOySBA-15 The
vanadium centers in the hydrated state are coordinated by V-O-V V-OH and VmiddotmiddotH2O groups A
decomposition temperature below 440 K of the hydrated state indicates a rather weak bond of the
coordinated water species to the vanadium centers Apparent activation energies in the range of
70-90 kJmol were determined for the water desorption The apparent activation energies for the
desorption process of hydrated VxOySBA-15 increased with vanadium loading and storage time With
increasing time of storage a ldquogrowthrdquo of the hydrated VxOySBA-15 structure on high loaded 77 wt
VxOySBA-15 was observed This ldquogrowthrdquo was accompanied by an increased formation of V-V
interactions and a stronger interaction of coordinated water with the hydrated vanadium oxide species
The formation of V2O5middotnH2O gel like structures seemed likely In addition to the formation of the
dehydrated VxOySBA-15 structure the formation of V2O5 was observed during thermal decomposition of
these V2O5middotnH2O gel like structures
93 Dehydrated state of VxOySBA-15
The dehydrated VxOySBA-15 structure formed at temperatures above 440 K during thermal treatment of
hydrated VxOySBA-15 in 20 O2 The UV-Vis-DRS and XAFS spectra of dehydrated VxOySBA-15
showed similarity with those of vanadium oxide references exhibiting a dimeric or chainlike structure of
VOx tetrahedrons Therefore a model structure based on an ordered arrangement of adjacent [V2O7] units
was proposed for dehydrated VxOySBA-15 This theoretical model structure was refined successfully to
the experimental Fourier transformed EXAFS of all three VxOySBA-15 samples employed
Dehydration of hydrated VxOySBA-15 was accompanied by an increased amount of water in the gas
phase Structural rearrangement processes to the final structure of dehydrated VxOySBA-15 were
observed between 440 K and 550 K No intermediate structures were formed The number of dispersed
VxOy centers in the dehydrated state correlated significantly with the number of available Si-OH sites
Formation of V2O5 will be likely if the amount of vanadium centers exceeds the number of Si-OH groups
Therefore the presence of at least one V-O-Si bond per vanadium center or dimeric unit seems to be a
prerequisite for the formation of dehydrated tetrahedral vanadium centers Formation of three V-O-Si
bonds per vanadium site to the support seemed not likely because even for high vanadium loadings not all
Si-OH groups of SBA-15 reacted to V-O-Si bonds during dehydration at moderate temperatures of 723 K
Therefore V-OH groups may be present in dehydrated VxOySBA-15 For low VSi-OH ratios
(lt 05 Vnm2) the formation of isolated besides dimeric vanadium centers seemed likely The formation
173
of the dehydrated state was observed to be independent of the presence of water during the thermal
treatment
Small V2O5 aggregates formed on high loaded 77 wt VxOySBA-15 during dehydration and were able
to re-disperse on the support under calcination conditions The re-dispersion effect was observed for
vanadium loadings near the maximum surface coverage in the range of 24 Vnm2
94 Structure of VxOySBA-15 catalysts under reducing and under catalytic conditions
It was shown from Raman and UV-Vis-DRS measurements that the vanadium oxide structure under
propene oxidizing conditions corresponds mainly to the dehydrated VxOySBA-15 state Only minor
structural changes compared to the dehydrated state were observed in the V K edge XANES and EXAFS
spectra of VxOySBA-15 after reaction in propene and oxygen The observed changes affected the V-V
interactions slightly XAFS measurements showed that minor structural distortions may be present in the
second (V-V) coordination sphere Changes in the UV-Vis edge energy indicated that V-O-Si bonds
formed in the initial phase of the reaction with propene in the presence of oxygen V-OH groups may
have reacted with Si-OH groups to V-O-Si bonds For high loaded 77 wt VxOySBA-15 a decrease of
the Si-OH groups was detected in the 29Si MAS-NMR spectrum that was not observed under dehydrating
conditions This suggests that Si-OH groups reacted with the vanadium centers Furthermore the UV-Vis
edge energy shift observed in the UV-Vis-DR spectra was more distinct for 14 wt VxOySBA-15 than
for high loaded 77 wt VxOySBA-15 More V-O-V bonds were determined for 77 wt VxOySBA-15
Therefore V-OH rather than V-O-V bonds may be involved in the V-O-Si bond formation The
formation of V-O-Si bonds should be visible in the Raman spectra According to the theoretical
calculation [171] an increase in the region 873-962 cm-1 (Si-O-V out of phase interface mode) and in the
region 1020-1080 cm-1 (in phase mode) was expected However the data quality of the recoded spectra
was not sufficient to resolve these changes More detailed investigations would be desirable Further
measurements of changes of the V-OH groups with IR spectroscopy and of the Si-OH groups with in situ
NMR spectroscopy may elucidate the reaction observed
In addition to the structural characterization under catalytic conditions the reducibility of dehydrated
VxOySBA-15 catalysts was tested using propene as reducing agent Dehydrated VxOySBA-15 samples
were reducible independent of the vanadium loading XANES spectra suggest the formation of tetrahedral
or square pyramidal V4+ and V3+ centers In oxidizing conditions a complete re-oxidation of the reduced
vanadium species of VxOySBA-15 proceeded without formation of additional V-O-Si bonds In contrast
to the reduction of dehydrated VxOySBA-15 a lower reducibility was observed for VxOySBA-15
samples treated under propene oxidizing conditions prior to the reduction The reducibility was lower for
ldquoreactedrdquo 14 wt VxOySBA-15 than for ldquoreactedrdquo 77 wt VxOySBA-15 Therefore V-O-Si bonds
formed during catalytic reaction might not be involved in the reduction process Conversely V-O-V
bonds present in 77 wt VxOySBA-15 may be involved The changed reducibility of VxOySBA-15
174
under catalytic conditions is of great interest given that TPR experiments are commonly used to elucidate
the redox properties of vanadium oxide catalysts The reducibility cannot be deduced from the initial
dehydrated state of VxOySBA-15 This knowledge has to be considered for further TPR experiments with
VxOySBA-15
95 Catalytic performance of VxOySBA-15
In addition to elucidating the structure and reducibility of V xOySBA-15 a functional characterization
was performed The catalytic performance during propene oxidation was investigated using a laboratory
reactor The formation of selective oxidation products like acrolein propionaldehyde acetaldehyde
acetone and acetic acid was observed together with the formation of CO2 and CO Three major reaction
pathways existed for propene oxidation [35] First propene was selectively oxidized to acrolein with 18-
25 selectivity Second propene was oxidized to propionaldehyde and acetaldehyde and third propene
was oxidized to acetone and acetic acid The reaction products formed during the selective oxidation of
propene suggest that different oxygen species are involved In accordance with the literature [162]
formation of acrolein is ascribed to the presence of nucleophilic oxygen (O2-) that attacks propene at the
methyl group The formation of the other reaction products is ascribed to electrophilic oxygen (O2 O-
and O2) that attack propene at the C=C bond The origin of electrophilic oxygen may be a consequence of
the re-oxidation of reduced vanadium centers with molecular oxygen Thus future investigations with
other oxidizing agents like N2O which may enhance the selectivity for acrolein during propene oxidation
on VxOySBA-15 catalysts would be desirable The formation of acetone and acetic acid suggested that
V-OH groups were involved in propene oxidation For temperatures above 500 K the UV-Vis edge
energy shift indicated a reaction of V-OH to V-O-Si bonds Experiments at temperatures below 500 K
therefore may provide more information about the role of V-OH groups in propene oxidation
Furthermore the influence of high water content (gt 20 Vol) was not investigated in this work
Increasing the amount of water in the reaction atmosphere to a high content may increase the number of
V-OH groups Thus investigations with high water content seem promising to investigate the role of V-
OH groups in selective propene oxidation
Higher vanadium loading of VxOySBA-15 facilitated the consecutive reactions of the primary C3
aldehydes to C2 oxygenates and CO The amount of electrophilic oxygen may increase with higher
vanadium loading on SBA-15 However when combining the selectivities of the oxidation to the C3
aldehydes and the selectivity of the consecutive reactions of the respective reaction pathway no
significant difference was observed with vanadium loading Therefore decreasing the vanadium loading
of VxOySBA-15 does not alter the fundamental reaction pathways of the propene oxidation Conversely
a twice as high propene conversion rate and 40 higher acrolein formation rate per V site was observed
for 77 wt VxOySBA-15 compared to 41 wt and 14 wt VxOySBA-15 The same reaction rates
were determined for 41 wt and 14 wt VxOySBA-15 The increase in these reaction rates is attributed
to a higher density of adjacent [V2O7] units on 77 wt VxOySBA-15 Thus either the C-H abstraction
175
step or the electron transfer process during propene oxidation to acrolein may be facilitated due to the
increased number of neighboring vanadium sites
The reaction orders determined for the formation of acrolein were zero for oxygen and 05 for propene
The reaction order of 05 for propene could not be assigned unambiguously to a specific reaction
mechanism The zero reaction order for oxygen indicates that a fast re-oxidation of the vanadium centers
involved proceeds during the propene oxidation This interpretation is corroborated by the fact that the
average vanadium valance of VxOySBA-15 remained +5 during propene oxidation Furthermore UV-
Vis-DRS experiments with alternating reducing and oxidizing conditions showed that the re-oxidation
process of VxOySBA-15 is considerably faster than the reduction
96 Structure-activity correlations deduced from a comparison of VxOySBA-15 with bulk V2O5
Reduced vanadium oxide phases (ie V4O9 and VO2 (B)) were observed during the reaction of propene
and oxygen on V2O5 The formation of reduced vanadium phases may be caused by the participation of
mobile bulk oxygen species in the catalytic process (Chapter 2) Such mobile bulk oxygen species may
be required for the re-oxidation step in selective oxidation reactions (Mars van Krevelen mechanism)
However for VxOySBA-15 an average valance of V5+ was observed during catalytic oxidation of
propene although VxOySBA-15 exhibits no accessible mobile oxygen species Hence mobile bulk
oxygen species are not required for a fast re-oxidation of reduced vanadium species during the propene
oxidation Therefore the oxygen mobility in V2O5 is a consequence of its bulk structure but not a
prerequisite for the catalytic performance of vanadium oxides in selective oxidation reactions
The observed reaction products and selectivities detected during propene oxidation on VxOySBA-15
were not significantly different from those observed with bulk V2O5 (Chapter 2) Therefore basically the
same reaction steps may occur This suggests that similar active centers are present on the surface of
SBA-15 supported and bulk V2O5 during propene oxidation Similar active centers can be explained by
similar structural motifs of vanadium oxide clusters on the surface or they may be assigned to intrinsic
properties of the vanadium sites eg electronic and redox properties The latter is corroborated by the fact
that even 14 wt VxOySBA-15 for which isolated [VO4] units may be present showed basically the
same reaction pathways for the selective oxidation of propene with oxygen as bulk V2O5 (V4O9)
Apparently no change in the reaction pathways was observed when VxOySBA-15 model catalysts
consisting of small tetrahedral units with low extension were compared to structurally more complex
bulk V2O5 Moreover even an increase in the structural complexity among the VxOySBA-15 model
catalyst deduced from the increasing number of adjacent and connected tetrahedral vanadium centers did
not change significantly the reaction pathways for propene oxidation Only a decrease in acrolein
selectivity from 25 to 18 was observed with increasing loading which was assigned to consecutive
reactions of the primary aldehydes Hence the selectivity towards acrolein formation of vanadium oxide
centers seems to be independent on the vanadium oxide structure for the ldquobinaryrdquo V5+ catalysts
176
investigated here Thus structural complexity of the vanadium oxide structure seems to have only a
minor impact on the propene oxidation reaction over VxOySBA-15 model catalysts and bulk V2O5
97 Structure-activity correlations with respect to complex mixed metal oxide catalysts
The objective of the present work was elucidating structure-activity correlations of VxOySBA-15 model
catalysts for the selective oxidation of propene to acrolein The results obtained showed that supporting
vanadium oxide on SBA-15 enhanced the activity compared to bulk V2O5 while selectivity towards the
desired product acrolein remained similar The increase in activity is assigned to an increased number of
accessible surface sites on VxOySBA-15 catalysts Among the VxOySBA-15 samples 77 wt
VxOySBA-15 exhibited a superior activity Conversely almost the same selectivity towards acrolein was
observed Hence a higher density of active vanadium sites possibly with a higher connectivity than
isolated or dimeric vanadium units may facilitate the acrolein formation
However the low changes in acrolein selectivity suggested that the structural complexity of the vanadium
oxide phase of VxOySBA-15 and bulk V2O5 had only a minor impact on the propene oxidation
Presumably metal sites with a different character may be required which reduce and control the
unselective character of the active vanadium sites eg Mo Te W Such an interpretation suggests that
these metal sites in highly active bulk catalysts eg MoVNbTe may work as moderator for the vanadium
sites involved in the reaction Thus vanadium sites may increase the activity but the cooperation of
vanadium with other metal sites may be required to obtain a high selectivity In this case the chemical
complexity must be increased in order to improve the catalytic performance of vanadium sites in the
selective oxidation of propene towards acrolein However vanadium is mostly the minor component in
highly active mixed metal catalyst Therefore from the point of view of possible cooperating metal sites
like Mo it would be of interest whether certain host structures thus structural complexity must be
present to improve activity and selectivity of mixed metal oxide catalysts Hence in the next generation
of SBA-15 supported metal oxides mixed metal oxide systems eg Mo and V seem promisingly
The minor role of structural complexity of the vanadium oxide phase of VxOySBA-15 and bulk V2O5 on
selective propene oxidation is interesting and will need further investigation With respect to the variety
of structural configurations that are possible for vanadium oxide structures new model systems which
exhibit more complex vanadium oxide structures must be employed Moreover the structural complexity
of vanadium oxide sites in highly active ldquoMoVTerdquo catalysts may be higher than the structural complexity
provided by the VxOySBA-15 model system Changing the support material may be one opportunity to
obtain different vanadium oxide structures compared to that observed for VxOySBA-15 Nevertheless
the support material itself should not be active for propene oxidation like Nb2O5 Non-oxidic materials
like carbon or less active oxides like MgO or Ta2O5 may be more likely as possible support material
177
178
179
10 Appendix
101 Physisorption small angle XRD and CHNS results of SBA-15 and VxOySBA-15 samples
Table 10-1 Lattice plane distance (d100) and cell parameter (a0) determined from the 100 diffraction in the small angle XRD powder patterns BET surface area (SBET) C parameter (CBET) and BJH pore size (dporeBJH) pore volume (Vpore) and the SBA-15 channel wall thickness (dwall determined from a0-dporeBJH) of the initial bare and the functionalized VxOySBA-15 samples () sample prepared via the ion exchange method in Figure 4-1 () sample prepared by wet impregnation with a NH4VO3 solution () sample prepared by incipient wetness using a (NH4)6V10O28 solution
Sample
d100 [nm] a0 [nm] dporeBJH [nm] dwall [nm] (BJH)
Vpore [mlg] (BJH)
SBET [m2g-1] CBET
bare func bare func bare func bare func bare func bare func bare func
30 wt VxOySBA-15
102 100 118 115 80 71 38 44 078 067 751 522 148 186
57 wt VxOySBA-15
104 104 120 120 80 92 4 28 082 081 768 403 166 131
50 wt VxOySBA-15
103 102 119 118 80 70 39 48 066 050 639 270 166 180
77 wt VxOySBA-15
105 102 122 118 80 80 42 38 085 057 818 386 144 153
41 wt VxOySBA-15
100 99 115 114 70 70 45 44 067 057 607 427 146 155
14 wt VxOySBA-15
102 100 117 116 80 70 37 46 085 071 749 542 132 164
Table 10-2 CHN element content of bare SBA-15 SBA-15-APTES and calcined VxOySBA-15 samples () samples prepared via the ion exchange method in Figure 4-1 () sample prepared by wet impregnation with a NH4VO3 solution () sample prepared by incipient wetness using a (NH4)6V10O28 solution
Sample
bare SBA-15
[wt]
VxOy SBA-15 [wt]
APTESSBA-15 [wt]
APTESSBA-15 APTESSBA-15
C H C H N C H mmol N g Nnm2 (bare
SBA-15)
30 wt VxOySBA-15 01 10 02 09
57 wt VxOySBA-15 01 08 02 07
50 wt VxOySBA-15 20 06 00 04 16 48 15 114 11
77 wt VxOySBA-15 01 10 01 09 27 87 22 193 14
41 wt VxOySBA-15 01 00 01 11 19 72 17 136 13
14 wt VxOySBA-15 01 05 00 09 49 148 35 350 28
Appendix
180
102 Information Vanadium oxide and vanadate references
Table 10-3 Origin and theoretical XRD phases that match the experimental XRD powder pattern of the vanadium oxide references used
Sample Purchaser Synthesized Reference for Theoretical Structure
Ca3V2O8 Synthesized
(TU Berlin AK Ressler) [172]
Mg3V2O8 Synthesized
(TU Berlin AK Ressler) [67]
Na3VO4 Aldrich 9998 no explicit phase
m-Mg2V2O7 Synthesized
(TU Berlin AK Ressler) [69]
K3VO4 Alfa Aesar 999 no explicit phase
Ca2V2O7 Synthesized
(TU Berlin AK Ressler) [173]
t-Mg2V2O7 Synthesized
(TU Berlin AK Ressler) [139]
NaVO3 Aldrich 999 [174]
KVO3 Alfa Aesar 999 [175]
NH4VO3 Fluka 99 [138]
CaV2O6 Synthesized
(TU Berlin AK Ressler) [176]
(NH4)6V10O28 Synthesized
(TU Berlin AK Ressler) [177]
Mg3V10O28 middotxH2O Synthesized
(TU Berlin AK Ressler) [66]
MgV2O6 Synthesized
(TU Berlin AK Ressler) [68]
V2O5 Alfa Aesar 998 [140]
VO2(B) Synthesized
(TU-Berlin AK Lerch) [71]
V3O7 Synthesized
(TU-Berlin AK Lerch) [178]
V2O3 Synthesized
(TU-Berlin AK Lerch) [179]
181
103 Baselines of white reflectance standard measured in the in situ UV-Vis-DR cells used
0
100
20
40
60
80
200 800400 600Wavelength [nm]
Ref
lect
ion
[]
Integration SphereMgO (ABCR)
Figure 10-1 Baseline measured in the UV-Vis-DR spectrometer using the standard integration sphere
0
4
1
2
3
200 800400 600Wavelength [nm]
Ref
lect
ion
[]
Praying MantisTM Cell MgO (ABCR)
SBA-15
Figure 10-2 Baselines measured in the UV-Vis-DR spectrometer using the Praying MantisTM cell
182
104 In situ Raman measurements during dehydration
200 400 600 800 1000 12000
3000
6000
9000298 Kafter
773 K623 K
523 K
453 K
423 K
393 K
363 K
333 K298 K
inte
nsity
raman shift [cm-1]
3 mW 514 nm
267
521706 1037
269
522 705 1020
270
528 702 1023
273
5291026697
270 357
528
525
1037272
524 710 1038274
529 696 1037995
1034529
7051041
287
995
409
200 400 600 800 1000 1200500
1000
1500
2000
2500
3000
3500
4000
298 KH
2O
298 K
623 K
523 K
453 K
423 K
393 K
363 K
333 K
298 K
513
513710
702
707
1037
1037
inte
nsity
raman shift [cm-1]
1025
1027
1023
1032
1028
1035
1040
707
700
702
698
704514
407265
266
265
264
264
263
264
263
264521
515
513
518
521
514 nm 3mW
Figure 10-3 In situ Raman spectra during dehydration in a ldquodryrdquo (left) and a water saturated atmosphere (right) 20 O2 and 80 N2 (and ~ 45 H2O) 25 mlmin ndash 50 mlmin
105 Usable spectral range of the χ(k)k3 determined from in situ XAFS spectra
00
50
100
150
200
00
-50
4 6 8 10
χ(k)
k3
k [Aring-1]
EXAFS scan 723 K
EXAFS scan 298 K
QEXAFS scan 723 K
Figure 10-4 Usable spectral range of EXAFS and QEXAFS scans used for measurements of 77 wt VxOySBA-15 under catalytic conditions (5 propene and 5 O2 in He 40 mlmin)
183
106 Supporting data chapter 7
560 630 700 77000
01
02
03
04
01
02
03
04
01
02
03
04
05560 630 700 770
Sel
ectiv
ity
Temperature [K]
CO2
CO acetaldehyde propionaldehyde aceton acrolein acetic acid
UV-Vis-DR cell
SiO2 tube reactor
Sel
ectiv
ity
Sel
ectiv
ity
XAS cell
Figure 10-5 Product selectivities determined in the different measurement cells during the temperature programmed propene oxidation using a dehydrated 77 wt VxOySBA-15
550 575 600 625 650 675 700 725
000
005
010
015
020
Run 1
Run 2
acetaldehyde propionealdehyde acetone acrolein acetic acid
Con
cent
ratio
n [V
ol
]
Temperature [K]
000
005
010
015
020
Con
cent
ratio
n [V
ol
]
Figure 10-6 Product concentration during propene oxidation (5 O2 and 5 propene in He) of 77 wt VxOySBA-15 for subsequent temperature programmed reactions
184
-10 -05 00 05 10 15-8
-7
-6
-5
-4
-3 673 K
y(563)=06x-73 R=0999
y(673)=06x-50R=0996
y(633)=06x-61R=0992
ln(R
ate
Acr
olei
n) [m
olpr
open
e(g
catm
in)]
ln(c(C3H
6)) [molm3]
633 K 713 K
y(713)=08x-43R=0998
563 K
00 05 10 15-75
-70
-65
-60
-55
-50
-45
-40
-35
-30
633 K
y(563)=02x-70R=091
y(713)=05x-42R=099
y(673)=03x-48R=095
y(633)=02x-58R=088
ln(R
ate
Acr
olei
n) [m
olpr
open
e(g ca
tmin
)]
ln(c(O2)) [molm3]
673 K 713 K
563 K
Figure 10-7 Determination of the reaction order for propene (left) and oxygen (right) for the acrolein formation on 77 wt VxOySBA-15
-10 -05 00 05 10 15-10
-9
-8
-7
-6
-5
633 K
y(714)=06x-63 R=099
y(673)=05x-67 R=098
y(633)=05x-74 R=097
ln(R
ate
Acr
olei
n) [m
olpr
open
e(g
catm
in)]
ln(c(C3H
6)) [molm3]
673 K 714 K
563 K
y(563)=06x-86 R=098
00 05 10 15-10
-9
-8
-7
-6
-5
633 K
y(563)=-01x-8 R=099
y(714)=-01x-56 R=096
y(673)=00x-61 R=097
y(633)=-01x-68 R=098
ln(R
ate
Acr
olei
n) [m
olpr
open
e(g
catm
in)]
ln(c(O2)) [molm3]
673 K 714 K
( )
( )
( )
( )
563 K
Figure 10-8 Determination of the reaction order for propene (left) and oxygen (right) for the acrolein formation on 14 wt VxOySBA-15
185
107 Results of the analysis of the V K edge pre-edge feature
Table 10-4 Results of the analysis of the pre-edge feature determined from the normalized V K edge XANES spectra ( Chapter 8 Figure 8-2) Energy position at maximum intensity relative to V K edge (5645 keV) height of pre-edge peak at maximum intensity (PH) centroid energy and energy position of the individual components relative to V K edge (5645 keV) determined and total area of pre-edge peak from peak refinement according to Chaurand et al [94] (Section 524 Figure 5-4 right) product of pre-edge peak height and total area average V-O bond length from the literature (Table 10-3) and beamline used at Hasylab
Sample E PH
Component positon [eV] Total Area
Centroid RV-O PHmiddot Area
Beam-line
[ eV] 1 2 3 [eV] [Aring]
Ca3V2O8 470 108 470 331 497 206 471 170 223 A
Mg3V2O8 470 103 474 342 589 210 480 173 216 A
Na3VO4 470 105 473 342 530 201 469
A
m-Mg2V2O7 480 092 483 351 613 206 482 171 189 A
K3VO4 480 100 478 323 698 218 499
A
Ca2V2O7 490 083 483 310 605 184 492 177 152 A
t-Mg2V2O7 490 088 492 321 710 234 507 172 206 A
NaVO3 490 077 492 333 706 232 512 172 179 A
KVO3 490 086 487 309 699 234 498 174 201 A
NH4VO3 490 080 486 320 698 216 502 172 173 A
CaV2O6 520 075 517 359 672 180 545 182 135 A
(NH4)6V10O28 530 052 528 345 729 134 556 192 070 A
Mg3V10O28 530 055 525 339 731 136 547 192 075 A
MgV2O6 530 064 520 335 647 169 544 183 108 A
V2O5 540 057 301 532 683 189 594 183 108 A
hydrated VxOySBA-15
560 057 555 389 741 165 564
094 A
dehydrated VxOySBA-15
540 074 536 343 705 221 523
164 A
reduced 673 K VxOySBA-15
517 032 544 388
100 448
032 A
reduced 723 K VxOySBA-15
424 020 382 537 199 069 398
014 A
VO2(B) 526 030 395 550 757 114 542
034 C
V3O7 517 049 426 519 728 177 553
086 C
V2O3 519 012 087 258 466 032 399
004 C
186
108 Results from XRD refinements
monoclinic Mg2V2O7 (Sample B Figure 2-2)
R-Values [] Rexp 349 Rwp 622 Rp 471 GOF 178 Quantitative Analysis - Rietveld Phase 1 ICSD 2321 282(22) wt Phase 2 ICSD 93603 9718(22) wt Phase 1 ICSD 2321 [139] R-Bragg [] 2092
Spacegroup 1P Crystallite Size [nm] (Lorentzian) 266(46) Lattice parameters a (Aring) 13968(19) b (Aring) 5641(12) c (Aring) 48838(86) alpha (deg) 8113(11) beta (deg) 10583(12) gamma (deg) 13008(13) Phase 2 ICSD 93603 [69] R-Bragg [] 3255 Spacegroup P121c1 Crystallite Size [nm] (Lorentzian) 10169(60) Lattice parameters a (Aring) 660368(41) b (Aring) 841165(51) c (Aring) 948087(57) beta (deg) 1006372(10)
triclinic Mg2V2O7
R-Values[] Rexp 382 Rwp 680 Rp 512 GOF 178 Quantitative Analysis - Rietveld Phase 1 ICSD 2321 9600(35) wt Phase 2 ICSD 93603 400(35) wt Phase 1 ICSD 2321 [139] R-Bragg [] 2703
Spacegroup 1P Crystallite Size [nm] (Lorentzian) 1821(16) Lattice parameters a (Aring) 1377974(43) b (Aring) 541704(18) c (Aring) 492857(16) alpha (deg) 8137459(73) beta (deg) 10683011(74) gamma (deg) 13034723(69) Phase 2 ICSD 93603 [69] R-Bragg [] 2059 Spacegroup P121c1 Crystallite Size [nm] (Lorentzian) 193(31) Lattice parameters a (Aring) 6681(10) b (Aring) 8236(13) c (Aring) 9472(12) beta (deg) 9993(16)
187
MgV2O6 (Sample D Figure 2-2)
R-Values [] Rexp 351 Rwp 953 Rp 639 GOF 271 Phase ICSD 10391 [68] R-Bragg [] 7395 Spacegroup C12m1 Crystallite Size [nm] (Lorentzian) 1487(17) Strain (Gaussian) 00815(29) Lattice parameters a (Aring) 928049(49) b (Aring) 348887(18) c (Aring) 672976(36) beta (deg) 11173192(82)
Mg3V2O8
R-Values [] Rexp 264 Rwp 552 Rp 417 GOF 209 Phase ICSD 21085 [67] R-Bragg [] 2672 Spacegroup Cmca Crystallite Size [nm] (Lorentzian) 2042(27) Strain (Gaussian) 01085(16) Lattice parameters a (Aring) 606620(27) b (Aring) 1144485(50) c (Aring) 831868(36)
Mg3V10O28middotx H2O
R-Values [] Rexp 238 Rwp 1022 Rp 730 GOF 429 Phase Mg3V10O28middot28 H2O [66] R-Bragg [] 6247
Spacegroup 1P Crystallite Size [nm] (Lorentzian) 903(21) Strain (Gaussian) 000(14) Lattice parameters a (Aring) 1052751(64) b (Aring) 1074262(71) c (Aring) 213503(13) alpha (deg) 898932(68) beta (deg) 976450(62) gamma (deg) 1043959(66)
188
5049484746454443424140393837363534333231302928272625242322212019181716151413121110
700
600
500
400
300
200
100
0
-100
-200
-300
V4O9 8407 V2O5 1593
2 θ [deg]
Inte
nsity
Figure 10-9 Experimental Cu Kα XRD powder pattern of V4O9 determined in 5 propene in He (56 mlmin) (dotted black) at 598 K together with the XRD structure refinement of the corresponding phases (solid red) and the differential plot (solid grey)
Experimental XRD pattern of V4O9 determined during reduction of V2O5 in 5 propene in He
(56 mlmin) at 598 K
R-Values [] Rexp 1335 Rwp 3434 Rp 2742 GOF 257 Quantitative Analysis ndash Rietveld Phase 1 V4O9 Kijima 8407(90) wt Phase 2 V2O5 1593(90) wt Phase 1 V4O9 Kijima [56] R-Bragg [] 22440 Spacegroup Cmcm Crystallite Size [nm] (Lorentzian) 494(50) Strain (Gaussian) 1652(75) Lattice parameters a (Aring) 103877(47) b (Aring) 81717(28) c (Aring) 167118(21) Phase 2 V2O5 [140] R-Bragg [] 24828 Spacegroup Pmmn Crystallite Size [nm] (Lorentzian) 10000(870000) Strain (Gaussian) 280(29) Lattice parameters a (Aring) 11598(11) b (Aring) 35435(33) c (Aring) 43870(46)
189
Bibliography
[1] Centi G Cavani F Trifirograve F Selective Oxidation by Heterogeneous Catalysis Kluwer
Academic Plenum Publishers New York 2001 p 1
[2] Arpe H-J Industrielle Organische Chemie bedeutende Vor- und Zwischenprodukte 6th ed Wiley-VCH Weinheim Germany 2007 p 317
[3] Lin M M Selective oxidation of propane to acrylic acid with molecular oxygen Appl Catal A 2001 207 (1-2) 1-16
[4] Kniep B L Ressler T Rabis A Girgsdies F Baenitz M Steglich F Schloumlgl R Rational Design of Nanostructured CopperndashZinc Oxide Catalysts for the Steam Reforming of Methanol Angew Chem Int Ed 2004 43 (1) 112 ndash115
[5] Bettahar M M Costentin G Savary L Lavalley J C On the partial oxidation of propane and propylene in mixed metal oxide catalysts Appl Catal A 1996 145 (1-2) 1-48
[6] Schloumlgl R Active Sites for Propane Oxidation Some Gerneric Considerations Top Catal 2011 54 (10-12) 627-638
[7] Ressler T Solid-state kinetics and catalytic behavior of selective oxidation catalysts from time-resolved XAFS investigations Catal Today 2009 145 (3-4) 258ndash266
[8] Ressler T Walter A Huang Z-D Bensch W Structure and properties of a supported MoO3ndashSBA-15 catalyst for selective oxidation of propene J Catal 2008 254 (2) 170ndash179
[9] Ressler T Walter A Scholz J Tessonnier J-P Su D S Structure and properties of a Mo oxide catalyst supported on hollow carbon nanofibers in selective oxidation J Catal 2010 271 (2) 305ndash314
[10] Ressler T Dorn U Walter A Schwarz S Hahn A H P Structure and properties of PVMo11O40 heteropolyoxomolybdate supported on silica SBA-15 as selective oxidation catalyst J Catal 2010 275 (1) 1ndash10
[11] Bruumlckner W Oppermann H Reichelt W Terukow J I Abramowitsch F Wolf E Vanadiumoxide Darstellung Eigenschaften Anwendung Akademie-Verlag Berlin 1983 pp 13ndash17
[12] Dinse A Khennache S Frank B Hess C Herbert R Wrabetz S Schloumlgl R Schomaumlcker R Oxidative dehydrogenation of propane on silica (SBA-15) supported vanadia catalysts A kinetic investigation J Mol Catal A 2009 307 (1-2) 43ndash50
[13] Sugiyama S Hirata Y Osaka T Mogria T Nakagawa K Sotowa K-I 51V MAS NMR and XAFS Evidences for Redox of Magnesium Pyro- and Ortho-Vanadates on the Oxidative Dehydrogenation of Propane J Ceram Soc Jpn 2007 115 (10) 667ndash671
[14] Centi G Cavani F Trifirograve F Selective Oxidation by Heterogeneous Catalysis Kluwer Academic Plenum Publishers New York 2001 pp 203-283
190
[15] Loacutepez Nieto J M Kremenic G Fierro J L G Selective Oxidation of Propene over Supported Vanadium Oxide Catalysts Appl Catal A 1990 61 (1) 235ndash251
[16] Zhao C Wachs I E Selective oxidation of propylene over model supported V2O5 catalysts Influence of surface vanadia coverage and oxide support J Catal 2008 257 (1) 181ndash189
[17] Bauer G Guumlther V Hess H Otto A Roidl O Roller H Sattelberger S Vanadium and Vanadium Compounds In Ullmannrsquos Encyclopedia of Industrial Chemistry Wiley-VCH Weinheim Germany 2005 doi10100214356007a27_367
[18] Weckhuysen B M Keller D E Chemistry spectroscopy and the role of supported vanadium oxides in heterogeneous catalysis Catal Today 2003 78 (1-4) 25ndash46
[19] Bartholomew C H Farrauto R J Fundamentals of Industrial Catalytic Processes 2nd ed Wiley-VCH Hoboken NJ 2006 pp 580ndash583
[20] Hess C Hoefelmeyer J D Tilley T D Bell A T Partial oxidation of methanol over highly dispersed vanadia supported on silica SBA-15 Catal Lett 2005 105 (1-2) 1ndash8
[21] Bronkema J L Bell A T Mechanistic Studies of Methanol Oxidation to Formaldehyde on Isolated Vanadate Sites Supported on MCM-48 J Phys Chem C 2007 111 (1) 420ndash430
[22] Du G Lim S Pinault M Wang C Fang F Pfefferle L Haller G L Synthesis characterization and catalytic performance of highly dispersed vanadium grafted SBA-15 catalyst J Catal 2008 253 (1) 74ndash90
[23] Gao X Bare S R Weckhuysen B M Wachs I E In Situ Spectroscopic Investigation of Molecular Structures of Highly Dispersed Vanadium Oxide on Silica under Various Conditions J Phys Chem B 1998 102 (52) 10842ndash10852
[24] Berndt H Martin A Bruumlckner A Schreier E Muumlller D Kosslick H Wolf G-U Luumlcke B Structure and Catalytic Properties of VOxMCM Materials for the Partial Oxidation of Methane to Formaldehyde J Catal 2000 191 (2) 384ndash400
[25] Forneacutes V Loacutepez C Loacutepez H H Martiacutenez A Catalytic performance of mesoporous VOxSBA-15 catalysts for the partial oxidation of methane to formaldehyde Appl Catal A 2003 249 (2) 345ndash354
[26] Launay H Loridant S Nguyen D L Volodin A M Dubois J L Millet J M M Vanadium species in new catalysts for the selective oxidation of methane to formaldehyde Activation of the catalytic sites Catal Today 2007 128 (3-4) 176ndash182
[27] Nguyen L D Loridant S Launay H Pigamo A Dubois J L Millet J M M Study of new catalysts based on vanadium oxide supported on mesoporous silica for the partial oxidation of methane to formaldehyde Catalytic properties and reaction mechanism J Catal 2006 237 (1) 38ndash48
[28] Gruene P Wolfram T Pelzer K Schloumlgl R Trunschke A Role of dispersion of vanadia on SBA-15 in the oxidative dehydrogenation of propane Catal Today 2010 157 (1-4) 137ndash142
[29] Ovsitser O Cherian M Kondratenko E V In-Situ UVvis and Transient Isotopic Analysis of the Role of Oxidizing Agent in the Oxidative Dehydrogenation of Propane over Silica-Supported Vanadia Catalysts J Phys Chem C 2007 111 (24) 8594ndash8602
[30] Wachs I E Weckhuysen B M Structure and reactivity of surface vanadium oxide species on oxide supports Appl Catal A 1997 157 (1-2) 67ndash90
191
[31] Muylaert I Van Der Voort P Supported vanadium oxide in heterogeneous catalysis elucidating the structurendashactivity relationship with spectroscopy Phys Chem Chem Phys 2009 11 (16) 2826ndash2832
[32] Hess C Hoefelmeyer J D Tilley T D Spectroscopic Characterization of Highly Dispersed Vanadia Supported on SBA-15 J Phys Chem B 2004 108 (28) 9703ndash9709
[33] Hanke W Bienert R Jerschkewitz H-G Untersuchungen an katalytisch aktiven Oberflaumlchenverbindungen Herstellung und Untersuchung von Vanadinoxid-Phasen auf SiO2 Z Anorg Allg Chem 1975 414 (2) 109ndash129
[34] Xie S Iglesia E Bell A T Effects of Hydration and Dehydration on the Structure of Silica-Supported Vanadia Species Langmuir 2000 16 (18) 7162ndash7167
[35] Morey M Davidson A Eckert H Stucky G Pseudotetrahedral O32VO Centers Immobilized on the Walls of a Mesoporous Cubic MCM-48 Support Preparation Characterization and Reactivity toward Water As Investigated by 51V NMR and UVndashVis Spectroscopies Chem Mater 1996 8 (2) 486ndash492
[36] Thomson Reuters (formerly ISI) Web of Knowledge database httpwwwisiwebofknowledge com (accessed Jan 2011)
[37] Keller D E Koningsberger D C Weckhuysen B M Molecular Structure of a Supported VO4 Cluster and Its Interfacial Geometry as a Function of the SiO2 Nb2O5 and ZrO2 Support J Phys Chem B 2006 110 (29) 14313ndash14325
[38] Chlosta R Tolzov-Muumlller G Schloumlgl R Hess C Nature of dispersed vanadium oxide influence of the silica support structure and synthesis methods Catal Sci Technol 2011 doi 101039c1cy00062d
[39] Molinari J E Wachs I E Presence of Surface Vanadium Peroxo-oxo Umbrella Structures in Supported Vanadium Oxide Catalysts Fact or Fiction J Am Chem Soc 2010 132 (36) 12559ndash12561
[40] Schraml-Marth M Wokaun A Pohl M Krauss H-L Spectroscopic Investigation of the Structure of Silica-supported Vanadium Oxide Catalysts at Submonolayer Coverages J Chem Soc Faraday Trans 1991 87 (16) 2635ndash2646
[41] Walter A Herbert R Hess C Ressler T Structural characterization of vanadium oxide catalysts supported on nanostructured silica SBA-15 using X-ray absorption spectroscopy Chem Cent J 2010 4 3
[42] Haumlvecker M Cavalleri M Herbert R Follath R Knop-Gericke A Hess C Hermann K Schloumlgl R Methodology for the structural characterisation of VxOy species supported on silica under reaction conditions by means of in situ O K-edge X-ray absorption spectroscopy Phys Status Solidi B 2009 246 (7) 1459ndash1469
[43] Cavalleri M Hermann K Knop-Gericke A Haumlvecker M Herbert R Hess C Oestereich A Doumlbler J Schloumlgl R Analysis of silica-supported vanadia by X-ray absorption spectroscopy Combined theoretical and experimental studies J Catal 2009 262 (2) 215ndash223
[44] Venkov T V Hess C Jentoft F C Redox Properties of Vanadium Ions in SBA-15-Supported Vanadium Oxide An FTIR Spectroscopic Study Langmuir 2007 23 (4) 1768ndash1777
[45] Rozanska X Kondratenko E V Sauer J Oxidative dehydrogenation of propane Differences between N2O and O2 in the reoxidation of reduced vanadia sites and consequences for selectivity J Catal 2008 256 (1) 84ndash94
192
[46] Novakova E K Veacuterdrine J C Propane Selective Oxidation to Propene and Oxygenates on Metal Oxides In Metal Oxides Chemistry and Applications Fierro J L G Ed CRC Press Boca Raton FL 2006 pp 413ndash461
[47] Ressler T Solid-state kinetics and catalytic behavior of selective oxidation catalysts from time-resolved XAFS investigations Catal Today 2009 145 (3-4) 258ndash266
[48] Loacutepez Nieto J M Kremenic G Fierro J L G Selective Oxidation of Propene over Supported Vanadium Oxide Catalysts Appl Catal 1990 61 (1) 235ndash251
[49] Centi G Cavani F Trifirograve F Selective Oxidation by Heterogeneous Catalysis Kluwer Academic Plenum Publishers New York 2001 p 234
[50] Patel D Andersen P J Kung H H Oxidative Dehydrogenation of Butane over Orthovanadates J Catal 1990 125 (1) 132ndash142
[51] Solsona B Dejoz A Vaacutezquez M I Maacuterquez F Loacutepez Nieto J M SiO2-supported vanadium magnesium mixed oxides as selective catalysts for the oxydehydrogenation of short chain alkanes Appl Catal A 2001 208 (1-2) 99ndash110
[52] Siew Hew Sam D Soenen V Volta J C Oxidative Dehydrogenation of Propane over V---Mg---O Catalysts J Catal 1990 123 (2) 417ndash435
[53] Cavani F Ballarini N Cericola A Oxidative dehydrogenation of ethane and propane How far from commercial implementation Catal Today 2007 127 (1-4) 113ndash131
[54] Kung H H Kung M C Oxidative dehydrogenation of alkanes over vanadium-magnesium-oxides Appl Catal A 1997 157 (1-2) 105ndash116
[55] Gao X Ruiz P Xin Q Guo X Delmon B Preparation and characterization of three pure magnesium vanadate phases as catalysts for selective oxidation of propane to propene Catal Lett 1994 23 (3-4) 321ndash337
[56] Kijima N Toba M Yoshimura Y A Chemical Potential Diagram and an In-situ X-ray Diffraction Analysis of a VndashMgndashO Catalyst Used in the Oxidative Dehydrogenation of n-Butane Catal Lett 2009 127 (1-2) 63ndash69
[57] Sugiyama S Hirata Y Osaka T Mogria T Nakawa K Sotowa K-I 51V MAS NMR and XAFS Evidences for Redox of Magnesium Pyro- and Ortho-Vanadates on the Oxidative Dehydrogenation of Propane J Ceram Soc Jpn 2007 115 (10) 667ndash671
[58] Balderas-Tapia L Hernaacutendez-Peacuterez I Schacht P Coacuterdova I R Aguilar-Riacuteos G G Influence of reducibility of vanadiumndashmagnesium mixed oxides on the oxidative dehydrogenation of propane Catal Today 2005 107-108 371ndash376
[59] Ballarini N Battisti A Cavani F Cericola A Cortelli C Ferrari M Trifirograve F Arpentinier P The combination of propane partial oxidation and of WGS reaction in a single catalytic bed and the self-adapting catalytic properties of vanadium oxide catalyst Appl Catal A 2006 307 (1) 148ndash155
[60] Haber J Witko M Tokarz R Vanadium pentoxide I Structures and properties Appl Catal A 1997 157 (1-2) 3ndash22
[61] Colpaert M N Clauws P Fiermans L Vennik J Thermal and low energy electron bombardment induced oxygen loss of V2O5 single crystals Transition into V6O13 Surf Sci 1973 36 (2) 513ndash525
193
[62] Colpaert M N Exploratory Study of Catalytic Oxidation Reactions on Vanadium Pentoxide Single Crystals Z Phys Chem (Frankfurt) 1973 84 (1-4) 150ndash156
[63] Andersson A An Oxidized Surface State Model of Vanadium Oxides and Its Application to Catalysis J Solid State Chem 1982 42 (3) 263ndash275
[64] Yamazaki S Li C Ohoyama K Nishi M Ichihara M Ueda H Ueda Y Synthesis structure and magnetic properties of V4O9 ndash A missing link in binary vanadium oxides J Solid State Chem 2010 183 (7) 1496ndash1503
[65] Holgado J P Soriano M D Jimeacutenez-Jimeacutenez J Concepcioacuten P Jimeacutenez-Loacutepez A Caballero A Rodriacuteguez-Castelloacuten E Loacutepez Nieto J M Operando XAS and Raman study on the structure of a supported vanadium oxide catalyst during the oxidation of H2S to sulphur Catal Today 2010 155 (3-4) 296ndash301
[66] Iida A Ozeki T Mg2Na2V10O28middot20H2O and Mg3V10O28middot28H2O Acta Crystallogr Sect C 2004 C60 i43ndashi46
[67] Krishnamachari N Calvo C Refinement of the Structure of Mg3(VO4)2 Can J Chem 1971 49 (10) 1629ndash1637
[68] Ng H N Calvo C Crystal Structure of and Electron Spin Resonance of Mn2+ in MgV2O6 Can J Chem 1972 50 (22) 3619ndash3624
[69] Nielsen U G Jakobsen H J Skibsted J Norby P Crystal structure of α-Mg2V2O7 from synchrotron X-ray powder diffraction and characterization by 51V MAS NMR spectroscopy J Chem Soc Dalton Trans 2001 21 3214ndash3218
[70] Ulikaacute L Thermal Decomposition of Decavanadates of Bivalent Metals J Therm Anal Calorim 1980 18 (1) 127ndash136
[71] Oka Y Yao T Yamamoto N Ueda Y Hayashi A Phase Transition and V4+-V4+ Pairing in VO2(B) J Solid State Chem 1993 105 (1) 271ndash278
[72] Kim Y H Lee H-I Redox Property of Vanadium Oxide and Its Behavior in Catalytic Oxidation Bull Korean Chem Soc 1999 20 (12) 1457ndash1463
[73] Kijima N Toba M Yoshimura Y A Chemical Potential Diagram and an In-situ X-ray Diffraction Analysis of a VndashMgndashO Catalyst Used in the Oxidative Dehydrogenation of n-Butane Catal Lett 2009 127 (1-2) 63ndash69
[74] Bruumlckner W Oppermann H Reichelt W Terukow J I Abramowitsch F Wolf E Vanadiumoxide Darstellung Eigenschaften Anwendung Akademie-Verlag Berlin 1983 pp 13ndash17
[75] Schiebold E Uumlber die Kristallstruktur des Periclas Z Kristallogr 1921 56 430-435
[76] Ruumldorff W Reuter B Die Struktur der Magnesium- und Zink-Vanadinspinelle Beitrag zur Struktur der Spinelle Z Anorg Allg Chem 1947 253 (3-4) 194ndash208
[77] Reuter B Aust R Colsmann G Neuwald Ch Uumlber Oxidsysteme mit Uumlbergangsmetallionen in verschiedenen Oxydationsstufen XIX Darstellung und Eigenschaften Vanadium(II)-haltiger und damit n-leitender Vanadium(III)-Spinelle Z Anorg Allg Chem 1983 500 (5) 188ndash198
[78] Bosch H Kip B J Van Ommen J G Gellings P J Factors Influencing the Temperature-programmed Reduction Profiles of Vanadium Pentoxide J Chem Soc Faraday Trans 1 1984 80 (9) 2479ndash2488
194
[79] Theacuteobald F Cabala R Bernard J C R Acad Sci Paris 1969 269 1209ndash1212
[80] Burrows A Kiely C J Perregaard J Hoslashjlund-Nielsen P E Vorbeck G Calvino J J Loacutepez-Cartes C Structural characterisation of a VMgO catalyst used in the oxidative dehydrogenation of propane Catal Lett 1999 57 (3) 121ndash128
[81] Soenen V Herrmann J M Volta J C In Situ Electrical Characterization of Magnesium Vanadate Reference Phases (meta-MgV2O6 pyro-Mg2V2O7 and ortho-Mg3V2O8) Used in Oxidative Dehydrogenation of Propane to Propene J Catal 1996 159 (2) 410ndash417
[82] Zhao D Feng J Huo Q Melosh N Fredrickson G H Chmelka B F Stucky G D Triblock Copolymer Syntheses of Mesoporous Silica with Periodic 50 to 300 Angstrom Pores Science (Washington DC) 1998 279 (5350) 548ndash552
[83] Schreiber A Ketelsen I Findenegg G H Melting and freezing of water in ordered mesoporous silica materials Phys Chem Chem Phys 2001 3 (7) 1185ndash1195
[84] Adaptation from Harris D C Exploring Chemical Analysis Freeman New York 1997 Home Page httparchivesevergreeneduwebpagescurricular20002001MANDM2000Handouts Labs Chemistrylab6xhtm (accessed July 2008)
[85] FEFF Home Page httpleonardophyswashingtonedufeff (accessed May 2011)
[86] Koningsberger D C Prins R Eds X-ray Absorption principles applications techniques of EXAFS SEXAFS and XANES Wiley New York 1988
[87] Weckhuysen B M Ed In-situ spectroscopy of catalysts American Scientific Publishers California 2004 Chapters 6 7 9
[88] Rehr J J Booth C H Bridges F Zabinsky S I X-ray-absorption fine structure in embedded atoms Phys Rev B Condens Matter 1994 49 (17) 12347ndash12350
[89] Rehr J J Albers R C Theoretical approaches to x-ray absorption fine structure Rev Mod Phys 2000 72 (3) 621ndash654
[90] Ressler T Jentoft R E Wienold J Guumlnter M M Timpe O In Situ XAS and XRD Studies on the Formation of Mo Suboxides during Reduction of MoO3 J Phys Chem B 2000 104 (27) 6360ndash6370
[91] Ressler T WinXAS a program for X-ray absorption spectroscopy data analysis under MS-Windows J Synchrotron Radiat 1998 5 (2) 118ndash122
[92] Ressler T Brock S L Wong J Suib S L Multiple-Scattering EXAFS Analysis of Tetraalkylammonium Manganese Oxide Colloids J Phys Chem B 1999 103 (31) 6407ndash6420
[93] Press W H Teukolsky S A Vetterling W T Flannery B P Numerical Recipes The Art of Scientific Computing 3rd ed Cambridge University Press New York 2007 (wwwnrcom)
[94] Chaurand P Rose J Briois V Salome M Proux O Nassif V Olivi L Susini J Hazemann J-L Bottero J-Y New Methodological Approach for the Vanadium K-Edge X-ray Absorption Near-Edge Structure Interpretation Application to the Speciation of Vanadium in Oxide Phases from Steel Slag J Phys Chem B 2007 111 (19) 5101ndash5110
[95] Weckhuysen B M Van der Voort P Catana G Eds Spectroscopy of transition metal ions on surfaces Leuven University Press Leuven Belgium 2000 pp 221ndash268
[96] Kober F Grundlagen der Komplexchemie Salle Frankfurt am Main 1979
195
[97] Woodward P M Mizoguchi H Kim Y-I Stoltzfus M W The Electronic Structure of Metal Oxides In Metal oxides chemistry and applications Fierro J L G Ed Taylor amp Francis Boca Raton FL 2006 pp 133ndash193
[98] Kortuumlm G Reflexionsspektroskopie Grundlagen Methodik Anwendungen Springer Berlin 1969
[99] Delgass W N Diffuse reflectance and photoacoustic spectroscopies In Spectroscopy in heterogeneous catalysis Academic Press New York 1979 pp 86ndash131
[100] Gao X Wachs I E Investigation of Surface Structures of Supported Vanadium Oxide Catalysts by UV-vis-NIR Diffuse Reflectance Spectroscopy J Phys Chem B 2000 104 (6) 1261ndash1268
[101] Barrett E P Joyner L G Halenda P P The Determination of Pore Volume and Area Distributions in Porous Substances I Computations from Nitrogen Isotherms J Am Chem Soc 1951 73 (1) 373
[102] Massiot D Fayon F Capron M King I Le Calveacute S Alonso B Durand J-O Bujoli B Gan Z Hoatson G Modelling one- and two-dimensional solid-state NMR spectra Magn Reson Chem 2002 40 (1) 70ndash76
[103] Thielemann J Synthesis Characterization and in situ Catalysis of Silica SBA-15 Supported Molybdenum Oxide Model Catalysts Dissertation Technical University Darmstadt 2011
[104] Vansant E F Van Der Voort P Vrancken K C Characterization and chemical modification of the silica surface studies in surface science and catalysis 93 Elsevier Amsterdam 1995 pp 93ndash126
[105] Fitzer E Fritz W Technische Chemie Einfuumlhrung in die chemische Reaktionstechnik 3rd ed Springer Berlin 1989 pp 42ndash49
[106] NIST chemistry WebBook database httpwebbooknistgovchemistry (accessed Aug 2010)
[107] Asatryan R da Silva G Bozzelli J W Quantum Chemical Study of the Acrolein (CH2CHCHO) + OH + O2 Reactions J Phys Chem A 2010 114 (32) 8302ndash8311
[108] Olthof B Khodakov A Bell A T Iglesia E Effects of Support Composition and Pretreatment Conditions on the Structure of Vanadia Dispersed on SiO2 Al2O3 TiO2 ZrO2 and HfO2 J Phys Chem B 2000 104 (7) 1516ndash1528
[109] Hardcastle F D Wachs I E Determination of Vanadium-Oxygen Bond Distances and Bond Orders by Raman Spectroscopy J Phys Chem 1991 95 (13) 5031ndash5041
[110] Sing K S W Everett D H Haul R A W Moscou L Pierotti R A Rouqueacuterol J Siemieniewska T Reporting physisorption data for gassolid systems with Special Reference to the Determination of Surface Area and Porosity Pure Appl Chem 1985 57 (4) 603ndash619
[111] Herbert R Synthesis Characterization and Catalysis of Nanostructured Vanadia Model Catalysts for Partial Oxidation of Propane Dissertation Technical Universiy Berlin 2008
[112] Van Der Voort P Ravikovitch P I De Jong K P Benjelloun M Van Bavel E Janssen A H Neimark A V Weckhuysen B M Vansant E F A New Templated Ordered Structure with Combined Micro- and Mesopores and Internal Silica Nanocapsules J Phys Chem B 2002 106 (23) 5873ndash5877
196
[113] Meyen V Cool P Vansant E F Kortunov P Grinberg F Kraumlger J Mertens M Lebedev O I Van Tendeloo G Deposition of vanadium silicalite-1 nanoparticle on SBA-15 materials Structural and transport characteristics of SBA-VS-15 Micropor Mesopor Mat 2007 99 (1-2) 14ndash22
[114] Keller D E Visser T Soulimani F Koningsberger D C Weckhuysen B M Hydration effects on the molecular structure of silica-supported vanadiumoxide catalysts A combined IR Raman UVndashvis and EXAFS study Vib Spectrosc 2007 43 (1) 140ndash151
[115] Hess C Wild U Schloumlgl R The mechanism for the controlled synthesis of highly dispersed vanadia supported on silica SBA-15 Micropor Mesopor Mat 2006 95 (1-3) 339ndash349
[116] Liu W Lai S Y Dai H Wang S Sun H Au C T Oxidative dehydrogenation of n-butane over mesoporous VOxSBA-15 catalysts Catal Lett 2007 113 (3-4) 147ndash154
[117] Hess C Tzolova-Muumlller G Herbert R The Influence of Water on the Dispersion of Vanadia Supported on Silica SBA-15 A Combined XPS and Raman Study J Phys Chem C 2007 111 (26) 9471ndash9479
[118] Hess C Direct correlation of the dispersion and structure in vanadium oxide supported on silica SBA-15 J Catal 2007 248 (1) 120ndash123
[119] Oyama S T Went G T Lewis K B Bell A T Somorjai G A Oxygen Chemisorption and Laser Raman Spectroscopy of Unsupported and Silica-Supported Vanadium Oxide Catalysts J Phys Chem B 1989 93 (18) 6786ndash6790
[120] Keller D E Koningsberger D C Weckhuysen B M Elucidation of the Molecular structure of Hydrated Vanadium Oxide Species by X-ray Absorption Spectroscopy Correlation between the VmiddotmiddotmiddotV coordination number and distance and the point of zero charge of the support oxide Phys Chem Chem Phys 2006 8 (41) 4814ndash4824
[121] Keller D E Airaksinen S M K Krause A O Weckhuysen B M Koningsberger D C Atomic XAFS as a Tool To Probe the Reactivity of Metal Oxide Catalysts Quantifying Metal Oxide Support Effects J Am Chem Soc 2007 129 (11) 3189ndash3197
[122] Keller D E Weckhuysen B M Koningsberger D C Application of AXAFS Spectroscopy to Transition-Metal Oxides Influence of the Nearest and Next Nearest Neighbour Shells in Vanadium Oxides Chem Eur J 2007 13 (20) 5845ndash5856
[123] Tanaka T Yamashita H Tsuchitani R Funabiki T Yoshida S X-Ray absorption (EXAFSXANES) study of supported vanadium oxide catalysts Structure of surface vanadium oxide species on silica and γ-alumina at a low level of vanadium loading J Chem Soc Faraday Trans 1 1988 84 (9) 2987ndash2999
[124] Keller D E de Groot F M F Koningsberger D C Weckhuysen B M ΛO4 Upside Down A New Molecular Structure for Supported VO4 Catalysts J Phys Chem B 2005 109 (20) 10223ndash10233
[125] Sojka Z Bozon-Verduraz F Che M UVndashVisndashNIR and EPR Spectroscopies In Handbook of heterogeneous catalysis 2nd ed Ertl G Knoumlzinger H Schuumlth F Weitkamp J Eds Wiley-VCH Weinheim Germany 2008 Vol 2 pp 1039ndash1065
[126] Weckhuysen B M Van Der Voort P Catana G Eds Spectroscopy of transition metal ions on surfaces Leuven University Press Leuven Belgium 2000 Chapter 4 pp 244ndash254
[127] Weber R S Effect of Local Structure on the UV-Visible Absorption Edges of Molybdenum Oxide Clusters and Supported Molybdenum Oxides J Catal 1995 151 (2) 470ndash474
197
[128] Tian H Roberts C A Wachs I E Molecular Structural Determination of Molybdena in Different Environments Aqueous Solutions Bulk Mixed Oxides and Supported MoO3 Catalysts J Phys Chem C 2010 114 (33) 14110ndash14120
[129] Ross-Medgaarden E I Wachs I E Structural Determination of Bulk and Surface Tungsten Oxides with UVminusvis Diffuse Reflectance Spectroscopy and Raman Spectroscopy J Phys Chem C 2007 111 (41) 15089ndash15099
[130] Haaszlig F Adams A H Buhrmester T Schimanke G Martin M Fuess H X-Ray absorption and X-ray diffraction studies on molybdenum doped vanadium pentoxide Phys Chem Chem Phys 2003 5 (19) 4317-4324
[131] Wong J Lytle F W Messmer R P Maylotte D H K-edge absorption spectra of selected vanadium compounds Phys Rev B Condens Matter 1984 30 (10) 5596ndash5610
[132] Centi G Perathoner S Trifiro F Aboukais A Aissi C F Guelton M Physicochemical characterization of V-silicalite J Phys Chem 1992 96 (6) 2617ndash2629
[133] So H Pope M T Origin of some charge-transfer spectra Oxo compounds of vanadium molybdenum tungsten and niobium including heteropoly anions and heteropoly blues Inorg Chem 1972 11 (6) 1441ndash1443
[134] Ronde H Snijder J G The position of the VO3minus4 charge-transfer transition as a function of the
V---O distance Chem Phys Lett 1977 50 (2) 282ndash283
[135] Lazukova N I Gubanov V A Mokerov V G Electronic Absorption Spectra of V2O5 Int J Quantum Chem 1977 12 (5) 915-923
[136] Avdeev V I Zhidomirov G M Modeling the active centers of V2O5SiO2 and V2O5TiO2 supported catalysts DFT theoretical analysis of optical properties J Struct Chem+ 2005 46 (4) 577ndash590
[137] Thielemann J P Ressler T Walter A Tzolova-Muumlller G Hess C Structure of molybdenum oxide supported on silica SBA-15 studied by Raman UVndashVis and X-ray absorption spectroscopy Appl Catal A 2011 399 (1-2) 28ndash34
[138] Hawthorne F C Calvo C The crystal chemistry of the M+VO3 (M+= Li Na K NH4 Tl Rb
and Cs) pyroxenes J Solid State Chem 1977 22 (2) 157ndash170
[139] Gopal R Calvo C Crystal Structure of Magnesium Divanadate Mg2V2O7 Acta Crystallogr Sect B 1974 B30 (10) 2491ndash2493
[140] Enjalbert R Galy J A Refinement of the Structure of V2O5 Acta Crystallogr Sect C 1986 C42 1467ndash1469
[141] Launay H Loridant S Pigamo A Dubois J L Millet J M M Vanadium species in new catalysts for the selective oxidation of methane to formaldehyde Specificity and molecular structure dynamics with water J Catal 2007 246 (2) 390ndash398
[142] Baltes M Cassiers K Van Der Voort P Weckhuysen B M Schoonheydt R A Vansant E F MCM-48-Supported Vanadium Oxide Catalysts Prepared by the Molecular Designed Dispersion of VO(acac)2 A Detailed Study of the Highly Reactive MCM-48 Surface and the Structure and Activity of the Deposited VOx J Catal 2001 197 (1) 160ndash171
[143] Jehng J-M Deo G Weckhuysen B M Wachs I E Effect of water vapor on the molecular structures of supported vanadium oxide catalysts at elevated temperatures J Mol Catal A 1996 110 (1) 41ndash54
198
[144] Pentildea M L Dejoz A Forneacutes V Rey F Vaacutezquez M I Loacutepez Nieto J M V-containing MCM-41 and MCM-48 catalysts for the selective oxidation of propane in gas phase Appl Catal A 2001 209 (1-2) 155ndash164
[145] Luan Z Bae J Y Kevan L Vanadosilicate Mesoporous SBA-15 Molecular Sieves Incorporated with N-Alkylphenothiazines Chem Mater 2000 12 (10) 3202ndash3207
[146] Dzwigaj S El Malki E M Peltre M-J Massiani P Davidson A Che M Effect of calcinationrehydration treatments on the environment of V in β zeolite Top Catal 2000 11-12 (1-4) 379ndash390
[147] Zhuravlev L T The surface chemistry of amorphous silica Zhuravlev model Colloids Surf A 2000 173 (1-3) 1ndash38
[148] Abello L Husson E Repelin Y Lucazeau G Structural Study of Gels of V2O5Vibrational Spectra of Xerogels J Solid State Chem 1985 56 (3) 379ndash389
[149] Knoumltziger H Taglauer E Toward Supported Oxide Catalysts via Solid-Solid Wetting Catalysis 1993 10 1ndash40
[150] Wang C-B Cai Y Wachs I E Reaction-Induced Spreading of Metal Oxides onto Surfaces of Oxide Supports during Alcohol Oxidation Phenomenon Nature and Mechanisms Langmuir 1999 15 (4) 1223ndash1235
[151] Van Der Voort P White M G Mitchell M B Verberckmoes A A Vansant E F The effect of water on the structure of supported vanadium oxide structures An FT-RAMAN in situ DRIFT and in situ UV-VIS diffuse reflectance study Spectrochim Acta Part A 1997 53 (12) 2181ndash2187
[152] Atanasov M Adamsky H Eiffert K Valence Stabilization Mixed Crystal Chemistry and Electronic Transitions in Tetrahedral Oxo and Hydroxo Cr(IV) Mn(V) and Fe(VI) Clusters A Theoretic Investigation J Solid State Chem 1997 128 (1) 1ndash16
[153] Liu T-C Forissier M Coudurier G Veacutedrine J C Properties of Molybdate Species Supported on Silica J Chem Soc Faraday Trans 1 1989 85 (7) 1607ndash1618
[154] Hess C Nanostructured Vanadium Oxide Model Catalysts for Selective Oxidation Reactions ChemPhysChem 2009 10 (2) 319ndash326
[155] Dinse A Frank B Hess C Habel D Schomaumlcker R Oxidative dehydrogenation of propane over low-loaded vanadia catalysts Impact of the support material on kinetics and selectivity J Mol Catal A 2008 289 (1-2) 28ndash37
[156] Liu Y-M Feng W-L Li T-C He H-Y Dai W-L Huang W Cao Y Fan K-N Structure and catalytic properties of vanadium oxide supported on mesocellulous silica foams (MCF) for the oxidative dehydrogenation of propane to propylene J Catal 2006 239 (1) 125ndash136
[157] Liu Y-M Cao Y Yi N Feng W-L Dai W-L Yan S-R He H-Y Fan K-N Vanadium oxide supported on mesoporous SBA-15 as highly selective catalysts in the oxidative dehydrogenation of propane J Catal 2004 224 (2) 417ndash428
[158] Zhao C Operando spectroscopic and kinetic study of the selective oxidation of propylene to acrolein over well-defined supported vanadium oxide catalysts Dissertation Lehigh University Pennsylvania 2007
httpproquestumicompqdlinkdid=1417810771ampFmt=7ampclientId=79356ampRQT=309ampVName=PQD (accessed 08072011)
199
[159] Li M Shen J Microcalorimetric Adsorption Characterizations of Supported Vanadia Catalysts for Selective Oxidation of Propylene to Acetone J Catal 2002 205 (2) 248ndash258
[160] Yoshida S Magatani Y Noda S Funabiki T Partial Oxidation of Propene over UV-irradiated Vanadium Oxide supported on Silica J Chem Soc Chem Commun 1981 12 601ndash602
[161] Jackson S D Hargreaves J S J Eds Metal oxide catalysis Wiley-VCH Weinheim Germany 2009 Vol 2 pp 178-179
[162] Grzybowska-Świerkosz B Thirty years in selective oxidation on oxides what have we learned Top Catal 2000 1112 (1-4) 23ndash42
[163] Li S Mirabal A Demuth J Woumlste L Siebert T A Complete ReactantndashProduct Analysis of the Oxygen Transfer Reaction in [V4O11middotC3H6]
ndash A Cluster Complex for Modeling Surface Activation and Reactivity J Am Chem Soc 2008 130 (50) 16832ndash16833
[164] Li H-B Tian S X Yang J Propene Oxidation with the Anionic Cluster V4O11ndash Selective
Epoxidation Chem Eur J 2009 15 (41) 10747-10751
[165] Kondratenko E V Bruumlckner A On the nature and reactivity of active oxygen species formed from O2 and N2O on VOxMCM-41 used for oxidative dehydrogenation of propane J Catal 2010 274 (1) 111ndash116
[166] Kondratenko E V Ovsitser O Radnik J Schneider M Kraehnert R Dingerdissen U Influence of reaction conditions on catalyst composition and selectivenon-selective reaction pathways of the ODP reaction over V2O3 VO2 and V2O5 with O2 and N2O Appl Catal A 2007 319 98ndash110
[167] Grasselli R K Genesis of site isolation and phase cooperation in selective oxidation catalysis Top Catal 2001 15 (2-4) 93ndash101
[168] Liu Y-M Cao Y Zhu K-K Yan S-R Dai W-L He H-Y Fan K-N Highly efficient VOxSBA-15 mesoporous catalysts for oxidative dehydrogenation of propane Chem Commun 2002 (23) 2832ndash2833
[169] Goodrow A Bell A T A Theoretical Investigation of the Selective Oxidation of Methanol to Formaldehyde on Isolated Vanadate Species Supported on Silica J Phys Chem C 2007 111 (40) 14753ndash14761
[170] Grubert G Rathousky J Schulz-Ekloff G Wark M Zukal A Reducibility of vanadium oxide species in MCM-41 Micropor Mesopor Mat 1998 22 (1-3) 225ndash236
[171] Doumlbler J Pritzsche M Sauer J Vibrations of Silica Supported Vanadia Variation with Particle Size and Local Surface Structure J Phys Chem C 2009 113 (28) 12454ndash12464
[172] Gopal R Calvo C The structure of Ca3(VO4)2 Z Kristallogr 1973 137 (1) 67ndash85
[173] Trunov V K Velikodnyi Yu A Murasheva E V Zhuravlev V D The crystal structure of calcium pyrovanadate Dokl Akad Nauk 1983 270 886
[174] Marumo F Isobe M Iwai S Kondo Y α form of sodium metavanadate Acta Crystallogr Sect B 1974 B30 (6) 1628ndash1630
[175] Petrasova M Madar J Hanic F Crystal structure of potassium metavanadate Chem Zvesti 1958 12 410ndash418
200
[176] Bouloux J C Perez G Galy J Structure cristalline des metavanadates CaV2O6 et CdV2O6 alpha La transformation polymorphique CdV2O6 alpha - CdV2O6 betha Bull Soc Fran Miner et cristallogr 1972 V95 130ndash133
[177] Eglmeier C Range K-J Kleynhans A Heyns A M H36N6O34V10 S Afr J Chem 1993 46 7ndash13
[178] Waltersson K Forslund B Wilhelmi K-A Andersson S Galy J Structural Crystallography and Crystal Chemistry Acta Crystallogr Sec B 1974 30 (11) 2644-2652
[179] Natl Bur Stand (US) Monograph 1983 25 (20) 108
201
Table Captions
Table 1-1 Commercially important selective oxidations with catalysts containing vanadium [18] 3
Table 2-1 Preparation details of the synthesized magnesium vanadate samples 13
Table 2-2 UV-Vis edge energies (Eg) and low energy LMCT band positions extracted from UV-Vis-DR spectra in Figure 2-4 17
Table 2-3 Catalytic performance of the magnesium vanadate phases compared to V2O5 during the selective oxidation of propene
(40 mlmin 5 O2 and 5 propene in He) 22
Table 3-1 Standard enthalpy of formation ∆Hf0 for selected compounds in the gas phase 50
Table 3-2 Parameters used to estimate the mass and heat transfer 50
Table 4-1 BET surface area (SBET) and vanadium content of the calcined VxOySBA-15 samples () sample prepared via the ion
exchange method in Figure 4-1 () sample prepared by wet impregnation with a NH4VO3 solution () sample prepared by
incipient wetness using a (NH4)6V10O28 solution The values in brackets refer to the V content determined by RFA) 52
Table 5-1 Absorption band position and UV-Vis edge energy determined from UV-Vis-DR spectra of vanadium oxide reference
compounds (Figure 5-1 left) together with the assumed covalent V-O-V bond (CVB) number (reference of the theoretical structure
which matched the experimental XRD powder pattern Table 10-3 appendix) Values in brackets refer to measurements in in situ
cell 66
Table 5-2 Absorption band position and UV-Vis edge energy determined from the UV-Vis-DR spectra of hydrated and dehydrated
VxOySBA-15 samples (Figure 5-1 right) together with the calculated covalent V-O-V bond (CVB) number Values in brackets
refer to diluted samples (F(Rinfin)max~ 1-2) 67
Table 5-3 Type and number (N) of atoms at distance R from the absorbing V atom in a model system assuming an ordered
arrangement of V2O7 units (Figure 5-9 right) compared to experimental distances and XAFS disorder parameters (σ2) The
parameters were obtained from the refinement of this model structure to the experimental V K edge XAFS FT(χ(k)k 3) of
dehydrated VxOySBA-15 (77 wt) t-Mg2V2O7 and NH4VO3 (k range from 27-105 Aring-1 R range 084-362 Aring Nind = 16 E0 = 0
eV in all cases fit residual 39 (dehydrated VxOySBA-15) (Nfree = 8) 107 (t-Mg2V2O7) (Nfree = 7) 147 (NH4VO3) (Nfree = 5))
(subscript c indicates parameters that were correlated in the refinement subscript f indicates parameters that were fixed in the
refinement) Confidence limits and significance to the fit parameters are given in Table 5-4 75
Table 5-4 V K edge XAFS parameters (Z for distances R and disorder parameter σ2) obtained from three different procedures of
fitting a model structure (ie ldquoordered V2O7 dimersrdquo on SiO2 support) to the experimental XAFS FT(χ(k)k 3) of dehydrated
VxOySBA-15 (77 wt ) (details of fit given in Table 5-3) together with confidence limits (plusmn z referring to 95 of fit residual) and
significance parameters F (details given in text) 76
Table 5-5 Type and number (N) of atoms at distance R from the absorbing V atom in a model system assuming an ordered
arrangement of [V2O7] units (Figure 5-9 right) compared to experimental distances and XAFS disorder parameters (σ2) The
parameters were obtained from the refinement of this model structure to the experimental V K edge XAFS FT(χ(k)k 3) of
dehydrated VxOySBA-15 with different V loadings (ie 77 wt 41 wt 14 wt ) (Figure 5-9 left) (k range from 27-105 Aring-1
R range 084-362 Aring Nind = 16 Nfree = 8 E0 = 0 eV in all cases fit residual 38 (77 wt) 70 (41 wt) 56 (14 wt)) (subscript c
indicates parameters that were correlated in the refinement subscript f indicates parameters that were fixed in the refinement)
Confidence limits and significance of fit parameters correspond to those given in Table 5-4 for the 77 wt sample 80
202
Table 5-6 V K edge XAFS parameters (Z for distances R and disorder parameter σ2) obtained from two different procedures of
fitting a model structure (ie V2O5) to the experimental XAFS FT(χ(k)k 3) of the V2O5 reference together with confidence limits (plusmn
z referring to 95 of fit residual) and significance parameter F (details given in text) 84
Table 5-7 V K edge XAFS parameters (Z for distances R and disorder parameter σ2) obtained from four different procedures of
fitting a model structure (ie V2O5) to the experimental XAFS FT(χ(k)k 3) of hydrated VxOySBA-15 (77 wt) (details of fit given
in Table 5-8) together with the confidence limits (plusmn z referring to 95 of fit residual) and the significance parameter F (details
given in text) 86
Table 5-8 Type and number (N) of atoms at distance R from the V atoms in a V2O5 system compared to the experimental distances
and the XAFS disorder parameter (σ2) The parameters were obtained from the refinement of a reduced V2O5 model structure (ICSD
60767 [140]) to the experimental V K edge XAFS FT(χ(k)k 3) of hydrated VxOySBA-15 (77 wt) and bulk V2O5 (k range from
27 - 110 Aring-1 R range 09 - 38 Aring E0 (VxOySBA-15) = 00 eV E0 (V2O5) = 00 fit residual 86 (VxOySBA-15) and 125 (V2O5)
Nind = 17 Nfree = 8) (subscript c indicates parameters that were correlated in the refinement) Confidence limits and significance of
the fit parameters are given in Table 5-787
Table 6-1 Apparent activation energies of water desorption Ed determined from the plot of ln(Tmax2β) as a function of 1Tmax
(Figure 6-6) freshly calcined sample two year old sample 96
Table 6-2 UV-Vis edge energy Eg of hydrated VxOySBA-15 samples determined after various rehydration procedures Dehydration
treatments as described in Figure 6-9 101
Table 6-3 Experimental distances (R) and XAFS disorder parameters (σ2) for different type and number (N) of atoms at distance R
from the absorbing V atom in a model system assuming an ordered arrangement of [V2O7] units (Chapter 5) Parameters were
obtained from the refinement of this model structure to the experimental V K edge XAFS FT(χ(k)k 3) of dehydrated 77 wt
VxOySBA-15 at various stages of aging (k range from 27-105 Aring-1 R range 083-362 Aring Nind = 16 E0 = 0 eV in all cases (subscript
c indicates parameters that were correlated in the refinement subscript f indicates parameters that were fixed in the refinement)
Dehydration was conducted in 20 O2 in He 104
Table 6-4 Experimental distances and XAFS disorder parameters (σ2) for different type and number (N) of atoms at distance R
from the absorbing V atom in a model system assuming an ordered arrangement of [V2O7] units (Chapter 5) Parameters were
obtained from the refinement of this model structure to the experimental V K edge XAFS FT(χ(k)k 3) of dehydrated 77 wt
VxOySBA-15 (k range from 27-105 Aring-1 R range 083-362 Aring Nind = 16 E0 = 0 eV in all cases (subscript c indicates parameters
that were correlated in the refinement subscript f indicates parameters that were fixed in the refinement) Dehydration in the 1st and
2nd cycle was conducted in 20 O2 in He and in 10 O2 (and 16 H2O) in He in the 3rd dehydration cycle 106
Table 6-5 UV-Vis edge energies Eg determined from the UV-Vis-DR spectra recorded at 298 K after different dehydration cycles
(details given in Figure 6-14) The samples were diluted with SBA-15 (13 (SBA-15 77 wt VxOySBA-15) and 11 (SBA-15
14 wt or 41 wt VxOySBA-15)) 107
Table 7-1 Propene conversion and selectivity for propene oxidation over vanadium and molybdenum oxides supported on SiO2 115
Table 7-2 Experimental distances (R) XAFS disorder parameters (σ2) and coordination numbers (N) for different types of atom in
a model system assuming an ordered arrangement of [V2O7] units (Chapter 5) Parameters were obtained from the refinement of this
model structure to the experimental V K edge XAFS FT(χ(k)k 3) of dehydrated 14 wt and 77 wt VxOySBA-15 (k range from
27-105 Aring-1 R range 083-362 Aring Nind = 16 E0 = 0 eV in all cases (subscript c indicates parameters that were correlated in the
refinement subscript f indicates parameters that were fixed in the refinement) Dehydration was conducted in 20 O2 in He at 623
K for 1 h and propene oxidation at 723 K for 1 h (5 O2 and 5 propene in He) 118
Table 7-3 Experimental distances (R) XAFS disorder parameters (σ2) and coordination numbers (N) for different types of atom in
a model system assuming an ordered arrangement of [V2O7] units (Chapter 5) Parameters were obtained from the refinement of this
model structure to the experimental V K edge XAFS FT(χ(k)k 3) of dehydrated 14 wt and 77 wt VxOySBA-15 (k range from
203
27-105 Aring-1 R range 083-362 Aring Nind = 16 E0 = 0 eV in all cases (subscript c indicates parameters that were correlated in the
refinement subscript f indicates parameters that were fixed in the refinement) Dehydration was conducted in 20 O2 in He at 623
K and propene oxidation at 723 K (5 O2 and 5 propene in He 08 H2O) 123
Table 7-4 Experimental distances and XAFS disorder parameters (σ2) for different types of atom at distance R from the absorbing
V atom in a model system assuming an ordered arrangement of [V2O7] units (Chapter 5) Parameters were obtained from the
refinement of this model structure to the experimental V K edge XAFS FT(χ(k)k 3) of dehydrated 77 wt VxOySBA-15 (k range
from 27-105 Aring-1 R range 083-362 Aring Nind = 16 E0 = 0 eV in all cases (subscript c indicates parameters that were correlated in the
refinement subscript f indicates parameters that were fixed in the refinement) Recalcination was conducted in 20 O2 in He at 768
K for 8 h and propene oxidation at 723 K (5 O2 and 5 propene in He) 131
Table 7-5 Product selectivities and propene conversion of 77 wt VxOySBA-15 at 673 K after 8-12 h (Figure 7-13 (right)) (A)
dehydrated sample 653 K 1 h 20 O2 in He (B) hydrated sample (C) hydrated sample and 08 H2O in the reaction gas (D)
ldquorecalcinedrdquo sample 843 K 12 h 20 O2 in He (rate [micromolpropene(gmiddots)] g=mv or mcat GHSV gas hour space velocity referred to
a 08 ml reactor volume and a 20-75 mlmin volume flow) 134
Table 7-6 Product selectivities and propene conversion of dehydrated 14-77 wt VxOySBA-15 (653 K 1 h 20 O2) at 673 K
after 8-12 h (1 rate [micromolpropene(gmiddots)] 2 GHSV gas hour space velocity referred to 08 ml reactor volume and 20-75 mlmin volume
flow3 ball milled V2O5 + SBA-15 4 at 643 K 6 at 684 K) 137
Table 10-1 Lattice plane distance (d100) and cell parameter (a0) determined from the 100 diffraction in the small angle XRD powder
patterns BET surface area (SBET) C parameter (CBET) and BJH pore size (dporeBJH) pore volume (Vpore) and the SBA-15 channel wall
thickness (dwall determined from a0-dporeBJH) of the initial bare and the functionalized VxOySBA-15 samples () sample prepared
via the ion exchange method in Figure 4-1 () sample prepared by wet impregnation with a NH4VO3 solution () sample
prepared by incipient wetness using a (NH4)6V10O28 solution 179
Table 10-2 CHN element content of bare SBA-15 SBA-15-APTES and calcined VxOySBA-15 samples () samples prepared via
the ion exchange method in Figure 4-1 () sample prepared by wet impregnation with a NH4VO3 solution () sample prepared
by incipient wetness using a (NH4)6V10O28 solution 179
Table 10-3 Origin and theoretical XRD phases that match the experimental XRD powder pattern of the vanadium oxide references
used 180
Table 10-4 Results of the analysis of the pre-edge feature determined from the normalized V K edge XANES spectra ( Chapter 8
Figure 8-2) Energy position at maximum intensity relative to V K edge (5645 keV) height of pre-edge peak at maximum intensity
(PH) centroid energy and energy position of the individual components relative to V K edge (5645 keV) determined and total area
of pre-edge peak from peak refinement according to Chaurand et al [94] (Section 524 Figure 5-4 right) product of pre-edge
peak height and total area average V-O bond length from the literature (Table 10-3) and beamline used at Hasylab 185
204
Figure Captions
Figure 1-1 Main structural configurations of the vanadium oxide phase on silica supports discussed in literature 4
Figure 1-2 The number of papers that are found in the ISI web of Knowledge database using the keywords vanadium silica and
catalyst [] 5
Figure 2-1 Experimental Cu Kα XRD powder patterns of the synthesized magnesium vanadate phases (dotted black) together with
the XRD structure refinement of the corresponding phase (solid red) and the differential plot (solid grey) 15
Figure 2-2 Structure motifs of the magnesium vanadate phases and the color of the respective powder 16
Figure 2-3 V K edge XANES (right) and Fourier transformed χ(k)k 3 (left) of the as prepared magnesium vanadates 16
Figure 2-4 Left UV-Vis-DR absorption spectra of the as-prepared magnesium vanadate phases and differrent sample batches (Table
2-1) Right picture of the different colored samples batches of the monoclinic Mg2V2O7 phase (AB) and MgV2O6 (CD) phase
(lines are the same as on the left side) 17
Figure 2-5 Evolution of Cu Kα XRD patterns during thermal treatment of Mg3V10O2828H2O (323-773 K 20 O2 in He) together
with the ion current (H2O) measured during in situ XRD 18
Figure 2-6 Selected in situ powder pattern during treatment in 5 propene and 5 oxygen in He (temperature range from 300 K to
673 K) of monoclinic Mg2V2O7 (left) and V2O5 (right) the diffraction at ~189 deg2θ originates from the sample holder 19
Figure 2-7 UV-Vis-DR absorption spectra (left) and V K edge XANES spectra (right) of monoclinic Mg2V2O7 and V2O5 before and
after treatment in 5 propene and 5 oxygen in He (temperature range from 300 K to 653 K) glitch at 850 nm originates from
detector change 20
Figure 2-8 Left Evolution of relative absorption at 700 nm (compared to maximum intensity in the respective spectrum) of the UV-
Vis-DR absorption spectra of magnesium vanadate phases and V2O5 Right evolution ion currents (CO2 water and acrolein)
measured during in situ UV-Vis-DR studies (thermal treatment in 5 propene and 5 oxygen in He) 21
Figure 2-9 Propene conversion and selectivity of the magnesium vanadate phases and V2O5 in 5 propene and 5 oxygen in He at
673-683 K 22
Figure 2-10 Selected in situ powder pattern during treatment in 5 propene in He (temperature range from 300 K to 673 K) of
monoclinic Mg2V2O7 (left) and V2O5 (right) the diffraction at ~189 deg2θ originates from the sample holder 23
Figure 2-11 UV-Vis-DR absorption spectra (left) and V K edge XANES spectra (right) of monoclinic Mg2V2O7 and V2O5 before
and after treatment in 5 propene in He (temperature range from 300 K to 653 K) glitch at 850 nm originates from detector
change 24
Figure 2-12 Left Evolution of the relative absorption at 700 nm (compared to the maximum intensity in the respective spectrum) in
the UV-Vis-DR absorption spectra of the magnesium vanadate phases and V2O5 Right Evolution of the ion currents (CO2 water
and acrolein) measured during in situ UV-Vis-DR studies (thermal treatment in 5 propene in He) 24
Figure 2-13 The XRD powder pattern of Mg3V2O8 before (grey) and after (black) treatment in 5 propene in He (300-773 K)
together with the structure motif of the possible Mg2-xV1+xO4 spinel type phases 25
205
Figure 2-14 (100) plane of the phases formed during the reduction and oxidation of V2O5 in the presence of propene at elevated
temperatures (left V2O5 Pmmn [140] middle V4O9 Cmcm [64] right VO2(B) C12m1 [71]) triangles indicate location of distorted
octahedrons with V-O distances between 23 Aring and 28 Aring 26
Figure 2-15 Scheme of the triclinic Mg2V2O7 structure (lines indicate connections between tetrahedral V2O74- units when the first
V-O coordination sphere is extended from 23 Aring to 3Aring) 28
Figure 3-1 Left excitation process of the photoelectron middle scattering process of the photoelectron right typical V K edge
spectrum 35
Figure 3-2 XAS data reduction left extraction of the χ(k) middle k3 weighted χ(k) right Fourier transformed k3 weighted χ(k) 36
Figure 3-3 Left in situ transmission XAS cell right typical configuration of transmission beamlines 37
Figure 3-4 Left Praying MantisTM set up right illustration of specular and diffuse reflection 40
Figure 3-5 Left schematic drawing of the Praying MantisTM in situ UV-Vis-DR cell right picture of the in situ UV-Vis-DR cell
The position of the optional thermocouple that was used to determine the sample temperature is marked as dashed line 41
Figure 3-6 Example for the determination of the UV-Vis edge energy Eg of V2O5 42
Figure 3-7 Drawing of the used double GC setting 45
Figure 3-8 Simplified flow chart of the measurement set up used in the laboratory 46
Figure 3-9 Picture of the furnace and reactor used for quantitative measurements 47
Figure 4-1 Simplified reaction scheme of the APTES grafting and ion exchange ((NH4)6V10O28middotxH2O precursor) preparation process
of VxOySBA-15 samples 51
Figure 4-2 Raman spectra (left middle) and UV-Vis-DRS spectra (right) of the uncalcined VxOySBA-15 samples and selected
vanadate references (A) SBA-15 (B) 30 wt VxOySBA-15 incipient wetness (C) 8 wt V (NH4)6V10O28middotxH2O mixed with
SBA-15 (Crsquo) (NH4)6V10O28middotH2O (D) 57 wt VxOySBA-15 wet impregnation (E) 8 wt V NH4VO3 mixed with SBA-15 (Ersquo)
NH4VO3 (F) APTES functionalized SBA-15 (G) 50 wt VxOySBA-15 ion exchange (H) 41 wt VxOySBA-15 ion exchange
(I) 14 wt VxOySBA-15 ion exchange 53
Figure 4-3 V K edge XANES spectra (left) χ(k)k 3 (middle) and FT(χ(k)k 3) (right) of the uncalcined VxOySBA-15 samples and
selected vanadate references (A) (NH4)6V10O28middotxH2O (B) NH4VO3 (C) 57 wt VxOySBA-15 wet impregnation (D) 30 wt
VxOySBA-15 incipient wetness (E) 50 wt VxOySBA-15 ion exchange (F) 41 wt VxOySBA-15 ion exchange (G) 14 wt
VxOySBA-15 ion exchange 54
Figure 4-4 XRD powder patterns (Cu Kα) of the calcined VxOySBA-15 samples bare SBA-15 and a physical mixture of ball
milled V2O5 and SBA-15 (8 wt V) 55
Figure 4-5 Raman (left middle) and UV-Vis-DRS spectra (right) of the calcined VxOySBA-15 samples and selected vanadium
oxide references (A) 30 wt VxOySBA-15 incipient wetness (B) 57 wt VxOySBA-15 wet impregnation (C) 77 wt
VxOySBA-15 ion exchange (D) 41 wt VxOySBA-15 ion exchange (E) 14 wt VxOySBA-15 ion exchange (samples diluted
11 or 12 with SBA-15 for UV-Vis-DRS measurments) 56
Figure 4-6 V K edge XANES spectra (left) χ(k)k 3 (middle) and FT(χ(k)k 3) (right) of the calcined and dehydrated VxOySBA-15
samples (20 O2 in He 623 K) (A) 57 wt VxOySBA-15 wet impregnation (B) 30 wt VxOySBA-15 incipient wetness (C) 77
wt VxOySBA-15 ion exchange (D) 41 wt VxOySBA-15 ion exchange (E) 14 wt VxOySBA-15 ion exchange 57
206
Figure 4-7 N2 adsorption (open symbols) and desorption (filled symbols) isotherms Left initial SBA-15 (grey same symbols as
VxOySBA-15 samples) and calcined VxOySBA-15 samples prepared via the graftingion exchange method (colored squares 14
wt V triangles 41 wt V circles 77 wt V) The inset depicts the small angle XRD powder patterns of the calcined 77 wt
VxOySBA-15 sample and the initial SBA-15 Right initial SBA-15 (black squares) SBA-15-APTES after calcination (blue
circles) and calcined 77 wt VxOySBA-15 (red triangles) The inset depicts the respective pore size distributions obtained from
the adsorption isotherm (BJH model) 58
Figure 4-8 top REM images of the calcined 77 wt VxOySBA-15 sample middle TEM images of the initial SBA-15 bottom
TEM images of the calcined 77 wt VxOySBA-15 sample 59
Figure 5-1 Left UV-Vis-DR spectra of vanadium reference compounds (Mg3V2O8 ( ) m-Mg2V2O7 ( ) t-Mg2V2O7 ( )
MgV2O6 ( ) Mg3V10O28middotxH2O ( ) V2O5 ( )) and 77 wt VxOySBA-15 in the hydrated ( ) and dehydrated ( )
state Right UV-Vis-DR spectra of VxOySBA-15 with different loading in the hydrated and dehydrated state (14 wt ( ) 41
wt ( ) 77 wt ( )) 65
Figure 5-2 Left Covalent V-O-V bond number (CVB) versus UV-Vis edge energy (Eg) of vanadium oxide reference compounds
(Na3VO4 ( ) K3VO4 ( ) Ca3V2O8 () Mg3V2O8 () m-Mg2V2O7 () Ca2V2O7 ( ) t-Mg2V2O7 () NaVO3 (diams) NH4VO3
( ) KVO3 ( ) CaV2O6 () MgV2O6 () Mg3V10O28middotxH2O ( ) (NH4)6V10O28middotxH2O ( ) V2O5 ( ) grey symbols refer to
measurements in in situ cell) right UV-Vis edge energy versus average V-O bond length in the first coordination sphere of
vanadium references exhibiting a tetrahedral coordination 68
Figure 5-3 V K edge XANES spectra of hydrated and dehydrated VxOySBA-15 samples with different vanadium loadings (14
wt 41 wt and 77 wt) V K edge compared to the spectra of various V5+ reference compounds (dotted line refers to 77 wt
dehydrated VxOySBA-15) 70
Figure 5-4 Left Correlation of the product of the V K edge pre-edge peak intensity and area versus average V-O bond length R in
the first coordination sphere (Ca3V2O8 () Mg3V2O8 () m-Mg2V2O7 () Ca2V2O7 ( ) t-Mg2V2O7 () NaVO3 (diams) NH4VO3
( ) KVO3 ( ) CaV2O6 () MgV2O6 () Mg3V10O28middotxH2O ( ) (NH4)6V10O28middotxH2O ( ) V2O5 ( )) right subtraction of the
background from V K edge pre-edge peak of 77 wt VxOySBA-15 (top) and an example of the peak fit to the background
corrected signal (bottom) The pre-edge peak heights for VxOySBA-15 are indicated as lines (Refer to text and Table 10-4 for
details) 72
Figure 5-5 left V K edge χ(k) of dehydrated VxOySBA-15 with different vanadium loadings (14 wt 41 wt and 77wt ) and
NH4VO3 middle right V K edge FT(χ(k)k 3) of dehydrated VxOySBA-15 (77 wt dotted) compared to those of various
references 73
Figure 5-6 Experimental (solid) V K edge FT(χ(k)k 3) of the NH4VO3 (right) and the Mg2V2O7 (left) reference together with a
theoretical XAFS function (fitting results are given in Table 5-3) Also shown are the Fourier transformed χ(k)k 3 of the individual
scattering paths together with the corresponding coordination number in brackets 74
Figure 5-7 Experimental (solid) V K edge FT(χ(k)k 3) of dehydrated VxOySBA-15 (77 wt) together with theoretical XAFS
functions (left ldquoisolated VO4rdquo model middle addition of a V-Si path to the ldquoisolated VO4rdquo model right addition of support oxygen
to ldquoisolated VO4rdquo model) Insets show the [VO4] tetrahedron (left) and a schematic representation of the V-Si path employed
(middle) Also shown are the Fourier transformed χ(k)k 3 of the individual scattering paths together with the corresponding
coordination number in brackets 77
Figure 5-8 Experimental (solid) V K edge FT(χ(k)k 3) of dehydrated VxOySBA-15 (77 wt) together with a theoretical XAFS
function (ie ldquoordered arrangement of V2O7rdquo model) Fit results are given in Table 5-3 The inset shows a schematic representation
of the arrangement of V2O7 units in Mg2V2O7 Also shown are the Fourier transformed χ(k)k 3 of the individual scattering paths
together with corresponding coordination number in brackets 78
207
Figure 5-9 left Experimental (solid) V K edge FT(χ(k)k 3) of dehydrated VxOySBA-15 (14 wt 41 wt and 77 wt) together
with a theoretical XAFS function The fit results are given in Table 5-5 right Schematic structural representation of dehydrated
VxOySBA-15 The most prominent distances employed in the XAFS refinement procedure are indicated 79
Figure 5-10 V K edge FT(χ(k)k 3) of hydrated VxOySBA-15 (77 wt) compared to those of various references (eg V2O5 and
MgV2O6) and the FT(χ(k)k 3) and χ(k)k 3 of hydrated VxOySBA-15 samples with different vanadium loadings (14 wt 41 wt
and 77 wt) 83
Figure 5-11 Experimental (solid) V K edge FT(χ(k)k3) of V2O5 (left) together with theoretical XAFS functions (V2O5 model red
lines refer to the V-O scattering path black lines refer to the V-V scattering paths) and a representation of the structural V2O5 model
(right) Prominent distances employed in the XAFS refinement procedure are indicated 84
Figure 5-12 Experimental (solid) V K edge FT(χ(k)k 3) of hydrated VxOySBA-15 (77 wt) together with theoretical XAFS
functions The procedures refer to the subsequent reduction of the theoretical V2O5 model Details are provided in the text and the fit
results are given in Table 5-7 Also shown are the Fourier transformed χ(k)k 3 of the individual scattering paths together with the
corresponding coordination number in brackets 85
Figure 5-13 left Experimental (solid) V K edge FT(χ(k)k 3) of hydrated VxOySBA-15 (77 wt) (top) and of V2O5 (bottom)
together with the theoretical XAFS functions Right A representation of the reduced V2O5 model structure used for the refinement
The most prominent distances employed in the XAFS refinement procedure are indicated 87
Figure 6-1 Left UV-Vis-DR spectra of 77 wt VxOySBA-15 dehydrated at different temperatures All spectra were recorded at
298 K Right V K edge FT(χ(k)k 3) of 77 wt VxOySBA-15 after different dehydration procedures The dehydration was
performed in 20 O2 in He 90
Figure 6-2 Left in situ UV-Vis-DR spectra of the 14 wt VxOySBA-15 sample and the water ion current me 18 (554 K 4 Kmin
20 O2 in He) during dehydration The inset shows the 2D spectra depicted in the 3D color map Right V K edge in situ XANES
spectra during dehydration of the 77 wt VxOySBA-15 sample (623 K 5 Kmin 20 O2 in He E4 Beamline) 91
Figure 6-3 Evolution of the V K pre-edge peak height () and energy position () together with the resulting concentration of the
hydrated () and dehydrated () phase of 77 VxOySBA-15 derived from the XANES spectra depicted in Figure 6-2 right (623 K
5 Kmin 20 O2 in He E4 beamline) 92
Figure 6-4 V K edge pre-edge peak height as a function of average V-O bond length (left) and relative energy position and centroid
energy (right) of vanadium oxide reference compounds measured at A1 beamline The values determined for dehydrated and
hydrated 77 wt VxOySBA-15 are indicated as lines (symbols as in Figure 5-4 Chapter 524 details Table 10-4) 93
Figure 6-5 Left Thermograms of bare and VxOySBA-15 samples Right normalized relative mass loss detected for the observed
steps derived from the thermograms (left side) 95
Figure 6-6 Left TG and DTG signals recorded for 77 wt VxOySBA-15 (10 Kmin 623 K) location of Tmax is indicated right
plot of ln(Tmax2β) as a function of 1Tmax for bare SBA-15 and 77 wt VxOySBA-15 97
Figure 6-7 Left A picture of different types of silanol groups of silica materials right 29Si CP-MAS-NMR of bare and 77 wt
VxOySBA-15 treated at different temperatures (A) bare SBA-15 (B) hydrated 77 wt VxOySBA-15 (C) dehydrated 77 wt
VxOySBA-15 (653 K 1 h) (D) calcined 77 wt VxOySBA-15 (843 K 12 h) The red curve is the envelope of the Gaussian
deconvolution 98
Figure 6-8 Left V K edge XANES spectra (inset) pre-edge peak height and water ion current during rehydration of dehydrated 77
wt VxOySBA-15 (298 K 16 Vol H2O) Right UV-Vis edge energy and water ion current during rehydration of dehydrated 77
wt VxOySBA-15 (298 K 13 Vol H2O) 99
208
Figure 6-9 FT(χ(k)k 3) of 77 wt VxOySBA-15 (left) and UV-Vis-DR spectra of 14 wt VxOySBA-15 (right) after various
hydration and dehydration cycles as prepared (A) first dehydration at 623 K XAS 554 K UV-Vis-DRS 30 min (B) first
rehydration 13-16 Vol 60-90 min (C) second dehydration at 723 K XAS 634 K UV-Vis-DRS 1 h (D) second rehydration
13-16 Vol 60 min (E) The line types on right side refer to the same procedure as on the left side 100
Figure 6-10 Left FT(χ(k)k 3) of differently hydrated 77 wt VxOySBA-15 and V2O5 Right result of the least-squares fit
( ) using the V K edge XANES spectra of dehydrated and rehydrated 77 wt VxOySBA-15 ( ) recorded after the
first de-rehydration cycle (Figure 6-9 left) to the experimental XANES spectrum ( )of two week old as-prepared 77 wt
VxOySBA-15 101
Figure 6-11 UV-Vis-DR spectra of 77 wt VxOySBA-15 (left) and 14 wt VxOySBA-15 (right) as-prepared (14 wt)
hydrated after calcination (77 wt) ( ) dehydrated as-prepared sample ( ) hydrated one year old sample
( ) dehydrated one year old sample ( ) dehydration parameters 20 O2 in He 554 K 30 min all spectra recorded at
298 K 102
Figure 6-12 left Raman spectra of (A) a 3 wt V V2O5SBA-15 mixture (1064 nm 100 mW) and (B) SBA-15 and in situ spectra
(514 nm 6 mW) during dehydration of (C) one year old 77 wt VxOySBA-15 at 723 K (20 O2 in N2) and (D) a 77 wt
VxOySBA-15 sample that is dehydrated at 623 K (20 O2 in N2) after recalcination at 823 K for 12 h in a muffle furnace (spectra
C-D 514 nm 6 mW) right least square fit ( ) of three Gaussian functions ( ) to the UV-Vis-DR spectrum ( ) of
dehydrated one year old 77 wt VxOySBA-15 (554 K 30 min 20 O2 in He) 103
Figure 6-13 Left V K edge FT(χ(k)k 3) of 77 wt VxOySBA-15 after different dehydration procedures 623 K 10 O216 Vol
H2OHe (A) 623 K 10 O2He (B) 298 K 10 O2He (C) and 1st dehydration cycle (623 K 20 O2He) 298 K (D) Right in situ
UV-Vis-DR spectra of the 14 wt VxOySBA-15 sample during dehydration together with water ion current me 18 (554 K
4 Kmin13 Vol H2O 20 O2 in He) The inset shows the 2D spectra recorded at 86 min and 113 min 105
Figure 6-14 UV-Vis-DR spectra recorded at 298 K after different dehydration cycles 1st dehydration at 554 K for 30 min ( )
2nd dehydration at 634 K for 1 h ( ) 3nd dehydration at 554 K for 30 min (13 Vol H2O) and 15 min (ldquodryrdquo) ( ) The
samples were diluted with SBA-15 (13 (SBA-15 77 wt VxOySBA-15) and 11 (SBA-15 14 or 41 wt VxOySBA-15)) 107
Figure 6-15 Schematic drawing of assumed dynamic structural transformations of supported vanadium oxide phase on SBA-15
during hydration and dehydration 108
Figure 7-1 V K edge XANES (left) FT(χ(k)k 3) (middle) and UV-Vis-DR spectra (right) recorded at 298 K after dehydration
(solid line 623 K 1 h 20 O2 in He) and after propene oxidation (dashed line 673 K (UV-Vis) and 723 K (XAS) 1 h 5 O2 and
5 propene in He) (A) 77 wt (B) 41 wt and (C) 14 wt VxOySBA-15 117
Figure 7-2 Top and middle in situ UV-Vis-DR spectra of dehydrated VxOySBA-15 (623 K 1 h 20 O2 in He) and the evolution of
the ion current me 56 (acrolein) during the temperature programmed reaction (A) 77 wt VxOySBA-15 (675 K 5 O2 and 5
propene in He 1st run) (B) 14 wt VxOySBA-15 (634 K 5 O2 and 5 propene in He 1st run) (C) 77 wt VxOySBA-15 (675
K 1 h 5 O2 and 5 propene in He 2nd run) (D) 77 wt VxOySBA-15 (675 K 5 O2 in He) Bottom Evolution of the ion
current me 56 for the 1st and 2nd measurement run All measurements were performed with 4 Kmin 119
Figure 7-3 In situ UV-Vis-DR spectra of 77 wt VxOySBA-15 (right) and 14 wt VxOySBA-15 (left) recorded at 636 K and at
298 K after reaction in 5 propene and 5 O2 in He dehydrated sample (554 K 20 O2) (solid line black) hydrated sample
(dashed and dotted line red) and hydrated sample with water (08 Vol) in the reaction mixture (dotted line blue) 121
Figure 7-4 In situ V K edge FT(χ(k)k 3) of 77 wt VxOySBA-15 (right) and 14 wt VxOySBA-15 (left) recorded at 723 K and
at 298 K after reaction in 5 propene and 5 O2 in He dehydrated sample (554 K 20 O2) (solid line black) hydrated sample
(dashed and dotted line red) and hydrated sample with water (08 Vol) in the reaction mixture (dotted line blue) 121
209
Figure 7-5 Evolution of the recorded MS ion currents (left top) and the V K edge pre-edge peak height () and energy position
() (left bottom relative to 5465 keV) and the phase fraction for the hydrated () and dehydrated () vanadium oxide structure
obtained from a PCA (left bottom) of the V K edge XANES spectra (right top) that were recorded during the temperature
programmed reaction (5 O2 and 5 propene in He 298-723 K 5 Kmin) of 77 wt hydrated VxOySBA-15 FT(χ(k)k 3)
(QEXAFS scans) of a comparable measurement are shown on the right side (bottom) 122
Figure 7-6 Left in situ UV-Vis-DR spectra of dehydrated 77 wt VxOySBA-15 (623 K 1 h) after subsequent treatment at 675 K
in (1) oxygen (2) propene and oxygen and (3) oxygen Right 29Si CP-MAS-NMR of SBA-15 and 77 wt VxOySBA-15 treated
at different temperatures (A) SBA-15 (B) dehydrated 77 wt VxOySBA-15 (653 K 1 h) (C) dehydrated 77 wt VxOySBA-15
(653 K 1 h) after propene oxidation (5 propene and 5 O2 in He 673 K 1 h) The red curve is the sum of the Gaussian functions
used for the profile refinement 124
Figure 7-7 Left In situ UV-Vis-NIR-DR spectra of dehydrated (dashed line) 14 wt and 77 wt VxOySBA-15 (623 K) after 1st
(solid line) and 2nd (dashed and dotted line) catalytic measurement (675 K 5 O2 and 5 propene in He) Right in situ Raman
spectra of dehydrated 77 wt VxOySBA-15 (723 K 20 O2 in N2) in 5 O2 and 5 propene in N2 514 nm 6 mW 126
Figure 7-8 Left in situ Raman spectra of hydrated 77 wt VxOySBA-15 during propene oxidation 5 O2 and 5 propene in N2
514 nm 6 mW Right Comparison of the in situ Raman spectra of hydrated and dehydrated 77 wt VxOySBA-15 during propene
oxidation at 473 K and 523 K 127
Figure 7-9 Propene conversion and oxygenate selectivity (left) Propene conversion rate referred to the sample mass and product
selectivities determined in the different measurement cells during the temperature programmed propene oxidation using dehydrated
77 wt VxOySBA-15 (right) 128
Figure 7-10 Propene conversion during propene oxidation (5 O2 and 5 propene in He) on 14 wt VxOySBA-15 (right) and 77
wt VxOySBA-15 (left) (A) dehydrated sample 653 K 1 h 20 O2 in He (B) dehydrated sample 763 K 1 h 20 O2 in He (C)
ldquorecalcinedrdquo sample 843 K 12 h 20 O2 in He (D) ldquomultisteprdquo sample (i) 843 K 12 h 20 O2 in He (ii) 298 K 24 h 20 O2
and 2 H2O in He 653 K 1 h 20 O2 in He (E) hydrated sample (F) hydrated sample and 08 H2O in the reaction gas (G)
physical mixture of V2O5 and SBA-15 (8 wt V) (H) physical mixture of ldquoball milledrdquo V 2O5 and SBA-15 (8 wt V)
Approximately 08-09 mg V was used for all measurements 130
Figure 7-11 V K edge XANES spectra (left) and FT(χ(k)k 3) (right) of 77 wt VxOySBA-15 recorded at 298 K after
ldquorecalcinationrdquo at 768 K for 8 h in 20 O2 in helium (A) and after a temperature programmed propene oxidation at 723 K 5 O2
and 5 propene in He (B) 131
Figure 7-12 Propene conversion and oxygenate selectivity during propene oxidation (5 O2 and 5 propene in He) of 77 wt
VxOySBA-15 for different treatments During subsequent temperature programmed reactions (left) and under isothermal conditions
at 673 K (right) 133
Figure 7-13 Oxygenate selectivity versus propene conversion determined after 8-12 h at 673 K (left) for 77 wt VxOySBA-15 and
comparision of the product selectivities for similar propene conversion (right) (A) dehydrated sample 653 K 1 h 20 O2 in He
(B) hydrated sample (C) hydrated sample and 08 H2O in the reaction gas (D) ldquorecalcinedrdquo sample 843 K 12 h 20 O2 in He
(Details Table 7-5) 133
Figure 7-14 UV-Vis-DR spectra of dehydrated (623 K 20 O2 in He) 14 wt (right) and 77 wt (left) VxOySBA-15 recorded at
298 K after dehydration (solid line) and propene oxidation (dotted line) at 675 K for 4 h 135
Figure 7-15 Left top Propene conversion and oxygenate selectivity during propene oxidation (5 O2 and 5 propene in He) of
dehydrated 14-77 wt VxOySBA-15 under isothermal conditions at 673 K (right) Left bottom and right Propene conversion and
product selectivity of dehydrated 14-77 wt VxOySBA-15 during the temperature programmed reaction in propene and oxygen
(5 O2 and 5 propene in He) (symbols on right side circle=CO square=CO2 closed triangle up=acrolein open triangle
up=acetaldehyde open triangle down=propionaldehyde half filled triangle= acetone closed star=acetic acid) 136
210
Figure 7-16 Oxygenate selectivity versus propene conversion determined after 8-12 h at 673 K (left top) for dehydrated 14-77
wt VxOySBA-15 Comparison of propene and oxygen conversions (right top) and product selectivities corresponding to the
conversions shown (bottom) (Table 7-6) 137
Figure 7-17 Main oxygenate products of the partial oxidation of propane and propene [35] 138
Figure 7-18 Propene and oxygen conversion reacted ratio of oxygenpropene and product selectivities for (hydrated) 14 wt and
77 wt VxOySBA-15 as a function of the initial oxygen to propene ratio in the reaction gas at 633 K (Vol O2 Vol propene ~
25 55 755 105 575 525 and 51) 141
Figure 7-19 UV-Vis-DR spectra of dehydrated 14 wt (right) and 77 wt VxOySBA-15 (left) recorded at 298 K after
temperature programmed reaction in various oxygenpropene mixtures in He at 636 K after dehydration 554 K 20 O2 (dotted
grey) 55 (dotted red) 15 (dashed black) 51 (dashed and dotted blue) and 05 (solid black) 143
Figure 8-1 V K edge XANES spectra (left) χ(k)k 3 (middle) and FT(χ(k)k 3) (right) recorded at 298 K (A) dehydrated 77 wt
VxOySBA-15 (623 K 20 O2) (B) dehydrated 77 wt VxOySBA-15 (623 K 20 O2) after reaction in 5 propene in He at 723
K (C) dehydrated 77 wt VxOySBA-15 (623 K 20 O2) after reaction in 5 propene in He at 673 K (D) V3O7 (E) VO2(B) (F)
V2O3 153
Figure 8-2 Normalized pre-edge peak areas (referred to the area of V2O5 that was normalized to 080) versus centroid energy of
vanadium reference compounds and 77 wt VxOySBA-15 after various treatments Additionally the values reported by Chaurand
et al [94] are shown Dashed rings refer to the coordination of absorbing vanadium centers (Oh = octrahedral Py = pyramidal Td =
tetrahedral) Detailed parameters are listed in Table 10-4 in the appendix 154
Figure 8-3 V K edge XANES spectra (left) and pre-edge peak height and water ion current me 18 (right) during the temperature
programmed reaction of dehydrated (623 K 20 O2 in He) 77 wt VxOySBA-15 in 5 propene in He (298-723 K 5 Kmin) 155
Figure 8-4 In situ UV-Vis-DR spectra (left) and absorption at 700 nm (relative to the maximum intensity determined in the
absorption spectra at 298 K after dehydration) together with the water ion current me 18 (right) during the temperature programmed
reaction of dehydrated (623 K 20 O2 in He) 77 wt VxOySBA-15 in 5 propene in He (298-673 K 4 Kmin) The arrows on
the left side indicate the evolution of the spectra during temperature treatment 156
Figure 8-5 Left UV-Vis-DR spectra of dehydrated (623 K 20 O2 in He) 77 wt VxOySBA-15 recorded at 673 K after several
reducing (5 propene) and oxidizing (5 propene and 5 oxygen) reaction cycles Right Evolution of the absorption at 700 nm
(relative to the maximum intensity determined in the absorption spectra at 298 K after dehydration) during the reducing (5
propene) and oxidizing (5 propene and 5 oxygen) reaction cycles at 673 K The gas phase was changed after 39 min in each
reaction cycle 157
Figure 8-6 Propene and oxygen conversion and concentration of major reaction products after several oxidizing (5 propene and
5 oxygen) reaction cycles (Figure 8-5) Refer to text for experimental details 158
Figure 8-7 UV-Vis-DR spectra of dehydrated 77 wt VxOySBA-15 (623 K 20 O2 in He) recorded during the first (left) and the
second (right) re-oxidation (5 propene 5 O2) cycle at 673 K Top Evolution of the absorption at 700 nm (relative to the
maximum intensity determined in the absorption spectra at 298 K after dehydration) Middle Evolution of MS ion currents
Bottom in situ UV-Vis-DR spectra The gas phase was changed after 39 min in each reaction cycle 160
Figure 8-8 UV-Vis-DR spectra recorded at 298 K after reduction of dehydrated VxOySBA-15 in 5 propene in He at 623 K (left)
and UV-Vis-DR spectra recorded at 673 K after reduction in 5 propene at 623 K of VxOySBA-15 that was treated for 35 min in
5 propene and 5 O2 in He at 673 K prior to reduction (Right) 162
Figure 8-9 V K edge XANES (left) LC XANES fit (middle) and FT(χ(k)k 3) of 77 wt VxOySBA-15 after dehydration (623 K
20 O2 in He) reduction (723 K 5 propene in He) and after the switching experiment at 673 K under reducing catalytic
211
reducing catalytic and finally reducing conditions (673 K reducing conditions 5 propene in He catalytic conditions 5 propene
and 5 O2 in He) 162
Figure 8-10 In situ UV-Vis DR spectra of dehydrated 77 wt VxOySBA-15 (20 O2 in He 623 K) at 673 K after changing the
gas phase composition starting with 20 O2 in He (left) or 5 propene and 5 O2 in He (right) as the initial gas mixture 164
Figure 8-11 Evolution of the relative absorption at 700 nm (relative to the maximum intensity determined in the absorption spectra
at 298 K after dehydration) derived from the in situ UV-Vis DR spectra of dehydrated 77 wt VxOySBA-15 (20 O2 in He 623
K) at 673 K after changing the gas phase composition starting with 20 O2 in He (left) or 5 propene and 5 O2 in He (right) as
initial gas mixture 165
Figure 8-12 UV-Vis-DR spectra of dehydrated 77 wt VxOySBA-15 (623 K 20 O2 in He) recorded during the first reducing
(5 propene) cycle at 673 K starting with 20 O2 in He (left side) or 5 propene and 5 O2 in He (right side) as the initial gas
mixture Top Evolution of absorption at the 700 nm (relative to the maximum intensity determined in the absorption spectra at 298
K after dehydration) Middle Evolution of the MS ion currents Bottom in situ UV-Vis-DR spectra The gas phase was changed
after 39 min in each reaction cycle 166
Figure 8-13 Simplified scheme of the structural changes during dehydrating catalytic or reducing condition 167
Figure 10-1 Baseline measured in the UV-Vis-DR spectrometer using the standard integration sphere 181
Figure 10-2 Baselines measured in the UV-Vis-DR spectrometer using the Praying MantisTM cell 181
Figure 10-3 In situ Raman spectra during dehydration in a ldquodryrdquo (left) and a water saturated atmosphere (right) 20 O2 and 80
N2 (and ~ 45 H2O) 25 mlmin ndash 50 mlmin 182
Figure 10-4 Usable spectral range of EXAFS and QEXAFS scans used for measurements of 77 wt VxOySBA-15 under catalytic
conditions (5 propene and 5 O2 in He 40 mlmin) 182
Figure 10-5 Product selectivities determined in the different measurement cells during the temperature programmed propene
oxidation using a dehydrated 77 wt VxOySBA-15 183
Figure 10-6 Product concentration during propene oxidation (5 O2 and 5 propene in He) of 77 wt VxOySBA-15 for
subsequent temperature programmed reactions 183
Figure 10-7 Determination of the reaction order for propene (left) and oxygen (right) for the acrolein formation on 77 wt
VxOySBA-15 184
Figure 10-8 Determination of the reaction order for propene (left) and oxygen (right) for the acrolein formation on 14 wt
VxOySBA-15 184
Figure 10-9 Experimental Cu Kα XRD powder pattern of V4O9 determined in 5 propene in He (56 mlmin) (dotted black) at 598
K together with the XRD structure refinement of the corresponding phases (solid red) and the differential plot (solid grey) 188