spectroscopic, textural and thermal characterization
TRANSCRIPT
REV.CHIM.(Bucharest)♦ 69♦ No. 12 ♦ 2018 http://www.revistadechimie.ro 3477
Spectroscopic, Textural and Thermal Characterization Methods ofBiostimulants Based on Sodium Humate
RUSANDICA STOICA1*, FLORIN OANCEA1, IULIAN MINCA1, SANDA MARIA DONCEA1, RODICA GANEA1, LUIZA CAPRA1,2,RALUCA SENIN1,2, MARIANA MATEESCU1, IRINA CIOBANU1, GEORGETA IVAN1,2, MIHAELA MANOLACHE1
1National Research & Development Institute for Chemistry and Petrochemistry ICECHIM, 202 Splaiul Independentei Str., 060021,Bucharest, Romania2University Politehnica of Bucharest, 313 Splaiul Independentei Str., 060042, Bucharest, Romania
Plant biostimulants, an emerging class of agricultural inputs, are complex products. The reproducibility oftheir specific action on plant metabolism and plant physiology, which lead to an enhanced nutrient useefficiency, stress tolerance and edible yield quality, is still a challenge. Development of quality insurancesystems for plant biostimulants need complex investigation based on adapted analytical, physico-chemicaland chemical methods. The objective of this work was to characterize commercial humate biostimulantsthrough different analytical techniques (Fourier transform infrared spectroscopy - FTIR, thermogravimetricanalysis- TGA) and to evaluate their textural and chemical (pH, C, N, humic acids, inorganic components)parameters. The first derivative curve from TG analysis showed decomposition of different compounds,classified according to the results obtained by FTIR. The humic substances determined by TGA method wascomparable with the results obtained by gravimetric reference method. The inductively coupled plasma-optical emission spectrometry (ICP-OES) technique was applied to determine the inorganic elementseither from the production process of humate or from raw materials, as well as for the control of humate interms of requirements for safety and quality. Their complementary properties obtaining through differentanalytical techniques provide essential information on the chemical characteristics of the humate plantbiostimulant formulations.
Keywords: sodium humate; humic acids, FTIR, TGA, BET, ICP-OES, biostimulant
Plant biostimulants represent a new class of productsused as inputs in the plant cultivation technologies, whichact on plant biochemistry and physiology [1-3], increasingthe water and nutrient uptake and use efficiency,enhancing the tolerance of cultivated plants to biotic andabiotic stress, improving crop quality, mainly due to a higheraccumulation of the bioactive compounds into edible yield[4]. Most biostimulants currently used are complexmixtures of (bio)chemicals defined as a formulated productof biological origin that improves plant productivity as aconsequence of the novel, or emergent properties of thecomplex of constituents, and not as a sole consequenceof the presence of known essential plant nutrients, plantgrowth regulators, or plant protective compounds [5].
The main categories of biostimulants for plants, otherthan plant beneficial microorganisms [6] are: humic andfulvic acids [7]; protein hydrolysates / peptides and aminoacids [8] and other amino derivatives compounds such asglycine-betaine [9]; algae [10, 11] and plants extracts [12];beneficial elements [13], especially soluble silicon / silicicacid [14] and inorganic compounds as phosphite [15];chitosan [16] and other biopolymers [17].
Humic substances (HS) are natural constituents of thesoil organic matter, resulting from the decomposition ofplant, animal and microbial residues, but also from themetabolic activity of soil microbes using these substrates.HS are collections of heterogeneous compounds, originallycategorized according to their molecular weights andsolubility into humins, humic acids and fulvic acids. Humicsubstances have been recognized for long as essentialcontributors to soil fertility, acting on physical, physico-chemical, chemical and biological properties of the soil.Most biostimulant effects of HS refer to the amelioration ofroot nutrition, via different mechanisms [18].
* email: [email protected]; [email protected]
Clearly, the reproducibility of the biological action ofthese bioproducts obtained from natural/renewable rawmaterials depends on their characterization andstandardization. In order to achieve such characterization,which is indispensable for defining the regulatoryframework for these bioproducts it is necessary to developfast and accessible methods of analysis, used both in theobtaining process of these bioproducts and to demonstrateconformity with essential requirements of products forsafety and quality.
The need for standardization is reflected by theestablishment of a new CEN Technical Committee PlantBiostimulants and Agricultural Micro-organisms. Thistechnical committee in the field of plant biostimulants andagricultural micro-organisms comes in support of ECproposal for the elaboration a new regulation which willextend the scope of the previous fertilizers regulation toseveral new product families, including biostimulants [2].
Different studies [19-21] have shown methodologicalapproaches for the characterization of biostimulants, e.g.those based on brown macro-algae.
Despite the fact that comprehensive information onplant growth and yield studies of biostimulants exist, thechemical composition of these complex mixtures is muchmore difficult to obtain. The objective of this study was tocharacterize two commercial humate and its major humicfraction (humic acids) using the chemical, textural, thermicand spectroscopic methods. The humate biostimulantscharacterization was done considering the corroborationof the information obtained through different analyticaltechniques FTIR, BET, TGA, TOC/TNb, ICP-OES. The resultsof our work can be useful for small and medium enterprises(SME), which are manufacturers of humates, forcharacterization of their bioproducts.
http://www.revistadechimie.ro REV.CHIM.(Bucharest)♦ 69 ♦ No. 12 ♦ 20183478
Experimental partMaterials and methodsChemicals and biostimulant formulations
The humic acids standard was purchased from Sigma-Aldrich, sodium hydroxide from Scharlau and hydrochloricacid from Merck. The Certipur ICP-element standardsolution IV (Merck) and the Phosphor ICP standard(Merck), both with concentrations of 1000 mg.L-1 wereused for prepared standard solutions. The digestions ofsodium humate samples were done using HNO3 65% andHF 48% purchased from Scharlau. Doubly distilled waterwas used to prepare the standard solutions. All reagentsused in the experiments were of analytical grade. Thecommercial biostimulant formulation evaluated in thisstudy was liquid (LH) and solid humate (SH).
Reference methodHumic substances determined by TGA method which
is described below is based on the gravimetric method asa reference method. The alkaline extraction, separation,and determination of humic acids were performed asdescribed in this reference [22].
Fourier transform infrared spectroscopyThe Fourier Transform Infrared Spectroscopy method,
FTIR, was used both by transmission technique, in KBrpellet for humic and fulvic acids and humate samples.Spectrum recordings were done on an Perkin Elmer FTIRSpectrum GX apparatus, from 4000 cm-1 to 400 cm-1
accumulating 32 spectra, at a resolution of 4 cm-1.
Textural characterizationNitrogen physisorption was used to characterize and
compare the textural properties of a humic acid standardand a commercial humate. The textural characteristics ofthe two samples were evaluated from nitrogen adsorption/desorption isotherms recorded at the liquid nitrogentemperature using a Quantachrome Nova 2200eequipment. The standard Brunauer-Emmett-Teller (BET)equation was applied to calculate the specific surface areaof the analyzed samples. The total pore volume wasestimated from the amount of gas adsorbed at a relativepressure (p/po) value close to unity. The pore sizedistribution was determined from the adsorption branchof the isotherm using Barrett-Joyner-Halenda (BJH) model.The t-plot method was used to estimate the externalsurface of the humic materials [23]. Prior to adsorptionmeasurements, amounts of 90-100 mg of each samplewere vacuum - degassed at room temperature for 24 h.The experimental data processing was performed usingNova Win version 11.03 software.
Thermogravimetric analysisAnalysis of the humate biostimulants and the humic
acids standard was carried out using a TGA/SDTA 851thermogravimetric analyser (Mettler Toledo). The samplesand reference material were heated from roomtemperature to 900°C in alumina crucibles at a heatingrate of 20°C min-1 in air at a flow rate of 50 mL min-1. Thethermal weight loss characteristics were observed asthermograms and quantitative evaluations were carriedout on the curves using STARe evaluation software asderivative thermograms.Chemical analysis
The pH of the formulation was measured using 10 %aqueous solution of the original product.
The elemental compositions of the samples weredetermined by inductively coupled plasma-optical emission
spectroscopy (Optima 2100 DV ICP-OES System)instrument. Humate samples were digested usingMultiwave 3000 (Anton Paar) model microwave digestionsystem. The RF power used was 1300 watts, plasma flowwas 15 L/min, Auxiliary gas flow was kept at 0.2 L/min,Nebulizer Flow was kept at 0.8 L/min, and Pump FlowRate was kept at 1.5 L/min. Plasma view was in the axial/radial mode. Approximately 0.2 g of sample was weighedand transferred into a pressure-resistant PTFE(polytetrafluoroethylene) vessel, and the mixture of acids(65 % HNO3 + 48 % HF, 10:2 mL) was added. The procedurementioned above was following by the complexationstage with boric acid (H3BO3). Boric acid is added followingdigestion to complex F in solution. The reaction mixturewas subjected to an evaporation procedure in order toremove the acids after the final digestion. The ICP-OESmeasurements were performed for the diluted solutions.The standard solutions for calibration curves were madefrom reference standards Certipur ICP-element standardsolution IV of 1000 mg/L. Determination of Cd, Co, Cr, Cu,Ni, Pb was achieved by constructing a multipoint standardcurve covering the range of analyte concentrations insamples (2-100 µg.L-1). Analytical determination ofselenium it was done on a calibration curve in the range50- 300 µg.L-1. Phosphorus analysis was performed on acalibrated curve containing standards with concentrationsof 0.3-1 mg.L-1.
The determinations of TC (Total Carbon), TIC (TotalInorganic Carbon), TOC (Total Organic Carbon) were madeusing Multi N/C 2100 Analytic Jena AG-Germany.Standardized methods were performed as described in thisreference [24, 25]. After dilution, the samples wereanalyzed by difference method. The TOC is obtained bycalculating the difference between TC and TIC. The carbonand nitrogen content of the samples were calculated usinga previously determined calibration function.
Results and discussionsFourier transform infrared spectroscopy
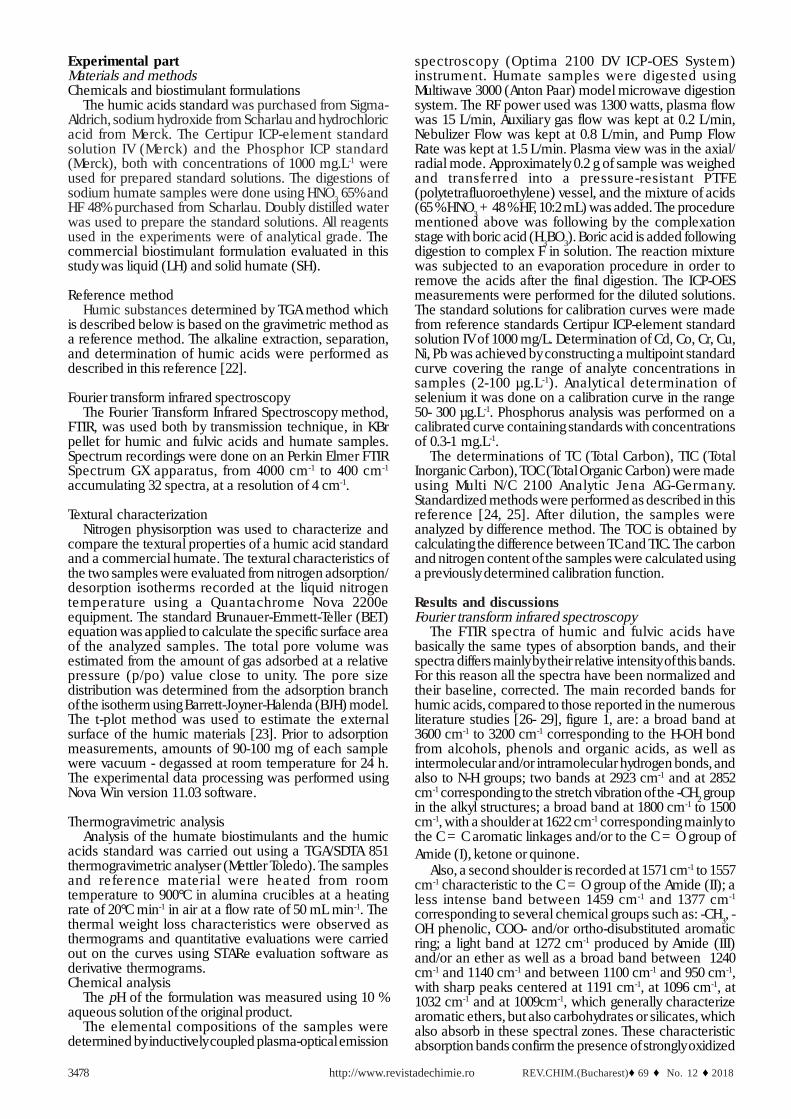
The FTIR spectra of humic and fulvic acids havebasically the same types of absorption bands, and theirspectra differs mainly by their relative intensity of this bands.For this reason all the spectra have been normalized andtheir baseline, corrected. The main recorded bands forhumic acids, compared to those reported in the numerousliterature studies [26- 29], figure 1, are: a broad band at3600 cm-1 to 3200 cm-1 corresponding to the H-OH bondfrom alcohols, phenols and organic acids, as well asintermolecular and/or intramolecular hydrogen bonds, andalso to N-H groups; two bands at 2923 cm-1 and at 2852cm-1 corresponding to the stretch vibration of the -CH2 groupin the alkyl structures; a broad band at 1800 cm-1 to 1500cm-1, with a shoulder at 1622 cm-1 corresponding mainly tothe C = C aromatic linkages and/or to the C = O group ofAmide (I), ketone or quinone.
Also, a second shoulder is recorded at 1571 cm-1 to 1557cm-1 characteristic to the C = O group of the Amide (II); aless intense band between 1459 cm-1 and 1377 cm-1
corresponding to several chemical groups such as: -CH3, -OH phenolic, COO- and/or ortho-disubstituted aromaticring; a light band at 1272 cm-1 produced by Amide (III)and/or an ether as well as a broad band between 1240cm-1 and 1140 cm-1 and between 1100 cm-1 and 950 cm-1,with sharp peaks centered at 1191 cm-1, at 1096 cm-1, at1032 cm-1 and at 1009cm-1, which generally characterizearomatic ethers, but also carbohydrates or silicates, whichalso absorb in these spectral zones. These characteristicabsorption bands confirm the presence of strongly oxidized
REV.CHIM.(Bucharest)♦ 69♦ No. 12 ♦ 2018 http://www.revistadechimie.ro 3479
humic acids, which is the basic structure of fulvic acids,which are in very good concordance with the literature[30-32]. The humates samples were analyzed both bytransmission technique, in KBr pellet, and by attenuatedtotal reflectance, in order to find out which spectraltechnique provides more information for theircharacterization. More informations have been obtainedby transmission technique, and the main recordedabsorption bands, in concordance with literature [33-37].As a general feature, spectrum has a high absorptionintensity for the three types of bands, namely: at 3400cm-1, at 1650 cm-1 and at 1034 cm-1. The first correspondsto the hydrogen bond, H-OH, and/or the intermolecular and/or intramolecular OH bond, of OH ... OH type, and/or theNH group, the second occurs mainly in benzoic compoundsand the third band mainly belongs to the C-O-C ethericbond.
Textural characterizationThe N2 adsorption/desorption isotherms of humic acid
and sodium humate (not shown here) are quite similarrepresenting a combination of II and IV type isothermsaccording to IUPAC classification and indicate themesoporous character of the two samples [38].
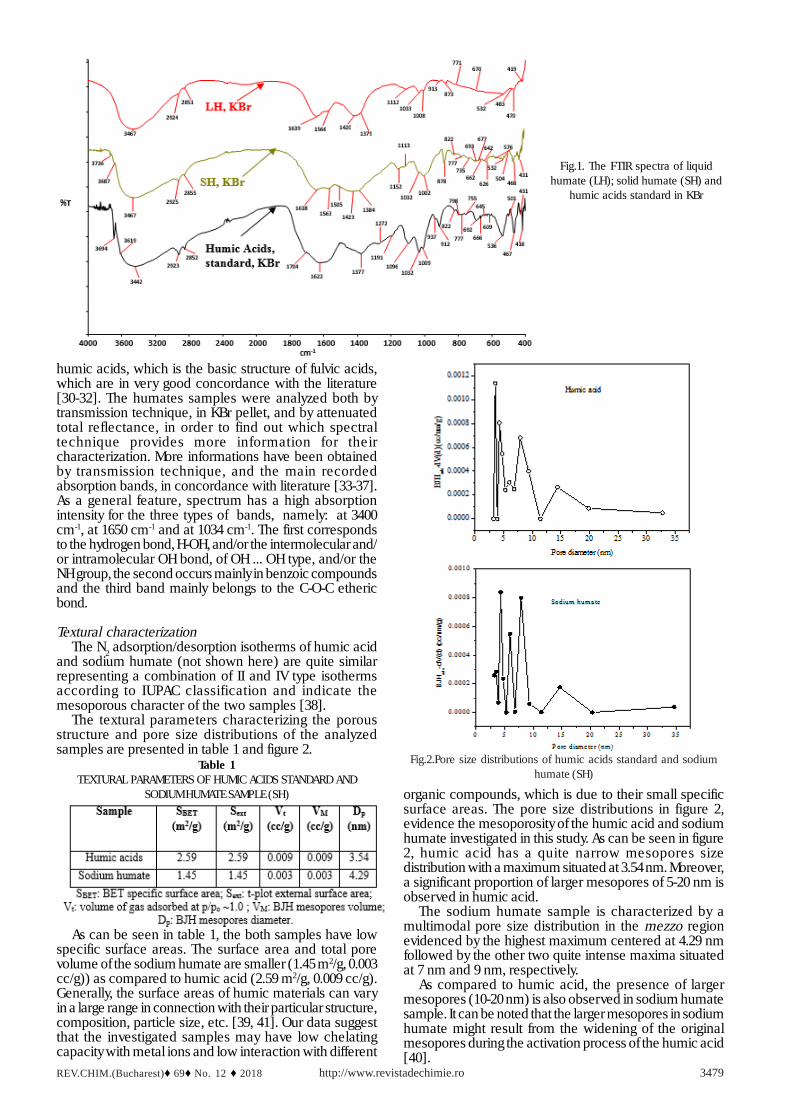
The textural parameters characterizing the porousstructure and pore size distributions of the analyzedsamples are presented in table 1 and figure 2.
Fig.1. The FTIR spectra of liquidhumate (LH); solid humate (SH) and
humic acids standard in KBr
organic compounds, which is due to their small specificsurface areas. The pore size distributions in figure 2,evidence the mesoporosity of the humic acid and sodiumhumate investigated in this study. As can be seen in figure2, humic acid has a quite narrow mesopores sizedistribution with a maximum situated at 3.54 nm. Moreover,a significant proportion of larger mesopores of 5-20 nm isobserved in humic acid.
The sodium humate sample is characterized by amultimodal pore size distribution in the mezzo regionevidenced by the highest maximum centered at 4.29 nmfollowed by the other two quite intense maxima situatedat 7 nm and 9 nm, respectively.
As compared to humic acid, the presence of largermesopores (10-20 nm) is also observed in sodium humatesample. It can be noted that the larger mesopores in sodiumhumate might result from the widening of the originalmesopores during the activation process of the humic acid[40].
Table 1TEXTURAL PARAMETERS OF HUMIC ACIDS STANDARD AND
SODIUM HUMATE SAMPLE (SH)
As can be seen in table 1, the both samples have lowspecific surface areas. The surface area and total porevolume of the sodium humate are smaller (1.45 m2/g, 0.003cc/g)) as compared to humic acid (2.59 m2/g, 0.009 cc/g).Generally, the surface areas of humic materials can varyin a large range in connection with their particular structure,composition, particle size, etc. [39, 41]. Our data suggestthat the investigated samples may have low chelatingcapacity with metal ions and low interaction with different
Fig.2.Pore size distributions of humic acids standard and sodiumhumate (SH)
http://www.revistadechimie.ro REV.CHIM.(Bucharest)♦ 69 ♦ No. 12 ♦ 20183480
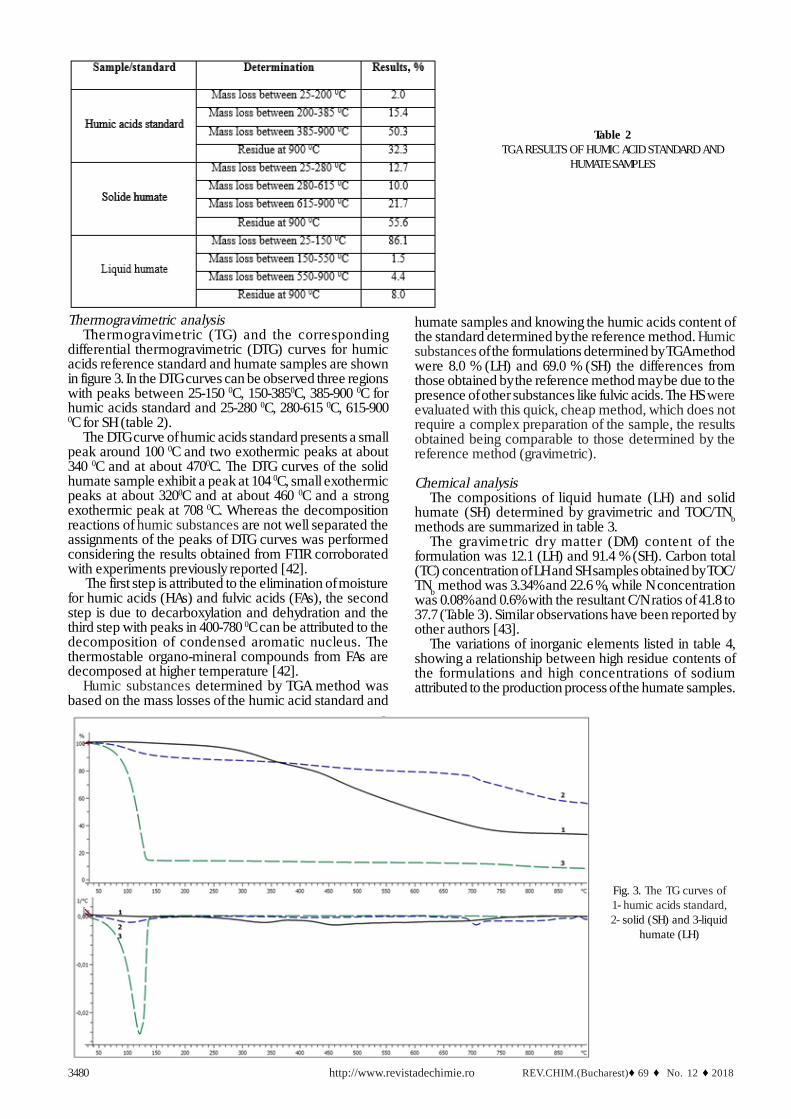
Thermogravimetric analysisThermogravimetric (TG) and the corresponding
differential thermogravimetric (DTG) curves for humicacids reference standard and humate samples are shownin figure 3. In the DTG curves can be observed three regionswith peaks between 25-150 0C, 150-3850C, 385-900 0C forhumic acids standard and 25-280 0C, 280-615 0C, 615-9000C for SH (table 2).
The DTG curve of humic acids standard presents a smallpeak around 100 0C and two exothermic peaks at about340 0C and at about 4700C. The DTG curves of the solidhumate sample exhibit a peak at 104 0C, small exothermicpeaks at about 3200C and at about 460 0C and a strongexothermic peak at 708 0C. Whereas the decompositionreactions of humic substances are not well separated theassignments of the peaks of DTG curves was performedconsidering the results obtained from FTIR corroboratedwith experiments previously reported [42].
The first step is attributed to the elimination of moisturefor humic acids (HAs) and fulvic acids (FAs), the secondstep is due to decarboxylation and dehydration and thethird step with peaks in 400-780 0C can be attributed to thedecomposition of condensed aromatic nucleus. Thethermostable organo-mineral compounds from FAs aredecomposed at higher temperature [42].
Humic substances determined by TGA method wasbased on the mass losses of the humic acid standard and
Table 2TGA RESULTS OF HUMIC ACID STANDARD AND
HUMATE SAMPLES
Fig. 3. The TG curves of1- humic acids standard,2- solid (SH) and 3-liquid
humate (LH)
humate samples and knowing the humic acids content ofthe standard determined by the reference method. Humicsubstances of the formulations determined by TGA methodwere 8.0 % (LH) and 69.0 % (SH) the differences fromthose obtained by the reference method may be due to thepresence of other substances like fulvic acids. The HS wereevaluated with this quick, cheap method, which does notrequire a complex preparation of the sample, the resultsobtained being comparable to those determined by thereference method (gravimetric).
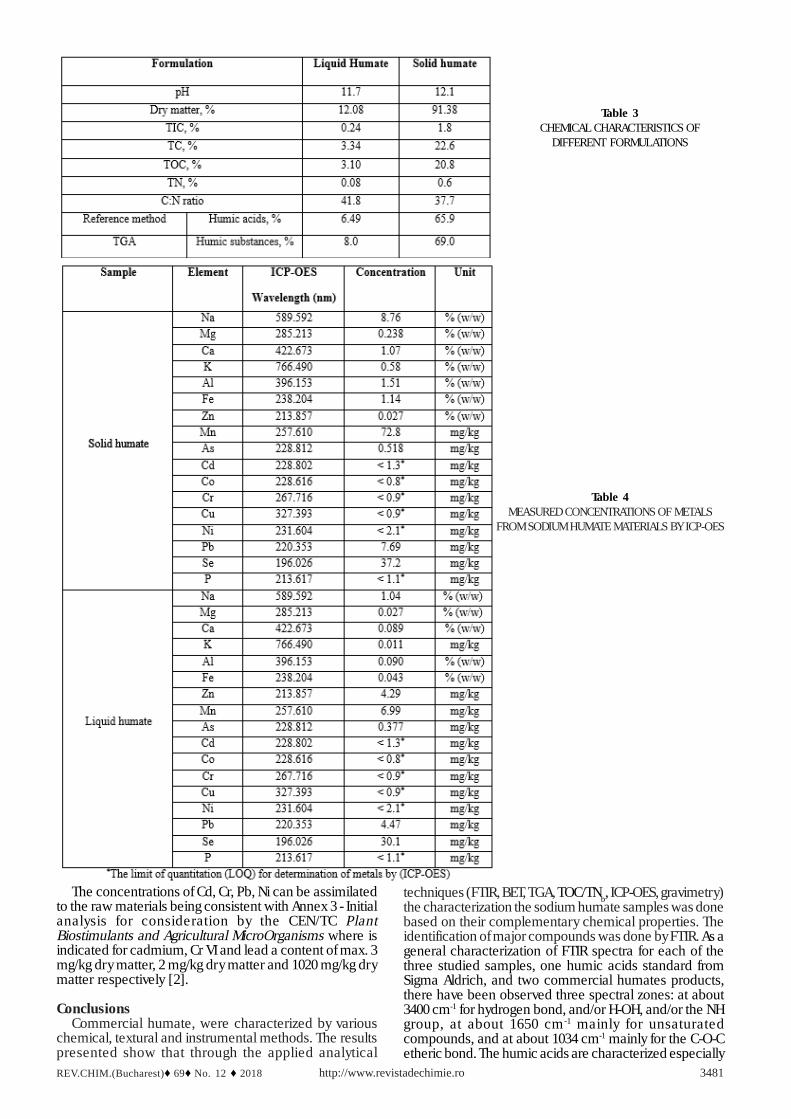
Chemical analysisThe compositions of liquid humate (LH) and solid
humate (SH) determined by gravimetric and TOC/TNbmethods are summarized in table 3.
The gravimetric dry matter (DM) content of theformulation was 12.1 (LH) and 91.4 % (SH). Carbon total(TC) concentration of LH and SH samples obtained by TOC/TNb method was 3.34% and 22.6 %, while N concentrationwas 0.08% and 0.6% with the resultant C/N ratios of 41.8 to37.7 (Table 3). Similar observations have been reported byother authors [43].
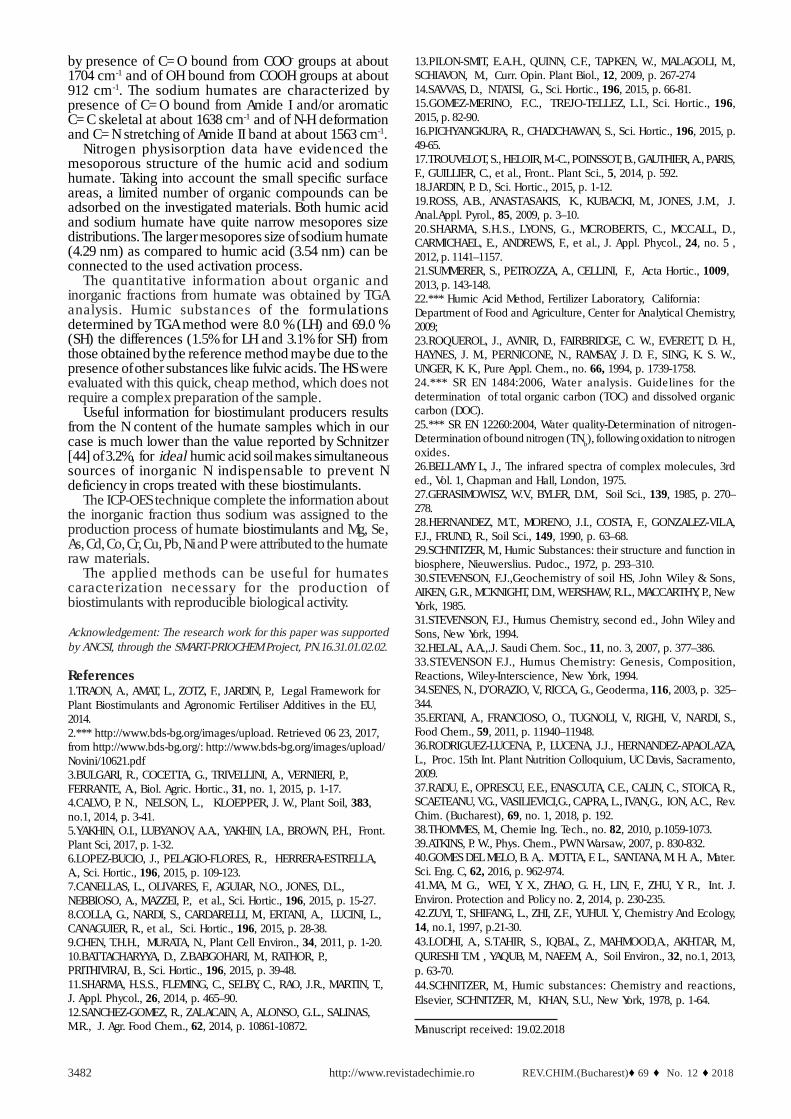
The variations of inorganic elements listed in table 4,showing a relationship between high residue contents ofthe formulations and high concentrations of sodiumattributed to the production process of the humate samples.
REV.CHIM.(Bucharest)♦ 69♦ No. 12 ♦ 2018 http://www.revistadechimie.ro 3481
The concentrations of Cd, Cr, Pb, Ni can be assimilatedto the raw materials being consistent with Annex 3 - Initialanalysis for consideration by the CEN/TC PlantBiostimulants and Agricultural MicroOrganisms where isindicated for cadmium, Cr VI and lead a content of max. 3mg/kg dry matter, 2 mg/kg dry matter and 1020 mg/kg drymatter respectively [2].
ConclusionsCommercial humate, were characterized by various
chemical, textural and instrumental methods. The resultspresented show that through the applied analytical
techniques (FTIR, BET, TGA, TOC/TNb, ICP-OES, gravimetry)the characterization the sodium humate samples was donebased on their complementary chemical properties. Theidentification of major compounds was done by FTIR. As ageneral characterization of FTIR spectra for each of thethree studied samples, one humic acids standard fromSigma Aldrich, and two commercial humates products,there have been observed three spectral zones: at about3400 cm-1 for hydrogen bond, and/or H-OH, and/or the NHgroup, at about 1650 cm-1 mainly for unsaturatedcompounds, and at about 1034 cm-1 mainly for the C-O-Cetheric bond. The humic acids are characterized especially
Table 3CHEMICAL CHARACTERISTICS OF
DIFFERENT FORMULATIONS
Table 4MEASURED CONCENTRATIONS OF METALS
FROM SODIUM HUMATE MATERIALS BY ICP-OES
http://www.revistadechimie.ro REV.CHIM.(Bucharest)♦ 69 ♦ No. 12 ♦ 20183482
by presence of C=O bound from COO- groups at about1704 cm-1 and of OH bound from COOH groups at about912 cm-1. The sodium humates are characterized bypresence of C=O bound from Amide I and/or aromaticC=C skeletal at about 1638 cm-1 and of N-H deformationand C=N stretching of Amide II band at about 1563 cm-1.
Nitrogen physisorption data have evidenced themesoporous structure of the humic acid and sodiumhumate. Taking into account the small specific surfaceareas, a limited number of organic compounds can beadsorbed on the investigated materials. Both humic acidand sodium humate have quite narrow mesopores sizedistributions. The larger mesopores size of sodium humate(4.29 nm) as compared to humic acid (3.54 nm) can beconnected to the used activation process.
The quantitative information about organic andinorganic fractions from humate was obtained by TGAanalysis. Humic substances of the formulationsdetermined by TGA method were 8.0 % (LH) and 69.0 %(SH) the differences (1.5% for LH and 3.1% for SH) fromthose obtained by the reference method may be due to thepresence of other substances like fulvic acids. The HS wereevaluated with this quick, cheap method, which does notrequire a complex preparation of the sample.
Useful information for biostimulant producers resultsfrom the N content of the humate samples which in ourcase is much lower than the value reported by Schnitzer[44] of 3.2%, for ideal humic acid soil makes simultaneoussources of inorganic N indispensable to prevent Ndeficiency in crops treated with these biostimulants.
The ICP-OES technique complete the information aboutthe inorganic fraction thus sodium was assigned to theproduction process of humate biostimulants and Mg, Se,As, Cd, Co, Cr, Cu, Pb, Ni and P were attributed to the humateraw materials.
The applied methods can be useful for humatescaracterization necessary for the production ofbiostimulants with reproducible biological activity.
Acknowledgement: The research work for this paper was supportedby ANCSI, through the SMART-PRIOCHEM Project, PN.16.31.01.02.02.
References1.TRAON, A., AMAT, L., ZOTZ, F., JARDIN, P., Legal Framework forPlant Biostimulants and Agronomic Fertiliser Additives in the EU,2014.2.*** http://www.bds-bg.org/images/upload. Retrieved 06 23, 2017,from http://www.bds-bg.org/: http://www.bds-bg.org/images/upload/Novini/10621.pdf3.BULGARI, R., COCETTA, G., TRIVELLINI, A., VERNIERI, P.,FERRANTE, A., Biol. Agric. Hortic., 31, no. 1, 2015, p. 1-17.4.CALVO, P. N., NELSON, L., KLOEPPER, J. W., Plant Soil, 383,no.1, 2014, p. 3-41.5.YAKHIN, O.I., LUBYANOV, A.A., YAKHIN, I.A., BROWN, P.H., Front.Plant Sci, 2017, p. 1-32.6.LOPEZ-BUCIO, J., PELAGIO-FLORES, R., HERRERA-ESTRELLA,A., Sci. Hortic., 196, 2015, p. 109-123.7.CANELLAS, L., OLIVARES, F., AGUIAR, N.O., JONES, D.L.,NEBBIOSO, A., MAZZEI, P., et al., Sci. Hortic., 196, 2015, p. 15-27.8.COLLA, G., NARDI, S., CARDARELLI, M., ERTANI, A., LUCINI, L.,CANAGUIER, R., et al., Sci. Hortic., 196, 2015, p. 28-38.9.CHEN, T.H.H., MURATA, N., Plant Cell Environ., 34, 2011, p. 1-20.10.BATTACHARYYA, D., Z.BABGOHARI, M., RATHOR, P.,PRITHIVIRAJ, B., Sci. Hortic., 196, 2015, p. 39-48.11.SHARMA, H.S.S., FLEMING, C., SELBY, C., RAO, J.R., MARTIN, T.,J. Appl. Phycol., 26, 2014, p. 465–90.12.SANCHEZ-GOMEZ, R., ZALACAIN, A., ALONSO, G.L., SALINAS,M.R., J. Agr. Food Chem., 62, 2014, p. 10861-10872.
13.PILON-SMIT, E.A.H., QUINN, C.F., TAPKEN, W., MALAGOLI, M.,SCHIAVON, M., Curr. Opin. Plant Biol., 12, 2009, p. 267-27414.SAVVAS, D., NTATSI, G., Sci. Hortic., 196, 2015, p. 66-81.15.GOMEZ-MERINO, F.C., TREJO-TELLEZ, L.I., Sci. Hortic., 196,2015, p. 82-90.16.PICHYANGKURA, R., CHADCHAWAN, S., Sci. Hortic., 196, 2015, p.49-65.17.TROUVELOT, S., HELOIR, M.-C., POINSSOT, B., GAUTHIER, A., PARIS,F., GUILLIER, C., et al., Front.. Plant Sci., 5, 2014, p. 592.18.JARDIN, P. D., Sci. Hortic., 2015, p. 1-12.19.ROSS, A.B., ANASTASAKIS, K., KUBACKI, M., JONES, J.M., J.Anal.Appl. Pyrol., 85, 2009, p. 3–10.20.SHARMA, S.H.S., LYONS, G., MCROBERTS, C., MCCALL, D.,CARMICHAEL, E., ANDREWS, F., et al., J. Appl. Phycol., 24, no. 5 ,2012, p. 1141–1157.21.SUMMERER, S., PETROZZA, A., CELLINI, F., Acta Hortic., 1009,2013, p. 143-148.22.*** Humic Acid Method, Fertilizer Laboratory, California:Department of Food and Agriculture, Center for Analytical Chemistry,2009;23.ROQUEROL, J., AVNIR, D., FAIRBRIDGE, C. W., EVERETT, D. H.,HAYNES, J. M., PERNICONE, N., RAMSAY, J. D. F., SING, K. S. W.,UNGER, K. K., Pure Appl. Chem., no. 66, 1994, p. 1739-1758.24.*** SR EN 1484:2006, Water analysis. Guidelines for thedetermination of total organic carbon (TOC) and dissolved organiccarbon (DOC).25.*** SR EN 12260:2004, Water quality-Determination of nitrogen-Determination of bound nitrogen (TNb), following oxidation to nitrogenoxides.26.BELLAMY L, J., The infrared spectra of complex molecules, 3rded., Vol. 1, Chapman and Hall, London, 1975.27.GERASIMOWISZ, W.V., BYLER, D.M., Soil Sci., 139, 1985, p. 270–278.28.HERNANDEZ, M.T., MORENO, J.I., COSTA, F., GONZALEZ-VILA,F.J., FRUND, R., Soil Sci., 149, 1990, p. 63–68.29.SCHNITZER, M., Humic Substances: their structure and function inbiosphere, Nieuwerslius. Pudoc., 1972, p. 293–310.30.STEVENSON, F.J.,Geochemistry of soil HS, John Wiley & Sons,AIKEN, G.R., MCKNIGHT, D.M., WERSHAW, R.L., MACCARTHY, P., NewYork, 1985.31.STEVENSON, F.J., Humus Chemistry, second ed., John Wiley andSons, New York, 1994.32.HELAL, A.A.,.J. Saudi Chem. Soc., 11, no. 3, 2007, p. 377–386.33.STEVENSON F.J., Humus Chemistry: Genesis, Composition,Reactions, Wiley-Interscience, New York, 1994.34.SENES, N., D’ORAZIO, V., RICCA, G., Geoderma, 116, 2003, p. 325–344.35.ERTANI, A., FRANCIOSO, O., TUGNOLI, V., RIGHI, V., NARDI, S.,Food Chem., 59, 2011, p. 11940–11948.36.RODRIGUEZ-LUCENA, P., LUCENA, J.J., HERNANDEZ-APAOLAZA,L., Proc. 15th Int. Plant Nutrition Colloquium, UC Davis, Sacramento,2009.37.RADU, E., OPRESCU, E.E., ENASCUTA, C.E., CALIN, C., STOICA, R.,SCAETEANU, V.G., VASILIEVICI,G., CAPRA, L., IVAN,G., ION, A.C., Rev.Chim. (Bucharest), 69, no. 1, 2018, p. 192.38.THOMMES, M., Chemie Ing. Tech., no. 82, 2010, p.1059-1073.39.ATKINS, P. W., Phys. Chem., PWN Warsaw, 2007, p. 830-832.40.GOMES DEL MELO, B. A,. MOTTA, F. L., SANTANA, M. H. A., Mater.Sci. Eng. C, 62, 2016, p. 962-974.41.MA, M. G., WEI, Y. X., ZHAO, G. H., LIN, F., ZHU, Y. R., Int. J.Environ. Protection and Policy no. 2, 2014, p. 230-235.42.ZUYI, T., SHIFANG, L., ZHI, Z.F., YUHUI. Y., Chemistry And Ecology,14, no.1, 1997, p.21-30.43.LODHI, A., S.TAHIR, S., IQBAL, Z., MAHMOOD,A., AKHTAR, M.,QURESHI T.M. , YAQUB, M., NAEEM, A., Soil Environ., 32, no.1, 2013,p. 63-70.44.SCHNITZER, M., Humic substances: Chemistry and reactions,Elsevier, SCHNITZER, M., KHAN, S.U., New York, 1978, p. 1-64.
Manuscript received: 19.02.2018