speech-coding and training-induced …kilgard/centanni dissertation.pdfspeech-coding and...
TRANSCRIPT

SPEECH-CODING AND TRAINING-INDUCED PLASTICITY IN
AUDITORY CORTEX OF NORMAL AND DYSLEXIA
MODEL RATS
by
Tracy Michelle Centanni
APPROVED BY SUPERVISORY COMMITTEE:
___________________________________________
Dr. Michael P. Kilgard, Chair
___________________________________________
Dr. Robert L. Rennaker II
___________________________________________
Dr. Peter F. Assmann
___________________________________________
Dr. Jeffrey S. Martin

Copyright 2013
Tracy Michelle Centanni
All Rights Reserved

This dissertation is dedicated to my father, who spent the last 26 years teaching me that there is
always more to a question than a one sentence answer. He pushed me and helped create the
inquisitive mind I have today. This dissertation would not have been possible without his love
and encouragement. I love you, Dad. “Po-ta-to” doesn’t seem so stupid anymore…

SPEECH-CODING AND TRAINING-INDUCED PLASTICITY IN
AUDITORY CORTEX OF NORMAL AND DYSLEXIA
MODEL RATS
by
TRACY MICHELLE CENTANNI, BS, MS
DISSERTATION
Presented to the Faculty of
The University of Texas at Dallas
in Partial Fulfillment
of the Requirements
for the Degree of
DOCTOR OF PHILOSOPHY IN
COGNITION AND NEUROSCIENCE
THE UNIVERSITY OF TEXAS AT DALLAS
May 2013

v
ACKNOWLEDGMENTS
First, I must sincerely thank my parents for instilling in me the drive to even attempt a doctorate,
and for the love and support along the way. They were both always willing to listen to me talk
out a particular problem I was having, even if they didn’t understand all the jargon. I am
eternally grateful for that. And thank you to my sister, who helped me keep things in perspective
when I was feeling frustrated. I also could not have finished this program without the love and
support of my husband, Matt. He spent the entire four years living more than 1,500 miles away,
visiting every 3-4 weeks and encouraging me over the phone, email, skype, and any other form
of technology we could get our hands on. I cannot put into words how much that sacrifice has
meant to me and I am so exceptionally lucky to have him by my side.
I am incredibly fortunate to have completed my doctoral program at UTD. My mentor, Dr.
Michael Kilgard, has always encouraged me to be a better scientist. From day one, he was
hounding me for project ideas, and though he time and again turned down my music-related
project ideas, this process helped me become the queen of multi-tasking, running at least 4 full
experiments, 4 pilot projects, and assisting in 3 other projects during my 4 years in the lab. This
program has been a collaborative one between Dr. Kilgard and I, and I am a better person and a
better researcher for it. Thank you for allowing me to stretch my wings and for keeping me
focused when my ambitions got the better of me.
Thank you also to my committee members for their valuable advice and help along the way. Dr.
Robert Rennaker has been an irreplaceable mentor from day one, helping me to develop new

behavior tasks and teaching me the art of awake recordings. Dr. Peter Assmann gave me my
foundation in speech science and his advice on relating my rodent work to the human population
has been enlightening. Dr. Jeff Martin was always available to give me his insights on the
population of people with communication disorders, and was instrumental in always reminding
me to put my work into context. The work in this dissertation is a small but important piece of a
larger puzzle.
I also could not have finished this dissertation without the help of Dr. Andrew Sloan. He taught
me almost everything I know about Matlab coding and never (outwardly) lost his patience with
my millions of nagging questions about syntax and commands. He has also tirelessly helped me
apply a new statistical method when my own knowledge fell short. I can never express how
much he truly helped me and I am forever in his debt.
I have been lucky to share the lab with many wonderful colleagues. First, I must thank Dr.
Crystal Engineer, who taught me the techniques of anesthetized microelectrode recording and the
corresponding analysis. She and I have developed a mutual relationship of data collection and
analysis and her help and advice has been crucial in this process. Secondly, thank you to Navid
Khodaparast who has been a wonderful lab mate over the last 4 years. Our friendly competition
pushed me, but his willingness to listen and offer advice was even more valuable. I will miss his
witty comments. Also a thank you to Dr. Amanda Reed, Dr. Ben Porter, Dr. Jai Shetake, Dr.
Kamalini Ranasinghe, and Dr. Navzer Engineer for being wonderful mentors as I was starting
out in the lab. Thank you to Mike Borland, Will Vrana, Allison Malik, and Ryan Carraway for
help with data collection throughout the years; I cannot say how much I appreciate all the late
nights.

I have been fortunate to have a wonderful group of undergraduate volunteers throughout my time
in the lab who were instrumental in the collection of data and the completion of this research:
Nicole Lengnick, Hali Shepard, Zeenat Abdulali, Cody Mains, Nicole Moreno, Ryan Cheung,
Harjoat Gill, Dez Gunter, Elizabeth Hanacik, Chris Im, Susan Mahioddin, Chanel Matney,
Robert Miller, Christina May, Cal Rohloff, Christina Stelly, Lye-Yeng Wong, Akbar Afsar,
Laura Baxter, Kisha Williams, Ariel Schmid, Karen Wong, Amreen Sitabkhan, Ryan Russell,
Stephanie Barata, Ashley Ramdeen, Nujeen Zibari, Jacob VanNattan, and Ian Heimbuch.
Finally, I would like to thank my undergraduate research advisor, Dr. Michael Wenger and my
friends Dr. Jennifer Bittner and Dr. Rebecca Von Der Heide-Byrne for their continued support
and advice during this process. You all helped prepare me for this crazy ride and I am eternally
grateful. Go State!
March 2013

viii
PREFACE
This dissertation was produced in accordance with guidelines which permit the inclusion as part
of the dissertation the text of an original paper or papers submitted for publication. The
dissertation must still conform to all other requirements explained in the “Guide for the
Preparation of Master’s Theses and Doctoral Dissertations at The University of Texas at Dallas.”
It must include a comprehensive abstract, a full introduction and literature review and a final
overall conclusion. Additional material (procedural and design data as well as descriptions of
equipment) must be provided in sufficient detail to allow a clear and precise judgment to be
made of the importance and originality of the research reported. It is acceptable for this
dissertation to include as chapters authentic copies of papers already published, provided these
meet type size, margin and legibility requirements. In such cases, connecting texts which
provide logical bridges between different manuscripts are mandatory. Where the student is not
the sole author of a manuscript, the student is required to make an explicit statement in the
introductory material to that manuscript describing the student’s contribution to the work and
acknowledging the contribution of the other author(s). The signatures of the Supervising
Committee which precede all other material in the dissertation attest to the accuracy of this
statement.

ix
SPEECH-CODING AND TRAINING-INDUCED PLASTICITY IN
AUDITORY CORTEX OF NORMAL AND DYSLEXIA
MODEL RATS
Publication No. ___________________
Tracy Michelle Centanni, PhD
The University of Texas at Dallas, 2013
ABSTRACT
Supervising Professor: Michael P. Kilgard, PhD
The ability to understand auditory stimuli and particularly speech sounds is a complex process
involving many brain regions. Communication disorders are among the most common
disabilities in the US and affect over 20% of the general population. Understanding the
differences in the way the auditory cortex processes speech sounds in individuals with these
disorders may elucidate the neural mechanisms behind these disorders and lead to more effective
therapies. Dyslexia is the most common developmental language disorder and causes
impairments in reading ability in spite of normal non-verbal IQ. Children with dyslexia have
difficulty recognizing phonemes: the smallest segment of a word that, if changed, alters the
meaning of the word. Dyslexic children also have altered neural responses to short auditory
stimuli, such as phonemes or tones. Since humans with dyslexia have complex genetic profiles,
the direct link between each of the dyslexia-associated genes and the auditory processing

x
impairments seen in dyslexia cannot be studied in humans and requires the precise control
available in animal models. In this dissertation, I document the cortical auditory firing
impairments in rats with in utero RNAi of Kiaa0319, the most well-studied candidate dyslexia
gene. We document for the first time, that suppression of a candidate-dyslexia gene causes
impaired phoneme processing in multiple auditory fields compared to normal controls. Many
studies have shown that abnormal neural firing patterns lead to impairments in comparable
behavior tasks. We report here that rats with RNAi of Kiaa0319 also have significant behavioral
impairments on phoneme discrimination tasks. Extensive behavioral training can improve speech
discrimination accuracy as well as restore neural firing properties to control levels. This result
provides the first evidence for a possible neural mechanism that drives improvement in dyslexic
children. Finally, in an effort to develop more biologically plausible analysis tools, we also
report the development and testing of a new classifier which can use auditory cortex activity to
locate and identify the evoking speech stimulus in real time. The results of these studies show
that the variants in the candidate dyslexia gene KIAA0319 can cause neural and behavioral
impairments in phoneme processing and provide new tools to investigate neural encoding of
speech sounds in the normal and abnormal brain

xi
TABLE OF CONTENTS
ACKNOWLEDGMENTS...............................................................................................................v
PREFACE................................................................................................................................... viii
ABSTRACT..................................................................................................................................ix
LIST OF FIGURES……….……………………….…………………………………………....xiii
LIST OF TABLES……….……………………….………………………………………….....xvi
CHAPTER 1: Introduction ............................................................................................................1
CHAPTER 2: Knockdown of the dyslexia-associated gene Kiaa0319 impairs temporal
responses to speech stimuli in rat primary auditory cortex…………………..........6
Appendix: Chapter 2 Figures..................................................................................35
References ..............................................................................................................47
CHAPTER 3: Cortical speech-evoked response patterns in multiple auditory fields are
correlated with behavioral ability..………………………………………….........57
Appendix: Chapter 3 Figures and Tables..............................................................83
References………….............................................................................................96
CHAPTER 4: Speech sound processing deficits and training-induced neural plasticity in rats
with dyslexia gene knockdown….………………………...………………….....102
Appendix A: Chapter 4 Figures...........................................................................130
Appendix B: Chapter 4 Supplementary Figures..................................................140
References….……...............................................................................................149

xii
CHAPTER 5: Real time identification of speech sounds using cortical activity patterns ......156
Appendix: Chapter 5 Figures............................................................................189
References………………………………….....................................................186
CHAPTER 6: Conclusion.......................................................................................................190
Appendix: Chapter 6 Figures...........................................................................194
References........................................................................................................195
VITA

xiii
LIST OF FIGURES
CHAPTER TWO Page
Figure 2.1 In utero RNAi of Kiaa0319 (KIA-) caused delayed speech-evoked local
field potentials (LFPs) in both awake and anesthetized rats………………………….35
Figure 2.2 In utero RNAi of Kiaa0319 caused degraded spatiotemporal response patterns
to consonant speech sounds …………………………….…………………..……….37
Figure 2.3 In utero RNAi of Kiaa0319 caused delayed activity to speech sounds.……….…....38
Figure 2.4 In utero RNAi of Kiaa0319 caused increased variability in neural responses to
speech stimuli.……………………………………………………………………….39
Figure 2.5 In utero transfection with Kiaa0319 shRNA caused impaired neural
discrimination of consonant and vowel stimuli…………………………...………….40
Figure 2.6 In utero RNAi of Kiaa0319 impaired neural firing properties to repetitive broad
band stimuli.………………………………………………………………….……....42
Figure 2.7 In utero RNAi of Kiaa0319 caused impaired neural firing to tonal stimuli..…….…43
Figure 2.8 Basic neural firing impairments may contribute to poor neural classification of
phonemes …………………………………..………………………………………..44
Figure 2.9 Neurons with transfection of Kiaa0319 shRNA had higher membrane resistance
than controls …………………………….…………...……………………….……..45
CHAPTER THREE
Figure 3.1 Speech sound stimuli were shifted up by an octave…………….…………………..83
Figure 3.2 Example of an auditory cortex map from one anesthetized,
adult rat……………………………………………………………………………...84
Figure 3.3 Tone response properties in anterior, primary, ventral, and posterior auditory
fields mimic previous studies….………….……………………………….….….….85

xiv
Figure 3.4 Classifier performance by auditory field as a function of number of sites…………86
Figure 3.5 Neural classifier performance in each auditory field with and without spike
timing information……….…………………………………………………….…….87
Figure 3.6 Single site examples of the evoked-response to consonant speech sounds in
each auditory field.…………………………………………………………….…….88
Figure 3.7 Spatiotemporal response patterns to all consonant speech sounds tested in
anterior, primary, ventral, and posterior auditory fields……………………….……89
Figure 3.8 Neural similarity is highly correlated across fields………………….………….…..91
Figure 3.9 Example correlations from one pair of sites in each field…..………………………92
Figure 3.10 Distribution of correlation coefficients between speech evoked responses in
pairs of recording sites….………….………………………………………….…...93
Figure 3.11 Neural activity from multiple fields can identify consonant sounds better
when spike timing information is preserved……………………………………….94
CHAPTER FOUR- APPENDIX A
Figure A4.1 Rats with in utero RNAi of Kiaa0319 are impaired at speech discrimination
tasks……………………………………………………………………………....130
Figure A4.2 Extensive speech discrimination training can improve on clear speech
tasks………………………………………………………………………………132
Figure 4.3 Percentage of transfected neurons predicts behavioral aptitude in KIA- rats….....133
Figure A4.4 Extensive short speech training improves full speech and speech in noise
performance in KIA- rats……………………………………………………....…134
Figure A4.5 Extensive behavioral training improves reliability of neural firing and neural
discrimination performance……………………………………………………...135
Figure A4.6 Training improves firing reliability in response to consonant speech sounds…..136
Figure A4.7 Training improves the ability of KIA- A1 and PAF sites to fire reliably to
repetitive stimuli…………………………………..…….…………………….…138
Figure A4.8 Extensive behavioral training shortens latency and amplitude of N1
component of LFP response……………………………………………………..139

xv
CHAPTER FOUR- APPENDIX B
Figure B4.1 Rats with in utero RNAi of Kiaa0319 are able to learn a simple lever
pressing task…………………………………………………………………..….140
Figure B4.2 Training affects basic neural firing properties to tonal stimuli in KIA-
and control rats …………………………………………………………………..142
Figure B4.3 Extensive behavioral training improves neural encoding of vowel sounds
in control and KIA- auditory cortex……………………………………………....144
Figure B4.4 Untrained, awake KIA- neurons are impaired at following repetitive stimuli..…146
Figure B4.5 An additional 4 weeks of behavior training causes additional plasticity in
control rats……………………………………………………………………...…147
CHAPTER FIVE
Figure 5.1 Explanation of decision threshold calculation...………………….………….…….179
Figure 5.2 A real time classifier could locate and identify nine consonant speech sounds
with high levels of accuracy……..…………………………………………………180
Figure 5.3 A Gaussian filter was necessary for highlighting evoked activity….……………..181
Figure 5.4 The classifier was able to locate and identify multiple speech sounds in a
sequence.................................................................................................................182
Figure 5.5 Schematic of the behavioral task…..…………………………….……………...…183
Figure 5.6 Average performance of rats and the classifier on the speech sequence task….….184
Figure 5.7 Cortical speech-evoked activity patterns were robust up to 10 sps………..………185
CHAPTER SIX
Figure 6.1 Schematic of the possible role of multiple auditory fields for robust speech
perception in adverse listening conditions…………………………………………194

xvi
LIST OF TABLES
CHAPTER 3
Table 3.1 Behavioral speech sound discrimination performance of rats………………...……95

1
CHAPTER 1
INTRODUCTION
The ability to understand auditory stimuli and particularly speech sounds is a complex process
involving many brain regions. Communication disorders are among the most common
disabilities in the US and affect over 20% of the general population (asha.org). Many individuals
with communication disorders experience debilitating setbacks in education which often impact
the individual’s quality of life (McNulty 2003; Shaywitz 1998). Understanding the differences in
the way the auditory cortex processes speech sounds in individuals with these disorders
compared to normal individuals may elucidate the neural mechanisms behind these disorders and
lead to more effective therapies.
Dyslexia is the most common developmental language disorder and affects 5-10% of the
population. This disorder causes impairments in reading ability in spite of normal non-verbal IQ.
Children with dyslexia have difficulty recognizing phonemes- the smallest segment of a word
that, if changed, alters the meaning of the word (Boscariol et al. 2010; Peterson and Pennington,
2012; Tallal and Piercy 1974; Vandermosten et al. 2010). Dyslexic children also have altered
neural responses to short auditory stimuli, such as phonemes or tones. For example, tone-evoked
EEG responses in dyslexic children were delayed and had lower amplitude compared to control
children (Nagarajan et al. 1998; Tonnquist-Uhlen 1996). Individuals with dyslexia also have
reduced neural responses to speech stimuli (Kraus et al. 1996; Kujala et al. 2000; Schulte-Körne
et al. 2001).

2
Dyslexia is also highly heritable and several candidate dyslexia genes have been proposed
(KIAA0319, DCDC2, DYC1C1, ROBO1, among others; (Bates et al. 2011; Deffenbacher et al.
2004; Francks et al. 2004; Galaburda et al. 2006; Harold et al. 2006; Luciano et al. 2007;
Paracchini et al. 2006; Schumacher et al. 2006). KIAA0319 is the most well-studied of these
genes and is linked to reduced left hemisphere activation to phoneme stimuli (Pinel, 2012). We
designed the studies in chapter 2 to determine the role of this specific gene in causing the neural
firing deficits associated with dyslexia.
In chapter 2, we document the impaired neural firing to speech and non-speech stimuli in rats
with in utero RNAi of Kiaa0319. Primary auditory cortex in these rats fired with significantly
higher variability in onset latency from trial to trial of the same stimulus. An established nearest-
neighbor Euclidean distance classifier can predict behavioral performance in normal rats. We
used this classifier to see if the impaired firing patterns in KIA- A1 would affect the ability of
neural activity to discriminate between speech sounds. Neural responses in A1 of KIA- rats were
significantly impaired at discriminating between pairs of consonant or vowel speech sounds.
In chapter 2, we focused on analyzing A1 recordings in normal and KIA- rats. Other auditory
fields likely contribute to speech sound processing and may provide information about
specialization for certain types of auditory stimuli. In Chapter 3, we document the neural
responses to speech sounds in primary (A1), anterior (AAF), ventral (VAF), and posterior (PAF)
auditory fields of the normal adult rat. We observed a comparable set of speech-evoked neural
response patterns in each of the four fields we examined and saw no apparent advantage for
speech sound processing in other fields in the normal rat. In spite of the consistent speech-
encoding across fields, we did also observe an increase in encoding diversity in the non-primary

3
fields. Such a result suggests differences in processing, perhaps providing the bandwidth to
encode many new processing tasks.
The experiments in this chapter set the foundation for us to look in other auditory fields in
our dyslexia model (as described in Chapter 2). Other auditory fields can show deficits in
auditory processing even when primary auditory cortex is responding normally. For example,
studies have shown that other auditory fields in autistic children respond abnormally to speech
sounds even when A1 responds normally (Lai et al. 2011). Dyslexic children are treated using
extensive behavioral therapy to improve impaired performance on phoneme manipulation or
deletion tasks as compared to controls (‘break’ without the /b/ or switch the first phoneme in two
words, ‘dog’ and ‘house’; (Paulesu et al. 1996). Dyslexic individuals can also have abnormal
rhyme or non-word recognition (Howland and Liederman 2012; Paulesu et al. 1996) and these
deficits in phoneme processing are thought to be due to an underlying deficit in rapid auditory
processing (Martino et al. 2001; Poelmans et al. 2012; Russo et al 2004; Tallal and Piercy 1974).
Abnormal neural responses in dyslexic children can improve after extensive training, such as the
program Fast ForWord (Scientific Learning Corporation, Oakland, CA). The neural mechanism
by which it is effective, and whether other auditory fields are also benefitted by training, is
unknown. We hypothesized that training may induce plasticity in primary and non-primary
auditory fields of KIA- rats.
In chapter 4, we document the behavioral deficit of rats with in utero RNAi of Kiaa0319.
These rats have abnormal startle response to oddball tone paradigms (Szalkowski et al., 2012)
and we hypothesized that they would also have impairment on phoneme discrimination. Rats are
good models of speech sound discrimination. They are able to accurately discriminate human

4
consonants (Engineer et al., 2008) and vowels (Perez et al., 2012) in quiet, various levels of
speech-shaped and white background noise (Shetake et al., 2011) and after spectral or temporal
degradation (Ranasinghe et al., 2012). We report that in utero RNAi of Kiaa0319 causes
significant behavioral impairments on several of these phoneme discrimination tasks. Extensive
speech training can improve reliability of neural firing in KIA- A1 and improve the neural
discrimination performance of this field. A similar plasticity effect was seen in KIA- PAF and in
Control PAF. The results in this chapter provide the first evidence of speech training-induced
plasticity in a control animal and suggest a possible mechanism by which training programs like
Fast ForWord are effective.
In the previous 3 chapters, we used a nearest-neighbor two-alternative forced choice
classifier to evaluate neural firing patterns in normal and dyslexia model rats. This classifier had
several conditions which are biologically implausible. First, the classifier was given knowledge
of the stimulus onset time, which may not be available to the animal in real world situations.
Second, the classifier was forced to choose between one of two options for the evoking stimulus,
which put chance level at 50%. In chapter 5, we document a new classifier which uses
anesthetized or awake neural data to locate the time at which a speech stimulus was presented
and identify the evoking speech sound. The benefits of this new classifier are that is it not forced
to guess and is effective using a variety of previously reported stimulus sets. This classifier can
also predict behavior on a relatively novel behavioral task in which speech sounds are presented
in random, rapid sequences at one of 6 speeds.

5
In chapter 6, we discuss the implications of these experiments and how the results relate to
the current literature. This dissertation consists of 6 chapters and 4 appendices that contain
supplementary data and figures.
6
CHAPTER 2
KNOCKDOWN OF THE DYSLEXIA-ASSOCIATED GENE KIAA0319 IMPAIRS
TEMPORAL RESPONSES TO SPEECH STIMULI IN RAT PRIMARY
AUDITORY CORTEX*
Authors- Tracy M. Centanni1, Anne B. Booker
2, Andrew M. Sloan
1, Fuyi Chen
2, Brady J.
Maher2, Ryan S. Carraway
1, Navid Khodaparast
1, Joseph J. LoTurco
2, and Michael P. Kilgard
1
1School of Behavioral and Brain Sciences, GR41
The University of Texas at Dallas
800 W. Campbell Road
Richardson, Texas, 75080-3021
2Department of Physiology and Neurobiology
The University of Connecticut
75 North Eagleville Road
Storrs, CT, 75080-3021
* Article was published in Cerebral Cortex in February, 2013: Knockdown of the Dyslexia-Associated Gene Kiaa0319 Impairs Temporal Responses to Speech Stimuli in Rat Primary Auditory Cortex T. M. Centanni; A. B. Booker; A. M. Sloan; F. Chen; B. J. Maher; R. S. Carraway; N. Khodaparast; R. Rennaker; J. J. LoTurco; M. P. Kilgard Cerebral Cortex 2013; doi: 10.1093/cercor/bht028

7
ABSTRACT
One in fifteen school age children have dyslexia, which is characterized by phoneme processing
problems and difficulty learning to read. Dyslexia is associated with mutations in the gene
KIAA0319. It is not known whether reduced expression of KIAA0319 can degrade the brain’s
ability to process phonemes. In the current study, we used RNA interference (RNAi) to reduce
expression of Kiaa0319 (the rat homolog of the human gene KIAA0319) and evaluate the effect
in a rat model of phoneme discrimination. Speech discrimination thresholds in normal rats are
nearly identical to human thresholds. We recorded multi-unit neural responses to isolated speech
sounds in primary auditory cortex (A1) of rats that received in utero RNAi of Kiaa0319.
Reduced expression of Kiaa0319 increased the trial by trial variability of speech responses and
reduced the neural discrimination ability of speech sounds. Intracellular recordings from affected
neurons revealed that reduced expression of Kiaa0319 increased neural excitability and input
resistance. These results provide the first evidence that decreased expression of the dyslexia
associated gene Kiaa0319 can alter cortical responses and impair phoneme processing in
auditory cortex.

8
INTRODUCTION
Approximately 7% of children with normal intelligence have trouble learning to read (Badian
1999; Shaywitz et al. 1990; Shaywitz et al. 1992). These children typically have deficits in tasks
that involve phonemic awareness (Boscariol et al. 2010; Peterson and Pennington, 2012; Tallal
and Piercy 1974; Vandermosten et al. 2010). Phonemes are the smallest individual acoustic
component of a word that can change that word’s meaning (i.e. the “b” sound in the word /bad/).
Normal individuals respond with a consistent threshold when asked to categorize sounds along a
continuum. For example, in a ba-pa continuum, stimuli with a voice onset time below 25 ms are
categorized as “ba,” while stimuli with longer voice onset times are categorized as “pa” (Manis
et al. 1997; Werker and Tees 1987). Dyslexic individuals have a less defined perceptual divide in
discriminating phonemes. When asked to delete or exchange two phonemes in a spoken phrase
(i.e. turn “dog house” into “hog douse”), dyslexic individuals perform significantly worse
(Paulesu et al. 1996).
The phonemic deficit observed in dyslexia is theorized to be the result of temporal
processing problems in the central auditory system (Martino et al. 2001; Poelmans et al. 2012;
Russo et al 2004; Tallal and Piercy 1974). The impaired ability of the dyslexic brain to process
phonemic stimuli likely interferes with the mapping of phonemes to the corresponding grapheme
(visual letters). The observation that children with dyslexia are also impaired in rapid tone
processing (Ahissar et al. 2000; Tonnquist-Uhlen 1996; Wright et al. 1997) suggests that deficits
in temporal processing are not speech specific and reflect a more general dysfunction in temporal
processing.
9
Temporal processing deficits associated with dyslexia are theorized to result from
abnormal firing in the central auditory system (Ahissar et al. 2000; Boscariol et al. 2010; Tallal
1980; Temple et al. 2001, but see McLean et al., 2011 and Rosen 2003). Primary auditory cortex
encodes phonemic stimuli with millisecond precision (Eimas 1985; Engineer et al. 2008).
Altered cortical response properties have been found in dyslexic individuals to simple stimuli
like brief tones, with longer latencies to tones and lower amplitude in dyslexics compared to
controls (Nagarajan et al. 1998; Tonnquist-Uhlen 1996). Individuals with dyslexia also have
reduced neural responses to speech sounds during passive exposure (Kraus et al. 1996; Kujala et
al. 2000; Schulte-Körne et al. 2001) and during phoneme discrimination tasks (Flowers, Wood,
Naylor 1991; Rumsey et al. 1992; Rumsey et al. 1997; Temple et al. 2001; Temple et al. 2003;
Temple et al.).
Dyslexia displays both environmental and genetic risk components (Cope et al. 2005;
Fisher and DeFries 2002; Nöthen et al. 1999; Pennington et al. 1991). The co-incidence rate
among monozygotic twins is 50-68% (Pennington et al. 1991). Allelic variations in the gene
KIAA0319 have been consistently associated with dyslexia (Bates et al. 2011; Deffenbacher et al.
2004; Francks et al. 2004; Galaburda et al. 2006; Harold et al. 2006; Luciano et al. 2007;
Paracchini et al. 2006; Schumacher et al. 2006). In addition, allelic variation in a region
encompassing the KIAA0319 gene has been associated directly with alterations in fMRI
responses during reading in left superior temporal cortex in individuals with dyslexia, indicating
a potentially direct role of KIAA0319 function in cortical processing during reading (Pinel et al.
2012).

10
We have previously shown that neuronal responses in the primary auditory cortex of rats
accurately encode human phonemes that can be difficult for dyslexic children to distinguish
(Engineer et al. 2008; Perez et al. 2012; Porter et al. 2011; Ranasinghe et al. 2012a; Shetake et al.
2011). This study was designed to determine whether in utero RNAi of Kiaa0319 (the rat
homolog of the human gene, KIAA0319) can degrade the brain’s ability to process phonemes.
METHODS
Animals
Subjects were Wistar rats, both male and female, that were 3-6 months old at the time of
study. All rats used were subjected as embryos to in utero electroporation targeting lateral
regions of neocortex that included the auditory cortex by methods described previously (Bai et
al. 2003; Bai et al. 2008; Burbridge et al. 2008; Szalkowski et al. 2012; Threlkeld et al. 2007).
The animals were transfected with either an shRNA against Kiaa0319 which can decrease the
Kiaa0319 protein expression in cell culture (Tarkar and LoTurco, unpublished observation) and
to cause migration delay in neocortex in embryos that was rescued by expression of exogenous
Kiaa0319 (Parrachini et al 2006). Control transfection animals received a scrambled sequence
control of Kiaa0319 shRNA, also previously used, that contained 6 bases in the sequence
scrambled to render the shRNA inactive in terms of reducing Kiaa0319 expression (Parrachini et
al 2006). Kiaa0319 shRNA and scrambled shRNA constructs were injected at a concentration of
1.0 µg/µL. pB-GFP was co-transfected with the effective shRNA construct, and pB-mRFP was
co-transfected with the scrambled Kiaa0319 shRNA control construct to identify the
experimental condition in post experimental histological analysis. Electroporation paddles were

11
placed in a horizontal plane and voltage pulses were discharged across the cerebrum in both
polarities to achieve bilateral transfections. The experimental status of the subject remained blind
to the experimenters throughout data collection. Following data collection, each subject was
perfused transcardially with 250 mL of 0.1 M PB solution with 0.02% heparin, followed by 500
mL of 4% formalin solution in 0.1 M PB. Sections were taken at 80 µm intervals and analyzed
under a confocal microscope (Zeiss) to identify the experimental status of each subject (green
florescent protein marked experimental subjects and red florescent protein marked control
littermates). All animal protocols were approved by the University of Connecticut Institutional
Animal Care and Use Committee.
Anesthetized recordings
Multiunit recordings were acquired from the primary auditory cortex of 11 rats. After
histological analysis, we determined that 5 were Kiaa0319 knockdowns (KIA-, 2 females, 3
males), and 6 were littermate controls (3 females, 3 males). The recording procedure is explained
in detail elsewhere (Engineer et al. 2008). In brief, animals were anesthetized with pentobarbital
(50 mg kg-1
) and given supplemental dilute pentobarbital (8 mg ml-1
) as needed to maintain
areflexia, along with fluids to prevent dehydration. A tracheotomy was performed to ensure ease
of breathing throughout the experiment. Primary auditory cortex and several nearby auditory
fields were exposed via craniotomy and durotomy. Four Parylene-coated tungsten
microelectrodes (1-2 MΩ) were simultaneously lowered to layer IV of right primary auditory
cortex (~600-800 µm).
Brief tones were presented at 90 randomly interleaved frequencies (1-48 kHz) at 16
intensities (1- 75 dB SPL) to determine the characteristic frequency of each site. Tones had 5 ms

12
cosine squared ramps and their total duration was 25 ms. Additional stimuli were randomly
interleaved and presented at 20 repeats per recording site. Broad band noise was presented in
trains of six 25 ms long bursts at four different presentation rates (4, 7, 10 and 12.5 Hz). Broad
band stimuli contained evenly distributed frequencies between 1 and 32 kHz. We also presented
8 English consonant-vowel-consonant (CVC) speech sounds (/dad/, /sad/, /tad/, /bad/, /gad/,
/dud/, /deed/, and /dood/) previously tested in our lab (Engineer et al. 2008; Floody et al. 2010;
Ranasinghe et al. 2012a; Shetake et al. 2011). Sounds were shifted up 1 octave using the
STRAIGHT vocoder to better match the rat hearing range (Kawahara 1997). Each sound was
calibrated so that the most intense 50 ms of the stimulus length was 60 dB SPL. All sounds were
presented approximately 10 cm from the left ear of the rat.
Awake recordings
Chronic awake recordings were collected from subjects implanted with 16-channel
microwire electrode arrays. The implantation surgery and microwire arrays have been previously
reported in detail (Rennaker et al., 2005a). Briefly, subjects were anesthetized with an
intramuscular injection of a mixture of ketamine, xylazine and acepromazine (50 mg/kg, 20
mg/kg, 5 mg/kg, respectively). Atropine and dexamethazone were administered subcutaneously
prior to and following surgery. A midline incision was made, exposing the top of the skull, and a
section of the right temporalis muscle was removed to access primary auditory cortex. Six bone
screws were fixed to the dorsal surface of the skull (two in each parietal bone and one in each
frontal bone) to provide structural support for the head cap. The two middle screws had attached
leads to serve as a reference wire and a grounding wire. A craniotomy and durotomy were
performed to expose the cortex in the region of primary auditory cortex. The microwire array

13
was then inserted to a depth of 550-600 µm (layer IV/V) in primary auditory cortex using a
custom built mechanical inserter (Rennaker et al, 2005b). The area was sealed with a silicone
elastomer (Kwik-Cast, World Precision Instruments Inc, Sarasota, Florida) and the head cap was
built with a connector secured with acrylic. Finally, the skin around the implant was sutured in
the front and the back of the head cap. Subjects were given prophylactic minocycline in water ad
libitum for 2 days prior and 5 days following surgery to lessen immune responses (Rennaker et
al. 2007), and were also given Rimadyl tablets for 3 days after surgery to minimize discomfort.
Topical antibiotic was applied to the incision to prevent infection.
Following a week of recovery, recordings were obtained from each animal in a series of
daily recording sessions. During each session, the animal was unrestrained in a 30 x 30 cm cage
and sounds were presented from a calibrated magnetic speaker (Tucker Davis Technologies,
Alachua, FL) mounted 35 cm directly above the animal (Rennaker et al. 2005). A head-stage
amplifier was directly attached to the subject’s electrode connector, and neural signals were
sampled at 25 kHz, amplified, and band-pass filtered from 825 to 4500 Hz using Tucker Davis
Technologies System 2 hardware. Custom software was used for displaying and saving
recordings and for auditory stimulus control.
Three acoustic stimulus sets were presented to awake subjects in separate recording
sessions. The first stimulus set consisted of trains of broadband clicks (~1 ms duration, 3 dB
points at 1.6 and 31.6 kHz) played at 13 presentation rates ranging from 1 Hz to 250 Hz. Click
intensity was calibrated such that the loudest 50 ms of the fastest clicktrain had an intensity of 60
dB SPL at a distance of 5 cm from the cage floor. The second stimulus set consisted of the 5
English CVC speech sounds that were also presented to the anesthetized subjects that varied by

14
first consonant (/dad/, /sad/, /tad/, /bad/, and /gad/). The third stimulus set consisted of the 4 CVC
speech sounds that varied by vowel (/dad/, /dud/, /deed/, and /dood/). As with the anesthetized
recordings, all speech sounds were shifted up 1 octave and calibrated such that the loudest 50 ms
was heard at 60 dB SPL. Since the animal was unrestrained, sound levels were measured at four
locations inside the cage and then averaged to account for any change in acoustics.
Analysis of Neural Recordings
To define primary auditory cortex (A1) sites, multi-unit recording sites were manually
analyzed to select the characteristic frequency of each site, as well as to obtain bandwidth,
latency, peak firing and end of peak response information. From this point on, only A1 sites were
analyzed.
Following selection of A1 sites, basic firing properties were calculated in response to
tones. Firing latency is defined as the point in time (ms) that average firing rate (across all
repeats) first exceeds 2 standard deviations above the spontaneous firing rate, threshold is
defined as the lowest intensity that evoked a response from the multiunit site, and bandwidths
were calculated at 10, 20, 30 and 40 dB above threshold and defined as the range of frequencies
that evoked responses at the current intensity. In response to broad band click trains, normalized
spike rate (number of spikes evoked by bursts 2-6, normalized by the number of spikes to the
first burst) and vector strength (VS) were calculated. VS quantifies the degree of synchronization
between action potentials and repeated sounds. Mean VS is calculated with the formula:

15
where n = total number of action potentials, ti is the time of occurrence of the i’th action
potential, and T is the inter-stimulus interval. Perfect synchronization would result in a value of
one, whereas no synchronization would result in a value of zero. To investigate the reliability of
onset latency to repetitive stimuli, we calculated the time to peak latency within the first 80 ms
(the shortest inter-pulse-interval tested) of the first pulse at 4Hz and averaged across multiunit
sites. The variability in this measure, as reported in variance, was compared across KIA- and
controls.
Single trial response patterns to each of the isolated speech sounds were compared using
a nearest neighbor classifier (Engineer et al. 2008; Foffani and Moxon 2004; Foffani and Moxon
2005; Perez et al. 2012; Ranasinghe et al. 2012a; Ranasinghe et al. 2012b; Ranasinghe et al.
2012b; Shetake et al. 2011). We chose this method because our earlier studies showed that the
performance of this classifier is highly correlated with rat behavioral discrimination (Engineer et
al. 2008; Perez et al. 2012; Ranasinghe et al. 2012a; Ranasinghe et al. 2012b; Shetake et al.
2011). We used Euclidean distance to compare single trial activity to the average activity
(PSTH) evoked by 19 repeats each of two different stimuli. For consonants, activity was binned
using 1 ms temporal precision over a 40 ms window to encompass the spike timing precision
present in the initial consonant (Engineer et al. 2008; Porter et al. 2011; Ranasinghe et al. 2012a),
while vowel activity was binned across a single 400 ms window so that spike count information
was preserved (Perez et al. 2012; Ranasinghe et al. 2012a). The classifier then compared the
response of each single trial with the average activity template (PSTH) evoked by all repeats of
each of the speech stimuli presented. The current trial being considered was not included in the
PSTH to avoid artifact. The classifier attempted to identify the stimulus that evoked the current

16
single trial activity pattern by selecting the template that was most similar to the single trial in
units of Euclidean distance. ED was calculated using the formula:
where nsites is each recording site and nbins is each of 40 one-millisecond bins being compared
between activity evoked by speech sound X versus speech sound Y. For vowel sounds, the
classifier counted the number of action potentials over a single 400 ms bin and compared the
single trial response with the two PSTH templates (Ranasinghe et al. 2012a). We used t-tests for
all pairwise comparisons of the accuracy of both classifiers and across experimental groups.
When necessary, an α of 0.01 was used to correct for multiple comparisons.
Brain Slice recordings
Whole cell patch clamp recording were made from pyramidal neurons in acute brain
slices as previously described (Maher et al. 2009). Briefly, P28-35 previously electroporated rats
were deeply anesthetized with isoflurane and transcardially perfused with ice-cold oxygenated
(95% O2 and 5% CO2) dissecting buffer containing (in mM): 83 NaCl, 2.5 KCl, 1 NaH2PO4,
26.2 NaHCO3, 22 glucose, 72 sucrose, 0.5 CaCl2, and 3.3 MgCl2. The rats were decapitated and
the brains rapidly removed and immersed in ice-cold oxygenated dissection buffer. Coronal
slices (400 µm) were cut using a vibratome (VT1200S, Leica), incubated in a dissection buffer
for 30-45 min at 34°C, and then stored at room temperature. Slices were visualized using IR
differential interference microscopy (DIC) (E600FN, Nikon) and a CCD camera (QICAM,
QImaging). Individual layer 2/3 pyramidal cells expressing GFP or RFP were visualized with
epifluourescent illumination and a 40x Nikon Fluor water immersion (0.8 numerical aperture)

17
objective. For all experiments, artificial cerebrospinal fluid (ACSF) was oxygenated (95% O2
and 5% CO2) and contained (in mM): 125 NaCl, 25 NaHCO3, 1.25 NaH2PO4, 3 KCl, 25
dextrose, 1 MgCl2, and 2 CaCl2, pH 7.3. Patch pipettes were fabricated from borosilicate glass
(N51A, King Precision Glass, Inc.) to a resistance of 2-5 MΩ. For current-clamp experiments
pipettes were filled with (in mM): 125 potassium gluconate, 10 HEPES, 4 Mg-ATP, 0.3 Na-
GTP, 0.1 EGTA, 10 phosophocreatine, 0.05% biocytin, adjusted to pH 7.3 with KOH. Voltage
signals were recorded and current pulses injected with a Multiclamp 700A amplifier (Molecular
Devices). Data were acquired using Axograph, and data acquisition was terminated when series
resistances were >15 MΩ.
RESULTS
In utero RNAi of Kiaa0319 causes degraded neural firing to phonemes
Variants in the gene Kiaa0319 are associated with dyslexia (Bates et al. 2011; Deffenbacher
et al. 2004; Galaburda et al. 2006; Harold et al. 2006; Paracchini et al. 2006; Schumacher et al.
2006). To test whether reduced expression of this gene can cause the abnormal speech-evoked
potentials observed in dyslexics, we measured speech-evoked local field potentials (LFPs)
derived from multi-unit recordings in awake rats that were transfected with Kiaa0319 shRNA in
utero (Paracchini et al. 2006). In response to the sound “dad”, LFPs in transfected rats (KIA-)
had a longer P1 latency than in control rats (Figure 2.1A; P1: 112.7 ± 4.3 ms vs. 75.8 ± 9.1 ms;
p< 0.01; KIA- vs. controls respectively). Since we cannot be sure which auditory field or the
exact depth our awake recordings are from, we also recorded multi-unit speech responses in
anesthetized rats. Auditory responses do not differ drastically between anesthetized and awake

18
preparations in normal rats (Engineer et al. 2008; Shetake et al. 2011), and anesthetized
recordings allow for complete control of the targeted auditory field and behavioral state. In
primary auditory cortex (A1) of anesthetized rats, speech-evoked LFPs to the sound “dad” had a
significantly lower N1 and P1 amplitude in KIA- sites than in controls (N1 amplitude: -44.1 ±
1.5 Hz vs. -78.2 ± 2.1 Hz; p< 0.01,P1 amplitude: 27.6 ± 0.9 Hz vs. 45.9 ± 1.2 Hz; p< 0.01; KIA-
vs. controls respectively; Figure 2.1B). LFP responses to the sound “bad” (Figure 2.1 C&D)
show the same pattern of response, with some slight variation. These response properties to
speech sounds mimic the reduced activity seen in human dyslexic imaging studies.
We next tested whether the differences in the evoked responses were due to a reduction
in the number of auditory evoked action potentials or due to differences in neural
synchronization (Blau et al. 2010; Kraus et al. 1996; Lovio et al. 2010). In KIA- rats, multi-unit
sites fired more spikes per stimulus than control sites. Across the length of the speech sound “da”
(a 400 ms analysis window), cortical responses in KIA- rats fired 19.9 spikes as compared to
14.5 spikes from controls (p< 0.01). On average, KIA- sites did not fire significantly more spikes
than controls in response to speech sounds (an average of 17.9 ± 4.6 spikes/vowel in KIA- sites
vs. 17.1 ± 5.1 spikes/vowel in controls; p=.10). Since the lower amplitude in KIA- LFP
recordings cannot be explained by fewer evoked spikes, we tested whether these sites fired with
greater variability in onset latency across trials. In response to the sound “da,” onset latency of
KIA- sites was more variable trial by trial (26.8 ms2) compared to control sites (13.2 ms
2 in
controls; p< 0.01). This increased variability in onset latency was observed in response to all
speech sounds tested (an average of 27.2 ms2 in KIA- sites vs. 12.5 ms
2 in control sites; p< 0.01).

19
Increased variability in spike timing would be expected to decrease the amplitude of the
population response to speech sounds.
In control rats, each consonant sound evoked a unique pattern of response across the
tonotopic organization of A1. These different patterns can be seen by plotting the average
responses to consonant sounds for each of a variety of sites and organizing those sites by
characteristic frequency (low to high; Figure 2.2A). The consonants “d” and “t” evoked firing
from high frequency neurons first, followed by an onset of low frequency neurons that
corresponds to that consonant’s voice onset time. For example, in response to the sound “d,”
high frequency neurons (> 6 kHz) fired first, followed by low frequency neurons approximately
20 ms later (Figure 2.2A, first panel). In response to the sound “b” (a voiced consonant), neurons
fired in the opposite order; low frequency neurons fired first and high frequency neurons almost
immediately after (Figure 2.2A, second panel). The observation that our control sites responded
similarly to previous studies in unaffected rats (Engineer et al. 2008; Perez et al. 2012;
Ranasinghe et al. 2012a; Shetake et al. 2011), suggests that the in utero surgery, plasmid
injection and electroporation alone did not alter neural responses.
In contrast to the distinct patterns of speech responses in the controls, KIA- sites
responded less precisely to speech sounds in a number of ways. As expected from the LFP data,
KIA- sites responded to speech sounds more slowly, though these trends were not significant.
For example, the timing of the first evoked spike to the consonant sound /d/ was slightly (but not
significantly) later in KIA- sites (17.4 ± 0.2 ms) compared to control sites (15.9 ± 0.7ms; p=
0.07). The peak latency was significantly later for each of the speech sounds presented, firing an
average of 3.9 ms later than controls (25.3 ± 0.5 vs. 21.4 ± 0.4 ms respectively; p< 0.01; Figure

20
2.3A). The variability in the onset latency across repeats of each speech sound was much higher
in KIA- sites (variance of 70.1 ± 4.1 ms2 vs. 40.6 ± 2.7 ms
2 in controls; p< 0.01; Figure 2.4A). In
addition to the variability in latency, the number of spikes fired in the first 400 ms of each
stimulus in KIA- sites was more variable across repeats (variance of 30.9 ± 0.6 spikes2 vs. 24.1 ±
0.8 spikes2 in controls; p= 0.03; Figure 2.4B). This increase in variance could have been due to
an increase in mean firing rate. We measured the mean firing rate evoked by speech sounds in 40
ms and 400 ms analysis windows. On average, KIA- sites fired the same number of action
potentials in response to speech sounds as control sites (Figure 2.4C). This result suggests that an
increase in mean firing rate is not responsible for the increase in trial by trial variability.
The increased trial by trial variability in speech responses could interfere with the brain’s
ability to distinguish between similar speech sounds. We used a well validated nearest
neighborhood classifier to test this hypothesis (Engineer et al. 2008; Perez et al. 2012;
Ranasinghe et al. 2012a; Shetake et al. 2011). The classifier compared single trial activity
patterns with millisecond precision to the average responses to two different consonant sounds.
We compared single trial responses from individual recording sites to the average responses to
two different stimuli. For example, the neural response (peristimulus time histogram, PSTH) of a
single site in response to the sound “d” was compared to the average response of that site evoked
by “d” or “b”. The PSTH template that was most similar to the single trial (i.e. had the smallest
Euclidean distance), was selected as the sound most likely to have elicited the single trial
response. In control sites, a typical high frequency site responded very quickly after the onset of
the sound “d,” but with a slight delay following the onset of the sound “b” (Figure 2.5A). In a
typical high frequency KIA- site, the response is less consistent from trial to trial and causes

21
more errors in stimulus identification (Figure 2.5B). On average, the classifier correctly
identified the consonant sound 68 ± 1% of the time when using KIA- sites and 77 ± 2% of the
time when using control sites (p< 0.01; Figure 2.5C). The degree of impairment on consonant
discrimination caused by reduced KIA0319 expression is equivalent to the impairment caused by
adding 60 dB SPL background noise, which resulted in a 0 dB signal to noise ratio (Shetake et al.
2011). This result indicates that in utero RNAi of Kiaa0319 increases firing variability and
reduces the ability of A1 neurons to discriminate different consonant speech sounds.
To test whether in utero RNAi of Kiaa0319 might also impair vowel discrimination, we
used a version of the neural classifier that considers only spike count (and not spike timing;
Perez et al. 2012). Performance of this classifier on vowel discrimination was highly correlated
with behavior observations (Perez et al. 2012). The rate based classifier used single trial
responses and classified sounds based on which sound evoked the closest number of spikes on
average (across 19 repeats). For example, a high frequency recording site in control rats typically
fired fewer spikes in response to the vowel sound “a” (as in “dad”) than in response to the vowel
sound “u” (as in “dud”; Figure 2.5D). In a typical high frequency KIA- site, the variability in
number of spikes fired trial-to-trial was much greater (Figure 2.5E), while the mean number of
evoked spikes did not differ. Across sites, the trial by trial variability in number of evoked spikes
was higher in KIA- sites vs. controls (29.9 ± 1.5 spikes2 vs. 23.8 ± 1 spikes
2 respectively; p<.01).
Average number of action potentials fired to each vowel was not significantly different between
control and KIA- sites (to “a”, 17.3 ± 1 spikes in controls vs. 17.9 ± 1 spikes in KIA- sites,
p=.49; to “u”, 19.2 ± 1 spikes in controls vs. 19.9 ± 1 spikes in KIA- sites, p=.54). We
hypothesized that the greater trial by trial variability in spike count would lead to impaired vowel

22
discrimination. As expected, neural discrimination of vowel sounds using activity from KIA- rats
was significantly worse than controls. Activity from sites in KIA- rats was able to correctly
identify the vowel sounds 55 ± 1% of the time compared to 59 ± 1% in control sites (p< 0.01;
Figure 2.5F). This result suggests that reduced in utero RNAi of Kiaa0319 can impair both
consonant and vowel discrimination.
RNAi of Kiaa0319 causes impaired neural firing to non-speech stimuli
The increased A1 response variability caused by in utero RNAi of Kiaa0319 was not
specific to speech sounds. In response to a noise burst, a representative control site fired
consistently across twenty repeats of the stimulus. In response to the same stimulus, a
representative KIA- site fired later and less consistently (Figure 2.6A). The average onset
latency was significantly later in KIA- sites (16.9 ± 6.9 ms in KIA- vs. 15.3 ± 4.6 ms in controls;
p< 0.01; Figure 2.6B). The finding that KIA- sites had longer latency to non-speech stimuli is
similar to the longer latency of evoked potentials in human dyslexics (Tonnquist-Uhlen 1996).
The variability in onset latency was also higher across the population of KIA- sites as compared
to controls (48.7 ± 0.6 ms2 in KIA- sites vs. 21.4 ± 1.1 ms
2 in controls; p< 0.01; Figure 2.6C).
Similar to the reduced firing amplitude to tones seen in human EEG studies (Nagarajan et al.
1999; Tonnquist-Uhlen 1996), peak firing rate to a noise burst was significantly lower in KIA-
sites as compared to controls (256.1 ± 0.4 Hz in KIA- sites compared to 383.9 ± 0.6 Hz in
controls; p< 0.01; Figure 2.6D). The observation that the number of spikes fired to a broad band
noise burst was not significantly different in KIA- sites (2.9 ± .04 spikes vs. 2.9 ± .03 spikes; p=
0.80), suggests that the reduced peak firing rate may be due to greater variability in onset
latency. To quantify the variability in latency, we measured vector strength in response to noise

23
burst trains and found that KIA- sites were impaired at phase-locking compared to controls at all
four presentation rates tested (Figure 2.6E; p< 0.01). When we compared the sites’ ability to
discriminate between different presentation rates (using the same classifier as used for
phonemes), KIA- sites were significantly worse at identifying presentation rate (63.9 ± 1%
correct vs. 80.8 ± 1% correct in control sites; p< 0.01). Children with dyslexia have poorer
sensitivity to modulation rates compared to control children and adults (Lorenzi 2000).
To determine whether in utero RNAi of Kiaa0319 impaired the sensitivity and selectivity
of A1 sites, we evaluated responses at each site to a wide range of tonal stimuli (1-32 kHz, 0-75
dB SPL). The observation that average response threshold was not impaired in KIA- rats
compared to controls (8.9 ± 0.6 dB SPL vs. 7.2 ± 0.6 dB SPL; p= 0.06) suggests that basic
hearing ability was not disrupted by Kiaa0319 RNAi. The latency of tone evoked responses was
later and the response amplitude was lower in KIA- rats (Figure 2.7A), which is consistent with
tone evoked responses in dyslexics (Tonnquist-Uhlen 1996). Peak latency was 27 ± 0.5 ms in
KIA- rats and 22 ± 0.5 ms in control sites (p< 0.01). KIA- recordings had higher spontaneous
firing levels than controls (16.2 ± 0.6 Hz in KIA- vs. 12.6 ± 0.6 Hz in controls; p< 0.01). KIA-
sites also had significantly narrower bandwidths than controls. For example, BW20 (20 dB
above threshold) was 1.89 ± .05 octaves in KIA- sites compared to 2.25 ± .04 octaves in control
sites (p< 0.01). In spite of the lower peak firing rate (Figure 2.7A), KIA- sites actually fired more
spikes per tone than control sites. The number of spikes evoked by tones within 0.5 octaves of
the best frequency was computed for intensities from 0 to 75 dB SPL. KIA- sites fired
significantly more spikes than control sites for intensities from 10 to 65 dB SPL (Figure 2.7B).
For example, KIA- sites generated approximately 20% more spikes per 40 dB SPL tone than

24
controls (1.4 ± 0.1 vs. 1.23 ± 0.1 spikes, p< 0.01). The average characteristic frequency was
higher in KIA- sites than in controls (13 kHz in KIA- compared to 9.7 kHz in controls; p< 0.01).
Although in utero RNAi of Kiaa0319 does not alter tone thresholds and hearing range, it does
significantly alter A1 response properties which may contribute to the abnormal neural responses
to speech sounds.
Firing abnormalities to non-speech stimuli contribute to poor phoneme classification
To evaluate which of the abnormal A1 response properties were most likely to contribute
to degraded speech responses, we created subpopulations of sites from control rats which were
selected to have the same distribution as KIA- rats for several different response properties and
evaluated which subpopulations were also significantly impaired in speech discrimination (as
compared to the full sample of control sites; consonant performance of 77 ± 2% and vowel
performance of 59 ± 1%). Since KIA- sites fired with much higher trial by trial spike count
variability (over a 40 ms window), control sites could not be found to match the distribution of
KIA- sites. We analyzed the 10% of control sites with the highest variability and found that these
sites’ ability to discriminate consonants was significantly different than the full set of control
sites sites (consonant discrimination; 68 ± 1%; p= 0.01) but was not different on vowel tasks; 58
± 2%; p=0.24). Control sites with a spontaneous firing distribution selected to match that of
KIA- rats were significantly different from the full sample of control sites at neural
discrimination of consonants (68 ± 1%; p<.01; Figure 2.8A) and vowels (57 ± 1%; p<.01; Figure
2.8B). Control sites with a peak latency distribution or a bandwidth distribution selected to match
that of KIA- rats were significantly different from the full set of control sites at neural
discrimination of consonants (latency: 68 ± 1%; p<.01, bandwidth: 68 ± 1%; p<.01), but did not

25
differ at vowels (latency: 59 ± 1%; p=.67, bandwidth: 59 ± 1%; p=.46). Control sites with a CF
distribution selected to match that of KIA- rats were not significantly different from the full set
of control sites at consonant (73 ± 1%; p= 0.09) and vowel discrimination (59 ± 1%; p= 0.33).
These results suggest that abnormal/inconsistent neural excitability and latency may contribute
the impaired responses to speech sounds observed in rats transfected with Kiaa0319 shRNA in
utero.
Neurons with RNAi of Kiaa0319 are more excitable than control neurons
Kiaa0319 is a very large protein (1052 amino acids, 116 kDa) whose functions are poorly
understood (Velayos-Baeza et al. 2010; Velayos-Baeza et al. 2008; Poon et al. 2011a). To
investigate the effect of reduced expression of this gene on intracellular firing properties, we
made whole-cell patch clamp voltage recordings from layer II/III pyramidal neurons expressing
one of four transgenes. Cells expressing Kiaa0319 shRNA fired many more action potentials in
response to current injection compared to scramble control neurons (same control as above). For
example, neurons expressing the Kiaa0319 shRNA fired 5.5 ± 1 spikes in response to a 200pA
current injection, while control (scrambled RNA) neurons responded with 0.5 ± 0.5 spikes to the
same current injection (p< 0.01; Figure 2.9A). To confirm that the increased excitability is not
due to a non-specific effect of the Kiaa0319 shRNA, we recorded from cells that expressed both
the Kiaa0319 shRNA (which reduces Kiaa0319 expression) and a transgene to increase
Kiaa0319 expression. The normal excitability of the rescue controls suggests that reduced
Kiaa0319 expression causes greater neural excitability. We also recorded from neurons that
expressed the transgene to increase Kiaa0319 expression (overexpression control). The normal
level of excitability seen in recordings from this control confirms that the increased excitability

26
in the reduced Kiaa0319 expression group (KIA-) was not due to any non-specific effect of
RNAi.
One possibility for the increased excitability following Kiaa0319 RNAi would be an increase
in input resistance as cells with increased input resistance may fire more action potentials as
compared to control cells. To test input resistance of individual neurons, differing amounts of
current (between -200 and 500 pA in 50 pA increments) were injected into the cell and sub-
threshold membrane potential of the cell was measured at each step (Figure 2.9B&C). KIA-
neurons showed a significantly greater change in membrane potential for every pA of current
injected as compared to scramble controls (at 100 pA of current, KIA- membrane potential
changed by 18.4 ± 3.6 mV versus 8.1 ± 1.1 mV in controls; p= 0.02; Figure 2.9B), indicating a
greater input resistance in KIA- neurons as compared to controls (193.7 ± 25.3 Mohm in KIA-
cells vs. 103.6 ± 21.4 Mohm in scramble control; p= 0.01; Figure 2.9C&D). Neurons with
reduced expression of Kiaa0319 did not have a significant difference in gross anatomy
(Galaburda et al. 2006; Peschansky et al. 2010), resting membrane potential (-71.1 ± -0.7 mV in
KIA- vs. -71.5 ± -1.4 in scramble control; p= 0.70) or action potential width (0.7 ± -0.03 ms
compared to 0.7± -0.02 ms in controls; p= 0.40). Our result that reduced expression of Kiaa0319
causes increased resistance may help explain the variability in number of action potentials fired
trial-to-trial in our multi-unit data.
DISCUSSION
Summary of results
This study was designed to test the hypothesis that in utero RNAi of Kiaa0319 can disrupt
the brain’s ability to process speech sounds. Recordings in awake and anesthetized rats
27
demonstrate that Kiaa0319 RNAi degrades auditory cortex responses to both speech and non-
speech sounds. Increased spontaneous firing, increased latency, increased response variability
and decreased frequency selectivity all contribute to the reduced ability of A1 sites to distinguish
between speech sounds. Neurons with transfected with Kiaa0319 shRNA have higher input
resistance and greater excitability compared to control neurons. These results provide the first
direct evidence of a neural mechanism whereby the dyslexia associated gene Kiaa0319 could
interfere with phonemic processing.
Dyslexic individuals have abnormal auditory neural responses
Dyslexics have abnormal auditory cortex responses that are similar to the abnormalities
we observed in rats transfected with Kiaa0319 shRNA in utero (KIA-).
Auditory-evoked potentials in dyslexic humans are later and weaker than controls in response to
tones and speech sounds (Nagarajan et al. 1999; Tonnquist-Uhlen 1996). Studies using fMRI
consistently show reduced cortical response to speech during passive exposure (Kraus et al.
1996; Kujala et al. 2000; Schulte-Körne et al. 2001) and during phoneme discrimination tasks
(Flowers, Wood, Naylor 1991; Rumsey et al. 1992; Rumsey et al. 1997; Temple et al. 2001;
Temple et al. 2003; Temple et al.). Our results suggest that this reduced response may be due to
higher trial by trial variability rather than a reduced number of action potentials. Human neural
responses are also less able to lock to gamma-rate modulations of white noise (Lehongre et al.
2011). The result that neural responses in rats with in utero RNAi of Kiaa0319 are significantly
worse at phase locking to repetitive broad band stimuli suggests that reduced expression of this
gene may directly impair the ability of auditory cortex to fire consistently to speech and non-
speech stimuli.

28
Neural responses in dyslexic humans are abnormal in several non-cortical areas.
Responses in the left auditory thalamus to phoneme stimuli are weaker in dyslexics (Diaz et al.
2012). This brain region responds asymmetrically in controls but fire symmetrically in dyslexics.
For example, in a phoneme task, the left auditory thalamus in controls responds more strongly
than the right, and for speaker identification tasks, the right thalamus responds more strongly
than left. In dyslexics, the two hemispheres show no difference relative to the task. Auditory
brain stem responses (ABRs) in dyslexic humans are also weaker and fire less precisely to the
timing characteristics of speech sounds (Russo et al. 2004). ABRs in dyslexics also do not adapt
to repetitive stimuli as they do in controls (Chandrasekaran et al. 2009). Kiaa0319 is expressed
in many brain areas including brainstem, striatum, hippocampus and cortex (Peschansky et al.
2010; Poon et al. 2011b). It is likely that variants in the gene Kiaa0319 disrupt neural firing
properties in multiple brain regions.
Genetic basis of dyslexia
The underlying cause of dyslexia has been a matter of great debate for thirty years.
Factors such as socio-economic status, birth weight, visual function, attention, and genetics have
all been proposed to explain the disorder (Bates et al. 2011; Galaburda et al. 2006; Hack et al.
1991; Hari et al. 1999; Miles and Haslum 1986; Pennington et al. 1991; Ramus et al. 2003).
Twin studies provided the first convincing evidence that genetics plays a major role in the
development of problems with reading (Pennington et al. 1991). Genome wide association
studies failed to find a single gene responsible for the majority of cases of dyslexia and instead
identified a diverse set of genes (KIAA0319, DCDC2, ROBO1, DYX1C1), each one of which
alone accounts for only a small percentage of the population variance (Bai et al. 2003; Bai et al.

29
2008; Burbridge et al. 2008; Deffenbacher et al. 2004; Fisher and DeFries. 2002; Galaburda et al.
2006; Meaburn et al. 2008; Roeske et al. 2011; Scerri et al. 2011; Threlkeld et al. 2007). All four
of the dyslexia associated genes are expressed in the brain, but their contribution to reading
problems remains unclear. Our study tested the earlier proposal that dyslexia is caused by poor
phonemic awareness due to a degraded neural representation of speech sounds (Martino et al.
2001; Poelmans et al. 2012; Russo et al 2004; Tallal and Piercy 1974). The idea was that poor
phoneme processing is usually not detected until children must explicitly relate specific speech
sounds (phonemes) to specific letters (graphemes). Although it was clear that dyslexics have
abnormal brain responses, it was not at all clear how dyslexia associated genes might lead to
these abnormalities. Our demonstration that in utero RNAi of Kiaa0319 can degrade the neural
representation of speech sounds is consistent with this hypothesis.
A small sub-population of humans with dyslexia have known variants in the KIAA0319
gene (Bates et al. 2011; Deffenbacher et al. 2004; Galaburda et al. 2006; Harold et al. 2006;
Paracchini et al. 2006; Schumacher et al. 2006). Dyslexics with KIAA0319 variants had reduced
activation of the left temporal cortex in response to speech (Pinel et al. 2012). This abnormality
is correlated with poor speech perception and reading ability. Dyslexics with a KIAA0319 variant
also have white matter abnormalities in left tempo-parietal cortex (Darki et al. 2012). Dyslexics
with KIAA0319 variants typically have mutations in the promoter region of the gene (Paracchini
et al 2006), which causes reduced expression of KIAA0319 (Dennis et al 2009). Our observation
that in utero RNAi of Kiaa0319 in rats results in degraded cortical responses to speech is
consistent with observations in dyslexics with KIAA0319 mutations.

30
It will be important to determine if other dyslexia genes can degrade the cortical
representation of speech sounds. If reduced expression of most dyslexia genes can degrade
speech sound processing, it is likely that degraded auditory processing is the primary deficit
responsible for dyslexia. If reduced expression of other dyslexia genes does not degrade speech
sound processing, then the auditory processing hypothesis of dyslexia would be in doubt. A
recent study reported that human dyslexics with ROBO1 mutations exhibit abnormal evoked
responses in auditory cortex and the severity of this abnormality is proportional to the level of
ROBO1 gene expression (Lamminmäki et al. 2012). Additional studies in humans or animals
with reduced expression of ROBO1, DCDC2, and DYX1C1 are needed to determine whether
auditory cortex dysfunction is a common consequence of dyslexia gene mutation.
The amount of genetic suppression present may contribute to the extent of the observed
deficit. RNAi does not generate uniform suppression and does not affect every neuron. Even
though this model is not a complete genetic knockout, the suppression of dyslexia associated
genes can affect cells that were not transfected. Previous work has shown that RNAi of another
dyslexia associated gene (Dcdc2) can cause non cell-autonomous effects, as demonstrated by
migration abnormalities in non-transfected cells (Burbridge et al. 2008). Our results show that
even though it is likely that many cells included in our multi-unit recordings were not
transfected, the influence of the genetic suppression was significant enough to generate a
significant impairment in cortical auditory processing. The extent of the effect on non-
transfected auditory cortex neurons is unanswered and would provide insights into the multi-
modal symptoms observed in dyslexics.

31
Future Directions
Our model of a Kiaa0319 variant in rats is valuable for studying the direct contribution of
this gene to auditory processing. The behavioral consequence of in utero transfection of
Kiaa0319 shRNA on speech discrimination in rats is not known. However, a recent study in
these rats confirmed that they are impaired at discrimination of frequency-modulated (FM)
sweeps (Szalkowski et al. 2012). Our observation that these rats exhibit impaired speech
responses suggests that they may have problems discriminating between similar speech sounds.
A similar degree of degradation of the neural response to speech caused by added background
noise (Shetake et al. 2011) or signal degradation using a noise vocoder (Ranasinghe et al. 2012a)
impaired consonant and vowel discrimination in rats. The hypothesis that in utero RNAi of
Kiaa0319 will impair phoneme discrimination needs to be tested.
Rats with in utero RNAi of Kiaa0319 could be used to test the neural mechanisms that
allow for improved phoneme processing with extensive behavioral training. Extensive therapy in
dyslexics can normalize neural responses in the cortex and brainstem. For example, three months
of exposure and discrimination training can improve speech evoked responses in auditory cortex
and brainstem (Gaab et al. 2007; Temple et al. 2003). When interventions focus on only a small
set of stimuli, improvements in cortical responses can be seen in as little as three weeks (Lovio et
al. 2012; Tremblay & Kraus. 2002). Speech training can also improve timing and amplitude of
speech evoked responses in the auditory brainstem (Russo et al. 2004). If neural responses in our
rat model can be improved by training, recordings of action potential patterns may elucidate the
mechanisms by which behavioral therapy improves speech sound processing in dyslexics.

32
Phoneme processing problems in dyslexia may be due to inconsistent neural firing
Many studies have documented that dyslexics have a smaller average auditory evoked
response compared to control subjects. The simplest interpretation is that fewer neurons respond
to sound in dyslexics. Our results suggest another explanation. It is possible that abnormal
expression of dyslexia genes impairs speech processing by increasing trial by trial variability
(internal noise), rather than by reducing the number of neurons that respond to sound. Several
imaging studies in humans with dyslexia have suggested that poor phonological awareness is
directly related to inconsistent neural responses across different stimuli (McAnally and Stein.
1996; Wible et al. 2002; Ziegler et a.. 2009). We suggest that this inconsistent firing occurs
across repeats of the same stimulus as well. Rats with transfection of Kiaa0319 shRNA in utero
have higher trial by trial variability in the timing and the number of spikes generated by each
sound. This variability appears to be responsible for the lower peak firing rate for the average
population response to both speech and non speech stimuli. The classifier we used relies on
single trial responses to discriminate between different sounds. Neural discrimination was
impaired when Kiaa0319 shRNA was transfected in utero even though the number of evoked
spikes was not decreased. These results suggest the possibility that phoneme processing
problems in dyslexics can be caused by increased trial by trial variability even if the average
response is not reduced.
Conclusion
In utero RNAi of Kiaa0319 increases excitability in cortical neurons and degrades the
spectral and temporal fidelity of auditory cortex responses. The cortex of rats transfected with
Kiaa0319 shRNA in utero have delayed latency, are impaired at phase-locking to repetitive

33
stimuli, and show significantly poorer discrimination of both consonant and vowel stimuli. We
have confirmed that the candidate dyslexia gene Kiaa0319 is involved in phonemic processing in
primary auditory cortex and our results suggest that this gene may contribute to these deficits in
dyslexic humans. In addition, intracellular recordings revealed that in utero transfection of
Kiaa0319 shRNA increased the excitability of neocortical neurons and may account for the
impaired systems level responses. Our observation that a dyslexia associated gene can degrade
the neural representation of speech sounds is consistent with a prevailing theory of the biological
basis for dyslexia. The rat model of speech sound processing will be useful in testing the
relationship between dyslexia gene expression levels and degraded neural responses to speech.
The model could also be used to elucidate the mechanism of action of current behavioral
treatments for dyslexia.
Funding
This work was supported by the National Institute for Deafness and Communication Disorders at
the National Institutes of Health (R01DC010433 to MPK) and the National Institute of Child
Health and Human Development at the National Institutes of Health (HD055655 to JJL).

34
Acknowledgments
We would like to thank K. Trull and N. Wasko for help with histological analysis, M. Fink, L.
Doss, R. Miller, E. Hanacik, C. Rohloff, M. Borland, N. Moreno, and C. Matney for help with in
vivo recordings, and C. Fiondella for performing surgeries. We would also like to thank S. Hays,
D.Truong, C. Engineer, K. Im, and S. del Tufo for their suggestions on earlier versions of this
manuscript.

35
APPENDIX
CHAPTER 3 FIGURES
Figure 2.1. In utero RNAi of Kiaa0319 (KIA-) caused delayed speech-evoked local field
potentials (LFPs) in both awake and anesthetized rats. LFPs in panels A. and C. were created by
averaging across 47 sites from 9 awake KIA- animals and 6 sites from 3 awake control animals.
LFPs in panels B. and D. were created by averaging across Responses are averaged across all
recording sites 247 sites from 5 anesthetized KIA- animals and 255 sites from 6 anesthetized
control animals. Latency of the LFP was calculated by milliseconds to the peak of each
component. A. LFPs in response to the speech sound “dad” had a lower amplitude in KIA-
neurons recorded from awake animals compared to controls. B. These abnormal response
properties were not affected by pentobarbital anesthesia. Speech evoked LFPs to the sound “dad”
had longer (but not significantly longer) latency and lower amplitude in KIA- neurons recorded

36
Figure 2.1 continued…
from animals anesthetized with dilute pentobarbital compared to controls. C. LFPs in response to
the speech sound “bad” had a longer P1 latency than controls. D. These abnormal properties
were more obvious in the presence of pentobarbital anesthesia. Though the LFP response to the
sound “dad” (panels A & B) were slightly different than the LFP response to the speech sound
“bad” (panels C & D), the average response to these sounds was extremely similar.

37
Figure 2.2. In utero RNAi of Kiaa0319 caused degraded spatiotemporal response patterns to
consonant speech sounds. A. Consonant sounds evoked unique patterns of activation across the
A1 of anesthetized control rats. Each multi-unit site’s average response to the speech sound over
20 repeats is organized by the characteristic frequency of the site. The average response across
all sites is shown on top of each sub-panel. These patterns are similar to previous studies using
unaffected rats (Engineer et al. 2008; Perez et al. 2012; Ranasinghe et al. 2012a; Shetake et al.
2011). B. Response patterns of multi-unit recordings taken from primary auditory cortex of
anesthetized rats that had undergone in utero RNAi. In utero RNAi of Kiaa0319 caused delayed
response to speech sounds, as well as reduced precision in firing latency.

38
Figure 2.3. In utero RNAi of Kiaa0319 caused delayed activity to speech sounds. A. Onset
latency and peak latency in response to the consonant sound /d/ were longer in multi-unit
recordings from anesthetized rats transfected with Kiaa0319 shRNA in utero (* = p< 0.01). B.
Average onset latency and peak latency to consonant stimuli were later in multi-unit recordings
from anesthetized KIA- rats as compared to anesthetized control sites (* = p< 0.01).

39
Figure 2.4. In utero RNAi of Kiaa0319 caused increased variability in neural responses to speech
stimuli. A. Onset latency to speech sounds was more variable across trials in multi-unit responses
from anesthetized KIA- rats (light bar) compared to sites from anesthetized controls (dark bar; *
= p<0.01). B. The number of action potentials fired during speech sounds was more variable
trial-to-trial in KIA- sites (light bar) during vowels (400 ms window; * = p< .01). C. The average
number of evoked action potentials to speech sounds was not significantly different between
control and KIA- sites for either a 40 ms or a 400 ms analysis window (p=.10). This result
suggests that the increased trial by trial variability is not due to an increased firing rate.

40
Figure 2.5. In utero transfection with Kiaa0319 shRNA caused impaired neural discrimination of
consonant and vowel stimuli. A. Single trial neural responses from a typical high frequency
control site. Action potentials are plotted over the course of the consonant sound and organized
by repeat (each row is a different repeat). To the sound “d”, this site fired quickly after the sound
onset, while this site fired with a 10 ms delay to the sound “b.” Repeats during which the
classifier guessed incorrectly as to the stimulus identity are marked by an ‘x’ on the right. Total
percent correct for this pair is on top of the panel. B. Single trial neural responses from a typical
high frequency KIA- site. To the sound “d,” this site fired later than the control site, and with
greater variability across repeats. To the sound “b,” this site fired later than the control site, and
with greater variability across repeats. This site made many more errors in identifying the source
stimulus as compared to the control, due to the amount of variability across repeats. C. Average
percent correct across ten neural consonant discrimination tasks. A two-alternative forced-choice
classifier compared the Euclidean distance between a single trial response and the average
response to two consonant stimuli. Using activity from a single site in 1 ms bins, the classifier
guesses which sound evoked the single trial activity by picking the comparison yielding the
smallest Euclidean distance. KIA- neurons were significantly impaired at discriminating between
consonant sounds (* = p< 0.01). D. Single trial neural responses from a typical low frequency
control site.

41
Figure 2.5 continued…
Average number of spikes fired per repeat is plotted by repeat. To the vowel sound “a” (as in
“dad”), this site fired more spikes than in response to the vowel sound “u” (as in “dud”). Vowels
were more difficult than consonants to discriminate, as the classifier compared each trial’s spike
count with the average spike count for that sound (vertical lines) and this is reflected by a greater
number of classifier errors, as marked by an ‘x’ on the right. E. Single trial neural responses
from a typical low frequency KIA- site. The average number of spikes per vowel was more
similar in KIA- sites (vertical lines), which makes the classifier guess incorrectly more often. F.
Average percent correct across six neural vowel discrimination tasks. The same neural classifier
used single site activity in 400 ms bins to identify which vowel sound evoked the single trial
activity using Euclidean distance. KIA- neurons were significantly impaired at discriminating
between vowel sounds (* = p< 0.01).

42
Figure 2.6. In utero RNAi of Kiaa0319 impaired neural firing properties to repetitive broad band
stimuli. A. Example of single site responses to the first broad-band noise burst. Each row
represents a repeat of the stimulus, and each dot shows the location of an action potential with
respect to time. The control site (top) responded consistently across repeats, while the KIA- site
(bottom) responded later and with more variability across repeats. B. Onset latency to the first
broad-band noise burst was later in KIA- neurons compared to control neurons (* = p= 0.01). C.
Variability in peak latency across repeats was significantly longer in KIA- neurons compared to
control neurons (* = p< 0.01). D. Firing rate to each broad-band burst was lower in KIA-
neurons as compared to controls at all four presentation rates (* = p< 0.01). E. Vector strength
was significantly lower in KIA- neurons at all four presentation rates (* = p< 0.01).

43
Figure 2.7. In utero RNAi of Kiaa0319 caused impaired neural firing to tonal stimuli. A.
Spontaneous levels in RNAi rats were higher than controls (* = p<0.01). Similar to speech and
noise-burst stimuli, KIA- neurons had a longer peak latency to tone stimuli compared to control
neurons (* = p< 0.01). We used only tones louder than 60 dB to plot the average response. This
cutoff ensured that the narrower bandwidths observed in KIA- recordings did not bias the
comparison. B. Average number of spikes to tones at each intensity tested. Number of spikes for
each site was counted within the 10 sites surrounding that site’s CF to account for bandwidth
difference. KIA- neurons fired more spikes to tones than control neurons at most intensities
tested (* = p< 0.01).

44
Figure 2.8. Basic neural firing impairments may contribute to poor neural classification of
phonemes. We tested groups of control neurons that mimicked the distribution of KIA- neurons
with respect to several neural firing properties. All * are p<.01. A. Several abnormal firing
properties contributed to poor consonant classification. Control neurons with a distribution of
spontaneous firing (third bar; 68 ± 1%; p<.01), peak latencies (fourth bar; 68 ± 1%; p<.01), and
bandwidths (at 20 dB above threshold, fifth bar; 68 ± 1%; p<.01) that match the KIA- sites were
significantly different than the full set of control sites on neural discrimination of consonants. B.
Abnormal spontaneous firing levels seemed to contribute to poor vowel performance. Control
neurons with a distribution of spontaneous firing rates that match the KIA- sites were
significantly different from the full set of control sites on neural discrimination of vowels (57 ±
1%; p<.01).

45
Figure 2.9. Neurons with transfection of Kiaa0319 shRNA had higher membrane resistance than
controls. Four experimental groups were used in this experiment: KIAA RNAi neurons
expressed the Kiaa0319 shRNA transgene, KIAA OE (over expression) neurons expressed a
transgene which increased Kiaa0319 expression, Scramble neurons expressed a scrambled
shRNA, and Rescue neurons expressed both the Kiaa0319 shRNA (which reduced expression)
and a transgene to increase expression. A. KIAA RNAi neurons fired significantly more action
potentials per pA of current injection than Scramble controls (at 200pA of current, KIAA RNAi
neurons fire 5.5 ± 1 spike vs.0 .5 ± 0.5 spikes in controls; * = p< 0.01). B. Example voltage
traces from one KIAA RNAi neuron and two control neurons. In response to current injection,
membrane

46
Figure 2.9 continued…
potential of KIAA RNAi neurons changed more drastically and fired more action potentials than
Scramble controls. C. Input resistance function for all four experimental groups tested. For each
pA of current injected, the membrane potential of KIAA RNAi neurons changed significantly
more than control groups (at 100 pA of current, KIAA RNAi membrane potential changed by
18.4 ± 3.6 mV versus 8.1 ± 1.1 mV in controls; * = p=0.02). D. KIAA RNAi neurons had a
higher membrane resistance than scramble control neurons (193.7 ± 25.3 Mohm in KIA- cells vs.
103.6 ± 21.4 Mohm in scramble control; * = p= 0.01). KIAA OE and Rescue controls did not
have increased membrane resistance (* = p= 0.05).

47
REFERENCES
Ahissar M, Protopapas A, Reid M, Merzenich MM. 2000. Auditory processing parallels reading
abilities in adults. Proceedings of the National Academy of Sciences 97(12):6832.
Badian NA. 1999. Reading disability defined as a discrepancy between listening and reading
comprehension: a longitudinal study of stability, gender differences, and prevalence.
Journal of Learning Disabilities, 32: 138-48.
Bai J, Ramos RL, Paramasivam M, Siddiqi F, Ackman JB, LoTurco JJ. 2008. The role of DCX
and LIS1 in migration through the lateral cortical stream of developing forebrain. Dev
Neurosci 30(1-3):144-56.
Bai J, Ramos RL, Ackman JB, Thomas AM, Lee RV, LoTurco JJ. 2003. RNAi reveals
doublecortin is required for radial migration in rat neocortex. Nat Neurosci 6(12):1277-83.
Bates TC, Luciano M, Medland SE, Montgomery GW, Wright MJ, Martin NG. 2011. Genetic
variance in a component of the language acquisition device: ROBO1 polymorphisms
associated with phonological buffer deficits. Behav Genet 41(1):50-7.
Blau V., Reithler J., Van Atteveldt N., Seitz J., Gerretsen P., Goebel R., Blomert L. 2010.
Deviant processing of letters and speech sounds as proximate cause of reading failure: a
magnetic resonance imaging study of dyslexic children. Brain 133(3): 868-879.
Boscariol M, Guimarães CA, Hage SRV, Cendes F, Guerreiro MM. 2010. Temporal auditory
processing: Correlation with developmental dyslexia and cortical malformation. Pró-Fono
Revista De Atualização Científica 22(4):537-42.
Burbridge TJ, Wang Y, Volz AJ, Peschansky VJ, Lisann L, Galaburda AM, Lo Turco J, Rosen
GD. 2008. Postnatal analysis of the effect of embryonic knockdown and overexpression of
candidate dyslexia susceptibility gene homolog Dcdc2 in the rat. Neuroscience 152(3):723-
33.
Cardon LR, Smith SD, Fulker DW, Kimberling WJ, Pennington BF, DeFries JC. 1994.
Quantitative trait locus for reading disability on chromosome 6. Science 266(5183): 276-
279.

48
Chandrasekaran B, Hornickel J, Skoe E, Nicol T, Kraus N. 2009. Context-dependent encoding in
the human auditory brainstem relates to hearing speech in noise: implications for
developmental dyslexia. Neuron 64(3): 311-319.
Cope N, Harold D, Hill G, Moskvina V, Stevenson J, Holmans P, Owen MJ, O’Donovan MC,
Williams J. 2005. Strong evidence that KIAA0319 on chromosome 6p is a susceptibility
gene for developmental dyslexia. The American Journal of Human Genetics 76(4):581-91.
Creutzfeldt O, Ojemann G, Lettich E. 1989. Neuronal activity in the human lateral temporal
lobe. Experimental Brain Research 77(3):451-75.
Darki F., Peyrard-Janvid M., Matsson H., Kere J., Klingberg T. 2012. Three dyslexia
susceptibility gened, DYX1C1, DCDC2, and KIAA0319, affect temporo-parietal white
matter structure. Biol Psychiatry 72(8): 671-6.
Deffenbacher KE, Kenyon JB, Hoover DM, Olson RK, Pennington BF, DeFries JC, Smith SD.
2004. Refinement of the 6p21. 3 quantitative trait locus influencing dyslexia: Linkage and
association analyses. Hum Genet 115(2):128-38.
Dennis MY, Paracchini S, Scerri TS, Prokunina-Olsson L, Knight JC, Wade-Martins R, Coggill
P, Beck S, Green ED, Monaco AP. 2009. A common variant associated with dyslexia
reduces expression of the KIAA0319 gene. PLoS Genet 5(3): e1000436.
doi:10.1371/journal.pgen.1000436
Díaz B, Hintz F, Kiebel SJ, von Kriegstein K. 2012. Dysfunction of the auditory thalamus in
developmental dyslexia. Proceedings of the National Academy of Sciences 109(34): 13841-
13846.
Eimas PD. 1985. The perception of speech in early infancy. Sci Am 252(1):34-40.
Eimas PD. 1975. Auditory and phonetic coding of the cues for speech: Discrimination of the [rl]
distinction by young infants. Attention, Perception, & Psychophysics 18(5):341-7.
Engineer CT, Perez CA, Chen YTH, Carraway RS, Reed AC, Shetake JA, Jakkamsetti V, Chang
KQ, Kilgard MP. 2008. Cortical activity patterns predict speech discrimination ability. Nat
Neurosci 11(5):603-8.
Engineer ND, Engineer CT, Reed AC, Pandya PK, Jakkamsetti, V, Moucha R, Kilgard MP.
2012. Inverted-U function relating cortical plasticity and task difficulty. Neuroscience
205:81-90.
Fisher SE and DeFries JC. 2002. Developmental dyslexia: Genetic dissection of a complex
cognitive trait. Nature Reviews Neuroscience 3(10):767-80.

49
Floody OR, Ouda L, Porter BA, Kilgard MP. 2010. Effects of damage to auditory cortex on the
discrimination of speech sounds by rats. Physiol Behav 101(2):260-8.
Flowers DL, Wood FB, Naylor CE. 1991. Regional cerebral blood flow correlates of language
processes in reading disability. Arch Neurol 48(6):637.
Foffani G., Moxon KA. 2005. Studying the role of spike timing in ensembles of neurons. Neural
engineering, 2005. conference proceedings. 2nd international IEEE EMBS conference
onIEEE. 206 p.
Foffani G., Moxon KA. 2004. PSTH-based classification of sensory stimuli using ensembles of
single neurons. J Neurosci Methods 135(1):107-20.
Francks C, Paracchini S, Smith SD, Richardson AJ, Scerri TS, Cardon LR, Marlow AJ, MacPhie
IL, Walter J, Pennington BF, Fisher SE, Olson RK, DeFries JC, Stein JF, Monaco AP.
2004. A 77-kilobase region of chromosome 6p22.2 is associated with dyslexia in families
from the united kingdom and from the united states. Am J um Genet. 75(6): 1046-1058.
Friesen LM, Shannon RV, Baskent D, Wang X. 2001. Speech recognition in noise as a function
of the number of spectral channels: Comparison of acoustic hearing and cochlear implants.
J Acoust Soc Am 110:1150.
Gaab N, Gabrieli JDE, Deutsch GK, Tallal P, Temple E. 2007. Neural correlates of rapid
auditory processing are disrupted in children with developmental dyslexia and ameliorated
with training: an fMRI study. Restorative Neurology and Neuroscience 25:295-310.
Galaburda AM, LoTurco J, Ramus F, Fitch RH, Rosen GD. 2006. From genes to behavior in
developmental dyslexia. Nat Neurosci 9(10):1213-7.
Habib M, Rey V, Daffaure V, Camps R, Espesser R, Joly-Pottuz B, Démonet JF. 2002.
Phonological training in children with dyslexia using temporally modified speech: A three-
step pilot investigation. International Journal of Language & Communication Disorders
37(3):289-308.
Hack M, Breslau N, Weissman B, Aram D, Klein N, Borawski E. 1991. Effect of very low birth
weight and subnormal head size on cognitive abilities at school age. N Engl J Med 325:
231-237.
Hari R., Kiesilä P. 1996. Deficit of temporal auditory processing in dyslexic adults. Neurosci
Lett 205(2):138-40.
Hari R, Valta M, Uutela K. 1999. Prolonged attentional dwell time in dyslexic adults.
Neuroscience Letters 271: 202-204.

50
Harold D, Paracchini S, Scerri T, Dennis M, Cope N, Hill G, Moskvina V, Walter J, Richardson
A, Owen M. 2006. Further evidence that the KIAA0319 gene confers susceptibility to
developmental dyslexia. Mol Psychiatry 11(12):1085-91.
Helenius P, Uutela K, Hari R. 1999. Auditory stream segregation in dyslexic adults. Brain
122(5):907-13.
Huss M, Verney JP, Fosker T, Mead N, Goswami U. 2011. Music, rhythm, rise time perception
and developmental dyslexia: Perception of musical meter predicts reading and phonology.
Cortex 47(6):674-89.
Kawahara H. 1997. Speech representation and transformation using adaptive interpolation of
weighted spectrum: Vocoder revisited. Acoustics, speech, and signal processing, 1997.
ICASSP-97., 1997 IEEE international conference onIEEE. 1303 p.
Kidd T, Brose K, Mitchell KJ, Fetter RD, Tessier-Lavigne M, Goodman CS, Tear G. 1998.
Roundabout controls axon crossing of the CNS midline and defines a novel subfamily of
evolutionarily conserved guidance receptors. Cell 92(2): 205-215.
Kraus N, McGee TJ, Carrell TD, Zecker SG, Nicol TG, Koch DB. 1996. Auditory
neurophysiologic responses and discrimination deficits in children with learning problems.
Science 273(5277):971-3.
Kujala T, Myllyviita K, Tervaniemi M, Alho K, Kallio J, Näätänen R. 2000. Basic auditory
dysfunction in dyslexia as demonstrated by brain activity measurements. Psychophysiology
37(2):262-6.
Lamminmäki S, Massinen S, Nopola-Hemmi J, Kere J, Hari R. 2012. Human ROBO1 regulates
interaural interaction in auditory pathways. The Journal of Neuroscience 32(3): 966-971.
Lehongre K, Ramus F, Villiermet N, Schwartz D, Giraud AL. 2011. Altered low-gamma
sampling in auditory cortex accounts for the three main facets of dyslexia. Neuron
72(6):1080-90.
Lorenzi C. 2000. Use of temporal envelope cues by children with developmental dyslexia.
Journal of speech, language, and hearing research 43(6): 1367-1379.
Lovio R., Näätänen R., Kujala T. 2010. Abnormal pattern of cortical speech feature
discrimination in 6-year-old children at risk for dyslexia. Brain Research 1335: 53-62.
Lovio R, Halttunen A, Lyytinen H, Näätänen R., Kujala T. 2012. Reading skill and neural
processing accuracy improvement after a 3-hour intervention in preschoolers with
difficulties in reading-related skills. Brain Research 1448:42-55.

51
Luciano M, Lind PA, Duffy DL, Castles A, Wright MJ, Montgomery GW, Martin NG, Bates
TC. 2007. A haplotype spanning KIAA0319 and TTRAP is associated with normal variation
in reading and spelling ability. Biological Psychiatry 62(7): 811-817.
Maher BJ, McGinley MJ, Westbrook GL. 2009. Experience-dependent maturation of the
glomerular microcircuit. Proc Natl Acad Sci USA 106: 16865-16870.
Manis FR, McBride-Chang C, Seidenberg MS, Keating P, Doi LM, Munson B, Petersen A.
1997. Are speech perception deficits associated with developmental dyslexia? J Exp Child
Psychol 66(2):211-35.
Martino SD, Espesser R, Rey V, Habib M. 2001. The “temporal processing deficit” hypothesis in
dyslexia: New experimental evidence. Brain Cogn 46(1-2):104-8.
McAnally KI, Stein JF. 1996. Auditory temporal coding in dyslexia. Proc. R. Soc. Lond.
263(1371): 961-965.
McLean, G.M.T., Stuart, G.W., Coltheart, V., Casltes, A. 2011. Visual temporal processing in
dyslexia and the magnocellular deficit theory: the need for speed? Journal of Experimental
Psychology: Human Perception and Performance, 37(6): 1957-1975.
Meaburn, E. L., Harlaar, N., Craig, I. W., Schalkwyk, L. C., Plomin, R. 2007. Quantitative trait
locus association scan of early reading disability and ability using pooled DNA and 100K
SNP microarrays in a sample of 5760 children. Molecular psychiatry, 13(7): 729-740.
Mesgarani N, David SV, Fritz JB, Shamma SA. 2008. Phoneme representation and classification
in primary auditory cortex. J Acoust Soc Am 123:899.
Miles TR, Haslum MN. 1986. Dyslexia: anomaly or normal variation? Annals of Dyslexia 36(1):
103-117.
Miller GA and Nicely PE. 1955. An analysis of perceptual confusions among some english
consonants. J Acoust Soc Am 27:338.
Näätäneiv R, Lehtokoski A, Lennest M, Luuki A, Alliki J, Sinkkonen J, Alho K. 1997.
Language-specific phoneme representations revealed by electric and magnetic brain
responses. .
Nagarajan S, Mahncke H, Salz T, Tallal P, Roberts T, Merzenich MM. 1999. Cortical auditory
signal processing in poor readers. Proceedings of the National Academy of Sciences
96(11):6483.

52
Nagarajan S, Mahncke H, Poeppel D, Robert T, Tallel P, Merzenich M. 1998. Neuromagnetic
evidence for deficits in temporal ordering of brief tones by adult dyslexics. Cognitive
Neuroscience Society.
Nöthen MM, Schulte-Körne G, Grimm T, Cichon S, Vogt I, Müller-Myhsok B, Propping P,
Remschmidt H. 1999. Genetic linkage analysis with dyslexia: Evidence for linkage of
spelling disability to chromosome 15. Eur Child Adolesc Psychiatry 8:56-9.
Overy K. 2003. Dyslexia and music. Ann N Y Acad Sci 999(1):497-505.
Paracchini S, Thomas A, Castro S, Lai C, Paramasivam M, Wang Y, Keating BJ, Taylor JM,
Hacking DF, Scerri T. 2006. The chromosome 6p22 haplotype associated with dyslexia
reduces the expression of KIAA0319, a novel gene involved in neuronal migration. Hum
Mol Genet 15(10):1659-66.
Paulesu E, Frith U, Snowling M, Gallagher A, Morton J, Frackowiak RSJ, Frith CD. 1996. Is
developmental dyslexia a disconnection syndrome? evidence from PET scanning. Brain
119(1):143-57.
Pennington BF, Gilger JW, Pauls D, Smith SA, Smith SD, DeFries JC. 1991. Evidence for major
gene transmission of developmental dyslexia. JAMA: The Journal of the American Medical
Association 266(11):1527-34.
Perez CA, Engineer CT, Jakkamsetti V, Carraway RS, Perry MS, Kilgard MP. 2012. Different
timescales for the neural coding of consonant and vowel sounds. Cerebral Cortex .
Peschansky VJ, Burbridge TJ, Volz AJ, Fiondella C, Wissner-Gross Z, Galaburda AM, Turco
JJL, Rosen GD. 2010. The effect of variation in expression of the candidate dyslexia
susceptibility gene homolog KIAA0319 on neuronal migration and dendritic morphology in
the rat. Cerebral Cortex 20(4):884-97.
Peterson, R.L., Pennington, B.F. 2012. Developmental dyslexia. The Lancet. 379(9830): 1997-
2007.
Pinel P, Fauchereau F, Moreno A, Barbot A, Lathrop M, Zelenika D, Le Bihan D, Poline JB,
Bourgeron T, Dehaene S. 2012. Genetic variants of FOXP2 and
KIAA0319/TTRAP/THEM2 locus are associated with altered brain activation in distinct
language-related regions. The Journal of Neuroscience 32(3):817-25.
Poelmans H, Luts H, Vandermosten M, Boets B, Ghesquière P, Wouters J. 2012. Auditory
steady state cortical responses indicate deviant phonemic-rate processing in adults with
dyslexia. Ear Hear 33(1):134.

53
Poon MW, Tsang WH, Waye MM, Chan SO. 2011a. Distribution of KIAA0319-like
immunoreactivity in the adult mouse brain-- a novel protein encoded by the putative
dyslexia susceptibility gene KIAA)319-like. Histol Histopathol. 26(8): 953-63.
Poon MW, Tsang WH, Chan SO, Li HM, Ng HK, Waye MMY. 2011b. Dyslexia-associated
KIAA0319-Like protein interacts with axon guidance receptor Nogo Receptor 1. Cellular
and Molecular Neurobiology 31(1):27-35.
Porter BA, Rosenthal TR, Ranasinghe KG, Kilgard MP. 2011. Discrimination of brief speech
sounds is impaired in rats with auditory cortex lesions. Behav Brain Res 219(1):68-74.
Ramus F, Rosen S, Dakin SC, Day BL, Castellote JM, White S, Frith U. 2003. Theories of
developmental dyslexia: insights from a multiple case study of dyslexic adults. Brain 126:
841-865.
Ranasinghe KG, Vrana WA, Matney CJ, Kilgard MP. 2012a. Neural mechanisms supporting
robust discrimination of spectrally and temporally degraded speech. JARO-Journal of the
Association for Research in Otolaryngology :1-16.
Ranasinghe KG, Carraway RS, Borland MS, Moreno NA, Hanacik EA, Miller RS, Kilgard MP.
2012b. Speech discrimination after early exposure to pulsed-noise or speech. Hear Res .
Rennaker R, Street S, Ruyle A, Sloan A. 2005a. A comparison of chronic multi-channel cortical
implantation techniques: Manual versus mechanical insertion. J Neurosci Methods
142(2):169-76.
Rennaker R, Ruyle A, Street S, Sloan A. 2005b. An economical multi-channel cortical electrode
array for extended periods of recording during behavior. J Neurosci Methods 142(1):97-
105.
Roeske, D., Ludwig, K. U., Neuhoff, N., Becker, J., Bartling, J., Bruder, J., Brockschmidt, F.F.,
Warnke, A., Remschmidt, H., Hoffmann, P., Müller-Myhsok, B., Nöthen, M.M., Schulte-
Körne, G. 2009. First genome-wide association scan on neurophysiological endophenotypes
points to trans-regulation effects on SLC2A3 in dyslexic children. Molecular
psychiatry, 16(1): 97-107.
Rosen, S. 2003. Auditory processing in dyslexia and specific language impairment: Is there a
deficit? What is its nature? Does it explain anything?.Journal of Phonetics, 31(3): 509-527.
Rumsey JM, Andreason P, Zametkin AJ, Aquino T, King AC, Hamburger SD, Pikus A,
Rapoport JL, Cohen RM. 1992. Failure to activate the left temporoparietal cortex in
dyslexia: An oxygen 15 positron emission tomographic study. Arch Neurol 49(5):527.
54
Rumsey J, Horwitz B, Donohue B, Nace K, Maisog J, Andreason P. 1997. Phonological and
orthographic components of word recognition. A PET-rCBF study. Brain 120(5):739-59.
Russo NM, Nicol TG, Zecker SG, Hayes EA, Kraus N. 2004. Auditory training improves neural
timing in the human brainstem. Behavioral Brain Research 156(1):95-103.
Scerri TS, Morris AP, Buckingham LL, Newbury DF, Miller LL, Monaco AP, Bishop DVM,
Paracchini S. 2011. DCDC2, KIAA0319 and CMIP are associated with reading-related
traits. Biological Psychiatry 70(3):237-245.
Schulte-Körne G, Deimel W, Bartling J, Remschmidt H. 2001. Speech perception deficit in
dyslexic adults as measured by mismatch negativity (MMN). International Journal of
Psychophysiology 40(1):77-87.
Schumacher J, Anthoni H, Dahdouh F, König IR, Hillmer AM, Kluck N, Manthey M, Plume E,
Warnke A, Remschmidt H. 2006. Strong genetic evidence of DCDC2 as a susceptibility
gene for dyslexia. The American Journal of Human Genetics 78(1):52-62.
Shaywitz, SE., Bennett BA., Fletcher JM., Escobar MD. 1990. Prevalence of reading disability in
boys and girls, results of the Connecticut longitudinal study. JAMA, 264(8):998-1002.
Shaywitz, SE., Escobar, MD., Shaywitz, B.A., Fletcher, J.M., Makuch, R. 1992. Evidence that
dyslexia may represent the lower tail of a normal distribution of reading ability. New
England Journal of Medicine, 326:145-150.
Shetake JA, Wolf JT, Cheung RJ, Engineer CT, Ram SK, Kilgard MP. 2011. Cortical activity
patterns predict robust speech discrimination ability in noise. Eur J Neuroscience 34:1823-
38.
Steinschneider M, Volkov IO, Noh MD, Garell PC, Howard III MA. 1999. Temporal encoding
of the voice onset time phonetic parameter by field potentials recorded directly from human
auditory cortex. J Neurophysiol 82(5):2346-57.
Steinschneider M, Volkov IO, Fishman YI, Oya H, Arezzo JC, Howard III MA. 2005.
Intracortical responses in human and monkey primary auditory cortex support a temporal
processing mechanism for encoding of the voice onset time phonetic parameter. Cerebral
Cortex 15(2):170-86.
Szalkowski CE, Fiondella CG, Galaburda AM, Rosen GD, LoTurco JJ, Fitch RH. 2012.
Neocortical disruption and behavioral impairments in rats following in utero RNAi of
candidate dyslexia risk gene KIAA0319. International Journal of Developmental
Neuroscience .

55
Tallal P. 1980. Auditory temporal perception, phonics, and reading disabilities in children. Brain
Lang 9(2):182-98.
Tallal P and Piercy M. 1974. Developmental aphasia: Rate of auditory processing and selective
impairment of consonant perception. Neuropsychologia 12(1):83-93.
Temple E, Deutsch GK, Poldrack RA, Miller SL, Tallal P, Merzenich MM, Gabrieli JDE. 2003.
Neural deficits in children with dyslexia ameliorated by behavioral remediation: Evidence
from functional MRI. Proceedings of the National Academy of Sciences 100(5):2860.
Temple E, Poldrack RA, Salidis J, Deutsch GK, Tallal P, Merzenich MM, Gabrieli JDE. 2001.
Disrupted neural responses to phonological and orthographic processing in dyslexic
children: An fMRI study. Neuroreport 12(2):299.
Temple E, Poldrack R, Salidis J, Deutsch G, Merzenich M, Talla P, Gabrieli J. Functional
magnetic resonance imaging (fMRI) of developmental dyslexia: Neural response to
linguistic and nonlinguistic stimuli in dyslexic children. .
Threlkeld SW, McClure MM, Bai J, Wang Y, LoTurco JJ, Rosen GD, Fitch RH. 2007.
Developmental disruptions and behavioral impairments in rats following in utero RNAi of
Dyx1c1. Brain Res Bull 71(5):508-14.
Tonnquist-Uhlen I. 1996. Topography of auditory evoked long-latency potentials in children
with severe language impairment: The P2 and N2 components. Ear Hear 17(4):314.
Tremblay KL, Kraus N. 2002. Auditory training induces asymmetrical changes in cortical neural
activity. Journal of Speech, Language, and Hearing Research. 45: 564-572.
Vandermosten M, Boets B, Luts H, Poelmans H, Golestani N, Wouters J, Ghesquière P. 2010.
Adults with dyslexia are impaired in categorizing speech and nonspeech sounds on the basis
of temporal cues. Proceedings of the National Academy of Sciences 107(23):10389.
Velayos-Baeza A, Toma C, Paracchinie S, Monaco AP. 2008. The dyslexia-associated gene
KIAA0319 encodes highly N- and O-glycosylated plasma membrane and secreted isoforms.
Hum. Mol. Genet. 17(6):859-71.
Velayos-Baeza A, Levecque C, Kobayashi K, Holloway ZG, Monaco AP. 2010. The dyslexia-
associated KIAA0319 protein undergoes proteolytic processing with ƴ-secretase-
independent intramembrane cleavage. Journal of Biological Chemistry 285(51): 40148-62.
Werker JF and Tees RC. 1987. Speech perception in severely disabled and average reading
children. Canadian Journal of Psychology/Revue Canadienne De Psychologie 41(1):48.

56
Wible B, Nicol T, Kraus N. 2002. Abnormal neural encoding of repeated speech stimuli in noise
in children with learning problems. Clinical Neurophysiology 113(4): 485-494.
Wright BA, Lombardino LJ, King WM, Puranik CS, Leonard CM, Merzenich MM. 1997.
Deficits in auditory temporal and spectral resolution in language-impaired children.
Ziegler JC, Pech-Georgel C, George F, Lorenzi C. 2009. Speech-perception-in-noise deficits in
dyslexia. Developmental Science 12(5):732-745.

57
CHAPTER 3
CORTICAL SPEECH-EVOKED RESPONSE PATTERNS IN MULTIPLE AUDITORY
FIELDS ARE CORRELATED WITH BEHAVIORAL DISCRIMINATION ABILITY
Authors- Tracy M. Centanni, Crystal T. Engineer, and Michael P. Kilgard
School of Behavioral and Brain Sciences, GR41
The University of Texas at Dallas
800 W. Campbell Road
Richardson, Texas, 75080-3021
58
ABSTRACT
Different speech sounds evoke unique patterns of activity in primary auditory cortex (A1).
Behavioral discrimination by rats is well correlated with the distinctness of the A1 patterns
evoked by individual consonants, but only when precise spike timing is preserved. In this study
we recorded the speech evoked responses in the primary, anterior (AAF), ventral (VAF), and
posterior (PAF) auditory fields of the rat and evaluated whether activity in these fields is better
correlated with speech discrimination ability when spike timing information is included or
eliminated. Spike timing information improved consonant discrimination in all four of the
auditory fields examined. Behavioral discrimination was significantly correlated with neural
discrimination in all four auditory fields. The diversity of speech responses across recordings
sites was greater in PAF and VAF compared to A1 and AAF. These results suggest that while the
various auditory fields of the rat process speech sounds differently, neural activity in each field
could be used to distinguish between consonant sounds with accuracy that closely parallels
behavioral discrimination. Earlier observations in the visual and somatosensory systems that
cortical neurons do not rely on spike timing should be reevaluated with more complex natural
stimuli to determine whether spike timing contributes to sensory encoding.

59
INTRODUCTION
Primary auditory cortex (A1) encodes consonant sounds using precise spike timing information
within 1-50 ms bins (Engineer et al. 2008; Perez et al. 2012; Ranasinghe et al. 2012a;
Ranasinghe et al. 2012b; Schnupp et al. 2006a; Shetake et al. 2011; Wang et al. 1995). This
precision generates unique patterns of activity across the tonotopic organization of this field. For
example, in rat A1, the consonant sound /d/ causes an evoked response from neurons tuned to
high frequencies first (higher than ~7 kHz), followed by a response from neurons tuned to lower
frequencies after a short delay of ~20 ms. The consonant sound /b/ causes the opposite pattern
such that low frequency neurons fire first, followed by higher frequency neurons. To account for
the shifted audiogram of the rat, these stimuli are shifted up by an octave and the firing
differences across frequency groups reflect the frequency information in the stimuli (Engineer et
al. 2008; also see Figure 3.1). Each consonant sound evokes a unique pattern of activity and the
difference in these responses can be used to identify the evoking stimulus using a pattern
classifier (Engineer et al. 2008; Perez et al. 2012; Ranasinghe et al. 2012b; Shetake et al. 2011;
Foffani and Moxon 2004).
The uniqueness of these patterns is correlated with behavioral ability of rats in a wide
range of tasks. Rats are able to discriminate human speech sounds in quiet (Engineer et al. 2008;
Perez et al. 2012), background noise (Shetake et al. 2011), and after spectral or temporal
degradation (Ranasinghe et al. 2012b). The neural responses in primary auditory cortex can
predict behavioral ability in all of these tasks using a Euclidean distance classifier. Sounds that
create contrasting patterns of activity, such as the opposite patterns evoked by /b/ and /d/,
correspond to pairs of sounds that are more easily discriminated by rats (Engineer et al. 2008;

60
Ranasinghe et al. 2012a; Ranasinghe et al. 2012b; Shetake et al. 2011). Pairs of sounds that have
similar spectrotemporal profiles, such as /r/ and /l/, cause similar neural responses and are more
difficult for rats to behaviorally discriminate (Engineer et al. 2008). Degraded stimuli, like those
caused by the addition of background noise or a vocoder, can cause delayed and/or weakened
neural responses. The more severe the degradation to the neural response patterns, the more
impaired the rats were at the corresponding behavior task (Ranasinghe et al. 2012b; Shetake et
al. 2011). The preservation of the spike timing information is crucial to these correlations; if
spike timing information is removed, no tasks are correlated with the differences in patterns of
neural activity (Engineer et al. 2008; Ranasinghe et al. 2012a; Ranasinghe et al. 2012b; Shetake
et al. 2011).
Other sensory systems appear to rely predominantly on spike rate, rather than spike
timing for discrimination, especially in sensory fields higher up in their respective pathways. In
the visual system, the primary visual cortex relies on precise spike timing to discriminate
between stimuli that evoke similar number of spikes (Montemurro et al. 2008). As the
information is passed to higher level regions, neurons begin to use spike rate information rather
than spike timing to make behavioral decisions. For example, when monkeys were asked to
identify the direction of motion of a visual stimulus after a delay, the rate of firing in the
posterior parietal cortex predicted the behavioral decision of the subject (Shadlen and Newsome
2001; Shadlen and Newsome 1996). The somatosensory system functions in a similar manner.
For example, when monkeys were trained to detect whether the rate of two tactile vibrations
were the same, high level areas of the somatosensory system perform the task by comparing the
firing rate of neurons to each stimulus (Romo and Salinas 2003). A well-received theory states

61
that temporal information is consistently transformed into a rate code as the information moves
up the appropriate neural network (Ahissar et al. 2000). This is plausible in the auditory system
as well (Buonomano and Merzenich 1995; Wang et al. 2008). The current study was designed to
test the theory that neural responses to consonant speech sounds would also undergo a
transformation throughout the auditory pathway. Early auditory cortex requires precise spike
timing information to encode consonant sounds (Centanni et al. 2013; Engineer et al. 2008;
Ranasinghe et al. 2012a; Ranasinghe et al. 2012b; Shetake et al. 2011), while vowel stimuli rely
on spike rate, even at this early sensory level (Perez et al. 2012). We therefore used consonant
stimuli in the current study to answer the following question: Do auditory fields higher in the
auditory pathway than A1 use spike timing or spike rate to encode and discriminate consonant
speech sounds?
METHODS
Anesthetized recordings
We acquired 1,253 multiunit recordings from the auditory cortex of 15 experimentally
naïve rats. The recording procedure is explained in detail elsewhere (Engineer et al. 2008). In
brief, animals were anesthetized with pentobarbital (50 mg kg-1
) and given supplemental dilute
pentobarbital (8 mg ml-1
) as needed to maintain areflexia, along with fluids to prevent
dehydration. A tracheotomy was performed to ensure ease of breathing throughout the
experiment. Primary auditory cortex and several nearby auditory fields were exposed via
craniotomy and durotomy. Four Parylene-coated tungsten microelectrodes (1-2 MΩ) were
simultaneously lowered to layer IV/V of either left or right auditory cortex (~600-800 µm).

62
Responses were collected in four auditory fields; primary auditory cortex (A1), anterior auditory
field (AAF), posterior auditory field (PAF) and ventral auditory field (VAF). These fields are
widely considered core regions in the rat (Doron et al. 2002; Polley et al. 2006; Storace et al.
2010), but recent evidence suggests that these fields receive input from more than one thalamic
region, which may suggest a hierarchical organization (Smith et al. 2012; Storace et al. 2012).
Brief (25 ms) tones with 5 ms ramps were presented at 90 randomly interleaved frequencies (1-
48 kHz) at 16 intensities (0- 75 dB SPL) to determine the characteristic frequency of each site.
We also presented 7 English consonant-vowel-consonant (CVC) speech sounds (/dad/, /sad/,
/tad/, /bad/, /gad/, /shad/, and /chad/) previously tested in our lab (Engineer et al. 2008;
Ranasinghe et al. 2012b; Shetake et al. 2011; Floody et al. 2010). The speech stimuli were
randomly interleaved and presented at 20 repeats per recording site. Sounds were shifted up 1
octave into the rat hearing range using the STRAIGHT vocoder (Kawahara 1997; Figure 3.1).
Each sound was calibrated with respect to its length so that the most intense 100 ms of the
stimulus length was heard at 60 dB SPL. All sounds were presented approximately 10 cm from
the contralateral ear of the rat. As the effect of speaker location was beyond the scope of our
study, the speaker was always located outside of the pinna and aimed directed into the ear canal.
With this configuration, the sound level was always greater to the contralateral ear (which
corresponded to our recording sites) versus the ipsilateral ear.
Neural data analysis
To define the borders between auditory fields, recording sites were analyzed to select the
characteristic frequency of each site, as well as to obtain bandwidth, latency, peak firing and end
of peak response information. Firing latency is defined as the point in time (ms) that average

63
firing rate (across all repeats) first crosses two standard deviations above the spontaneous firing
rate, threshold is defined as the lowest intensity that evoked a response from the multiunit site,
and bandwidths were calculated at 10, 20, 30 and 40 dB above threshold and defined as the range
of frequencies that evoked responses at the current intensity. Each field was defined as
established in the literature, using characteristic frequency gradients, gradient reversals, and
tuning curve properties (Doron et al. 2002; Higgins et al. 2010; Pandya et al. 2008; Polley et al.
2006). A1 sites were defined as having sharp tuning, short onset latency (between 10-20 ms from
tone onset), high firing rate (100 Hz or greater), and organized tonotopically so that characteristic
frequencies (CFs) ranged from low to high in a posterior-anterior direction. AAF sites were
defined using the same parameters as A1, but with a reversed tonotopy, such that CFs ranged
from low to high in an anterior-posterior direction. The VAF field was located anatomically
between AAF and A1. We first located the tonotopic gradient reversal at the edges of AAF and
A1. Next, sites were analyzed for whether or not they exhibited non-monotonic features. Non-
monotonic sites were defined as sites in which the response bandwidth at 40 dB above threshold
was not wider than responses 30 dB quieter. VAF as a field also had a higher average
characteristic frequency as compared to the other fields (Polley et al. 2006). PAF sites were
defined as having long onset latency (greater than 30 ms) and broad tuning curves and were
located immediately posterior to A1. These methods of defining site boundaries are consistent
with previous work in rodent models (Doron et al. 2002; Higgins et al. 2010; Pandya et al. 2008;
Polley et al. 2006). Out of the 1,253 sites we acquired, 1,116 of these were included in the
subsequent analyses.

64
Single trial response patterns to each of the isolated speech sounds were compared using
a nearest neighbor classifier (Engineer et al. 2008; Perez et al. 2012; Popescu and Polley 2010;
Ranasinghe et al. 2012a; Ranasinghe et al. 2012a; Ranasinghe et al. 2012b; Shetake et al. 2011;
Foffani and Moxon 2004; Foffani and Moxon 2005). We used Euclidean distance to compare
single trial activity from 5 random sites to the average post-stimulus time histogram (PSTH)
template evoked by 19 repeats each of two different stimuli. Activity was binned using 1 ms
temporal precision over a 40 ms window to encompass the spike timing precision present in the
initial consonant (Engineer et al. 2008; Ranasinghe et al. 2012b; Porter et al. 2011). The
classifier then compared the response of each single trial with the average activity template
(PSTH) evoked by all repeats of each of the speech stimuli presented. The current trial being
considered was not included in the PSTH to avoid artifact. The classifier attempted to identify
the stimulus that evoked the current single trial activity pattern by selecting the template that was
closest to the single trial in units of Euclidean distance. ED is calculated using the formula:
where #sites is each recording site and #bins is each of 40 one-millisecond bins being compared
between activity evoked by speech sound X versus speech sound Y. We chose Euclidean
distance as our metric for two reasons. First, it is a well established metric for this type of neural
classification (Engineer et al. 2008; Perez et al. 2012; Popescu and Polley 2010; Ranasinghe et
al. 2012a; Ranasinghe et al. 2012a; Ranasinghe et al. 2012b; Shetake et al. 2011; Foffani and
Moxon 2004; Foffani and Moxon 2005). Second, this metric is inherently resistant to variations
in spike rate. Since some auditory fields fire fewer spikes to auditory stimuli than others, we

65
wanted to ensure that this variable was accounted for in evaluating the neural encoding ability of
various auditory fields. We ran the classifier so that each site was included in the classifier
analysis at least once (i.e. the classifier ran once for each site recorded) and performance was
calculated as the average performance across all classifier runs. For example, the classifier ran
399 times to evaluate every A1 site, 303 times to evaluate every AAF site, and so on. We used an
ANOVA and t-tests to compare the accuracy of the classifier across all auditory fields. When
appropriate, a Bonferroni correction was used to correct for multiple comparisons.
We then compared speech-evoked neural responses between pairs of sites in each field
that had characteristic frequencies within 1/4 octave. This analysis was designed to compare the
differences in neural responses between similarly tuned neural sites as a measure of firing
redundancy (Chechik et al. 2006; Cohen and Kohn 2011). We counted the number of evoked
spikes to each speech sound within the same 40 ms window used for the classifier. We compared
the number of spikes evoked by each sound across each pair of sites and quantified the
relationship using the correlation coefficient. When neural firing redundancy decreased, we refer
to this as an increase in diversity.
Recordings from a subset of 4 rats were mapped with a different speaker than the
remaining 11 rats (Motorola Optimus Bullet Horn Tweeter vs. TDT FF1 free field speaker). To
ensure that the speaker difference did not significantly change the quality of our neural
recordings, we compared the classifier’s performance on four consonant tasks (/dad/ vs /bad/,
/gad/, /sad/, or ‘tad) using sites from three auditory fields in male rats mapped with each speaker.
There were no significant differences in classifier performance across speaker (Optimus Bullet
66
Horn Tweeter speaker; 74.4 ± 1% correct vs. 71.2 ± 1% correct with FF1 speaker; p=0.55), so all
data was combined for analysis.
Behavioral testing
We trained 10 rats to discriminate speech sounds using an operant go/no-go procedure.
Each rat trained for two 1 hour sessions per day (5 days a week). Rats first underwent a shaping
period in which they were taught to press a lever to hear the target sound and obtain a 45 mg
sugar pellet reward. Once the rat was able to earn 100 pellets independently for two consecutive
sessions, the rat was advanced to detection. During detection, the rat learned to withhold pressing
the lever until the target sound was presented. Silent periods were randomly interleaved into the
session to serve as catch trials. Rats were initially given 8 seconds to respond to the sound and
this window was gradually decreased to 3 seconds. Once the rat achieved a d’ of 1.5 or greater
for 10 sessions, the rat was advanced to discrimination. During discrimination, the rat learned to
press the lever for a target speech sound and not press for several distracter speech sounds. A
total of 6 rats were trained to discriminate the sound /dad/ from /bad/, /gad/, /sad/, and /tad/ (data
previously published in Engineer et al., 2008) and 4 rats trained on /bad/ versus /dad/, /gad/,
/sad/, and /tad/, as well as /shad/ versus /sad/, /chad/, /dad/, and /gad/. Rats were only rewarded
for pressing the lever to their respective target sound (presented ~44% of the time). A response
to a distracter sound (presented ~44% of the time) or to a silent catch trial (presented ~11% of
the time) resulted in a time out in which the cage lights were extinguished and the program
paused for 6 seconds. Each discrimination task lasted for 20 training sessions over 2 weeks.
Behavior percent correct was evaluated on the last day of training and is reported as the mean ±
sem across rats. Training took place in soundproof, double-walled booth which was lined with

67
foam to reduce noise. Inside the booth, a house light, video camera and speaker were mounted
outside an 8 x 8 x 8” cage which contained the lever and food dish. A pellet dispenser was
mounted outside the booth to reduce noise. During the experiment, rats were food deprived to
above 85% of their original body weight. Rats were housed individually and maintained on a
reverse 12-hour light-dark cycle. Behavioral percent correct for correlation with classifier
performance was calculated using data from the last day of training. All protocols and recording
procedures were approved by the University of Texas at Dallas Institutional Animal Care and
Use Committee.
RESULTS
Topographic organization of tone frequency tuning was used to identify the four auditory
fields; primary (A1), anterior (AAF), ventral (VAF), and posterior (PAF). A1 and AAF exhibited
clearly ordered frequency maps (correlation between site location and characteristic frequency
R= -0.77 and R= -0.69 respectively) while VAF and PAF did not (R= -0.05 and R= -0.37
respectively). Characteristic frequencies (CF) in A1 increased in a posterior to anterior direction,
while CFs in AAF increased in an anterior to posterior direction (Figure 3.2). Firing latency to
tones was significantly different across all four fields (one-way ANOVA, F (3, 1112) =181.51,
p<0.001; Figure 3.3). VAF had the narrowest bandwidths at 40 dB above threshold (2.4 ± 0.1
octaves), followed by A1 (2.6 ± 0.1 octaves, unpaired t-test, p<0.01), AAF (2.8 ± 0.1 octaves,
unpaired t-tests vs. A1 and VAF, p=0.01), and PAF had the longest bandwidths (3.5 ± 0.1
octaves (unpaired t-tests vs. AAF, A1, and VAF, p<0.01; Figure 3.3C). Frequency tuning and
tonotopic organization in each field was consistent with earlier reports (Polley et al. 2007;

68
Carrasco and Lomber 2011; Doron et al. 2002; Jakkamsetti et al. 2012; Pandya et al. 2008;
Puckett et al. 2007; Takahashi et al. 2011, see Methods and Figure 3.3), so we are confident that
the boundaries between fields were accurately defined. In total, we recorded from 303 multi-unit
sites in AAF, 399 sites in A1, 206 sites in VAF and 208 sites in PAF.
Neural discrimination of consonants is better when spike timing information is preserved
Neural activity from each field can be used to discriminate between consonant sounds. As
in previous studies, A1 responded to each speech sound differently (Engineer et al. 2008; Perez
et al. 2012; Ranasinghe et al. 2012a; Ranasinghe et al. 2012b; Shetake et al. 2011). We used this
classifier to test the hypothesis that other auditory fields use spike timing information to identify
speech sounds. We calculated the Euclidean distance between the single trial neural response
post stimulus time histogram (PSTH) and each of two PSTH templates created from the average
neural activity evoked by each of two sounds. The classifier then guessed which of the template
sounds likely caused the single trial pattern of activity by choosing the template which was most
similar to the single trial (i.e. had the smallest Euclidean distance; see Methods). Each run of the
classifier used multi-unit activity from one to two hundred recording sites. Classifier
performance most closely matched previously published behavioral performance of
approximately 80% correct when the classifier was given data from five randomly selected
recording sites (Engineer et al. 2008; Figure 3.4). As a result, groups of five sites were used for
all classifier analyses in this paper.
We tested the ability of neural activity in each field to discriminate all possible pairs of
the seven consonant sounds evaluated in this study and compared classifier performance when
spike timing information was preserved or removed. We preserved spike timing information by

69
analyzing the data with 1 ms temporal bins (over a 40 ms analysis window) and we removed
timing information by analyzing the data in a single 40 ms bin. The classifier performance was
significantly different when spike timing information was preserved versus when it was not
(two-way ANOVA, F (1, 1115) = 2.07, p<0.001). Across all the comparisons we used, PAF sites
were significantly worse at the neural discrimination task than A1 and AAF (t-tests with
Bonferroni correction, p<0.01; Figure 3.5). VAF performance was intermediate between AAF
and PAF and was not significantly different from either field (t-tests with Bonferroni correction;
p=0.07 and p=0.02 respectively; Figure 3.5). The classifier performed significantly better when
spike timing information was preserved in A1 responses compared to when spike timing
information was removed (1 ms bins, 94.4 ± 1.0% correct vs. a single 40 ms bin, 77.3 ± 1.5%
correct; t-test, p<0.01; Figure 3.5), which is consistent with our earlier report (Engineer et al.
2008). The three non-primary fields also performed significantly better when spike timing
information was preserved than when it was removed (AAF: 93.1 ± 1.0% v s. 72.2 ± 1.5%
correct; p<0.01, VAF: 86.2 ± 1.3% vs. 68.2 ± 1.4% correct; p<0.01, PAF: 75.2 ± 1.4% vs. 66.5 ±
1.0% correct; p<0.01, t-tests for with and without spike timing information respectively; Figure
3.5). This result is not specific to these bin sizes. As expected, the classifier performed
significantly better when spike timing information was preserved (1-10 ms bin sizes) than when
spike timing information was removed (40-100 ms bin sizes). When using AAF activity, the
classifier was significantly worse at consonant discrimination when 10 ms bins were used instead
of 1 ms bins (89.4 ± 1.4% correct with 10 ms bins vs. 93.1 ± 1.0% correct with 1 ms bins,
p=0.02). For all of the other fields, there was no significant difference in performance when 1 or
10 ms bins were used (A1: 92.2 ± 1.0% correct with 10 ms bins vs. 94.4 ± 1.0% correct with 1

70
ms bins, p=0.13; VAF: 84.3 ± 1.5% correct with 10 ms bins vs. 86.2 ± 1.3% correct with 1 ms
bins, p=0.32; PAF: 75.4 ± 1.5% correct with 10 ms bins vs. 75.2 ± 1.4% correct with 1 ms bins,
p=0.94). For each of the four auditory fields tested, these results suggest that spike timing can
provide information about consonant identity.
Activity from non-primary fields is nearly as effective as A1 in discriminating speech sounds
As expected from earlier studies (Polley et al. 2007; Carrasco and Lomber 2011; Doron et
al. 2002; Jakkamsetti et al. 2012; Pandya et al. 2008; Puckett et al. 2007; Takahashi et al. 2011),
the speech evoked responses slightly differed across the four fields. Differences in the response
properties to speech sounds were similar to the differences in the response properties to tones
(Figure 3.3). AAF and A1 fired quickly after the onset of the speech sound, /dad/ in a single
burst of activity (average latency of 14.2 ± 0.7 in AAF and 15.2 ± 0.7 ms in A1; p=0.32, Figure
3.6B&C). VAF sites responded just as quickly as AAF and A1 to the onset of each consonant
sound (14.3 ± 0.8 ms; t-tests with Bonferroni correction, p=0.39, Figure 3.6D). The onset of the
response in PAF sites was the latest of any of the fields (average latency of 18.1 ± 0.7 ms across
all speech sounds; t-test vs. A1, p<0.01). The result that VAF and PAF sites responded more
quickly to speech sounds than to tones may be due to the broader bandwidths in speech stimuli
(Barbour and Wang 2003; Petkov et al. 2006; Rauschecker and Tian 2004; Rauschecker et al.
1995). In addition, the amplitude of response to speech sounds was highest in AAF (601.8 ±
73.2 Hz), followed by A1 (556.1 ± 70.5, t-test vs. AAF, p=0.01), VAF (414.9 ± 54.0 Hz, t-test
vs. AAF and A1, p<0.01) and PAF (314.8 ± 38.2 Hz, t-tests vs. the other 3 fields, p<0.01). The
representative examples shown in black in Figure 3.6 (example sites used are outlined in black in
Figure 3.2) are sites tuned to ~10 kHz, but the general timing and strength of the response was

71
consistent across the range of characteristic frequencies in each field (average responses shown
in gray; Figure 3.6).
Here, we examined responses to consonant speech sounds in A1 and three additional non-
primary cortical fields. For example, the sound /d/ caused neurons tuned to high frequencies to
fire first, followed by lower frequency neurons after a brief delay (Figure 3.7A). The consonant
sound /g/ caused mid-frequency neurons to fire first, followed by firing from high and low
neurons milliseconds later (Figure 3.7A). The spatiotemporal response patterns to speech were
similar in AAF to those in A1 (Figure 3.7B). The apparent “blurring” of response in PAF may
be caused by broader bandwidths in this field as sites with broad bandwidths likely responded to
multiple aspects of the speech signal. In AAF and A1, some narrowly tuned sites fired to the
consonant burst while other sites fired to the vowel, while PAF neurons fired to both portions of
the stimulus signal. We hypothesized that these differences in response patterns may cause
longer latency fields to be worse at encoding speech sounds with a short voice onset time, such
as /d/ and /b/.
We calculated the similarity (using Euclidean distance) between patterns of activity
evoked by all possible pairs of consonant sounds and compared these differences across auditory
fields (Figure 3.8). In every field, the patterns of activity evoked by /dad/ and /bad/ were the least
similar (i.e. had the largest Euclidean distance value) and /sad/ and /chad/ were the most similar
(i.e. had the smallest Euclidean distance value; Figure 3.8). The difference in neural response
patterns between unvoiced consonants (/t/, /s/, /sh/, and /ch/) was higher in VAF and PAF than in
A1 (Figure 3.8B&C). The similarity between pairs of neural responses in VAF and PAF were
lower than in A1, which suggests that these two fields may be better able to discriminate

72
between these sounds. In spite of this apparent advantage, classifier performance on pairs of
unvoiced consonants was better in A1 than in VAF (90.1 ± 1.8% correct in A1 vs. 82.4 ± 2.6%
correct in VAF, p<0.02) and in PAF (69.4 ± 2.2% correct, p<0.01). As expected from previous
studies, these results did not significantly change using larger analysis windows (from stimulus
onset until between 50-300 ms later), as long as spike timing information was preserved (e.g. 1-
10 ms temporal bins; Engineer et al. 2008; Perez et al. 2012; Ranasinghe et al. 2012a;
Ranasinghe et al. 2012b; Shetake et al. 2011). These results suggest that while VAF and PAF
encode unvoiced consonant stimuli differently than A1, the information needed to discriminate
between these patterns of activity is present in all three fields. Although the auditory fields fired
to speech sounds with different latencies and bandwidths, the similarity between pairs of speech-
evoked neural responses was strongly correlated across fields (Figure 3.8, not all comparisons
shown).
Neural responses are correlated with behavioral discrimination of consonants
The similarity between speech-evoked patterns in A1 is strongly correlated with
behavioral discrimination ability in rats (Engineer et al. 2008; Perez et al. 2012; Ranasinghe et al.
2012b; Shetake et al. 2011). We hypothesized that the similarity between patterns of speech-
evoked neural responses in the three non-primary fields would also be correlated with behavior.
Neural activity from all four auditory fields was correlated with behavioral discrimination ability
of rats trained to discriminate several sets of consonant speech sounds. The highest performance
was achieved by rats trained on tasks in which /dad/ was the target (88.3 ± 2.3% correct; see
Table 3.1 for performance on each pair) and tasks in which /bad/ was the target (87.6 ± 3.7%
correct; Table 3.1), followed by tasks in which /shad/ was the target (79.1 ± 9.5% correct; Table

73
3.1). Using the 5-site classifier described above in each field (neural data recorded in untrained
rats), every field was strongly correlated with behavior (R2=0.41, p=0.02 in AAF, R
2=0.59,
p<0.01 in A1, R2=0.39, p=0.03 in VAF and R
2=0.48, p=0.01 in PAF). Classifier performance in
3 of the 4 fields was correlated when spike timing information was preserved but not when it was
removed (without spike timing in AAF, R2=0.18, p=0.16; in A1 R
2=0.28, p=0.07; and in VAF
R2=0.10, p=0.32). Classifier performance in PAF was correlated with or without spike timing
(without spike timing; R2=0.55, p<0.01). PAF neural discrimination ability was able to correlate
to rat behavioral ability without spike timing information, even though this field’s classifier
performance was significantly worse than the other fields.
Our earlier studies reported that the correlation between speech discrimination
performance and neural responses does not depend on using a classifier to perform
discrimination using neural activity (Engineer et al. 2008; Perez et al. 2012; Ranasinghe et al.
2012b; Shetake et al. 2011). The Euclidean distances between pairs of speech-evoked responses
(using all neural sites from each field) was correlated to behavioral performance (R2=0.47,
p=0.01 in AAF, R2=0.54, p=0.01 in A1, R
2=0.29, p=0.07 in VAF, and R
2=0.68; p<0.01 in PAF),
as expected from our earlier studies. The patterns of evoked activity to speech in all four auditory
areas were strongly correlated with each other and with behavioral discrimination. We
hypothesized that the slight differences in response patterns across fields may contribute
differently to the animal’s performance. We used all sites from all four fields and compared the
similarity between neural responses to pairs of consonants and behavioral ability. This meta-
ensemble was strongly correlated to behavioral performance (R2=0.46, p=0.02) but did not seem
to perform better or worse than the individual fields. Though we cannot be sure how information

74
in the multiple auditory fields is used by the animal during the task, these results suggest that
each auditory field contains comparable information about consonant stimuli.
Response diversity to speech stimuli is higher in non-primary fields
Diversity was quantified as the strength of the correlation between the responses evoked
in similarly tuned neurons to a variety of speech sounds. Since VAF and PAF are not as clearly
organized by characteristic frequency as AAF and A1, we could not simply analyze pairs of sites
that were anatomically close to each other. For this study, we restricted the analysis to pairs of
sites that were within ¼ octaves of each other. Similarly tuned sites in A1 and AAF encode
speech stimuli more similarly than similarly tuned sites in VAF or PAF. For example, in a pair of
similarly-tuned AAF sites, the speech sound /dad/ evoked more spikes in site #2 than in site #1,
but the relationship was still significantly correlated (R2=0.77, p=0.01; Figure 3.9A). In A1, two
sites with a CF of 5 kHz fired the most spikes to the sounds /bad/ and /dad/ and fewest to the
sound /sad/ and the relationship between the firing strength of these two sites to all speech
sounds was significantly correlated (R2=0.86, p<0.01; Figure 3.9B). These results suggest that
similarly tuned sites in both A1 and AAF encode speech stimuli with a significant level of
redundancy. In PAF and VAF, spike rate among pairs of sites is also significantly correlated
(R2=0.61, p=0.04 in VAF and R
2=0.63, p=0.04 in PAF; Figure 3.9C&D), but several consonant
sounds evoke different responses within each pair. For example, in PAF, site #1 fired almost no
spikes to the sounds /sad/, /gad/ and /bad/, while site #2 fired strongly to each of these sounds
(Figure 3.9D). The trends in these single pair examples are representative of the population of
pairs in each of the four auditory fields we tested.

75
The highest average correlation across pairs of sites with the same CF (±¼ octave) was
observed in A1, followed by AAF (R= 0.36 and R= 0.33 respectively; p<0.01). In these two
fields, 10% of site pairs were in the 75th
percentile of their respective distributions (R value
above 0.6; Figure 3.10A&B). VAF and PAF were less correlated than AAF or A1 (t-tests with
Bonferroni correction, p<0.01), but were not significantly different from each other (in VAF; R=
0.17 and in PAF; R= 0.18, p=0.04). In VAF and PAF, the distribution shifts so that only 8% of
pairs were in the 75th
percentile (R value above than 0.5; Figure 3.10C&D, respectively). These
results suggest that pairs of sites in VAF and PAF are encoding the same speech sound with less
redundancy than in AAF or A1. The encoding redundancy in A1 may increase the efficacy of
this field in driving downstream neurons (Eggermont 2007).
These results suggest that similarly tuned neurons encode speech stimuli with various levels of
redundancy across the auditory fields we recorded from. This difference in redundant firing
across similarly tuned neurons supports the hypothesis that information is transformed across the
synapses of the auditory pathway. In spite of this increased diversity, no auditory field was better
correlated to behavioral performance than any other. It is unlikely that neural circuits use this
method of calculating similarity between individual neural responses. We report that neural
firing patterns in each of four auditory fields can be used to achieve comparable levels of
performance on a consonant discrimination task using Euclidean distance as a metric. This result
suggests that the information needed to accomplish such a task is encoded in each of the fields
we investigated.

76
Neural activity from multiple fields can be used to identify consonant sounds.
Identifying sounds from a list of many possibilities is different than simply categorizing
sounds into two categories (“go” and “no go”). To determine whether neural responses in
multiple fields would able to identify consonant speech sounds, we tested the classifier on a
seven-alternative forced-choice task with and without spike timing information. The classifier
compared single trial activity to the average template of each of seven sounds instead of two
sounds used above and in previous studies (Engineer et al. 2008; Centanni et al. 2013; Perez et
al. 2012; Ranasinghe et al. 2012a; Ranasinghe et al. 2012b; Shetake et al. 2011). The classifier
was able to identify seven different sounds at well above chance level using activity from any of
the auditory fields tested (chance is 14%; t-tests for all fields’ performance vs. chance, p<0.001;
Figure 3.11). Spike timing information improved classifier performance for each field (p<0.001).
The classifier performed best when using A1 activity, followed by AAF (t-test vs. A1, p<0.01),
VAF (t-tests vs. AAF and A1, p<0.01), and PAF (t-tests vs. all other fields, p<0.01). Spike
timing improved classifier performance more in some fields than others. The classifier benefited
most from having spike timing when AAF activity was used (increase of 40.6 ± 0.7%), followed
by A1 (36.6 ± 0.7%), VAF (30.8 ± 1.2%), and PAF (13.6 ± 1.2%). These results suggest that
neural activity patterns in all four fields can be used to accurately identify different consonant
sounds.

77
DISCUSSION
Summary of results
This study was designed to test whether spike timing information contributes to speech
processing in non-primary auditory fields. We used an established nearest neighbor classifier to
demonstrate that spike timing information improves accuracy on a neural discrimination task in
all auditory fields. The classifier performance in each field was correlated with behavioral ability
of rats trained to discriminate the same sounds in an operant go/no-go paradigm. The response to
speech sounds between recording sites with the same characteristic frequency is less redundant
in long latency fields of the auditory pathway. Our results suggest that while the various auditory
fields process speech sounds differently, each fields’ neural discrimination ability is strongly and
independently correlated with the behavioral performance of rats.
Anesthesia may affect neural responses
Our recordings were obtained from the auditory cortex of anesthetized adult rats. Neural
recordings in awake animals differ from recordings in anesthetized animals, especially to
repetitive stimuli, and may have affected our recordings using speech stimuli. Auditory cortex
neurons in awake animals respond strongly to repetitive noise burst stimuli and encode more
information about these sounds than the anesthetized cortex (Dong et al. 2011; Anderson et al.
2006). Basic tuning properties in the rat auditory cortex change under anesthesia, including a
reduction in the number of active neurons and sharper tuning curves in those active neurons
(Gaese and Ostwald 2001). Although response properties of neurons can differ when animals are
awake compared to anesthetized, discrimination between similar sounds using cortical activity
from awake and anesthetized animals is comparable (Engineer et al. 2008; Hromádka et al. 2008;

78
Huetz et al. 2009; Huetz et al. 2009). In awake rats and monkeys, response patterns evoked by
speech sounds are just as accurate at encoding the stimulus as in anesthetized cortex (Engineer et
al. 2008; Centanni et al. 2013; Steinschneider et al. 1994). In spite of the firing differences to
tones and repetitive stimuli caused by anesthesia, speech sound responses in A1 are not
qualitatively different in the awake versus the anesthetized rat. The ability to record speech
sound responses in the anesthetized animal ensures a low spontaneous firing rate (Anderson et al.
2006; Rennaker et al. 2007). The reduction of spontaneous firing makes the evoked responses
easily visible and reduces the variability in identifying driven recordings. Responses in non-
primary visual cortex to complex stimuli are similar in anesthetized and awake monkeys
(Jazayeri et al. 2012; Stoner and Albright 1992; Schmolesky et al. 1998), which suggests that
responses in non-primary auditory cortex of awake and anesthetized subjects may also be
similar. In human subjects with intra-cranial electrodes, anesthesia diminishes activity in non-
primary auditory fields, but the general pattern of activity is comparable (Howard et al. 2000).
Additional studies are needed to determine how anesthesia affects neural encoding of speech
sounds in non-primary auditory fields during behavioral tasks and in passive listening conditions.
The effect of training on neural responses to speech sounds
The speech-evoked responses in untrained rats is correlated with behavioral ability in
several different tasks, including consonant and vowel discrimination in quiet (Engineer et al.
2008; Perez et al. 2012), in various levels of background noise (Shetake et al. 2011) and after
spectral or temporal degradation (Ranasinghe et al. 2012b). Extensive behavioral training does
change neural firing patterns in auditory cortex (Takahashi et al. 2011; Reed et al. 2011) and may
therefore affect the ability of the classifier to predict stimulus identity. Training in ferrets

79
increased the amount of information encoded (as measured by bits), but did not seem to affect
the fundamental nature of the spatiotemporal response patterns (Schnupp et al. 2006b).
Additional studies are needed to determine whether speech sound training alters speech
responses in primary and non-primary cortex of non-human animals. Human imaging studies
suggest that speech training will enhance neural responses (Kraus et al. 1995; Tremblay et al.
2001).
Diversity increases throughout the auditory pathway
Diversity in the speech-evoked responses in cortical auditory fields may contribute to the
ability of an animal to generalize to stimuli or accurately perceive stimuli in adverse listening
conditions (Kilgard 2012). The redundancy of encoded information decreases significantly as
information is passed from the cochlea to the non-primary cortical fields. In the inferior
colliculus (IC), neural responses in neurons tuned to the same frequency are highly correlated
with each other (Chechik et al. 2006). In the thalamus and the primary auditory cortex, the
response patterns in similarly tuned neurons are already substantially different, likely due to the
transformation of information to reflect different stimulus characteristics (Chechik et al. 2006;
Sen et al. 2001; Spitzer and Semple 1998; Winer et al. 2005). Earlier studies have indicated that
greater diversity results in a more robust representation of sensory information (Morisset and
Ghallab 2008; Lyons-Warren et al. 2012; Schnupp 2006a; Sharpee et al. 2011; Shimizu et al.
2000). Novel natural stimuli, such as songbird vocalizations, evoke highly redundant patterns of
activity in the cat inferior colliculus (IC) as compared to A1 (Chechik et al. 2006; Tishby et al.
2002). Both the spike rate and the spike timing information of a stimulus encoded by IC neurons
are strongly correlated across neurons with the same characteristic frequency, while similarly

80
tuned A1 neurons encode less redundant information about the same stimulus. This result is
likely due to the longer integration time in A1 as compared to IC (Chen et al. 2012). We show
that the non-primary field, PAF, has significantly longer integration times than A1, and may
represent a continuation of this hierarchical organization. Classifier performance using PAF
activity was correlated with behavior both with and without spike timing information. With
larger numbers of sites, PAF is able to perform the neural discrimination task with higher
accuracy (Figure 3). Since the brain has access to the entire field of neurons, the performance
difference we show here may not accurately reflect functional differences across fields. Activity
from more PAF neurons (compared to the other fields) may be needed to complete the same
tasks. Our results support these earlier results as we have shown an increase in firing diversity
throughout the cortical auditory fields we tested.
The ability of multiple fields to identify complex auditory stimuli may be beneficial in
ensuring the processing of important auditory cues. The presence of background noise
dramatically alters the neural responses in the primary auditory cortex in rats. When 60 dB of
speech shaped background noise is added to a speech sound stimulus, A1 sites fire with a
delayed latency and lower amplitude in comparison to speech sounds presented in quiet (Shetake
et al. 2011). In spite of the severe degradation to the neural response, rats are still able to
behaviorally discriminate speech sounds with this level of background noise significantly above
chance levels. If non-primary auditory fields are encoding different aspects of the speech
stimulus, as has been previously suggested (Rauschecker et al. 2009), this may explain the robust
speech discrimination ability of rats at this signal to noise ratio. Similarly, spectral or temporal
degradation with a vocoder causes degraded neural firing patterns in rat A1, while the behavioral

81
performance remains significantly above chance (Ranasinghe et al. 2012b). Other auditory fields
may encode the speech stimuli in a way that is more robust to such interference, allowing the rat
to accomplish the behavioral task in adverse listening environments. Additional cortical
deactivation experiments are needed to evaluate whether each auditory field is capable of
compensating for the loss of other auditory field activity.
Evidence for an integrated and parallel hierarchical organization
There are two opposing theories for sensory organization in the brain that are currently being
debated. The first suggests that the auditory system is organized into separate streams of
information processing. Similar to the visual system, a “what” and a “where” pathway may also
exist in the auditory system (Lomber and Malhotra 2008; Recanzone 2000; Rauschecker and
Scott 2009). Deactivation of AAF in cats causes selective impairment on pattern discrimination
tasks while deactivation of PAF causes impairment on spatial awareness tasks (Lomber and
Malhotra 2008). The second theory suggests that the auditory system functions as an
arrangement of integrated but parallel groups of neurons (Sharpee et al. 2011; Recanzone 2000).
Our results, as well as previous work in rats, show that as information moves farther up the
auditory pathway, onset latency significantly increases and suggests an order of processing
(Jakkamsetti et al. 2012; Pandya et al. 2008; Polley et al. 2007; Puckett et al. 2007; Storace et al.
2012). The encoding of different stimulus features across different levels of the auditory system
may help the brain to better encode spatial location (Recanzone 2000; Walker et al. 2011) or help
the brain process information in adverse listening environments (Ranasinghe et al. 2012b;
Shetake et al. 2011). Our data suggest that while multiple auditory fields encode speech sounds
in a similar but not identical manner, each field is highly correlated with behavioral

82
discrimination ability. The similarity in correlative ability across all fields supports the view that
processing of novel sounds involves neural activity that is distributed across multiple auditory
cortex fields.
Acknowledgments
The authors would like to thank K. Im and N. Moreno for help with acquiring microelectrode
recordings. We would also like to thank D. Polley, N. Khodaparast, and A. Sloan for their
comments on earlier versions of this manuscript. This work was supported by the National
Institute for Deafness and Communication Disorders at the National Institutes of Health
(R01DC010433).

83
APPENDIX
CHAPTER 3 FIGURES AND TABLES
Figure 3.1.Speech sound stimuli were shifted up by an octave. Spectrograms of the seven
consonant speech sounds that we used in the present study. Since the rat audiogram is
considerably higher than the human audiogram, we shifted speech sounds up by an octave,
preserving all other spectral and temporal information using the STRAIGHT vocoder (Kawahara
1997; see Methods).

84
Figure 3.2. Example of an auditory cortex map from one anesthetized, adult rat. Microelectrode
recordings were acquired from layer IV/V of 15 experimentally naïve rats. We recorded
responses from each of four fields; anterior, primary, ventral and posterior auditory fields.
Tonotopic organization and latency were used to identify boundaries between fields. Anterior
auditory field was organized from low frequency sites to high frequency in an anterior-to-
posterior direction, while primary auditory field was organized from low to high in a posterior-
to-anterior direction. Ventral auditory field was located anatomically between the two fields but
had no tonotopic gradient. Posterior auditory field was located posterior to the primary auditory
field and also had no tonotopic gradient. Sites outlined in black and with black text represent the
individual examples shown in Figure 3.6.

85
Figure 3.3. Tone response properties in anterior, primary, ventral, and posterior auditory fields
mimic previous studies. A. AAF and A1 responded to tones with the shortest onset latency (14.8
± 0.6 ms and 16.2 ± 0.2 ms; p<0.01), followed by VAF (19.8 ± 0.8 ms; t-test vs. A1, p<0.01).
PAF fired with the longest onset latency of any field and was significantly different from every
other field (33.1.2 ± 1.2 ms; t-test vs. VAF, p<0.01). B. AAF, A1 and VAF responded to tones
with the same threshold (14.2 ± 0.5 dB, 14.8 ± 0.6 dB, and 3.2 ± 1 dB respectively), while PAF
sites had a significantly higher threshold than the other three fields (18.1 ± 1.0 dB; t-tests with
Bonferroni correction, p <0.01). C. VAF had the narrowest bandwidths at 40 dB above threshold
(2.4 ± 0.1 octaves), followed by A1 (2.6 ± 0.1 octaves, t-test vs. VAF, p<0.01). AAF had broader
bandwidths than VAF and A1 (2.8 ± 0.1 octaves (unpaired t-tests with Bonferroni correction,
p=0.01) and PAF had the broadest bandwidths at this intensity level (3.5 ± 0.1 octaves (unpaired
t-tests with Bonferroni correction, (p<0.01). D. AAF and A1 fired the most driven spikes to tones
(2.8 ± 0.1 spikes and 2.7 ± 0.1 spikes respectively); t-test, p=0.14). VAF fired significantly fewer
spikes than AAF (2.4 ± 0.1 spikes, p<0.01), and PAF fired the least amount of driven spikes of
any field (1.9 ± 0.1 spikes, respectively; t-tests with Bonferroni correction, p<0.01).

86
Figure 3.4. Classifier performance by auditory field as a function of number of sites. The two-
alternative forced choice classifier reaches ceiling performance in all fields when greater than 20
sites are used, while performance is close to floor when single sites are used. For the analyses in
this report, we used 5 sites per classifier run (marked by the vertical line) to achieve performance
well above chance level while avoiding ceiling performance. Classifier was run in all instances
using spike timing information: 1 ms temporal bins across a 40 ms analysis window.

87
Figure 3.5. Neural classifier performance in each auditory field with and without spike timing
information. Neural activity in anterior, primary, ventral, and posterior auditory fields were all
better able to discriminate pairs of consonant speech sounds when spike timing information was
preserved than when spike timing information was removed. Classifier performance plotted is
the average of many groups of 5 random sites performing neural discrimination of 21 different
consonant pairs (see Methods). In AAF, the classifier achieved 91.3 ± 2.3% correct when spike
timing information was preserved versus 67.7 ± 2.2% correct when spike timing information
was removed (p<0.01). In A1, the classifier achieved 92.6 ± 2.1% correct vs. 72.9 ± 2.2%
(p<0.01). In VAF, the classifier achieved 84.6 ± 2.9% correct vs. 65.0 ± 2.2%, p<0.01. In PAF,
the classifier achieved 75.0 ± 2.9% correct vs. 62.8 ± 1.6%, p<0.01. All t-tests reported tested
classifier performance with and without spike timing respectively. Error bars represent standard
error of the mean across groups of 5 recording sites.

88
Figure 3.6. Single site examples of the evoked-response to consonant speech sounds in each
auditory field. Average response (from a ~10 kHz site in each field) to 20 repeats of each of four
consonant speech sounds as compared to the average post-stimulus-response-histograms (PSTH)
response in each field. The individual site examples are plotted in black and the population
PSTH for the entire field is plotted in gray for comparison. Onset latency for the individual site is
marked by a triangle and the mean ± std of the latencies for each site in the population is marked
by the black bar. A. Waveforms of four example consonant speech sounds; two voiced
consonants; /b/ and /d/, and two unvoiced consonants; /s/ and /sh/. B. Single site PSTH of a
representative AAF site. AAF sites responded quickly to the onset of a speech stimulus in a well
defined peak of activity (average onset latency of 14.2 ± 0.7ms; mean ± sem). C. PSTH
responses from a representative A1 site. Like AAF sites, A1 sites responded quickly to the onset
of a stimulus and had a short peak response (15.2 ± 0.7 ms in A1; t-test vs. AAF, p=0.32). D.
PSTH responses from a representative VAF site. This result was similar to the longer latency
seen in response to tones. E. PSTH responses from a representative PAF site. Just as PAF sites
responded last to tones (compared to the other three fields), this field also responded last to
speech sounds (18.1 ± 0.7 across all speech sounds; t-test vs. A1, p<0.01).

89
Figure 3.7. Spatiotemporal response patterns to all consonant speech sounds tested in anterior,
primary, ventral, and posterior auditory fields. Average response to speech sounds from each site
in each field, organized by characteristic frequency. The average response across all sites is
shown on top of each sub-panel. The average response plotted is the same as is shown in gray in
Figure 3.6. A. AAF sites responded strongly to all speech sounds, but responded less strong for
non-stop consonants (/s/, /sh/, and /ch/). Each speech sound evoked a unique pattern of response.
For example, the sound /b/ caused low frequency sites to fire first, followed by high. The
consonant /d/ caused the opposite firing pattern. B. A1 responses to speech sounds were similar
to AAF and mimic previous recordings in A1. Like AAF, A1 sites responded more strongly to
stop consonants. C. VAF did not have as many low frequency sites as AAF or A1, which caused
the response patterns to appear more similar. In spite of the bias in characteristic frequency, VAF

90
Figure 3.7 continued…
sites tuned below 6 kHz did respond to the vowel portion of the speech sounds in a manner that
mimicked AAF and A1 responses. D. PAF sites were more broadly tuned than the other three
fields. As a result, each site responded to both the consonant onset as well as the vowel onset.

91
Figure 3.8. Similarity between neural responses to speech sounds is highly correlated across
fields. Euclidean distance was calculated between the neural responses in each field to every pair
of consonant sounds. The similarity between neural responses to speech sounds was then
compared between every combination of fields. In general, /d/ and /b/ were the most distinct and
/s/ and /ch/ were the least distinct. Despite some variation, the correlation between fields was
high and significant. Not all comparisons shown. A. The similarity between the neural response
to pairs of speech-evoked responses is highly correlated between A1 and AAF (R2=0.91,
p<0.01). These two fields perform the neural discrimination task with comparable accuracy. B.
The similarity between pairs of speech-evoked neural responses between A1 and VAF is highly
correlated (R2=0.76, p<0.01), but the correlation contains more outliers than the AAF/A1
comparison. VAF is better able to discriminate between unvoiced consonants (for example, S/T
and S/Ch) than A1. This difference in the similarity between response patterns does not give
VAF an advantage for these tasks in the neural discrimination task. C. The similarity between
pairs of speech-evoked neural responses between A1 and PAF is as strongly correlated as A1 and
AAF (R2=0.91, p<0.01). The neural responses in PAF are more distinct than in A1. This
difference does not give VAF and advantage for these tasks in the neural discrimination
classifier.

92
Figure 3.9. Example correlations from one pair of sites in each field. We counted the number of
evoked spikes to each speech sound fired from each of two sites that were tuned within ¼ octave
of each other and quantified these pairs using the correlation coefficient. These examples
represent pairs in the 75th
percentile in each field. A. AAF sites fire with a similar number of
spikes per sound. For example, both of these sites fired the most spikes to /b/ and /g/, and the
least number of spikes to /s/. This example had an R2 of 0.77 (p=0.01). B. A1 pairs had the
highest correlation, suggesting the largest amount of redundant information. This pair had an R2
of 0.86 (p<0.01). C. VAF (R2 of 0.61, p=0.04) and D. PAF (R
2 of 0.63, p=0.03) pairs had weak
correlations, suggesting that these fields had less redundancy in information encoding. For
example, in both C. and D., one site in the pair fired more spikes to /g/ than the other site in the
pair.

93
Figure 3.10. Distribution of correlation coefficients between speech evoked responses in pairs of
recording sites. In each field, we found pairs of sites tuned within ¼ octave of each other and
compared the number of evoked spikes to each of the seven consonant sounds presented. We
quantified these comparisons using the correlation coefficient. A. Pairs of sites in AAF were
strongly correlated with each other when comparing the number of evoked spikes to speech
sounds. AAF site pairs had an average R value of 0.33. B. A1 pairs were the most correlated with
each other (an average R value of 0.36, t-test vs. AAF, p<0.01). C. VAF and D. PAF pairs were
the least correlated, with an average R value of 0.17 in VAF and 0.18 in PAF. Both of these
fields were less correlated than AAF or A1 (t-tests with Bonferroni correction, p<0.01), but were
not different from each other (p=0.04).

94
Figure 3.11. Neural activity from multiple fields can identify consonant sounds better when spike
timing information is preserved. We ran the classifier using templates for all 7 sounds
simultaneously to test the ability of neural activity to identify the 7 sounds with and without
spike timing information. All four fields were significantly better at the identification task when
spike timing information was preserved (black bars) than when spike timing information was
removed (white bars; * = p<0.001). AAF was most affected by the removal of spike timing (i.e.
had the greatest difference in performance across the two conditions), followed by A1, VAF, and
PAF (p<0.001).
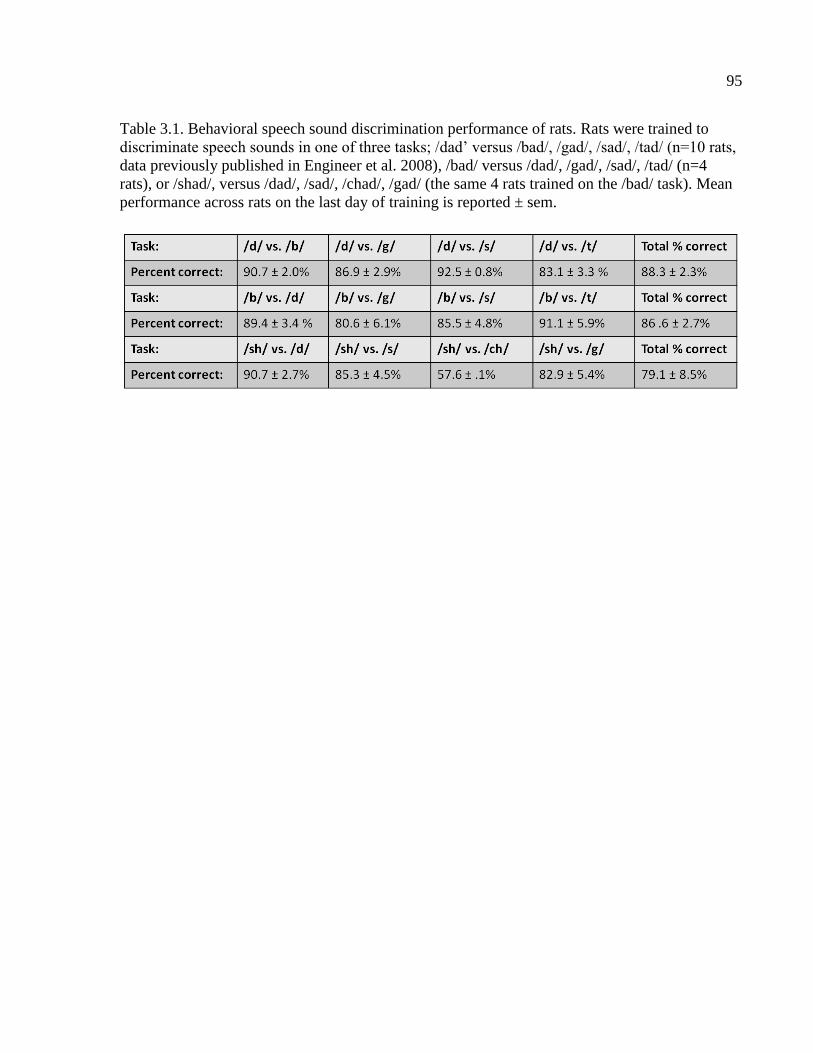
95
Table 3.1. Behavioral speech sound discrimination performance of rats. Rats were trained to
discriminate speech sounds in one of three tasks; /dad’ versus /bad/, /gad/, /sad/, /tad/ (n=10 rats,
data previously published in Engineer et al. 2008), /bad/ versus /dad/, /gad/, /sad/, /tad/ (n=4
rats), or /shad/, versus /dad/, /sad/, /chad/, /gad/ (the same 4 rats trained on the /bad/ task). Mean
performance across rats on the last day of training is reported ± sem.
96
REFERENCES
Ahissar E, Sosnik R, and Haidarliu S. Transformation from temporal to rate coding in a
somatosensory thalamocortical pathway. Nature, 406: 302-306. 2000.
Anderson S, Kilgard M, Sloan A and Rennaker R. Response to broadband repetitive stimuli in
auditory cortex of the unanesthetized rat. Hear Res 213: 1: 107-117, 2006.
Barbour DL and Wang X. Contrast tuning in auditory cortex. Science 299:1073–1075, 2003
Buonomano DV and Merzenich MM. Temporal information transformed into a spatial code by a
neural network with realistic properties. Science- New York Then Washington 1028-1028,
1995.
Carrasco A and Lomber SG. Neuronal activation times to simple, complex, and natural sounds in
cat primary and nonprimary auditory cortex. J Neurophysiol 106: 3: 1166-1178, 2011.
Centanni TM, Booker AB, Sloan AM, Chen F, Maher BJ, Carraway RS, Khodaparast N,
Rennaker RL, LoTurco JJ, and Kilgard MP. Knockdown of the dyslexia-associated gene
KIAA0319 impairs temporal responses to speech stimuli in rat primary auditory cortex,
Cerebral Cortex; doi:.10.1093/cercor/bht028, 2013.
Chechik G, Anderson MJ, Bar-Yosef O, Young ED, Tishby N and Nelken I. Reduction of
information redundancy in the ascending auditory pathway. Neuron 51: 3: 359-368, 2006.
Chen C, Read HL, and Escabi MA. Precise feature based time scales and frequency decorrelation
lead to a sparse auditory code. J Neurosci, 32: 8454-68, 2012.
Cohen MR and Kohn A. Measuring and interpreting neuronal correlations. Nat Neurosci,
14:811-819, 2011.
Dong C, Qin L, Liu Y, Zhang X and Sato Y. Neural responses in the primary auditory cortex of
freely behaving cats while discriminating fast and slow click-trains. PloS one 6: 10:
e25895, 2011.
Doron NN, Ledoux JE and Semple MN. Redefining the tonotopic core of rat auditory cortex:
physiological evidence for a posterior field. J Comp Neurol 453: 4: 345-360, 2002.
97
Eggermont JJ. Correlated neural activity as the driving force for functional changes in auditory
cortex. Hearing Research, 229: 69-80, 2007.
Engineer CT, Perez CA, Chen YTH, Carraway RS, Reed AC, Shetake JA, Jakkamsetti V, Chang
KQ and Kilgard MP. Cortical activity patterns predict speech discrimination ability. Nat
Neurosci 11: 5: 603-608, 2008.
Floody OR, Ouda L, Porter BA and Kilgard MP. Effects of damage to auditory cortex on the
discrimination of speech sounds by rats. Physiol Behav 101: 2: 260-268, 2010.
Foffani G and Moxon KA. PSTH-based classification of sensory stimuli using ensembles of
single neurons. J Neurosci Methods 135: 1: 107-120, 2004.
Foffani G and Moxon K. Studying the role of spike timing in ensembles of neurons. Conference
Proceedings, 2nd
International IEEE EMBS conference 206-208, 2005.
Gaese BH and Ostwald J. Anesthesia changes frequency tuning of neurons in the rat primary
auditory cortex. J Neurophysiol 86: 2: 1062-1066, 2001.
Higgins NC, Storace DA, Escabi MA, and Read HL. Specialization of binaural responses in
ventral auditory cortices, The Journal of Neuroscience, 30: 14522-14532.,2008.
Howard MA, Volkov IO, Mirsky R, Garell PC, Noh MD, Granner M, Damasio H,
Steinschneider M, Reale RA, Hind JE and Brugge JF. Auditory cortex on the human
posterior superior temporal gyrus. J Comp Neurology 416: 79-92, 2000.
Hromádka T, DeWeese MR and Zador AM. Sparse representation of sounds in the
unanesthetized auditory cortex. PloS biology 6: 1: e16, 2008.
Huetz C, Philibert B and Edeline JM. A spike-timing code for discriminating conspecific
vocalizations in the thalamocortical system of anesthetized and awake guinea pigs. The
Journal of Neuroscience 29: 2: 334-350, 2009.
Jakkamsetti V, Chang KQ and Kilgard MP. Reorganization in processing of spectral and
temporal input in the rat posterior auditory field induced by environmental enrichment. J
Neurophysiol 107: 5: 1457-1475, 2012. Kawahara H. Speech representation and
transformation using adaptive interpolation of weighted spectrum: vocoder revisited. In
Acoustics, Speech and Signal Processing 2: 1303-1306 vol. 2, 1997.
Jazayeri M, Wallisch P, and Movshon JA. Dynamics of macaque MT cell responses to grating
triplets. J Neuroscience, 32: 8242-8253, 2012.

98
Kawahara H. Speech representation and transformation using adaptive interpolation of weighted
spectrum: vocoder revisited. In Acoustics, Speech and Signal Processing 2: 1303-1306
vol. 2, 1997.
Kilgard MP. Harnessing plasticity to understand learning and treat disease. Trends in
Neuroscience, 35:715-22, 2012.
Kraus, N, McGee, T, Carrell, TD, King, C, Tremblay, K, and Nicol, T. Central auditory system
plasticity associated with speech discrimination training. Journal of Cognitive
Neuroscience, 7: 25-32, 1995.
Lomber SG and Malhotra S. Double dissociation of'what'and'where'processing in auditory
cortex. Nat Neurosci 11: 5: 609-616, 2008.
Lyons-Warren AM, Hollmann M and Carlson BA. Sensory receptor diversity establishes a
peripheral population code for stimulus duration at low intensities. J Exp Biol 215: 15:
2586-2600, 2012.
Ma H, Qin L, Dong C, Zhong R and Sato Y. Comparison of Neural Responses to Cat Meows and
Human Vowels in the Anterior and Posterior Auditory Field of Awake Cats. PloS one 8:
1: e52942, 2013.
Montemurro MA, Rasch MJ, Murayama Y, Logothetis NK and Panzeri S. Phase-of-firing coding
of natural visual stimuli in primary visual cortex. Current biology 18: 5: 375-380, 2008.
Morisset B and Ghallab M. Learning how to combine sensory-motor functions into a robust
behavior. Artif Intell 172: 4: 392-412, 2008.
Pandya PK, Rathbun DL, Moucha R, Engineer ND and Kilgard MP. Spectral and temporal
processing in rat posterior auditory cortex. Cerebral Cortex 18: 2: 301-314, 2008.
Perez CA, Engineer CT, Jakkamsetti V, Carraway RS, Perry MS and Kilgard MP. Different
Timescales for the Neural Coding of Consonant and Vowel Sounds. Cerebral Cortex;
doi: 10.1093/cercor/bhs045, 2012.
Petkov CI, Kayser C, Augath M, and Logothetis NK. Functional imaging reveals numerous
fields in the monkey auditory cortex. PLoS Biol 4: e215, 2006.
Polley DB, Read HL, Storace DA and Merzenich MM. Multiparametric auditory receptive field
organization across five cortical fields in the albino rat. J Neurophysiol 97: 5: 3621-3638,
2007.
Popescu MV and Polley DB. Monaural deprivation disrupts development of binaural selectivity
in auditory midbrain and cortex. Neuron 65: 5: 718-731, 2010.
99
Porter BA, Rosenthal TR, Ranasinghe KG and Kilgard MP. Discrimination of brief speech
sounds is impaired in rats with auditory cortex lesions. Behav Brain Res 219: 1: 68-74,
2011.
Puckett AC, Pandya PK, Moucha R, Dai WW and Kilgard MP. Plasticity in the rat posterior
auditory field following nucleus basalis stimulation. J Neurophysiol 98: 1: 253-265,
2007.
Ranasinghe KG, Carraway RS, Borland MS, Moreno NA, Hanacik EA, Miller RS and Kilgard
MP. Speech discrimination after early exposure to pulsed-noise or speech. Hear Res 289:
1-12, 2012a.
Ranasinghe KG, Vrana WA, Matney CJ and Kilgard MP. Neural Mechanisms Supporting
Robust Discrimination of Spectrally and Temporally Degraded Speech. Journal of the
Association for Research in Otolaryngology 13:527-542, 2012b.
Rauschecker JP and Scott SK. Maps and streams in the auditory cortex: nonhuman primates
illuminate human speech processing. Nat Neurosci 12: 6: 718-724, 2009.
Rauschecker JP and Tian B. Processing of band-passed noise in the lateral auditory belt cortex of
the rhesus monkey. J Neurophysiol 91: 2578–2589,2004.
Rauschecker JP, Tian B, and Hauser MD. Processing of complex sounds in the macaque
nonprimary auditory cortex, Science, 268: 111-114, 1995.
Recanzone GH. Spatial processing in the auditory cortex of the macaque monkey. Proceedings
of the National Academy of Sciences 97: 22: 11829-11835, 2000.
Reed A, Riley J, Carraway R, Carrasco A, Perez C, Jakkamsetti V and Kilgard MP. Cortical map
plasticity improves learning but is not necessary for improved performance. Neuron 70:
1: 121-131, 2011.
Rennaker, RL, Chen, CFF, Ruyle, AM, Sloan, AM, and Wilson, DA Spatial and temporal
distribution of odorant-evoked activity in the piriform cortex. J Neuroscience, 27(7),
1534-1542, 2007.
Romo R and Salinas E. Flutter discrimination: neural codes, perception, memory and decision
making. Nature Reviews Neuroscience 4: 3: 203-218, 2003.
Schmolesky MT, Wang Y, Hanes DP, Thompson KG, Leutgeb S, Schall JD, and Leventhal AG.
Signal timing across the macaque visual system.J Neurophys, 79: 3272-78, 1998.
Schnupp J. Auditory filters, features, and redundant representations. Neuron 51: 3: 278-280,
2006a.

100
Schnupp J, Hall TM, Kokelaar, and Ahmed B. Plasticity of temporal pattern codes for
vocalization stimuli in primary auditory cortex. J Neuroscience, 26:4785-4795, 2006b.
Sen K, Theunissen FE and Doupe AJ. Feature analysis of natural sounds in the songbird auditory
forebrain. J Neurophysiol 86: 3: 1445-1458, 2001.
Shadlen MN and Newsome WT. Neural basis of a perceptual decision in the parietal cortex (area
LIP) of the rhesus monkey. J Neurophysiol 86: 4: 1916-1936, 2001.
Shadlen MN and Newsome WT. Motion perception: seeing and deciding. Proceedings of the
National Academy of Sciences 93: 2: 628-633, 1996.
Sharpee TO, Atencio CA and Schreiner CE. Hierarchical representations in the auditory cortex.
Curr Opin Neurobiol 21: 5: 761-767, 2011.
Shetake JA, Wolf JT, Cheung RJ, Engineer CT, Ram SK and Kilgard MP. Cortical activity
patterns predict robust speech discrimination ability in noise. Eur J Neurosci 34:1823-38,
2011.
Shimizu Y, Kajita S, Takeda K and Itakura F. Speech recognition based on space diversity using
distributed multi-microphone. 3: 1747-1750, 2000.
Smith PH, Uhlrich DJ, Manning KA and Banks MI. Thalamocortical projections to rat auditory
cortex from the ventral and dorsal divisions of the medial geniculate nucleus, J Comp
Neuro, 520: 34-51, 2012.
Spitzer MW and Semple MN. Transformation of binaural response properties in the ascending
auditory pathway: influence of time-varying interaural phase disparity. J Neurophysiol
80: 6: 3062-3076, 1998.
Steinschneider M, Schroeder CE, Arezzo JC and Vaughan HG. Speech-evoked activity in
primary auditory cortex: effects of voice onset time. Electroencephalography and clinical
Neurophysiology 92: 1: 30-43, 1994.
Stoner GR and Albright TD. Neural correlates of perceptual motion coherence. Nature, 358:
412-14, 1992.
Storace DA, Higgins NC, and Read HL. Thalamic label patterns suggest primary and ventral
auditory fields are distinct core regions. J Comp Neurol, 518:1630-1646,2010.
Storace DA, Higgins NC, Chikar JA, Oliver DL and Read HL. Gene expression identifies
distinct ascending glutamatergic pathways to frequency-organized auditory cortex in the
rat brain. J Neurosci, 32: 15759-68, 2012.
101
Takahashi H, Yokota R, Funamizu A, Kose H and Kanzaki R. Learning-stage-dependent, field-
specific, map plasticity in the rat auditory cortex during appetitive operant conditioning.
Neuroscience 199: 243-58, 2011.
Tishby GCAGN, Young MJAED and Nelken I. Group redundancy measures reveal redundancy
reduction in the auditory pathway. Advances in Neural Information Processing Systems
14: Proceedings of the 2001 Neural Information Processing Systems (NIPS) Conference.
1: 173-80, 2002.
Tremblay, K, Kraus, N, McGee, T, Ponton, C, & Otis, B. Central auditory plasticity: changes in
the N1-P2 complex after speech-sound training. Ear and hearing, 22: 79-90, 2001.
Walker KM, Bizley JK, King AJ and Schnupp JW. Multiplexed and robust representations of
sound features in auditory cortex. The Journal of Neuroscience 31: 41, 14565-14576,
2011.
Wang Y, Lu T, Bendor D, and Bartlett E. Neural coding of temporal information in auditory
thalamus and cortex. Neuroscience, 154:294-303, 2008.
Wang Y, Merzenich MM, Beitel R, and Schreiner CE. Representation of a species-specific
vocalization in the primary auditory cortex of the common marmoset: temporal and
spectral characteristics. Journal of Neurophysiology, 74:2685-2706, 1995.
Winer JA, Miller LM, Lee CC and Schreiner CE. Auditory thalamocortical transformation:
structure and function. Trends Neurosci 28: 5: 255-263, 2005.

102
CHAPTER 4
SPEECH SOUND PROCESSING DEFICITS AND TRAINING-INDUCED NEURAL
PLASTICITY IN RATS WITH DYSLEXIA GENE KNOCKDOWN
Authors- Tracy M. Centanni1, Fuyi Chen
2, Anne B. Booker
2, Andrew M. Sloan
1, Crystal T.
Engineer1, Robert Rennaker II
1, Joseph J. LoTurco
2, and Michael P. Kilgard
1
1School of Behavioral and Brain Sciences, GR41
The University of Texas at Dallas
800 W. Campbell Road
Richardson, Texas, 75080-3021
2Department of Physiology and Neurobiology
The University of Connecticut
75 North Eagleville Road
Storrs, CT, 75080-3021

103
ABSTRACT
Reduced expression of the dyslexia associated gene Kiaa0319 in rats (KIA-) causes degraded
responses to phoneme stimuli as well as increased trial-by-trial variability in onset latency. Here
we report that in utero RNAi of this gene causes significant behavioral speech sound processing
impairments in rats. KIA- rats needed twice as much practice on a speech discrimination task to
perform at control levels. The percentage of neurons affected by RNAi is strongly correlated
with speech discrimination ability. Extensive behavioral training (>10 weeks) was able to restore
trial by trial neural firing variability. This amount of training also restored the performance of
neural activity patterns to predict stimulus identity. KIA- rats are able to learn difficult speech
discrimination tasks, but require long training periods. These results provide the first direct
evidence that in utero suppression of the dyslexia associated gene KIAA0319 can cause
behavioral phoneme processing impairments.

104
INTRODUCTION
Dyslexia is the most common developmental language disorder and affects approximately 7% of
the population (Shaywitz et al. 1992; Shaywitz et al. 1998). Individuals with this disorder have
normal nonverbal intelligence, but score at least 1 standard deviation below their peers on
reading tests (Shaywitz et al. 1992; Tallal 1980; Ziegler and Goswami 2005). Children with
dyslexia typically have deficits in phoneme perception and manipulation (Boscariol et al. 2010;
Peterson and Pennington 2012; Tallal and Piercy 1974; Vandermosten et al. 2010). For example,
dyslexic children are less accurate at identifying consonants along a continuum (Manis et al.
1997; Vandermosten et al. 2010; Werker and Tees 1987), at exchanging or manipulating
phonemes (i.e. say “break” without the /b/ sound; (Elbro, Nielsen, Petersen 1994; Paulesu et al.
1996), or at identifying pairs of rhyming words (Howland and Liederman 2012; Kovelman et al.
2012). Dyslexia is highly heritable (Cope et al. 2005; Fisher and DeFries 2002; Nöthen et al.
1999; Pennington et al. 1991) and at least four candidate dyslexia genes have been identified
(KIAA0319, DYX1C1, DCDC2 and ROBO1; (Bates et al. 2011; Burbridge et al. 2008; Galaburda
et al. 1985; Galaburda et al. 2006; Harold et al. 2006; Scerri et al. 2011; Threlkeld et al. 2007).
KIAA0319 variants are consistently associated with dyslexia and are directly related to poor
speech perception and reading ability (Pinel et al. 2012). The auditory temporal processing
theory hypothesizes that the behavioral deficits seen in dyslexics are caused by abnormal neural
firing to rapid auditory stimuli (Ahissar et al. 2000; Boscariol et al. 2010; Tallal 1980; Temple et
al. 2000) but see McLean 2011 and Rosen 2003). Variants in KIAA0319 are linked with reduced
left temporal lobe activation to speech sound stimuli (Pinel et al. 2012) and may contribute to
abnormal auditory processing.

105
Rats with in utero RNA interference (RNAi) of the rat homolog of this gene (Kiaa0319)
have significantly higher trial-by-trial variability in the timing of neural responses to tones and
speech stimuli (Centanni et al. 2013). This result suggests that this specific candidate dyslexia
gene causes unreliable neural firing in auditory cortex and may also contribute to behavioral
auditory processing impairments. Neural activity patterns are correlated with behavioral ability
of rats on discrimination tasks using human consonants and vowels in quiet (Engineer et al.
2008b; Perez et al. 2012), in various levels of background noise (Shetake et al. 2011), and with
temporal or spectral degradation (Ranasinghe et al. 2012a). Rats with in utero RNAi of
Kiaa0319 have difficulty discriminating short non-speech stimuli, such as frequency-modulated
sweeps (Szalkowski et al. 2012) and we hypothesized that these rats would also have impaired
speech sound discrimination.
Extensive and targeted behavioral therapy is currently the most effective intervention for
children with dyslexia. Many programs focus on using synthetically stretched or otherwise
modified speech stimuli to improve phoneme awareness (Lovio et al. 2012; Penolazzi et al.
2010; Russo et al. 2005; Temple et al. 2003). Such training can cause changes in neural
responses at multiple stages of the auditory pathway (Penolazzi et al. 2010; Tremblay and Kraus
2002). For example, an 8-week training program for phonemic awareness (Earobics, Evanston,
IL) improved speech in noise responses in the auditory brainstem (Russo et al. 2005). A similar
remediation program (Fast ForWord (Scientific Learning Corporation, Oakland, CA) increased
fMRI activation in several cortical brain regions, including the left temporo-parietal cortex and
inferior frontal gyrus (Temple et al. 2003). These studies support the hypothesis that behavioral
training can induce neural plasticity in a genetic disorder. However, some studies suggest that

106
behavioral training is not completely effective (Eden and Moats 2002; Lovett et al. 1989;
Schulte-Körne 2010) and the cause of this discord is unknown. The specific genetic variants of
the participants in those studies are unknown and it is possible that such behavioral training may
not induce changes for people with specific genetic variants.
In the current study, we trained rats with in utero RNAi of Kiaa0319 on a variety of
speech sound discrimination tasks designed to mimic known deficits in human dyslexics
including speech in noise, rapid speech sounds, and phonemes. We also recorded multiunit
neural activity in primary (A1) and posterior auditory fields (PAF) to evaluate whether extensive
behavioral training improved neural responses to speech and non-speech stimuli.
METHODS
Animals
Subjects were Wistar rats, both male and female, that were 4-8 months old at the time of
study. All rats used were subjected as embryos to in utero electroporation targeting lateral
regions of neocortex that included the auditory cortex by methods described previously (Bai et
al. 2003; Bai et al. 2008; Burbridge et al. 2008; Centanni et al. 2013; Szalkowski et al. 2012;
Threlkeld et al. 2007)(Bai et al. 2003; Bai et al. 2008; Burbridge et al. 2008; Szalkowski et al.
2012; Threlkeld et al. 2007). The animals were transfected with either an shRNA against
Kiaa0319 which can decrease the Kiaa0319 protein expression in cell culture (Tarkar and
LoTurco, unpublished observation) and to cause migration delay in neocortex in embryos that
was rescued by expression of exogenous Kiaa0319 (Paracchini et al. 2006). Control transfection
animals received a scrambled sequence control of Kiaa0319 shRNA, also previously used, that

107
contained 6 bases in the sequence scrambled to render the shRNA inactive in terms of reducing
Kiaa0319 expression (Paracchini et al. 2006). Kiaa0319 shRNA and scrambled shRNA
constructs were injected at a concentration of 1.0 µg/µL. pB-GFP was co-transfected with the
effective shRNA construct, and pB-mRFP was co-transfected with the scrambled Kiaa0319
shRNA control construct to identify the experimental condition in post experimental histological
analysis. Electroporation paddles were placed in a horizontal plane and voltage pulses were
discharged across the cerebrum in both polarities to achieve bilateral transfections. The
experimental status of the subject remained blind to the experimenters throughout data
collection. Following data collection, each subject was perfused transcardially with 250 mL of
0.1 M PB solution with 0.02% heparin, followed by 500 mL of 4% formalin solution in 0.1 M
PB. Sections were taken at 80 µm intervals and analyzed under a confocal microscope (Zeiss) to
identify the experimental status of each subject (green florescent protein marked experimental
subjects and red florescent protein marked control littermates). All animal protocols were
approved by the University of Connecticut Institutional Animal Care and Use Committee.
Behavioral Training
We trained 26 rats to discriminate a target speech sound (/dad/) in four different contexts.
Of these rats, 16 received RNAi of Kiaa0319 (KIA-) and 10 received scrambled RNAi and
served as controls. The behavior tasks we tested are described in detail elsewhere (Engineer et al.
2008b; Perez et al. 2012; Porter et al. 2011; Sloan, Dodd, Rennaker II 2009). Briefly, rats were
trained to respond to a target sound /dad/ using either a lever press or withdrawal from an infra-
red nose poke. Once rats understood the mechanism of response was either a lever press or a
withdrawal from the nose poke, rats were trained to wait for the presentation of a target sound

108
prior to making a response. Once rats reached a d’ of >= 1.5 for 10 sessions, they were moved on
to 20 sessions of each of four discrimination tasks.
The isolated speech task consisted of a go-no go paradigm in which rats were trained to
press a lever in response to the target sound and to reject 7 distracters: /dad/ versus /bad/, /gad/,
/sad/, /tad/, /dud/, /deed/, /dood/ (Engineer et al. 2008b). The speech in noise task involved a
similar lever press discrimination task where the same set of speech sounds described above
were presented in four levels of background speech shaped noise: 0, 48, 60, 72 dB speech shaped
background noise (Shetake et al. 2011). The phoneme task presented only the first 40 ms of the
consonant information and rats were required to press the lever in response to ‘da’ and ignore the
distracters (Porter et al. 2011). The rapid speech task presented a random sequence of distracter
sounds (/bad/, /gad/, /sad/, /tad/), with the target sound (/dad/) inserted randomly between 2-7
seconds from the start of the trial. Responses were registered in this task by removal from an
infra-red nose poke (Sloan, Dodd, Rennaker II 2009).
We trained half of the rats using one task order (isolated speech, speech in noise, rapid
speech, phonemes) and the other half using a second task order (phonemes, isolated speech,
speech in noise, rapid speech). This change in order was to determine if KIA- rats were able to
learn the difficult short speech task if given extensive training. Since there were only minor
differences across groups in the neural responses following training, neural activity from both
groups was combined for analysis. Percent correct is average hits-false alarms across all tasks.
Acute neural recordings
Following the approximately 4 months of training needed to complete all four tasks; rats
were anesthetized with pento barbital and mapped. The techniques used for acute recordings are

109
described in detail elsewhere (Centanni et al. 2013; Engineer et al. 2008a; Ranasinghe et al.
2012a; Shetake et al. 2011). In brief, animals were anesthetized with pentobarbital (50 mg kg-1
)
and were given supplemental dilute pentobarbital (8 mg ml-1
) as needed to maintain areflexia,
along with a 1:1 mixture of dextrose (5%) and standard Ringer’s lactate to prevent dehydration.
A tracheotomy was performed to ensure ease of breathing throughout the experiment and filtered
air was provided through an air tube fixed at the open end of the tracheotomy. A craniotomy and
durotomy was performed, exposing right primary auditory cortex. Four Parylene-coated tungsten
microelectrodes (1-2 MΩ) were simultaneously lowered to layer (4/5) of right primary auditory
cortex (~600-800 µm). Electrode penetrations were marked using blood vessels as landmarks. In
addition, we recorded multiunit responses from 11 experimentally naïve rats to evaluate the
effect of training on neural responses (5 KIA-, 6 controls, previously published in Centanni et al.
2013).
All animals were exposed to the same set of auditory stimuli. Brief (25 ms) tones were
presented at 90 randomly interleaved frequencies (1-47 kHz) at 16 intensities (1- 75 dB SPL) to
determine the characteristic frequency of each site. Trains of six 25 ms tones were presented,
with a frequency change between the 5th
and 6th
tones. This set of stimuli was used to evaluate
the presence of mismatched negativity response between a repeated standard and a deviant
frequency. Next, broad band noise burst trains were presented at four different speeds (4, 7, 10
and 12.5 Hz) to evaluate following ability of A1 neurons. Each train consisted of 6 bursts with
duration of 25 ms for each burst. We also presented a series of speech stimuli identical to those
used in our lab previously (Engineer et al. 2008b; Porter et al. 2011; Shetake et al. 2011). The
sounds were recorded in a double-walled, soundproof booth and were spoken by a female native-

110
English speaker. The spectral envelope was shifted up in frequency by a factor of two using the
STRAIGHT vocoder (Kawahara 1997) to better accommodate the rat hearing range. Eight
individual speech sounds that were the same as those discriminated during the isolated speech
task (see Behavior Training section). Finally, we presented a sequence of speech sounds to
mimic the stream task. /Bad-bad-gad-sad-tad-dad/ was played at six speeds, measured in
syllables per second (2, 4, 5, 6.667, 10 and 20 sps). Each set of stimuli was randomly interleaved,
and presented at 20 repeats per recording site. All sounds were presented approximately 10 cm
from the left ear of the rat. Stimulus generation, data acquisition and spike sorting were
performed with Tucker-Davis hardware (RP2.1 and RX5) and software (Brainware). All animal
protocols were approved by the University of Texas at Dallas Institutional Animal Care and Use
Committee.
Analysis of neural recordings
Though behavior did not differ between groups, we analyzed tuning curves for each group to
see if the training order caused differences in the neural responses. No major differences were
seen, so all neural data was also pooled for analysis. To define primary (A1) and posterior (PAF)
auditory cortex sites, multi-unit recording sites were manually analyzed to select the
characteristic frequency of each site, as well as to obtain bandwidth, latency, peak firing and end
of peak response information. From this point on, only A1 and PAF sites were analyzed.
Following selection of A1 and PAF sites, basic firing properties were calculated in response
to tones. Firing latency is defined as the point in time (ms) that average firing rate (across all
repeats) first exceeds 2 standard deviations above the spontaneous firing rate, threshold is
defined as the lowest intensity that evoked a response from the multiunit site, and bandwidths

111
were calculated at 10, 20, 30 and 40 dB above threshold and defined as the range of frequencies
that evoked responses at the current intensity. In response to broad band click trains, normalized
spike rate (number of spikes evoked by bursts 2-6, normalized by the number of spikes to the
first burst) and vector strength (VS) were calculated. VS quantifies the degree of synchronization
between action potentials and repeated sounds. Mean VS is calculated with the formula:
where n = total number of action potentials, ti is the time of occurrence of the i’th action
potential, and T is the inter-stimulus interval. Perfect synchronization would result in a value of
one, whereas no synchronization would result in a value of zero. To investigate the reliability of
onset latency to repetitive stimuli, we calculated the time to peak latency within the first 80 ms
(the shortest inter-pulse-interval tested) of the first pulse at 4Hz and averaged across multiunit
sites. The variability in this measure, as reported in variance, was compared across KIA- and
controls.
Single trial response patterns to each of the isolated speech sounds were compared using
a nearest neighbor classifier (Centanni et al. 2013; Engineer et al. 2008b; Foffani and Moxon
2004; Foffani and Moxon 2005; Perez et al. 2012; Ranasinghe et al. 2012b; Shetake et al. 2011).
We chose this method because our earlier studies showed that the performance of this classifier
is highly correlated with rat behavioral discrimination. We used Euclidean distance to compare
single trial activity to the average activity (PSTH) evoked by 19 repeats each of two different
stimuli (Centanni et al. 2013; Engineer et al. 2008b; Foffani and Moxon 2004; Foffani and
Moxon 2005; Perez et al. 2012; Ranasinghe et al. 2012b; Shetake et al. 2011). For consonants,

112
activity was binned using 1 ms temporal precision over a 40 ms window to encompass the spike
timing precision present in the initial consonant (Engineer et al. 2008b; Porter et al. 2011;
Ranasinghe et al. 2012a), while vowel activity was binned across a single 400 ms window so that
spike count information was preserved (Perez et al. 2012; Ranasinghe et al. 2012a). The
classifier then compared the response of each single trial with the average activity template
(PSTH) evoked by all repeats of each of the speech stimuli presented. The current trial being
considered was not included in the PSTH to avoid artifact. The classifier attempted to identify
the stimulus that evoked the current single trial activity pattern by selecting the template that was
most similar to the single trial in units of Euclidean distance. ED was calculated using the
formula:
where nsites is each recording site and nbins is each of 40 one-millisecond bins being compared
between activity evoked by speech sound X versus speech sound Y. For vowel sounds, the
classifier counted the number of action potentials over a single 400 ms bin and compared the
single trial response with the two PSTH templates (Perez et al. 2012)(Ranasinghe et al. 2012a).
We used t-tests for all pairwise comparisons of the accuracy of both classifiers and across
experimental groups. 1-way ANOVA was used to compare vector strength across groups. When
necessary, Bonferroni correction was used to correct for multiple comparisons.

113
RESULTS
In utero RNAi of Kiaa0319 causes speech sound discrimination impairment
Rats with in utero RNA interference (RNAi) of the dyslexia-associated gene Kiaa0319 (KIA-
) have significantly higher trial-by-trial variability in neural firing to speech and non-speech
stimuli (Centanni et al. 2013) and we hypothesized that they would also have deficits on
behavioral speech sound discrimination tasks. We trained KIA- rats to discriminate a target
speech sound from a variety of speech sound distracters. Rats with in utero RNAi of Kiaa0319
were impaired at this task on the first couple days, but were not impaired in their ability to reach
the performance criterion compared to controls (10 sessions with a d’≥1.5; Figure B4.1). Both
groups reached this criterion in approximately 5 days (Controls: 4.4 ± 0.8 days vs. KIA-: 5.4 ±
5.4 days; unpaired t-test, p=0.35; Figure B4.1). We tested 8 KIA- rats and 5 control rats on a full
speech task in which they were required to press the lever to the target sound /dad/ and withhold
pressing to the distracter sounds (/bad/, /gad/, /sad/, /tad/, /dud/, /deed/, /dood/). On the first day,
both controls and KIA- rats performed at chance (51.9 ± 3.1% correct by controls vs. 44.8 ±
2.4% correct by KIA- compared to 50% chance; unpaired t-tests, p=0.84 and p=0.59
respectively; Figure A4.1A). On the following 4 days of the testing period, KIA- rats were
significantly worse than controls at performing this task (unpaired one-tailed t-tests, p<0.01;
Figure A4.1A), while control rats significantly improved during this time period (last day
performance was 76.5 ± 3.0% correct, paired t-test vs. first day, p=0.01; Figure A4.1A). On the
last day of testing, KIA- rats were better at vowel tasks than consonant tasks (58.9 ± 7.8% on
vowel tasks vs. 46.7 ± 5.0% correct on consonant tasks, paired t-test, p=0.01) and KIA- rats false
alarmed to distracter sounds more than control rats (61.3 ± 9.3% false alarms by KIA- rats vs.

114
32.7 ± 8.2% false alarms by control rats; unpaired t-test, p=0.04, Figure A4.1B&C). The result
that KIA- rats were impaired at speech sound discrimination tasks suggests that a variant in the
candidate dyslexic gene KIAA0319 can cause behavioral phoneme awareness deficits. The
observation that consonant sounds were more difficult than vowels for KIA- rats is consistent
with the phoneme impairments seen in humans with dyslexia (Tallal and Piercy 1974).
Rats with in utero RNAi of Kiaa0319 can improve on certain tasks with extensive speech
training
The most effective therapy for dyslexic children is extensive behavioral training using
modified speech sounds (Lovio et al. 2012; Penolazzi et al. 2010; Russo et al. 2005; Temple et
al. 2003). Training programs often focus on intensive practice on phoneme awareness and can
lead to improved speech perception (Lovio et al. 2012; Penolazzi et al. 2010; Russo et al. 2005;
Temple et al. 2003). We hypothesized that with additional training, KIA- rats would also
improve. KIA- rats did reach 80% correct on the full speech task (81.4 ± 2.3% correct on the last
day of training), but it took significantly longer to reach this point compared to controls (9.6 ±
0.6 days of training vs. 6.2 ± 0.6 days for control rats, unpaired t-test, p<0.01; Figure A4.2A).
We hypothesized that if the RNAi of Kiaa0319 was responsible for the impaired
performance in KIA- rats, that rats with a greater number of neurons affected by the RNAi
transfection would perform worse at the task than rats with fewer transfected neurons. We
counted the percentage of pyramidal neurons which were co-transfected with fluorescent protein
(see Methods) in layer 2/3 of primary auditory cortex bilaterally and compared the extent of the
transfection with the animals’ last day performance on the full speech discrimination test. In rats
with in utero RNAi of Kiaa0319, the percent of affected neurons was strongly correlated with

115
last day speech discrimination performance. Rats with a greater percentage of affected neurons
were more impaired at the task than rats with fewer affected neurons (R2= 0.77, p<0.01; Figure
A4.3A). The percentage of transfected neurons in control rats (injected with a scramble mRNA
and a different color protein) did not correlate with behavioral performance (R2= 0.61, p=0.12;
Figure A4.3B). The lack of correlation in our control rats suggests that the surgery itself did not
cause the behavioral impairment, but that the deficit seen in KIA- rats was due to RNAi of the
candidate dyslexia gene Kiaa0319. Our results suggest that the degree of in utero suppression of
this gene is related to each rats’ aptitude for learning the full speech sound task.
Following this additional week of training on full speech, we trained all rats for 2 weeks
on a speech in noise task. The same target and distracters from the full length task were used and
were presented with speech-shaped background noise at one of 4 intensities (0, 48, 60, or 72 dB
SPL; Shetake et al. 2012). We hypothesized that KIA- rats would be less able to learn a more
difficult speech discrimination task, such as speech in background noise. Children with dyslexia
can often perform speech discrimination in quiet at control levels, but have significant
impairment on the same task in background noise (Chandrasekaran et al. 2009; Nagarajan et al.
1999; Ziegler and Goswami 2005; Ziegler et al. 2009). On the first day of speech in noise
training, KIA- rats and control rats both experienced a drop in overall performance levels
compared to their last day of full speech training (first day of speech in noise by KIA- rats was
64.3 ± 6.3% correct vs. 81.1 ± 3.1% correct on the last day of full speech; p<0.01, and first day
of speech in noise by controls was 67.2 ± 8.0% correct vs. 84.2 ± 2.1% correct on the last day of
full speech; p<0.01; Figure A4.2A). The drop in performance seen from the last day of full
speech to the first day of speech in noise is likely due to the stress of switching from a relatively
116
easy task (speech in silence) to a more difficult task (speech sounds in a variety of background
noise). Control rats were able to improve over the course of 10 training days at 3 of the 4 noise
levels (last day performance and paired t-test of last day performance vs. first day; 0 dB 91.2 ±
1.5% p<0.01; 48 dB 86.9 ± 2.3% p<0.01; 60 dB 72.2 ± 2.3% p<0.01; 72 dB 51.9 ± 1.5% p=0.38;
Figure A4.2B). The inability to improve on the loudest intensity noise mimics previous chance
level performance at this noise level using control rats (Shetake et al. 2011). KIA- rats were also
able to improve over the course of training on two of the four noise levels (last day performance
and paired t-test of last day performance vs. first day; 0 dB 83.5 ± 3.0% p<0.01; 48 dB 78.9 ±
2.8% p<0.01; 60 dB 62.0 ± 2.1% p=0.11; 72 dB 51.2 ± 1.2% p=0.96; Figure A4.2B), but
remained significantly worse than control rats at three of the four noise levels (unpaired t-tests, 0
dB p=0.02, 48 dB p=0.03, 60 dB, p<0.01, 72 dB p=0.72). The improved performance caused by
full speech training did not seem to generalize to other conditions. This result suggests that
training with clear speech in quiet conditions may be the key to improving performance.
To test whether KIA- rats could learn an equally difficult task using clear speech in quiet,
we next trained rats for 40 days on a speech sequence task in which a target speech sound (/dad/)
was inserted into a random string of distracter sounds. This task was designed to be a difficult
task for rats to learn and to evaluate whether KIA- rats are simply unable to learn a challenging
speech task. Rats responded to the target sound by removing their noses from an infra-red
nosepoke (Sloan, Dodd, Rennaker II 2009). Since this task required a different response
mechanism than the previous tasks (infra-red nosepoke vs. lever press), several days of training
were required to teach rats the new task. There was no difference in the amount of time needed
to learn the task between control and KIA- rats. Performance between these two groups did not
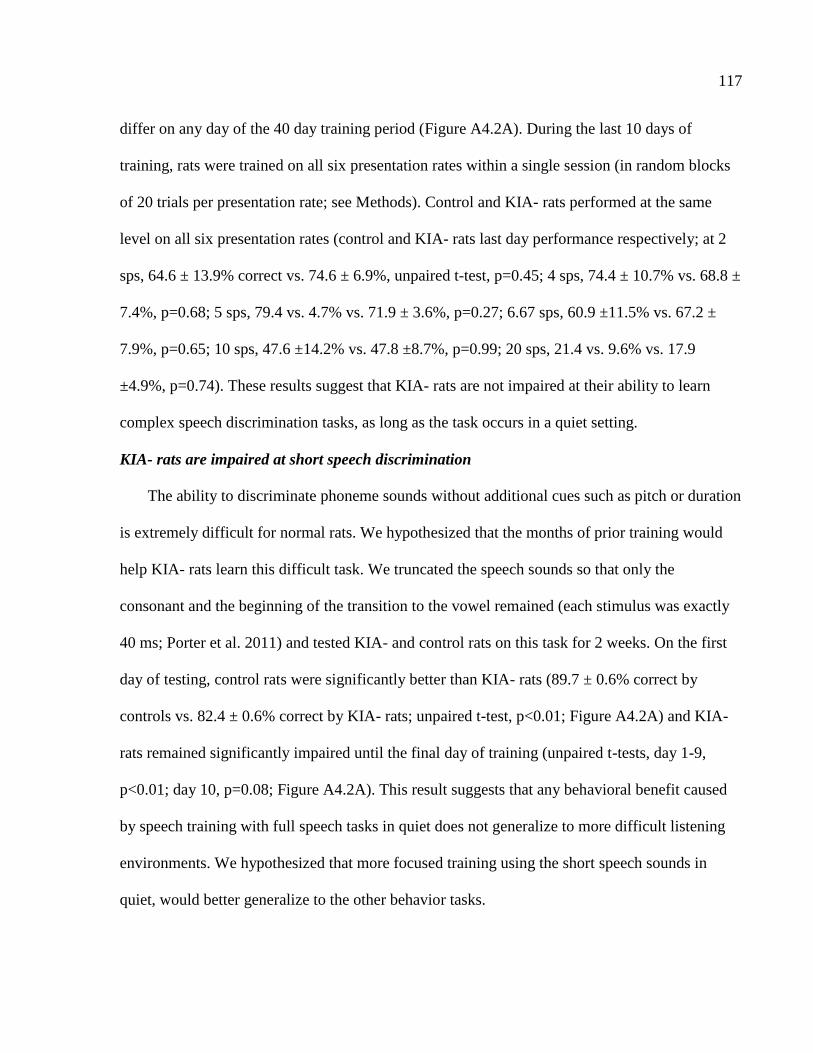
117
differ on any day of the 40 day training period (Figure A4.2A). During the last 10 days of
training, rats were trained on all six presentation rates within a single session (in random blocks
of 20 trials per presentation rate; see Methods). Control and KIA- rats performed at the same
level on all six presentation rates (control and KIA- rats last day performance respectively; at 2
sps, 64.6 ± 13.9% correct vs. 74.6 ± 6.9%, unpaired t-test, p=0.45; 4 sps, 74.4 ± 10.7% vs. 68.8 ±
7.4%, p=0.68; 5 sps, 79.4 vs. 4.7% vs. 71.9 ± 3.6%, p=0.27; 6.67 sps, 60.9 ±11.5% vs. 67.2 ±
7.9%, p=0.65; 10 sps, 47.6 ±14.2% vs. 47.8 ±8.7%, p=0.99; 20 sps, 21.4 vs. 9.6% vs. 17.9
±4.9%, p=0.74). These results suggest that KIA- rats are not impaired at their ability to learn
complex speech discrimination tasks, as long as the task occurs in a quiet setting.
KIA- rats are impaired at short speech discrimination
The ability to discriminate phoneme sounds without additional cues such as pitch or duration
is extremely difficult for normal rats. We hypothesized that the months of prior training would
help KIA- rats learn this difficult task. We truncated the speech sounds so that only the
consonant and the beginning of the transition to the vowel remained (each stimulus was exactly
40 ms; Porter et al. 2011) and tested KIA- and control rats on this task for 2 weeks. On the first
day of testing, control rats were significantly better than KIA- rats (89.7 ± 0.6% correct by
controls vs. 82.4 ± 0.6% correct by KIA- rats; unpaired t-test, p<0.01; Figure A4.2A) and KIA-
rats remained significantly impaired until the final day of training (unpaired t-tests, day 1-9,
p<0.01; day 10, p=0.08; Figure A4.2A). This result suggests that any behavioral benefit caused
by speech training with full speech tasks in quiet does not generalize to more difficult listening
environments. We hypothesized that more focused training using the short speech sounds in
quiet, would better generalize to the other behavior tasks.

118
KIA- rats can learn phoneme discrimination with extensive training
We trained a second group of 8 KIA- and 5 control rats on the short speech task for 28 days
(the length of time needed for control rats’ performance to reach ceiling; Porter et al. 2010). All
rats were trained on shaping and detection as described above. Following detection, group 2 rats
were trained on discrimination using the short speech stimuli. As seen previously, this task was
extremely difficult to learn; both control and KIA- rats needed 7 days of training to perform
above chance levels. Controls were able to perform the task at 80% correct after 12 ± 1.2 days of
training. KIA- rats were only slightly impaired at reaching this level of performance and needed
16.3 ± 2.1 days (unpaired 1-tailed t-test, p=0.07; Figure A4.4A). KIA- rats were not significantly
different from controls by the end of the 28 day training period (94.5 ± 1.6% correct on day 28
by controls vs. 90.8 ± 1.9% correct on day 28 by KIA- rats; unpaired 1-tailed t-test, p=0.11;
Figure A4.4A). These results suggest that with focused training, KIA- rats are able to learn the
short speech task and perform at control levels. We then tested these rats on the full speech task
to determine whether or not the focused short speech training would generalize to performance
on the other tasks using full speech sounds. KIA- rats were able to perform the full speech task
as well as control rats throughout the 10 day testing period (average percent correct in KIA- rats
was 87.7 ± 3.1% vs. 93.9 ± 2.2% in controls, unpaired t-test, p=0.37; Figure A4.4A). KIA- rats
were significantly below controls on only one of the four noise levels (average performance at 0
dB noise in KIA- rats was 89.5 ± 0.6% vs. 92.9 ± 0.9% correct in controls, p<0.01, at 48 dB,
KIA- rats achieved 90.1 ± 1.2% correct vs. 89.9 ± 2.3% by controls, p=0.97, at 60 dB, KIA- rats
achieved 76.6 ± 1.8% correct vs. 78.2 ± 3.6% correct by controls, p=0.71, at 72 dB, KIA- rats
achieved 49.6 ± 0.9% correct vs. 49.8 ± 1.2% correct by controls, p=0.53; Figure A4.4B) or

119
during the speech sequence task (average performance at 2 sps in KIA- rats was 76.0 ± 7.7%
correct vs. 71.1 ± 9.0% correct by controls; p=0.69, at 4 sps, KIA- rats achieved 69.8 ± 10.1%
correct vs. 63.1 ± 12.6% correct by controls; p=0.69, at 5 sps, KIA- rats achieved 78.1 ± 6.9%
correct vs. 74.7 ± 7.5% correct by controls; p=0.75, at 6.67 sps, KIA- rats achieved 73.6 ± 5.6%
correct vs. 69.4 ± 7.0% correct by controls; p=0.66, at 10 sps, KIA- rats achieved 41.7 ± 6.2%
correct vs. 44.4 ± 5.3% correct by controls; p=0.75, at 20 sps, KIA- rats achieved 15.6 ± 2.8%
correct vs. 21.0 ± 7.7% correct by controls; p=0.53; Figure A4.4C). Extensive behavioral
training in normal rats and in human dyslexics can improve neural responses to speech and non-
speech stimuli (Engineer et al. 2012; Habib et al. 2002; Jakkamsetti, Chang, Kilgard 2012;
Penolazzi et al. 2010; Takahashi et al. 2011). We hypothesized that the extensive training
programs our rats completed would also improve neural responses.
Extensive behavioral training restores neural firing patterns in KIA- auditory cortex
After 4 months of training and testing on the speech sound discrimination tasks described
above, all rats were anesthetized and neural recordings were acquired from primary (A1) and
posterior (PAF) auditory fields. Neural responses in untrained KIA- rats were significantly later
than control rats (Centanni et al. 2013). In response to tones and speech sounds, control A1 and
PAF sites fired faster after training. For example, untrained KIA- A1 sites fired 25.8 ± 0.6 ms
after tone onset versus 17.7 ± 0.6 ms after training (unpaired t-test, p<0.01) and PAF sites fired
45.6 ± 7.1 ms after tone onset vs. 29.5 ± 2.2 ms after training (unpaired t-test, p<0.01; Figure
B4.4A). Training also shortened control responses to tones in A1 (22.3 ± 0.7 ms in untrained A1
vs. 17.2 ± 0.6 ms in trained A1; unpaired t-test, p<0.01) but was less effective at shortening
latency in PAF (42.5 ± 7.2 ms in untrained PAF vs. 31.8 ± 2.7 ms in trained PAF; unpaired t-test,

120
p=0.11; Figure B4.4A). In addition to the significantly shorter onset latency, the trial by trial
variability in onset latency was significantly decreased in KIA- A1 (70.2 ± 4.1 ms2 in untrained
vs. 27.9 ± 4.4 ms2
after training; unpaired t-test, p<0.01; Figure A4.5A and Figure A4.6F) and
PAF (103.2 ± 3.9 ms2
in untrained vs. 44.5 ± 3.2 ms2
after training; unpaired t-test, p<0.01;
Figure A4.5A and Figure A4.6H). Training also decreased trial-by-trial variability in control A1
(40.6 ± 2.7 ms2
in untrained vs. 31.8 ± 3.3 ms2
after training; unpaired t-test, p=0.04; Figure
A4.5A and Figure A4.6E) and control PAF (103.2 ± 3.9 ms2 in untrained vs. 55.3 ± 3.5 ms
2 after
training; unpaired t-test, p<0.01; Figure A4.5A and Figure A4.6G). The additional 4 weeks of
training by group 2 rats caused control A1 and PAF variability to significantly decrease
compared to the group 1 control rats (A1: 65.3 ± 2.1% correct by group 1 vs. 77.2 ± 5.5% correct
by group 2; unpaired t-test, p<0.01, PAF: 59.4 ± 4.3 ms2 in group 1 vs. 29.5 ± 2.6 ms
2 in group
2; unpaired t-test, p<0.01; Figure B4.5A), but had no effect on KIA- neural variability (A1: 27.3
± 4.6 ms2 in group 1 vs. 29.4 ± 4.5 ms
2 in group 2; p=0.72, PAF: 44.5 ± 3.6 ms
2 in group 1 vs.
44.5 ± 3.9 ms2 in group 2, p=0.99; Figure B4.5A). The improved reliability in trial-by-trial
neural firing to auditory stimuli may generalize to improved neural discrimination ability.
We hypothesized that the training-induced neural plasticity would also extend to the ability
of KIA- neural recordings to identify speech stimuli. Using the nearest-neighbor classifier
described above, we compared neural classifier performance in trained versus untrained neural
recordings. Control A1 sites did not improve on the neural discrimination task as a result of
speech training (consonant tasks: 76.6 ± 0.9 correct vs. 76.4 ± 0.9% correct, using untrained or
trained A1 sites respectively; unpaired t-test, p=0.94; vowel tasks: 59.9 ± 0.9% vs. 58.9 ± 0.8%
correct using trained or untrained PAF sites, respectively; unpaired t-test, p=0.33; Figure

121
A4.5B&C and Figure B4.3E&G). The lack of training-induced plasticity in control rats supports
earlier studies showing an absence of plasticity after tone (Reed et al. 2011) in the A1 of normal
animals. PAF sites in control rats did significantly improve after training on neural
discrimination of consonant sounds (59.7 ± 3.2% correct in untrained sites vs. 66.9 ± 1.9%
correct after training; unpaired t-test, p<0.01; Figure A4.5B and Figure A4.6G). Training did not
improve control PAF sites’ ability to identify vowel stimuli (56.2 ± 3.4% correct in untrained
sites vs. 56.2 ± 1.6% correct after training; unpaired t-test, p=0.97; Figure A4.5C and Figure
B4.3G). A1 sites in KIA- rats were significantly better at the neural discrimination task following
behavioral training. KIA- A1 sites were significantly better after training at consonant
discrimination (67.8 ± 0.9% correct in untrained vs. 74.6 ± 0.8% correct after training; unpaired
t-test, p<0.01; Figure A4.5B and Figure A4.6F). Training was less effective at improving KIA-
A1 sites on neural discrimination of vowels (55.7 ± 1.1% correct in untrained vs. 57.4 ± 0.7%
correct after training; unpaired t-test, p=0.09; Figure A4.5C and Figure B4.3F). Trained KIA- A1
sites were not significantly different from trained control A1 sites (consonants p=0.46; vowels
p=0.13). Training improved KIA- PAF sites’ performance on neural consonant discrimination
(58.8 ± 2.0% correct in untrained sites vs. 67.7 ± 2.0% correct after training, p<0.01; Figure
A4.5B and Figure A4.6H) but not neural discrimination of vowels (56.4 ± 1.9% correct in
untrained sites vs. 55.4 ± 1.9% correct after training; unpaired t-test, p=0.52; Figure A4.5C and
Figure B4.3H). As with neural variability, we saw an increase in consonant classifier
performance in group 2 control PAF as compared to group 1 controls (65.3 ± 2.1% correct by
group 1 vs. 77.2 ± 5.5% correct by group 2; unpaired t-test, p<0.01; Figure B4.5). This result

122
may suggest that there is a ceiling to the amount of training-induced neural plasticity in a brain
with in utero knockdown of Kiaa0319 as compared to control rats.
We expected that extensive training would improve the ability of KIA- neurons to fire to
repetitive stimuli as well as to brief tones. Auditory cortex in untrained KIA- rats had
significantly lower vector strength than control rats (Centanni et al. 2013, Figure A4.7A and
Figure B4.4). After 4 months of speech discrimination training, vector strength in KIA- A1 was
no longer significantly different from control rats at any speed we tested (an average of 0.65 ±
0.1 in controls vs. 0.62 ± 0.1 in KIA- rats; 1-way ANOVA, F(1,6)=0.18, p=0.68; Figure
A4.7A&C). There were no significant differences in vector strength in PAF across control and
KIA- groups (unpaired t-tests; 4 Hz p=0.67, 7 Hz p=0.24, 10 Hz p=0.06, 12.5 Hz p=0.39).
Training did significantly improve vector strength in KIA- PAF (0.32 ± 0.1 in untrained KIA-
PAF vs. 0.51 ± 0.1 in trained KIA- PAF; 1-way ANOVA, F (1,6)=16.1, p<0.01; Figure
A4.7C&D), but did not affect vector strength in control PAF (0.45 ± 0.1 in untrained control
PAF vs. 0.55 ± 0.1 in trained PAF; 1-way ANOVA, F(1,6)=4.52, p=0.08; Figure A4.7C&D).
Untrained KIA- A1 sites fired more action potentials both spontaneously as well as to auditory
stimuli, such as tones, broad band bursts, and speech sounds (Centanni et al. 2013; Figure B4.3).
Training also changed these basic firing properties in both KIA- A1 and PAF (Figure B4.2).
These results suggest that extensive speech training also improves neural firing to non-speech
stimuli.
EEG and fMRI recordings from dyslexic children before and after training demonstrate an
improvement in the amplitude and latency of auditory-evoked responses (Hornickel et al. 2012;
Penolazzi et al. 2010; Russo et al. 2005; Temple et al. 2003; Tremblay and Kraus 2002). We

123
hypothesized that the average improvement in our multi-unit recordings (as local field potentials,
or LFPs) would also show improvements in amplitude and onset latency. After speech
discrimination training, local field potentials (LFPs) in control A1 responded faster to the onset
of the speech sound /dad/ (40.9 ± 0.4 vs. 35.9 ± 0.6 ms, untrained vs. trained, respectively;
unpaired t-test, p<0.01; Figure A4.8A). Trained KIA- A1 LFPs also responded faster compared
to untrained recordings (43.7 ± 0.8 vs. 32.9 ± 0.7 ms; unpaired t-test, p<0.01; Figure A4.8B). N1
amplitude was significantly increased as a result of training in control A1 (-72.4 ± 2.0 mV in
untrained control A1 vs. -151.3 ± 4.2 mV after training; unpaired t-test, p<0.01; Figure A4.8A)
and in KIA- A1 (-41.3 ± 1.5 mV in untrained KIA- A1 vs. -100.6 ± 2.9 mV after training;
unpaired t-test, p<0.01; Figure A4.8B). Latency of the N1 in control PAF was not significantly
affected by training (46.1 ms ± 1.3 ms in untrained control PAF vs. 42.4 ± 1.1 ms after training;
unpaired t-test, p=0.07; Figure A4.8C). KIA- PAF LFP had a longer latency following training
(20.8 ± 14.5 ms in untrained KIA- PAF vs. 42.0 ± 0.9 ms after training; unpaired t-test, p<0.01;
Figure A4.8D). The longer latency may be due in part to the significant increase in N1 amplitude
in KIA- PAF (-18.9 ± 3.5 mV in untrained KIA- PAF vs. -73.8 ± 5.1 mV after training; unpaired
t-test, p<0.01; Figure A4.8D), which sharpened the peak response. N1 amplitude in control PAF
was also significantly increased by training (-42.1 ± 5.2 mV in untrained control PAF vs. -94.6 ±
10.4 mV after training; unpaired t-test, p<0.01; Figure A4.8C). Our observation that training
induced plasticity improved neural discrimination performance of KIA- A1 and PAF sites
suggests a possible neural basis for the success of current therapeutic options for humans with
dyslexia. The result that control PAF improved after training supports the idea that auditory

124
fields higher than A1 may support auditory learning tasks in a unique and meaningful way (Lai
et al. 2011; Takahashi et al. 2011).
DISCUSSION
Summary of results
This study was designed to test the hypothesis that in utero RNAi of the candidate dyslexia
gene Kiaa0319 would cause impaired speech sound discrimination in adult rats. KIA- rats were
significantly impaired at discriminating a target speech sound from distracter speech sounds in a
variety of contexts and required twice as much training to perform at control levels. KIA- rats
were able to learn more difficult speech tasks, such as sequences and short speech. Extensive
training significantly reduced the variability in KIA- auditory cortex responses and improved the
neural encoding of speech sounds. Our results provide the first direct evidence that the
candidate-dyslexia gene KIAA0319 is directly related to phoneme perception. We provide
evidence that the impairments caused by specific developmental genetic variants may be
mediated by training.
Effect of anesthesia on neural responses
The majority of our neural recordings were made in the auditory cortex of anesthetized
rats. There is evidence that anesthesia affects basic firing properties of auditory cortex to tonal
stimuli. For example, neural responses in anesthetized animals can have sharper tuning curves
(Gaese and Ostwald 2001) and fire less spontaneous action potentials than when the animal is
awake (Capsius and Leppelsack 1996). In spite of these basic firing differences, neural encoding
of natural sounds, specifically human speech sounds, are not significantly different as a result of

125
anesthesia (Engineer et al. 2008b; Hromádka, DeWeese, Zador 2008; Huetz, Philibert, Edeline
2009; Steinschneider et al. 1994). In the current study, we recorded speech sounds from
anesthetized animals, but did not record from trained, awake rats. In our previous study, we
reported that anesthesia did not significantly affect neural responses to speech sounds in
experimentally-naïve rats (Centanni et al. 2013). Training on auditory tasks can affect neural
responses. For example, when rats are trained to identify a low frequency tone, there is a
corresponding expansion in the amount of auditory cortex neurons that preferentially respond to
the target frequency (Takahashi et al. 2011). It is possible that extensive training on speech
sound stimuli may also cause changes in the organization or firing patterns of awake rats.
Additional studies are needed to evaluate whether the auditory cortex of trained KIA- rats fires
differently following training and how those responses compare to the anesthetized responses
reported here.
Training effects may be larger in non-primary auditory fields
Extensive training can change firing patterns in primary auditory cortex. For example,
after rats are trained to discriminate sequences of auditory sounds, the bandwidth of primary
auditory cortex responses was significantly narrowed and response latencies were significantly
shorter (Engineer et al. 2012). Responses in other auditory fields can also be affected by
extensive training. After more than 20 days of behavioral training, the percentage of neurons
firing to the target frequency was significantly increased compared to naïve controls, and this
effect is just as big or bigger in other auditory fields, such as the ventral auditory field
(Takahashi et al. 2011).

126
Our results show that the trial-by-trial variability was reduced more after training in
control and KIA- PAF than in A1. There are several explanations for this observation. It is
possible that non-primary auditory fields are more sensitive to insult and are therefore more
affected in communication disorders than the primary field. When autistic children listen to
speech sounds, there is less evoked activity in the superior temporal gyrus compared to controls,
while primary auditory cortex responses do not differ (Lai et al. 2011). Another explanation
could be that this effect is merely an artifact of the degree of firing differences across fields. In
experimentally naïve posterior auditory field, tone-evoked responses are significantly later than
A1 and PAF has a significantly higher threshold, broader bandwidths and fewer evoked spikes
than A1, anterior, or ventral auditory fields (Polley et al. 2007). The observation that PAF seems
to benefit more from training than A1 does may be due to the smaller beginning impairment in
A1 causing a floor effect after training. Additional studies should be conducted in other auditory
fields to see if the other non-primary fields experience greater training-induced plasticity than
A1.
Effect of training time on neural improvement
Neural plasticity is likely a transient phenomenon, causing observable changes in the
cortical organization of auditory cortex during the learning phase of behavioral training, but
disappearing once the task is mastered (Reed et al. 2011; Takahashi et al. 2011). Such plasticity
is necessary for learning, but does not seem to be needed for continued accuracy at the task
(Reed et al. 2011). The degree of neural plasticity is related to task difficulty. Tasks that are easy
for an animal to acquire do not cause an obvious expansion in neurons dedicated to the task
(Engineer et al. 2012). Our observation that KIA- animals with a greater percentage of

127
transfected neurons were worse at the speech discrimination task suggests that animals with
more transfection may need more training to achieve high levels of accuracy than animals with
less transfection. The degree of impairment is likely related to the amount of training needed to
cause the improvement in neural response we report here. Future experiments should investigate
a link between the amount of transfection and the amount of training needed to normalize both
behavioral and neural responses to speech sounds.
Are these training effects specific to this candidate dyslexia gene?
We report here that in utero RNAi of the candidate dyslexia gene Kiaa0319 in rats causes
impaired speech discrimination performance. Humans with variants in this gene also have
impairments in phoneme awareness which correlates to reduced activation in left auditory cortex
(Pinel et al. 2012). KIAA0319 is not the only candidate dyslexia gene and accounts for a small
percentage of all dyslexia cases. The candidate dyslexia gene DCDC2 has been linked to visual
and spatial impairments in both rat models and in human dyslexics (Lind et al. 2010; Scerri et al.
2011), and knockout mice show some signs of rapid auditory processing impairment (Truong
2009). The dyslexia-associated gene ROBO1 has been linked to phonological impairments, but
only in one subpopulation of humans with the disorder (Bates et al. 2011). In addition, rats with
in utero RNAi of the gene DYX1C1 have small deficits in the ability to process rapid tonal
stimuli (Threlkeld et al. 2007). No studies to date have investigated the effect of in utero RNAi
of any of the other three dyslexia-associated genes on neural or behavioral speech processing.
Future studies are needed to evaluate these genes on tasks using speech sounds as stimuli. This
work will be critical to understanding the role variants in these other genes play on creating the
variety of behavioral symptoms seen in dyslexic individuals.

128
Improved variability may be the mechanism for therapy in human dyslexics
We report that extensive training of rats with in utero knockdown of Kiaa0319 can
improve both behavioral and neural processing of speech sound stimuli. Behavioral training
programs can improve speech processing in humans with dyslexia (Lovio et al. 2012; Penolazzi
et al. 2010; Russo et al. 2005; Temple et al. 2003), but the mechanism by which this training is
effective is still unknown. Our results show that extensive training was able to significantly
reduce trial-by-trial variability in onset latency to both speech and non-speech stimuli. Recent
studies suggest that this variability may be an underlying cause of the auditory phoneme
awareness deficits in dyslexic people. Auditory brain stem responses in children with dyslexia
are significantly more variable in response to speech sounds than healthy control children
(Hornickel and Kraus 2013). Neural responses in people with other disorders, such as autism,
can also be unreliable to a variety of sensory stimuli. Variability in the neural encoding of visual,
auditory, and somatosensory stimuli is significantly higher in autistic individuals compared to
controls (Dinstein et al. 2012). Interventions for dyslexic children can improve the latency and
firing amplitude of speech-evoked neural responses (Hornickel et al. 2012; Lovio et al. 2012;
Penolazzi et al. 2010; Russo et al. 2005; Temple et al. 2003), but it is not yet known what effect
this training has on the trial-by-trial variability in onset response. As individuals age, the neural
onset to auditory stimuli becomes less precise and reliable. With auditory training, the onset
latency to speech sounds is significantly reduced and corresponds to an increase in behavioral
ability (Anderson et al. 2013) . We suggest that trial-by-trial variability may be a mechanism for
the auditory processing impairments seen in dyslexia and the significant reduction in variability
caused by training may be a possible mechanism by which such training is effective.

129
Additional studies are needed in both human dyslexics as well as in animal models to further
evaluate this claim.
Conclusion
In utero RNAi of the candidate dyslexia gene Kiaa0319 causes behavioral impairments on
speech sound discrimination tasks by rats. These rats are able to learn complex tasks, such as
identifying a target sound in a rapid sequence, but still have difficulty identifying phonemes
without additional cues like duration or pitch. This result provides the first evidence that the
suppression of the gene KIAA0319 directly causes speech sound discrimination deficits. The
extent of the deficit is strongly correlated to the percentage of affected neurons and suggests a
possible mechanism for the large degree of variance seen in the symptoms of human dyslexics.
Extensive training reduces trial-by-trial onset variability and improves the accuracy of neurons to
encode speech sounds. This improvement in neural firing suggests that impairments caused by
developmental genetic variants may not be permanent.
Acknowledgments
The authors would like to thank K. Im, N Moreno, K Rahebi, E Hancik, M Borland, E Buell, M
Fink, and R Carraway for help with microelectrode recordings, as well as N Khodaparast, L
Baxter, K Trull, and N Wasko for help with histology. This work was supported by the National
Institute for Deafness and Communication Disorders at the National Institutes of Health
(R01DC010433 to MPK) and the National Institute of Child Health and Human Development at
the National Institutes of Health (HD055655 to JJL).

130
APPENDIX A
CHAPTER 4 FIGURES
Figure A4.1. Rats with in utero RNAi of Kiaa0319 are impaired at speech discrimination tasks.
A. On the first day of testing, KIA- and control rats both performed at chance level (unpaired t-
tests, p=0.84 and p=0.59 respectively). KIA- rats were significantly worse than control rats on
the full speech discrimination task for the remainder of testing (unpaired, one-tailed t-tests,
*=p<0.01). B. KIA- rats hit to the target sound dad at the same rate as control rats (unpaired t-
test; p=0.33), but false alarmed to the distracter sounds significantly more than control rats

131
Figure A4.1 continued…
(*=p=0.04). C. Break down of lever press rates to each of the distracter sounds. KIA- rats
responded to every sound significantly more than control rats (unpaired t-tests, *=p<0.01).

132
Figure A4.2. Extensive speech discrimination training can improve on clear speech tasks. A.
After an additional week of training, 8 KIA- rats were able to perform the full speech task at the
same level as 5 control rats (unpaired t-test, p=0.24). Rats were then trained for 2 weeks on a
speech in noise task. On the first day, control and KIA- rats experienced a drop in performance
compared to full speech (paired t-tests; p<0.01). By the last day of training, control rats had
significantly improved on 3 of the 4 noise levels (last day performance and paired t-test of last
day performance vs. first day; 0 dB p<0.01; 48 dB p<0.01; 60 dB p<0.01; 72 dB p=0.38). KIA-
rats remained significantly below control levels at the end of training (unpaired t-tests, 0 dB
p=0.02, 48 dB p=0.03, 60 dB, p<0.01, 72 dB p=0.72). Rats were next trained on a sequence task
in which a target sound was inserted into a sequence of random distracter speech sounds. There
were no significant differences between control and KIA- rats during this 40 day training period
(at 2 sps; p=0.41, at 4 sps; p=0.90, at 5 sps; p=0.50, at 6.67 sps; p=0.85, at 10 sps; p=0.91, at 20
sps; p=0.97). For this task, chance performance was 0% rather than 50% because in this task,
distracters were presented significantly more often than targets. Finally, rats were trained for 2
weeks on a short speech task in which only the first 40 ms of the speech stimulus was presented.
KIA- rats were significantly impaired at this task compared to controls until the final day of
training (unpaired t-tests, day 1-9, p<0.01; day 10, p=0.08). B. Breakdown of the last day
performance of rats on the speech in noise task. Both control and KIA- rats performed at chance
level at the highest noise intensity (72 dB; unpaired t-test, p=0.72). KIA- rats were significantly
impaired at the remaining 3 noise levels compared to controls (0 dB; p=0.02, 48 dB; p=0.03, 60
dB; p<0.01). C. Breakdown of last day performance of rats on the sequence task. There were no
significant differences between control and KIA- rats at any presentation rate tested (2 sps,
p=0.45; 4 sps, p=0.68; 5 sps, p=0.27; 6.67 sps, p=0.65; 10 sps, p=0.99; 20 sps, p=0.74).
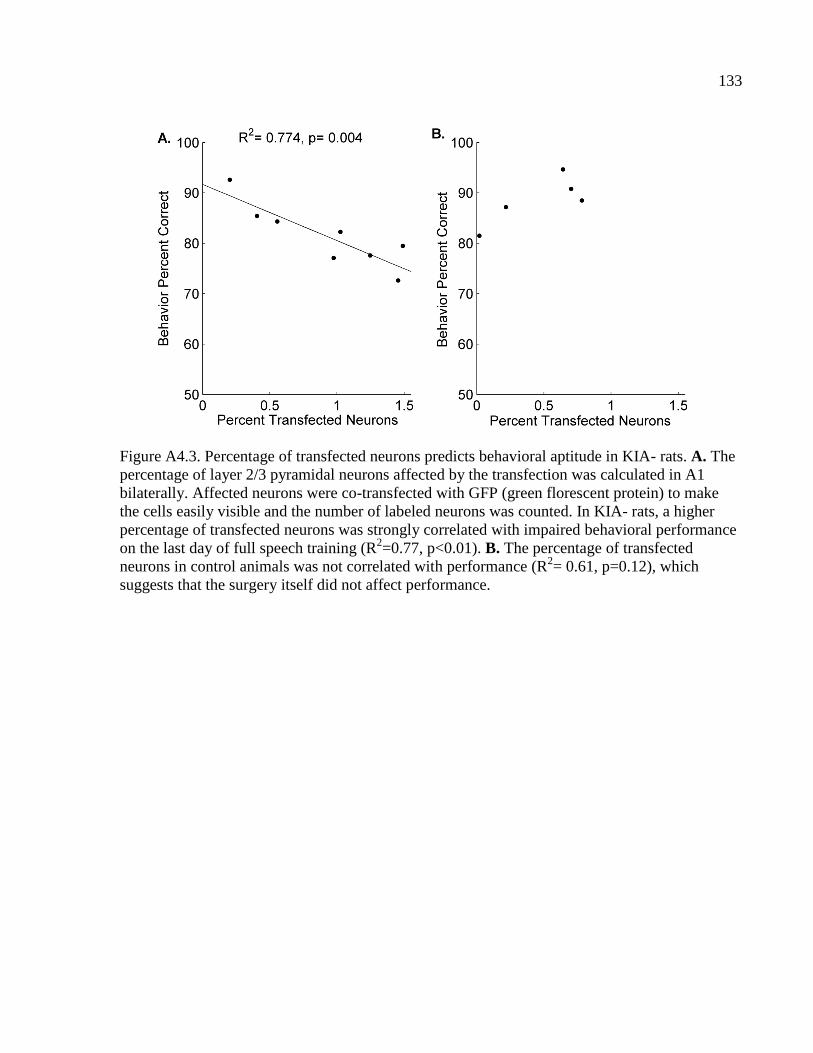
133
Figure A4.3. Percentage of transfected neurons predicts behavioral aptitude in KIA- rats. A. The
percentage of layer 2/3 pyramidal neurons affected by the transfection was calculated in A1
bilaterally. Affected neurons were co-transfected with GFP (green florescent protein) to make
the cells easily visible and the number of labeled neurons was counted. In KIA- rats, a higher
percentage of transfected neurons was strongly correlated with impaired behavioral performance
on the last day of full speech training (R2=0.77, p<0.01). B. The percentage of transfected
neurons in control animals was not correlated with performance (R2= 0.61, p=0.12), which
suggests that the surgery itself did not affect performance.
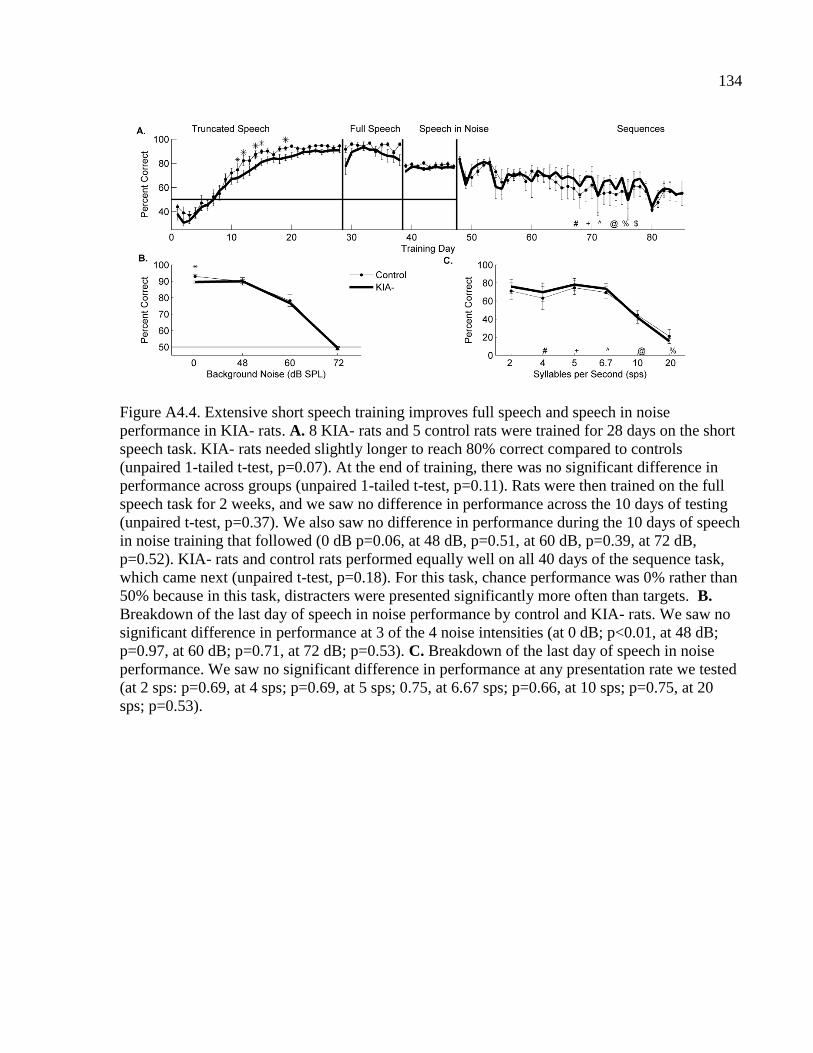
134
Figure A4.4. Extensive short speech training improves full speech and speech in noise
performance in KIA- rats. A. 8 KIA- rats and 5 control rats were trained for 28 days on the short
speech task. KIA- rats needed slightly longer to reach 80% correct compared to controls
(unpaired 1-tailed t-test, p=0.07). At the end of training, there was no significant difference in
performance across groups (unpaired 1-tailed t-test, p=0.11). Rats were then trained on the full
speech task for 2 weeks, and we saw no difference in performance across the 10 days of testing
(unpaired t-test, p=0.37). We also saw no difference in performance during the 10 days of speech
in noise training that followed (0 dB p=0.06, at 48 dB, p=0.51, at 60 dB, p=0.39, at 72 dB,
p=0.52). KIA- rats and control rats performed equally well on all 40 days of the sequence task,
which came next (unpaired t-test, p=0.18). For this task, chance performance was 0% rather than
50% because in this task, distracters were presented significantly more often than targets. B.
Breakdown of the last day of speech in noise performance by control and KIA- rats. We saw no
significant difference in performance at 3 of the 4 noise intensities (at 0 dB; p<0.01, at 48 dB;
p=0.97, at 60 dB; p=0.71, at 72 dB; p=0.53). C. Breakdown of the last day of speech in noise
performance. We saw no significant difference in performance at any presentation rate we tested
(at 2 sps: p=0.69, at 4 sps; p=0.69, at 5 sps; 0.75, at 6.67 sps; p=0.66, at 10 sps; p=0.75, at 20
sps; p=0.53).

135
Figure A4.5. Extensive behavioral training improves reliability of neural firing and neural
discrimination performance. A. Trial-by-trial variability was compared between trained and
untrained neural recordings in control A1, KIA- A1, control PAF, and KIA- PAF. Training
significantly decreased the variability in onset latency in KIA- A1 (unpaired t-test,*= p<0.01)
and KIA- PAF (unpaired t-test, *=p<0.01). Training also decreased variability in control A1
(unpaired t-test, *=p=0.04) and control PAF (unpaired t-test, *=p<0.01). B. Extensive behavioral
training improved the ability of neural responses to discriminate consonant speech sounds in
every field except control A1. Control PAF sites significantly improved after training (unpaired
t-test, *=p<0.01), as did KIA- A1 (unpaired t-test,*= p<0.01) and KIA- PAF (unpaired t-test,
*=p<0.01). C. Training did not improve neural discrimination performance on vowel tasks in
any field: in control A1 (unpaired t-test, p=0.33), control PAF (unpaired t-test, p=0.97), KIA- A1
(unpaired t-test, p=0.09), or KIA- PAF (unpaired t-test, p=0.52).

136
Figure A4.6. Training improves firing reliability in response to consonant speech sounds. Single
site examples of neural responses to the consonant sounds /d/ and /b/ in every field before and
after training. Classifier performance for each site is plotted on top of each panel, and trials
which the classifier guessed incorrectly are marked by an ‘x’. A. A representative single site in
untrained control A1. This data was originally collected for and reported in Centanni et al. 2013.
B. A representative single site in untrained KIA- A1. This data was originally collected for and
reported in Centanni et al. 2013. C. A representative single site example in untrained control
PAF. Control PAF sites had longer onset latency to tones than A1 sites and had a higher
variability in onset latency (unpaired t-tests, p<0.01 and p<0.01 respectively). D. A
representative single site example in untrained KIA- PAF. KIA- PAF sites had longer onset
latency to tones than A1 sites and had a higher variability in onset latency (unpaired t-tests,
p<0.01 and p<0.01 respectively). E. A representative single site example in trained control A1.
Training did not significantly affect the ability of control A1 sites to encode consonant stimuli.
F. A representative single site example in trained KIA- A1. Training significantly improved the

137
Figure A4.6 continued…
trial by trial variability in KIA- A1 sites (unpaired t-test, p<0.01) as well as reduced the number
of action potentials fired (unpaired t-test, p<0.01; Figure B4.2). These aspects of neural plasticity
likely contributed to the increased classifier performance. G. A representative single site
example in trained control PAF. Training significantly improved trial by trial variability in this
field (unpaired t-test, p<0.01) and likely contributed to the improved classifier performance. H.
A representative single site example in trained KIA- PAF. Training shortened onset latencies
(unpaired t-test, p<0.01) and reduced trial-by-trial variability in this field (unpaired t-test,
p<0.01). These properties likely contributed to the improved classifier performance.

138
Figure A4.7. Training improves the ability of KIA- A1 and PAF sites to fire reliably to repetitive
stimuli. A. Untrained KIA- A1 sites are significantly worse at following repetitive stimuli as
measured by vector strength (*=p<0.01). Data was originally collected for and reported in
Centanni et al. 2013. B. There was no significant difference in A1 vector strength between
control and KIA- rats after extensive behavioral training (one-way ANOVA F(1,6)=0.18,
p=0.68). C. Prior to training, there were no significant differences in vector strength between
control and KIA- PAF sites (unpaired t-tests; 4 Hz p=0.67, 7 Hz p=0.24, 10 Hz p=0.06, 12.5 Hz
p=0.39). D. Extensive training significantly improved KIA- PAF vector strength (one-way
ANOVA F (1,6)=16.1, p<0.01) but did not affect control PAF vector strength (F(1,6)=4.52,
p=0.08).

139
Figure A4.8. Extensive behavioral training shortens latency and amplitude of N1 component of
LFP response to the speech sound /dad/. Responses are plotted with gray markers at -50 and 50
mV to help visualize differences across plots. Significant differences are marked by a black line.
A. LFP response to the sound /dad/ in untrained control and KIA- A1. This data was originally
collected for and reported in Centanni et al. 2013. B. Extensive training improves onset latency
and amplitude of the LFP response in KIA- A1. After this training, there were no differences in
LFP response between control and KIA- A1. C. LFP response to the sound /dad/ in untrained
control and KIA- PAF sites. As was seen in A1 recordings, latency and amplitude of KIA- PAF
responses were significantly different from control recordings. D. Following training, there were
not significant differences in the LFP response to the sound /dad/ between control PAF and KIA-
PAF.

140
APPENDIX B
CHAPTER 4 SUPPLEMENTARY FIGURES
A. Figure B4.1, related to Figure A4.1.
Rats were first trained to press a lever, which triggered the presentation of the target sound
(/dad/) and a sugar pellet reward. KIA- rats learned this task in the same amount of time as
control rats (to criterion of 2 sessions of 100 self presses; 113.4 ± 14.2 minutes for KIA- rats vs.
141.5 ± 27.2 minutes for controls; unpaired t-test, p=0.30). After learning to press the lever, rats
were transitioned to detection in which they were
required to press the lever only when the target sound
/dad/ was presented. Rats with in utero RNAi of
Kiaa0319 were not impaired in their ability to switch
from free pressing to waiting for the target sound. Both
groups were able to reach the performance criterion (10
sessions with a d’≥1.5) in approximately 5 days
(Controls: 4.4 ± 0.8 days vs. KIA-: 5.4 ± 5.4 days;
unpaired t-test, p=0.35; Figure B4.1A). To determine
whether KIA- rats also had attention impairments, we
analyzed reaction times as well as hit and false alarm
rates. KIA- rats did not take longer to respond to speech
sounds as compared to controls. On the first day of
training, KIA- rats actually responded faster than
controls (1.7 ± 0.1 s vs. 2.2 ± 0.1 s, KIA- and controls
respectively, one tailed t-test, p<0.01; Figure B4.1B).
KIA- rats did not false alarm to silent catch trials more
than control rats at any point during detection training
(one tailed t-tests, p=0.51; Figure B4.1C). KIA- rats did
miss more target sounds than controls did early in
training, but were not significantly different from
controls throughout the remainder of detection training
(days 2 and 3 of detection training, one tailed t-test,
p<0.01; Figure B4.1C). In utero RNAi of Kiaa0319 did
not impair rats’ ability to learn to press a lever in
response to a target sound, and were then able to
transition to a more difficult discrimination task (Figure

141
Figure B4.1 continued…
A4.1, Main text). This observation supports earlier reports that these animals can hear speech
sounds and can learn behavioral tasks (Centanni et al. 2013; Szalkowski et al. 2012).
Figure B4.1. Rats with in utero RNAi of Kiaa0319 are able to learn a simple lever pressing task.
A. KIA- rats were not impaired at their ability to reach a criterion of 10 sessions with a d’≥1.5 as
compared to control rats. Both groups were able to learn this task within 7 days of training (14
sessions). B. KIA- rats responded to the target sound later than control rats on the first day of
training (p<0.01). By the following day, and for the rest of the training period, there was no
difference in response times across groups. C. KIA- rats respond to the target sound less than
control rats do during the first 3 days of training (*=p<0.01). Performance was not significantly
different overall due to the “normal” false alarm rate to silent catch trials on these days. By the
middle of training, KIA- rats were hitting to the target and withholding response to the silent
catch trials at the same rate as control rats.

142
B. Figure B4.2, related to Figures A4.3 & A4.4.
We trained rats for 4 months on a variety of speech discrimination tasks (Figures A4.3&
A4.4, Main Text) and evaluated the effect of such training on neural firing properties. Training
reduced onset latency in both KIA- A1 (25.8 ± 0.6 ms in untrained vs. 17.7 ± 0.7 ms after
training; p<0.01) and PAF (45.6 ±7.1 ms in untrained vs. 29.5 ± 2.2 ms after training, p=0.01;
Figure B4.2A), and KIA- A1 also fired fewer evoked spikes after training (2.9 ± 0.1 spikes in
untrained vs. 2.4 ± 0.1 spikes after training, p<0.01; Figure B4.2D). This reduction in action
potentials may be related to the decrease in neural variability we observed (Figure A4.5, Main
Text). Control A1 sites had shorter latencies (22.3 ± 0.7 ms in untrained vs. 17.2 ± 0.6 spikes
after training, p<0.01; Figure B4.2A), narrower bandwidths (2.3 ±0.1 octaves in untrained vs. 1.9
± 0.1 octaves after training, p<0.01; Figure B4.2B), and had a greater number of driven action
potentials to tones (2.8 ± 0.1 spikes in untrained vs. 3.2 ± 0.1 spikes after training, p<0.01;
Figure B4.2D). Thresholds were not affected by training in any group (Figure B4.2C).
Figure B4.2. Training affects basic neural firing properties to tonal stimuli in KIA- and Control
rats. A. Training significantly shortened the onset latency in Control A1 (22.3 ± 0.7 ms in
untrained vs. 17.2 ± 0.6 spikes after training, p<0.01), KIA- A1 (25.8 ± 0.6 ms in untrained vs.
17.7 ± 0.7 ms after training; p<0.01), and KIA- PAF (45.6 ±7.1 ms in untrained vs. 29.5 ± 2.2 ms
after training, p=0.01). No significant differences were seen in control PAF sites. B. Extensive
behavioral training shortened bandwidths in Control A1 (2.3 ±0.1 octaves in untrained vs. 1.9 ±
0.1 octaves after training, p<0.01), but had no effect on bandwidths in the other fields. C.

143
Figure B4.2 continued…
Extensive behavioral training had no effect on auditory thresholds in any group or field (control
A1; p=0.72, KIA- A1; p=0.06, control PAF; p=0.90, KIA- PAF; p=0.53). D. Extensive
behavioral training increased the number of tone-evoked action potentials fired in control A1
(2.8 ± 0.1 spikes in untrained vs. 3.2 ± 0.1 spikes after training, p<0.01), but reduced the number
of tone-evoked spikes fired in KIA- A1 (2.9 ± 0.1 spikes in untrained vs. 2.4 ± 0.1 spikes after
training, p<0.01). The reduction in spikes in KIA- A1 may contribute to the improved neural
encoding of consonants, since the spontaneous rate of firing and the number of evoked spikes in
untrained KIA- was significantly higher than controls (Centanni et al., 2013).

144
C. Figure B4.3, related to Figure A4.6.
After training, trial-by-trial variability in onset latency across sites in KIA- A1 and PAF as
well as control PAF were significantly reduced (Figure A4.5, Main Text). Responses to
consonant speech sounds were significantly more precise following training and were better able
to encode the differences between consonant sounds (Figure A4.6, Main Text). We saw a similar
effect in the encoding of vowel sounds following training. Vowel sounds are encoded using
spike count over a single 400 ms analysis window (Perez et al. 2012). As reported previously,
untrained control and KIA- A1 responded to vowel sounds with a high degree of variability, and
these two sites performed worse at the vowel task than at the consonant task (Figure B4.3 A&B;
data originally collected for and reported in Centanni et al. 2013). Untrained PAF in control
animals was slightly worse at the vowel task than A1 in each group. Average performance by
untrained control PAF sites was 64.4 ± 2.4% correct vs. 73.4 ± 0.6% correct in untrained control
A1 (p<0.01; Figure B4.3C).
Performance in untrained
KIA- PAF sites was not
significantly worse than
untrained KIA- A1 sites (64.3
± 1.4% correct in PAF vs.
62.9 ± 0.1% correct in A1;
p=0.71; Figure B4.3D).
Following training, we
noticed a slight (but not
significant) improvement in
the neural encoding of
vowels. Trial-by-trial
variability was reduced in
every field (Figure B4.3 E-H
and Figure A4.5, Main Text),
which slightly improved the
ability of each site to encode
differences in vowel sounds.
This result suggests that the
specific training tasks we
used benefitted consonant
processing more effectively
than vowel processing.
Figure B4.3. Extensive behavioral training improves neural encoding of vowel sounds in control
and KIA- auditory cortex. A. A representative site from untrained control A1. The number of

145
Figure B4.3 continued…
spikes encoded in response to each vowel sound was used to predict which sound evoked each
single trial response. Data originally collected for and reported in Centanni et al. 2013. B. A
representative site from untrained KIA- A1. The variability in neural firing was significantly
higher in KIA- sites, which significantly impaired the ability of these sites to perform the vowel
discrimination task. Data originally collected for and reported in Centanni et al. 2013. C. A
representative site from untrained control PAF. D. A representative site from untrained KIA-
PAF. E. A representative site from trained control A1. Though training did not have a significant
impact on the classifier performance, the reduced variability in this field following training did
provide some improvement on neural processing of vowels in this field. F. A representative site
from trained KIA- A1. The improved variability in KIA- neurons after training did improve
classifier performance on the vowel tasks, though this improvement was not significant. G. A
representative site from trained control PAF. There was significant reduction in trial-by-trial
variability in this field after training, and there was slight (but not significant) improvement in
this fields’ vowel classifier performance. H. A representative site from trained KIA- PAF. There
was significant reduction in trial-by-trial variability in this field after training, and there was
slight (but not significant) improvement in this fields’ vowel classifier performance.

146
D. Figure B4.4, related to Figure A4.7.
Rats were implanted with a chronic array of 16 microelectrodes into right primary auditory
cortex. Neural recordings were acquired in a single session while the animals were awake,
unrestrained, and passively listening to a variety of stimuli. This data was collected for and
partially reported in Centanni et al. 2013. In response to click trains at a variety of speeds, 55
sites in 9 KIA- rats were less able then controls (16 sites in 3 animals) to phase-lock to these
stimuli as measured by vector strength (Figure B4.4). The difference between vector strength in
KIA- rats versus control rats is not significant at speeds less than 76 Hz in the awake animals
(Figure B4.4), while it was significant at 4, 7, 10, and 12.5 Hz in the anesthetized condition
(Figure A4.7, Main Text). Vector strength is a metric that relies on spike count for the
calculation. Since recordings from awake animals have higher spontaneous firing than
anesthetized recordings, this discrepancy in spike count may be driving the lack of a significant
effect at the slower speeds in the awake recordings.
Figure B4.4. Untrained, awake KIA- neurons are impaired at following repetitive stimuli.
Primary auditory cortex responses to repetitive click trains from 9 KIA- rats and 3 control rats
chronically implanted with a 16 microelectrode array. Vector strength in KIA- rats was
significantly worse than control rats at speeds between 76 and 166 Hz (*=p<0.01). At speeds of
9 through 40 Hz, KIA- rats have slightly (but not significantly) lower vector strength. The higher
spontaneous firing rate in awake rats is likely the factor keeping this trend from reaching
significance.

147
E. Figure B4.5, related to Figure A4.5.
The 4 weeks of additional training was also able to further reduce the trial-by-trial onset
latency variability in control rats, but not KIA- rats as compared to group 1. In control A1, neural
recordings from group 2 rats had lower trial-by-trial variability compared to group 1 (34.6 ± 3.3
ms2 in group 1 vs. 20.3 ± 3.2 ms
2 in group 2; unpaired t-test, p=0.01; Figure B4.5A and Figure
A4.6, Main Text). Control PAF in group 2 was also less variable trial-by-trial as a result of the
additional training (59.4 ± 4.3 ms2 in group 1 vs. 29.5 ± 2.6 ms
2 in group 2; unpaired t-test,
p<0.01; Figure B4.5A). Trial-by-trial variability in KIA- rats did not decrease with additional
training (A1: 27.3 ± 4.6 ms2 in group 1 vs. 29.4 ± 4.5 ms2 in group 2; p=0.72, PAF: 44.5 ± 3.6
ms2 in group 1 vs. 44.5 ± 3.9 ms2 in group 2, p=0.99; Figure B4.5A). We observed an increase
in neural discrimination (as measured by the nearest-neighbor classifier) ability selectively in
control PAF. Neural activity from group 2 control PAF sites were better able to discriminate
between pairs of consonants than group 1 control PAF (65.3 ± 2.1% correct by group 1 vs. 77.2
± 5.5% correct by group 2; unpaired t-test, p<0.01; Figure B4.5B). Control and KIA- A1 and
KIA- PAF sites did not improve on the neural consonant discrimination task as a result of
additional training (unpaired t-tests; p=0.29, p=0.16, and p=0.88, respectively; Figure B4.5B).
Similarly, no group experienced an increase in neural vowel discrimination performance as a
benefit of additional training (Control A1, p=0.05; Control PAF, p=0.36; KIA- A1, p=0.42; KIA-
PAF, p=0.70; Figure B4.5C). The result that additional training did not provide additional neural
plasticity in KIA- rats suggests that there may be a limit in how beneficial behavioral therapy can
be in mediating the impairment caused by variants in Kiaa0319.
Figure B4.5. An additional 4 weeks of behavior training causes additional plasticity in control
rats. A. The additional training received by group 2 caused a significant reduction in trial-by-trial
variability in control A1 (p=0.01) and control PAF (p<0.01). No significant changes were seen in

148
Figure B4.5 continued…
either field in KIA- rats (p=0.72 and p=0.99 in A1 and PAF respectively). B. Additional training
improved the ability of control PAF sites to perform the consonant neural discrimination task
(p<0.01), but this training did not improve classifier performance in control A1 (p=0.29), KIA-
A1 (p=0.16), or KIA- PAF (p=0.88). C. Additional training did not improve the ability of neural
activity in any group or field to perform the neural discrimination task using vowel stimuli.
Control A1; p=0.05, KIA- A1; p=0.42, control PAF; p=0.36, KIA- PAF, p=0.70.

149
REFERENCES
Ahissar M, Protopapas A, Reid M, Merzenich MM. 2000. Auditory processing parallels reading
abilities in adults. Proceedings of the National Academy of Sciences 97(12):6832.
Anderson S, White-Schwoch T, Parbery-Clark A, Kraus N. 2013. Reversal of age-related neural
timing delays with training. Proceedings of the National Academy of Sciences .
Bai J, Ramos RL, Paramasivam M, Siddiqi F, Ackman JB, LoTurco JJ. 2008. The role of DCX
and LIS1 in migration through the lateral cortical stream of developing forebrain. Dev
Neurosci 30(1-3):144-56.
Bai J, Ramos RL, Ackman JB, Thomas AM, Lee RV, LoTurco JJ. 2003. RNAi reveals
doublecortin is required for radial migration in rat neocortex. Nat Neurosci 6(12):1277-83.
Bates TC, Luciano M, Medland SE, Montgomery GW, Wright MJ, Martin NG. 2011. Genetic
variance in a component of the language acquisition device: ROBO1 polymorphisms
associated with phonological buffer deficits. Behav Genet 41(1):50-7.
Boscariol M, Guimarães CA, Hage SRV, Cendes F, Guerreiro MM. 2010. Temporal auditory
processing: Correlation with developmental dyslexia and cortical malformation. Pró-Fono
Revista De Atualização Científica 22(4):537-42.
Burbridge TJ, Wang Y, Volz AJ, Peschansky VJ, Lisann L, Galaburda AM, Lo Turco J, Rosen
GD. 2008. Postnatal analysis of the effect of embryonic knockdown and overexpression of
candidate dyslexia susceptibility gene homolog Dcdc2 in the rat. Neuroscience 152(3):723-
33.
Capsius B and Leppelsack H. 1996. Influence of urethane anesthesia on neural processing in the
auditory cortex analogue of a songbird. Hear Res 96(1):59-70.
Centanni T, Booker A, Sloan A, Chen F, Maher B, Carraway R, Khodaparast N, Rennaker R,
LoTurco J, Kilgard M. 2013. Knockdown of the dyslexia-associated gene Kiaa0319 impairs
temporal responses to speech stimuli in rat primary auditory cortex. Cerebral Cortex.
Chandrasekaran B, Hornickel J, Skoe E, Nicol T, Kraus N. 2009. Context-dependent encoding in
the human auditory brainstem relates to hearing speech in noise: Implications for
developmental dyslexia. Neuron 64(3):311-9.

150
Cope N, Harold D, Hill G, Moskvina V, Stevenson J, Holmans P, Owen MJ, O’Donovan MC,
Williams J. 2005. Strong evidence that< i> KIAA0319</i> on chromosome 6p is a
susceptibility gene for developmental dyslexia. The American Journal of Human Genetics
76(4):581-91.
Dinstein I, Heeger DJ, Lorenzi L, Minshew NJ, Malach R, Behrmann M. 2012. Unreliable
evoked responses in autism. Neuron 75(6):981-91.
Eden GF and Moats L. 2002. The role of neuroscience in the remediation of students with
dyslexia. Nat Neurosci 5:1080-4.
Elbro C, Nielsen I, Petersen DK. 1994. Dyslexia in adults: Evidence for deficits in non-word
reading and in the phonological representation of lexical items. Annals of Dyslexia
44(1):203-26.
Engineer CT, Kilgard MP, Assmann PF, Atzori M, Thompson LT. 2008a. Speech Sound Coding
and Training-Induced Plasticity in Primary Auditory Cortex .
Engineer CT, Perez CA, Chen YTH, Carraway RS, Reed AC, Shetake JA, Jakkamsetti V, Chang
KQ, Kilgard MP. 2008b. Cortical activity patterns predict speech discrimination ability. Nat
Neurosci 11(5):603-8.
Engineer N, Engineer C, Reed A, Pandya P, Jakkamsetti V, Moucha R, Kilgard M. 2012.
Inverted-U function relating cortical plasticity and task difficulty. Neuroscience .
Fisher SE and DeFries JC. 2002. Developmental dyslexia: Genetic dissection of a complex
cognitive trait. Nature Reviews Neuroscience 3(10):767-80.
Foffani G. and Moxon KA. 2005. Studying the role of spike timing in ensembles of neurons.
Neural engineering, 2005. conference proceedings. 2nd international IEEE EMBS
conference onIEEE. 206 p.
Foffani G and Moxon KA. 2004. PSTH-based classification of sensory stimuli using ensembles
of single neurons. J Neurosci Methods 135(1):107-20.
Gaese BH and Ostwald J. 2001. Anesthesia changes frequency tuning of neurons in the rat
primary auditory cortex. J Neurophysiol 86(2):1062-6.
Galaburda AM, LoTurco J, Ramus F, Fitch RH, Rosen GD. 2006. From genes to behavior in
developmental dyslexia. Nat Neurosci 9(10):1213-7.
Galaburda AM, Sherman GF, Rosen GD, Aboitiz F, Geschwind N. 1985. Developmental
dyslexia: Four consecutive patients with cortical anomalies. Ann Neurol 18(2):222-33.

151
Habib M, Rey V, Daffaure V, Camps R, Espesser R, Joly-Pottuz B, Démonet JF. 2002.
Phonological training in children with dyslexia using temporally modified speech: A three-
step pilot investigation. International Journal of Language & Communication Disorders
37(3):289-308.
Harold D, Paracchini S, Scerri T, Dennis M, Cope N, Hill G, Moskvina V, Walter J, Richardson
A, Owen M. 2006. Further evidence that the KIAA0319 gene confers susceptibility to
developmental dyslexia. Mol Psychiatry 11(12):1085-91.
Hornickel J and Kraus N. 2013. Unstable representation of sound: A biological marker of
dyslexia. The Journal of Neuroscience 33(8):3500-4.
Hornickel J, Zecker SG, Bradlow AR, Kraus N. 2012. Assistive listening devices drive
neuroplasticity in children with dyslexia. Proceedings of the National Academy of Sciences
.
Howland KA and Liederman J. 2012. Beyond decoding: Adults with dyslexia have trouble
forming unified lexical representations across pseudoword learning episodes. J Speech Lang
Hear Res .
Hromádka T, DeWeese MR, Zador AM. 2008. Sparse representation of sounds in the
unanesthetized auditory cortex. PLoS Biology 6(1):e16.
Huetz C, Philibert B, Edeline JM. 2009. A spike-timing code for discriminating conspecific
vocalizations in the thalamocortical system of anesthetized and awake guinea pigs. The
Journal of Neuroscience 29(2):334-50.
Jakkamsetti V, Chang KQ, Kilgard MP. 2012. Reorganization in processing of spectral and
temporal input in the rat posterior auditory field induced by environmental enrichment. J
Neurophysiol 107(5):1457-75.
Kawahara H. 1997. Speech representation and transformation using adaptive interpolation of
weighted spectrum: Vocoder revisited. Acoustics, speech, and signal processing, 1997.
ICASSP-97., 1997 IEEE international conference onIEEE. 1303 p.
Kovelman I, Norton ES, Christodoulou JA, Gaab N, Lieberman DA, Triantafyllou C, Wolf M,
Whitfield-Gabrieli S, Gabrieli JDE. 2012. Brain basis of phonological awareness for spoken
language in children and its disruption in dyslexia. Cerebral Cortex 22(4):754-64.
Lai G, Schneider HD, Schwarzenberger JC, Hirsch J. 2011. Speech stimulation during functional
MR imaging as a potential indicator of autism. Radiology 260(2):521-30.

152
Lind PA, Luciano M, Wright MJ, Montgomery GW, Martin NG, Bates TC. 2010. Dyslexia and
DCDC2: Normal variation in reading and spelling is associated with DCDC2
polymorphisms in an australian population sample. European Journal of Human Genetics
18(6):668-73.
Lovett MW, Ransby MJ, Hardwick N, Johns MS, Donaldson SA. 1989. Can dyslexia be treated?
treatment-specific and generalized treatment effects in dyslexic children's response to
remediation. Brain Lang 37(1):90-121.
Lovio R, Halttunen A, Lyytinen H, Näätänen R, Kujala T. 2012. Reading skill and neural
processing accuracy improvement after a 3-hour intervention in preschoolers with
difficulties in reading-related skills. Brain Res .
Manis FR, McBride-Chang C, Seidenberg MS, Keating P, Doi LM, Munson B, Petersen A.
1997. Are speech perception deficits associated with developmental dyslexia? J Exp Child
Psychol 66(2):211-35.
McLean, G.M.T., Stuart, G.W., Coltheart, V., Casltes, A. 2011. Visual temporal processing in
dyslexia and the magnocellular deficit theory: the need for speed? Journal of Experimental
Psychology: Human Perception and Performance, 37(6): 1957-1975.
Nagarajan S, Mahncke H, Salz T, Tallal P, Roberts T, Merzenich MM. 1999. Cortical auditory
signal processing in poor readers. Proceedings of the National Academy of Sciences
96(11):6483.
Nöthen MM, Schulte-Körne G, Grimm T, Cichon S, Vogt I, Müller-Myhsok B, Propping P,
Remschmidt H. 1999. Genetic linkage analysis with dyslexia: Evidence for linkage of
spelling disability to chromosome 15. Eur Child Adolesc Psychiatry 8:56-9.
Paracchini S, Thomas A, Castro S, Lai C, Paramasivam M, Wang Y, Keating BJ, Taylor JM,
Hacking DF, Scerri T. 2006. The chromosome 6p22 haplotype associated with dyslexia
reduces the expression of KIAA0319, a novel gene involved in neuronal migration. Hum
Mol Genet 15(10):1659-66.
Paulesu E, Frith U, Snowling M, Gallagher A, Morton J, Frackowiak RSJ, Frith CD. 1996. Is
developmental dyslexia a disconnection syndrome? evidence from PET scanning. Brain
119(1):143-57.
Pennington BF, Gilger JW, Pauls D, Smith SA, Smith SD, DeFries JC. 1991. Evidence for major
gene transmission of developmental dyslexia. JAMA: The Journal of the American Medical
Association 266(11):1527-34.
Penolazzi B, Spironelli C, Vio C, Angrilli A. 2010. Brain plasticity in developmental dyslexia
after phonological treatment: A beta EEG band study. Behav Brain Res 209(1):179-82.
153
Perez CA, Engineer CT, Jakkamsetti V, Carraway RS, Perry MS, Kilgard MP. 2012. Different
timescales for the neural coding of consonant and vowel sounds. Cerebral Cortex .
Peterson RL and Pennington BF. 2012. Developmental dyslexia. The Lancet .
Pinel P, Fauchereau F, Moreno A, Barbot A, Lathrop M, Zelenika D, Le Bihan D, Poline JB,
Bourgeron T, Dehaene S. 2012. Genetic variants of FOXP2 and
KIAA0319/TTRAP/THEM2 locus are associated with altered brain activation in distinct
language-related regions. The Journal of Neuroscience 32(3):817-25.
Polley DB, Read HL, Storace DA and Merzenich MM. Multiparametric auditory receptive field
organization across five cortical fields in the albino rat. J Neurophysiol 97: 5: 3621-3638,
2007.
Porter BA, Rosenthal TR, Ranasinghe KG, Kilgard MP. 2011. Discrimination of brief speech
sounds is impaired in rats with auditory cortex lesions. Behav Brain Res 219(1):68-74.
Ranasinghe KG, Vrana WA, Matney CJ, Kilgard MP. 2012a. Neural mechanisms supporting
robust discrimination of spectrally and temporally degraded speech. JARO-Journal of the
Association for Research in Otolaryngology :1-16.
Ranasinghe KG, Carraway RS, Borland MS, Moreno NA, Hanacik EA, Miller RS, Kilgard MP.
2012b. Speech discrimination after early exposure to pulsed-noise or speech. Hear Res .
Reed A, Riley J, Carraway R, Carrasco A, Perez C, Jakkamsetti V, Kilgard MP. 2011. Cortical
map plasticity improves learning but is not necessary for improved performance. Neuron
70(1):121-31.
Rosen, S. 2003. Auditory processing in dyslexia and specific language impairment: Is there a
deficit? What is its nature? Does it explain anything?.Journal of Phonetics, 31(3): 509-527.
Russo NM, Nicol TG, Zecker SG, Hayes EA, Kraus N. 2005. Auditory training improves neural
timing in the human brainstem. Behav Brain Res 156(1):95-103.
Scerri TS, Morris AP, Buckingham LL, Newbury DF, Miller LL, Monaco AP, Bishop DVM,
Paracchini S. 2011. DCDC2, KIAA0319 and CMIP are associated with reading-related
traits. Biol Psychiatry .
Schulte-Körne G. 2010. The prevention, diagnosis, and treatment of dyslexia. Deutsches
Ärzteblatt International 107(41):718.
Shaywitz SE, Escobar MD, Shaywitz BA, Fletcher JM, Makuch R. 1992. Evidence that dyslexia
may represent the lower tail of a normal distribution of reading ability. N Engl J Med
326(3):145-50.
154
Shaywitz SE, Shaywitz BA, Pugh KR, Fulbright RK, Constable RT, Mencl WE, Shankweiler
DP, Liberman AM, Skudlarski P, Fletcher JM. 1998. Functional disruption in the
organization of the brain for reading in dyslexia. Proceedings of the National Academy of
Sciences 95(5):2636.
Shetake JA, Wolf JT, Cheung RJ, Engineer CT, Ram SK, Kilgard MP. 2011. Cortical activity
patterns predict robust speech discrimination ability in noise. Eur J Neurosci .
Sloan AM, Dodd OT, Rennaker II RL. 2009. Frequency discrimination in rats measured with
tone-step stimuli and discrete pure tones. Hear Res 251(1-2):60-9.
Steinschneider M, Schroeder CE, Arezzo JC, Vaughan HG. 1994. Speech-evoked activity in
primary auditory cortex: Effects of voice onset time. Electroencephalography and Clinical
Neurophysiology/Evoked Potentials Section 92(1):30-43.
Szalkowski CE, Fiondella CG, Galaburda AM, Rosen GD, LoTurco JJ, Fitch RH. 2012.
Neocortical disruption and behavioral impairments in rats following< i> in utero</i> RNAi
of candidate dyslexia risk gene< i> Kiaa0319</i>. International Journal of Developmental
Neuroscience .
Takahashi H, Yokota R, Funamizu A, Kose H, Kanzaki R. 2011. Learning-stage-dependent,
field-specific, map plasticity in the rat auditory cortex during appetitive operant
conditioning. Neuroscience .
Tallal P. 1980. Auditory temporal perception, phonics, and reading disabilities in children. Brain
Lang 9(2):182-98.
Tallal P and Piercy M. 1974. Developmental aphasia: Rate of auditory processing and selective
impairment of consonant perception. Neuropsychologia 12(1):83-93.
Temple E, Deutsch GK, Poldrack RA, Miller SL, Tallal P, Merzenich MM, Gabrieli JDE. 2003.
Neural deficits in children with dyslexia ameliorated by behavioral remediation: Evidence
from functional MRI. Proceedings of the National Academy of Sciences 100(5):2860.
Temple E, Poldrack R, Protopapas A, Nagarajan S, Salz T, Tallal P, Merzenich M, Gabrieli J.
2000. Disruption of the neural response to rapid acoustic stimuli in dyslexia: Evidence from
functional MRI. Proceedings of the National Academy of Sciences 97(25):13907.
Threlkeld SW, McClure MM, Bai J, Wang Y, LoTurco JJ, Rosen GD, Fitch RH. 2007.
Developmental disruptions and behavioral impairments in rats following< i> in utero</i>
RNAi of Dyx1c1. Brain Res Bull 71(5):508-14.
Tremblay KL and Kraus N. 2002. Auditory training induces asymmetrical changes in cortical
neural activity. Journal of Speech, Language and Hearing Research 45(3):564.

155
Truong D. 2009. Behavioral implications of knockout for the dyslexia-risk gene Dcdc2 in mice. .
Vandermosten M, Boets B, Luts H, Poelmans H, Golestani N, Wouters J, Ghesquière P. 2010.
Adults with dyslexia are impaired in categorizing speech and nonspeech sounds on the basis
of temporal cues. Proceedings of the National Academy of Sciences 107(23):10389.
Werker JF and Tees RC. 1987. Speech perception in severely disabled and average reading
children. Canadian Journal of Psychology/Revue Canadienne De Psychologie 41(1):48.
Ziegler JC and Goswami U. 2005. Reading acquisition, developmental dyslexia, and skilled
reading across languages: A psycholinguistic grain size theory. Psychol Bull 131(1):3.
Ziegler JC, Pech‐Georgel C, George F, Lorenzi C. 2009. Speech‐perception‐in‐noise deficits in
dyslexia. Developmental Science 12(5):732-45.

156
CHAPTER 5
REAL TIME IDENTIFICATION OF SPEECH SOUNDS USING CORTICAL
ACTIVITY PATTERNS
Authors- Tracy M. Centanni, Andrew M. Sloan, Robert Rennaker II, and Michael P. Kilgard
School of Behavioral and Brain Sciences, GR41
The University of Texas at Dallas
800 W. Campbell Road
Richardson, Texas, 75080-3021

157
ABSTRACT
We developed a classifier that can accurately identify nine English consonants from neural
activity in real time. The classifier searches primary auditory cortex activity for action potential
patterns that indicate that a speech sound has occurred and identifies the speech sound within 40
milliseconds of stimulus onset. The classifier can accurately identify the occurrence of nine
consonants without prior knowledge of the stimulus onset times. The classifier performs as well
as rats trained on several previously reported consonant discrimination tasks. To test the
temporal limits of the classifier, we developed a novel task that requires rats to identify
individual consonants from a stream of distracter consonants. The classifier successfully
predicted the ability of rats to accurately identify speech sounds when the syllable presentation
rate was at or below 10 syllables per second. These results suggest a novel method to read out
detailed information from cortical networks in real time.

158
INTRODUCTION
Speech sounds evoke unique spatiotemporal patterns in the auditory cortex of many species
(Eggermont 1995; Engineer et al. 2008; Kuhl and Miller 1975). Consonant sounds evoke
transient bursts of neural activity in primary auditory cortex (A1). A1 neurons fire to all
consonants, but fire at different times for different sounds. For example, the consonant /d/ evokes
activity first in neurons tuned to high frequencies, followed by neurons tuned to lower
frequencies. The sound /b/ causes the opposite pattern such that low frequency neurons fire first,
followed by high (Engineer et al. 2008; Perez et al. 2012; Ranasinghe et al. 2012; Shetake et al.
2011). This pattern of activity can be used to identify auditory stimuli. EEG recordings in
patients listening to isolated words (Chang et al. 2010; Pasley et al. 2012) can be used to identify
which word was presented, provided that the recordings encompass a large frequency range.
Since consonant sounds are transient and occur on a millisecond time scale, microelectrode
recordings in rats provide the high level of spectral and temporal precision needed to visualize
the neural patterns evoked by these complex stimuli.
These unique patterns of activity predict behavioral discrimination accuracy in rats. Rats are
a good model of human speech sound discrimination as these rodents have neural and behavioral
discrimination thresholds that are similar to humans. Rats can discriminate isolated human
speech sounds with high levels of accuracy (Engineer et al. 2008; Perez et al. 2012). Rats and
humans can discriminate speech sounds with as few as 4 bands of spectral information
(Ranasinghe et al. 2012). Rats and humans are also able to discriminate speech sounds when
presented at 0 dB signal to noise ratio (Shetake et al. 2011). Sounds that evoke different patterns
of neural activity are more easily discriminated than two sounds that evoke similar patterns of

159
activity (Engineer et al. 2008; Ranasinghe et al. 2012; Shetake et al. 2011). Speech sounds
presented in background noise evoke neural response patterns with longer latency and lower
firing rate than speech presented in quiet and the extent of these differences is correlated to
behavioral ability (Martin and Stapells 2005; Shetake et al. 2011). Neural activity patterns in
anesthetized rats also predict behavioral discrimination ability of spectrally and/or temporally
degraded speech stimuli (Ranasinghe et al. 2012).
The classifier used in the aforementioned studies was provided the stimulus onset time,
which may not be readily available to the brain during discrimination tasks. Previous classifiers
in our lab performed as a two-alternative forced choice classifier in which the correct answer was
always one of the two choices. In the current study, we designed a classifier that could identify
any of nine consonant sounds, but was not forced to guess if a decision criterion was not met. We
hypothesized that neural activity patterns should be sufficient to identify the evoking stimulus in
real-time and report a novel behavioral paradigm to test this hypothesis.
METHODS
Speech Stimuli
For this study, we used the same stimuli as several previous studies in our lab (Engineer et
al. 2008; Floody et al. 2010; Porter et al. 2011; Ranasinghe et al. 2012; Shetake et al. 2011). We
used nine English consonant-vowel-consonant (CVC) speech sounds differing only by the initial
consonant: (/bad/, /dad/, /gad/, /kad/, /pad/, /sad/, /tad/, /wad/, and /zad/), which were recorded in
a double-walled, soundproof booth by a female native- English speaker. The spectral envelope
was shifted up in frequency by a factor of two while preserving all spectral information using the

160
STRAIGHT vocoder (Kawahara 1997) to better accommodate the rat hearing range. The
intensity of each sound was calibrated with respect to its length, such that the loudest 100 ms was
presented at 60 dB SPL and 5 ms on and off ramps were added to prevent any artifacts.
Surgical procedure- anesthetized recordings
Multiunit recordings were acquired from the primary auditory cortex of anesthetized,
experimentally-naïve Sprague-Dawley rats. Recording procedures are described in detail
elsewhere (Engineer et al. 2008; Ranasinghe et al. 2012; Shetake et al. 2011). In brief, animals
were anesthetized with pentobarbital (50 mg kg-1
) and were given supplemental dilute
pentobarbital (8 mg ml-1
) as needed to maintain areflexia, along with a 1:1 mixture of dextrose
(5%) and standard Ringer’s lactate to prevent dehydration. A tracheotomy was performed to
ensure ease of breathing throughout the experiment and filtered air was provided through an air
tube fixed at the open end of the tracheotomy. A craniotomy and durotomy was performed,
exposing right primary auditory cortex. Four Parylene-coated tungsten microelectrodes (1-2
MΩ) were simultaneously lowered to layer (4/5) of right primary auditory cortex (~600 µm).
Electrode penetrations were marked using blood vessels as landmarks.
Brief (25 ms) tones were presented at 90 randomly interleaved frequencies (1-47 kHz) at 16
intensities (1- 75 dB SPL) to determine the characteristic frequency of each site. A set of four
stimuli were created using Adobe Audition for comparison to our behavioral task (described
below). Each stimulus consisted of a train of six individual speech sounds such that across all
four sequences, 24 possible sound pairs were presented once (/bad bad gad sad tad dad/, /tad tad
sad gad bad dad/, /gad gad tad bad sad dad/, /sad sad bad tad gad dad/). The temporal envelope of
the stimuli was compressed so that when presented with a 0 second inter-stimulus interval,

161
sounds were presented at 2, 4, 5, 6.667, 10 and 20 syllables per second (sps). All speech stimuli
were randomly interleaved, and presented at 20 repeats per recording site. All sounds were
presented approximately 10 cm from the left ear of the rat. Stimulus generation, data acquisition
and spike sorting were performed with Tucker-Davis hardware (RP2.1 and RX5) and software
(Brainware).
Surgical procedure- awake recordings
Rats were anesthetized and implanted with a chronic array of 16 polyimide-insulated 50 µm
diameter tungsten micro wires. The implantation surgery and microwire arrays have been
previously reported in detail (Rennaker et al. 2005). Briefly, subjects were anesthetized with an
intramuscular injection of a mixture of ketamine, xylazine and acepromazine (50 mg/kg, 20
mg/kg, 5 mg/kg, respectively). Atropine and dexamethazone were administered subcutaneously
prior to and following surgery. A midline incision was made, exposing the top of the skull, and a
section of the right temporalis muscle was removed to access primary auditory cortex. Six bone
screws were fixed to the dorsal surface of the skull (two in each parietal bone and one in each
frontal bone) to provide structural support for the head cap. The two middle screws had attached
leads to serve as a reference wire and a grounding wire. A craniotomy and durotomy were
performed to expose the cortex in the region of primary auditory cortex. The microwire array
was then inserted to a depth of 550-600 µm (layer IV/V) in primary auditory cortex using a
custom built mechanical inserter (Rennaker et al. 2005). The area was sealed with a silicone
elastomer (Kwik-Cast, World Precision Instruments Inc, Sarasota, Florida) and the head cap was
built with a connector secured with acrylic. Finally, the skin around the implant was sutured in
the front and the back of the head cap. Subjects were given prophylactic minocycline in water ad

162
libitum for 2 days prior and 5 days following surgery to lessen immune responses (Rennaker et
al. 2005), and were also given Rimadyl tablets for 3 days after surgery to minimize discomfort.
Topical antibiotic was applied to the incision to prevent infection. After a minimum of 5 days of
recovery, neural activity was collected in a single 2.5 hour session and saved using custom
MATLAB programming. The session included an abridged tuning curve (to assess each site’s
best frequency) and the same set of speech sequence stimuli presented to the anesthetized
animals. All passive sound sets were created and run through custom MATLAB programming.
Neural analysis and classifier
To identify stimulus identity in real-time using neural activity, we modified a well
established classifier (Engineer et al. 2008; Foffani and Moxon 2004; Perez et al. 2012;
Ranasinghe et al. 2012; Schnupp et al. 2006; Shetake et al. 2011). The classifier searched neural
activity (from a random selection of a subgroup of sites) for the onset of a sound by locating a
pattern of activity. We trained the classifier to recognize nine patterns of activity, corresponding
to each consonant sound in the English language, by providing the mean activity across 19
repeats of each stimulus. 150 random sites was enough to capture the range of characteristic
frequencies sampled and show the unique pattern of activity evoked by each consonant. The
classifier then analyzed a single repeat of neural activity and identified if a pattern was located,
when it occurred, and which sound caused the pattern of activity. We calculated decision
thresholds for each possible consonant sound which allowed the classifier to determine which
consonant sound most likely caused the activity, and when that sound was likely presented. To
calculate the thresholds, we compared the similarity between each average pattern of activity, or
template, to the response of each single repeat (20 repeats x 20 speech sounds). To reduce the

163
influence of uncorrelated spontaneous activity, we smoothed the data using a Gaussian filter with
a half width of approximately 15% of the total number of sites to smooth sites across bins with
similar characteristic frequency. Euclidean distance was used to measure the similarity between
the single trial and each template and is calculated by taking the square root of the sum of the
squared differences between two patterns of neural activity. The threshold was set to maximize
the sensitivity index for each sound to ensure the maximum number of correct responses while
minimizing the number of false alarms (Figure 5.1).
Once all thresholds were calculated, we normalized the single trials and templates so that
the comparison between spontaneous activity and any template equaled 0. A normalized metric
of Euclidean distance values for each single trial were calculated so that the values centered on 0
and templates similar to the single trial returned positive values while templates less similar to
the single trial returned negative values. This was done using the equation:
where c is the window currently being analyzed, EDc is the raw Euclidean distance at that point,
EDsp is the Euclidean distance between this template and spontaneous activity, tc is the threshold
for this template and mt is the minimum threshold across all templates. Once this normalized
metric (NM) was calculated for the entire single trial, the classifier then searched each single trial
recording sweep and identified when a pattern of activity occurred (when a threshold was
crossed) and which stimulus caused that pattern of activity. If more than one template crossed the
threshold, the classifier guessed the template with the highest NM value, or the template that was

164
closest to the single trial being analyzed. Since the classifier runs in real time, the first crossing is
counted as the guess, even if the threshold would have been met again later in the sequence. The
classifier was run thirty times, with a different randomly sampled neural population for each run.
The average percent correct for each compression level was calculated and plotted with behavior.
The strength of the correlation was measured using the correlation coefficient.
Behavioral Paradigm
Sprague-Dawley albino rats were trained using either an established lever press paradigm
for the isolated speech task (Engineer et al. 2008; Perez et al. 2012; Ranasinghe et al. 2012;
Shetake et al. 2011) or an operant paradigm with an infrared nose poke (for the speech sequence
task), developed by Dr Robert Rennaker (Sloan, Dodd, Rennaker II 2009). Each rat trained for
two 1-hour sessions per day, 5 days per week. For the isolated speech task, the behavioral
training procedures and data reported here were the same as was reported in Engineer et al.
(2008). In brief, 6 rats were trained to press a lever when a target speech sound was presented
and to withhold pressing when a distracter sound was presented (/d/ vs. /s/, /d/ vs. /t/, and /d/ vs.
/b/ and /g/). Rats were trained for 2 weeks on the tasks in the order given and performance was
assessed after training on each task to obtain the values reported in Engineer et al. (2008) and the
current study.
For the speech sequence task, all animals were first trained to associate the infrared (IR)
nose poke with the sugar pellet reward. Each time the rat broke the IR beam, the target speech
sound (/dad/) was played and a 45 mg sugar pellet was dispensed. After each animal earned over
100 pellets, each rat was then trained to wait patiently in the nose poke and withdraw their nose
from the nose poke after hearing the target. During training stages, d’ was used as a criterion for

165
advancing to the next stage (Green and Swets 1966). This stage lasted until the animal performed
with a d’ greater than 1.5 for 10 sessions. For these first two stages, the animal had a response
window of 800 ms to withdraw their nose in response to the target.
Rats were then introduced to the four possible distracters by presenting a string of repeats
of a single distracter prior to the presentation of the target. The inter-stimulus-interval (ISI) was 1
second and the response window was also reduced to 650 ms during these stages. Since the task
involved random patterns of distracters, we trained the animals on a fixed pattern of distracters to
introduce the concept of multiple distracters per trial. For each trial in this stage, two or three of
the four CS- were randomly selected and alternated. In the final two training stages, a sequence
for each trial was randomly generated using all four possible distracters and presented to ensure
that the rat could not memorize the pattern or time their responses. In addition, the ISI was
reduced to 0 seconds and the response window was reduced to 500 ms. Once rats performed with
a d’ > 1.5 for at least two sessions, they were introduced to each compression level. During this
period of training, rats were presented with blocks of 20 trials each. Each trial contained a
random hold time (the time before the onset of the target sound) between 2 and 7 seconds, with
the sounds prior to the target consisting of randomly selected distracters (Figure 5.5). The
presentation rate of each block was either 2 sps or one of the additional presentation rates. These
blocks were presented in random order. 20% of trials were catch trials in which no target was
presented to ensure the rats were listening for the target and not attempting to time the target
location (Figure 5.5).
Animals were tested for a minimum of 10 sessions during which all six presentation rates
were randomly interleaved. The animals were individually housed with free access to water and
166
were food deprived to no less than 85% body weight while experimenting. When not
experimenting, they were given free access to water and food and housed on a reverse 12:12
light/dark schedule. The behavioral paradigm was written and executed via a custom-designed
MATLAB (The Mathworks Inc, Natick, Massachusetts) program and run through a PC computer
with an external real-time digital-to-analog processor (RP2.1; Tucker-Davis Technologies),
which monitored the infrared nose poke and controlled the stimuli presentation and lights. Each
of the 5 sounds was analyzed for response rate (number of responses/number of presentations
*100). Target responses are referred to as hits and the summed response to all four distracters is
referred to as false alarm rate. Overall performance is reported in terms of hits-false alarms per
presentation rate. All protocols and recording procedures were approved by the University of
Texas Institutional Animal Care and Use Committee.
RESULTS
Neural activity patterns predict stimulus identity in real time
Speech sounds evoke unique spatiotemporal response patterns in primary auditory
cortex (Engineer et al. 2008; Perez et al. 2012; Ranasinghe et al. 2012; Shetake et al. 2011).
Previous classifiers have been able to use these patterns to identify the evoking stimulus when
the stimulus onset time was provided. We have developed a neural classifier that can identify a
wide range of speech sounds from continuous activity recorded in the primary auditory cortex
(A1) of anesthetized rats, without prior knowledge of the stimulus onset time. Previous
classifiers were forced to guess (in a two-alternative paradigm), while our classifier did not need
to guess if a decision criterion was not met. The classifier was trained to recognize nine different
167
English consonants. Decision thresholds were determined by calculating the Euclidean distance
between the average response to each consonant and the single trial responses evoked by each
sound (all using 2 ms temporal bins over an 80 ms analysis window). We then compared the
Euclidean distances that occurred when the single trial matched the template (i.e. when the single
trial and the template were both evoked by the same sound) to the Euclidean distance that
occurred when the single trial and the template were evoked by different sounds. The threshold
was set at the Euclidean distance value that optimized the sensitivity index for each sound. This
value ensured the maximum number of correct responses while minimizing the number of false
alarms (Figure 5.1). The classifier then searched single trials of neural activity for a location in
which one of the decision thresholds was crossed. A normalized metric of Euclidean distance
values for each single trial were calculated so that the values centered on 0 and templates similar
to the single trial returned positive values while templates less similar to the single trial returned
negative values. We then tested both the detection and discrimination abilities of this new
classifier.
Evoked patterns of neural activity are identifiable when neurons with a variety of
characteristic frequencies (CFs) are recorded. For example, if the stimulus onset time was
unknown and only one recording site was available for analysis, it would be impossible to
identify when a speech sound occurred compared to spontaneous activity. Small numbers of sites
could identify if a sound occurred, but performed at chance when asked to identify the sound (60
site detection at 53.4 ±22.8% correct, discrimination performance at 31.8 ± 13.1% correct;
Figure 5.2A). This inability to identify stimuli using 60 sites corresponds with the amount of bits
encoded with this number of sites (0.8 bits of information) compared to almost 3 bits of

168
information in a group of 400 sites (Figure 5.2B). This increase in bits could be due to a larger
frequency range included in larger site groups. If a large number of sites are used, synchronized
activity across those sites could be used to identify when a sound occurred. For example, in
response to the sound /dad/, sites with a characteristic frequency above ~7 kHz responded to the
consonant /d/ first, while lower frequency sites fired only to the onset of the vowel (Figure
5.3A). To the sound /bad/, the opposite pattern occurred; low frequency sites fired first, followed
by high frequency sites (Figure 5.3A, third panel). Some sounds evoked neurons in the same
order, such as /d/ and /t/, which both evoked responses from high frequency neurons first,
followed by low frequencies. We used these distinct patterns of activity to train our classifier to
recognize the evoked response to each sound. Using large numbers of sites, this entire frequency
range was represented and the classifier was able to perform the task well above chance level.
Our recordings were not acquired simultaneously (4 electrodes were inserted at a time)
and the uncorrelated spontaneous activity seemed to significantly impair the classifier’s
performance. The synapses in the sensory cortex likely have ways of strengthening the weight of
evoked responses and dampening the weight of spontaneous neural firing. To diminish the
influence of uncorrelated spontaneous firing, we ran the data through a Gaussian filter to
strengthen the influence of the evoked signal (Giraud et al. 2000; Langers, Backes, Dijk 2003;
Langers, Backes, Van Dijk 2007). Since our classifier counts every spike equally, this technique
of spectral smoothing allowed us to strengthen the evoked activity in a biologically plausible
manner (Figure 5.3B; Bear, Cooper, Ebner 1987; Hao et al. 2009; Poirazi, Brannon, Mel 2003a;
Poirazi, Brannon, Mel 2003b; Sengpiel and Kind 2002). While various amounts of spectral
smoothing were adequate to dampen the spontaneous activity (10-20% of the total number of

169
sites), peak performance was obtained using data from 400 sites that had been smoothed with a
Gaussian filter with a half width of approximately 15% of the total number of sites (data
collected for Engineer et al. 2008). Even with a smaller group of 150 sites, this classifier was
able to identify the onset of a speech sound as well as identify the stimulus with high levels of
accuracy (64.7 ± 6.0%; Figure 5.2A). These results validate that our new classifier is able
perform the task using neural activity without specific knowledge of the stimulus onset time. In
addition, our results show that a Euclidean distance classifier can perform with high levels of
accuracy without being forced to guess.
To test the temporal limits of this new classifier, we created four sequences of speech
sounds (/bad bad gad sad tad dad/, /tad tad sad gad bad dad/, /gad gad tad bad sad dad/, /sad sad
bad tad gad dad/; neural responses acquired from a different set of four rats). We applied the
same spectral smoothing as was used for the classification of isolated speech sounds. Following
smoothing, the classifier was able to guess the location of the target sound with an accuracy
of 70.0 ± 0.5% using random groups of 150 sites. Figure 5.4 shows a single trial example of the
classifier’s performance at the sequence /bad-tad-gad-dad/. As described earlier, the Euclidean
distance values are normalized to a scale from 0-1 where values close to 0 indicate that the
template does not match the single trial and values equal to 1 indicate that the template matches
the single trial activity. Note in this example that the values for more than one template are close
to 1 (Figure 5.4). If multiple templates reach a value of 1, the classifier uses the template with the
highest value as a tie-breaker. This method takes into account that some sounds are similar and
may therefore account for some common errors made by humans in difficult listening
environments.

170
It was possible that our classifier would perform differently using awake recordings, due
to differences in spontaneous activity or attention effects (Steinmetz et al. 2000; Treue 2001). A
different group of rats were implanted with a chronic array of 16 micro-electrodes. After
recovery, we presented four speech sound sequences during a single passive recording session.
Awake recordings had a higher spontaneous firing rate than anesthetized recordings (64.2 ±1.8
Hz compared to 23.4 ± 1 Hz in the anesthetized preparation, unpaired t-test; p=1.2*10-21
) but this
did not change the effectiveness of the Gaussian filter. The classifier performed at an average
of 45.0 ± 8.3 % using random groups of 100 sites and a Gaussian filter with a half width of 15%
the total number of sites. This accuracy mimics what the anesthetized classifier was able to
accomplish with this number of sites. The result that awake neural activity can perform the
neural discrimination task with comparable accuracy to anesthetized recordings is similar to what
we saw using our earlier classifier (Engineer et al. 2008). The new classifier described here was
able to locate and identify speech sounds in isolation or in sequences and performed with
surprising accuracy using both anesthetized and awake neural recordings.
Neural responses predict behavioral ability
Our new classifier performed significantly above chance at identifying speech sounds in
real time, but may not have performed the task as well as rats could behaviorally. We used
behavioral data published in our previous report (Engineer et al. 2008) for comparison with our
new classifier. Six rats were to press a lever when a target speech sound was presented and to
withhold pressing when a distracter sound was presented (/d/ vs. /s/, /d/ vs. /t/, and /d/ vs. /b/ and
/g/). Using groups of 150 recording sites, the classifier performed with accuracy levels
comparable to rats’ behavioral performance (average classifier performance on these four tasks

171
was 89.9 ± 6.9% correct vs. 88.3 ± 2.4% correct by the rats; unpaired t-test, p=0.64). This result
suggests that our new classifier performs at the same level of accuracy as the rats and may be
applicable to a range of speech stimuli and new behavior tasks.
Since the stimulus onset time is not provided to the classifier, a potential advantage of the
current classifier is the ability to identify a speech sound from within a sequence. We developed
a novel behavioral paradigm to see if our real-time classifier could predict rats’ ability to identify
a target speech sound in a stream of speech distracters. Rats were trained to initiate trials using
an infra-red nose poke, and to withdraw from the nose poke upon presentation of the target
sound /dad/ and to withhold responding to four distracter sounds (Figure 5.5; /bad/, /gad/, /sad/,
and /tad/). This task required a longer learning period than previous studies of speech sound
discrimination. Our rats required 38.2 ± 1.7 days to reach performance of d’≥1.5 compared to
17.4 ± 2.3 days for isolated speech tasks (Engineer et al. 2008). After ~40 days of training, rats
were able to consistently respond to the target (/dad/) and withhold responding to distracters
(/sad/,/bad/,/gad/ or /tad/). The average percent correct (hits-false alarms) of rats was 69 ± 5.2%,
which was the same as the average classifier performance using neural responses from untrained
rats (70.0 ± 0.5%; Figure 5.6A). The new real time classifier we report here can identify stimuli
with accuracy levels that are comparable to behavioral ability.
Since our awake recordings (classifier performance: 45.0 ± 8.3% correct) were acquired
from trained rats (though they were not performing the task when recordings were acquired), we
were able to evaluate if the classifier’s ability directly related to the behavior in the same
animals. We noticed that the classifier was less accurate on two of the four sequences (/gad gad
tad bad sad dad/ and /sad sad bad tad gad dad/). To investigate whether or not these sequences

172
were also more challenging for the animal, we looked for trials in which these exact sequences
were presented. Since the stimuli were presented randomly during the behavior task, these exact
sequences were only played a few times. Comparing the average percent correct across all rats
on these trials (sequence 1; n=20 trials, sequence 2; n=8 trials, sequence 3; n=9 trials, sequence
4; n=12 trials), the classifier performance was strongly correlated to behavioral ability (Figure
5.6C; R2= 0.90, p=0.05). Sequences that the classifier was less accurate on were the same
sequences that rats had trouble with behaviorally. Neural activity recorded from trained, awake
rats predicted the relative difficulty of the same sequences in the behavioral task. This result
suggests that our classifier may be able to predict performance in real time using neural
recordings acquired from awake and behaving animals.
Behavioral performance and neural responses were robust up to 10 sps
Behavioral discrimination accuracy gradually decreased as the presentation rate increased
using a speech vocoder. Performance remained well above chance (0%) up to 10 sps (2 sps: 69.2
± 5.2%, 4 sps: 62.4 ± 8.7%, 5 sps: 56.5 ± 10.9%, 6.67 sps: 59.0 ± 12.7%, 10 sps: 46.1 ± 9.2%),
though performance at this rate was significantly worse than performance at 2 sps (46.1 ± 9.2%
vs. 69.2 ± 5.2%, 10 sps vs 2 sps respectively; paired t-test; p=0.007). Poor performance at 20 sps
(6.1 ± 2.0% correct) was consistent with performance in humans at the same rate (Figure
5.6A; Ahissar et al. 2001; Ghitza and Greenberg 2009; Poldrack et al. 2001). At presentation
rates faster than 2 sps, false alarm rates did not differ between distracters (two-way analysis of
variance; F (5, 3) = 2.11; p=0.07). The classifier was able to perform the neural discrimination
task as well as the rats were able to behaviorally at every speed tested (classifier performance at
2 sps: 70.0 ± 0.9%; p=0.93, 4 sps: 57.9 ± 1.1%; p=0.72, 5 sps: 72.8 ± 0.7%; p=0.37, 6.67 sps:
173
71.6 ± 0.7%; p=0.54, 10 sps: 75.9 ± 0.5%; p=0.15, 20 sps: 24.9 ± 0.9%; p=0.17; unpaired t-tests;
Figure 5.6B). The classifier performance was robust up until 20 sps, and then performed
significantly worse than at 2 sps (Figure 5.6B). Similarly, neural activity patterns were strong
and distinguishable at rates up to 10 sps (Figure 5.7). The significant reduction in neural firing
strength at 20 sps as well as the impaired performance of the animals and the classifier at this
speech suggests that as long as neural response patterns are unique and are distinguishable from
spontaneous firing, A1 activity can predict behavioral ability of rats to identify a target sound in
a rapid sequence.
DISCUSSION
Calculation of decision thresholds
In our study, we designed a real time classifier that sweeps neural activity for a pattern of
activity evoked by a speech sound and decides which sound caused that activity using
predetermined decision thresholds. Our classifier used neural activity recorded in primary
auditory cortex and supports the idea that the information needed to perform speech sound
identification is located in A1 (Engineer et al. 2008; Perez et al. 2012; Ranasinghe et al. 2012;
Shetake et al. 2011). However, we found no evidence of a target specific response in A1.
Previous studies showed that removing A1 does not impair the ability of animals to perform
speech sound discrimination tasks or to learn new speech sound targets (Floody et al. 2010;
Porter et al. 2011). In order to predict behavioral accuracy, we needed to transform the data by
highlighting simultaneously occurring evoked activity. We smoothed across the spectral
dimension, to mimic a biologically plausible way in which the brain weights excitatory synaptic

174
inputs (Bear, Cooper, Ebner 1987; Poirazi, Brannon, Mel 2003a; Poirazi, Brannon, Mel 2003b).
The need for such smoothing suggests that the ability to use A1 activity to identify a speech
stimulus requires integration across synapses. It is therefore unlikely that these thresholds are
calculated or even exist in this core auditory region.
Brain regions even one synapse higher than the core sensory area may code the
relationship between two stimuli. For example, when monkeys were asked to identify whether
two tactile stimuli were the same or different, primary somatosensory cortex encoded only the
current stimulus, while secondary somatosensory cortex was already beginning to compare the
two stimuli (Romo and Salinas 2003). It is likely that higher level brain regions contain
integrator neurons that recognize patterns of activity occurring in lower level areas. Neural
networks designed to mimic sensory neurons can be trained to integrate basic sensory
information into categorical decisions (Buonomano and Merzenich 1995; Mazurek et al. 2003).
Single neurons recorded in premotor cortex of monkeys can also predict the intended motor
sequence when a maximum-likelihood decoder analyzes the firing rate (Shanechi et al. 2012).
Our classifier does not propose a mechanism for how this threshold is created or where in the
brain it is stored, but it is the first to show that a real time classifier can predict the location and
identity of speech stimuli without being forced to choose between a set list of options. As in
behavioral tasks, if the decision threshold is not met, the classifier is not required to guess. In
addition, if multiple thresholds are met, our classifier is designed to choose the template which is
most like the single trial.
In the current study, we used Euclidean distance to determine the location of maximum
sensitivity; the point at which most hits would be captured while minimizing false alarms. Once

175
calculated, these thresholds did not change as a result of testing, and our classifier used these
thresholds to determine which stimulus evoked a single pattern of neural activity. It is unlikely
that the brain does not adapt to real-time feedback during testing. If thresholds never changed,
the brain would be inept at tasks of generalization. For example, the same word spoken with
small changes in pitch, pronunciation and/or context may cause the brain to categorize these as
two different words. It is well known that synapses change as a result of real-time feedback
(Buonomano and Merzenich 1998; Cohen-Cory 2002; Malenka and Nicoll 1993; Malinow and
Malenka 2002), but the question of how the brain monitors these changes and how drastic the
adjustments are remains to be answered. A classifier that could adjust its thresholds in relation to
real time feedback would provide a more biologically accurate model and may be able to explain
models of learning impairments.
Evaluation of the data set and classifier
The data reported in our study was acquired from many animals and analyzed post hoc.
In the anesthetized recordings, four electrodes were recorded simultaneously. In the awake
preparation, up to seven electrodes were viable at any given time point. Single neuron recordings
in premotor cortex can predict motor sequences in real time using spike rate information
(Shanechi et al. 2012). Since consonant identification requires precise spike timing information,
we were only able to achieve above chance performance with our classifier using more than 60
sites. The development of multi-channel electrode arrays with at least this many channels will
allow us to record enough neurons simultaneously to locate and identify an evoking speech
stimulus in an awake-behaving animal.

176
The classifier uses a fixed window (80 ms) to scan a single trial of neural activity for evoked
responses. There is sufficient information present in this window for consonant identification to
take place (Engineer et al. 2008; Kuhl and Miller 1975; Miller and Nicely 1955). However, it is
likely that rats and humans also use information occurring in larger integration windows,
especially in difficult hearing environments (Shetake et al. 2011). Our classifier attempts to
account for this by analyzing the normalized metric values within 5 ms of the initial guess. This
allows the classifier some flexibility to wait until all similar templates are considered and then
make a decision using the strongest signal. This time period of flexibility is biologically
plausible as it is well within the minimum amount of time in which the brain can make a decision
(Stanford et al. 2010).
Future applications for the classifier
In the current study, we demonstrate that a classifier can locate and identify speech sound
stimuli in real time using single repeats of A1 neural activity. Real time classifiers have been
developed in the motor system to identify and read out sequences of intended motor movements
(Shanechi et al. 2012). Such work will be invaluable for the development of prosthetic limbs that
carry out intended movements. Neural activity in other sensory systems, such as vision, has also
been used in successful classifiers to identify objects presented to human and non-human primate
participants. When participants are shown or asked to imagine varying images, the pattern of
active voxels acquired by fMRI differs between categories of objects (Haxby et al. 2001;
Norman et al. 2006; Stokes et al. 2009). Multiple voxel pattern analysis (MVPA) can be used to
identify lines of varying orientation, the direction of movement of an image, or whether the
visual object is a picture or a sentence. In a task where two competing images are presented,

177
MVPA can also predict when one image is perceived over the other, and which image is
dominant on a second-to-second timescale (Haynes and Rees 2005; Polonsky et al. 2000). In
addition, the use of pattern classification for olfactory information has been successfully
integrated into electronic devices that identify odors by mimicking the human olfactory bulbs
(Gutierrez-Osuna 2002). Such devices also contain feedback loops for optimization as well as
several internal controls to account for differences in sensor settings and other sources of noise.
The ability to integrate such controls into a speech sound classifier will greatly improve the
performance of the classifier on tasks involving generalization or distortion.
Conclusion
We developed a classifier that can locate and identify a speech stimulus using single trial
neural responses. Unlike previous models, the current classifier is not forced to make a guess if
the decision criterion is not met and is a good computational model for a possible mechanism of
speech sound processing. The current study showed that such a classifier can predict rats’ speech
sound discrimination ability in a previously described task as well as a novel task in which rats
are trained to locate a target sound in a stream of speech sounds. These results indicate that the
rat is a good animal model of human speech sound processing and will be valuable in evaluating
the neural mechanisms responsible for many human speech sound processing disorders. Neural
activity recorded from the awake and anesthetized rat can predict behavioral ability on a variety
of tasks using single repeats in real-time.
178
Acknowledgments
We would like to thank N. Lengnick, H. Shepard, N. Moreno, R. Cheung, C. Im, S. Mahioddin,
C. Rohloff and A. Malik for their help with behavioral training, as well as A. Reed, D. Gunter, C.
Mains, M. Borland, E. Hancik and Z. Abdulali for help in acquiring neural recordings. We would
also like to thank K. Ranasinghe and C.T. Engineer for their suggestions on earlier versions of
this manuscript. This work was supported by the National Institute for Deafness and
Communication Disorders at the National Institutes of Health (R01DC010433).

179
APPENDIX
CHAPTER 5 FIGURES
Figure 5.1. Explanation of decision threshold calculation. Decision thresholds were calculated by
comparing single trial neural responses to the average evoked response to each consonant sound.
For example, to create the decision threshold for the sound /sad/, the average response to this
sound (over 19 repeats) was compared to all single trial responses to every sound. The similarity
of the single trials to the template was calculated using Euclidean distance. We then plotted the
Euclidean distance values generated when the single trials were evoked by the template sound
(e.g. when template and single trial were both evoked by /sad/) versus the Euclidean distance
values when the template did not match the single trial (e.g. when the template was evoked by
/bad/ while the template was evoked by /sad/). The decision threshold was then set at the
intersection point between these two distributions, as marked by a * in the bottom half of the
figure. This maximized the sensitivity index so that the most correct answers were preserved
while excluding the maximum number of false alarms.

180
Figure 5.2. A real time classifier could locate and identify nine consonant speech sounds with
high levels of accuracy. A. The real time classifier was able to locate the onset of a speech
stimulus with high levels of accuracy, but required a larger number of sites to accurately identify
the speech sound. This is likely due to the limited frequency range included in small groups of
sites. Previous classifiers provided the stimulus onset time and were able to achieve high levels
of accuracy using single sites of neural activity. Points marked by black circles represent data
sets that performed significantly above chance level (8% chance for detection, 10% chance for
identification). B. Number of bits encoded in various subgroups of sites. 60 sites were able to
locate the sound onset, but could not identify the sound, as this number of sites contained less
than 0.8 bits of information. Larger groups of sites contained up to 3 bits of information and
were better able to perform the task. C. Confusion matrix of classifier performance on nine
English consonant sounds. The classifier performed the task with high levels of accuracy at
every sound presented.

181
Figure 5.3. A Gaussian filter was necessary for highlighting evoked activity. A. Neural activity
patterns in A1 without any smoothing. The first 40 ms of average evoked activity from each site
is organized by characteristic frequency. Each consonant evoked a unique pattern of activity such
that each group of neurons fire at a different latency depending on the characteristic frequency of
the group. Red lines mark the onset response of each frequency group. B. The same neural
activity plotted in A. after a Gaussian filter has been applied to the spectral dimension. We used
a filter with a half width of 15% of the total number of sites. This ensured that spontaneous
activity is not as influential on the classifier as evoked activity.

182
Figure 5.4. The classifier was able to locate and identify multiple speech sounds in a sequence. A
single trial example of the classifier’s performance on a speech sequence. The classifier analyzed
a single trial neural response to the sequence ‘bad tad gad dad’ by comparing the response to
each of five templates. The Euclidean distance responses were converted to the normalized
metric (NM) to that responses were between 0 and 1 (see Methods). If the NM value reached 1,
the classifier signaled that a speech sound occurred at that time point and guesses that the
corresponding template sound was presented. Each colored line represents the values yielded
from comparison with each template, and *’s represent the location of a guess. Note that the
template /sad/ never registered a guess during this sequence, signaling that the classifier correctly
registered that the sound /sad/ was never presented.

183
Figure 5.5. Schematic of the behavioral task. Speech sounds are presented in random order
beginning when a rat breaks the infra-red (IR) beam. Target sound (/dad/) was presented in a
single random location anywhere from the third sound of the sequence until the end of the 2-7
second trial. A. Example of a possible target trial. From the onset of the target sound, rats had
500 ms to respond by withdrawing from the IR beam. If the target sound was less than 500 ms
long, additional distracters were added afterwards to avoid the use of silence as a cue. Correct
responses to the target were rewarded with a 45 mg sugar pellet. Incorrect responses to distracter
sounds or missed responses to the target were punished by a 5 second timeout in which the booth
lights were extinguished and the IR beam was disabled. B. Example of a possible catch trial.
Twenty percent of trials were catch trials in which no target was presented. A false alarm to any
of the stimuli triggered a time-out period. Correct rejections were un-rewarded and the next trial
began after a brief delay. C. Simplified schematic of the behavior task. Top row shows a sound
sequence, each box represents a speech sound. The colored box represents a possible target
location. The middle row represents possible responses by the rat. The bottom row represents the
outcomes of each response; a premature response yielded a time out in which the cage lights
were extinguished and the program was paused. A correct response triggered a sugar pellet
reward.

184
Figure 5.6. Average performance of rats and the classifier on the speech sequence task. A.
Average behavioral performance by rats was measured by hits-false alarms for each of six
presentation rates tested. Performance was plotted across a minimum of 10 sessions per rat of the
testing stage in which all presentation rates were randomly interleaved in blocks of 20 trials per
block (see Methods). Performance was robust until 10 and 20 sps (compared to performance at 2
sps; *p<.01). The task was almost impossible for rats when sounds were presented at 20 sps (**
p<.001 as compared to 2 sps). B. Average classifier performance at each of the six presentation
rates. Performance was calculated by counting the number of correct responses per sequence
over 20 repeats of each sequence. This process was repeated 30 times with random groups of
sites and average performance across the 30 runs is plotted. The classifier performed with
accuracy levels that did not differ from rats’ behavioral ability (unpaired t-tests, p=0.93, p=0.72,
p=0.37, p=0.54, p=0.15, and p=0.17 at each presentation rate, respectively). C. Awake neural
activity was able to predict the order of difficulty for rats to perform the sequence task for four
specific speech sound sequences (R2=0.90, p=0.05). Both rats and the classifier performed best
on the sequence /bad bad gad sad tad dad/ and worst on the sequence /sad sad bad tad gad dad/.

185
Figure 5.7. Cortical speech-evoked activity patterns were robust up to 10 sps. Neural responses
were averaged for each site and plotted organized by characteristic frequency. Each consonant
speech sound (by row) evoked a unique pattern of activity at 2 sps (first column). The response
of these patterns was robust through the 10 sps presentation rate. At 20 sps, responses were
visibly weaker and were less distinct that at the previous presentation rates. This drastic change
in neural responses may be the reason that both behavior and classifier performance fall at this
speed.

186
REFERENCES
Ahissar E, Nagarajan S, Ahissar M, Protopapas A, Mahncke H, Merzenich MM. 2001. Speech
comprehension is correlated with temporal response patterns recorded from auditory cortex.
Proceedings of the National Academy of Sciences 98(23):13367.
Bear M, Cooper LN, Ebner FF. 1987. Synapse modification. .
Buonomano DV and Merzenich MM. 1998. Cortical plasticity: From synapses to maps. Annu
Rev Neurosci 21(1):149-86.
Buonomano DV and Merzenich MM. 1995. Temporal information transformed into a spatial
code by a neural network with realistic properties. SCIENCE-NEW YORK THEN
WASHINGTON- :1028-.
Chang EF, Rieger JW, Johnson K, Berger MS, Barbaro NM, Knight RT. 2010. Categorical
speech representation in human superior temporal gyrus. Nat Neurosci 13(11):1428-32.
Cohen-Cory S. 2002. The developing synapse: Construction and modulation of synaptic
structures and circuits. Science 298(5594):770-6.
Eggermont JJ. 1995. Representation of a voice onset time continuum in primary auditory cortex
of the cat. J Acoust Soc Am 98:911.
Engineer CT, Perez CA, Chen YTH, Carraway RS, Reed AC, Shetake JA, Jakkamsetti V, Chang
KQ, Kilgard MP. 2008. Cortical activity patterns predict speech discrimination ability. Nat
Neurosci 11(5):603-8.
Floody OR, Ouda L, Porter BA, Kilgard MP. 2010. Effects of damage to auditory cortex on the
discrimination of speech sounds by rats. Physiol Behav 101(2):260-8.
Foffani G and Moxon KA. 2004. PSTH-based classification of sensory stimuli using ensembles
of single neurons. J Neurosci Methods 135(1):107-20.
Ghitza O and Greenberg S. 2009. On the possible role of brain rhythms in speech perception:
Intelligibility of time-compressed speech with periodic and aperiodic insertions of silence.
Phonetica 66(1-2):113-26.

187
Giraud AL, Lorenzi C, Ashburner J, Wable J, Johnsrude I, Frackowiak R, Kleinschmidt A. 2000.
Representation of the temporal envelope of sounds in the human brain. J Neurophysiol
84(3):1588-98.
Green DM and Swets JA. 1966. Signal detection theory and psychophysics. Wiley New York.
Gutierrez-Osuna R. 2002. Pattern analysis for machine olfaction: A review. Sensors Journal,
IEEE 2(3):189-202.
Hao J, Wang X, Dan Y, Poo M, Zhang X. 2009. An arithmetic rule for spatial summation of
excitatory and inhibitory inputs in pyramidal neurons. Proceedings of the National
Academy of Sciences 106(51):21906-11.
Haxby JV, Gobbini MI, Furey ML, Ishai A, Schouten JL, Pietrini P. 2001. Distributed and
overlapping representations of faces and objects in ventral temporal cortex. Science
293(5539):2425-30.
Haynes JD and Rees G. 2005. Predicting the stream of consciousness from activity in human
visual cortex. Current Biology 15(14):1301-7.
Kawahara H. 1997. Speech representation and transformation using adaptive interpolation of
weighted spectrum: Vocoder revisited. Acoustics, speech, and signal processing, 1997.
ICASSP-97., 1997 IEEE international conference onIEEE. 1303 p.
Kuhl PK and Miller JD. 1975. Speech perception by the chinchilla: Voiced-voiceless distinction
in alveolar plosive consonants. Science 190(4209):69-72.
Langers DRM, Backes WH, Van Dijk P. 2007. Representation of lateralization and tonotopy in
primary versus secondary human auditory cortex. Neuroimage 34(1):264-73.
Langers DRM, Backes WH, Dijk P. 2003. Spectrotemporal features of the auditory cortex: The
activation in response to dynamic ripples. Neuroimage 20(1):265-75.
Malenka RC and Nicoll RA. 1993. NMDA-receptor-dependent synaptic plasticity: Multiple
forms and mechanisms. Trends in Neurosciences; Trends in Neurosciences .
Malinow R and Malenka RC. 2002. AMPA receptor trafficking and synaptic plasticity. Annu
Rev Neurosci 25(1):103-26.
Martin BA and Stapells DR. 2005. Effects of low-pass noise masking on auditory event-related
potentials to speech. Ear Hear 26(2):195.
Mazurek ME, Roitman JD, Ditterich J, Shadlen MN. 2003. A role for neural integrators in
perceptual decision making. Cerebral Cortex 13(11):1257-69.

188
Miller GA and Nicely PE. 1955. An analysis of perceptual confusions among some english
consonants. J Acoust Soc Am 27:338.
Norman KA, Polyn SM, Detre GJ, Haxby JV. 2006. Beyond mind-reading: Multi-voxel pattern
analysis of fMRI data. Trends Cogn Sci (Regul Ed ) 10(9):424-30.
Pasley BN, David SV, Mesgarani N, Flinker A, Shamma SA, Crone NE, Knight RT, Chang EF.
2012. Reconstructing speech from human auditory cortex. PLoS Biology 10(1):e1001251.
Perez CA, Engineer CT, Jakkamsetti V, Carraway RS, Perry MS, Kilgard MP. 2012. Different
timescales for the neural coding of consonant and vowel sounds. Cerebral Cortex .
Poirazi P, Brannon T, Mel BW. 2003a. Arithmetic of subthreshold synaptic summation in a
model CA1 pyramidal cell. Neuron 37(6):977-87.
Poirazi P, Brannon T, Mel BW. 2003b. Pyramidal neuron as two-layer neural network. Neuron
37(6):989-99.
Poldrack RA, Temple E, Protopapas A, Nagarajan S, Tallal P, Merzenich M, Gabrieli JDE. 2001.
Relations between the neural bases of dynamic auditory processing and phonological
processing: Evidence from fMRI. J Cogn Neurosci 13(5):687-97.
Polonsky A, Blake R, Braun J, Heeger DJ. 2000. Neuronal activity in human primary visual
cortex correlates with perception during binocular rivalry. Nat Neurosci 3:1153-9.
Porter BA, Rosenthal TR, Ranasinghe KG, Kilgard MP. 2011. Discrimination of brief speech
sounds is impaired in rats with auditory cortex lesions. Behav Brain Res 219(1):68-74.
Ranasinghe KG, Vrana WA, Matney CJ, Kilgard MP. 2012. Neural mechanisms supporting
robust discrimination of spectrally and temporally degraded speech. JARO-Journal of the
Association for Research in Otolaryngology :1-16.
Rennaker R, Street S, Ruyle A, Sloan A. 2005. A comparison of chronic multi-channel cortical
implantation techniques: Manual versus mechanical insertion. J Neurosci Methods
142(2):169-76.
Romo R and Salinas E. 2003. Flutter discrimination: Neural codes, perception, memory and
decision making. Nature Reviews Neuroscience 4(3):203-18.
Schnupp JWH, Hall TM, Kokelaar RF, Ahmed B. 2006. Plasticity of temporal pattern codes for
vocalization stimuli in primary auditory cortex. The Journal of Neuroscience 26(18):4785-
95.
189
Sengpiel F and Kind PC. 2002. The role of activity in development of the visual system. Current
Biology 12(23):R818-26.
Shanechi MM, Hu RC, Powers M, Wornell GW, Brown EN, Williams ZM. 2012. Neural
population partitioning and a concurrent brain-machine interface for sequential motor
function. Nat Neurosci .
Shetake JA, Wolf JT, Cheung RJ, Engineer CT, Ram SK, Kilgard MP. 2011. Cortical activity
patterns predict robust speech discrimination ability in noise. Eur J Neurosci .
Sloan AM, Dodd OT, Rennaker II RL. 2009. Frequency discrimination in rats measured with
tone-step stimuli and discrete pure tones. Hear Res 251(1-2):60-9.
Stanford TR, Shankar S, Massoglia DP, Costello MG, Salinas E. 2010. Perceptual decision
making in less than 30 milliseconds. Nat Neurosci 13(3):379-85.
Steinmetz PN, Roy A, Fitzgerald P, Hsiao S, Johnson K, Niebur E. 2000. Attention modulates
synchronized neuronal firing in primate somatosensory cortex. Nature 404(6774):131-3.
Stokes M, Thompson R, Cusack R, Duncan J. 2009. Top-down activation of shape-specific
population codes in visual cortex during mental imagery. The Journal of Neuroscience
29(5):1565-72.
Treue S. 2001. Neural correlates of attention in primate visual cortex. Trends Neurosci
24(5):295-300.

190
CHAPTER 6
CONCLUSION
The ability of the auditory cortex to encode natural sounds, specifically speech sounds, is a
critical component to a high quality of life of all humans. Many disorders, such as dyslexia and
autism, cause abnormal speech sound processing and can lead to poor school performance, low
self esteem, and delinquency in adult life. Dyslexia is known to be caused by genetic variants,
though the specific genes and severity of the impairment varies widely across individuals. In this
dissertation, we provide the first evidence that in utero suppression of the dyslexia candidate
gene Kiaa0319 causes a significant increase in the trial-by-trial variability of the neural response
to auditory stimuli and that these impairments can be ameliorated with extensive behavioral
training.
The role of each associated gene on causing the neural and behavioral symptoms of
dyslexia has only recently been explored. Humans with variants in KIAA0319 have reduced
activation in left auditory cortex in response to auditory stimuli, and this corresponds to a
significant behavioral impairment (Pinel et al. 2012). Our results show that the reduced
activation in human EEG studies is likely due to the increased trial-by-trial variability in neural
responses. We show in Chapters 2 and 4 that at least 2 auditory fields (primary and posterior
auditory cortices) have neural firing impairments and these deficits improve following training.
Variants in another candidate dyslexia gene, DCDC2, are relatively common in humans and have
been studied in rats as well (Lind et al. 2010; Scerri et al. 2011; Schumacher et al. 2006).

191
Humans with variants in this gene are known to have reading problems, but whether this gene
also causes auditory processing impairments is unknown (Lind et al. 2010; Scerri et al. 2011).
Dcdc2 knockout mice are impaired at rapid auditory processing and spatial maze tasks (Truong
2009; Wang et al. 2011). The role of this gene in causing the behavioral speech processing
impairments seen in the KIA- rats is unknown. DYX1C1 is a candidate-dyslexia gene whose role
has been debated in the literature. It seems to cause visual and spatial impairments in rat models
(Marino et al. 2007; Threlkeld et al. 2007), but its exact role in auditory processing is still
unknown. In addition, some researchers deny that this gene is a risk factor for dyslexia at all
(Marino et al. 2005; Scerri et al. 2004). Humans with ROBO1 variants have phonemic processing
problems, but these mutations are rare and have never been studied in an animal model (Bates et
al. 2011). Dyslexia is a complex disorder with a variety of symptoms that seem to affect
individuals differently. The variability in symptoms is likely due to the differences in genetic
variants across individuals. Some genes may be responsible for the visual and spatial symptoms
commonly seen in this disorder, while other genes seem to cause the auditory temporal
processing deficits. All of these symptoms together likely cause the impaired reading scores
which are the hallmark diagnostic criterion of this disorder.
The auditory phoneme processing impairments discussed in Chapters 2 and 4 of this
dissertation may be caused by the high trial-by-trial variability we saw in the onset latency of
neural responses. Extensive training significantly reduced this variability, and returned neural
firing precision of rats with in utero RNAi of Kiaa0319 to control levels. Future experiments are
needed to determine whether this reduced variability was the driving mechanism behind the
improved behavioral performance or whether this is a non-functional consequence of the

192
training. In Chapter 3, we described normal neural firing patterns in multiple auditory areas and
suggested that non-primary areas may be functioning not only as a stimulus encoder, but also
areas like the posterior auditory area (PAF) may be the first auditory area in which integration
may be taking place. In primary, anterior, and ventral auditory fields, consonant sounds are more
accurately encoded when spike timing information is preserved, while PAF can encode such
stimuli with or without spike timing information (Chapter 3). The classifier performance was
correlated to behavior using activity from each of the four auditory fields. It is possible that the
comparable classifier performance serves as a way to help the brain process sound in adverse
listening conditions. For example, in noisy conditions, speech-evoked responses in primary
auditory cortex are significantly degraded (Shetake et al. 2011). Other auditory fields may not be
similarly affected by background noise, allowing the brain access to necessary components of the
speech signal (Figure 6.1). Additional studies are needed to address the speech-evoked responses
in other auditory areas and inactivation studies are needed to address the hypothesis that the
multiple auditory fields function cooperatively in adverse listening conditions.
People with other communication disorders, such as autism, have a greater impairment in
non-primary auditory areas. Neural recordings in our KIA- rats did not provide evidence of this
in the two fields we investigated (A1 and PAF), but future studies are needed to evaluate other
auditory areas as well as other brain regions. We hypothesize that variants in the dyslexia-
associated gene KIAA0319 will cause high trial-by-trial neural variability in other auditory areas,
as well as other brain regions, such as visual and somatosensory cortices. This increased
variability in other sensory systems may contribute to other dyslexia symptoms, such as impaired
vision and spatial awareness. Additional studies are needed to evaluate whether other sensory

193
systems are similarly affected by suppression of the gene KIAA0319. Studies on visual acuity
would also be beneficial for understanding whether KIAA0319 also causes impairment in this
system. Genetic knockout rat models are beginning to be widely available and will provide an
ideal system for answering some of these questions. Additional studies are also needed to
evaluate the contribution of the other candidate dyslexia genes described above. It is rare for a
human with dyslexia to acquire the disorder due to a variant in only one of the dyslexia-
associated genes (or one of a number of other currently undocumented dyslexia-associated
genes). Rat models will allow researchers to evaluate the consequence of in utero RNAi of
combinations of genes on neural function in multiple brain areas and the behavioral consequence
of such interference.
The real time neural classifier described in Chapter 5 of this dissertation can use primary
auditory cortex activity to locate and identify a speech sound stimulus with levels of accuracy
comparable to the behavioral ability of rats. This classifier is likely able to perform the same task
using neural activity from other sensory systems. Such a classifier would be valuable in
evaluating other sensory system processing in not only dyslexia, but in disorders that can be
more difficult to study, such as autism or schizophrenia.

194
APPENDIX
CHAPTER 6 FIGURES
Figure 6.1 Schematic of the possible role of multiple auditory fields for robust speech perception
in adverse listening conditions. The auditory pathway consists of many parallel connections,
depicted by the series of vertical lines. Since speech perception is robust in many adverse
listening conditions, I hypothesize that these parallel connections may facilitate this process. If a
particular masker, for example, a certain type of background noise, interferes with the
transmission of information in a few of these pathways, the redundancy in other pathways may
allow for the transmission of necessary information to integration and decision centers of the
brain.

195
REFERENCES
Bates TC, Luciano M, Medland SE, Montgomery GW, Wright MJ, Martin NG. 2011. Genetic
variance in a component of the language acquisition device: ROBO1 polymorphisms
associated with phonological buffer deficits. Behav Genet 41(1):50-7.
Lind PA, Luciano M, Wright MJ, Montgomery GW, Martin NG, Bates TC. 2010. Dyslexia and
DCDC2: Normal variation in reading and spelling is associated with DCDC2
polymorphisms in an australian population sample. European Journal of Human Genetics
18(6):668-73.
Marino C, Citterio A, Giorda R, Facoetti A, Menozzi G, Vanzin L, Lorusso M, Nobile M,
Molteni M. 2007. Association of short‐term memory with a variant within DYX1C1 in
developmental dyslexia. Genes, Brain and Behavior 6(7):640-6.
Marino C, Giorda R, Lorusso ML, Vanzin L, Salandi N, Nobile M, Citterio A, Beri S, Crespi V,
Battaglia M. 2005. A family-based association study does not support DYX1C1 on 15q21.
3 as a candidate gene in developmental dyslexia. European Journal of Human Genetics
13(4):491-9.
Scerri TS, Morris AP, Buckingham LL, Newbury DF, Miller LL, Monaco AP, Bishop DVM,
Paracchini S. 2011. DCDC2, KIAA0319 and CMIP are associated with reading-related
traits. Biol Psychiatry .
Scerri T, Fisher S, Francks C, MacPhie I, Paracchini S, Richardson A, Stein J, Monaco A. 2004.
Putative functional alleles of DYX1C1 are not associated with dyslexia susceptibility in a
large sample of sibling pairs from the UK. J Med Genet 41(11):853-7.
Schumacher J, Anthoni H, Dahdouh F, König IR, Hillmer AM, Kluck N, Manthey M, Plume E,
Warnke A, Remschmidt H. 2006. Strong genetic evidence of DCDC2 as a susceptibility
gene for dyslexia. The American Journal of Human Genetics 78(1):52-62.
Shetake JA, Wolf JT, Cheung RJ, Engineer CT, Ram SK, Kilgard MP. 2011. Cortical activity
patterns predict robust speech discrimination ability in noise. Eur J Neurosci .
Threlkeld SW, McClure MM, Bai J, Wang Y, LoTurco JJ, Rosen GD, Fitch RH. 2007.
Developmental disruptions and behavioral impairments in rats following< i> in utero</i>
RNAi of Dyx1c1. Brain Res Bull 71(5):508-14.

196
Truong D. 2009. Behavioral implications of knockout for the dyslexia-risk gene Dcdc2 in mice. .
Wang Y, Yin X, Rosen G, Gabel L, Guadiana SM, Sarkisian MR, Galaburda AM, LoTurco JJ.
2011. Dcdc2 knockout mice display exacerbated developmental disruptions following
knockdown of dcx. Neuroscience .

VITA
Tracy Michelle Centanni was born in Oakland, California to Daniel and Beverly Rosen. Her
younger sister, Hannah Rosen, is currently a doctoral student in the Biology Department at
Stanford’s Hopkins Marine Station. Tracy grew up in Pocono Pines, Pennsylvania and was a
member of the championship Pocono Mountain High School marching band for four years. In
addition to her musical interests, Tracy began horseback riding and showing in 4-H at the age of
eight, and earned 3rd
place in the Pennsylvania State Horse Show with a young horse she helped
train. Tracy has been an avid musician and horse woman for the majority of her life and hopes to
continue both of these pursuits in her personal life outside the lab.
She received her Bachelor’s of Science degree in Psychology from The Pennsylvania State
University in 2008. While attending Penn State, she was a member of the marching Blue Band
for four years. In addition, Tracy marched in the Reading Buccaneers Drum and Bugle Corps of
Reading, PA during their first undefeated season in 2005, and marched in the Santa Clara
Vanguard Drum and Bugle Corps of Santa Clara, CA for the 2006, 2007 and 2008 seasons. She
received two awards for high visual and one award for high musicianship during her time at
Santa Clara. While at Penn State, she also volunteered as a research assistant in the Vision,
Memory and Cognitive Neuroscience lab headed by Dr. Michael Wenger. During her two and a
half years in the lab, Tracy assisted in the design and data acquisition of a study by Dr. Andrea
Halpern at Bucknell University investigating the neural response of musicians and non-
musicians to major and minor scales. Following her Bachelor’s degree, Tracy worked for four

months as a technical writer for Sanofi Pasteur, where she met her husband, Matthew Centanni.
They married in September of 2012.
She completed her Master’s of Science in Applied Cognition and Neuroscience at The
University of Texas at Dallas in 2011 and her Doctorate of Philosophy in Cognition and
Neuroscience in 2013. Following completion of her doctoral degree, Tracy plans to move to
Boston, Massachusetts to pursue a career in research and live with her husband, Matt and their
English Bulldog, Chomper.