speech in the u.s. military: a sociophonetic perception ... · speech in the u.s. military: a...
TRANSCRIPT

SPEECH IN THE U.S. MILITARY: A SOCIOPHONETIC PERCEPTION APPROACH TO IDENTITY AND MEANING
A THESIS SUBMITTED TO THE GRADUATE DIVISION OF THE UNIVERSITY OF HAWAI‘I AT MĀNOA IN PARTIAL FULFILLMENT
OF THE REQUIREMENTS FOR THE DEGREE OF
MASTER OF ARTS
IN
LINGUISTICS
MAY 2011
By
M. Joelle Kirtley
Thesis Committee:
Katie Drager, Chairperson Patricia Donegan Richard Schmidt
Keywords: Sociophonetics, Variation, Perception, Military


i
Acknowledgements
Thank you so much to all of the people who helped me to complete this project. Thank you
to Katie Drager for your thorough words of advice and gentle words of encouragement.
Thank you to Patricia Donegan and Richard Schmidt for your attention and support. Thank
you James Grama for being my sounding board and providing a constant exchange of ideas.
Thank you to Bartek Plichta and Erez Levon for your kind and prompt guidance in using
resynthesis software. Thank you to John Basarab for keeping me calm and always rational.

ii
ABSTRACT
Linguistic variants can index different social meanings so that speakers who use those
variants are perceived as being associated with different social characteristics or social
categories. Perception studies provide an effective means by which to better understand the
interaction of linguistic variation and social meaning. These studies can also help to identify
the specific social meanings that are associated with particular linguistic variants.
This thesis describes a perception study of speech by members of the U.S. Military;
investigating the correlation between Southernness, dominance, efficiency, and stoicism, and
some of their respective linguistic correlates: /ai/ monophthongization and /u/ placement, F0,
speech rate, and pitch width. The study employs the Matched-Guise Technique. This
technique compares participants’ responses to a single speaker in two different ‘guises,’ in
this case, guises created with digital manipulation. The results show evidence that these
linguistic variables are associated with specific social meanings and with the U.S. Military.

iii
Contents
Acknowledgements………………………………………………………………...…… i
Abstract………………………………………………………………………………..... ii
List of Tables…………………………………………………………………………..... v
List of Figures………………………………………………………………………..... vii
1 Introduction…………………………………………………………………………...… 1
2 Literature Review…………………………………………………………………..…... 4
2.1. Sociophonetics………………………………………………………………….. 4
2.2. Perception Studies……………………………………………………………... 10
2.3. The U.S. Military…………………………………………………………….... 14
2.4. A Qualitative Study on U.S. Military Speech………………………………… 14
2.5. This Study’s Purpose and Contribution………………………………………. 16
3 Impressions of U.S. Military Speech…………………………………………………. 20
3.1. Language Ideology……………………………………………………………... 20
3.2. A Qualitative Survey………………………………………………………….... 20
4 Experiment One……………………………………………………………………….. 26
4.1. Purpose…………………………………………………………………………. 26
4.2. Stimuli Voices………………………………………………………………….. 26
4.3. Method…………………………………………………………………………. 28
4.3.1. Linguistic Variables…………………………………………………….... 28
4.3.2. Experiment Design…………………………………………………….…. 33
4.4. Results………………………………………………………………………….. 38
5 Experiment Two……………………………………………………………………….. 46
5.1. Purpose…………………………………………………………………………. 46
5.2. Method…………………………………………………………………………. 46

iv
5.2.1. Stimuli………………………………………………………………... 46
5.2.3. Experiment Design…………………………………………………… 47
5.3. Results………………………………………………………………………….. 49
6 Discussion…………………………………………………………………………….....60
6.1. Aims…………………………………………………………………………..... 60
6.2. Results Summary……………………………………………………………..... 61
6.3. Theoretical Contributions…………………………………………………...…. 64
6.3.1. The Third Wave………………………………………………………..… 64
6.3.2. Models of Speech Processing………………………………………….… 68
6.4. Methodological Contributions…………………………………………………. 68
7 Conclusion……………………………………………………………………………... 70
A Transcripts of Stimuli……………………………………………………………….… 72
B Information about Stimuli ………………………………………………………..….. 76
C Naturalness Rating of Stimuli ……….………………………………………………. 77
D Experiment One Answer Booklet……………………………………………………. 78
E Qualitative Survey Instrument………………………………………………………. 92
F Future Research……………………………………………………………………… 93
References…………………………………………………………………….............. 94

v
List of Tables 3.1 MILITARY and NON-MILITARY responses to characteristics of U.S. Military
personnel…………………………………………………………………………...… 22
3.2 MILITARY and NON-MILITARY responses to where someone from the military
sounds like they are from…………………………………………………………….. 23
4.1 Mean pitch before and after manipulation for each stimulus for
Dominance………………………………………………………………………….... 31
4.2 Range of pitch before and after manipulation for each stimulus for
Stoicism……………………………………………………………………………… 33
4.3 Questions Asked for Each Critical Stimulus………………………………………… 37
4.4 Responses to the Origin of Speaker 2 when manipulated for Southernness……...….. 39
4.5 Responses to the sports Speaker 3 would play when manipulated for pitch……..….. 43
4.6 Responses to the occupation Speaker 3 would have when manipulated for pitch….... 44
4.7 Responses to the origin of Speaker 4 when manipulated for speech rate……………. 45
5.1 Model of the likelihood of identifying the speaker as Southern, when the token had
fronted /u/ and monophthongized /ai/………………………………………………... 50
5.2 Model of the likelihood of identifying the speaker as a leader, when the token had
fronted /u/ and monophthongized /ai/………………………………………………... 52
5.3 Model of the likelihood of identifying the speaker as having been in the military,
when the token had fronted /u/ and monophthongized /ai/…………………………... 52
5.4 Model of the likelihood of perceiving the speaker as someone who would win a
physical fight, when the token had lower pitch…………………………………….... 53
5.5 Model of the likelihood of identifying the speaker as arrogant, when the token had
lower pitch..………………………………………………..………………………… 53
5.6 Model of the likelihood of identifying the speaker as having spent time in the
military, when the token had lower pitch…………………………………………….. 54

vi
5.7 Model of the likelihood of identifying the speaker as helpful, when the token had
slower speech rate……………………………………………………………………. 55
5.8 Model of the likelihood of identifying the speaker as efficient, when the token had
slower speech rate………………………………………………………………….… 55
5.9 Model of the likelihood of identifying the speaker as competent, when the token
had slower speech rate……………………………………………………………..… 56
5.10 Model of the likelihood of perceiving the speaker as having spent time in the
military, when the token had slower speech rate…………………………………….. 56
5.11 Model of the likelihood of identifying the speaker as expressive, when the token
had a wider pitch width…………………………………………………………….… 56
5.12 Model of the likelihood of identifying the speaker as having spent time in the
military, when the token was manipulated for all variables……………………….… 57
5.13 Model of the likelihood of perceiving the speaker as able to win a physical fight,
when the token was manipulated for all variables………………………………….... 57
5.14 Model of the likelihood of identifying the speaker as helpful when the token was
manipulated for all variables…………………………………………………………. 58
5.15 Correlations for each statement and their p values…………………………….…….. 59

vii
List of Figures
3.1 Participants’ regional origins, by whether they or their family members had served
in the military………………………………………………………………………..…21
3.2 Responses from all participants to what type of man serves in the U.S. Military…..…23
3.3 Responses from all participants to how a man in the U.S. Military speaks…………... 24
4.1 Responses to the looks of Speaker 6 when manipulated with higher pitch………..…. 40
4.2 Responses to the looks of Speaker 6 when manipulated with lower pitch………….... 41
4.3 Responses to what kind of boss Speaker 3 would be when manipulated with higher
pitch………………………………………………………………………………...…. 41
4.4 Responses to what kind of boss Speaker 3 would be when manipulated with lower
pitch………………………………………………………………………………….... 42
4.5 Responses to what kind of boss Speaker 6 would be when manipulated with higher
pitch………………………………………………………………………………..….. 42
4.6 Responses to what kind of boss Speaker 6 would be when manipulated with lower
pitch………………………………………………………………………………..….. 43


1
Chapter One: Introduction
With every new encounter, we are judged and judge others by the way we walk, the
way we dress, and the way we talk. While many scholars and laypeople are interested in the
construction of identity through these avenues, sociolinguists seek to learn how talk and
identity interact. Fine phonetic detail in another person’s speech can lead us to think they
have come from a certain place, completed a certain amount of schooling, make a certain
amount of money, or associate with certain people. Sometimes, we are right. Oftentimes, our
judgments are based on specific linguistic traits in the other person’s speech stream, and we
associate those traits with particular social meanings; meanings that we may have learned
from experience with other people, from stereotypes in our communities, or from the media.
Recent scholarship in sociolinguistics has begun to look at speech and speech perception as
composed of linguistic variables, each variable attached to a field of social meanings, present
in larger society (Eckert 2003, 2005, Campbell-Kibler 2009). These traits are used in concord
and in nuanced ways to shape the identities that each of us project in our daily lives.
This thesis investigates four such linguistic traits and their relationship to various
social meanings and to an association with U.S. Military involvement. Linguistic traits were
chosen based on interviews with military personnel and a qualitative survey of American
native-English speakers, used to determine what people think they think about speech and
people in the military. Each linguistic variable may have complex ties to social meanings and
categories for the listeners; experimental techniques can be used to examine those ties.
Experiments One and Two tested what character traits were associated with each linguistic
variable. The results can potentially shed light on whether the process of associating people
with a social group first involves associating them with character traits that would be found
in members of that group. The experiments also served to test whether people’s qualitative
ideas of how they would determine a member of the military were actually used in making
that decision.

2
The linguistic traits examined in this study are F0 (or overall fundamental frequency
(pitch)), speech rate, pitch width, monophthongization of /ai/, and frontness of /u/.
Experiment One was designed to gain a nuanced understanding of how some of these traits
are interpreted by listeners. The results of Experiment Two reflect the relationships between
F0 and physical dominance, arrogance, and military membership; faster speech rate and
efficiency, helpfulness, competence, and military membership; pitch width and
expressiveness; and /ai/ monophthongization and /u/ fronting and Southernness, leadership,
and military membership.
There exists little scholarship on the speech of members of the U.S. Military, but it is
not a subject left untouched by laypeople in everyday conversation. It is common knowledge
that people in the military use acronyms and jargon, but it is also common knowledge that
people in the military come from all over America and from all walks of life, so what can
really be said of U.S. Military speech generally? Even though people in the military may use
all of the American dialects, the military is still a group of speakers sharing a common goal
and a group that undergoes institutionalization from basic training through retirement. These
common goals and common training shape members of the military in a particular way, and
though this may not affect every member’s speech, it is likely to have some effect on most.
In addition, there exists in the U.S.A. wide and common stereotypes of what it is to be a
member of the U.S. Military, including the way that a person might speak. The judgments
made by listeners about someone’s membership in this social category would rely heavily on
these preconceptions. Stereotypes can be powerful tools that people use to assess others. The
purpose of this study is to investigate not which linguistic traits members of the military
actually possess, but which traits listeners listen for in order to determine that someone is in
the military.
The results of this study have theoretical implications for ideas both within
sociolinguistics and in other fields of linguistics as well. Consistent with Campbell-Kibler
(2007), the findings support ideas about linguistic traits being connected to a complex
indexical field of social meanings which can be interpreted differently in different contexts.
They also provide evidence that phonetic variation and social information have linked
representations in the mind that are accessed during speech perception. Evidence of this
relationship between phonetic and social information challenges the traditional view that

3
such variation is filtered out by listeners. The results provide evidence that listeners not only
notice variation in the speech stream, but they use it to make judgments about the speaker.
While this study does not exclusively support exemplar theories of lexical processing,
wherein listeners retain memory traces of each instance they hear of a given word, it does
suggest that some degree of detailed phonetic information must be stored and must be taken
into account when modeling speech processing.
An additional goal of this study is to improve on the methodologies being used for
perception work in sociolinguistics. The methodologies used in past studies attempting to
understand how specific differences in people’s speech affects judgments made about them
have left room for improvement. It is difficult to control for all of the factors that are present
in one person’s speech stream in order to isolate what about a voice brings about a judgment.
Some studies used different speakers who used the different variants that were under
investigation. A technique known as the Matched-Guise Technique (Lambert 1966) sets up
groups of stimuli spoken by a single speaker in different guises in order to keep constant as
many linguistic variables as possible except for the one being investigated. With the advent
of improved and open-source resynthesis software, recent studies have been able to use this
technique with digital manipulation. The experiments in this thesis use various digital
manipulations to create matched pairs of a single speaker using different linguistic variants.
Chapter Two provides an overview of the field of sociophonetics, examining past
studies and theories in order to establish how this thesis contributes to an understanding of
identity and speech. Chapter Three presents a look at people’s qualitative perceptions of
speech in the military and why such a view is important to this study. Experiments One and
Two are discussed in Chapters Four and Five respectively. Chapter Six provides a close
examination of the results of the experiments and offers insight into how the results fit into
sociolinguistic theory.

4
Chapter Two: Literature Review 2.1. Sociophonetics
Sociolinguistics is a broad field that investigates how social information and language
interact. The field includes both discourse analysis and a more structural study of language.
The structural side of the field took off in the 1960’s with the famous studies carried out by
William Labov to expand the notions of linguistic structure within traditional linguistic study
to include formal treatment of speech variation (Labov 1969). His first projects included the
famous Martha’s Vineyard study (1963) in which he found that participants of different age
groups and ideologies represented themselves using different speech patterns, and his
department store study (1972b) in which he found that retail workers at more prestigious
stores used more standard variants of /r/ than those at the less prestigious stores. Inquiry into
structural variation includes examination of lexical items, grammar, morphology, and
phonetics, and though production studies have made up the majority of scholarship in
variation work, perception studies are also being carried out more and more frequently.
Studies of variation in phonetics were identified as a special field within both
phonetics and sociolinguistics beginning in 1979, when the term ‘sociophonetics’ was first
used by phoneticians to describe phonetic studies that considered social variation as a factor
(Foulkes et al. 2010). More recently, Penelope Eckert divided this work into three main
branches of theory which she calls the first, second, and third waves of variation studies
(Eckert 2003). These waves are not related in a linear succession, but overlap in time and are
distinct because of their underlying treatments of variation. The first wave was spurred by
Labov’s department store study (1972b), which actually came after the publication that
spurred the second wave, his Martha’s Vineyard study (1963). The first wave is called such
because it was the predominant approach to variation for decades, before a return to
investigation of local meaning in the last twenty years (Eckert 2005). Studies within the first

5
wave of variation theory connected linguistic variables to broader social categories such as
region, sex, socioeconomic class, or ethnicity. These studies used survey methods to access
the speech of large groups of speakers. Surveys involved quick exposure to the speech of the
participants, usually requiring speakers to read from a passage and a word list, answer some
questions about themselves, and answer a question that was meant to put them in an
emotional state wherein they would use the speech that came most naturally to them. For an
example of this type of survey instrument, see Labov (1966). Both the casual and the read
speech would be compared across speakers for one or more variable and correlations would
be drawn from sociological information about the speakers and the particular variants they
used.
One of the first principles espoused by the first wave was that non-standard variants
of linguistic traits were used more often by those lower on the socioeconomic hierarchy, and
this use interacted also with the speaker’s membership with other broad social categories
such as gender, region, and ethnicity. Non-standard variants in this case were those that were
either more stigmatized or more likely to be associated with a particular group of speakers
(Eckert 2003). Standard speech was that which could be associated with a wider group of
speakers. Labov also proposed that register and use of standard or non-standard variants were
correlated (Labov 1972b). Formal and read speech were more standard, while informal
speech, particularly that used when the speaker was in an excitable state, would be less
standard. His ‘Principle of Style Shifting’ proposed that “styles can be ordered along a single
dimension, measured by the amount of attention paid to speech” (Labov 1972a).
Labov (1966) first proposed the class stratification of linguistic variables, reporting
the findings of a broad study of speech in New York City. He first determined the
socioeconomic status of the participants, setting this variable up as the primary one, and then
discussed how the different classes use several linguistic traits: the presence or absence of
final /ɹ/, the height of the vowels /æ/ and /a/, and the realizations of both /θ/ and /ð/. He also
discussed ethnicity as a determiner of the use of particular variants. Wolfram (1969)
discussed a similar survey study of the speech of African-Americans in Detroit. His work
examined several social variables and their relationship with grammatical and phonetic traits
and found that social class was the greatest determiner of variation. A more recent example
of work within this wave of study is Gorman (2010), where the author applied new statistical

6
methods to older data with the goal of finding correlations between socioeconomic factors
and the use of negative concord. His pursuit, though executed 44 years later than Labov
(1966), was in keeping with the basic presuppositions of first-wave sociolinguistic studies.
While these studies found a relationship between the socioeconomic hierarchy and
use of standard and non-standard variants, this correlation was not always a linear one.
Despite the popular belief, sometimes supported by evidence from sociolinguistic studies,
that the vernacular is spoken by those of less socioeconomic standing, studies found that the
greatest use of non-standard variants is not found in the speech of members of the lowest
rung of the socioeconomic hierarchy, but in that of members of the upper working class or
lower middle class (Labov 2001). Researchers postulated that this had to do with these
groups’ greater community involvements. Therefore, speech is not a direct reflection of
membership in a particular socioeconomic group, but instead a reflection of what it means to
belong to a certain socioeconomic group. There is something about being in the upper
working class or lower middle class that causes one to utilize the vernacular more than
others. Similarly, something about being a man or a woman, or being part of a certain age
group or ethnicity might be the driving force behind the link between these groups and their
speech. The question of what that something is led to the second wave of variation studies,
research which strove to determine the local meaning behind the use of particular variants.
Again, the second wave did not necessarily follow the first wave in time, but rather, is
an alternative approach to the study of variation. Scholars as early as 1948, when the term
‘idiolect’ was first used, were interested in the speech of the individual (Bloch 1948), and
thought that studies of the speech of a single individual within the context of a community
could prove profitable. This idea was set up in opposition to studies using wider surveys
searching for generalizations that could be drawn across society. Linguists following the
second line of thinking emphasize that individuals can use language to index the different
social groups to which they belong at any given point in time. These studies use ethnographic
methods in order to understand a particular speech community and the way that vernacular
and standard variants are used within that community to construct the identities of its
speakers. To investigate these identities, scholars do not necessarily seek out the usage of
predetermined variables, but instead spend time studying the social groups and dynamics

7
within the community and investigating how linguistic traits interact with and display these
dynamics.
For example, Milroy and Margrain (1980) examined the social networks of 46
working-class speakers from Belfast to determine how their social involvements interacted
with their use of vernacular speech norms. Specifically, they discussed the interaction of key
phonological variables with the speakers’ individual social networks to determine if
linguistic behavior can be predicted by social involvement. They concluded that speakers
may begin to use a greater number of standard variants when their social networks are less
dense, and they suggested that this may be because in these cases, institutions rather than
local community practices have more sway over the speakers.
Eckert (1989) spent time in high schools in Detroit to examine the relationship
between the progression of the Northern Cities Chain Shift and the two traditional classes of
adolescents in Middle America: the Jocks and the Burnouts. She found that the burnouts,
students who associated their status and social standing with the community at large rather
than with the high school status hierarchy, were more likely to use more recent, urban
linguistic changes, and their use of linguistic traits was more strongly correlated with the
social category with which they associated than to which class their family belonged.
Mary Bucholtz (1999) spent a year in a high school in California studying the
relationships, ideals, and linguistic practices of a group of middle-class European-American
girls. In the first wave, these girls would have been placed neatly into a single category (e.g.
young, middle-class, European-American, female), but spending time with them revealed the
strategies they used within their own community of practice (a group of people oriented on a
daily basis towards achieving similar goals) (Eckert 2005). Bucholtz described one group
who self-identified as nerds. She claimed that linguistic practices worked in conjunction with
other practices within the group to create meaning and identity. She used as an example the
participant Bob’s linguistic work to distance herself from stereotypical femininity, which
Bucholtz argued is merely part of Bob’s overall work to participate in anti-feminine
practices.
Robert Lawson carried out a similar study of adolescent males in Glasgow (Lawson
2005). He spent three years with males who were self-reportedly in different social groups to
determine what linguistic traits might correlate with community membership. He

8
investigated how violence and adolescence interacted with speech and discourse. Mary
Aleene Rose interviewed 36 speakers at a Senior Citizen’s Center in Wisconsin and observed
the participants’ activities and memberships over time. She investigated realizations of /dh/
and /ow/ and found that variation correlated with ethnicity, gender, occupation, and
education (Rose 2006). Quantitative analysis coupled with ethnographic observation can
provide much richer insight into how and why some variants are used for different groups
and how identity is created within a specific community of practice.
Even with this different approach to sociolinguistic variation, the second wave, like
the first, still dealt with variation in regards to social categories: what links are formed
between social group involvement and specific linguistic traits? The qualities or character
traits that might be indexed by a linguistic trait were mentioned sometimes as an aside, but
never as a focus of the study. The third wave of variation studies views linguistic variation in
terms of linguistic traits being associated with particular qualities of a person, and these
qualities are then logically associated with social categories, thereby relating the linguistic
traits with social categories.
Much theory within sociolinguistics has dealt with people’s speech as something that
they somehow fell into. The possible ways that people could speak were mandated by the
social categories to which they belonged, and agency was placed in the hands of society.
However, society is merely a group of individuals, and while societal practices usually
constrain the action of the individual, agency still lies with individual action. Nettle writes,
“One of the central insights of sociolinguistics is that learners of language do not simply pick
up the most common norms going on around them. Rather, they are seen as active
discriminators who aspire to membership of particular social groups and make themselves
sound as similar as possible to the members of those groups” (Nettle 1999: page 97). Eckert
(2003) points out that the social sciences in the last three decades have moved from a study
of structure to the study of practice, rightly identifying the place of agency; the third wave of
variation studies follows this concern, focusing on how speakers index social meaning using
linguistic traits in order to project both their personal character traits and their involvement
with various social categories. Building on the practices of the second wave of variation
studies, the third wave of theory involves examining more closely what it means to belong to
one category or another, determining what character traits would most likely become

9
representative of a social category, and also questioning why those character traits have
become representative of that category. When these questions are answered, a closer look can
be given to how linguistic traits map to social traits and are used in composite to display
one’s social membership and style. Taking Eckert’s work with Jocks and Burnouts as an
example, the second wave would be interested in membership in one category or the other
and which linguistic traits were found in the speech of which group. The third wave would be
more interested in taking a close look at what it means to be a Jock or to be a Burnout, the
lifestyle and orientations that go with both groups and trying to figure out how certain
linguistic traits might interact with those more specific aspects of belonging to a social
category. One example of this that Eckert offers is the correlation between urban linguistic
traits and the Burnout speakers: Burnouts orient themselves around their communities,
holding down after-school jobs, spending time in the neighborhood, or hanging out at the
skating rink (Eckert 2003). These stronger community ties mean that Burnouts use
community linguistic markers more frequently, demonstrating that the expectations for
belonging to a certain social category can shape how a person speaks.
One of the most compelling studies in the third wave is Zhang (2005). She examined
the use of four phonological variables by speakers of Mandarin Chinese living in Bejing as
working professionals employed either by Chinese or foreign companies. She found that the
employees of foreign companies preferred to use more global linguistic features, while the
State employees used local variants. She concluded that linguistic features are used by the
professionals in foreign businesses to give meaning to their new social identities.
Other studies involve examining the social meaning of one or two linguistic traits to
determine how they might be perceived by listeners or to determine how they could be
perceived differently in different contexts (Campbell-Kibler 2007, Clopper and Pisoni 2004a,
2004b, and 2006, Levon 2006, 2007). For example, there are studies that investigate how
pitch may affect judgments that listeners make of speakers (Puts et al. 2006, 2007). Puts et al.
(2007) manipulated both the fundamental frequency and formant dispersion of male
speakers’ voices to determine whether listeners would find the speakers more or less
physically or socially dominant in higher or lower guises. They found that both a lower F0
and a different Df caused listeners to believe the speaker to be more dominant in both areas.
Similarly, Campbell-Kibler (2007) investigated the social meaning of the pronunciation of

10
/ing/ as either [in] or [iŋ] by different speakers of American English. She reported that the
manipulation had a different effect on the perceptions of the listeners according to which
speaker was using the variants, thereby showing that a linguistic trait can index several social
meanings according to the other linguistic traits amongst which it is found.
These different approaches to inquiry investigate whether a linguistic trait can in fact
have a certain social meaning and whether that meaning exists within an indexical field of
other meanings and categories. Still to be examined is how separate linguistic variables index
broader categories even when found in isolation Another question that remains is whether
linguistic variables used together more strongly suggest membership in one social category
or another than if they occur in isolation. The work presented in this thesis explores these two
areas of inquiry.
2.2. Perception Studies
With the notable exception of Puts et al. (2007) and Campbell-Kibler (2007), the
work discussed in the previous section has analyzed data from speech production. While
perception experiments have been used in speech processing studies for quite a while, they
are newer within the field of sociophonetics. Both pursuits can offer important insight into
meaning and interaction. Production studies involve collecting speech data from speakers and
analyzing variation either on the spot or later on using either careful scrutiny or technological
assistance. Researchers have come to value perception studies because they can approach
some questions that production studies cannot; including what linguistic cues listeners use to
identify speakers (Clopper and Pisoni 2004a), what linguistic traits bring about specific
social judgments (Levon 2006, 2007), how listeners store social information in the mind
(Sumner and Samuels 2009), and even how and why language change takes place (Hay,
Warren, and Drager 2006). It is also important to supplement a production investigation with
a perception study to investigate whether parameters of speech production as identified for a
particular speech community are actually perceived as being related to that community by
listeners. Within sociophonetic perception studies, several methods have become widely
used, and new methods continue to be developed.

11
Some perception studies strive to determine who speaks what dialect and where, at
least in the opinions of the participants. In order to inquire after popular opinions of what
dialects are spoken where and by whom, researchers use both dialect map tasks and
interviews to ascertain the participants’ opinions of certain dialects. The map-drawing task
was first presented by Preston (1989). In this methodology, participants are given an empty
map and asked to draw in the boundaries of different dialects and label the regions. Some
researchers also ask the participants to write any stereotypes they have for the area or words
that someone from that region might use (Fought 2002). These studies found that the
listeners’ experiences greatly affected their responses to the tasks. They also illustrate that
dialect differences can cause drastically different social judgments to be made.
The most straightforward methodology used in perception studies might be simply
playing different speakers to the participants and asking them questions about what they
think of the speakers or of their dialects. Clopper and Pisoni’s body of work on the
perception of regional origin (2004a, 2004b, 2006) requires that the participants listen to
recordings of speakers from different dialect regions and guess what region they are from.
They found that listeners listened for several salient traits in order to make determinations
about what region a speaker was from. In the work on the perception of homosexual male
speech, Gaudio (1994) found that his listeners could accurately guess the sexuality of the
speaker, but he was unable to determine after the fact what speaker traits that listeners were
attending to because there was too much variation in the speakers in his study to attribute
differences in judgment to particular linguistic variables.
One of the most promising methodologies used to perform perception studies in
sociophonetics is the Matched-Guise Technique. In this methodology, a single speaker is
played to the participant in multiple guises, and opinions of the speaker or their accent are
elicited from the listener each time. The purpose behind this is to control for as many
phonetic variables as possible so that traits attributed to the speaker can be confidently linked
with changed variables. If many things about the speech stream in question change at once,
there is no way to be certain which change caused a shift in response. Using the Matched-
Guise Technique, researchers can investigate the perception of an entire dialect or the
meaning of just one linguistic variable. Early implementation of the Matched-Guise
Technique used a single speaker who would employ multiple accents or even languages. For

12
example, Ball (1983) used the Matched-Guise Technique to investigate Australian
participants’ impressions of speakers of Standard English, Liverpool English, Glasgow
English, Australian English, American English, and English spoken with a French, German,
or Italian accent. Purnell et al. (1999) used this method to investigate housing discrimination
in California and found that which dialect the speaker used determined how many times that
speaker’s call was returned. While these uses of the technique can demonstrate how listeners’
perceptions shift in response to major changes in the speaker’s voice, they cannot provide
exact isolation of a single variable, nor can they guarantee that the manipulation is authentic
and consistent.
More recently, as the technology for speech resynthesis has improved, the Matched-
Guise Technique has evolved to include the use of digital manipulation to create the matched
guises for a single speaker’s voice. These guises are then played to the participants, who are
asked to give their opinions of the speaker in both guises. Usually, the listeners have been
made aware that they are listening to the same speaker (Levon 2006, 2007), and at times,
they also know what variable has been manipulated (Campbell-Kibler 2007). Campbell-
Kibler’s study, described in section 2.2, investigated the meaning of variation in word-final
/ing/ and employed this technique. She manipulated utterances from eight different speakers
of various regional dialects and sexual orientations to produce 32 critical pairs of stimuli in
which the speaker produced instances of /ing/ as either [iŋ] or [in]. She then played these
manipulated passages to participants and asked them about the speaker’s regional
background, education, sexuality, and personality. Her study showed that a large amount of
speaker information can be contained in a single token, and it demonstrated how the
interpretation of that information changes according to the linguistic context in which the
token was heard.
With a slightly different line of inquiry in mind, Levon (2007) manipulated the
speech of two speakers, one identified as gay-sounding and one identified as straight-
sounding, for pitch width and sibilant duration in order to determine what effect changes in
those variables might have on listener’s judgments of the speakers’ sexuality. Rather than
focusing on the entire indexical field of a variable in different linguistic contexts as
Campbell-Kibler did, Levon was interested in whether one single variant could index a social
category and what degree of phonetic change would be required to evoke that social

13
judgment. Levon manipulated a 71-second passage of read speech for pitch width and
sibilant duration. He narrowed the gay-sounding speaker’s pitch width by 25% and shortened
his sibilant duration by 17% and created four different stimuli: one with the original variants,
one with narrowed width and longer duration, one with wider width and shorter duration, and
one with both narrowed width and shorter duration. He did the exact opposite for the straight-
sounding speaker. Levon found that perceptions of the gay-sounding speaker’s sexual
orientation and masculinity were linked with differences in pitch width and sibilant duration.
Other work in speech perception investigates how the participants’ backgrounds
affect both the way that they hear sounds and the decisions that they make about social
categorization. Clopper and Pisoni (2004a) investigated whether listeners were able to
accurately place speakers into the correct regional dialect group. Building on that research,
Clopper and Pisoni (2004b) set up an experiment using the same task as their past studies
wherein the participants were asked to identify the origin of six American speakers, but this
time noting the participants’ own regional backgrounds. Clopper and Pisoni found that
listeners who had lived in several regions of America were better able to correctly identify
the region each speaker was from, and they also found that listeners were the best at
identifying speakers if they had lived in the particular region that the speaker was from.
Fridland (2008) built on two studies described in Fridland et al. (2004) and Fridland
et al. (2005), examining the role of vowel formant changes in progress in social perception.
In Fridland et al. (2004) Memphians were tested for whether they found shifted variants of
certain vowels to be more Southern than non-shifted variants, and for whether shifts in front
vowels were more salient as markers of Southernness for the participants than shifts in back
vowels. Adding to this, Fridland et al. (2005) investigated how perceptions of the variant as
Southern interacted with perceptions of pleasantness and education. In order to examine the
role of listener background on the perception of shifts in progress, the same experiments
were carried out with participants from Reno, Nevada. Fridland (2008) found that while both
groups were competent at recognizing the more Southern variants in the token pairs,
Nevadans were overall better at the task, and the two groups seemed to use different criteria
in making their judgments. Fridland attributed this difference to Reno participants using
distance from their own phonological systems as a gauge to determine Southernness, while
Memphis participants used vowel trajectory in addition to vowel formants to make their

14
judgments. Fridland further concluded, in contrast to other studies, that listeners, when forced
to make dialect judgments, perform better if that dialect is not their own.
2.3. The U.S. Military
The experiments presented in this thesis examine how different linguistic variables
are linked with the perception of military involvement. The U.S. Military is portrayed in
some of the most memorable Hollywood moments, featured in the evening news all around
the world, and made up of one percent of the American population at any given time.
Although its members come from all over the country and from every type of background,
the military is a community of speakers, one that vigorously practices institutionalization that
results in greater homogeneity. Along with standardized haircuts and uniforms, the language
used in the military is something that new recruits begin to adopt from the moment that they
enter service. Some of this is intentionally driven by the military itself, as in the chants that
recruits shout out in basic training to learn occupation-appropriate vocabulary. Some speech
markers specific to the U.S. military result from the goals that the community shares while
others probably have more to do with convergence that takes place among the many different
members that join up with different language practices in tow.
2.4. A Qualitative Study on U.S. Military Speech
Kirtley (2010) conducted interviews with seven members of the military in order to
find out how they believe military and non-military speech differ. The interviewees reported
a wealth of differences between the two groups’ speech. The first and most frequent thing
that interviewees were likely to note was the use of military-related lexical items, including
acronyms and slang. They also mentioned that people in the military tend to speak more
quickly and with more fluency, noting that they had noticed this change in their own speech
after joining. Kirtley (2010) argues that these speech characteristics stem from the need for
military communication to be efficient and concise; every communication must be clear and
quick so that sensitive orders can be carried out without dangerous incident.

15
Other markers mentioned by the interviewees may have to do with the strict hierarchy
practiced in the military. Using titles and choosing to use either direct or indirect language
according to the person with whom they are communicating creates and fortifies the military
hierarchy in a constant way so that servicemen are made aware of who to take orders from
and who to give orders to. Participants also mentioned an increased use of slang, a decrease
in pitch change, and a generally lowered F0, linguistic variants that may be a result of
masculine posturing and displays of dominance that take place in a culture that is male-
dominated and intrinsically violent (Kirtley 2010: page 79).
In addition, the tasks that soldiers are required to perform are emotionally taxing and,
in today’s society, much more violent than the tasks required of an average citizen. As such,
soldiers must maintain a different level of emotional distance from their everyday activities
in order to be able to perform these tasks. This distance may be partly established through
using acronyms or military jargon to describe events whose words in civilian society bear a
great deal of emotional semantic content (Kirtley 2010: page 79). The word war is latent with
negative or traumatic meaning, but O.E.F, the acronym for Operation Enduring Freedom,
which is how the war in Afghanistan is referred to by the military, has much less emotional
content.
Emotional distance may also be established through using a smaller pitch range; some
interviewees reported a ‘lack of intonation’ in military speech, and previous studies have
found that emotional language has greater pitch diversity (Burkhardt and Sendlmeier 2000).
Therefore, stoic language is that without much change in pitch and may be a part of what
constitutes military speech.
One last interesting characteristic of military speech that was reported in the
interviews was Southern dialect markers. One participant thought that because military
training camps, where new recruits begin to formulate their identities as soldiers, are in the
South, and because military ideals and Southern ideals often overlap in American media and
perhaps in American popular opinion, soldiers converge with certain markers of the Southern
or South-Midland dialects.
In summation, the most consistently discussed differences about speech in the
military in Kirtley (2010) were lexical items. Just as when an American speaker and a British
speaker of English come together and talk about the different words that they have for the

16
same referents, the interviewees particularly noted the new words that they learned to use for
the first time during service. In addition to these vocabulary items, there were also some
phonetic differences that were either prominent to a greater number of the participants or
particularly salient to at least one participant. These variables included speech rate, speech
efficiency, monotonous intonation, Southernness, and authority.
2.5. This Study’s Purpose and Contribution
The experiments described herein explore the connections between linguistic
variables and social variables within the indexical field of social meaning. The concept of a
member of the U.S. Military, though not always the same for every person, is comprised of
many different social characteristics; the reoccurrence of a perceived association between
some of the characteristics and what it means to be a serviceman is what comprises the
prototype or stereotype of ‘Man in the Military’. When people come into contact with a set of
characteristics in a single person, they are likely to believe that person to be part of the
predetermined social category to which they have assigned those qualities. If those qualities
are mapped to linguistic traits for the perceiver, coming into contact with the linguistic trait
will lead the perceiver to associate the speaker to the social category as well. Therefore, the
hypothesis of this study is that if an American English speaker should hear a man speak
quickly, with Southern vowels, in a low pitch, and without much variance in pitch, that man
will be more likely to be assigned to the category ‘Man in the Military’ than a man with a
slow speech rate, Northern vowels, a higher voice, and more pitch variance. Levon wrote that
the purpose of his 2007 study
was not testing what “gay” and “straight” speakers actually do with language, but rather what a listener population may think they do with language. For this reason, I used the stereotypical assumptions characterizing gay men’s speech as having wide pitch ranges and long sibilant durations to investigate the perception of sexuality. (Levon 2007: page 538)
Similarly, for this thesis, I was not testing how men in the military actually speak, but the
preconceived notions that people have of men in the military and how they speak.

17
Like Clopper and Pisoni (2004a), these experiments were also designed to examine
the role of listeners’ backgrounds in their perception of speakers. Participants were
categorized into groups with military experience, with family in the military, or with no
experience with the military. It was expected that these groups might make decisions about
which speakers were in the military differently because of their backgrounds.
In addition to contributing to sociolinguistic theory, the experiments also provide
further evidence that speech processing involves the logging of social information. For many
decades, and still today for many researchers interested in speech processing, variation in the
acoustic stream was considered noise that listeners had to normalize in order to access
abstract phonological and lexical representations. This noise was also, and sometimes still is,
attributed to universal physiological and cognitive differences in speakers. Models created
under these presuppositions propose that audio input comes in, is subjected to normalization
filters in the brain and reverse processing of the phonological rules supposed for the speaker,
and is then associated with the best fitting abstract phonemic lexical entry. It is produced in
much the opposite fashion. Sociolinguistic evidence shows that these models are not
sufficient.
Sumner and Samuel (2009) found that listeners who were more familiar with the r-
lessness of the NYC dialect were primed by r-less variants of words to respond more quickly
to a word-judgment task while those less familiar were not primed by those same variants.
This suggests that exposure to a dialect can help to speed processing when listening to
speakers of that dialect. This evidence cannot be explained by abstract phonemic
representation models. Experiments One and Two can show further evidence that listeners
use extralexical and extrasentential information to learn more about the speaker, perhaps
even storing this information to speed processing of that speaker in the future.
Exemplar theory (Goldinger 1997, Bybee 1985, 2001, 2002, Johnson 1997, 2006) has
become a popular theory within sociolinguistics and beyond to deal with the evidence that
variation is not noise, but carries with it important social information that listeners store and
use to make future decisions about both familiar and new speakers. Theorists who propose
Exemplar Theories posit that a lexical entry in the mind is comprised of specific memory
traces of every instance in which that word was heard. In early versions of these models, the
process of accessing a lexical item is not limited to searching only for an abstract phonemic

18
representation, but rather, involves searching through memory traces of specific raw speech
episodes and situating the new utterance in a context of all versions of the word heard before
(Goldinger 1997). A study to investigate the validity of this model revealed that listeners are
able to perceive the way that an utterance is said and replicate it more closely very soon after
hearing it than they do a bit later. Listeners were also shown to more closely replicate an
utterance after hearing it produced the same way more times (Goldinger 1996). This shows
that listeners do not immediately convert the things that they hear into phonemic
representations, but produce affected tokens soon after hearing a word spoken in a certain
way. More recent versions of exemplar models have both episodic memories and abstract
representations (Pierrehumbert 2006), and different kinds of tasks may require activation of
either or both of these levels of representation (Hay, Drager, and Warren 2010).
McQueen et al. (2006) argue that adequate models must in the future include abstract
prelexical representations of words, something that is not included in extreme exemplar
models. One possible model is that each lexical entry is comprised of both an abstract
representation and exemplar memories of real-life encounters with the lexeme. Another is
that speaker information could be stored separately from the abstract representations in the
lexicon. One idea that has not been spoken of much to my knowledge is that perhaps there
are abstract representations of words, and listeners do in a manner normalize the acoustic
stream as it flows in, but the particular neural pathway, or more abstractly put, the filter
required for each normalization, is somehow stored in the memory and associated with
certain words. The memory of which filter is applied to the acoustic input may then be
associated with a social or biological category. That association could become stronger as the
filter or pathway is used more often. Perhaps this is what Pierrehumbert meant when she
wrote,
It would be astonishing if human neural circuitry proved to encode and store every single experience separately as such, like a character in a Borges story. Instead, remembering experiences involves updating or strengthening neural circuits. Extremely similar experiences would impact the same circuits, and the cumulative effect of exposure need not be linear. In fact it is unlikely to be linear. Saturation effects for the memory of extremely high-frequency types of events are only to be expected. (Pierrehumbert 2006: page 525)

19
Research to further determine the nature of speech processing in the mind would help to
further understanding of how social information is stored and accessed in the mind, along
with helping to determine the nature of cognitive processes of linguistic interaction.

20
Chapter Three: Impressions of U.S. Military Speech 3.1. Language Ideology
Beginning with Kirtley (2010) and using a qualitative survey to corroborate those
results, the experiments in this study were designed with preconceived ideas about which
possible linguistic traits might be associated with the military and further, which character
traits might also be associated with these linguistic traits and the military. Unlike Campbell-
Kibler (2007), which began with less conjecture and manipulated one variable to see what
the result might be, this study was designed with variables in mind based on past work. In
order to isolate what linguistic traits signal military membership, I began with both ideas
about military speech and ideas about social characteristics of members of the military. Then,
I used past sociolinguistic research to choose an acoustic correlate to those social
characteristics. The test questions for each linguistic trait in Experiment Two were designed
to find what I already suspected might be there, although asking open-ended questions in
Experiment One allowed the participants to contribute their opinions without being led to
respond in a certain way by rigid categories. This methodology combines testing for results
on preconceived notions with allowing the participants to project their own cognitive
delineations. Additionally, by first assuming a web of connections between linguistic traits
and social characteristics, I could compose experiments which tested whether people’s ideas
about what they thought of a certain group of people or how that group speaks actually
matched up to the judgments that they made.
3.2. A Qualitative Survey
In order to evaluate if the linguistic traits that participants from Kirtley (2010)
mentioned are associated with military speakers for a wider group of participants that

21
includes respondents with less exposure to the U.S. Military, a qualitative survey was
conducted with thirty-five American, native-English speaking participants. The respondents
were asked open-ended questions about where they grew up, how old they were, what type of
person they think of when they think of a member of the U.S. Military, how they think a man
from the U.S. Military speaks, where they think most men from the U.S. Military sound like
they are originally from, what type of women they think serve in the U.S. Military, and if
they or anyone in their immediate families had ever served in the U.S. Military. Each
participant was given a piece of candy for their participation upon their consent, and they
were given the form in the presence of the researcher, who waited for them to finish before
collecting the form. The forms were not analyzed until several days later, so the respondents
remained anonymous.
Survey respondents were grouped into two groups: MILITARY and NON-
MILITARY. MILITARY included those who either had immediate family members in the
military or had themselves served. NON-MILITARY included those who had never served
and did not have family who had served. Figure 3.1 shows the two groups of participants and
where they reported to be from.
Figure 3.1: Participants’ regional origins, by whether they or their family members had served in the military
Dealing with qualitative data gathered in surveys can be a difficult task. Open-ended
questions lead to many answers that may be similar but are worded a bit differently. As such,
the data gathered from this interview are represented in two ways: first, items that were
mentioned several times in the same way are presented in Tables 3.1 and 3.2, with a
0
2
4
6
8
10
MILITARY
NON-MILITARY

22
percentage of the times that that particular word or phrase was used out of all words or
phrases. Second, for items that were not the same, the items that have close semantic
connections with other answers are grouped into semantic categories and represented by a
heading given to each semantic cloud. This method was used in Drager et al. (2010), who
argued that semantically-informed tag clouds can be used as a more intuitive tool to display
perceived style than tables.
Semantic clouds based on the survey data are presented in Figures 3.2 and 3.3. In
these figures, the size of the font and the word’s centralness to the figure indicates how often
that semantic idea was mentioned by participants. For the purposes of this thesis, only the
answers given to the questions about men in the military, men’s speech in the military, and
what region men in the military sound like they are from will be addressed. They will be
addressed both separately in terms of MILITARY or NON-MILITARY in Tables 3.1 and
3.2, and together with no regard to the category of respondent in Figures 3.2 and 3.3 so that
the reader can get an idea of both how the two groups responded apart and how they
responded as a whole.
Table 3.1: MILITARY and NON-MILITARY responses to characteristics of U.S. Military personnel. NON-MILITARY characteristics n= 30
speaking n=22
MILITARY characteristics n=29
speaking n=21
white 10% respectful 9% serving 7% respectful 19% young 6.6% ignorant 9% hardworking 7% confident 9.5% strong 6.6% loudly 9% honest 7% partier 6.6% outgoing 6.6%
As shown in Table 3.1, those contributing from the NON-MILITARY group reported that a
member of the Military is a young, partying white male, who speaks loudly and some said
either with ignorance or respect. In contrast, the MILITARY group responded that he is a
hardworking and honest individual serving his country who speaks respectfully and with
confidence.

23
Table 3.2: MILITARY and NON-MILITARY responses to where someone from the military sounds like they are from. MILITARY NON-MILITARY South 35% South 29% Midwest 22% Midwest 33% All-over 22% All-over 19% Other 21% Other 19%
For both groups, the concept of a military man’s dialect region was either Midwest or South.
As shown in Table 3.2, over half of the participants responded that people in the military
sound like they come from one of these two regions. Other responses included “all-over”
(MILITARY 22%, NON-MILITARY 19%), East (MILITARY 4%), and West (MILITARY
4%, NON-MILITARY 5%). This finding, that military speech is associated with the South
and Midwest, is consistent with findings reported by Kirtley (2010) who found that even
members of the military presently active made this same association.
Figure 3.2: Responses from all participants to what type of man serves in the U.S. Military.
As shown in Figure 3.2, when asked about a man in the military’s character traits,
participants primarily responded that a man in the U.S. Military is disciplined, dominant,
patriotic, and strong. They also thought of him as young, white, and uneducated. Perhaps this

24
is because many people’s idea of a person in the military is the new Marine recruit or
infantry soldier often portrayed in the movies or seen in public places. Figure 3.3: Responses from all participants to how a man in the U.S Military speaks.
As shown in Figure 3.3, the perception of a man in the military is that he speaks respectfully,
possibly because of the hierarchical terms that he uses. He is perceived to be direct and
concise and someone who speaks with authority. In responses concerning a military man’s
characteristics, regional dialect was also mentioned; a man in the military is reported to speak
like someone from the Midwest or South.
Taken together, the survey results indicate that some of the most important
conceptions of U.S. Military servicemen are that they are Southern, confident, dominant,
strong, and patriotic. In terms of how they speak, participants reported that a military man
speaks with authority, clearly, concisely, and he is also respectful, though somewhat
ignorant. For many of the questions asked, participants had very similar answers, showing
that there is a stereotype or general concept of what a man in the military is like. Though in
truth there is probably a greater amount of diversity than there is of similarity among military
men, there still exists a concept of the community, like there is for all communities that one
regularly comes into contact with. These stereotypes help people to know what to expect

25
from people and how to interact with them. They also shape how people produce and
perceive speech when they interact with an interlocutor perceived to be from a specific
group.
3.3. Four Social Variables Identified for This Study
Considering which traits from Kirtley (2010) and the survey presented in Section 3.2
can be associated with acoustic speech variables, four social characteristics were chosen as
being ideologically linked to involvement with the U.S. Military and easily linked to a
linguistic trait: efficiency, stoicism, dominance, and Southernness. These social
characteristics were then assigned a linguistic correlate based on sociolinguistic research
conducted on each trait. Efficiency was linked with speech rate (Peng, Zebrowitz, and Lee
1993), stoicism with pitch width (Burkhardt and Sendlmeier 2000), dominance with F0 (Puts,
Gaulin, and Verdolini 2006), and Southernness with /ai/ monophthongization and /u/ fronting
(Clopper and Pisoni 2004a). These are the traits that are examined in the experiments
presented in Chapters Four and Five. By first using qualitative methods to ascertain from
participants what they conceive to be different about military speech, the experiments can
examine whether our conscious conceptions of differences are related to the actual process of
parsing a speech stream in order to decide what kind of person the speaker is. If listeners do
in fact associate these linguistic traits to members of the military when listening to speech,
this indicates that people have an awareness of linguistic variables and their link with social
categories, though listeners may not always have a conscious awareness of all the
connections between linguistic variables, social meanings, and social categories. Instead,
different levels of these connections may be the most salient to a listener in making a
judgment, even as all levels are activated. For example, listeners may think that a person who
seems physically dominant and speaks quickly is likely to be in the military without realizing
that F0 and perceptions of efficiency are connected to these traits and are assisting them in
making their judgments.

26
Chapter Four: Experiment One
4.1. Purpose
Experiment One presents open-ended questions to the participants and asks them to
give any answer that they find suitable. Compared with a forced-choice methodology, this
kind of answer can give a more nuanced look at some of the impressions that particular
manipulations give to the listeners. If participants can answer absolutely anything, the
experimenter has not coerced them into saying one thing or another and has not biased them
toward a certain answer. In addition, these answers can sometimes give new insights into the
nature of the variables being investigated that the experimenter had not thought of.
4.2. Stimuli Voices
To create all of the critical stimuli, and five of the filler stimuli, I interviewed eight
firemen who work at the same firestation in central Kansas. One of the men was a member of
my family. Members of this community are part of the South-Midlands dialect region. This
region was chosen because, taking into account the results of the qualitative survey reported
in Chapter Three, the South and Midwest are the most plausible dialect regions for a person
in the military to come from, and the South-Midlands dialects is much like the dialects of the
Midwest, but it also shares certain vowels with the Southern dialect, such as fronted /u/ and
the pin-pen merger.
All eight of the speakers interviewed are Caucasian males between the ages of 24 and
46 who grew up within forty miles of the small town where they now work. They come from
similar socioeconomic backgrounds, and all of them have completed high school and some
amount of college. All eight of the speakers are heterosexual. The other two speakers, whose
speech was used to create five filler stimuli for the experiment, were members of the U.S.

27
Military who also come from the South-Midlands dialect region. One speaker, a Caucasian
male, grew up within 20 miles of the small town from which the other speakers came and
still lives in that area. The other speaker, an African-American male, grew up 180 miles from
that small town and is now stationed in Hawaiʻi.
In perception experiments in the past, most of the stimuli created were taken either
from recordings of read passages or from various clips of interviews with no controlled
subject matter. I felt it was important for the speech to come from interviews, as judging a
person’s reading voice is not the same task as judging that person’s natural speech. However,
using natural speech can result in different topics for each speaker that might reveal social
information about that person, so I wanted to control the subject of each passage so that I
could have more confidence about what was causing any differences across responses of the
participants. Therefore, all of the speakers participated in an interview consisting of questions
about their backgrounds, including what meals were like at their houses, where they grew up,
how they got to school when they were children, and how they like their jobs. They were
then asked questions about how to get from one place to another in their town and about a
time when they had been lost. Four of the speakers also participated in a map task, in which
they gave directions to a partner about how to recreate a path that was drawn only on their
papers and not on their partners’ papers.
From these interviews, excerpts of speech were chosen which had little information
about what type of person was speaking or to whom they were speaking. For example,
speakers may describe directions from one place to another, including only street names that
could be found in any American city or generic places like a grocery store. In addition, four
of the stimuli describe being lost. Two of the stimuli manipulated for Southernness and one
manipulated for efficiency describe getting to school, and one manipulated for Southernness
is a description of a restaurant. It is believed that these passages give away little about the
speakers’ identities. In addition, the topic remained relatively constant across all of the
speakers, so topic change would not distract the participants from listening to the manner in
which the speaker spoke. The texts of all of the created stimuli are included in Appendix A.
The clips are between 10 and 20 seconds long after all manipulations were performed. The
filler stimuli were not manipulated.

28
4.3. Method
4.3.1. Linguistic Variables
When people say that people’s voices sound more or less efficient or stoic, dominant
or Southern, they are not speaking of ideals or character traits that are inherent in speakers’
voices; instead, they are talking about acoustic measures of voices that have come to signify
that particular character trait for speakers of English in a particular cultural context. Pitch
width can indicate a speaker’s sexuality (Levon 2007); /ai/ monophthongization can indicate
a speaker’s regional background (Clopper and Pisoni 2004). As such, there is an indexical
field that is activated when a person makes a social judgment of another person’s speech
(Eckert 2005). In order, then, to examine the connections between these character traits and
military involvement, the connections between the traits and linguistic variables that might
be associated to each of them had to be investigated. For this, I turned to sociophonetic
studies of each trait.
The participants in these experiments were asked to make judgments about the
characters of the speakers after they had been acoustically manipulated. Their responses will
express the complex correlations between the specific acoustic measure and the character
trait, the character trait and U.S. Military involvement, and last, the acoustic measure and
U.S. Military involvement.
Southernness
Clopper and Pisoni (2004b) report that Southernness has several salient features: the
monophthongization of /ai/, the voicing of /s/ before a high front vowel, the diphthongization
of /o/, the pin/pen merger, and /u/ fronting are all prominent features in Southern speech. In
this study, both /ai/ monophthongization and /u/ fronting were manipulated.
Monophthongization of /ai/ was manipulated because it is a salient cue of Southern dialects
(Clopper and Pisoni 2004b). Additionally, /ai/ monophthongization was chosen because it is
a manipulation that was more easily performed than that of the other Southern variables
mentioned above, there were a larger number of stimuli containing this variable, and the
vowel manipulation software created natural sounding monophthongs. The position of /u/
was manipulated because Clopper and Pisoni (2004b) found that the most significant

29
indicator of the south and south-midland dialects was /u/ fronting (2004b). Additionally, it is
found in both Southern and South-Midlands dialects. Because the South-Midlands dialect
might also have a strong effect on perception of military identity, it was best to choose a
marker that the two dialects share.
Of the tested methods to resynthesize the /ai/ and /u/ vowels of the Southern/non-
Southern stimuli, Akustyk (http://bartus.org/akustyk/) resulted in the most natural-sounding
tokens. The excerpts chosen for this manipulation had at least one instance of each vowel
type, and at least five instances total of these two vowels. In order to prepare each clip for
manipulation, I first had to generate silence around each token that was to be resynthesized,
as Akustyk cannot be used to resynthesize vowels well unless there is a clear closure on
either side of the utterance. I did this in Audacity by using the Generate Silence function to
add .25 seconds of silence on either side of the syllable. I then opened this new file in Praat.
All resyntheses were performed with the Create Basic Synthesis function in Akustyk. In this
function, the sound being changed can be divided into ten segments, and one can increase or
decrease both F1 and F2 within each segment. For each sound, I first determined which
segments corresponded to the parts of the vowel that required resynthesis. In order to
monophthongize /ai/, I worked on a case by case basis, as only some of the speakers
produced diphthongized /ai/. If the vowel was a diphthong, the F1 and F2 of the offglide were
resynthesized to have the F1 and F2 values of the nucleus. In order to diphthongize the sound,
I examined each speaker’s /i/ vowel in a word where /i/ was followed by a coronal stop, and
manipulated the token so that during the second half of the vowel, the formants transitioned
to the speaker’s F1 and F2 values for /i/. In general, the diphthongization required an
approximate decrease of F1 by 100 Hz and an increase of F2 by 300 Hz. However, there were
times when this manipulation did not sound natural, so for these cases, I decreased the slope
until it sounded like a natural utterance.
To front or retract the /u/ vowel, I also had to find where the program segmented the
sound for each word that I was manipulating. Once the /u/ vowel’s segments had been
identified, F2 was increased by around 300 hertz, remaining mostly constant across clips.
Similarly, to back the /u/ vowel, I decreased F2 by approximately 200 hertz, and this value
also remained mostly constant. After these changes were made to the vowels, the files were
reopened in Audacity, and the silences that I generated earlier were removed. For some

30
stimuli, the resynthesis created a few blips in the waveform, so I also tried to clean up the
final wav sound by deleting these blips to make it sound as natural as possible.
Dominance
Perception studies concerning male dominance have commonly looked to overall F0
as a possible correlate to more dominant speech. Puts et al. (2006) found that male
participants rated voices that had been lowered in F0 or Df as more dominant than the same
voices raised for these variables. In Puts et al. (2007) they further found that these
correlations were stronger for physical dominance than for social dominance. Dominance is
not the only trait associated with mean pitch; F0 is sometimes discussed as a marker of
masculinity, and it has also been related to perceptions of low emotional states (Puts et al
2006). For the experiments presented here, I sought to tease apart the judgments induced by
this variable through the use of specific wording, such as ‘What kind of sports would this
person play?’ or ‘What does this person look like?,’ to examine the relationship of pitch and
physical dominance as opposed to ‘This person is a leader.’ or ‘What kind of boss would this
person be?’ to investigate the relationship between pitch and social dominance.
Manipulations of overall F0 were also performed in Audacity. For this manipulation, I
used the Change Pitch Effect. For each stimulus, I first determined how far the pitch could be
manipulated before it no longer sounded like natural speech. I found that for all speakers, this
threshold was roughly a seven percent increase or decrease in pitch. I then calculated the
mean change that this percentage change would cause in hertz for each excerpt and checked
to make sure that a seven percent change in hertz would be an equal amount of change in
semitones, as semitones are a better indicator of the human perception of sound. A seven
percent change in hertz is indeed a steady amount of increase and decrease in semitones. For
stimuli with a higher overall F0, I used the pitch ratio function within the Change Pitch Effect
and increased the overall pitch of each clip by seven percent. For stimuli with a lower overall
F0, I decreased the overall pitch of each clip by seven percent. Table 4.1 shows the average
pitch of each clip before and after the manipulations were completed.

31
Table 4.1: Mean pitch before and after manipulation for each stimulus for Dominance. Speaker Direction of
Manipulation Original Range (Hertz)
After Manipulation (Hertz)
Speaker 3 raised 91.6 98.2 lowered 92.4 86.1 Speaker 5 raised 104.2 112.2 lowered 94 87.9 Speaker 6 raised 119.1 127.3 lowered 118.2 109.9
Efficiency
Efficiency involves speed and accuracy, getting a job done correctly in the shortest
amount of time possible. In speech, this would equate to concise wording, increased speech
rate, and fewer pauses, both vocal and silent. The amount of information that a person is able
to convey in a given slot of time is one of the most important aspects of efficient speech,
though this of course must be balanced by clear acoustic signals. Wingfield et al. (1985) used
time compression of speech clips in an experiment, showing that adults can understand
speech at a rate that is twice as fast as produced in normal time, so the hindrances in the
comprehension of quick speech are not speed but other confounds such as unclear syntactical
structures and muddled articulatory gestures. For these experiments, I chose to use speech
rate as the variable investigating efficiency because speech rate was specifically mentioned
by the interviewees and because it is easily manipulated and salient to the listener. In
addition, Peng et al. (1993) found that a faster speech rate was correlated with power and
competence for American listeners.
Manipulations of speech rate were performed in the software program Audacity. For
stimuli with a faster speech rate, the overall tempo of the entire clip was increased by ten
percent. All vocal pauses were deleted at the nearest zero crossing of the waveform. Silent
pauses were decreased to 500 ms. For stimuli with a slower speech rate, the tempo of silent
and vocal pauses was decreased by fifteen percent, while the overall tempo of the clip was
decreased by ten percent.
Stoicism
Emotional speech often includes increased pitch range and raised pitch contour.
Speech perceived as laden with a strong emotion like sadness or fear tends to have a wider

32
range of pitch (Burkhardt and Sendlmeier 2000). Pitch width may also be a factor in judging
a male speaker’s sexuality (Levon 2007). As such, the variable for stoicism is the width of
the speaker’s overall F0 throughout an excerpt, and this variable is also matched with
questions about manliness. Clips were manipulated so that there were two versions: one with
an increased pitch range (for emotionally imbibed speech) and the other with a decreased,
more monotonic pitch range (for stoic speech).
As done by Levon (2006), in his work investigating the correlation between pitch
width and perceived sexuality, pitch width was manipulated in Praat. Rather than changing
the pitch width by 25 percent as Levon did, I widened or narrowed the distance of each pitch
point in the pitch track from the midpoint of the clip by 50 percent. I first tried several
manipulations with a 25 percent shift in the width, but the difference was hardly noticeable.
The speaker in Levon (2006) had a larger pitch range than the speakers in this study, so it is
likely that a percentage change would be greater for that speaker than for the speakers in this
study.
For each excerpt, the file was converted in Praat to a manipulation track. In the Edit
function for each manipulation track, the pitch units were set to semitones, and the pitch
points set to 2.0 frequency resolution. I then determined the highest and lowest pitch points
for each excerpt, excluding any obvious outliers. From these, I established a midpoint for
each excerpt. For each pitch point of the excerpt, I calculated how far the point was from the
midpoint and multiplied that difference by either 50 percent or 150 percent. I then added or
subtracted the new value from the midpoint. Using a vertical dragging strategy, I dragged
each pitch point to its new value. When all of the pitch points had been either decreased or
increased according to whether I was narrowing or widening the pitch width, I then ran an
overlap-add resynthesis for each manipulation, which became my final manipulated stimuli.
Table 4.2 shows the pitch range of each clip before and after manipulation in both directions.

33
Table 4.2: Range of pitch before and after manipulation for each stimulus. Speaker Direction of
Manipulation Original Range (Semitones)
After Manipulation (Semitones)
Speaker 2 increased 6.5 7.4 decreased 13.6 10 Speaker 4 increased 14.1 15.9 decreased 17 13.3 Speaker 6 increased 14.9 17 decreased 9.9 6.9
All Variables
For two speakers, I also chose pairs of excerpts to be manipulated for all four
variables. If it turned out that a single acoustic variable was not enough to persuade a listener
that the speaker was in the military, perhaps that could be because listeners evaluate
speakers’ identities based on the composite of acoustic traits found in their speech. I wanted
to find out if manipulating a speaker for all of the traits I believed to be associated with
military speakers would influence listeners to have a stronger association of that speaker to
military involvement. To perform these manipulations, I followed the procedures explained
above for each variable. For each one, I tried manipulating the vowels first, followed by F0,
speech rate, and pitch width, but the final result was unnatural sounding for all four stimuli. I
next tried manipulating F0 first, followed by speech rate, pitch width, and vowels, and these
manipulations sounded more natural, though not perfect. They, while not being without some
fault, still sound like human speech, but they sound as if the audio quality were not as good
as for the other recordings. This difference was taken into account when analyzing the results
of the experiment.
4.3.2. Experiment Design
Stimuli
For the critical stimuli, six of the speakers contributed excerpts. For two of the
speakers, six excerpts were manipulated for three variables, and for four of the speakers, four
excerpts were manipulated for two variables. Table App.1, in Appendix B shows all of the
stimuli, including who was speaking, what manipulation was made, and the topic of the clip.

34
For each manipulation: speech rate, F0 , pitch width, and two Southern vowels, pairs of
excerpts from three different speakers were manipulated.
All of the stimuli, including the fillers, were played to five linguistic graduate
students who would not participate in the later experiments. Each audio clip was assigned a
number, and the listeners were asked to score the clip on a scale of one to five, one being
unnatural and five being natural. These scores were added together to formulate a naturalness
rating for each audio clip, and these scores can be seen in Appendix C. Overall, the tokens
were identified as natural. The stimuli where all manipulations took place, as was expected
based on my own response to these clips, had low scores. The excerpts manipulated to be
slower, with diphthongized /ai/ and backed /u/, with higher overall pitch and wider pitch
width especially sound too unnatural, and were treated delicately during analysis. The other
clips that were considered less than ideal were the excerpts that were manipulated to be
faster, with monophthongized /ai/ and fronted /u/, with lower pitch and narrower pitch width.
Experiment One Methodology
Experiment One used an extension of Matched-Guise methodology like that used in
Campbell-Kibler (2007) in which a single speaker is heard by participants in two different
guises. For the present study, participants listened to the pairs spoken by the same person but
manipulated in opposite ways, and the two clips were not played sequentially. The
participants were not intended to know that they were listening to the same speakers. The
participants answered the same questions about the pair of tokens so that their answers could
be compared. For example, if the first clip from Speaker 1 was manipulated to be lower, the
participants would be asked where he was from, what his occupation was, what sports he
played, and what kind of boss he would be. The second clip from Speaker 1, taken from a
different part of the interview with that speaker and heard later in the experiment, would be
manipulated to be higher, and the participants would answer the same questions about the
speaker without knowing that he was the same person. If their answers changed when the
pitch changed, this would suggest that a difference in pitch causes listeners to envisage the
speaker differently. The participants sat in front of a computer screen in a sound booth and
heard the stimuli through headphones. The experiment was created in E-Prime, and while all

35
sound files and questions were administered through E-Prime in a consistent but initially
pseudo-random order, the participants wrote their answers in an answer booklet by hand.
Before participating in the perception task, participants were informed that they
would be listening to several American men speaking, and they should try to answer
questions about what type of men they believed the speakers to be. They were told to be as
specific as possible and that they should not necessarily listen to what the men said, but how
they spoke. They were then given their answer booklet and ushered into the sound booth. The
E-prime experiment began with detailed instructions about the task. Participants read that
they would hear short clips of speech from 25 men. They were told that the task would be
self-guided, so they should make sure that they were prepared to listen before starting the
clip. After each sound file, they would be asked four questions about the speaker. They were
told that they would see the questions on the computer screen and also in their answer
booklets, and that they should answer in writing. After receiving these instructions, the
participants experienced one practice round in which they heard a speaker and then read
questions about him. After this practice round, if they had any questions about the task or
problems with the listening volume, they were instructed to consult the researcher.
Experiment One had twenty five stimuli: two pairs for each of the individual
variables, one pair of stimuli in which all of the variables had been manipulated, and five of
the filler stimuli. As stated before, the stimuli were ordered such that no one speaker was
heard twice in a row, and no one manipulation was heard twice in a row. A filler was played
after every three critical stimuli to add to the number of overall stimuli and to increase the
number of speakers in the experiment so that the participants would be less likely to guess
that they were hearing the same men throughout the experiment.
The questions for Experiment One were open-ended so as to allow the participants to
express their own preconceived social categories and perceptual spaces. For every token, the
participants were first asked where the speaker was from and then what the speaker’s
occupation was. They were then asked two additional questions that were more specific to
the particular variable that had been manipulated. For example, if the overall pitch had been
manipulated, the question would concern what the speaker looked like or what kind of sports
he would play. For each variable, one of the additional questions remained constant, while
one question was different for each pair. Refer to Table 4.3 for a complete list of the

36
questions that were used and the order in which the participants heard the stimuli. For every
pair, the questions were presented in the same order. A copy of the answer booklet is
included in Appendix D.
The participants took between 40 and 60 minutes to complete the task. When they
were finished with the experiment, they were asked to fill out a one-page survey about
themselves, asking where they had grown up, where they had lived, how old they were, what
language they had spoken at home growing up, if they could speak any other languages, and
if they had hearing problems. They were also asked if they had spent any time in the military,
and if so, in what capacity, if any of their immediate family members had spent time in the
military, what they thought the purpose of the study had been, and if they thought anything
was strange about the audio clips they had listened to. A copy of this survey can be found in
Appendix E.
For the second to last question, inquiring after the purpose of the study, most
participants wrote that it had to do with determining how listeners judge speakers based only
on their voices. Some wrote things as specific as that the task was a regional dialect task or
that I was looking for a correlation between socioeconomic background and region. One
thought that I was looking specifically at how pitch and accent affect perception. A few also
mentioned that their own backgrounds were a part of the study.
I asked the participants about whether there was anything strange about the speakers
in order to ascertain if the listeners were able to tell that there were far fewer speakers in the
study than they had been led to believe and whether they could tell that there was
manipulation. I was also interested to find out if they thought it strange that the speakers
sounded like they were from the same dialect region. Many answered that there was nothing
strange about them. One participant answered that some of the speakers sounded slow;
another mentioned that the emphasis that some of the speakers placed on certain words was
strange; two participants wrote that some of the speakers sounded slightly distorted and that
they thought this might be due to some sort of manipulation; one mentioned that all of the
speakers sounded white; two mentioned that all of the speakers sounded like they were from
one dialect region, either the south or the Midwest. From the answers given, it seems that
only one speaker guessed that they were hearing some speakers multiple times, and only one
speaker guessed that all of the speakers were from the Midwest. Largely, then, the

37
participants believed that they were listening to 25 speakers from different parts of America.
Even the speaker who guessed that he was hearing fewer speakers did not guess that he was
listening to manipulated pairs and thought that he heard only a few speakers multiple times.
Also, this participant answered similarly to the other participants. Because of these
responses, I did not remove any participant’s results from the study, and I can be confident
that the participants legitimately listened to each voice as a new speaker and the results are
not confounded by participants’ speculations. Table 4.3: Questions Asked for Each Critical Stimulus Stimuli Played Third Question Fourth Question Speaker 9- Filler
What kind of education does this person have?
What kind of television does this person watch?
Speaker 1- Southern What are this person's politics? What sports would this person play? Speaker 6- higher pitch What kind of boss would this person be? What does this person look like?
Speaker 2- nonSouthern What is this person's socioeconomic background? What are this person's politics?
Speaker 8- Filler What kind of car would this person drive? What sports would this person play?
Speaker 3- higher pitch What kind of sports would this person play? What kind of boss would this person be?
Speaker 4- faster What would this person do in their free time?
How would you describe this person's personality?
Speaker 6- widened width
What kind of movies does this person watch? Does this person cry? Why or why not?
Speaker 10- Filler What does this person look like? What kind of car would this person drive?
Speaker 5- slower What kind of education does this person have? What would this person do in their free time?
Speaker 4- widened width Does this person cry? Why or why not?
What kind of television does this person watch?
Speaker 1- All more What is this person's socioeconomic background? What kind of education does this person have?
Speaker 7- Filler Where would this person hang out? Would you be friends with this person? Why? Speaker 6- lowered pitch What kind of boss would this person be? What does this person look like? Speaker 1- nonSouthern What are this person's politics? What kind of sports would this person play? Speaker 3- lowered pitch
What kind of sports would this person play? What kind of boss would this person be?
Speaker 9- Filler What kind of education does this person have? What is this person's religion?
Speaker 2- Southern What is this person's socioeconomic background? What are this person's politics?
Speaker 6- narrowed width
What kind of movies does this person watch? Does this person cry? Why or why not?
Speaker 4- slower What would this person do in their free time?
How would you describe this person's personality?
Speaker 8- Filler What is this person's religion? What kind of car would this person drive?
Speaker 1- All less What is this person's socioeconomic background? What kind of education does this person have?
Speaker 5- faster What kind of education does this person have? What would this person do in their free time?
Speaker 4- narrowed width Does this person cry? Why or why not?
What kind of television does this person watch?
Speaker 10- Filler What is this person's socioeconomic background? Would you be friends with this person? Why?

38
Participants
The participants for Experiment One were American males who spoke English as a
native language and had no hearing problems. Only American, English-speaking males were
used in order to control for extra variables, and also because I wanted to include listeners that
had exposure to U.S. Military personnel and stereotypes of the military. All participants were
between the ages of 18 and 37 with the average age of 24. Participants were recruited
through fliers and websites, and they were given either class credit through the Linguistics
Beyond the Classroom program in the Department of Linguistics at the University of Hawaiʻi
at Mānoa or food in exchange for their time.
4.4. Results
In dealing with the responses of the participants, for many of the questions, I first
categorized certain answers into groups of similar qualities. For the first of two questions that
were asked for every speaker, “Where is the person from?” all of the answers were divided
into standard regional dialect areas. Based on the participants’ answers, possible regions were
Northeast, North, South, South-Midlands, Midwest, Southwest, Northwest, West, California,
Texas, and Hawaii. For the second question that was asked about every speaker, “What is
this person’s occupation?”, jobs were categorized into one of twenty categories: office,
military, businessman, driver, academics, coach, student, manager, technical, business owner,
medical, protection, farmer, service, sales, civil, artisan, manual, unemployed, or retired.
Most categorization was relatively straightforward, but some categories included several
jobs. ‘Academics’ included professors, teachers, or writers. ‘Technical’ included engineers,
accountants, and mechanics. ‘Protection’ included firefighters, EMT’s, and police officers.
‘Service’ included hotel industry, waiters, and cooks. ‘Civil’ included politicians, lawyers,
and judges. ‘Artisan’ included all craftsmen. ‘Manual’ included construction and building.
Next, the responses to “What kind of boss would this person be?” were grouped into twelve
semantic categories: laidback, strict, weak, friendly, lazy, average, not good, careful,
productive, good, leader, and fair. Most of these categorizations were also straightforward, as
the participants often used the same adjectives. The category ‘productive’ included efficient
and hardworking. ‘strict’ included intimidating, tough, and stern. ‘Laidback’ included

39
mellow, chill, and relaxed. ‘Friendly’ encompassed all adjectives implying an upbeat and
kind relationship between the boss and the employee. For the sports question, football,
hockey, and wrestling were included in ‘contact.’ Basketball, baseball, and softball were
categorized as ‘team.’ Other questions’ responses were left as they were and analyzed
without categorization.
Southernness
For the manipulation to investigate how participants viewed Southernness, listeners
heard speakers whose /ai/ and /u/ vowels were manipulated. The listeners, after hearing a
speaker manipulated in these ways, answered questions about the speaker’s occupation,
origin, and politics, and either his socioeconomic background or his sports preferences. I
expected to find for both speakers that were manipulated in this manner that listeners would
respond that the speaker was from the South more often in one manipulation than the other. I
also expected that the answers about his politics might lean toward Republican in the
Southern guise, as many Southern states are statistically Republican. He might also be
credited with playing football more often as it is most popular in the South. Despite these
expectations, I found only one noteworthy difference in responses for the pairs manipulated
for Southernness, and I found it for Speaker 2. When Speaker 2 was manipulated to have less
Southern vowels, there was no consensus on where he was from, and the most frequent
answers were California and the North with only 10 percent of the participants identifying
him as Southern, whereas when his vowels were more Southern, a majority, 55 percent of the
respondents, wrote that he was from the South. The following table illustrates the difference
in answers for this manipulation.
Table 4.4: Responses to the Origin of Speaker 2 when manipulated for Southernness
Speaker 2 Less Southern More Southern origin answers given answers given South 2 11 Midwest 2 3 California 4 2 North 3 2 Northwest 2 0 Texas 2 0 West 1 0

40
Dominance
The manipulation of a speaker’s pitch resulted in some of the most obvious
differences in responses. The participants were asked about the speaker’s occupation, origin,
and performance as a boss, as well as either what sports he played or what he might look like.
This manipulation was expected to change how a listener viewed the way that someone
looked, performed as a boss, and his view of what sports the speaker might play, but I also
found that it affected the type of occupation that was ascribed to a speaker. For the question
about Speaker 6’s looks, the lowered pitch resulted in responses that the person was tall,
balding or graying, in his 40’s, and average to heavy. In contrast, the speaker was described
as thin, average height, in his 30’s, with dark hair and glasses when his pitch was higher. It
seems that the lowering of pitch in this case caused the speaker to sound older and larger to
the listeners. These responses are illustrated in the following tag clouds, in which responses
that were given more frequently are a larger font and nearer the center of the figure. Each
word is in a font size that is the number of times that the response was given multiplied by
10. The first figure shows the description of the speaker in the higher guise, the second, the
lower guise. Figure 4.1: Responses to the looks of Speaker 6 when manipulated with higher pitch

41
Figure 4.2: Responses to the looks of Speaker 6 when manipulated with lower pitch
Pitch also had an effect on what kind of boss the listeners thought that the speaker
would be. Participants answered this question about two different speakers, and the answers
were slightly different for each, but there were some general trends with pitch change. For
Speaker 3, the number of responses that he sounded laidback increased from 6 to 13 when his
pitch was lowered. In addition, several people responded that he sounded weak in the higher
guise, while this was never given as a response for the lower guise. It was a bit surprising to
find that some respondents mentioned that Speaker 3 sounded like a leader when he was in
the higher guise, but this was never written for the lower guise, as other studies have found
that lower pitch correlates with both physical and social dominance. The following figures
show these changes in response. Figure 4.3: Responses to what kind of boss Speaker 3 would be when manipulated with higher pitch

42
Figure 4.4: Responses to what kind of boss Speaker 3 would be when manipulated with lower pitch
The most frequent comment given for the type of boss Speaker 6 would be in the
lower guise was that he would make a good boss. He was also friendly and strict. In the
higher guise, he was seen as laidback and again, as for Speaker 3, some participants
mentioned that he sounded weak. He was also seen as careful in the higher guise, more likely
to pay attention to detail. Figures 4.5 and 4.6 illustrate these differences. It seems that overall,
though the higher pitch does not make someone seem like they would be a bad boss, they
might be perceived as slightly more uptight and more likely to pay attention to details. Figure 4.5: Responses to what kind of boss Speaker 6 would be when manipulated with higher pitch

43
Figure 4.6: Responses to what kind of boss Speaker 6 would be when manipulated with lower pitch
Pitch changed the responses to what kind of sports Speaker 3 was likely to play.
When his pitch was higher, participants thought that he was most likely to play team or
preppy sports. In the lower pitch guise, they overwhelmingly responded that he would play
either contact sports or team sports, with no other types given as answers. This shows that the
lower pitch might cause listeners to imagine a larger, more physically confrontational
speaker than the higher pitch.
Table 4.5: Responses to the sports Speaker 3 would play when manipulated for pitch
Speaker 3 Higher Pitch Lower Pitch sports answers given answers given
team 9 14 preppy 7 0 contact 5 14 none 4 0 individual 1 0 not physical 1 0
A few interesting things happened in the responses concerning the Speakers’
occupation when pitch was manipulated. For Speaker 3, when his pitch was higher, he was
placed in jobs that are either indoors or typically performed by younger people. In the lower
guise, he performed jobs that require technical skill or outdoor labor. Again, this shift in
perception may have to do with associating lower pitch with a larger, more physical speaker
while higher pitch is associated with someone physically weaker.

44
Table 4.6: Responses to the occupation Speaker 3 would have when manipulated for pitch Speaker 3 Higher Pitch Lower Pitch
occupation answers given answers given student 3 0 service 3 4 sales 2 1 business owner 2 1 office 2 0 academics 2 0 manager 1 1 military 1 0 technical 1 2 businessman 1 0 farmer 1 1 manual 1 3 driver 0 2
Responses to Speaker 6 were remarkable in that he was overwhelmingly ascribed
positions of management in the lower guise. With a question as open-ended as occupation, it
was common for most speakers to receive only a few of the same responses for each type of
occupation, but for Speaker 6 in the lower guise, eight participants wrote some type of
management for his occupation. This was the only indication in this experiment that lower
pitch is associated with social dominance, but it was a rather strong result.
Efficiency
The other manipulation that returned some interesting results was that of speech rate.
For this manipulation, participants were asked again about the speakers’ origins and
occupations, and they were asked about what the person did in their freetime. For one
speaker, they were also asked what type of education the speaker had, and for the other, they
were asked about the speaker’s personality. I expected to find the most remarkable difference
in responses for this manipulation to the question about personality, but instead, I found
interesting responses to the origin of Speaker 4 and the occupation of Speaker 5. When
Speaker 4’s speech rate was increased, participants mostly responded that he was from the
West or the Midwest, while in the slower guise, the largest number believed him to be from
the South. This result may be caused by the popular belief that Southerners speak slower than

45
people from other dialect regions. Speech rate may be a salient cue for deciding on
someone’s regional background.
Table 4.7: Responses to the origin of Speaker 4 when manipulated for speech rate
Speaker 4 Faster Speech Rate Slower Speech Rate origin answers given answers given South 1 8 Midwest 5 2 California 1 1 North 1 2 Northwest 1 1 West 8 2
When Speaker 5’s speech rate was increased, three participants believed that he could be in
the military, suggesting that speech rate is indeed one of the most salient cues for military
involvement. When Speaker 5’s speech rate was decreased, some participants wrote
unemployed, a response not found elsewhere in the experiment. Perhaps this response
indicates that those who speak slowly are perceived as incompetent or lazy.
Stoicism
It was hoped that the final manipulation, that of the speakers’ pitch width, would
result in a difference in how the participants responded to the question about whether the
speaker was likely to cry, but no noteworthy difference was found for this manipulation.
In total then, results from this experiment provide evidence that social characteristics
attributed to a speaker can be influenced by phonetic variables. Specifically, how a
participant conceives of a person’s looks, build, and leadership skills can be altered by
changing his pitch. Additionally, the results show how a speaker’s perceived region of origin
is linked to his realization of certain vowels and his speech rate. Finally, mean pitch and
speech rate appear to be linked with perceived occupation. These results will be discussed
further in Chapter Six.

46
Chapter Five: Experiment Two
5.1. Purpose
In contrast to Experiment One, Experiment Two was designed to provide quantitative
evidence that manipulations of a speaker’s speech change listeners’ perceptions of that
speaker. The same linguistic variables were investigated by both Experiment designs, but in
this experiment, participants were asked to respond with a numerical value correlating to how
much they agreed or disagreed with a statement about the speaker that they had just heard.
Then, these values were evaluated to decide on the whole whether participants might change
their minds about what character traits a speaker might have or whether that speaker was in
the military according to which manipulated variant they heard in the speaker’s voice.
Additionally, this methodology allowed examination of the correlation between linguistic
variables and specific social characteristics and categories.
5.2. Method
5.2.1. Stimuli
For Experiment Two, the full list of test stimuli was used. For a full explanation of
how the stimuli were created, see Chapter Four. There were twenty-eight critical stimuli,
with no one voice being played twice in a row, and no one manipulation being played twice
in a row. A filler was played after every three test stimuli. For this experiment, there were
two possible orders that the participants heard. For each matched pair, one half of the
participants heard a pair’s token 1 first while the second group heard that same token second.
For example, if one group of participants heard Speaker 1-nonSouthern first, the other group
would hear Speaker 1-Southern first. This change in order was to ensure that participants
were not responding in a certain way to the tokens just because they heard them first or
second.

47
5.2.2. Experiment Design
The participants were informed verbally that they would be listening to several
American men speaking, and their task would be to judge the men on several accounts. They
would see four statements on the computer screen after hearing each man speak, and they
were to agree or disagree with the statement. They were told to listen to how the men spoke
rather than what they were saying and told that the task was self-guided, so they should make
sure they were ready to listen before moving on to the next speaker. The participants sat in
front of a computer screen in a sound booth and heard the stimuli through headphones. The
experiment was created in E-Prime, and the responses were collected through the E-Prime
software.
Once the experiment began, participants read instructions that explained that they
would hear 38 men who had been asked to give directions and other similar tasks speak for
ten to twenty seconds, and after each man spoke, they would be asked to rate statements
made about that speaker. They were asked to pay attention to how the speaker spoke rather
than what they were saying. They would be asked to agree or disagree with each statement
on a scale of 1 to 6, ‘1’ being ‘strongly disagree’ and ‘6’ being ‘strongly agree.’ After
receiving these instructions, the participants experienced one practice round, in which they
heard a speaker and then rated the statements made about him. This clip was created from the
interview with one of the filler speakers. After this practice round, if they had any questions
about the task or problems with the volume, they were instructed to consult the researcher.
The primary difference between Experiments One and Two, beyond the fact that
Experiment Two had more critical pairs, is that the responses in Experiment Two were
numerical. In this experiment, after the participants heard each speaker, they were presented
with a series of four statements about the speaker. For each pair, the statements were
presented in the same order. One statement was constant for all stimuli, and that was that the
person had spent time in the military. For stimuli manipulated for Southernness, the
statements presented were that the person was intelligent and from the South, and the fourth
was either that the person was kind or that he would make a good leader. For stimuli
manipulated for efficiency, the statements presented were that the person was efficient, good
at their job, and helpful. For stimuli concerning dominance, the statements were that the

48
person was arrogant, would be a good leader, and would win a physical fight. For stimuli
manipulated for stoicism, the statements included that the person was from the North,
expressed their emotions, was a leader, and was manly. Filler statements used both the
statements used for critical stimuli and also included statements that the person was from the
West Coast, gentle, educated, uneducated, friendly, ignorant, cheerful, popular, and
ambitious.
The participants for Experiment Two were also American males who spoke English
as a native language and had no hearing problems. They were between the ages of 18 and 53
with an average age of 24. The participants came from three different backgrounds, those
who had spent time in the U.S Military, those who had immediate family who had spent time
in the military, and those who had never spent any time in the military. Participants were
again recruited through fliers and websites, and they were given either food or class credit.
The experiment was self-paced, and the participants took between 15 and 30 minutes
to complete the experiment. When they finished, they completed the same one-page survey
as in Experiment One. Twenty-eight of the 51 participants for this study were born and raised
in Hawaii, and many of these 28 participants commented that they found it somewhat
difficult to feel confident in their abilities to identify the origins of the mainland speakers.
In response to the question concerning what the purpose of the study might be, most
participants guessed that the study had to do with exploring how listeners make judgments
about people based on their voices. Because military involvement was the only constant
statement, many also wrote that the study had something to do with how perceptions of
people are related to whether listeners will think they have been in the military. One
participant also guessed that his own military background was being used as a variable of
how he perceived other people’s military involvement. One participant thought that the study
had to do with determining how the perception of a speaker’s intelligence correlated with
other judgments about him. Another thought that the study was concerned with perceptions
of voice pitch. One wrote that the study was exploring correlations of intelligence, arrogance,
and efficiency with region or military involvement. For the last question, concerning whether
any of the speakers sounded strange in any way, the participants were much more likely for
this experiment than for the first to note that some of the audio had some problems. This
probably had to do with the increase in number of the somewhat choppy stimuli that were

49
manipulated for all variables. This experiment had four of these stimuli while the first had
only two.
Thirty-four of the 51 participants did not note that there was anything strange about
the speakers. Three mentioned that the voices were quite similar. One of these guessed that
maybe some of the speakers could have been the same person. Three participants wrote that
some of the stimuli were choppy or had blips in the audio. Five participants wrote that one or
two of the men sounded like they were computer-generated voices. Six participants noted
that the speakers had been altered somehow, one as specific as guessing that the alterations
had been made around the vowels, and another guessing that the pitch had been altered. In
total, eleven participants guessed a digital alteration of some the stimuli. Perhaps this could
have been avoided if the particularly unnatural stimuli altered in all ways had been left out,
as every person who mentioned the alteration mentioned that it only happened on a couple of
speakers. Because all of the participants thought that only a few of the voices sounded
strange, many of them mentioning only thinking this of one voice, all of the participants were
kept in the group for analysis.
There were four statements per speaker for thirty-eight speakers. This resulted in 112
critical responses per listener. The data from all of the participants was collected in a single
data sheet in Excel, and every participant was categorized in one of three groups: military,
family in the military, or civilian. Numeric responses were treated as binary, with responses
of 1, 2, or 3 corresponding to disagreeing with the statement and responses of 4, 5, or 6
corresponding with agreeing with the statement. The critical comparison for this experiment
was the difference in responses across the guises matched for speaker and manipulation type.
5.3. Results
To test for the significance of any trends in the data, a logistic regression model with
mixed-effects was run in the software interface R (R Development Core Team). These
models are becoming increasingly popular in dealing with data in the social sciences.
Although many variables, such as background, sex, hometown, and occupation were
controlled for in the creation of the stimuli, the different participants may behave differently
on the task. Mixed-effects models are more reliable in dealing with data collected from

50
human responses, in which there could be missing data or mistakes made, and they also
account for the fact that individuals may have tendencies towards answering in a certain
direction. In this experiment, there may have been individuals who had a bias toward
disagreeing or agreeing, but mixed-effects models treat the participants as a random effect
and therefore alleviate the possibility of a few subjects carrying the correlations. Mixed-
effects models account for both fixed and random effects. Furthermore, Fox explains that
“so-called mixed-effect models (or just mixed models) include additional random-effect
terms, and are often appropriate for representing clustered, and therefore dependent, data –
arising, for example, when data are collected hierarchically, when observations are taken on
related individuals (such as siblings), or when data are gathered over time on the same
individuals” (Fox 2002: http://cran.r-project.org/doc/contrib/Fox-Companion/appendix-
mixed-models.pdf). Because the critical comparison dealt with pairs of stimuli from the same
speaker, observations were indeed taken on related stimuli.
Separate models were fit to each statement for each manipulation in order to have
more simple, more interpretable models. Voice and participant were included as random
effects. Whether a participant agreed with the statement was treated as the dependent
variable; a larger coefficient indicates a greater likelihood that participants will agree with
the statement. In other words, a positive coefficient represents a positive correlation between
the manipulation type and the number of agreements with the statement. To illustrate this
relationship, Table 5.1 shows the model returned when the program was run for the statement
concerning Southernness when the stimuli were manipulated for Southernness.
Table 5.1: Model of the likelihood of identifying the speaker as Southern, when the token had fronted /u/ and monophthongized /ai/ Estimate Std. Error z value Pr(>|z|)
(Intercept) -0.7058 0.2765 -2.552 <0.05
manipulation=southern 1.3238 0.2552 5.187 <0.0001
The first number is the coefficient. Since it is positive, we know that the correlation
between a manipulation to make the stimuli more Southern and the number of agreements

51
with the statement is positive. The last number, <0.0001, is the p value, and since it is much
smaller than .05, the number commonly accepted as significant in the social sciences, we
know that this positive correlation is statistically significant. Therefore, if the stimuli were
manipulated to sound more Southern, participants were more likely to agree that the speaker
sounded like he was from the South, and this tendency is highly significant.
When considering separate manipulations, there were finally 24 statements, each
spread across at least two speakers, usually three speakers, to run through the model. Some of
the statements were expected to return much greater results than others, and ultimately, 14 of
the 24 statements returned significant results in the direction expected.
Southernness
When a stimulus was manipulated for Southernness, meaning that /u/ was fronted and
/ai/ was monophthongized, it was most important to find that the manipulation was
successful, and that participants really did associate these changes to Southernness.
Therefore, the results for the statement concerning the speaker being from the South are the
foundation of this particular variable. The statistics tell us that this manipulation was in fact
successful, as seen earlier in Table 5.1. The model returned a positive coefficient on this
relationship. If the stimuli were manipulated to be more Southern, they were more likely to
be perceived as being from the South (p <0.0001). Just these two vowel changes were
enough to lead listeners to respond differently to the same speakers.
The next strongest effect found from this manipulation concerned leadership; the
model for this is shown in Table 5.2. A positive coefficient shows that if a speaker was
manipulated to sound more Southern, he was more likely to be perceived as a leader
(p<0.001). This result was not necessarily expected, and not an emphasized aspect of the
hypotheses of this study. The strength of the association is interesting and will be discussed
further in Chapter Six.

52
Table 5.2: Model of the likelihood of identifying the speaker as a leader, when the token had fronted /u/ and monophthongized /ai/ Estimate Std. Error z value Pr(>|z|)
(Intercept) -1.0001 0.4449 -2.248 <0.0001
manipulation=southern 1.5681 0.4437 3.534 <0.0001
In addition, stimuli manipulated to sound more Southern were also more likely to be
perceived as having spent time in the military (p<0.05). Though this result was not as strong
as the first two, it was still significant. This tendency is shown in Table 5.3. There were not
significant correlations between these manipulations and the listeners’ perceptions of
kindness (p=1) or intelligence (p=.25).
Table 5.3: Model of the likelihood of identifying the speaker as having been in the military, when the token had fronted /u/ and monophthongized /ai/ Estimate Std. Error z value Pr(>|z|)
(Intercept) -0.5506 0.2300 -2.393 <0.05
manipulation=southern 0.4771 0.2431 1.962 <0.05
Therefore, for this variable, the results were consistent with the hypothesis that if /u/
were fronted and /ai/ monophthongized, listeners would perceive a speaker as more Southern
and further, more likely to have spent time in the military. This shows that the ideologies that
participants in Kirtley (2010) and the qualitative survey believed to be linked with the
military were used by a different group of participants to make judgments about speakers.
There is in fact a link between our qualitative impressions of others and the judgments that
we make about them based on linguistic variation.
Dominance
The next group of critical stimuli was manipulated with a lowering or raising of pitch
in order to explore the relationship between listeners’ perceptions of overall F0 and

53
dominance. It was expected that there would be a correlation between lower pitch and the
likelihood that participants would find speakers to be arrogant, leaders, likely to win in a
physical fight, and likely to have spent time in the military. Three of these hypotheses were
also supported by the results of the experiment.
If a speaker’s pitch was lowered, he was more likely to be perceived as being able to
win a physical fight (p <0.0001). The model is shown in Table 5.4. The overwhelming
tendency for listeners to identify the voices in the lower pitch guise as someone who would
win a fight demonstrates that listeners associate lower pitch with greater physical prowess
and perhaps also with aggression.
Table 5.4: Model of the likelihood of perceiving the speaker as someone who would win a physical fight, when the token had lower pitch Estimate Std. Error z value Pr(>|z|)
(Intercept) -1.4229 0.3594 -3.960 <0.0001
manipulation=lower 1.7038 0.2731 6.239 <0.0001
When the pitch was lowered, the speakers were also more likely to be perceived as
arrogant (p<0.01). This may be associated with ideas about social dominance, but it is also
possible that people perceive physically dominant males as more likely to be arrogant
because they possess the socially valued traits of athletic ability and larger build. Table 5.5: Model of the likelihood of identifying the speaker as arrogant, when the token had lower pitch Estimate Std. Error z value Pr(>|z|)
(Intercept) -2.0380 0.3141 -6.489 <0.0001
manipulation=lower 0.8941 0.3062 2.920 <0.01
In addition, tokens in the lower pitch guise were more likely to be perceived as
having spent time in the military (p<0.05), as seen in Table 5.6. This suggests that men in the
military are not only perceived as having lower voices, but that these character traits that are
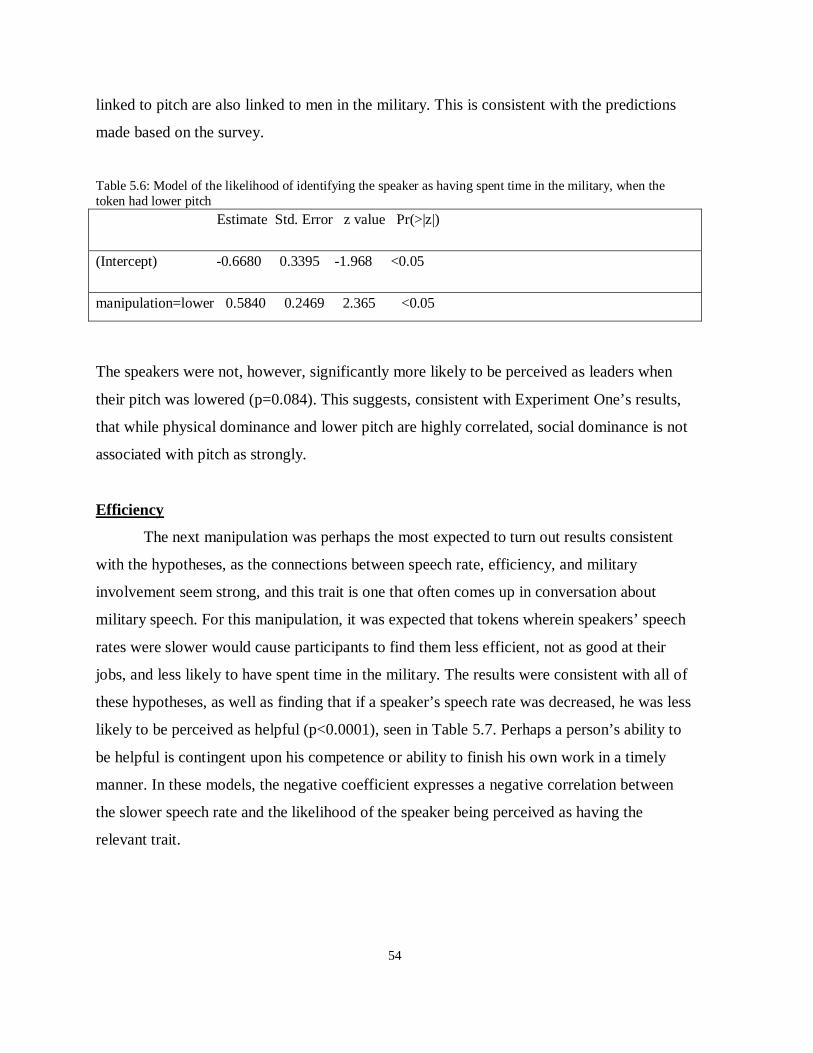
54
linked to pitch are also linked to men in the military. This is consistent with the predictions
made based on the survey.
Table 5.6: Model of the likelihood of identifying the speaker as having spent time in the military, when the token had lower pitch Estimate Std. Error z value Pr(>|z|)
(Intercept) -0.6680 0.3395 -1.968 <0.05
manipulation=lower 0.5840 0.2469 2.365 <0.05
The speakers were not, however, significantly more likely to be perceived as leaders when
their pitch was lowered (p=0.084). This suggests, consistent with Experiment One’s results,
that while physical dominance and lower pitch are highly correlated, social dominance is not
associated with pitch as strongly.
Efficiency
The next manipulation was perhaps the most expected to turn out results consistent
with the hypotheses, as the connections between speech rate, efficiency, and military
involvement seem strong, and this trait is one that often comes up in conversation about
military speech. For this manipulation, it was expected that tokens wherein speakers’ speech
rates were slower would cause participants to find them less efficient, not as good at their
jobs, and less likely to have spent time in the military. The results were consistent with all of
these hypotheses, as well as finding that if a speaker’s speech rate was decreased, he was less
likely to be perceived as helpful (p<0.0001), seen in Table 5.7. Perhaps a person’s ability to
be helpful is contingent upon his competence or ability to finish his own work in a timely
manner. In these models, the negative coefficient expresses a negative correlation between
the slower speech rate and the likelihood of the speaker being perceived as having the
relevant trait.

55
Table 5.7: Model of the likelihood of identifying the speaker as helpful, when the token had slower speech rate Estimate Std. Error z value Pr(>|z|)
(Intercept) 1.5334 0.4961 3.091 <0.01
manipulation=slower -2.1392 0.3508 -6.098 <0.0001
When the speech rate of the speaker was decreased, the speaker was less likely to be
perceived as efficient (p<0.0001). This shows that the manipulation was successful and that
speech rate and efficiency are in fact associated. Though it may seem obvious that being able
to speak more words in a certain amount of time would be perceived as more efficient, the
task in the experiment did not ask the participants to compare the guises next to one another,
but rather, make a decision about the speaker without knowing what was different about the
speaker’s voice. This suggests that there is some sort of standard threshold for speech rate
that listeners use to decide how quickly a person speaks and then associate that speaker with
other character traits. The correlation is shown in Table 5.8.
Table 5.8: Model of the likelihood of identifying the speaker as efficient, when the token had slower speech rate Estimate Std. Error z value Pr(>|z|)
(Intercept) 1.9398 0.3567 5.439 <0.0001
manipulation=slower -2.6664 0.3038 -8.777 <0.0001
In addition, the speaker was less likely to be perceived as being good at his job when
he had a slower speech rate (p<0.0001), shown in Table 5.9, which is perhaps connected to
his ability to get his work done in an efficient manner. He was also less likely to be perceived
as having spent time in the military (p<0.0001), shown in Table 5.10. Speakers were to a
great extent less likely to be perceived as having spent time in the military if they spoke more
slowly.

56
Table 5.9: Model of the likelihood of identifying the speaker as competent, when the token had slower speech rate Estimate Std. Error z value Pr(>|z|)
(Intercept) 2.1530 0.4028 5.345 <0.0001
manipulation=slower -2.5970 0.3821 -6.796 <0.0001
Table 5.10: Model of the likelihood of perceiving the speaker as having spent time in the military, when the token had slower speech rate Estimate Std. Error z value Pr(>|z|)
(Intercept) 0.8810 0.2195 4.015 <0.0001
manipulationslower -1.4932 0.2539 -5.882 <0.0001
Stoicism
The manipulation that I believed would evoke a perception of stoicism was a
manipulation of the speakers’ pitch widths. It was expected that if a speaker’s pitch width
were narrower, he would be perceived as less likely to express his emotions, less manly, and
less likely to have spent time in the military. While the manipulation did effectively lead
participants to significantly view the speakers as more or less likely to express their emotions
(p<0.05), seen in Table 5.11, the manipulation was not significantly correlated to answers
about manliness or military involvement. This will be discussed further in Chapter Six.
Table 5.11: Model of the likelihood of identifying the speaker as expressive, when the token had a wider pitch width Estimate Std. Error z value Pr(>|z|)
(Intercept) -1.3928 0.4337 -3.211 <0.01
manipulation=wider 0.6440 0.2761 2.333 <0.05

57
All Variables
The final critical pairs were manipulated for all of the acoustic variables. It was
expected that if a single speaker were manipulated for all of the variables towards the
direction expected to be perceived as more military, listeners would be likely to believe the
speaker to have spent time in the military. Only two pairs were manipulated in this manner. If
all of the variables were manipulated toward the hypothesized direction of increasing
perception of being in the military (manipulation=more), the speaker was indeed more likely
to be perceived as having spent time in the military (p<0.0001), as shown in Table 5.12.
Table 5.12: Model of the likelihood of identifying the speaker as having spent time in the military, when the token was manipulated for all variables Estimate Std. Error z value Pr(>|z|)
(Intercept) -0.7065 0.2658 -2.658 <0.01
manipulation=more 2.2205 0.3425 6.483 <0.0001
He was also more likely to be perceived as being likely to win in a physical fight (p<0.0001).
Table 5.13: Model of the likelihood of perceiving the speaker as able to win a physical fight, when the token was manipulated for all variables Estimate Std. Error z value Pr(>|z|)
(Intercept) -1.2533 0.3450 -3.633 <0.001
manipulationmore 2.7491 0.4946 5.558 <0.0001
In addition, the speaker was more likely to be perceived as helpful (p<0.01).

58
Table 5.14: Model of the likelihood of identifying the speaker as helpful when the token was manipulated for all variables Estimate Std. Error z value Pr(>|z|)
(Intercept) 0.1545 0.3420 0.452 0.65
manipulationmore 1.5295 0.4827 3.169 <0.01
It is noteworthy that unlike the other manipulations, the strongest significance for this
manipulation was found with the likelihood of the listeners perceiving these speakers as
having spent time in the military. The speakers manipulated to be more military received 41
and 38 agree responses with the military statement while they received 20 and 17 agree
responses respectively when manipulated to be less military-like. Taken together, the results
of this experiment support the hypothesis that listeners associate specific linguistic variables
to character traits and broader social categories in a complex interconnected field.
Summary
Table 5.15 shows the correlations that were returned, including the statement, the
direction of the manipulation, the coefficient returned by R, and the p value for each. They
are ordered by both type of manipulation and degree of significance. Significant results are in
bold print.

59
Table 5.15: Correlations for each statement and their p values Manipulation Statement Trend occurred in
Expected Direction P value
Southernness is from the south X <0.0001 is a leader X <0.001 spent time in the military X <0.05 is intelligent is kind Dominance would win in a physical fight X <0.0001 is arrogant X <0.01 spent time in the military X <0.05 is a leader Efficiency is efficient X <0.0001 is good at their job X <0.0001 is helpful X <0.0001 spent time in the military X <0.0001 Stoicism expresses their emotions X <0.05 is manly is from the North spent time in the military All variables spent time in the military X <0.0001 would win in a physical fight X <0.0001 is helpful X <0.01 is intelligent is from the South is kind

60
Chapter Six: Discussion
6.1. Aims
The experiments described in Chapters Four and Five were designed to: (1),
determine if particular linguistic variants lead to specific character traits being attributed to a
speaker, (2), determine if beyond just relating that speaker to a single trait, the variants might
also increase the likelihood of a listener associating the speaker with a particular community,
(3), investigate if a listener’s background could have a significant effect on the answers he
gave.
The two experiments were designed differently so that different questions could be
asked about the same speakers and so that a nuanced picture of the listeners’ perceptual
spaces could be obtained. The purpose of Experiment One was to find if listeners might
already associate the manipulations made with character traits of the speakers without those
traits being specifically mentioned. Experiment One was also meant to allow for the
provision of a clearer picture of the actual impressions of the listeners, as they were asked to
respond to broad, open-ended questions. This means that rather than just examining how, for
example, pitch affects the way a listener perceives a speaker’s leadership abilities, the results
would provide much more detail about how that perception changes.
The purpose of Experiment Two was to be able to investigate specific character traits
and their relationships to the phonetic variants, and to be able to test the robustness of the
associations made during Experiment One. While use of a forced-choice methodology leads
listeners into thinking about particular traits over others, it can be used to complement more
qualitative data and can be used to investigate the strength of particular sociophonetic
associations.
The results provide evidence that a single acoustic variable can have meaning within
a language and that variables can be used in combination to create and project a person’s
linguistic identity. Furthermore, though every dialect is made up of several acoustical

61
differences that make it unique from other dialects, these findings show that the manipulation
of just one of these acoustical measures is enough to associate the speaker with an identity.
When a listener finds several of the relevant traits in a speaker’s voice, that leads to an even
stronger judgment of that speaker’s affiliations.
6.2. Results Summary
Results from both experiments indicate that phonetic variables can change a listener’s
perception of a speaker. In Experiment One, some of the variants had notable effects on
perceived origin, occupation, looks, sports, or leadership traits. The manipulations of pitch, in
particular, resulted in various and interesting responses that might offer more insight into
exactly how F0 is related to the perception of a male speaker. Experiment One did not
specifically investigate whether variation would cause listeners to think of military
involvement, and even so, one variant, faster speech rate, did cause a notable amount of
responses that the speaker’s occupation was military. Experiment Two results indicate that
there is a correlation between the linguistic variables under investigation and various social
characteristics as well as with perceived involvement with the military.
Southernness
In Experiment One, the combination of a fronted /u/ and monophthongized /ai/
successfully led participants to respond that Speaker 2 was from the South. This shift in
perceived regional origin was expected given Clopper and Pisoni’s body of work
investigating the salience of different markers of regional dialects (2004a, 2004b, 2006).
However, many participants believed Speaker 1 to be from the South or the Midwest in either
guise, perhaps because of his particularly rural South-Midlands dialect, so the manipulation
of the vowels was not enough to cause a notable difference with the open-ended question for
both speakers.
In Experiment Two, manipulations of the vowels towards Southernness were
successful, as evidenced by the significant positive correlation found between the stimuli
manipulated in that direction and the agreement of the participants with the statements that
these speakers were from the South. A positive correlation was also found between more

62
Southern vowels and leadership and Southern vowels and time spent in the military. The
Southernness-leadership correlation was unexpected, and could have to do with the
prominence of speakers of the Southern dialect in American politics of late, including two
out of three of the most recent American presidents. The Southernness-military correlation
confirms both that, as expected, if a speaker sounds like he is Southern, he is more likely to
be perceived as someone who has spent time in the military, and that vowels that indicate
Southernness can also cause listeners to make broader social judgments of a speaker,
suggesting that social information is organized in a complex web of interactions, and pulling
on one string of the web can activate many other connected strings.
Dominance
The manipulation of F0 yielded many interesting results that might aid in
understanding how fundamental frequency and perception interact. Experiment One found
that overall, it seems that a speaker may be considered less physically dominant with a higher
F0, as found in Puts et. al (2007). The results also indicate that he is considered to play less
physical sports, he is shorter and thinner in stature, he would sometimes be seen as a weak
boss, and he performs less physical tasks in his occupation. The results of this experiment
also seem to show that lower pitch may be correlated with higher age.
In Experiment Two, lowering of fundamental frequency, or F0, correlated with
perceptions that the speaker would be more likely to win a physical fight, would be arrogant,
and would have spent time in the military. A correlation between lower F0 and leadership did
not reach significance. These findings support the idea that F0 correlates with physical
dominance, and perhaps with a speaker’s self-image, but it does not necessarily correlate
with social dominance. Further studies to parse these relationships would most likely prove
fruitful.
These results together indicate that lower pitch is indeed associated with a bigger
speaker, which makes sense, given that a longer vocal tract does actually result in a lower
pitch. More importantly, though, results show that this acoustic trait is associated with a
certain build which is then also associated with social characteristics that go along with being
bigger. If a man has a larger build, he is better able to compete in contact sports and win in a
fight. Also, he is better suited to perform physical tasks. In life, a larger build is of course not

63
always going to lead to a person’s participation in these social categories. However, in
making judgments during speech processing, an indication of a person’s build as specific as
his overall pitch heard in a short audio clip is enough to suggest to listeners the type of
person that they are listening to.
Efficiency
A decrease in speech rate led more participants to write that the speaker was from the
South. The Southern dialect is famous for its drawl, something that might be salient to the
participants. Southernness and faster speech rate seem contradictory, and while the results of
Experiment Two do indeed support the profile that the perception of military speech is that it
is both faster and more Southern, these results from Experiment One also testify that speech
rate and Southernness may be negatively correlated for some participants. These seemingly
contradictory results reveal that linguistic variables can obtain independent social meaning
and can then be used in different contexts to evoke various social categories. The speakers in
these experiments come from the South-Midlands dialect region, which shares many salient
features with the Southern dialect, so perhaps decreasing the speech rate was enough for this
pool of participants to cause listeners to believe that Speaker five was from the West rather
than from the South. As mentioned above, increased speech rate also caused three listeners
to write down military as a response to the open-ended question about the speaker’s
occupation. This is notable because ‘military’ was not a common answer overall, but
occurred three times out of twenty responses for Speaker 5 in the faster guise.
A slower speech rate correlated negatively with responses to efficiency, helpfulness,
job competence, and military involvement. In regards to speech, efficiency can be directly
construed as meaning a greater amount of speech produced in a shorter time. When a
person’s efficiency is discussed, we do not usually think of speech, but rather the amount of
work that he or she can accomplish in a certain amount of time. If this was what the
participants were responding to for this question, then speech rate successfully influenced the
listeners’ perceptions of the work efficiency of the speakers. This same correlation was
expected in regards to occupational competence, but the strong results of the question
concerning helpfulness were a bit surprising. Perhaps a person’s ability to be helpful was at
issue, or perhaps a slower speech rate makes some seem less generous. Further work is

64
required to parse the reasons behind this result. As expected, a slower speech rate
significantly decreased the number of participants who thought the speaker had spent time in
the military. Statistically, this manipulation was the strongest indicator that the speaker might
have military experience.
Stoicism
The relationship between pitch width and perceived stoicism was not as strong as the
other sociophonetic relationships tested. While a wider pitch range did positively correlate
with whether a speaker expressed his emotions, it did not correlate with statements
concerning manliness, nor did it correlate with military involvement. This contrasts with
work by Levon, who found a correlation between perceptions of masculinity and pitch width
(2007). It could be that pitch width is not the best indicator of a person’s expression of
emotion, or it could be that the participants do not link stoicism with manliness. It was
surprising that a smaller intonational range did not lead listeners to think of military
involvement, as this was a characteristic that was mentioned by several participants in Kirtley
(2010), but perhaps the manipulation itself should be performed differently. This will be
something to explore in the future.
6.3. Theoretical Contributions
6.3.1. The Third Wave
This study was designed in order to examine the perception of the social meanings of
a few select acoustic variables and determine if the manipulation of a single variable,
extracted from the conglomeration of acoustic markers that make up the speech of a certain
community, could affect perception. The findings of this study support the claims of the third
wave of variation studies, discussed in Chapter Two.
As described before, sociolinguists first considered social variation to be tied largely
to socioeconomic hierarchy and to region. Non-standard varieties were spoken by lower
socioeconomic groups, and formality in a conversation, no matter the speaker, would lead to
the use of more standard variables (Labov 1972). Later, sociolinguists began to consider
certain variables as associated with locally-defined speech communities; a speaker’s desire to

65
be affiliated with a particular group would determine what variables he or she chose to use at
the time. Finally, the third wave of variation modeled variation as acoustic variables carrying
separate locally-created meanings. These variables could then be used as a resource to create
a social personae, ever-changing as the speaker’s needs changed. Eckert (2005) stresses that
linguistic choices do not directly index the social categories or groups of speakers, but that
those choices index attitudes, character traits, and involvement in certain activities that in
turn are associated with different categories of people. These linguistic markers do not exist
only in an isolated speech community, but in the wider community of society, where they are
given broad meanings accessible to the culture. Eckert writes that stylistic practice “involves
adapting linguistic variables available out in the larger world to the construction of social
meaning on a local level. But the use of these variables requires that they have some general
conventional meaning, which can be vivified in the particular style” (2005: page 24). Local
groups fine-tune linguistic markers to have more nuanced meanings within a smaller
community, meaningful only because of their delineations into broader social categories in
society more generally. By examining whether participants who are parts of different speech
communities find different or stronger effects of meanings when listening to acoustic
variables, Experiment Two investigates whether the local meanings of acoustic variables are
different in different groups. Unfortunately, there were not enough members of the military
in this experiment to find significant differences, though this will hopefully be remedied by
adding more military participants in the near future.
It should be noted here that it is probable that speakers use particular variants
unconsciously or for a reason that is misinterpreted by the listener. Few people want to
project that they are incompetent, but many do. First, the absence of a particular linguistic
marker could cause a listener to judge the speaker as lacking in the trait or stance that is
associated with the missing marker. It is also possible that linguistic variables are adopted in
clusters as speakers move in and out of involvement with speech communities; some of those
variables may independently have negative associations for the society at large, but together,
the variables index the community in which the speaker has become involved. Additionally,
some linguistic traits, such as pitch, stutters, lisps, or speech rate may be resistant to
management by a speaker because they are products of biology or cognitive processes. Even
still, they become associated with social meaning for the society at large. Therefore, the way

66
that a person talks is not an entirely conscious projection of who that person wants to be, but
a complex combination of some linguistic markers that they unconsciously use out of habit,
some that they cannot control, some that they consciously manipulate, and some that are part
of a group of linguistic practices that index a speech community of which they have become
a part. Despite this, listeners most likely assign social meaning to most of the linguistic
practices that the speaker uses, whether they are intentional or not. This is why perception
experiments are an effective way to access the social meanings of linguistic variables. The
results of Experiments One and Two show that for this participant group (one that is quite
broad in dialect region, background, and age) isolated acoustic variables have several strong
correlations to specific character traits or social meanings, and those acoustic variables can
also be heavily associated with a particular group of speakers.
In Experiment Two, each acoustic variable was associated with one or more social
meanings for the listeners: /ai/ monophthongization and /u/ fronting with Southernness and
leadership, F0 with physical dominance and arrogance, speech rate with efficiency,
competence, and helpfulness, and pitch range with expressiveness. Furthermore, three of
those variables; Southernness, dominance, and efficiency, were then also associated with the
military community. The construction of military speech involves each of those individual
social meanings, so the association only requires one acoustic difference, but a speaker who
uses all of these acoustic variables in speech is more likely to be judged as having been in the
military. Thus, a faster speech rate, Southern vowels, and a lower F0 are phonetic variants
that an individual could use to project himself as a member of the military community. These
variables, however, are not limited to the military; they are resources available to all speakers
of American English when they would like to sound more efficient, capable of leadership, or
physically dominant. It just so happens that the amalgamation of these traits is what begins to
constitute the idea of a speaker involved in the military. This suggests that the identity of a
person belonging to a social category is made up of traits that cause that person to be
effective in that membership, and those traits are projected by the use of linguistic variables
that have obtained social meanings associated with the traits. When all of those linguistic
traits are used by a single speaker, listeners are likely to perceive that speaker as belonging to
the appropriate social category.

67
Work within the third wave of linguistic variation discusses the possibility that
linguistic variables are connected within a flexible indexical field, having multiple possible
social meanings. Which meaning is applied to a particular speaker’s use of the variable may
fittingly change meaning according to surrounding linguistic or nonlinguistic cues. The
designs of Experiments One and Two investigate the idea of each variable having multiple
meanings and associations from two different directions. Experiment One, with its open-
ended questions, allows the participants to express the complex possibilities of meaning for
each variable. Experiment Two investigates the robustness of the associations between each
acoustic variable and several specific social meanings that it might have. The idea behind
these inquiries was that a phonetic trait does not have just one meaning or belong to just one
group of speakers, but may have several purposes and may link to a web of interconnected
ideas about character traits and social identity. The experiments herein show that a single
variant may have multiple meanings which are revealed in different contexts.
The association of one meaning to a variable does not seem to exclude other
associations. Though the manipulation of F0 caused the listeners to think of the speaker as
physically dominant, it also made them think of the speaker as arrogant. Furthermore, one
acoustic change linked the speaker to a speech community that uses that trait, but several
acoustic changes create an even stronger link. Changing just the /ai/ and /u/ of a speaker
caused participants to think of him as likely to have been in the military, but changing these
vowels, his pitch, speech rate, and pitch width caused this association to be much stronger.
These results lend support to Eckert’s claim that linguistic variables are linked with multiple
meanings and that variables work together to form a speaker’s style. While a military style
was attributed to some voices some of the time when only one variable was manipulated,
when all of the variables were aligned, listeners were more likely to attribute a military
speech style to the voice.
Additionally, the results may support the claim that a variable can change meaning
depending on the other linguistic cues in the signal; participants shifted in their association of
traits with certain variables depending on the different voices. For example, Speaker 3 is
considered friendlier as a boss in the higher pitch guise, while Speaker 6 is considered
friendlier in the lower pitch guise. In addition, Speaker 3 is considerably more laidback in the
lower pitch guise, while Speaker 6 is considered more laidback in the higher pitch guise.

68
Even more interestingly, participants were likely to consider Speaker 3 a person who did
physical work in the lower pitch guise, while Speaker 6 was considered more managerial in
the lower pitch guise. These results are consistent with Campbell-Kibler (2007) who found
that a single linguistic variable had a different effect on perception according to the social
characteristics attributed to the speaker.
6.3.2. Models of Speech Processing
Compared with other models of speech perception, exemplar models would best
account for the results of these experiments because they highlight the possibility of listeners
having a great acuity for speaker variance and an ability to use this variance to gain richer
insights into the communicated message and its speaker. The present experiments do not
answer questions such as when social information is accessed or how it changes perception
of the speech stream, but they do confirm that speakers do not filter out all variance as noise,
but rather, use it to make judgments about the speaker, and possibly, to aid in more
efficiently understanding that speaker in the future.
Furthermore, most exemplar-based speech processing models deal with word
recognition, rather than the processing of suprasegmental phonetic cues at the phrasal or
sentential level. In an exemplar model where a token of a word heard by a listener is
associated with a social category based solely on its similarity to nearby memory traces,
phrasal or sentential material that could also be associated with social meaning is not
addressed. In Experiment Two, it was found that speech rate and pitch width could influence
the social perceptions of the participants. A single word in isolation cannot contain these
acoustic traits because the traits apply at the phrasal level. Future discussion of
sociophonetics in relation to speech processing models may need to take this into account.
6.4. Methodological Contributions
This thesis strove also to use a methodology that overcame some of the problematic
issues of sociolinguistic perception work. First, perception studies often used members of the
various social categories being studied without accounting for the variety within each

69
category and without fully understanding what it was about each voice that participants were
responding to. Use of the Matched-Guise Technique begins to control for this problem by
using the same person to produce stimuli that differ in accent or language. However, early
use of this technique still changed many things about the way the speaker was speaking in
each guise, so it was nearly impossible to say what exactly caused a participant’s opinion to
change. Campbell-Kibler and Levon’s work began to control for this problem by using
digital manipulation to change one isolated variable about the speech stream so that any
changes in opinion could be attributed to that change. The problem here is that the
participants were made aware in this methodology that they were listening to the same
person, in fact the same passage, and that it had been manipulated in some way. Participants
have a metaawareness in this design that is not ideal because they are aware of the particular
variable that they are to be listening to, which is not a natural listening task. The experiments
of this thesis overcame this problem by creating stimuli from the same speaker that contain a
different clip of the interview and spacing the speakers in such a way that they are not played
too near one another. The participants were then told only that they were going to hear a
bunch of American men speak. Most believed that each man was a different speaker. In this
way, every participant could hear every speaker and every manipulation, and the experiment
could maintain a within-subjects test, which is more rigorous than a between-subjects test.
Another problem with past perception studies is that it can be difficult to confidently separate
results caused by how the speaker speaks and results caused by what the speaker is saying. I
controlled for this variable by controlling the subject of the interviews, using topics that were
applicable to people anywhere in America. The speakers discuss directions and getting lost,
and only ubiquitous street names like ‘Main Street’ are used in the stimuli.

70
Chapter Seven: Conclusion
. Recent theoretical contributions in sociolinguistics have postulated that linguistic
traits are associated with specific social meanings in a field of connected meanings and social
variables. Ethnographic production studies were able to qualitatively associate certain
variables with complex social usage, and researchers have begun to use experimental
methods to examine these links in the perception of listeners. By isolating single variables
and asking the right questions, experiments can find correlations between changes in social
judgments and changes in linguistic variants. This thesis successfully used these methods to
show that four linguistic variables caused shifts in social perception when carefully
manipulated. Further, the results showed that these shifts in variants also caused participants
to judge the speakers as being more or less likely to be involved in the military. This suggests
that though each linguistic variable can have a specific social meaning, those meanings exist
in a complex indexical field in the listeners’ minds, and these associations are activated as
listeners process speech.
Specifically, these experiments found that lower pitch correlates with physical
dominance, a faster speech rate with competence, monophthongization of /ai/ and frontness
of /u/ with Southernness, and wider pitch width with expressiveness. The first three of these
variables also made a speaker seem more likely to have spent time in the military. When all
of these variables were combined, the speaker seemed extremely likely to have been in the
military, suggesting that listeners listen for individual linguistic traits to make social
judgments and also seek out combinations of variables to make connections with social
categories.
This thesis also used a methodology, building on recent successful use of the
Matched-Guise Technique, that had not been used before. Researchers have claimed that it is
not possible to both change just one linguistic variable and use the same speaker for multiple
stimuli without the participant knowing that they are listening to the same person (Levon
2007: page 542). However, these experiments were both carried out in just that manner. Only

71
ten speakers were used to create 25 and 38 stimuli for Experiments One and Two
respectively, but the participants did not know that they were listening to the same men over
and over. Instead, they made new judgments each time about speakers who they thought
were different every time. In this way, the manipulation of stimuli could be better masked
from the participants. In addition, the topic of each stimulus was controlled for in a way that
would assist the participants in making their judgments based only on the speech stream, thus
isolating any change in social judgment to a change in the manipulated variable.
Listeners in America are capable of cuing in on linguistic variables that are associated
with social characteristics attributed to members of the military in order to decide whether a
speaker is a member of the military or not. The results of this study suggest that during
speech processing, in addition to accessing lexical items and syntactic structures, listeners
process variation in order to understand more about the person speaking, and they begin to
make decisions about the person. Just as when we see a person with the high and tight haircut
or rigid stance and begin to integrate the possibility that he is in the military into our concept
of his social identity, we also listen to his speech stream and index the variance in his speech
to traits that would increase or decrease the likelihood of his involvement.

72
Appendix A- Transcripts of Stimuli
Speaker1-All variables 1 north dillons would be the closest from my house and uh oh as I pull out of my driveway I would take a right and go I guess that would be east to main street take another right on main street and go south uh to the intersection of main and twelfth Speaker1- All variables 2 um my house is on the intersection of on the corner of terrace drive and eighty-one highway so if you step off my driveway onto terrace drive um you'd be you could look ahead of you and see eighty-one highway Speaker1- Efficient 1 uh so I walked a lot um during the winter my folks would drop us off at a babysitter I guess and they would they'd be at work at seven in the morning so they'd drop us off at somebody's house and then we'd get a ride from them Speaker1- Efficient 2 nothing's really coming to mind um as really bad lost I was probably a child maybe and and uh probably just had to wander around until I found a major thouroughfare or a street or something that I recognized um Speaker1- Southern 1 and then uh walk north up old main to southwest third which is is quite a little ways so maybe three quarters of a mile I guess up old main Speaker1- Southern 2 I'll have it in mind you know I'll read the address and I'll say oh yeah that's here I'll head right there and it's a different street than what I had in my mind so I end up having to go All variables the way on the other side of town and so when I say lost I that's maybe not proper uh I get my street names mixed up Speaker2- Southern 1 I had to drop a co-worker off at their house cause their car was broke down at work so they kind of gave me directions but

73
Speaker2- Southern 2 basically I was just gonna drive until I hit cause I knew it was north of me uh you know probably ten miles or so north so I was like find a main road I know it's gonna go through I just gotta head north and I'll be there so Speaker2- Stoic 1 I got turned around I knew what direction I was headed I was headed north so I just uh basically knew that if I hit a main road take that north Speaker2- Stoic 2 so you go ahead take third over to mosley mosley south about two blocks and then there's a parking lot right there in front of first gear Speaker3- Dominance 1 depending on where you were at downtown if you were if you were right in the middle of downtown it would probably be quickest to head east on broadway to the interstate take the frontage road Speaker3- Dominance 2 so from freddy's that's on like twenty-first street uh I'd probably make it easy I'll just go twenty-first west to uh maize road to the new market square area Speaker3- Southern 1 last year we would drive the kids to school and drop my daughter off first at the elementary school and then since the middle school starts like five minutes later we would drop my son off second and then they would ride the bus home after school Speaker3- Southern 2 like kindergarten and first grade it was like maybe six blocks um and then second grade to fourth grade it was about eight blocks Speaker4- Efficient 1 to um corey to lazy creek to highway fifty left on highway fifty to anderson left on anderson to fourteenth right on fourteenth to old main old main to the nearest elementary school Speaker4- Efficient 2 take third to main main to twelfth twelfth you wanna make a left on and go All variables the way down you'll see it on your right Speaker4- Stoic 1 and then you'll see a church you're gonna wanna go circle around the church and head north towards the farm Speaker4- Stoic 2 then you're gonna go north or left around that school around behind it

74
Speaker5- Efficient 1 um I guess if was giving you formal directions I'd tell tell you as a stranger to go directly south uh to southeast fifth and then east on southeast fifth to duncan north on duncan to east first and then east on east first to the school Speaker5- Efficient 2 I would tell them to walk west on windward from medical center drive and follow that to old main and go north on old main to meadowbrook and meadowbrook you just keep walking west Speaker5- Dominance 1 um you actually gotta go south and then you gotta go east and then north and then east again you have to kind of jog around a big patch of ground that doesn't have any roads Speaker5- Dominance 2 um just follow follow washington road to main and keep keep going north it's a straight shot so Speaker6- All variables 1 from my house um I would start at uh southwest sixth street and uh I live at the at a deadend so there's only one way you can go so I would travel up southwest sixth to old main which is the first main road I'd hang a right on old main and I'd go down to southwest fourteenth Speaker6- All variables 2 I would start here I would uh start at third street go to main street hang a right on main street main street's gonna be the stop sign busy street I would go all the way through town to twelfth street hang a left on twelfth street and travel west until I got to the high school high school'l be on your right Speaker6- Dominance 1 to the house uh past the house to the church turn right again for a while turn right again Speaker6- Dominance 2 ok I would start at the train station uh and I would turn left for a short distance I would turn right uh until I could see the water tower and I would walk for a while Speaker6- Stoic 1 turn left again turn left again until I went all the way around the schoolhouse to the grocery store when I got to the grocery store I would turn right Speaker6- Stoic 2 I can see the tree I'm gonna hang a right at the tree another right and then another right for a long ways to the farm where I hang a right into the farm lane

75
Speaker7- Filler 1 give it just about two inches not even like an inch and a half but this is a straight line but it's angled down just a little bit Speaker7- Filler 2 now this object there shouldn't be an object there should only be about two inches between the object and the edge the right edge of that paper if you have it there yeah give or take Speaker8- Filler 1 at the bottom of that railroad track like in the middle of the two rails the west like you would run over this item I'm gonna tell you to put you're gonna put a star you would drive over it if you were in that train Speaker8- Filler 2 you're gonna draw a line straight to the house but leave about I don't know a little under an inch just vertical Speaker8- Filler 3 this one's kind of northeast I'd say seventy degrees it's got a slight slight rise to it Speaker9- Filler 1 the one on old main so we're gonna start at first and oak and we're gonna go to first we're gonna go west across first and then at old main we're gonna turn left south and it's gonna be a few blocks and it's gonna be right there on your left Speaker9- Filler 2 from oak and first we'll take oak to uh main and go north all the way up to family video it's gonna be on the left Speaker10- Filler 1 you would start here well I'd show you on a map you know we've got a map on the wall but um you'd go from third you'd go a block west to main street then main street you'd go north to twelfth and twelfth you'd go east no excuse me west to the high school then Speaker10- Filler 2 um hmm let me think we rode the bus um some of the time but if not then our parents would take us so Speaker10- Filler 3 I've I don't think I've real ever really really been lost you know to where I can't you know you get panicked and scared and stuff like that I don't think I've ever done that that I can remember

76
Appendix B- Information about Stimuli
Table App.1.:Explanation of the Critical Stimuli
Order Played in ‘Order 1’
Speaker Topic Manipulation Direction
2 Speaker 1 directions Southernness Southern 3 Speaker 6 map task Dominance higher pitch 4 Speaker 2 restaurant Southernness nonSouthern 6 Speaker 3 directions Dominance higher pitch 7 Speaker 4 directions Efficiency faster 8 Speaker 6 map task Stoicism widened width 10 Speaker 5 directions Efficiency slower 11 Speaker 4 map task Stoicism widened width
12 Speaker 1 directions All variables lowered pitch, narrowed width,
Southern vowels, faster 14 Speaker 6 map task Dominance lowered pitch 15 Speaker 1 directions Southernness nonSouthern 16 Speaker 3 directions Dominance lower pitch 18 Speaker 2 being lost Southernness Southern 19 Speaker 6 map task Stoicism narrowed width 20 Speaker 4 directions Efficiency slower
22 Speaker 1 directions All variables higher pitch, widened width, less
Southern vowels, slower 23 Speaker 5 directions Efficiency faster 24 Speaker 4 map task Stoicism narrowed width 26 Speaker 3 getting to school Southernness Southern 27 Speaker 1 getting to school Efficiency faster 28 Speaker 2 being lost Stoicism narrowed width 30 Speaker 5 directions Dominance lowered pitch
31 Speaker 6 directions All variables higher pitch, widened width, less
Southern vowels, slower 32 Speaker 1 being lost Efficiency slower 34 Speaker 5 directions Dominance higher pitch 35 Speaker 2 directions Stoicism widened width
36 Speaker 6 directions All variables lowered pitch, narrowed width,
Southern vowels, faster 38 Speaker 3 getting to school Southernness nonSouthern

77
Appendix C- Naturalness Rating of Stimuli Stimuli Naturalness rating
out of 5 possible 1. Practice 4.6 2. Speaker1All1 3.2 3. Speaker1All2 2 4. Speaker1Efficient1 4.4 5. Speaker1Efficient2 4.2 6. Speaker1Southern1 4 7. Speaker1Southern2 4.6 8. Speaker2Southern1 4.8 9. Speaker2Southern2 4.4 10. Speaker2Stoic1 4.8 11. Speaker2Stoic2 4.8 12. Speaker3Dominance1 4.6 13. Speaker3Dominance2 4.8 14. Speaker3Southern1 4.4 15. Speaker3Southern2 4.2 16. Speaker4Efficient1 4.2 17. Speaker4Efficient2 4.4 18. Speaker4Stoic1 4.4 19. Speaker4Stoic2 3.4 20. Speaker5Efficient1 3.4 21. Speaker5Efficient2 4.6 22. Speaker5Dominance1 5 23. Speaker5Dominance2 4.6 24. Speaker6All1 2 25. Speaker6All2 3.2 26. Speaker6Dominance1 4.6 27. Speaker6Dominance2 4.8 28. Speaker6Stoic1 4.2 29. Speaker6Stoic2 4.4 30. Speaker7Filler1 4.8 31. Speaker7Filler2 4.8 32. Speaker8Filler1 4.4 33. Speaker8Filler2 4.4 34. Speaker8Filler3 4.4 35. Speaker9Filler1 4.4 36. Speaker9Filler2 4.8 37. Speaker10Filler1 5 38. Speaker10Filler2 4.8 39. Speaker10Filler3 25

78
Appendix D- Experiment One Answer Booklet
(Begins on next page)

79
Practice Speaker-
Question 1- Where is this person from?
_____________________________________________________________________________________
_____________________________________________________________________________________
Question 2- What is this person’s occupation?
_____________________________________________________________________________________
_____________________________________________________________________________________
Question 3- What kind of friend would this person be?
_____________________________________________________________________________________
_____________________________________________________________________________________
Question 4- What sports would this person play?
_____________________________________________________________________________________
_____________________________________________________________________________________
Speaker 1-
Question 1- Where is this person from?
_____________________________________________________________________________________
_____________________________________________________________________________________
Question 2- What is this person’s occupation?
_____________________________________________________________________________________
_____________________________________________________________________________________
Question 3- What kind of education does this person have?
_____________________________________________________________________________________
_____________________________________________________________________________________
Question 4- What kind of television does this person watch?
_____________________________________________________________________________________
_____________________________________________________________________________________

80
Speaker 2-
Question 1- Where is this person from?
_____________________________________________________________________________________
_____________________________________________________________________________________
Question 2- What is this person’s occupation?
_____________________________________________________________________________________
_____________________________________________________________________________________
Question 3- What are this person’s politics?
_____________________________________________________________________________________
_____________________________________________________________________________________
Question 4- What sports would this person play?
_____________________________________________________________________________________
_____________________________________________________________________________________
Speaker 3-
Question 1- Where is this person from?
_____________________________________________________________________________________
_____________________________________________________________________________________
Question 2- What is this person’s occupation?
_____________________________________________________________________________________
_____________________________________________________________________________________
Question 3- What kind of boss would this person be?
_____________________________________________________________________________________
_____________________________________________________________________________________
Question 4- What does this person look like?
_____________________________________________________________________________________
_____________________________________________________________________________________

81
Speaker 4-
Question 1- Where is this person from?
_____________________________________________________________________________________
_____________________________________________________________________________________
Question 2- What is this person’s occupation?
_____________________________________________________________________________________
_____________________________________________________________________________________
Question 3- What is this person’s socioeconomic background?
_____________________________________________________________________________________
_____________________________________________________________________________________
Question 4- What are this person’s politics?
_____________________________________________________________________________________
_____________________________________________________________________________________
Speaker 5-
Question 1- Where is this person from?
_____________________________________________________________________________________
_____________________________________________________________________________________
Question 2- What is this person’s occupation?
_____________________________________________________________________________________
_____________________________________________________________________________________
Question 3- What kind of car would this person drive?
_____________________________________________________________________________________
_____________________________________________________________________________________
Question 4- What sports would this person play?
_____________________________________________________________________________________
_____________________________________________________________________________________

82
Speaker 6-
Question 1- Where is this person from?
_____________________________________________________________________________________
_____________________________________________________________________________________
Question 2- What is this person’s occupation?
_____________________________________________________________________________________
_____________________________________________________________________________________
Question 3- What sports would this person play?
_____________________________________________________________________________________
_____________________________________________________________________________________
Question 4- What kind of boss would this person be?
_____________________________________________________________________________________
_____________________________________________________________________________________
Speaker 7-
Question 1- Where is this person from?
_____________________________________________________________________________________
_____________________________________________________________________________________
Question 2- What is this person’s occupation?
_____________________________________________________________________________________
_____________________________________________________________________________________
Question 3- What would this person do in their freetime?
_____________________________________________________________________________________
_____________________________________________________________________________________
Question 4- How would you describe this person’s personality?
_____________________________________________________________________________________
_____________________________________________________________________________________

83
Speaker 8-
Question 1- Where is this person from?
_____________________________________________________________________________________
_____________________________________________________________________________________
Question 2- What is this person’s occupation?
_____________________________________________________________________________________
_____________________________________________________________________________________
Question 3- What kind of movies does this person watch?
_____________________________________________________________________________________
_____________________________________________________________________________________
Question 4- Does this person cry? Why or why not?
_____________________________________________________________________________________
_____________________________________________________________________________________
Speaker 9-
Question 1- Where is this person from?
_____________________________________________________________________________________
_____________________________________________________________________________________
Question 2- What is this person’s occupation?
_____________________________________________________________________________________
_____________________________________________________________________________________
Question 3- What does this person look like?
_____________________________________________________________________________________
_____________________________________________________________________________________
Question 4- What kind of car would this person drive?
_____________________________________________________________________________________
_____________________________________________________________________________________

84
Speaker 10-
Question 1- Where is this person from?
_____________________________________________________________________________________
_____________________________________________________________________________________
Question 2- What is this person’s occupation?
_____________________________________________________________________________________
_____________________________________________________________________________________
Question 3- What kind of education does this person have?
_____________________________________________________________________________________
_____________________________________________________________________________________
Question 4- What would this person do in their freetime?
_____________________________________________________________________________________
_____________________________________________________________________________________
Speaker 11-
Question 1- Where is this person from?
_____________________________________________________________________________________
_____________________________________________________________________________________
Question 2- What is this person’s occupation?
_____________________________________________________________________________________
_____________________________________________________________________________________
Question 3- Does this person cry? Why or why not?
_____________________________________________________________________________________
_____________________________________________________________________________________
Question 4- What kind of television does this person watch?
_____________________________________________________________________________________
_____________________________________________________________________________________

85
Speaker 12-
Question 1- Where is this person from?
_____________________________________________________________________________________
_____________________________________________________________________________________
Question 2- What is this person’s occupation?
_____________________________________________________________________________________
_____________________________________________________________________________________
Question 3- What is this person’s socioeconomic background?
_____________________________________________________________________________________
_____________________________________________________________________________________
Question 4- What kind of education does this person have?
_____________________________________________________________________________________
_____________________________________________________________________________________
Speaker 13-
Question 1- Where is this person from?
_____________________________________________________________________________________
_____________________________________________________________________________________
Question 2- What is this person’s occupation?
_____________________________________________________________________________________
_____________________________________________________________________________________
Question 3- Where would this person hang out?
_____________________________________________________________________________________
_____________________________________________________________________________________
Question 4- Would you be friends with this person? Why or why not?
_____________________________________________________________________________________
_____________________________________________________________________________________

86
Speaker 14-
Question 1- Where is this person from?
_____________________________________________________________________________________
_____________________________________________________________________________________
Question 2- What is this person’s occupation?
_____________________________________________________________________________________
_____________________________________________________________________________________
Question 3- What kind of boss would this person be?
_____________________________________________________________________________________
_____________________________________________________________________________________
Question 4- What does this person look like?
_____________________________________________________________________________________
_____________________________________________________________________________________
Speaker 15-
Question 1- Where is this person from?
_____________________________________________________________________________________
_____________________________________________________________________________________
Question 2- What is this person’s occupation?
_____________________________________________________________________________________
_____________________________________________________________________________________
Question 3- What are this person’s politics?
_____________________________________________________________________________________
_____________________________________________________________________________________
Question 4- What sports would this person play?
_____________________________________________________________________________________
_____________________________________________________________________________________

87
Speaker 16-
Question 1- Where is this person from?
_____________________________________________________________________________________
_____________________________________________________________________________________
Question 2- What is this person’s occupation?
_____________________________________________________________________________________
_____________________________________________________________________________________
Question 3- What sports would this person play?
_____________________________________________________________________________________
_____________________________________________________________________________________
Question 4- What kind of boss would this person be?
_____________________________________________________________________________________
_____________________________________________________________________________________
Speaker 17-
Question 1- Where is this person from?
_____________________________________________________________________________________
_____________________________________________________________________________________
Question 2- What is this person’s occupation?
_____________________________________________________________________________________
_____________________________________________________________________________________
Question 3- What kind of education does this person have?
_____________________________________________________________________________________
_____________________________________________________________________________________
Question 4- What is this person’s religion?
_____________________________________________________________________________________
_____________________________________________________________________________________

88
Speaker 18-
Question 1- Where is this person from?
_____________________________________________________________________________________
_____________________________________________________________________________________
Question 2- What is this person’s occupation?
_____________________________________________________________________________________
_____________________________________________________________________________________
Question 3- What is this person’s socioeconomic background?
_____________________________________________________________________________________
_____________________________________________________________________________________
Question 4- What are this person’s politics?
_____________________________________________________________________________________
_____________________________________________________________________________________
Speaker 19-
Question 1- Where is this person from?
_____________________________________________________________________________________
_____________________________________________________________________________________
Question 2- What is this person’s occupation?
_____________________________________________________________________________________
_____________________________________________________________________________________
Question 3- What kind of movies does this person watch?
_____________________________________________________________________________________
_____________________________________________________________________________________
Question 4- Does this person cry? Why or why not?
_____________________________________________________________________________________
_____________________________________________________________________________________

89
Speaker 20-
Question 1- Where is this person from?
_____________________________________________________________________________________
_____________________________________________________________________________________
Question 2- What is this person’s occupation?
_____________________________________________________________________________________
_____________________________________________________________________________________
Question 3- What would this person do in their freetime?
_____________________________________________________________________________________
_____________________________________________________________________________________
Question 4- How would you describe this person’s personality?
_____________________________________________________________________________________
_____________________________________________________________________________________
Speaker 21-
Question 1- Where is this person from?
_____________________________________________________________________________________
_____________________________________________________________________________________
Question 2- What is this person’s occupation?
_____________________________________________________________________________________
_____________________________________________________________________________________
Question 3- What is this person’s religion?
_____________________________________________________________________________________
_____________________________________________________________________________________
Question 4- What kind of car would this person drive?
_____________________________________________________________________________________
_____________________________________________________________________________________

90
Speaker 22-
Question 1- Where is this person from?
_____________________________________________________________________________________
_____________________________________________________________________________________
Question 2- What is this person’s occupation?
_____________________________________________________________________________________
_____________________________________________________________________________________
Question 3- What is this person’s socioeconomic background?
_____________________________________________________________________________________
_____________________________________________________________________________________
Question 4- What kind of education does this person have?
_____________________________________________________________________________________
_____________________________________________________________________________________
Speaker 23-
Question 1- Where is this person from?
_____________________________________________________________________________________
_____________________________________________________________________________________
Question 2- What is this person’s occupation?
_____________________________________________________________________________________
_____________________________________________________________________________________
Question 3- What kind of education does this person have?
_____________________________________________________________________________________
_____________________________________________________________________________________
Question 4- What would this person do in their freetime?
_____________________________________________________________________________________
_____________________________________________________________________________________
91
Speaker 24-
Question 1- Where is this person from?
_____________________________________________________________________________________
_____________________________________________________________________________________
Question 2- What is this person’s occupation?
_____________________________________________________________________________________
_____________________________________________________________________________________
Question 3- Does this person cry? Why or why not?
_____________________________________________________________________________________
_____________________________________________________________________________________
Question 4- What kind of television does this person watch?
_____________________________________________________________________________________
_____________________________________________________________________________________
Speaker 25-
Question 1- Where is this person from?
_____________________________________________________________________________________
_____________________________________________________________________________________
Question 2- What is this person’s occupation?
_____________________________________________________________________________________
_____________________________________________________________________________________
Question 3- What is this person’s socioeconomic background?
_____________________________________________________________________________________
_____________________________________________________________________________________
Question 4- Would you be friends with this person? Why or why not?
_____________________________________________________________________________________
_____________________________________________________________________________________

92
Appendix E- Qualitative Survey Instrument
Where did you grow up?
_______________________________________________________
How old are you?
_______________________________________________________
When you think of a man who is in the U.S. Military, what type of
person do you think he is?
_______________________________________________________
_______________________________________________________
How do you think that a man in the U.S. Military speaks?
_______________________________________________________
_______________________________________________________
Where do most men in the U.S. Military sound like they are originally
from?
_______________________________________________________
What type of women do you think serve in the U.S. Military?
_______________________________________________________
Have you or anyone in your immediate family spent any time in the U.S.
Military?
_______________________________________________________

93
Appendix F- Future Research
There are many avenues which further research could take. Specifically though, I
would like to perform a follow-up experiment to this study in which the same stimuli are
used, but the only question for each speaker is whether he has spent time in the military. If
the correlations are still significant, I could be more confident that the listeners were making
their decision based on the auditory data they had received without being at all influenced by
the other statements asked about that speaker or by their responses to those statements. I do
not think that the presence of certain statements for each speaker was responsible for the
results of Experiment Two, but finding the correlation without the additional statements
would strengthen my hypotheses. Additionally, I would like to continue Experiment Two as
it is presently with more participants who have been involved in the U.S. Military. With more
data from this group of participants, I believe I may be able to find significant results
concerning the differences in responses caused by listener background. With only the present
participants, trends were already becoming obvious in the differences in responses from each
group, but there were not enough listeners from the military group to reach significance.
Further experiments would help to parse the social meaning of F0. The responses of
the participants for this manipulation were strong, but nuanced, and an experiment focused
on just pitch would yield interesting data, particularly when informed by the results of
Experiments One and Two herein.

94
References
Baker, W., Eddington, D., & Nay, L. 2009. Dialect identification: The effects of region of
origin and amount of experience. American Speech 84 (1): 48-71.
Ball, P. 1983. Stereotypes of Anglo-Saxon and non Anglo-Saxon accents: Some
exploratory Australian studies with the matched guise technique. Language
Sciences 5 (2): 163-82.
Bloch, Bernard. 1948. A set of postulates for phonemic analysis. Language 24: 3-46.
Bucholtz, M. 1999. “Why be normal?”: Language and identity practices in a
community of nerd girls. Language in Society 28(2): 203–23.
Burkhardt, F. and W. Sendlmeier. 2000. Verification of acoustical correlates of emotional
speech using formant-synthesis. In: Proceedings of the ISCA Workshop on Speech
and Emotion.
Bybee, Joan L. 1985. Morphology: A study of the relation between meaning and form.
Philadelphia: Benjamins.
__________. 2001. Phonology and Language Use. Cambridge: Cambridge University
Press.
__________. 2002. Lexical diffusion in regular sound change. In David Restle &
Dietmar Zaefferer (eds.), Sounds and systems: Studies in structure and change. A
Festschrift for Theo Vennemann (Trends in Linguistics). Berlin: Mouton de Gruyter.
59–74.

95
Campbell-Kibler, Kathryn. 2007. Accent, (ING), and the social logic of listener
perceptions. American Speech 82 (1):32–64.
__________. 2009. The nature of sociolinguistic perception. Language Variation and
Change 21: 135–156.
Clopper, C. G. and D. B. Pisoni. 2004a. Effects of talker variability on perceptual
learning of dialects. Language and Speech 47: 207–239.
__________. 2004b. Homebodies and Army Brats: Some effects of early linguistic
experience and residential history on dialect categorization. Language Variation
and Change 16: 31–48.
__________. 2006. Effects of region of origin and geographic mobility on perceptual
dialect categorization. Language Variation and Change 18: 193–221.
Drager, Katie, Carly Salter and Megan Macinkowicz. 2010. Perceived style, sexuality,
and pitch: An experimental approach. Paper presented at New Ways of Analyzing
Variation (NWAV) 39. San Antonio, Texas.
Eckert, Penelope. 1989. Jocks and Burnouts: Social Categories and Identity in High
School. New York: Teachers College Press.
__________. 2003. The meaning of style. Texas Linguistic Forum 47: 41–53.
__________. 2005. Variation, convention, and social meaning. Paper presented at the
Annual Meeting of the Linguistic Society of America. Oakland, California.
Fought, Carmen. 2002. Ethnicity. In J.K. Chambers, Peter Trudgill, and Natalie
Schilling-Estes (eds.), The Handbook of Language Variation and Change. Oxford:
Blackwell. 444–472.

96
Foulkes, Paul, James M. Scobbie & Dominic J. L. Watt. 2010. Sociophonetics. To appear
in William J. Hardcastle & John Laver (eds.) Handbook of Phonetic Sciences (2nd
ed.). Oxford: Blackwell, 703–754.
Fox, John. 2002. Linear Mixed Models: Appendix to an R and S-PLUS companion to
applied regression. URL http://cran.r-project.org/doc/contrib/Fox-
Companion/appendix-mixed-models.pdf
Fridland, Valerie. 2008. Regional differences in perceiving vowel tokens on Southerness,
education and pleasantness ratings. Language Variation and Change 20: 67–83.
Fridland, Valerie, Bartlett, Kathryn, & Kreuz, Roger. 2004. Do you hear what I hear?
Experimental measurement of the perceptual salience of acoustically manipulated
vowel variants by Southern speakers in Memphis, TN. Language Variation and
Change 16: 1–16.
__________. 2005. Making sense of variation: Pleasantness and education ratings of
regional vowel variants. American Speech 80: 366–387.
Gaudio, Rudolf. 1994. Sounding gay: Pitch properties of gay and straight men. American
Speech 69: 30–57.
Goldinger, Stephen D. 1996. Words and voices: Episodic traces in spoken word
identification and recognition memory. Journal of Experimental Psychology:
Learning, Memory, and Cognition 22: 1166-1183.
__________. 1997. Words and voices: perception and production in an episodic lexicon.
In Keith Johnson & John W. Mullennix (eds.), Talker Variability in Speech
Processing. San Diego: Academic Press, 33–66.

97
Gorman, Kyle. 2010. The consequences of multicollinearity among socioeconomic
predictors of negative concord in Philadelphia. Paper presented at NWAV 38.
Philadelphia: University of Pennsylvania.
Hay, Jennifer, Paul Warren, and Katie Drager. 2006. Factors influencing speech
perception in the context of a merger-in-progress. Journal of Phonetics 34 (4):
458-484.
Hay, Jennifer, Katie Drager, and Paul Warren. 2010. Short-term exposure to one dialect
affects processing of another. Language and Speech, accessed January 28, 2011, doi:
10.1177/0023830910372489
Johnson, Keith. 1997. Speech perception without speaker normalization. in Johnson,
Keith. and Mullennix (eds.) Talker Variability in Speech Processing. San Diego:
Academic Press. 145-165.
__________. 2006. Resonance in an exemplar-based lexicon: the emergence of social
identity and phonology. Journal of Phonetics 34: 485–499.
Kirtley, Joelle. 2010. Making a soldier out of a civilian: Linguistic identity in the U.S.
Military. In: Selected Papers from the Fourteenth College-wide Conference for
Students in Languages, Linguistics, and Literature. 74-80.
Labov, William. 1963. The social motivation of a sound change. Word 19: 273–309.
__________. 1964. Phonological correlates of social stratification. American
Anthropologist 66 (2): 164-76.
__________. 1966. The Social Stratification of English in New York City. Washington,
DC: Center For Applied Linguistics.

98
__________. 1969. Contraction, deletion, and inherent variability of the English copula.
Language 45: 715-762.
__________. 1972a. Some principles of linguistic methodology. Language in Society 1:
97-120.
__________. 1972b. The social stratification of (r) in New York City department stores.
In Sociolinguistic patterns. Philadelphia: University of Pennsylvania
Press. 43-69.
__________. 2001. Principles of Linguistic Change: Social Factors. Malden, MA:
Blackwell.
Labov, William, Sharon Ash, and Charles Boberg. 2006. The Atlas of North American
English: Phonetics, Phonology and Sound Change. Berlin: De Gruyter.
Lambert, W.E., H. Frankel, & G.R.Tucker. 1966. Judging personality through speech: A
French- Canadian example. Journal of Communication 16: 305-321.
Lawson R. 2005. Sociolinguistic Constructions of Identity in a Glasgow High School.
MA thesis. University of Glasgow. 108pp.
Levon, Erez. 2006. Hearing “gay”: Prosody, interpretation and the affective judgments
of men’s speech. American Speech 81: 56-78.
__________. 2007. Sexuality in context: variation and the sociolinguistic perception of
identity. Language in Society 36: 533–54.
McQueen, J., A. Cutler, & D. Norris. 2006. Phonological abstraction in the mental
lexicon. Cognitive Science 30 (6): 1113-1126.
Milroy, L. & S. Margrain. 1980. Vernacular language loyalty and social network.
Language in Society 9: 43-70.

99
Nettle, D. 1999. Using Social Impact Theory to simulate language change. Lingua 108:
95-117.
Peng, Ying, Leslie A. Zebrowitz, and Hoon Koo Lee. The impact of cultural background
and cross-cultural experience on impressions of American and Korean male
speakers. Journal of Cross-Cultural Psychology 24 (2): 203-220.
Pierrehumbert, Janet B. 2006. The next toolkit. Journal of Phonetics 34: 516–530.
Preston, Dennis R. 1989. Perceptual dialectology: Nonlinguists’ views of areal
linguistics. Dordrecht: Foris.
Purnell, T., W. Idsardi, and J. Baugh. 1999. Perceptual and phonetic experiments on
American English dialect identification. Journal of Language and Social
Psychology 18: 10-30.
Puts, D.A., S.J.C. Gaulin, and K.Verdolini. 2006. Dominance and the evolution of sexual
dimorphism in human voice pitch. Evolution and Human Behavior 27 (4): 283-
296.
Puts, D.A., C.R. Hodges, R.A. Cárdenas, and S.J.C. Gaulin. 2007. Men's voices as
dominance signals: vocal fundamental and formant frequencies influence
dominance attributions among men. Evolution and Human Behavior 28 (5): 340-
344.
R Development Core Team. 2010. R: A Language and Environment for Statistical
Computing. Vienna: R Foundation for Statistical Computing.
Rose M. 2006. Language, place and identity in later life. PhD thesis, Stanford Univ.
150 pp.

100
Sumner, Meghan, and Arthur G. Samuel. 2009. The effect of experience on the
perception and representation of dialect variants. Journal of Memory and
Language 60: 487-501.
Wingfield, A., L. W. Poon, L. Lombardi, and D. Lowe. 1985. Speed of processing in
normal aging: Effects of speech rate, linguistic structure, and processing time.
Journal of Gerontology 40: 579-585.
Wolfram, Walter. 1969. A sociolinguistic description of Detroit Negro speech. Urban
Language Series, 5. Washington D.C.: Center for Applied Linguistics
Zhang, Qing. 2005. A Chinese yuppie in Beijing: Phonological variation and the
construction of a new professional identity. Language in Society 34: 431-466.