speeding up european electro-mobility · 1 speeding up european electro-mobility how to electrify...
TRANSCRIPT

1
Speeding up European Electro-Mobility
How to electrify half of new car sales by 2030

2
Acknowledgements
This report builds on a wide variety of sources, published reports and papers as well as expert inter-
views and comments from constructive reviewers. Preliminary versions of the report have received a
wealth of improvement suggestions from the latter. We can only regret the lack of time which has
made it difficult to take full advantage of all of these suggestions – but our work will continue in other
forms!
We are particularly grateful for the contributions of Julia Hildermeyer and her colleagues at Transport
& Environment, Marika Kolbenstvedt with assistance from some of her colleagues at the Institute of
Transport Economy, Oslo, Anders Lewald, Swedish Energy Agency, and Magnus Nilsson, Magnus Nils-
son Production, Stockholm.
We are also indebted to Peter Carlsson, NorthVolt, Kristina Edström, Uppsala University, Magnus Er-
icsson, Luleå Technical University, Christer Forsgren, Stena Metall, Börje Grandin, CEVT (China Euro
Vehicle Technology), Olle Johansson, Power Circle, Göran Lindberg, Royal Institute of Technology,
Stockholm and Björn Nykvist, Stockholm Resilience Center, for allowing us to draw on their expertice.
Finally, we sincerely want to thank Chris Bowers who did a great job in improving language, in terms
of both correctness and clarity, under intensive time pressure.
Financially, the study has been privileged by a generous grant from Jan Wallander´s, Tom Hedelius´
and Tore Browald´s research foundations at Svenska Handelsbanken, Stockholm.
About the authors
Christian Berggren, professor in Industrial Management at Linköping University, Sweden, is a long-time
student of production systems and technological competition in the automotive industry. Recent pub-
lications include analysis of improvement in internal combustion engines, in Energy Policy (2012); re-
views of policy design and innovation in the energy and automotive sectors, in Ecological Economics
(2014); and electrification of heavy vehicles, in Research Policy (2015) and Technological Forecasting
& Social Change (to be published, 2017).
Per Kågeson, professor emeritus in Environment System Analysis at the Royal Institute of Technology,
Stockholm, Sweden, is the author of around 30 books and a large number of papers and reports on
environmental issues, most of them related to the energy and transport sectors. He was president of
T&E in the early 1990s (1992-96).

3
List of abbreviations
AC/DC Alternating Current (AC) and Direct Current (DC)
BEV Battery Electric Vehicle
CCS Carbon Capture and Storage
CEVT China Euro Vehicle Technology AB
CO2 Carbon dioxide
EEA European Environment Agency
EU ETS European Emission Trading Scheme
EV Electric Vehicle
EVSE Electric Vehicle Supply Equipment
FCEV Fuel Cell Electric Vehicle
GHG Greenhouse gases
ICCT International Council on Clean Transportation
ICE Internal Combustion Engine
ICEV Internal Combustion Engine Vehicle
IEA International Energy Agency
NCA Nickel Cobalt Aluminum (Li-ion battery)
NEDC New European Driving Cycle
NMC Nickel Manganese Cobalt (Li-ion battery)
NOx Nitrogen oxides
OEM Original Equipment Manufacturer (often used to designate car manufacturers)
OPEC Organization of Petroleum Exporting Countries
PEM Proton Exchange Membrane (fuel cell)
PGM Platina Group Metals
PHEV Plug-in Hybrid Electric Vehicle
SOx Sulphur oxides
TCO Total Cost of Ownership
ULCV Ultra-Low Carbon Vehicle
UNFCCC United Nations Framework Convention on Climate Change
VAT Value-Added Tax

4
Contents
Executive Summary
1. Introduction (9)
2. Markets and product dynamics (13)
3. Battery developments and materials supply (19)
4. EV economics – total cost of ownership (31)
5. Fuel cell electric vehicles have GHG reduction potential but still face important market barriers
(37)
6. ICE – A competing or complementary technology? (41)
7. Large-scale electrification – the environmental impact (45)
8. Power supply issues (51)
9. Vehicle policy instruments and design issues (63)
10. Main conclusions (77)
References

5
Executive summary
In the wake of the “diesel-gate” scandal several cities with air pollution problems have called for an
end to the diesel car, and some countries, among them Norway, the Netherlands, Austria, France and
the United Kingdom, have made statements in favor of making new internal combustion engine vehi-
cles (ICEVs) illegal within one or two decades. A second reason for wanting to ban internal combustion
engine vehicles is to reduce emissions of carbon dioxide (CO2) from road transport. Electrification ap-
pears to be the most mature and cost-efficient solution for decarbonizing car traffic and simultane-
ously putting an end to air pollution-emissions. The European Union’s 2050 CO2 emission reduction
target will require most of the car fleet to become fossil-free. This report builds on the assumption
that at least 80 per cent of the European fleet in 2050 must be partially or fully electrified. To achieve
this, EVs would have to make up around 50 per cent of new sales in 2030.
The question is not if, but how quickly, the shift to electrification will happen. Currently, combustion
engine vehicles completely dominate car fleets and sales. In 2016, battery electric cars (BEVs) and plug-
in hybrid electric cars (PHEVs) made up only 1.3 per cent of new sales in EU28. However, the driving
range of electric cars is increasing, battery costs are rapidly declining, and sales are accelerating. Ac-
cording to several observers, total cost of ownership (TCO) parity with ICEVs can be expected by the
mid-2020s in some EU countries. However, large differences among national tax regimes will make
TCO parity come later in other member states.
Aiming at 50 per cent electrification of new cars by 2030, i.e. 13 years from today, involves multiple
challenges. In this report we investigate key aspects such as battery and vehicle production, critical
materials supply, charging infrastructure, production and distribution of electricity, and policy design.
Battery material supply and production
A range of studies show that Li-ion battery costs and performance will continue to improve rapidly. In
recent years, the industry has converged on two combinations as active cathode components: Lithium
Nickel Manganese Cobalt (NMC) and Lithium Nickel Cobalt Aluminum (NCA). Various combinations of
a graphite core mixed with silicon or lithium are used for the anodes.
Rechargeable batteries account for half of the global use of lithium and 40 per cent of the use of
cobalt; however, most is used in consumer electronics and only a small fraction in EV batteries. This
will change. If the global growth of EV sales parallels the assumed growth in Europe, there will be a 25-
fold increase in EV production volumes between now and 2030 and the EV demand for lithium and
cobalt will rise steeply, possibly increasing total cobalt demand five times in comparison to 2016.
New mining projects, increased extraction efficiency, and reduced content of critical metals per battery
will be important to secure material flows and acceptable prices when the industry enters such a
growth trajectory. For lithium there is also a vital need to industrialize recycling processes which so far
are only at lab-scale. For cobalt, the most expensive component in the NMC-cathodes, there are two
complications. First, cobalt is extracted as a by-product of the exploitation of other raw materials,
mainly copper and nickel. Thus the supply of cobalt is dictated by the demand for these primary ma-
terials. Second, around 50 per cent of known reserves are located in the Democratic Republic of Congo
which has a reputation for environmental and human rights abuses. The richness of the Congolese
mines makes them difficult to replace with other resources and the lead-time for opening new mines

6
is long, normally 6-10 years. To tackle this problem, systems for sustainable and transparent mining
need to be established. Using its strength in the refining sector, and its role as a major market, Europe
could be a leading force in such a development. There are also intensive R&D efforts to change battery
chemistries by altering the proportions of nickel, manganese and cobalt, which may reduce the cobalt
content by two thirds.
In 2015, 88 per cent of the world’s total Li-ion manufacturing capacity for all end-use applications was
located in China, Japan and Korea. These countries also produced a majority of the critical cell compo-
nents. Less than 5 per cent of global battery production is located in Europe, and the same is true for
critical components. Europe needs to ramp up battery production in the 2020s to match its assumed
share of the expanding EV market. If eight million electrified cars will be sold in the EU in 2030, half of
them BEVs with battery packs averaging 50 kWh, and half PHEVs with packs of 10 kWh, this would
require an annual battery supply of 240 GWh, roughly equal to seven Giga plants of the Tesla Arizona
scale. We estimate that the total lead-time for planning, construction and commissioning might be five
to seven years per battery plant.
Electricity demand and supply
If electric vehicles make up 20 per cent of new sales in EU28 by 2025 and 50 per cent by 2030, around
14 per cent of the car fleet will be electric (BEV or PHEV) in 2030. The demand for electricity caused by
electrification of cars would only add around 4 per cent to overall demand in 2030. This will take place
during a period when many of Europe’s nuclear reactors will be decommissioned for political reasons
or because of age. At the same time a large share of the coal-fired power plants will either have to
close or become equipped with Carbon Capture and Storage (CCS) to meet the EU`s climate change
requirements. Scarcity and higher costs associated with renewable power production and/or invest-
ment in CCS may push electricity prices upwards, although in the longer term the overall trend towards
cheaper renewables is likely to prevail.
The amount of electricity required for propelling electric cars depends on the size of the fleet, average
annual mileage, specific consumption (electricity per km), battery losses and the split between BEVs
and PHEVs. Alternative assumptions concerning mileage and specific consumption may each increase
or reduce demand for battery electricity by around 10 per cent. The growth of the fleet and how it is
divided between BEVs and PHEVs play a greater role. In our calculations we assume the split to be
50/50. If the entire new EV fleet was made up of BEVs, demand for vehicle electricity would increase
by approximately 25 per cent compared to the 50/50 case.
Fuel Cell Electric Vehicles (FCEVs) are much less energy efficient than BEVs, and in the less likely case
that they will represent a substantial proportion of the EV fleet, demand for electricity would rise con-
siderably, especially when electrolysis is used for producing the hydrogen needed. It should also be
remembered that besides passenger cars, light duty vehicles and increasing numbers of city buses and
distribution trucks will also use electricity in the coming decades.
Grids and charging infrastructure
Slow charging at home or close to home dominates battery charging. Based on Norwegian experience
fast public charging can be expected to account for only around 5 per cent of total vehicle battery
electricity demand but is crucial along core highways for longer distance e-mobility. Priority should be
given to developing the infrastructure for charging at home and at work places. Local grids will need
enforcement in countries with less developed grids.

7
The environmental impact of electric vehicles
Electrical vehicles are vastly superior to internal combustion vehicles in terms of emissions during the
operation cycle. However, the production of batteries is a highly energy-intensive process, which may
generate significant greenhouse gas emissions. To reduce these emissions, three factors are important:
(1) to operate the battery plants in their most efficient mode, which implies high capacity utilization;
(2) to locate battery plants in regions with a low fossil share in their electricity mix; and (3) to counter-
act the risk that falling battery costs are used to increasing the size of batteries, without considering
the GHG footprint. Ambitious requirements regarding recycling of battery minerals will also be needed
to keep overall emissions low and to minimize the demand for virgin materials.
Average CO2 emissions from European power production are being gradually reduced. A rapid electri-
fication of the European car fleet will substantially reduce emissions of air pollutants and carbon diox-
ide without causing carbon emissions from power production to rise. This is explained by the fact that
CO2 emissions from power plants are subject to the cap of the European Emissions Trading Scheme
(EU ETS), which is gradually lowered over the years, and by the rising share of renewable energy in
Europe’s power mix.
Achieving total cost parity with conventional cars
The purchase price of an electric vehicle is currently significantly higher than the price of an equivalent
conventional car. However, prices can be expected to fall with lower battery prices and increasing EV
production volumes. The running cost of an EV is low thanks to high energy efficiency and compara-
tively low taxes on electric power. Taking account of this and including the effect of significant in-
creases in overall production volumes, several studies predict cost parity between EVs and conven-
tional vehicles in the mid-2020s, measured as total cost of ownership over five years. However, the
differences in taxation of fuel and electricity among member states are huge. The current surplus on
running costs after four years leaves the first owner of a midsize BEV in Greece with €5,343 to balance
the capital cost, while his/her German counterpart is left with a mere €2,315. These differences may
affect the overall penetration rate of EVs within the EU.
The potential role of PHEVs
PHEVs can contribute as a transitionary solution for the shift to e-mobility if they are predominantly
driven in electric mode. A majority of all trips by car are short and the average daily mileage of motor-
ists is low. In sparsely populated Norway only 3 per cent of single car trips are longer than 80 km, and
85 per cent of all trip chains (home to home) are shorter than 50 km. We therefore assume that a PHEV
with a battery capacity of 10 kWh would allow most motorists to cover at least 70 per cent of the
annual mileage in e-mode. With a minimum range of 50 km, most urban driving can take place entirely
in e-mode.
In the event that the lead-time for producing enough battery materials, in particular cobalt, for a gen-
eral shift to BEVs turns out to be long, PHEVs driven in electric mode should temporarily play a role in
the market transition. If, for example, half of all new EVs were to be PHEVs, this would reduce battery
demand by around 44 per cent compared to a situation when all new EVs are BEVs. When comparing
a PHEV with a 10 kWh battery with a long-range BEV (80 kWh battery), each kWh of battery capacity
is used 5.6 times more effectively in the PHEV when the vehicle’s annual share in e-mode is 70 per
cent.

8
Choice of policy instruments
Current EU regulation requires average new car CO2 emissions not to exceed 95 g/km in 2021. This
regulation, however, is eroded by the provision of so-called super credits – a multiplier for each EV
sold that OEMs benefit from when their corporate CO2 average is calculated. The overall CO2 standard
has been supplemented by various incentives for low and zero emission vehicles financed by individual
member states causing potential market distortions. Other member states have done little to promote
EVs, in some cases due to severe budget restrictions.
To speed up the required market penetration of EVs across Europe, we suggest that the EU should
adopt regulation as a faster and more certain way of increasing the fleet. A regulation is less vulnerable
to budget restraints, miscalculations and changing relative prices than financial incentives.
A Zero Emission Vehicle (ZEV) target in 2025 would be the best way of sending a clear signal to the
automotive industry and investors in battery development and manufacturing that the EU is serious
about a rapid shift to electric vehicles. Providing planning security, the target would require automak-
ers to gradually increase the share of EVs among new sales. Building on the existing Californian scheme
and announced ZEV quota in China, a European ZEV target scheme would reward zero emission vehi-
cles with full credits, and half a credit for PHEVs with an e-mode range of at least 50 km under real
driving conditions. Flexibility for car makers would be given by the possibility to bank and trade credits.
An alternative could be to put a cap on ICEV sales that is gradually lowered over the years. A cap on
ICEV permits should probably allow banking of permits and trade with permits in order to provide
flexibility. As a last resort, non-complying automakers should have to pay a penalty, which should be
set above the average permit price in the previous year.
To prevent the marketing of gas-guzzling PHEVs, the super-credits system should be scrapped, and all
cars with an ICE be equally treated in the EU´s cars and CO2 regime. This would promote the develop-
ment of dedicated PHEV platforms and engines optimized for fuel and electricity efficiency.
How 50 per cent of all new cars in the EU can be electrified by 2030
This report shows that electrifying 50 per cent of all new cars by 2030 is possible, but requires consid-
erable efforts and investments in several areas. The EU will need massive investments in battery pro-
duction capacity and a long-term commitment to sustainable supply of critical materials. Electricity
demand needs to be satisfied at a time when coal-fired and nuclear-based power plants are decom-
missioned. Local grids and charging infrastructure have to be upgraded in many member states. A
credible, union-wide regulatory framework based on an increasingly stringent Zero Emission Vehicle
(ZEV) target needs to be established from 2025 onwards.

9
1. Introduction
Exhaust emissions from petrol and diesel engines have been a major issue for decades, but repeatedly
manufacturers have deflected the criticism by adding new treatment devices and control systems and
thus managed to preserve the dominance of the internal combustion engine (ICE). However, following
Volkswagen´s 2015 “Dieselgate” scandal1 several large cities with air pollution problems have called
for an end to the diesel car. Paris, Athens, Madrid and Mexico City have stated intentions to prohibit
such cars from 2025. Norway, France, Austria, the Netherlands and the United Kingdom all aim to
phase out internal combustion engine vehicles (ICEVs) completely, since a shift from diesel to petrol
would still leave them with considerable air quality problems and does not fit with their ambitious
plans to reduce greenhouse gas emissions. The German Bundesrat has set a target to make the ICE
illegal in new cars by 20302 while the intention in France and the UK is to ban new sales of such cars
by 2040.3
How this rapid shift is going to happen is less clear. In 2016, battery electric cars (BEVs) and plug-in
hybrid electric cars (PHEVs) made up only 1.3 per cent of new sales in EU28, and 2030 is not far away.
However, improvements in battery chemistry, package design and manufacturing efficiency mean that
the driving range in electric mode is increasing and that costs are rapidly declining. Some analysts
expect cost parity with ICE cars in the mid-2020s (measured as total cost of ownership), so there seem
to be real possibilities to replace the combustion engine within the foreseeable future.
Enforcing a ban on new ICEVs in some major cities or even in a few countries by 2030 may not be
impossible. However, making such a rapid shift take place in all of Europe would require much larger
production volumes and access to sufficiently strong and flexible local electricity grids and an ade-
quately dense charging infrastructure all over the continent. To reach the European transport sector's
climate goal in 2030, i.e. a GHG reduction of minus 30 per cent, Element Energy (2016) suggests the
introduction of a European zero-emission vehicle mandate growing linearly in the 2020s to 45 per cent
in 2030, and ICCT (2016b) assumes e-drive vehicles will account for 23 per cent of new light duty vehicle
sales in the EU by 2030. An expert group reporting to the European Commission suggests that the 2030
target for electrification of European road transport should be 60 per cent of new sales, equally split
between BEVs and PHEVs. The report, however, does not provide a plan for how this should be
achieved (EU Commission, 2017).
However, for the European Union to be able to reach its CO2 emission reduction target of minus 80-95
per cent by 2050, at least 80 per cent of the car fleet would probably have to be fossil-free by that
time. Protection of habitats and ecosystems, restrictions on the use of water and the necessity of guar-
anteeing sustainable global food production will limit the potential for biofuels. Bioenergy may also be
needed as fuels in other segments of the transport sector, in power production and for substituting
petroleum in the production of chemical products. Therefore this report builds on the assumption that
at least 80 per cent of the European car fleet in 2050 should be partially (PHEV) or fully electrified.
Assuming an average operation life of 17-18 years for new cars, this target requires a fast up-take of
1 It was later revealed that several other automakers had also been cheating. 2 Der Spiegel, 10 October 2016 http://www.spiegel.de/auto/aktuell/bundeslaender-wollen-benzin-und-
dieselautos-ab-2030-verbieten-a-1115671.html 3 The Guardian 6 July and 25 July 2017.

10
BEVs and PHEVs as early as the 2020s. We assume that by 2030, EVs need to make up around 50 per
cent of new sales, and ten years later sales of conventional cars would have to disappear almost com-
pletely.
The scope of the report
We focus on current trends in costs and technologies, and what can be done to promote a fast market
penetration in the years up to 2030, limiting our scope to BEVs and PHEVs. In a longer perspective,
Fuel-Cell Electric Vehicles (FCEVs) may also play a role. However, as explained in chapter 5, high incre-
mental cost, lack of fuel infrastructure and, above all, very low energy efficiency compared to BEVs are
major challenges to be overcome before FCEVs can become a viable option. As we do not expect these
problems to be solved before 2030, we have not included them in our calculations.
We do recognize that EVs help reduce local and regional air pollution and urban noise but make no
attempt in this report to calculate the socio-economic importance of these benefits. Nor do we reflect
on the prospects of more efficient transport through autonomous and shared driving that would be
facilitated by EV technology.
The scope of our report is limited to the electrification of light vehicles and does not discuss electrifi-
cation of city buses and distribution trucks, nor the potential future electrification of major highways.
This report does not cover other ways of reducing the climate and environmental impact of road
transport such as public transport or cycling.
The task of this report
Achieving a level of 50 per cent of car sales 13 years from today involves multiple challenges. There-
fore, this report investigates the implications of such a large-scale transition to electric cars for key
aspects such as battery and vehicle production, critical materials supply, charging infrastructure, elec-
tricity production and distribution, and policy design. Shortening the lead times for ramping up battery
production and reinforcing local grids may be of particular importance here.
To achieve cost parity with ICE-cars, battery prices must fall to a level where the remaining difference
in capital cost is balanced by the EV´s lower running cost. The relative retail prices of electricity and
traditional road fuels are of key importance in this context. We assess how an increasing use of elec-
tricity in the transport sector may affect overall demand in a decade when carbon emissions from
power production must be radically reduced and the role of nuclear power will diminish as many old
reactors are decommissioned without being replaced.
A rapid shift to electric propulsion will require the introduction of new policy instruments and incen-
tives. The current EU strategy, which is based on common rules for average CO2 emissions per kilome-
ter from new cars with a rebate (“super-credits”) for low emission vehicles, and a variety of national
and local incentives, may have to be supplemented or replaced by more powerful incentives. We will
evaluate different strategies with regard to the choice of such policy instruments.
The purpose of the report, therefore, is to analyze the preconditions for a rapid transition from cars
propelled by internal combustion engines to a fleet of electric vehicles, and in particular to study the
pros and cons of different strategies and policy measures. The main issues addressed in the report
include:

11
- Current strategies among vehicle manufacturers and their suppliers
- Technology trends, particularly with regard to batteries
- Strategic choices in the production of batteries, long-term material supply and recycling
- The need for investment in additional charging infrastructure
- The effects on power production and grids from a fast introduction of electric vehicles
- The role of competing technologies – evolving combustion engines and fuel cell vehicles
- Choice of EU and national policy instruments and the potential role of local incentives
Need for a new European industry strategy
To achieve an EU-wide target of 50 per cent electrification of all new cars sold in 2030 will require huge
efforts, but one positive potential side-effect would be to help improve Europe´s position in the global
“EV race”. European automakers have historically been successful internationally, but in a situation
when conventional diesel and petrol cars no longer represent the future, the industry needs to retool.
If European automakers fall behind in the electrification race and key components are researched,
developed and produced elsewhere, there is a serious risk of job losses in both R&D and production.
A lot is at stake for Europe. The huge efforts needed for a fast shift to electrification may provide
exports and employment opportunities in addition to social and environmental benefits.
A note on sources
The report has a dual reference system. Scientific papers and reports from research institutes are re-
ferred to in the standard academic way: name of author and year of publication (plus page number for
direct quotes) in parentheses in the text and a separate reference list at the end of the report. Other
sources, such as interviews, articles in magazines and trade journals, are referred to in footnotes on
the relevant page.

12

13
2. Markets and product dynamics
After many previous disappointments, electric vehicles have finally entered the stage of broad com-
mercialization and the potential for mass production. Ten years ago, the global number of EVs on the
roads was still in the hundreds. In 2015, the number of electric vehicles (pure electrics and plug-in
hybrids) in the global vehicle fleet exceeded 1 million, and in December 2016, the number surpassed
2 million4. More than half a million of these vehicles were used in Europe. Of the total global stock of
light vehicles, EVs still account for only 0.2 per cent, but viewed from a longer perspective, the dynam-
ics are striking.
The take-off started 2010-12 when manufacturers for the first time launched new cars based on mod-
ern lithium-ion batteries (Li-ion). Strong growth in several regions, in China in particular, resulted in a
six-fold increase in global sales: from 134,000 in 2012 to 774,000 in 2016, of which 61 per cent were
pure electrics. Together China, Europe and the US account for 95 per cent of these sales. In 2014, the
United States was the leading market with 119,000 electrified cars sold. In 2015 Europe took over this
position with sales of 190,000 EVs. In 2016 China became the undisputed leader with sales of 351,000
units, a remarkable change from the 10,000 sold in 2013.
This growth notwithstanding, EVs made up less than one per cent of the 90 million light vehicles sold
globally in 2016. Industry and energy analysts agree that both the numbers and the share will increase,
but disagree regarding the rate. The more conservative OPEC reports predict that EVs will account for
141 million of the 2 billion car fleet expected in 2040, a significant number but still only 7 per cent of
the total stock. Other analysts emphasize the radical transformation ahead, seeing the latest develop-
ments as signs of an inflection point: “EVs are crossing the Rubicon: 2016 could signal the break-
through” (Goldman Sachs, 2016, p23); "We are now within sight of levels that will act as a tipping point
for mass adoption of EVs" (Exane BNP Paribas5). This notion of a tipping point is supported by a closer
analysis of the performance improvements of electric vehicles on the market, as indicated by battery
capacity and realistic driving ranges.
A stream of bold automaker announcements
The first modern EVs were introduced in Europe in the 2010-13 period and included the Mitsubishi
iMIEV, Nissan Leaf, Renault Zoe and BMW i3, and somewhat later the VW e-Golf. The battery capacity
was highly limited, between 16 kWh and 24 kWh. Realistic driving ranges, measured according to the
US EPA cycle, were all in the 100-145 km bracket with the exception of the expensive Tesla Models.
Recommended prices approximated €36,000 to €39,000€.6 In short, these early Li-ion EVs commanded
high prices, but offered poor driving range, and in addition there were very few charging facilities in
most countries. From 2010 to 2015, the charging infrastructure was expanded and the number of mod-
els on the market increased, but there was little visible technological progress at the core, i.e. in the
electrical powertrains.
4 EV Volumes, download April 5, 2017. 5 Quoted in Automotive News Europe, Jan 5, 2017. 6 ”Mitsubishi´s EV goal: 2,000 N.A. sales by April”, Automotive News, July 11, 2011; ”Nissan Leaf ett bra val – även sett till priset”, Teknikens Värld, Sept. 9, 2011.

14
In 2016, the rate of visible progress in marketed models accelerated. In this year, Nissan, BMW and
VW all launched new versions of their main EVs – the Leaf, the i3 and the e-Golf. The updated models
offered 50 per cent increases in battery capacity, from 16-24 kWh to 30-36 kWh. This supported in-
creases in real driving range from 100-145 km to 180-200 km. Importantly, the companies offered this
without any significant change in the base price.7
The process of accelerated progress continued in 2017. Renault introduced a new version of its Zoe,
GM started to sell its new Chevrolet Bolt and Tesla prepared for the launch of its long awaited and less
expensive mass market Model 3. This new generation of EVs increased battery capacity to 40-60 kWh
and real driving range to 250-380 km. Compared to the models introduced in 2010-13, battery capacity
had grown by 150 per cent, and so had driving ranges. This occurred without any significant markups
in prices. The cheapest EV in 2010, Mitsubishi’s iMIEV with a 16 kWh battery, commanded a sticker
price of €36,000 on the Swedish market, whereas the powerful GM Bolt with a 60 kWh battery is esti-
mated to start at around €40,000 when it is launched on the same market in 2017-18.8
Thus the progress in battery technologies during this period has been used to keep EV prices flat while
extending their driving range, which auto executives – for example Lex Kerssemakers, CEO of Volvo
Cars USA – perceive as a crucial factor for broader market appeal: “Regardless of the vehicle’s size, US
consumers won’t be persuaded to go electric unless EVs have far more electric range than they actually
need … Why are people reluctant to buy a full electric car? It’s between the ears. It’s that they believe
there’s not sufficient range”.9
Significant growth in EV sales during the 2020s
This report builds on the assumption that electrified vehicles need to make up around 50 per cent of
new car sales by 2030 if Europe is serious about her long-term goals regarding reduction of greenhouse
gas emissions. Such a demanding target will require a sustained growth of EV sales over the entire
period 2017–30. On the back of the improved models now available it seems reasonable to assume
that EV sales in Europe could increase at an annual rate of 25 per cent in the next few years (the aver-
age for 2015-16 was higher, but volatility was also high).
The announced introduction of a stream of brand new EV models in 2019 and 2020 will probably con-
tribute to a higher rate of growth in the first half of the 2020s, but the outcome is also dependent on
the regulation regime. In this report we will assume ambitious policy approaches within the EU and
most member states. On the basis of those assumptions we suggest that an average growth rate of at
least 40 per cent per annum could be possible in the 2020-25 period. This would result in about three
million EVs (BEVs and PHEVs) being sold in 2025. For the next period (2026–30), however, several
factors suggest a slower pace of growth of around 20 per cent per annum. Cumulatively, this will lead
to 7.5 million new EVs being sold in 2030. The reasons for the slow-down are that high growth rates
are easier to achieve when the starting point is low. When volumes increase it becomes progressively
more difficult to maintain such rates. Further, the car market consists of many different segments and
7”BMW uppdaterar i3 - får längre räckvidd”, Teknikens Värld, May 2, 2016; ”Nissan Leaf 2016 – nu med 25 mils
räckvidd”, Teknikens Värld, Sept. 10, 2015; ”Nya VW e-Golf officiell ”, Teknikens Värld, Nov. 17, 2016; ”Nu
börjar VW e-Golf med lång räckvidd säljas ”, Teknikens Värld, March 10, 2017. 8 “Provkörning av Renault Zoe 40 Life”, Teknikens Värld, Feb. 5, 2017;
”Provkörd: elbilen alla pratar om – men Sverige får vänta på Opel Ampera-e”, Dagens Industri, April 27, 2017. 9”CEO: First Volvo EV´s range to be 250 miles”. Automotive News, March 16, 2017.

15
driver categories. The relatively high purchasing cost of electric vehicles makes them economically
most beneficial for owners who drive long annual distances. It will be more difficult to penetrate seg-
ments with short annual driving distances, and this will slow down further sales expansion. Moreover,
there is a considerable variety across the EU regarding the retail price of fuel and electricity. In coun-
tries with high fuel taxes and relatively cheap electricity, the total cost of ownership (TCO) for an EV
compared to a conventional vehicle will be favorable relatively soon. In other parts of the EU, the
comparison is distinctively less favorable, and this will slow down further penetration substantially.
The assumed sales curve 2017 to 2030 is presented in Figure 1.
The curve in Figure 1 builds on the following assumptions regarding annual sales growth: 25% in 2017-
20; 42 % in 2021-25 and slightly below 20% in the 2026-30 period.
The annual sales displayed in Figure 1 will cumulatively result in a European electrified car fleet in 2030
of around 40 million vehicles (see Chapter 8), which is approximately 60 times the stock of 640 000
EVs in 2016. Chapter 9 discusses the main policy instrument, a gradually tightened Zero-emissions ve-
hicle mandate, needed to realize the suggested growth and to achieve the target of 50 per cent elec-
trification of all cars sold in 2030. The growth assumed here is somewhere in the mid-terrain of the
projections discussed in the IEA-report “Global EV outlook 2017”. According to the Reference Technol-
ogy Scenario in that report the global EV stock in 2030 will be 28 times the 2016 stock, whereas the
2DS (two-degree) scenario suggests a global stock of 160 million EVs by 2030, i.e. 80 times more than
the stock in 2016 (IEA 2017, p22-23).
Bold forecasts have been made before. When Nissan introduced its Leaf and GM its Chevrolet Volt six
years ago, Carlos Ghosn forecast that Nissan and Renault together would have sold 1.5 million EVs by
2016 (the real figure was a third of that). At GM, Dan Akerson predicted sales of 60,000 Volt cars per
annum, a number the company did not reach in the first three years combined, despite prices that
resulted in losses on every car.10 These predictions, however, were based on the first generation of Li-
10 For these predictions, see: “Despite slow sales, Ghosn stick with EVs”, Automotive News, April 9, 2012;
“From Volt to Bolt: GM´s bumpy road to the future”, Automotive News, Jan. 2, 2017.
347,500542,969
1,094,8…
2,207,640
3,730,470
5,282,718
7,480,857
0
1,000,000
2,000,000
3,000,000
4,000,000
5,000,000
6,000,000
7,000,000
8,000,000
2017 2018 2019 2020 2021 2022 2023 2024 2025 2026 2027 2028 2029 2030
Figure 1. Assumed number of annual EV sales 2017-2030 (in thousands)
16
ion EVs with all their constraints. Nevertheless, despite their limited range and high prices, EV sales did
expand at a robust rate. Looking back, GM emphasizes the invaluable learning process: “With the Gen
1 Volt, we had to literally invent the process from nothing. We had to invent the lab, we had to invent
the test …Without the Volt we would not be able to do the Bolt with confidence.”11 The launch of the
new Bolt with a driving range of 238 miles (380 km) according to the strict EPA test and a base price of
$30,000 after subtracting the federal tax subsidy is evidence of the company´s new EV commitment,
and GM is not alone. In early 2017, for example, Tesla had collected more than 350,000 deposits for
its mass market Model 3, to be launched on the US market late in 2017. Since late 2016, the market
has offered several EV models with battery capacity sufficient for a majority of driving needs, except
extended holiday and business trips.
Product announcements for 2018-20 suggest that manufacturers are going in two directions, some-
times at the same time. The first direction is strongly affected by the emergence of a mass EV market
in China with a crowd of rapidly developing local rivals and is represented by firms who indicate that
they will use the coming years´ technological progress to reduce the cost of their models in the now
established 300-380 km driving range. . Nissan, for example, is expected to launch a next-generation
Leaf with a 50-60 kWh battery and range of at least 350 km in 2018. Hyundai will introduce a new EV
in the 320 km range in 2018, and another approaching 400 km in 2020. Volvo will use its small-car
compact modular architecture as the basis for several hybrids followed by a fully electric model in
2019. This EV will offer a driving range of approximately 350 km and be built in China, and according
to the company be offered at a very competitive price when it is launched.12
The second direction is represented by the European premium makers who have announced a stream
of products with extended driving range, huge batteries, powerful engines and premium prices. Jaguar
will launch its I-pace model in 2018, equipped with a 90 kWh battery pack, offering a driving range of
around 500 km and a price starting at €75,000. In the same year, Audi will launch its e-tron Quattro
with a 95 kWh battery pack and a similar driving range. In 2019, Volvo Cars will introduce a fully electric
vehicle based on its large car platform, probably with a 100 kWh battery and an equivalent driving
range. In 2020, Mercedes will join this luxury competition with its newly designed EQ-SUV built on a
dedicated EV platform.13 From a life-cycle perspective, however, huge batteries in the 80-100 kWh
range erode the environmental credentials of EVs, since Li-ion batteries require a highly energy-inten-
sive production process, and consume several critical materials. This problem is further discussed in
chapter 3.
Other mainstream automakers´ plans for sales, new models and dedicated EV architectures support
the impression that this time they perceive EVs as part of their future core business.14
11 “From Volt to Bolt: GM´s bumpy road to the future”, Automotive News, Jan. 2, 2017. 12”Hyundai steps up EV cadence”, Automotive News, July 11, 2016;
“Next-gen Leaf: More tech despite low sales”, Automotive News, Nov. 16, 2015; ”EVs top priority of new Nissan boss”, Automotive News, April 10, 2017;
Interview CEVT director of electrification May 9, 2017; “Volvo’s first all-electric car will be made in China”, www.media.volvocars.com, April 19, 2019, "Volvo Electric Car to Be Priced against Tesla Model 3 and Chevrolet Bolt EV", Car and Driver, March 20, 2017. 13”Det laddas för elbilar”, Auto motor & sport, no. 10, 2017; “Audi gives details of 3 EVs to debut in next 3 years”, Automotive News, March 20, 2017. 14 The plans discussed here are presented in:

17
Ford was late to invest seriously in EVs but has stated that it will offer 40 per cent of its global
lineup in hybrid or plug-in versions by 2020 and invest $4.5 billion in order to do so. In 2016
and 2017, the company presented details of seven of the 13 new electrified vehicles it plans
to introduce in the next years, including an electric SUV with a driving range of 400+ km.
VW says it aims to sell about 1 million battery electric and plug-in hybrid vehicles worldwide
by 2025 and has announced plans to launch 20 new electric and plug-in hybrid models in the
next few years. In contrast to its current offerings, the new models will not be adapted versions
of existing ICE-cars, but build on an entirely new and modular EV architecture, to be finished
in 2019. Audi e-tron and Porsche Mission E, however, which started their development before
the new architecture was decided, will build on model-specific EV architecture.
BMW expects to sell 100,000 plug-in hybrids and battery electric vehicles in 2018, according
to CEO Harald Krüger, tripling the annual EV volume BMW has sold in the past three years. An
all-electric Mini will be launched in 2019 and an all-electric BMW X3 in 2020. Several architec-
tures will be developed in parallel – all-electric, hybrid-electric, and conventional petrol and
diesel – to provide the company flexibility to respond to uncertainties in future demand. The
goal is to increase electrified vehicle sales to between 15 and 25 per cent of the company´s
worldwide volume by 2025.
Daimler is planning to develop 10 electric cars based on the same architecture by 2025, and
invest up to €10 billion in electric vehicle research and development, according to Thomas
Weber, the group´s head of R&D.
In addition, the markets for electrified two-wheelers and heavy vehicles are also growing, but predom-
inantly in China. A recent IEA report estimates the Chinese stock of electrified two-wheelers to be
around 200 million units, far above the European fleet of 5-8 million e-bikes and electrified scooters
(IEA, 2016, p5; T&E, 2016, p8). Moreover, China virtually owns the market for electrified heavy vehi-
cles, in particular buses. Currently Chinese cities are served by 170,000 electrified buses (IEA 2016);
the European total, including a few fuel cell buses, stands at 556 vehicles, or 0.3 per cent of the Chinese
stock (T&E, 2016, p9)! Europe is the home of a vibrant heavy truck and bus industry with a mix of large,
integrated manufacturers as well as small-scale, specialized bus builders, which together offer a range
of electrified models, plug-ins and fully electric buses (Berggren & Magnusson, 2015). However,
transport authorities and regulatory bodies within the EU have failed to design the combinations of
environmental rules and early market subsidies which are needed to electrify this important urban
transport market. Instead of a European industrial expansion, Chinese electric bus builders such as BYD
are now growing internationally on the basis of their strong domestic market.
More differentiated markets and more sophisticated buyers
Model variety and consumer education are crucial for sustained growth in EV sales. The importance
of the first factor, model variety, is negatively illustrated by the experience of Japan. In contrast to the
three major regions discussed above, the Japanese market for electric vehicles has remained stagnant
“Fields: Ford EV will have a range of near 200 miles”, Automotive News, May 2, 2017; “Ford´s electrified future: How it could be done”, Automotive News, Jan. 9, 2017; ”VW aims to sell 1 million battery EVs, plug-in hybrids by 2025”, Automotive News, May 30, 2016. “BMW Set to Roll Out Electric Mini, X3 to Counter Mercedes Push”, Bloomberg Technology, Sept. 30, 2016. “Daimler to invest 10 billion euros in electric vehicles”, Reuters Business News, Nov. 25, 2016.
18
with a recent decline in sales to 22,000 EVs in 2016 (EV Volumes 2017). This is related to the presence
of only two models on the market, and the strategy of the market leader Toyota to focus on stand-
alone hybrids as its major alternative to ICE-cars15.
By contrast, the number of electrified models on the European market increased from two in 2010 to
34 in 2016. This is a small fraction of the 417 models powered by conventional powertrains (T&E,
2016). However, as noted above, the number of electrified models will increase substantially in the
next few years, when automakers launch their EVs under development. Moreover, consumer attitudes
are rapidly becoming more appreciative of the benefits of EVs. A report that summarizes the results of
an international web-survey of car buyers in Europe, US and China highlights a “substantial latent de-
mand for EVs” (McKinsey, 2017, p16) based on the education of customers, who now perceive EVs “to
offer a wider range of additional benefits – Performance and acceleration; Lower maintenance costs;
Fun to drive; Avoiding the gas station; Decreased engine noise; Lower fuel costs”.
The new attitude towards EVs among important consumer groups is reflected in a recent Automotive
News editorial: “And consider Jaguar Land Rover. In late 2015, CEO Ralf Speth expressed zero interest
in a full-electric. Yet in November in Los Angeles, Jaguar introduced a concept of its battery-powered
I-pace crossover, which goes on sale in 2018. What changed? ´It´s a move that is driven primarily by
the customer, ´ Speth told us. ´Customers see this type of vehicle as cool and sexy, especially young
customers who … are not interested in the sound of the engine and things like that.´”16
Thus the manufacturers´ growth plans are underpinned by several factors: a rapidly increasing model
variety; robust improvement in critical performance parameters above all range; and more educated
consumer attitudes. Crucial for a real mass market penetration, however, will be competitive prices,
understood as parity with combustion engine vehicles in terms of total cost of ownership. This subject
of comparative costs is dealt with in chapter 4.
To sum up
In 2015, electrified vehicles on the road – plug-ins and fully electrics – for the first time passed the one
million milestone. In 2016, the number exceeded two million, of which more than 0.5 million were on
the roads in Europe. At the same time the number of models on the European market has multiplied
and many more will be released in the next few years. Globally, Europe constitutes the second most
important EV market. However, after a veritable sales explosion, China is now the No 1 electric car
market, and completely dominates the market for heavy electrified vehicles.
From 2010-12 to 2016, leading automakers increased the driving range of their main EV models by 50
per cent without any significant changes in prices. In 2017 several new models have been introduced
with driving ranges between 300 and 380 km on one charge, an increase of 150 per cent compared to
the average driving range five years earlier. In the next few years, several automakers plan to use the
technological improvements to introduce more cost-competitive models, whereas other firms will fo-
cus on premium models with big batteries and significantly extended driving ranges. After many false
starts, these improvements make it possible for EVs to finally cross the Rubicon, with huge implications
for industry and policy.
15 “Toyota Exec: Long-term focus will remain on hybrids”, Automotive News, Dec. 12, 2016. 16 ”Compelling EVs show what the industry can do”, Automotive News, Jan 9, 2017.

19
3. Battery development and materials supply
Three component systems in an EV powertrain are distinctively different from the internal combustion
engine: the electric motor, the battery pack, and the high-voltage wiring and charging system including
AC/DC inverter. All of these are under continuous development and improvement, but the energy
storage, i.e. the battery, is the defining system for cost, weight, range and charging speed and also for
the new system of materials supply needed for electrical vehicles.
Technological trends
The first electric vehicle from an established automaker in modern times, General Motors´ EV1, was
introduced in the mid-1990s with heavy lead acid batteries, but shifted to higher-density NiMH-bat-
teries (a similar chemistry to that used by the Toyota Prius), before production was discontinued in
1997. In the same decade an entirely new type of battery, based on the highly flammable lithium metal
in combination with a range of other metals, was pioneered by consumer electronics companies in
Japan. Since 1995 the Li-ion market has grown 25 per cent annually, from 2 GWh in 2000 to 60 GWh
in 2015. During this accelerated growth, costs and weight were reduced dramatically, and several
safety problems were detected and solved.
In 2008-10 Li-ion batteries entered their most demanding application yet – as the energy source for a
new generation of electric vehicles. At the start of these introductions, costs were still very high, with
an industry average above $1,000 per kWh (Nykvist & Nilsson, 2014). This meant that the small Leaf
car with a 24 kWh pack suffered from a battery cost of around $24,000! On top of that, the expected
lifetime of the batteries was uncertain, and the charging time lengthy: 6-8 hours. Since then, however,
there has been a dramatic improvement in costs and energy density.
A complex component defined by many performance parameters
Chemically, Li-ion batteries constitute a huge family of various metal combinations. Overall, the cath-
odes (positive electrodes) are most critical for battery cell performance. Several complex cathode
chemistries have been tried out, and new ones are continuously tested. In recent years the industry
seems to have converged on two combinations as active cathode components: Lithium-Nickel-Manga-
nese-Cobalt (NMC) and Lithium-Nickel-Cobalt-Aluminum (NCA), which provide superior energy den-
sity, and thus lower weight and volume, compared to other combinations tested for battery electric
vehicles (Sauer et al, 2016, Chung et al, 2016). In addition to improvements in cathodes, the anodes
(the negative electrode) are also receiving attention, and various combinations where the graphite
(crystalline carbon) core is mixed with silicon or lithium are being investigated. Moreover, there is also
a variety of electrolytes available, including solid polymers. Li-polymer batteries are used by Bolloré in
France, for example, and can be made thinner and with a more flexible casing than conventional Li-ion
batteries, but are somewhat more costly to manufacture.
There is vibrant research going on into improved Li-ion chemistries and components, and efforts to
implement lab results on an industrial scale often generate new research agendas. These include issues
such as how to achieve sufficient purity of electrode surfaces and how to exactly define input materials
when chemically similar deliveries from two suppliers differ in some non-defined aspects. Another R&D
challenge is to analyze the stability of binders in large-scale operations by applying rheological

20
knowledge, i.e. the study of fluids with complex microstructures, such as sludges, suspensions and pol-
ymers.17 A range of parameters need to be tested and compared when assessing a new battery: energy
density (both weight and volume), specific power (speed of energy release), cost, safety, cycling life
(number of deep cycles without losses in performance), and, increasingly, material availability (Novin-
sky et al, 2014). Many chemical combinations have been suggested but few of them perform satisfac-
torily on all these parameters. Research labs regularly announce and test new combinations, but as
noted by experienced battery researchers, there is a long time lag, normally 10-20 years, from lab
discovery to implementation in standardized mass production. If a radically new combination finds
industrial applications, this will first be in industries which are far less demanding than electrified ve-
hicles.
Along with advances in battery chemistry and increases in production scale, there is also a continuous
flow of improvements in geometry, in packaging, in battery control systems and in cell production. Half
of the weight of a Li-ion battery consists of ´dead´, i. e. chemically not active, material, and is used to
connect, protect, separate and control the active components. To reduce this proportion without jeop-
ardizing safety and reliability remains an important issue both for researchers and engineers.
Rapidly falling battery costs
Since their first introduction in automotive applications, total battery costs have fallen dramatically.
Based on a systematic analysis of industry reports and other estimates, Nykvist & Nilsson (2014) cal-
culated that the average cost in the 2007-14 period declined from $1,000 to $410 per kWh, and for
leading EV makers to $300/kWh. Their study indicates a cost reduction of 14 per cent per year industry-
wide and an 8 per cent annual reduction for leading makers, who started from a lower cost level. Based
on these results, the authors suggest a convergence around $230/kWh in 2017-18 which is broadly in
line with other estimates (McKinsey, 2017; Pillot, 2015).
A recent study published in Nature Energy (Kittner, et al 2017) predicts a pack price of $178/kWh in
2017 and a further rapid decline to $124/kWh in 2020, much faster than previously assumed (this
forecast is accompanied by a sensitivity analysis which yields a possible range $108 – $144/kWh). The
report Global EV Outlook 2017 emphasizes the importance of economies of scale, suggesting that bat-
tery packs produced in volumes of more than 200,000 per year will cost $200/kWh or less (IEA 2017,
p14). Energy density has also developed even more impressively, from an average of 60 Wh/liter in
2008 to 295 Wh/l in 2015, an improvement of almost 500 per cent, which translates into substantial
reductions in weight and space requirements (IEA 2016, p12).
According to a widespread consensus among researchers and industrialists, Li-ion battery costs and
performance will continue to improve in the 2020s: “There are still large development potentials, es-
pecially regarding density … and continued large cost reductions” (Sauer et al, 2016, p. 9). For several
reasons, breakthroughs for different technologies are not expected. First, the time from laboratory
discovery to application in a mass producing industry, particularly such a demanding industry as auto-
mobiles, is quite extensive, as noted above. Second, the rapid progress in established Li-ion technolo-
gies continues to attract major R&D efforts, and also to reduce the space for alternative technologies.
17 Interview K. Edström, April 13, 2017.

21
Battery production
As emphasized above, the battery systems and their energy intensity, cost and safety are defining el-
ements of electric vehicles, and will determine their success or failure. Battery R&D and production,
however, are heavily concentrated in East Asia. A technical report from NREL, the National Renewable
Energy Laboratory in the US, summarizes the key facts (Chung et al, 2016): In 2015, 88 per cent of the
world´s total Li-ion manufacturing capacity for all end-use applications was located in China, Japan and
Korea. These countries also produced a majority share of the critical cell components: cathodes (85
per cent of global capacity), anodes (97 per cent), separators (84 per cent) and electrolytes (64 per
cent). As noted by the authors these manufacturing clusters are a result of longstanding public and
private investments.
Japan invested heavily in the 1990s and is home to Panasonic, the global leader in cell production. A
decade later, Korea started to develop its Li-ion cluster by means of government and industry efforts,
which has resulted in two other major cell manufacturers, LG Chem and Samsung SDI. China is a rela-
tive latecomer, but is now intensively building capacity and capabilities. Both Korean and Chinese man-
ufacturers initially relied on supplies from Japanese cell producers, but they have systematically built
their own integrated supply chains. In a similar way, Tesla’s Giga battery factory in Arizona, built in
partnership with Japan’s Panasonic, currently relies on Japanese cell supplies. When fully commis-
sioned in 2018 the plan is to build all batteries in-house. The electric vehicles produced by GM in North
America, including GM Bolt, receive their batteries from a nearby cell plant in Michigan operated by
the Korean company LG. This is the first “Giga plant” operating in the US, and has reported a very high
precision in the production process with just two defects per million cells18.
Accelerated production expansion in China
According to Avicenne, a French consulting firm specializing in high-growth technology markets, total
Li-ion production capacity (including non-automotive applications) increased by more than 50 GWh
from 2011 to 2014 (Pillot, 2015). This rapid capacity expansion continues, but estimates of the rate of
ramp-up vary greatly. Avicenne suggests a total market of 120 GWh for automotive Li-ion batteries in
2025. This is a significant upgrade compared to the firm´s earlier predictions (Berg, 2016). More recent
estimates from other sources suggest even higher levels. According to Chung et al (2016), the global
manufacturing capacity of automotive Li-ion batteries amounted to 44 GWh in 2016, with 74 more
GWh partly commissioned, under construction or announced, making for a total of actual and planned
capacity of 118 GWh by 2020. Recent estimates from Benchmark Mineral Intelligence (Desjardins,
2017) suggest an even faster rate of capacity increases to a total of 174 GWh in 2020. This is assumed
to be driven by a six-fold increase in Li-ion battery production capacity in China, from 16 GWh in 2016
to 108 in 2020.
To put the battery production capacity projected by Chung et al (2016) in perspective, a capacity of
118 GWh would suffice to equip two million GM Bolt vehicles (each with a 60 kWh battery pack), or
three million new Zoe cars. These are significant volumes, but only make up a few per cent of the global
production of light vehicles. China has a goal of having 4.6 million EVs on the road in 2020 (IEA 2016),
which would mean that 1.5 million EVs are produced that year by China alone, but probably with
18 ”LG Chem quietly surges in battery race”, Automotive News, Dec. 14, 2015.

22
smaller size batteries than those in the GM Bolt.19 As noted by Chung et al (2016), optimistic demand
projections in the early years of the 2010s contributed to excessive investments which lead to poor
capacity utilization in battery cell production, approximately only 20 per cent in 2014. This improved
to 40 per cent in 2016 and has continued to improve, which contributes to overall cost reduction.
Recent European initiatives
Europe is one of the three leading EV regions globally in terms of sales and model diversity, and the EU
has adopted ambitious goals for reducing greenhouse gas emissions. However, in terms of R&D and
production of the technologically most advanced part of electric vehicles, Europe is far behind North
America and East Asia. Less than five per cent of global battery production is located in Europe, and
the same goes for the production of critical components (Stassin and Meeus, 2016). On the other hand,
Europe has a strong position in the refining of critical battery metals such as copper, nickel and cobalt
(see below) and a supply chain for other materials and components, for example separators and bind-
ers (Stassin and Meeus, 2016). As of April 2017, the following investments in battery plants have been
announced in Europe20:
Samsung SDI has started construction of a plant for battery production in Hungary with a re-
ported annual capacity of batteries for 50,000 pure electric vehicles, and is aiming for com-
mercial operation in the second half of 2018. A Korean competitor, LG Chem, is building a plant
in Wroclaw, Poland, with a capacity of 100,000 batteries. Production is set to start in the sec-
ond half of 2017. In both these cases the level of vertical integration is unclear.
Nissan has decided to build the fourth generation of the Leaf´s lithium-ion battery at its UK
factory with a capacity of 60,000 packs annually.
Audi has announced that it will build a new electric SUV at its plant in Belgium and concentrate
the assembly of battery packs at the same facility using cell modules from Korea´s LG and Sam-
sung. Production will begin in 2018.
The Daimler subsidiary Accumotive has started construction of a new battery factory in Ka-
menz outside Stuttgart, as part of a €500 million global investment. Production is scheduled
to start in the middle of 2018. Similar to Audi, Daimler will not produce any battery cells but
concentrate on assembling the battery pack consisting of cells, connective cables, control
equipment and protective housing.
19 Sales of EVs in China (almost totally produced domestically) are expected to reach 530 000 units in 2017, ac-cording to EV Volumes update 170815. This means a 50% sales increase compared to 2016, despite reduction in various government subsidies. If sales expand around 40% per annum in the next three years, the total stock will amount to 4.5 million EVs in 2020, assuming that none of these new cars will be scrapped. Based on these assumptions, 1.5 million EVs will be produced in China in 2020. 20 The overview builds on the following sources: Samsung plant in Hungary – Company website, Aug 31, 2016; “LG Chem Building EV Battery Production Plant Near Wrocław (Poland)”, CleanTechnica, Oct 6, 2016. “Starting in 2018, Audi´s Belgian Factory will only produce long-range e-tron SUV & Battery Packs”, Automotive News Europe Jan. 20, 2016: “Nissan will produce Leaf´s new advanced batteries in the UK”, Automotive News Europe, Jan. 21, 2016; “Daimler to build global production compound for lithium-ion batteries, Company website Oct. 24, 2016.

23
Compared to the massive investments in North America and East Asia, the initiatives in Europe, includ-
ing the Korean forays in Poland and Hungary, are small-scale and amount to only a few per cent of
global battery cell production (Stassin and Meeus, 2016). Much more ambitious attempts to build high-
volume battery cell plants are needed. The same goes for the advanced components needed by such
plants. In Europe, the three big chemical firms, Umicore in Belgium, Johnson Matthey in the UK and
BASF in Germany, are leading producers of exhaust catalysts for conventional vehicles. Announce-
ments from these companies indicate they have started to prepare for the decline of the internal com-
bustion engine and aspire to become key suppliers to the EV battery industry. According to the chief
executive at Umicore, “the vast majority of our investment [now] goes to battery materials because of
the formidable acceleration that we see in demand for our products”21. In a recent press release re-
garding its negotiations with Norilsk Nickel in Russia for the supply of nickel and cobalt, BASF highlight
their intention to spend up to €400m in the first step to build “industry-leading” cathode production
facilities in Europe22. Norilsk is the world’s second largest producer of nickel as well as a major producer
of cobalt from its Harjavalta refinery in Finland.
The value of battery cell production in Europe
Auto executives emphasize the value of having battery cell production close to vehicle production,
once the EV volumes take off23. One argument is related to the costs of logistics for shipping several
hundred kilograms of cells from Asia for each EV assembled in Europe. Industrialists, such as Thomas
Sedran at VW, also emphasize the importance of supply safety: “Battery suppliers will need to locate
close to their customers’ factories. Batteries are hazardous goods.” Other arguments are related to
the value for European battery researchers of being able to interact with high-volume production.24
Moreover, from an environmental perspective, the high energy intensity in battery cell production is
a serious concern. Thus it is important to supply future high-volume EV manufacturing in Europe from
local battery cell plants, instead of importing the cells from plants in Asia with a less decarbonized
energy mix. It is also an issue of future jobs, when development and manufacture of internal combus-
tion engines are gradually declining in importance.
So far European carmakers have refrained from making major investments in cell production, for ex-
ample in partnership with Asian specialists the way Tesla is doing with Panasonic for its Giga factory in
Arizona. Somewhat contradictory arguments are used to defend this relative passivity. Some argue
that battery production has become too advanced: “If we compare ourselves today with Samsung and
LG they are light years ahead of us”,25 whereas others state that Li-ion cells are becoming a commodity:
“The intelligence of the battery does not lie in the cell but in the complex battery system.”26 A third
argument, repeated in a T&E report on electric vehicles, is that Europe, because of its technology gap
21 See “Chemical groups gear up for electric car revolution”, Financial Times, July 10, 2017. 22 “BASF TARGETS CATHODE SUPPLY SECURITY WITH NORILSK NICKEL & COBALT NEGOTIATIONS”, Benchmark
Mineral Intelligence, July 7, 2017. 23 These representatives include B. Grandin, head of electro-mobility at CEVT in Sweden, and Thomas Sedran, head of group strategy at VW. The latter is quoted in “Automakers hunt for battery cell capacity to deliver on bullish EV targets,” Automotive News Europe, Jan 2, 2017. 24 Interview K. Edström, April 13, 2017. 25 Thomas Sedran at VW in “Automakers hunt for battery cell capacity to deliver on bullish EV targets,” Auto-motive News Europe, Jan. 2, 2017 26 Dieter Zetsche at Daimler in “Automakers hunt for battery cell capacity to deliver on bullish EV targets,” Au-tomotive News Europe, Jan. 2, 2017

24
in lithium-ion technology “should instead focus on breakthrough technologies such as new chemistries
that may enable Europe to leapfrog competitors in South Korea and Japan.” (T&E 2016, p36)
No commodity, no leapfrogging
These positions need to be discussed more thoroughly. As for the arguments against European invest-
ments in Li-ion technology, leading battery researchers, such as Kristina Edström at Uppsala University,
disagree:27 “Ten years ago we often heard this argument regarding commodity. Then they discovered
that a lot of things are still happening inside the cell and said ´we need to open the black box’.” As
noted by Pehlken et al (2017, p42), Li-ion batteries are far from reaching a commodity stage: “patent
applications for battery technologies have risen continuously between 1994 and 2008, and even ac-
celerated their upward trend since 2009.”
The continuous evolution of the existing Li-ion technologies, with a predicted doubling of energy den-
sity before 2030, is a strong argument against the notion of ´leapfrogging´, i. e. the idea that European
manufacturers can skip the current development stage, and invest in some future technology. The
continuous improvements in chemistry of cell components or packaging materials build on current
scientific and engineering knowledge, and new advanced knowledge has to be based on a deep under-
standing of the existing technology. Batteries are complex product systems and their development
could be analyzed as a case of creative accumulation, i.e. as a challenge of: “a) fine-tuning and evolving
existing technologies at a rapid pace, b) acquiring and developing new technologies and resources, and
c) integrating novel and existing knowledge into superior products and solutions” (Bergek et al, 2013,
p1210).
Getting left behind in a particular technology is not destiny. Competing from a catch-up position, link-
ing with and learning from foreign partners, is a normal situation for firms outside the OECD countries
and has been driving upgrading processes in major emerging economies (Karabag & Berggren, 2017).
European R&D and production of advanced batteries are lagging behind that of the Asian leaders, but
the same applied to the Korean firms in relation to Japan in the 1990s. This did not stop them from
learning from the Japanese leaders, and entering an intensive upgrading process along the same tech-
nological trajectory. Now China is following a similar path.
Giga plants in Europe needed
To build manufacturing capacity in line with its expanding EV market, and lay the ground for further
electrification, Europe needs to ramp up battery production in a major way in the 2020s. In this report
we assume European production of around three million electrified vehicles in 2025, approximately
half of them fully electric BEVs, and half PHEVs and seven-eight million vehicles in 2030. To equip the
BEVs with battery packs averaging 50 kWh and the PHEVs with packs of 10-12 kWh would require a
battery supply of more than 90 GWh in 2025, roughly equal to three European Giga plants of the Tesla
Arizona scale, if the cells are produced locally. With a planning and permission time of 2-3 years and
construction and commissioning time of 3-4 years per plant, total lead-time comes to five to seven
years per plant. If 50 per cent of all new cars will be electrified in 2030 with the same proportion of
BEVs and PHEVs, there will be a need for at least at least seven factories of this size (the exact number
depending on battery size per car).
27 Interview K. Edström, April 13, 2017.

25
The rapid change of mood within the industry, with almost every company announcing plans to launch
electrified cars within the next few years, has led to a sudden awareness among executives of the need
to secure a stable supply of high-quality battery cells, preferably produced within Europe. Several au-
tomakers are reportedly trying to persuade Asian manufacturers to locate new plants in Europe. Re-
cently, two independent initiatives have been announced, one in Germany and the other in Sweden.
In Germany, the battery pack assembler BMZ, supported by the “Kompetenznetzwerk Lithium-ionen-
Batterien” (KLiB), has formed a new company, Terra E, with the intention to build a cell manufacturing
plant with 28 GWh production capacity. In Sweden, a former Tesla executive has formed the company
NorthVolt with highly ambitious plans to have a Giga cell factory up and running within five years and
engaging leading Japanese production specialists to accomplish this28.
These initiatives need to be followed by more investments. European policy-makers could encourage
automakers to partner with Asian battery specialists, to support investments by independent firms
and entrepreneurs, or to attract direct investments by the Asian battery makers in Europe. To commit
to such massive investments, all actors would probably need some basic conditions: long-term con-
tracts or partnerships with major automakers, reliable power supply at reasonable cost, and low-cost
long-term credits. Attractive financial conditions for Asian battery investors may also be linked to de-
mands for investments in R&D centers within the EU.
Materials supply and sustainability
A transition to electrified vehicles will improve the energy security of Europe by drastically reducing its
dependence on imported oil and gas for vehicle use. At the same time, the production of vehicles will
become dependent on a reliable flow of metals for the Li-ion batteries, such as copper, nickel, lithium
and cobalt (plus common metals already used in vehicle production such as high-grade steel, aluminum
and manganese). Of these, copper and nickel are well established elements, produced in large quanti-
ties which only to a small degree target the electric vehicle industry29.
The annual global production of copper totals 18.5 million tons (2016) with less than 0.5 per cent going
to EV batteries. The risk of a supply shortage is virtually non-existent. Prices multiplied in the early
2000s, but have since fallen back considerably. The production of nickel is about a tenth of that of
copper. Approximately 2 million tons are produced from mines in many countries, the most important
being Russia, Canada, Indonesia and Australia. Major refineries are located in Europe (Norway, Finland)
and East Asia (China, Japan). Of the annual production, 60,000 tons (3%) are used in Li-ion batteries,
but this proportion is expected to increase. Prices have been volatile, with no clear trend.
Cobalt and lithium are different. They are, from the view of the mining industry, small-scale commod-
ities and increasingly dependent on demand from Li-ion battery manufacturers. The annual produc-
tion of cobalt is approximately 100,000 tons, an order of magnitude lower than the production of
28 “Germany to host two more battery factories”, pv magazine Deutschland, May 23, 2017;
“Rekordinvestering blir jobbgenerator, Europas största batterifabrik väntas kosta 40 miljarder”, Dagens Industri
March 8, 2017. 29 Data on production and demand of the metals discussed in this section are collected from several sources, including Macquarie Research (2016), CDI – Cobalt Development Initiatives, downloads in April-May 2017, in-terview with, and data supplied by, Magnus Ericsson, founder of Raw Materials Group, 170509.
26
nickel. Lithium production has increased rapidly during the last 10 years, but the annual volume of
35,000 tons (2016) is still low, only a third of the cobalt volume.30
Lithium – critical role and future availability
The market for lithium is divided into two categories: technical grade (ceramics, glass, lubricants) and
chemical grade (for use in batteries and other applications with high-purity requirements). In 2015,
the two types of applications were roughly similar in terms of volume. Chemical grade/battery appli-
cations are growing faster and are expected to constitute 50 per cent of the market around 2020.
Several physical and electro-chemical properties make lithium a critical ingredient in modern EV bat-
teries, both in the positive electrode (the cathode) and in the electrolyte. Lithium is the lightest of all
metals, with the highest electrochemical potential, and these properties make it possible to combine
high energy density with light weight packages. At the same time, lithium has a high coefficient of
thermal expansion which contributes to thermal stability and resilience. Being a highly reactive ele-
ment, lithium needs to be stabilized in chemical compounds and produced and used under closely
controlled conditions. In spite of its critical importance, the actual lithium content of a Li-ion battery is
only a few per cent; in 2016 the lithium cost of an NMC-battery was estimated at $5.5 per kWh, ap-
proximately 2 per cent of the cell cost. By comparison, the nickel cost for the same battery type was
estimated to be $3.8/kWh, and the cobalt cost $9.7/kWh (Macquarie 2016, p27).
Irrespective of actual cost, lithium remains a critical component, and projections of an accelerated
growth in EV production have fueled a stream of simulation studies on future availability. These aca-
demic studies show a huge spread in their results, with some predicting the possibility of substantive
depletion of known resources, whereas others forecast marginal impacts, even under assumptions of
comprehensive vehicle electrification (Pehlken et al, 2017). Mining industry specialists view the issue
differently. They argue that the mid-term availability (supply) of minerals, including lithium, can be
calculated with considerable certainty. This is based on the knowledge that new mines require consid-
erable lead-times before exploitation can start, and listed mining companies are therefore eager to
report the status of various projects publicly (Macquarie, 2016). Moreover, the closure of a mine and
restoration of the area is also a protracted process, which mining companies hesitate to take on. Taken
together, this means that the international mining communities have good knowledge of the supply
capacity of various minerals.
Longer-term, several factors make it difficult and economically uninteresting to estimate potential sup-
ply. Publicly listed companies have no financial motive in spending money on exploring potential re-
sources which might be economically interesting to exploit only after 10-20 years. New mining and
extraction techniques have historically taken a long time to develop, but within 15-20 years there are
strong reasons to believe that new technological approaches will be commercially available. This could
mean that reserves, including further exploitation of existing mines that are uninteresting today,
achieve a real economic value. An instructive case is the development of fracking technology in the oil
industry which completely changed the economics of the entire sector, including predictions of peak
oil, although at the expense of severe environmental consequences.
30 This figure refers to pure lithium; however, lithium is never traded as a pure metal and production statistics are often based on lithium carbonate equivalents (LCE) with 18.8 % lithium content

27
In contrast to supply, demand and prices are influenced by much more short-term variations, including
business cycles, temporary supply-demand mismatches and speculative hoarding. The behavior of
temporary oligopolies may also drive prices. This seems to be the case with lithium, for which the price
has shown a steady upward trend during the last six years, from $4.2/kg in 2011 to $9.1/kg in early
201731. As lithium represents only a few per cent of the cost of a Li-ion battery, however, the impact
of price increases on the pack level has been insignificant. Industry analysts emphasize that there are
no supply constraints and expect prices to fall back again, when the current four-firm oligopoly is chal-
lenged by new entrants (Macquarie, 2016).
Currently three countries, Chile, Australia and Argentina, account for 85 per cent of all lithium produc-
tion. In Australia, lithium is mined as hard rock (spodumene), which requires a multi-stage refining
process before a sufficiently concentrated lithium compound is obtained. In Latin America, lithium is
recovered in liquid form from brine deposits. Huge evaporation ponds are used to increase the lithium
content to approximately 6 per cent before the substrate is further refined to technical or chemical
grade. Chile has the best natural conditions for this kind of exploitation and is the world´s lowest-cost
producer. Bolivia is home to the world´s largest resources, but so far these are unexploited due to
unfavorable climatic conditions and brines with a high content of manganese, which make them more
complex to upgrade.
Because of lithium´s low production scale compared to other metals, the industry is currently domi-
nated by relatively small-scale companies. If growth continues, mining majors will start entering. This
will improve efficiencies, increase the long-term exploration of new resources, and support the devel-
opment of more advanced extraction techniques. Long-term, when EV production has stabilized at a
high level, there will probably also be significant supplies of recycled lithium (see chapter seven).
Cobalt: the need for sustainable mining
Cobalt is an important ingredient in super alloys which are used in the aerospace and aircraft indus-
tries. In recent years, rechargeable batteries have become a major market, accounting for 40 per cent
of total cobalt demand. Most of this cobalt is used in batteries powering mobile phones, laptop com-
puters, digital cameras and cordless tools, and only a small fraction is used in EV batteries. According
to analysts at CRU Consulting, electric vehicles consumed around 6.5 per cent (about 7,000 tons) of
refined cobalt in 201632. This estimate can be compared with the global sales of EVs, which amounted
to 770,000 units in 2016, of which 60 per cent were BEVs. Assuming 15 kg Co per BEV (a standard
estimate) and 3 kg per PHEV, the EV battery consumption of cobalt would approximate 7,850 tons
globally. In reality it could be somewhat lower, since some battery categories are relatively cobalt-
poor. In the future, cobalt demand for EV batteries is expected to increase considerably, constitute 17
per cent of total global demand in 2021, and continue to grow in the 2020s.
Both nickel and cobalt experienced steep price spikes in 2007 and 2008 but then fell back. In the case
of cobalt, prices remained low until early 2016, depressed by overcapacity and a falling demand for
31 Metalary.com, download April 20, 2017. 32 “Electric car boom spurs investor scramble for cobalt”, Business News, Febr. 14, 2017.
28
laptop computers. However, in the 18-month period January 2016 to June 2017, prices increased by
almost 160 per cent, from $22 to $56 per kg of refined cobalt33.
Already before this development, cobalt was the most expensive component in the popular NMC-
cathodes. The problem with cobalt is not price, however, but two other complications. First, in con-
trast to the three other metals discussed above, cobalt is very seldom extracted as a primary metal.
Instead it is a by-product of the exploitation of other raw materials, mainly copper and nickel. This
means that the supply of cobalt is determined by the demand for these primary materials. Moreover,
cobalt is distributed very unevenly around the globe. Around 50 per cent of known reserves are lo-
cated in the politically unstable Democratic Republic of Congo (Berger, 2016), with its reputation for
environmental and human rights abuses, including child labor in artisanal mining (Amnesty, 2016).
Cobalt is obtained as a minor metal in southern Congo, and the richness of these copper mines
makes it commercially difficult to replace them with other resources.
However, the price rally in cobalt, combined with widespread expectations of robust demand during
the 2020s on the back of vehicle electrification, is now driving new mining projects in countries such
as Australia, the US and Canada, in addition to plans to expand production in DRC. Analysts in the Fi-
nancial Times suggest that a two-tier market may emerge, where battery producers, in order to build
a robust supply base, pay a premium for cobalt originating outside Congo34. As stated by the chief
executive officer of Clean TeQ Holdings Ltd., which is developing a $680 million cobalt, nickel and
scandium project west of Sydney, customers “are desperately looking for sources of supply outside
of Africa.” Mining specialists argue there is at least a dozen projects outside Congo that could start
to deliver within 6 years, i. e. by 202335.
If the global growth of EV sales parallels the assumed expansion in Europe, there might be a 30-fold
increase in global EV production by 2030 and the need for crucial battery minerals would rise steeply.
Everything else being equal, this might imply an increase of cobalt demand for EV-batteries from 7,000-
8,000 tons in 2016 to 210,000-240,000 tons in 2030, resulting in a threefold increase in overall cobalt
demand compared to current levels, and substantially more if battery capacities expand to the 60–80
kWh range. However, if prices continue to climb there will be strong engineering efforts to reduce the
specific content of cobalt by changing battery chemistries. One promising alternative is to alter the
proportions of nickel, manganese and cobalt in NMC batteries from 1:1:1 to 8:1:1. This would reduce
the cobalt content by two thirds. Before such Co-reduced NMC-batteries can be implemented in the
auto industry, however, several issues regarding the surface treatment of nickel need to be solved36.
Regarding the next steps, smelting and refining, there are important production facilities in China and
Japan, but even more so in Europe. Kokkola in Finland is the world´s biggest cobalt refinery, and there
are also significant refining plants in Norway (Kristiansand) and Belgium (Umicore´s Olen facility). This
means that Europe could be able to exercise sustainability leverage on the cobalt supply chain. Several
activities are on the way, organized by the industry, for example RRMI, The Responsible Raw Materials
Initiative. International organizations, such as the OECD, are also active here. Such initiatives tend to
33 “The Growth of Cobalt Market and Demand Driven by Electronic Vehicles”, Financial Buzz.com, June 07,
2017. 34 “Cobalt set to shine in metals markets in 2017”, Financial Times, March 3, 2017. 35 “Race Is on to Mine Metal Powering Electric Vehicles”, Bloomberg Technology, June 9, 2017 36 Interview Kristina Edström, Uppsala University, April 13, 2017

29
contain strong doses of benign rhetoric, but they also put real pressure on mines and refineries to
increase transparency and traceability. New methods to detect and trace the origin of controversial
minerals which have been developed, above all in Germany, might be important in the development
of certification systems for responsible cobalt mining. Similar to nickel and copper, there are well es-
tablished processes and markets for recycled cobalt (Pehlken et al 2017). If prices increase, collection
rates and recovery efficiencies will also increase. For lithium, however, industry scale recycling pro-
cesses currently do not exist and need to be developed during the 2020s. In chapter 7 we return to
this issue.
Learning from history? The non-crisis of platinum supplies
The divergence in long-term projections of future lithium demand and resources, mentioned above, is
a reminder of the difficulty in making projections based on current knowledge of the reserve base,
extraction technologies and material use per component. Therefore, it is useful to look in the rear
mirror and study how the automotive industry has coped with previous instances of anticipated ma-
terials shortages. Here the so-called Platina Group Metals (platinum, palladium, and rhodium) repre-
sent a highly relevant case. These scarce metals are crucial components in the three-way catalytic con-
verter, which is used on all advanced markets, but are only mined in a few locations. Analyzing the
consequences of a rapidly growing global vehicle fleet, some researchers predicted serious difficulties
in PGM-supply, warning of “an impending platinum crisis” (Yang, 2009). Others, however, have em-
phasized the efficiency potential of the recycling process (Zhang et al, 2016), the capacity of the mining
industry to exploit new resources and the capabilities of car makers to reduce the metal content of
each converter; “chemical engineers are working on the problem at the molecular level, trying to make
the catalyst layers even thinner and diluting them with cheaper alloys” (Tollefson, 2007, p334). So far,
the latter group of experts has proven to be correct. The industry has not suffered from any shortages,
and prices have actually been falling during the last 10 years (2008-17).
The so-called rare earth crisis in 2010-11 is another instructive incident. In this case, there was no
material constraint regarding the supply of these metals, e.g. dysprosium which is crucial to the per-
manent magnets used in wind turbines and motors in electrified cars. The crisis was triggered when
China, the main producer, announced strict export quotas. Prices suddenly multiplied (Macquarie Re-
search, 2016, p48), and a report from the US Department of Energy in 2010 envisioned a possible “crit-
ical shortage” of five rare earth elements (Maycher, 2015). Two years later, however, prices had fallen
to a small fraction of their spike level and a supply crisis never materialized. Several factors contrib-
uted. Industries outside China responded with intense engineering efforts to reduce their dependence
on the rare earth minerals. In addition, the prospect of increased prices encouraged the opening of
new mines in various countries from North America to Australia, and after some time China abolished
its export quotas.
These and similar cases support the conclusion that risks are low that long-term resource scarcity will
block the development of the EV-industry. However, there is a more salient risk of short-term disturb-
ances caused by temporary bottlenecks in an expanding supply chain. An important consideration is
the long lead-time for developing new mining projects noted above. The physical construction and
commissioning of a large-scale battery plant might be achieved within 3-4 years if experienced pro-
ducers and equipment manufacturers are engaged. Mining projects are more difficult to accelerate
and lead-times of 5-10 years before significant production starts is normal (Novinsky et al, 2014, p16).

30
Comprehensive electrification of the EU vehicle fleet will require deliveries both from more advanced
exploitation of current resources and the opening of new mines. To make this possible, the planning
of such projects needs to start as soon as possible.
To sum up
Li-ion batteries are a key component in modern electric vehicles, determining performance and a sig-
nificant part of the total cost. After an evolutionary process of 15 years in the consumer electronics
industry, this storage technology entered the automotive industry around 2008. Since then costs per
kWh have fallen by almost 75 per cent. A further doubling of energy density and reduction of costs is
expected in the coming decade. Radically new compounds are very unlikely in automotive applications
with their stringent demands on safety, reliability, performance, cost and convenience.
The production of Li-ion batteries is heavily concentrated in East Asia. When high-volume EV manufac-
turing takes off in Europe, integrated battery production is needed on European soil too. One reason
is the economics of logistics – a 60 kWh battery pack weighs over 400 kg, of which the cells account
for more than half. Another reason is security of supply of a potentially hazardous good; a third, pos-
sibilities of close interaction with European centers in battery R&D; and a fourth, the environmental
value of the decarbonized European energy system for this energy-intensive production process. In-
vestments in large-scale battery cell production will also increase Europe´s leverage in building sus-
tainable and transparent supply systems for the critical metals used in battery cells. Partnerships and
long-term contracts with Asian battery specialists will be needed to build the Giga factories required
to supply a car industry whose output will be 50 per cent electric vehicles by 2030.
Li-ion batteries are dependent on several critical materials, such as nickel, cobalt and lithium. The avail-
ability of these metals may be assessed with considerable confidence in a 6 to 8-year timeframe. Actual
demand and short-term prices are much more volatile. A combination of new mining projects, in-
creased extraction efficiency and reduced content of critical metals per battery will most probably
suffice to secure material flows and acceptable prices when the industry enters a major growth trajec-
tory.
The history of scarce automotive minerals, such as platinum group metals and rare earth metals, sug-
gests that engineering efforts and economic forces are effective in securing availability and absorbing
price spikes. However, an expanding battery industry will need long-term planning of minerals supply
to avoid short-term bottlenecks caused by long lead-times in the exploitation of new resources. Recy-
cling of lithium is currently not economically feasible, but needs to be in place by the end of the 2020s.
As for cobalt, the geographic concentration of the natural resources to conflict-ridden areas means
that the establishment of systems and protocols for sustainable and transparent mining is of critical
importance. Using its strength in the refining sector, and its role as a major future market, Europe
could be a significant force in driving this development.

31
4. EV economics – total cost of ownership
As illustrated in chapter 1, EVs launched in recent years are rapidly approaching attractive levels of
realistic driving range. To seriously compete with conventional vehicles on the market, Nykvist and
Nilsson suggest that battery costs need to fall further, to around $150/kWh “at which BEVs are com-
monly understood as becoming cost competitive with internal combustion vehicles” (Nykvist and Nils-
son, 2014, p330). Industry analysts, such as McKinsey (2017), argue that “true price parity” with ICE
vehicles (in the C/D segment) requires battery costs below $100/kWh, a level they perceive as realistic
at the end of the 2020s. Interviews with researchers and industry specialists in April-May 2017 indicate
that this level could even be achieved around 202537.
A simple comparison of the purchasing prices of electric and combustion engine vehicles neglects the
differences in operating costs. To account for this, several studies make efforts to calculate the total
cost of ownership (TCO) of the different vehicle categories. The use of these calculations to predict
market behavior has previously been complicated by findings that consumers seldom include such ex-
ercises in their buying decisions (Greene, 2010). In the case of EVs versus conventional cars, however,
the TCO gap is so distinctive, and EV marketing departments so eager to point this out, that customers
may indeed be interested in doing the math. An example of such a TCO analysis is presented in IEA
(2016). Here the purchase price of an EV with 80 kW power rating, 350 km range and batteries costing
$100/kWh is calculated to be €3,600 ($4,000) higher than for a similar petrol car. The low costs of
driving electric, related to the electric motor’s high efficiency and the inexpensive electric power, is
calculated to offset this premium within in 5-6 years (IEA 2016, p22).
A report from Element Energy (2016) compares the four-year TCO of BEVs and PHEVs with diesel and
petrol cars in three segments: the B-segment (small/subcompact cars), the C-segment (medium/com-
pact cars) and the E-segment (premium or executive cars). According to this study, C-segment EVs will
come very close to cost parity with petrol cars in 2025. The TCO for small electrified cars, however, will
remain somewhat higher than for petrol cars also in 2030. As for large E-segment cars, the relevant
comparison is with diesel cars. The study finds that in this segment diesel PHEVs will come very close
to cost parity with ICE vehicles in 2030.
In an even more differentiated analysis, Swiss researchers modelled the total cost of ownership in 2020
and 2025 for cars with various powertrains in three segments and three driving distance categories
(Wu et al, 2015). This analysis showed driving distance to be a crucial factor. The simulations indicated
that in the long-distance category the capital costs of small electrified vehicles could be offset by its
lower operation costs already in 2020. However, this was not the case in the shorter-distance catego-
ries. For more expensive cars (C, D and J segments), battery and hybrid-electric vehicles displayed
roughly equal probabilities of being the technology with the lowest TCO/km, but only in the long dis-
tance category (Wu et al, 2015, p205). The results build on conservative projections of reductions in
battery cost (4 per cent a year). With the more rapid cost decline based on the recent data discussed
above, electric vehicles would probably be TCO-winners also in the shorter distance categories.
37 Interviews with B. Nykvist, SEI, April 28, 2017; B. Grandin, CEVT, May 9, 2017.

32
These and similar results need to be related to the current market prices of EVs and conventional cars.
Such comparisons show that battery costs are not the only problem. An electric Zoe including battery
had a purchasing price in Sweden in 2017 of SEK 325,000 (approx. €34,100). If the 41 kWh battery is
excluded, the price of a naked Zoe is SEK 245,000 (approx. €25,700) more than the price for a well-
equipped Golf in the same segment! The purchasing price of a basic GM Bolt will probably be SEK
410,000 (€43,000) when it is launched in Sweden. Assuming a cost of $200/kWh, a Bolt without battery
would cost around SEK 300,000 (€31,500), compared to €23,000 for a Blue Motion Golf with a 1.4 liter
TSI-engine and a 7-speed DCT transmission. What are the reasons for this huge difference?
Automotive industry insiders explain the high cost of ´naked´ EVs by referring to the low volumes, at
the component as well as the vehicle level. In the case of batteries, manufacturers need to develop a
still immature technology (plus achieve economies of scale) to continue reducing costs. By contrast,
EV builders use technically mature components, such as motors, contacts, high-voltage wiring and in-
verters. However, irrespective of maturity these components are produced in low numbers compared
to standards in the mass producing auto industry. To make them price competitive, volumes need to
increase from a ten thousand scale to a multi-million scale.
A considerably higher volume is also needed at the vehicle platform and model level. Without sufficient
volumes, car companies cannot reduce development costs per unit and invest in designs which inte-
grate components in space-effective and cost-effective sub-systems. An executive at a European com-
pany designing cars for the Chinese market claims that they can reduce the cost of a ´naked´ EV by half
if mass production is realized38. According to recent trends and projections, China will be the first mar-
ket where annual EV sales pass the one million milestone. Thus cost competitive electrical vehicles will
first be produced in and exported from China, before EV volumes take off in Europe.
Production learning and TCO – A comparison of an EV and an ICEV in 2025
To illustrate the importance of volume increases and industrial learning, we will compare the possible
price of a mass produced “Bolt-type” EV with a conventional petrol car in the same segment in 2025.
In line with the prediction in chapter two we assume that the sales of EVs in Europe will increase from
220,000 in 2016 to approximately 3 million vehicles in 2025, i.e. production volumes will double almost
four times. Thiel et al (2016) assume an industrial learning rate of 12.5 per cent. We make the more
conservative assumption of a learning rate of 10 per cent, i.e. each doubling of the production volume
reduces unit costs by 10 per cent. If the Bolt vehicle price of €43,000 in 2017 is a reasonable reflection
of the total vehicle cost, the four rounds of production doubling with the assumed learning rate would
result in a price of around €28,000 in 2025.
A TCO comparison using average European retail prices for petrol and electricity indicates that the EV
will save around €3,000 in fuel expenses during the first five years compared to a petrol engine car of
similar size. Adjusting for this difference, the ´net price´ would be €25,000. This is still €2,000 more
expensive than the Golf referred to above, but the gap is much closer than before39. In this case, the
38 Interview at CEVT 170509. 39 The calculation is based on the following assumptions: Annual driving range: 18,000 km. On average cars in the EU are driven 13,000 km/year. Here we compare new cars, which have higher than average annual driving distances (statistics provided by Trafikanalys, Sweden, June 6, 2017).

33
reduction in EV costs is only related to volume increases and industrial learning. If battery costs con-
tinue to decline at an annual rate of 8 per cent, as reported above, their cost would decline more than
the vehicle cost, which could result in price parity between the compared cars already by 2025. Alter-
natively, the faster reduction in battery costs could be exploited to extend the EV´s driving range, by
using more expensive lightweight materials, e.g. carbon fiber, and investing in more efficient climate
systems and other accessories.
A key point in the analysis is that EV costs are determined by two inter-related but different processes:
1) battery development (R&D and technical refinement plus economies of scale), and 2) vehicle volume
development (industrial learning and economies of scale). Although EV costs will come down, it will
not be possible to reduce the price of an EV including battery to the same level as the most cost-
effective petrol-powered cars in the A-segment (mini cars) which offer starting prices at around
€10,000. This has important implications for policy. Effective policies need to encourage volume ramp-
up as well as provide some type of support for the battery cost, if policy makers are serious about the
ultimate goal of replacing combustion engine cars also in the smallest segment.
The impact on TCO of fuel and electricity prices
A significant problem when trying to overcome the difference in total cost of ownership is the existing
large differences across Europe in fuel and electricity prices, including taxes and charges. Taking these
differences into account means that the incremental capital cost of shifting to electric vehicles differs
among countries even though cars and batteries are produced for a common market.
The differences in the cost of using the cars are illustrated in Table 1 based on two almost identical
new cars, a BEV and an ICEV. Both are assumed to be driven on average 18,000 km40 per year during
the first four years, the BEV consuming on average 0.20 kWh per km (including charging and battery
losses) and the ICEV 0.065 liters of petrol per km in real driving, in both cases including cold ambient
temperatures during part of the year. Assuming that the BEV is predominantly charged at home, the
owner´s energy cost would be determined by the household electricity price and the cost of buying a
private slow charger at approximately €1,000 to be written off over 10 years. Under these circum-
stances the BEV will consume 14,400 kWh over four years, while the ICEV will burn 4,680 liters of
unleaded Euro95 petrol. Table 1 shows the energy part of the variable vehicle cost of these two vehi-
cles in four countries, selected for different electricity and petrol cost profiles.
From the table it is evident that the surplus on running costs leaves the first owner of the BEV in Greece
€5,343 to balance his/her higher capital cost, while the German counterpart is left with a mere €2,315.
In addition both of them would benefit from a lower maintenance cost compared to the ICEV owners.
Energy/fuel consumption: 2.0 kWh/10 km for the EV including losses, assuming that the 2025 EV is 10% more
efficient than the current model; 0.58 liter/10 km for the petrol car. 0.70 liter/km is a realistic figure today,
here we assume two per cent annual improvements. For electricity costs we use the EU-28 average for house-
hold consumers: €0.206/kWh (http://ec.europa.eu/eurostat/statisticsexplained/index.php/ Electric-
ity_price_statistics#Electricity_prices_for_household_consumers.) For petrol we use the average EU-28 price in
May 2017: €1.29/liter (https://www.energy.eu/fuelprices/).
40 The average annual mileage over the life of the vehicle would be around 13,000 km but cars are driven for longer distances in the first years of their existence.

34
Table 1. Total energy costs for using a BEV and an ICEV during the first four years of ownership.
Germany United Kingdom Poland Greece
Fuel price (€/liter petrol) * 1.359 1.376 1.062 1.569
Electricity price (€/kWh) # 0.297 0.195 0.133 0.176
ICEF fuel cost over 4 years (€) 7,067 7,155 5,522 8,159
BEV electricity cost over 4 years (€) 4,752 3,120 2,128 2,816
Difference in cost over 4 years (€) 2,315 4,035 3,394 5,343
* Price at the pump in May 2017 (https://www.energy.eu/fuelprices/)
# Price 1st quarter 2016 (Eurostat)
Please note that Table 1 is based on average 2016 electricity retail prices. In coming years, a growing
supply of electricity from intermittent power production will make prices fluctuate much more. Con-
sumers who manage to adapt charging to these fluctuations may be able to reduce their average cost
while others may face higher costs.
Among the factors that will have an impact on the competitiveness of electric vehicles are the future
price of oil and the extent to which petroleum-based fuels and electricity are taxed. The development
of crude oil prices is notoriously hard to predict. Given the large resources of shale oil, which add to
the traditional reserves, a peak in terms of production capacity may not be near. A global peak in de-
mand appears more likely, and if it happened it would be partly caused by the electrification of road
traffic in combination with more fuel efficient vehicles and ships, together with rising use of biofuels
in some markets. If overall demand declines, prices will also fall but not below the short-term marginal
production cost. The cost of petrol and diesel at the pump is also to a large extent influenced by excise
duties and, where private motorists are concerned, by VAT.
The future price of electricity is also hard to predict. Many of Europe´s nuclear power plants will be
decommissioned in the coming 20 years and only a few new nuclear reactors are currently in the pro-
cess of construction or planning. Simultaneously the CO2-emissions allowed under the cap of the EU
Emissions Trading Scheme (EU ETS) must be gradually lowered. Fossil-fueled power plants, which cur-
rently dominate European power production, will thus gradually have to be replaced by fossil-free
production.
The price of EU CO2 allowances is currently very low but might increase considerably during the 2020s.
If carbon capture and storage at coal-fired condensing power plants becomes necessary, the cost may
drive the price of emission allowances to levels exceeding €40 per ton. This would make the price of
electricity in affected markets rise by approximately €0.03 per kWh and add 10-20 per cent to the
running cost of electric cars depending on the country´s pre-existing retail price on electricity. At least
part of the increase would also affect neighboring countries (even if they themselves are fossil-free)
through cross-boundary electricity trade. However, at times there may not be any need for using coal
as solar and wind power production will be sufficient.
A problem in the longer term is that governments will raise much less money from road transport
related taxes when EVs replace traditional cars in large numbers. The revenue per vehicle kilometer
will shrink by around 80 per cent in countries with relatively high excise duties on electricity and by

35
more than 90 per cent in countries with low taxes. The largest losses will occur in member states with
high excise duties on road fuels. Finance ministers will then probably start looking for some other traf-
fic related tax that can fill the coffers. One obvious candidate is km-charging which could also be justi-
fied as a means for internalizing the external costs of electric vehicles, in particular the risk for traffic
accidents that cause injuries and fatalities. The introduction of km-charges or some other duty to make
up for part of the difference in annual government revenue will of course affect the total cost of own-
ership of EVs. Whether the lower cost of using the EV will compensate for the higher capital cost de-
pends on the remaining market value of the car after a few years. Traditional cars often lose around
half of their initial value in the first three years. Whether this rule of thumb will also apply to electric
vehicles is not evident. If second-hand buyers appreciate the lower cost of using the vehicle they might
be willing to accept a slower rate of depreciation. However, worries concerning the life of the batteries
and their performance may work in the opposite direction.
If future EVs will have the same depreciation of their capital value as conventional vehicles, second
and third owners of EVs will benefit from more favorable total costs than first time buyers. The num-
bers of second-hand EVs currently on the market are too small to permit any studies of real trends.
Given the rapid technological development of electrified vehicles in terms of range, charging, etc., the
prices of used EVs could decline more steeply than the prices for conventional vehicles. Rapid depre-
ciation of product values is a recurrent phenomenon on markets characterized by fast technological
development (cf. prices of second hand desktop or laptop computers). This phenomenon could make
the TCO of second-hand EVs even more beneficial. When EV technologies enter a stage of maturity,
second hand prices will probably stabilize and be somewhat higher than for conventional vehicles in
view of their low operating costs.
An important precondition, however, is that buyers of second hand EVs can rely on realistic estimates
of the conditions and lifetime of the batteries after 5–10 years of use. This will require a market for
reliable and certified condition measurement services. If such services do not evolve by private market
initiatives, government agencies may need to take action, supported by an appropriate EU directive.
To sum up
The purchase price of an electric vehicle is currently significantly higher than the price of an equivalent
conventional car. This is not only explained by the costs of the battery, but also by the low volume of
the EV models designed and produced so far. Significant increases in volume which drive industrial
learning and create economies of scale are needed for EVs to approach the unit costs of conventional
cars. The operational expenses (fuel and service) for an EV are considerably lower than for a conven-
tional car, thanks to higher energy efficiency and the comparatively low costs of electric power. Taking
account of this, and including the effect of increases in overall EV volumes, several studies predict
approximate cost parity between EVs and conventional vehicles in the mid or late 2020s, measured as
total cost of ownership over circa five years. The comparison is sensitive to driving patterns: the more
distance the vehicle travels, the more beneficial the EV is for the individual owner. Moreover, there
are large variations across Europe in fuel taxes and costs of electricity which influence the comparative
cost of ownership for electrical vehicles. Second and third owners of EVs will benefit from more favor-
able total costs than first time buyers, especially in the current period of rapid technological change.

36

37
5. Fuel cell electric vehicles have GHG reduction potential but still face
important market barriers
Fuel cell vehicles (FCEV) were first presented as a sustainable alternative to combustion engines in the
late 1990s. However, at that time the costs and the bulkiness of the equipment did not make them a
feasible alternative for private car buyers. Since then, a few carmakers, in particular Toyota and Hyun-
dai, have succeeded in dramatically reducing the costs and shrinking the size of the powertrain.
Global automakers differ in their conclusions on whether BEVs or FCEVs provide the best long-term
option for the electrification of road passenger transport. Toyota, Honda and Hyundai have large FCEV
development programs, others are less committed. Longer range and faster refueling are obvious ad-
vantages with fuel cells compared to BEVs. However, getting the necessary infrastructure for hydrogen
refueling in place is a major challenge, and hydrogen is expensive to make, transport and store in com-
parison to electricity.
Limited market introduction of FCEVs
Among the FCEVs currently available in small numbers for sale or lease are the Hyundai Tucson, the
Toyota Mirai, and Honda´s Clarity. Toyota has been marketing the Mirai since late 2014, 2,000 were
sold in 2016, and Toyota is aiming at 3,000 in 2017.41 Vehicle costs remain high. FCEV prices have been
set at around $60,000 during the early market introduction phase, i.e. about $20,000 more than the
BEV Bolt model GM launched in 2016. The prices that have been announced might reflect more the
assumed customers’ willingness to pay than the costs of producing the vehicles. Currently, the on-road
fuel economy is around 1 kg of hydrogen per 100 km travelled, and demonstration cars have ranges of
around 500 km to 650 km (IEA, 2015).
California Air Resources Board (CARB) expects that two additional manufacturers will release purpose-
built FCEVs over the next three model years (CARB, 2017). In Europe, the interest remains minimal. In
2016, only 134 FC-vehicles were sold, a 22 per cent drop compared to 2015.
Japan is pushing for fuel cells in cars and buses as well as in stationary applications. The country´s
capital plans to use the Tokyo Olympic Games in 2020 as a major showcase. It has announced plans to
spend 45.2 billion yen ($400 million) on fuel-cell vehicle subsidies and hydrogen stations by the time
of the games. However, experts cited by Carlines do not anticipate hydrogen to play a major role as a
source of energy in Japan any time soon. The nation’s 2030 power mix, an outlook published by the
trade ministry in 2015, makes no mention of hydrogen.42
Hydrogen production
Several methods can be used for hydrogen production. The dominating technology is steam reforming
from hydrocarbons in natural gas, oil and coal. Around 48 per cent of current supply is produced from
natural gas using steam methane reforming, 30 per cent arises as a fraction of petroleum during the
refining process, 18 per cent is produced from coal, and 4 per cent is manufactured by electrolysis
(Decourt et al, 2014, cited in IEA, 2015). Several other production methods of limited current im-
portance exist, and a number of new methods are in development.
41 https://www.scientificamerican.com/article/lack-of-cheap-clean-hydrogen-slows-fuel-cell-cars/ 42 “Japan Makes Big Push for Hydrogen Fuel Cells”, Carlines February 2017.

38
Hydrogen is currently mainly used in hydrocracking for the conversion of heavy petroleum fractions
into lighter ones, and for the production of ammonia via the Haber process.
Production from natural gas is the cheapest source of hydrogen and can be made with approximately
80 per cent efficiency. In order to fit in a European scheme for reducing carbon emissions from road
transport, producing hydrogen from natural gas for use in vehicles would require the production plants
to be equipped with CCS, which would have a significant impact on the overall production cost.
Electrolysis means using electricity to split water into hydrogen and oxygen and is the most expensive
commercial method for hydrogen production. There are three main types of cells that can be used for
electrolysis. While two of them require high temperatures, polymer electrolyte membrane cells (PEM)
typically operate below 100°C and are becoming increasingly available commercially. The cost is ex-
pected to fall by around 50 per cent between 2012 and 2030 (E4tech Sàrl and Element Energy, 2014).
The efficiency of the best performing PEM electrolysers (around 70%) is sufficiently close to the theo-
retical minimum value that further improvements are expected only to be marginal. Small electrolys-
ers, suitable for local small-scale production, may have efficiencies well below 60 per cent (E4tech Sàrl
and Element Energy, 2014).
The cost of electrolytic hydrogen is to a large extent determined by the cost of electricity and the
investment costs associated with the electrolyser. Minimizing the cost of input electricity by relying on
cheap surplus renewable electricity (“power to gas”) has been discussed as a road to inexpensive hy-
drogen. However, using excess renewable power to generate hydrogen poses an economic challenge
for several reasons. Electrolysers have significant investment costs, which mean that they will only be
cost-effective if operated for a sufficient amount of time during the year. As power generation surplus
will occur only during short periods, relying exclusively on such hours is likely to be insufficient to reach
a satisfactory capacity factor (IEA, 2015).
In addition to the obstacles facing hydrogen producers, it is essential to remember that further invest-
ment in wind and solar energy will depend on a getting a sufficient average price over the year. It may
thus be difficult to unite the two business models, when one is dependent on a relatively high price on
electricity, and the other needs a low price during a substantial part of the year.
Hydrogen distribution
Creating an infrastructure for hydrogen distribution and delivery to thousands of future individual fuel-
ing stations presents additional challenges. It is more expensive on a per-liter-of-petrol-equivalent ba-
sis. Producing hydrogen in large centrally located plants minimizes the cost of production but raises
the cost of distribution. Producing hydrogen at or close to the point of end-use cuts distribution costs
but increases the cost of production.
Hydrogen is currently distributed through pipelines, by high-pressure tube trailers or by liquefied hy-
drogen tankers. Pipeline is the least-expensive way but requires a market for large volumes of hydro-
gen. Transporting compressed hydrogen gas by truck, railcar, ship, or barge in high-pressure tube trail-
ers is expensive and used primarily for distances of 300 km or less. Transporting hydrogen in tankers
requires cryogenic liquefaction, which is a process that cools the hydrogen to a temperature where it
becomes a liquid. The liquefaction is highly energy consuming compared to gaseous truck or pipeline
transport. Although this process is expensive, it allows hydrogen to be transported more efficiently

39
(compared with high-pressure tube trailers) over longer distances by truck, railcar, ship or barge. If the
liquefied hydrogen is not used sufficiently fast at the point of consumption, it boils off from its con-
tainment vessels. Typically it will evaporate at a rate of 0.5-1 per cent per day.
FCEVs are designed to accept 350 or 700 bar with the higher pressure giving greater range. Fueling
takes 3 to 5 minutes. Hydrogen stations are costly and can deliver a limited number of gas fillings per
hour due to the need to maintain sufficient pressure. The capital cost of a hydrogen refueling station
is affected by station capacity (kg/day), pressure and onsite storage method.
Ricardo (2016) estimates the current capital cost for a capacity of 200 kg/day43 in a low pressure system
(350 bar) to be $1,250,000 when the hydrogen is delivered to the station in gaseous form and the
capital cost recovery period is 10 years. The capital cost of a station based on liquid deliveries and with
a daily capacity of 400 kg is set at $1,970,000, while the cost of a similar station with a capacity of 800
kg/day would be $2,100,100. Ricardo believes that by 2030 the capital cost of the largest of these three
examples will have been reduced to $1,260,000.
It may take a relatively dense network of hydrogen fueling stations in order not to create range anxiety
among FCEV owners. This may prove difficult and costly in less populated areas. In 2016, there were
285 hydrogen fueling stations worldwide. In 2017, that number is expected to grow to 384, according
to the Washington-based Information Trends, which predicts that by 2022 there will be around 1,300.44
Overall efficiency and cost
Each conversion step on the way from electricity to hydrogen and back to electricity entails losses.
When the hydrogen is produced by electrolysis, the FCEV consumes at least 130 per cent more elec-
tricity per vehicle-kilometer than an identical BEV model.
In July 2016, the price of hydrogen in the US, produced from natural gas and untaxed, was between
$13 and $16 per kg45. In 2016, ITM Power in the UK charged £10 per kg of hydrogen.46 That translates
into approximately £0.10 per vkm (€0.12) and may be compared with the electricity cost of using a
BEV. For households consuming 2,500-5,000 kWh per year, the EU28 average price (weighted with the
national electricity consumption in the household sector) was €0.206 per kWh.47 Based on slow charg-
ing at home and assuming a current use of 0.22 kWh/km (including charging and battery losses) and
the average EU electricity price, the “fuel” price of the BEV would be around €0.053 per km, including
taxes and the capital cost of the charger.48 The current fuel cost of a traditional mid-size ICE-car is
about €0.09 in Europe (based on 0.06 l/vkm and a fuel price of €1.45/l).
In order to compensate for a much higher fuel cost, including transport and delivery, the FCEV itself
must become a lot cheaper to buy than a long-range BEV or a PHEV. Today the opposite is true, and
43 Equal to fuel for 20,000 vehicle km. 44 http://www.informationtrends.net/hydrogen-fueling-stations.html 45 https://energy.gov/eere/articles/5-things-know-when-filling-your-fuel-cell-electric-vehicle 46 https://www.forbes.com/sites/lauriewinkless/2016/06/01/are-hydrogen-fuel-cell-cars-becoming-nor-
mal/#11510956683a 47 With huge differences across Member States (€0.309 per kWh in Denmark and €0.297 in Germany vs €0.096
per kWh in Bulgaria and €0.111 in Hungary). 48 Based on 13,000 km/year and a capital cost of €1,000 to be written off over 10 years (i.e. €0.008/vkm).
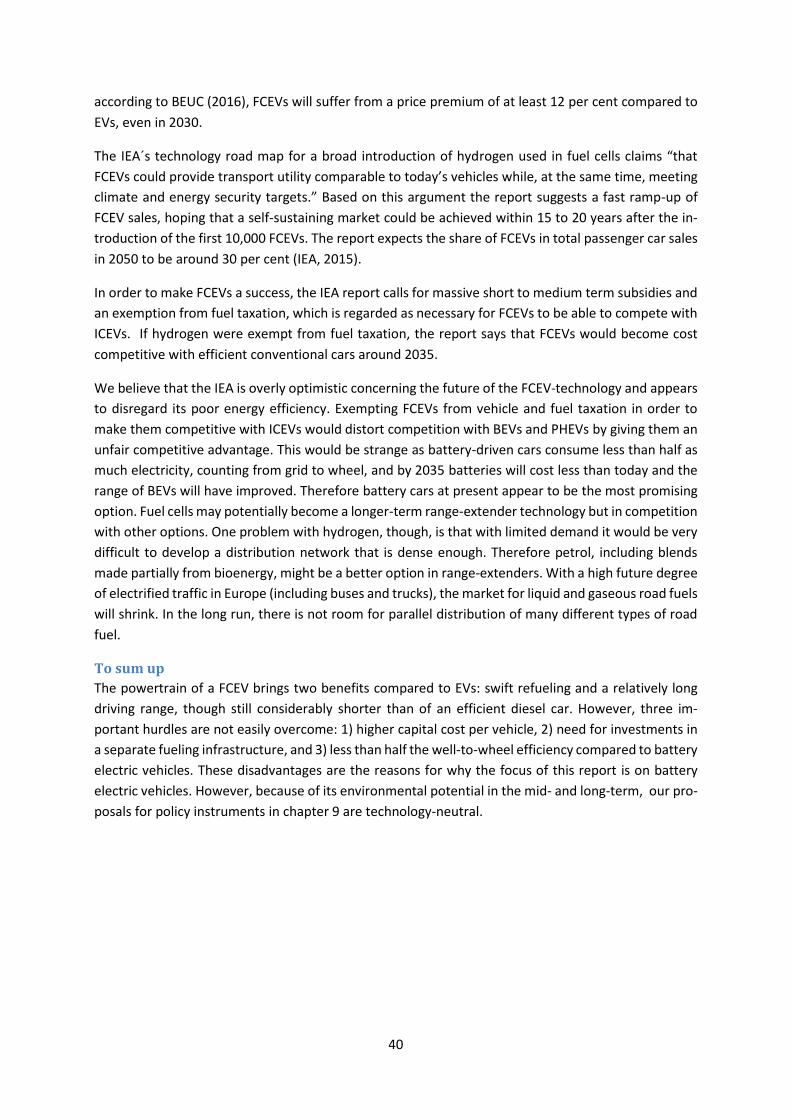
40
according to BEUC (2016), FCEVs will suffer from a price premium of at least 12 per cent compared to
EVs, even in 2030.
The IEA´s technology road map for a broad introduction of hydrogen used in fuel cells claims “that
FCEVs could provide transport utility comparable to today’s vehicles while, at the same time, meeting
climate and energy security targets.” Based on this argument the report suggests a fast ramp-up of
FCEV sales, hoping that a self-sustaining market could be achieved within 15 to 20 years after the in-
troduction of the first 10,000 FCEVs. The report expects the share of FCEVs in total passenger car sales
in 2050 to be around 30 per cent (IEA, 2015).
In order to make FCEVs a success, the IEA report calls for massive short to medium term subsidies and
an exemption from fuel taxation, which is regarded as necessary for FCEVs to be able to compete with
ICEVs. If hydrogen were exempt from fuel taxation, the report says that FCEVs would become cost
competitive with efficient conventional cars around 2035.
We believe that the IEA is overly optimistic concerning the future of the FCEV-technology and appears
to disregard its poor energy efficiency. Exempting FCEVs from vehicle and fuel taxation in order to
make them competitive with ICEVs would distort competition with BEVs and PHEVs by giving them an
unfair competitive advantage. This would be strange as battery-driven cars consume less than half as
much electricity, counting from grid to wheel, and by 2035 batteries will cost less than today and the
range of BEVs will have improved. Therefore battery cars at present appear to be the most promising
option. Fuel cells may potentially become a longer-term range-extender technology but in competition
with other options. One problem with hydrogen, though, is that with limited demand it would be very
difficult to develop a distribution network that is dense enough. Therefore petrol, including blends
made partially from bioenergy, might be a better option in range-extenders. With a high future degree
of electrified traffic in Europe (including buses and trucks), the market for liquid and gaseous road fuels
will shrink. In the long run, there is not room for parallel distribution of many different types of road
fuel.
To sum up
The powertrain of a FCEV brings two benefits compared to EVs: swift refueling and a relatively long
driving range, though still considerably shorter than of an efficient diesel car. However, three im-
portant hurdles are not easily overcome: 1) higher capital cost per vehicle, 2) need for investments in
a separate fueling infrastructure, and 3) less than half the well-to-wheel efficiency compared to battery
electric vehicles. These disadvantages are the reasons for why the focus of this report is on battery
electric vehicles. However, because of its environmental potential in the mid- and long-term, our pro-
posals for policy instruments in chapter 9 are technology-neutral.

41
6. ICE – a competing or complementary technology?
This report focuses on the prospects for, and implications of, rapid electrification of new vehicles in
Europe during the 2020s. However, electric vehicles will not be the only evolving powertrain technol-
ogy during this period. In this chapter we will briefly consider a competing, or possibly complementary,
technology: improved combustion engine vehicles.
Improved combustion engines – a competitor and an important complement
Our scenario of accelerated electrification where 50 per cent of new cars will be electrified in 2030
with an approximately equal split between BEVs and PHEVs means that internal combustion engines
will still power the majority of all vehicles sold. Therefore, their future development is of significant
importance. A well-known phenomenon in the history of technology is the so-called ´sailing-ship ef-
fect´ (Sushandoyo et al, 2012), where the emergence of a new technology triggers an accelerated de-
velopment of existing technologies to a level they never attained before the advent of the competitor.
The name derives from studies of sailing ship technologies after the introduction of steam engine-
vessels. These studies show that sailing ships improved during the entire 19th century but ultimately
could not match the regularity, speed and efficiency of their steam engine rivals. An important ques-
tion is whether the advent and spread of EVs will trigger a similar competition with ICEVs, which could
prolong the life of combustion engine cars for a considerable time.
In fact, since the introduction a decade ago of stricter regulations concerning GHG emissions (in Eu-
rope) and fuel efficiency (in the US), automakers have made great efforts to improve the efficiency of
combustion engines. However, this means that most low-hanging fruit has already been picked. Au-
tomakers have downsized the engines, from eight to six or four cylinders in North America, and from
six to four cylinders or four to three cylinders in Europe. They have introduced direct injection and
turbo charging, high compression injection systems and variable valve timing. Multi-speed transmis-
sions are increasingly common, starting with six-speed gearboxes, then seven-speed, and now also
eight- and nine-speed boxes. Dual clutch transmissions are replacing less fuel efficient conventional
automatics.49
More incremental improvements are possible: turbos can evolve into sequential turbo systems; ten-
to twelve-speed gearboxes might be introduced; cylinder deactivation systems for temporary down-
sizing have been available for several years and might come back50. However, all these additions tend
to add new complexity and cost, while only offering increasingly marginal improvements in efficiency.
An inherent weakness of combustion engines is the great loss of energy in the hot exhaust gases.
Technically there are several ways to recover part of these losses. One method is to take advantage of
the exhaust gases to produce steam in a so-called Rankine cycle and use the steam to generate elec-
tricity and relieve the generator. Another method is to add so-called thermo-electric generators which
49 Incremental improvements in ICE technologies are presented in ”Getting to 35.5 - The ABCs of mpg”, Automotive News, Jan 3, 2011. “3 is the new 4”, Automotive News, May 26, 2014. “1.2 litre turbo in Toyota´s new engine lineup”, Automotive News April 13, 2015. “Elektrisk turbo Så får man mer kräm och samtidigt sparar energi”, Teknikens Värld, July 7, 2016. 50 “VW Polo GT Snål som en diesel. Nya motorn använder två eller fyra cylindrar efter behov”, Teknikens Värld, Feb. 16, 2012.

42
use the temperature difference between their hot and cold sides to generate electric energy. Both
methods received lively attention around 2010-12.51 However, there seem to be very few if any imple-
mentations in standard vehicles, because of cost, complexity and problems with reliability and real
world performance.
More practical ways to improve combustion engines make use of small electric motors to drive various
accessory equipment, from fans and water pumps to power steering. Such small-scale electrification
eliminates the losses in traditional belt systems, which are running constantly irrespective of need.
However, the easiest changes have already been realized. Now, a German component specialist is of-
fering a so-called electronic clutch, or e-clutch, which makes it possible to put the engine in idle, or
switch it off entirely when running, a sort of stop-start in motion. Other firms propagate the use of a
48 voltage system to make vehicles able to recover more brake energy.52 The idea is controversial,
however, since such systems are insufficient to build full-scale regenerative braking systems. The
power released when braking a car at highway speed may be 30 kW or more, and to absorb this power
a high voltage system including battery is required, otherwise the copper wirings will melt down.
Thus internal combustion engines will continue to evolve. However, major improvements in efficiency
are becoming increasingly difficult to realize in pure ICE vehicles. In addition, after a decade of lax
implementation of emissions standards in the EU, more stringent standards and protocols are being
introduced. To satisfy these requirements further additions of equipment, costs and complexity will
be necessary, which will erode the competitive position of pure ICEVs.
However, combustion engines can be a complementary technology in electrified cars. This report as-
sumes that 50 per cent of EVs sold in 2030 will be plug-in hybrid vehicles, which combine an electric
motor and a combustion engine. Efficient PHEVs with batteries of 10-12 kWh will be capable of driving
electric for around 50 km. This covers the daily needs for a huge majority of users, and makes the
vehicles eligible for zero-emissions city zones. The limited battery size reduces the costs compared to
a BEV, and the combustion engine relieves the driver of range anxiety, which might still exist for smaller
EVs at the end of the 2020s. This also reduces the pressure on building large-scale battery plants, and
securing sufficient materials supply in the short term.
Dedicated development of plug-in hybrids makes significant efficiencies in the combustion engine pos-
sible. A classic optimization problem for engine developers is to combine high torque (power) at the
start and at highway speed without sacrificing efficiency. A plug-in car solves this problem. Here the
electric motor provides the torque needed at low and high speeds, and as a result the ICE can be de-
signed for its optimal number of revolutions. Thus “plug-in specific” engines, married to electric mo-
tors, might become considerably more efficient than today´s standard machines.
So far PHEVs have tended to be heavy conventional cars equipped with both powerful 2.0–2.5 liter
combustion engines and one or several added electric motors. An optimized, fuel-efficient plug-in
51 ”El från avgaser”, Teknikens Värld, June 20, 2012. 52 “Staples for a century, fan belts are slipping”, Automotive News Nov. 18, 2013; “Schaeffler touts fuel-saving e-clutch for manual gearboxes”, Automotive News, June 14, 2016; “The 48-volt jolt”, Automotive News, April 11, 2016; “48-volt hybrids challenge Europe´s diesels”, Automotive News, Feb. 13, 2017.

43
would need to be configured differently, combining a smaller 0.8–1.2 liter ICE dedicated for use in
PHEVs with an appropriately sized electric motor. To encourage such a development there is a need
for appropriately designed policies, as discussed in chapter 9. If PHEVs evolve in this way, they may
become an important part of the electrification process for decades to come, and ICEs will then be a
complementary rather than a competing technology.
To sum up
Internal combustion engines have improved significantly in terms of efficiency, emissions and specific
power since the early 2000s. They will continue to evolve but new steps tend to add more cost and
complexity without offering more than marginal improvements. However, internal combustion en-
gines may become significantly more efficient if they are developed specifically for plug-in hybrids.
Here the electric motor provides the torque needed when starting and at high speeds. The ICE can be
kept small and optimized for working at its most efficient number of revolutions. Such a development
would make optimized ICEs an important complement during the electrification process, but will prob-
ably need appropriate policy design in order to be realized.

44

45
7. Large-scale electrification – the environmental impact
A key policy motive for accelerating the introduction of EVs is related to their capacity to reduce emis-
sions, both noxious local emissions (NOx, soot) and greenhouse gases. The zero tailpipe emissions of
electric vehicles are obvious. However, the impact of driving an EV on greenhouse gas emissions de-
pends on how the electricity is generated and differs over the day and time of the year depending on
which power plants are used to meet additional demand. These emissions may vary greatly across
nations and over time.
An interesting effect of further electrification in EU28 is that the carbon emissions caused by road
traffic are shifted away from the non-trading sector, for which each member state is responsible ac-
cording to the Effort-Sharing Decision (ESD), to plants that are subject to the cap of the European
Emissions Trading Scheme (EU ETS). The average European electricity mix has decarbonized consider-
ably since the introduction of the ETS and this process will continue as the cap is lowered further. As a
result of shifting from road fuels to electric propulsion, emissions from the non-trading sectors may
diminish without causing any medium or long-term increase of emissions from plants in the trading
sector. The price of European emission allowances, however, will be affected by growing demand for
electricity, as explained in more detail in chapter 8.
Increasing relative role of the production phase
A transition to electric vehicles changes the relative shares of the production and use phases of the
energy consumed during a vehicle´s life cycle. Due to the superior operating efficiency of electrical
powertrains, energy consumption and GHG-emissions in the use phase decline, and the production
phase attains a higher relative share. For a conventional car, it is estimated that 15 per cent of the total
energy consumed during the vehicle´s life-cycle is used in the production phase. For electric vehicles,
the share of the energy consumed, and emissions produced, during the production phase could be
much higher (Hacker et al, 2009). The amount of energy used is strongly dependent on the efficiency
of the battery plant, and the amount of emissions also depends on the fossil share in the electricity
mix needed to run the plant.
The energy intensity of Li-ion battery production has been discussed for a number of years, and many
studies have been published, including several meta-studies. In one recent meta-study, Romare and
Dahllöf (2017) observe that a few empirical studies are often used as a basis for other studies, and
moreover that several of these are dated between 2006 and 2010, before Li-ion battery production
for EVs started to take off. A recurrent problem seems to be the difficulty to get access to primary data
from the battery industry.
Two papers, by Ellingsen et al (2014) and Kim et al (2016), belong to the minority which uses studies
of real battery plants. The Kim team studied the energy consumed for producing 24 kWh battery cells
for the Ford Focus. The Ellingsen study noted wide swings in energy consumption during the study. In
a re-analysis, researchers at Argonne Laboratories observed that the studied battery plant operated at
only one-third of its capacity, and argue that if such plants produce at optimal capacity, they can reduce
their energy consumption by 50 per cent or more (Dunn et al, 2015, p165). These results are explained
by the fact that crucial steps in battery production are volume independent. The drying equipment,
for example, consumes the same energy irrespective of the flow of materials.

46
In their meta-study Romare and Dahllöf (2017) try to summarize the results of a variety of studies
which use very different methods. On this basis they estimate that the most likely value for greenhouse
gas emissions generated in the battery production process (cell production plus pack assembly) are in
the range of 70–110 kg CO2 equivalents/kWh. The results are highly dependent on the amount of fossil
fuels used to generate the required electricity. The estimates reported by Romare and Dahllöf (2017)
build on an average fossil share of 50–70 per cent in the electricity mix. The study of battery production
by Kim et al (2016) was based on cell production in Korea and calculated the greenhouse gas emissions
related to battery cells to be approximately 64 kg CO2 equivalents per kWh. In Korea, power generation
is mainly based on fossil fuel with an emission intensity of 540g CO2 per generated kWh of electricity
(Korea, 2016). This can be compared with the 276 g CO2 emitted in the production of one kWh electric
power in Europe in 2014 (European Environment Agency, 2016). Thus, if the same cells were produced
in the EU, the emissions per kWh would stand at approximately 33 kg CO2/km.
The energy used for producing a specific EV is also related to the size of its battery pack – “the scaling
seems largely linear with current manufacturing data” (Romare and Dahllöf, 2017, p39). Thus a 100
kWh pack would take 2.5 times more energy to produce than a 40 kWh battery pack. Tesla has been a
trailblazer for electric vehicles, but from a lifecycle perspective its energy credentials are strongly re-
lated to the emissions generated during the production of its batteries, which in turn, are related both
to the efficiency of the plant and the energy mix used to feed its production processes.
Emissions during material extraction and the role of recycling
In addition to the GHG emissions resulting from the energy used to make batteries, the extraction of
crucial materials constitutes a source of several types of emissions. The main form of lithium extraction
starts with solar-driven open-sky evaporation and does not include any smelting with concomitant
discharges of harmful gases. The extraction of nickel, cobalt and copper, however, generates signifi-
cant emissions of both GHG and sulphur oxides (SOx), especially in the smelting and refining processes.
As noted above, major nickel and cobalt smelters and refineries are located in Europe, which means
that European regulation determines their emission levels. Several research groups have highlighted
the potential for reducing both GHG and SOx emissions by expanding the coverage and efficiency of
recycling. During a phase of rapid production expansion, exploitation of virgin resources will be
needed, but when the industry approaches maturity, recycling should become a key part of the mate-
rials supply, as discussed in chapter 3, and this will have a significant impact on lifecycle emissions.
According to the EU’s End-of-Life Vehicles Directive (ELV), 85 per cent of vehicles are supposed to be
reused or the materials recycled. The implication for batteries is regulated in the Battery Directive (BD),
first adopted in 2006, according to which the producer putting the battery on the market has the fol-
lowing responsibilities: to collect 95 per cent of used batteries, recycle 50 per cent of the total weight
of the collected batteries, and report this to the relevant authority. The detailed measurement and
interpretation of this target is not clear, however. According to Umicore, a leading materials and recy-
cling company within the EU, the recycling targets for Li-ion and NiMH batteries may be accomplished

47
without recycling any critical elements: “This target was set in 2006 for a broad range of battery chem-
istries without knowing the importance of Li-ion and NiMH ten years later.”53 The directive is now in a
re-evaluation phase, with planned completion in late 2017.54
Currently, a major part of the 50 per cent target is accomplished when a first-level recycler company,
for example Stena Metal in Sweden, discharges and dissembles the battery pack, separating the cells,
the electronics and the structural materials (mainly steel and aluminum). Structural metals and elec-
tronics are processed in separate recovery chains. The cells are sent to a recovery specialist, such as
Umicore, but only if they contain valuable metals such as cobalt and nickel. Otherwise they are incin-
erated (so-called energy recovery). Umicore uses a pyro-metallurgical process, which is the only indus-
trial scale process currently in operation in Europe, to recover high-value metals and burn graphite
(coal) and plastics.
The advantages of this process, according to Umicore, are the restricted use of chemicals and the ro-
bustness of the process which “accepts all actually known battery chemistries, [and has] flexibility to
adapt to new [chemistries].55” However, a serious limitation is that the metals are recovered in their
elemental stage, which only reflects a small portion of their value in the battery cells, where they are
combined with other elements in extremely pure, ´battery-grade´, compounds. Lithium is not recov-
ered at all but is part of a residual slag (Thyabat et al, 2013), which may be used as a substitute for filler
in cement (Romare and Dahlöf, 2017) or used in stone wool or ceramics. A serious aspect from a long-
term perspective is that this residual lithium is very difficult to recover even when new recycling pro-
cesses are developed.
Overall, the pyro-metallurgical process results in 30-40 per cent GHG savings and eliminates the SOx
emissions generated in the extraction of virgin copper, cobalt or nickel. A detailed study of the recovery
and re-introduction of cobalt and nickel into the production of LMO-batteries (Lithium Manganese
Oxide) found that the recycling scenario resulted in a 50 per cent saving of natural resources consump-
tion (Dewulf et al, 2010). There is a rapidly growing body of research on more sophisticated recycling
processes, which include the recovery of lithium. According to Zheng et al (2013), the yearly number
of publications (papers and patents) regarding spent LiB recycling increased from five in 2001 to 50 in
2011, and this growth continues.
In an analysis of the recycling of energy-dense batteries, such as NMC and NCA, Dunn et al (2015)
distinguished between three alternatives: 1) the pyro-metallurgical process industrialized by compa-
nies such as the Belgian-based Umicore, 2) an intermediate process combining mechanical separation
and purification, and 3) a so-called direct process. Several variations and combinations of these alter-
natives have been developed, for example the use of ultrasonic cleaning to separate cathode materials
from their aluminum-foil substrates (He et al, 2015) and other improvements of the hydro-metallurgi-
cal process (Gao et al, 2017). So far, however, these alternatives have only been developed at labora-
tory scale (Zheng et al, 2013). According to Umicore, the alternative processes tend to be dedicated
to well-defined battery types, consume less energy but more chemicals, and may be entirely unsuitable
for future battery types.
53 ”Umicore´s experience with industrial Li-ion batteries”, EuroBat AGM & Forum, Brussels, June 6, 2014. 54 ”Roadmap for evaluation of the EU BD 2006/66/EC”. 55 “Strategic choices for Battery recycling”, Jan Tytgat, Umicore.

48
Current industrial experience of recycling vehicle batteries is mainly limited to NiMH batteries used in
Toyota´s hybrid vehicles. The absence of lithium recovery is explained by several factors – the low price
of virgin material, the marginal lithium content in the batteries, the very limited supply of large-scale
batteries for recycling purposes, and the need for process adaptations.
A Swedish recycling company, Stena Metals, explains in an interview56: “We need to ask for customer
payment in order to take care of Li-ion batteries since the metal content we can recover, mainly copper
in wiring and contacts, is of such a low value. We also need to pay the firms at the next step in the
chain, for example Umicore, who decompose the cells and recover the metals.” Within a few years,
Stena Metals plans to build a pilot line for a more complete but still small-scale disassembly and recov-
ery process: “When there are sufficient volumes and stricter battery directives demanding lithium re-
cycling, we will have a lot of university projects to build on!”
A more substantial recycling market for lithium is unlikely to emerge for at least 10 years until signifi-
cant volumes of Li-ion batteries start to reach the end of their useful life in automobiles (Gaines &
Nelson, 2010; Pehlken et al, 2017). This could happen around 2025, but is also dependent on critical
improvements in current recycling technologies in order to produce Li-carbonate with the right purity
grade.57
The management of lead-acid batteries, 99 per cent of which are recycled in the G7 nations, represents
an ambitious reference model for the proponents of Li-ion recovery. This high level of recycling is sup-
ported by regulations which make it illegal to dump these batteries. Even more importantly, there is a
clear business case. As a result, recycling of lead-acid batteries is organized in large-scale processes in
both America and the EU. One example is the Boliden Bergsöe plant in southern Sweden which recov-
ers lead from four million automotive lead-acid batteries annually.
The recycling of lithium batteries is far more difficult because of their varied and constantly evolving
chemistries and packaging formats, and the absence of one dominant commercially valuable mineral
(Patel & Gaines, 2016). Increases in the price of virgin metals, a growing supply of used batteries and
focused R&D in process development and in recycling-friendly battery designs are probably needed to
support comprehensive recycling and open up markets for recycled materials. According to industry
specialists, lithium may be recovered today in a hydro-metallurgical process, but if the goal is to pro-
duce a compound of the purity level needed for reuse in battery cell manufacturing the costs are high.
Mass producing plants for the first steps in the recovery process – discharge and disassembly, including
solvent separation, plus separation of so-called blackmass (cathode and anode materials and the elec-
trolyte) from plastics, aluminum and copper foils – may be built in two or three years. The lead-time
for constructing high-volume plants for the next step – involving comprehensive recovery of the key
components of the blackmass, such as lithium, cobalt and nickel – is today unknown, since there are
no verified industrial processes which can be used58.
56 Interview B. Hall, Stena Metall, May 15, 2017. 57 Interview K. Edström, April 13, 2017. 58 Christer Forsgren, Stena Metals, pers. comm., June 22, August 18 and 21, 2017.

49
To avoid lock-ins to processes which recover some high-value metals at the expense of generating slag,
where lithium will be very difficult to recover in the future, specific EU directives are needed. A first
step could be that EU requires accreditation of recovery specialists with verified processes for storing
lithium remains productively, i.e. in a recoverable substrate, and the design of a system to compensate
these companies for taking care of such storage for 5–10 years. The next step for the EU would be to
require comprehensive levels of recycling of all Li-ion battery metals according to verified processes.
Such an expanded requirement should probably be implemented around 2026-27. Public R&D support
for industry-scale recycling would encourage such developments.
To sum up
Electric vehicles are vastly superior to internal combustion vehicles in terms emissions during the op-
eration cycle. However, the production of their Li-ion batteries is a highly energy-intensive process,
which may generate significant greenhouse gas emissions before the electrical vehicle is used on the
roads. To reduce these emissions three factors are important: 1) to operate the battery plants in their
most efficient mode, which implies high capacity utilization; 2) to locate battery plants in regions with
a low fossil share in their electricity mix; and 3) to counteract the risk that declining battery costs are
used to build increasingly large batteries, without considering the GHG footprint.
To maximize the benefits of electrification, a transition to EVs needs to be accompanied by a systematic
phase-out of fossil fuels in the electricity system, tax policies which discourage the diffusion of over-
sized (i.e. energy intensive) battery pack, and a location of cell plants to regions with minimal fossil use
in their power supply. Increasingly ambitious requirements regarding recycling of battery minerals,
including lithium, will also be needed. It is important in the short-term to avoid the waste of lithium in
a non-recoverable slagheap format. EU directives regarding the productive storage of lithium from
used batteries are needed at the present stage, as well as an accreditation system for comprehensive
and sustainable materials recycling in the second half of the 2020s.

50

51
8. Power supply issues As noted in the introduction, at least 80 per cent of the 2050 car stock must consist of zero emission
vehicles to allow EU28 to honor its long-term climate commitment. To make this happen, BEVs and
PHEVs (with a considerable range in e-mode) should make up around 50 per cent of new sales by 2030.
This chapter discusses different issues and challenges connected to supplying these vehicles with elec-
tricity.
A long-term scenario
The longer term impact of road transport electrification on the overall demand for power can be cal-
culated based on assumptions concerning population growth, car ownership, annual average mileage
and specific electricity consumption in BEVs and PHEVs. We assume that the population of EU28 will
increase by 5 per cent between 2015 and 2030 and by a further 7 per cent until 2050. This will result
in 534 million inhabitants in 2030 and 571 million by 2050.
In 2014 there were on average 498 cars per 1,000 inhabitants in the EU, which may be compared with
462 in 2005.59 The increase, however, is to large extent a result of rising car ownership in the member
states that joined in 2004 or later. The trend is rather flat in countries such as Germany, the UK, France
and Spain, while still rising at considerable speed in Finland, Denmark, Austria and the Netherlands.
It is extremely difficult to predict the size of the future fleet. Saturation (“peak car”) will probably hap-
pen in the richer countries, while economic growth may cause ownership to continue to rise in less
developed member states. For the sake of our calculations of electricity demand, we assume that the
average number of cars per 1,000 people will increase to 550 in 2030 and stay at approximately the
same level throughout the 2030s and 2040s.
The annual average mileage of the cars may rise as an effect of reduced running costs, but this may
partially or fully be balanced by factors working in the opposite direction (e.g. fewer long-distance
trips, more households having more than one car, and greater use of bikes and public transport). We
therefore suppose that the average mileage per car stays at today´s level, i.e. approximately 13,000
km per year (but with large differences in mileage between new and old cars).60
Power requirements by 2050
Finally, we assume that the electricity consumed per vehicle-kilometer in real traffic in 2050 will on
average be 0.17 kWh (average for BEVs and for PHEVs when driven in electric mode). To this consump-
tion one must add the electricity lost during charging and the loss of battery power which occurs when
the vehicle is parked (battery discharges), which we assume will add approximately 0.03 kWh when
divided per vehicle km. Total average demand would then be 0.20 kWh per km.
We assume that the total fleet of 314 million cars61 in 2050 will consist of 20 per cent ICEV, 40 per cent
BEV and 40 per cent PHEV. There will thus be 126 million BEVs on the roads and 126 million PHEVs. If
70 per cent of the annual mileage of PHEVs at this time is assumed to be in electric mode, the total
59 http://www.acea.be/statistics/tag/category/passenger-car-fleet-per-capita 60 https://www.adac.de/_mmm/pdf/fi_nutzen_pkw-verkehrs_europa_faltblatt_englisch_1115_238337.pdf 61 ((571 x 550)/1000) = 314 Million.

52
annual demand for plug-in electricity by cars in 2050 would be 557 TWh.62 This means that charging of
electric cars in 2050 will add new demand equal to 18.6 per cent of current consumption of electricity
in EU28 (which was on average approximately 3,000 TWh per year in 2011-15). We have for the sake
of simplicity in our calculation disregarded the fact that new cars will be used more frequently and for
longer annual distances than old cars. This means underestimating the true demand for electricity
somewhat, but when electric vehicles make up 80 per cent of the road vehicle fleet this is of minor
importance.
Total demand for electricity in other sectors is less likely to rise. Technological innovation and a greater
focus on efficiency in the use of electricity may instead result in shrinking demand. Consumption of
electricity in EU28 has declined somewhat in recent years despite a growing population and a rising
per capita income.
Adding 557 TWh per year (all else being equal) translates into an average extra consumption of 975
kWh per capita. This may be compared with the average per capita electricity consumption in EU28
which was 5,909 kWh in 2014.63 There were, however, large differences across countries. Finland and
Sweden used respectively 15,250 and 13,480 kWh per person as a consequence of harboring lots of
electricity-intensive industries and using various forms of electric heating in most single-family houses.
The lowest per capita consumption took place in central and eastern Europe, where Croatia, Hungary,
Latvia, Lithuania, Poland and Romania all used less than 4,000 kWh per person. All the big four, Ger-
many, France, Italy and the UK, consumed between 5,000 and 7,000 kWh per capita. Accommodating
vehicle charging will be easier in countries that to a large extent rely on electricity for heating of homes
as the local grids in such cases have been designed for the relatively high loads that temporarily occur
during cold winter days.
The power needed for a major shift to electric vehicles has previously been assessed by Oeko-Institut
et al (2016) in a study commissioned by the EEA. They explored the long-term impacts of greater elec-
tric vehicle use upon the energy systems of EU28 in two scenarios:
The EV-high scenario assumes 80 per cent electric cars in the passenger car stock in 2050, of
which 80 per cent are BEVs and the remaining 20 per cent PHEVs.
The EV-mid scenario assumes a 50 per cent electric share in the passenger car stock of 2050
split 60/40 between BEVs and PHEVs.
The assumed market penetration of electric vehicles in these two scenarios is a great deal higher com-
pared to the European Commission´s reference projection for 2050 (Capros et al, 2013), which pre-
sumes that only 8 per cent of Europe’s car fleet will be electric.
Oeko-Institut et al calculated the additional electricity generation in EU28 required in the EV-high sce-
nario to be 9.5 per cent by 2050. The study is based on the assumptions in the EU reference scenario
with regard to population increase, car fleets, and overall electricity demand (increasing by 0.5% an-
nually until 2030 and 1% thereafter, reaching 4,130 TWh in 2050). The authors have calculated that
the total annual generation for electric cars in 2050 will amount to 448 TWh in the EV-high penetration
scenario. They do not reveal any details concerning annual mileage per car or the electricity consumed
62 (126 x 13,000 x 0.20) + (126 x 13,000 x 0.20 x 0.7) = 556,920 GWh. 63 http://data.worldbank.org/indicator/EG.USE.ELEC.KH.PC

53
per km but the assumed demand appears to reflect a very low consumption per vehicle km (including
charging and battery losses). By comparison, ECF (2010) calculates that a complete electrification of all
cars in 2050 (80% BEV, 20% PHEV) would require 740 TWh.
Power requirements by 2030
Taking the average life expectancy of new vehicles into account, achieving a fleet in 2050 that is 80 per
cent electric would require around 50 per cent of new sales in 2030 to be BEV or PHEV, and in order
to achieve such a share at least 20 per cent of new cars would have to be fully or partially electric
already by 2025 and around 4 per cent by 2020. This means that around 14 per cent of the car fleet in
2030 would be electric (more than 40 million vehicles). Given that new vehicles are driven longer an-
nual distances than older vehicles and assuming a 50/50 split between BEV and PHEV, the additional
demand for electricity in EU28 caused by cars would be around 118 TWh in 2030.64 This would equal a
little less than 4 per cent of total expected electricity demand.65
In their assessment, Oeko-Institut et al (2016) assume in the EV-high scenario that cars would account
for 4-5 per cent of overall electricity demand in Europe in 2030 based on the assumption that EVs at
this time would make up 30 per cent of the stock.66 To arrive at such a small share of overall demand,
the authors must have assumed a very low demand per vehicle km. They claim that the additional
demand will not significantly influence the electricity system. We believe that whether the extra de-
mand caused by plug-in vehicles would put power production and grids under stress is a question that
cannot be answered without close examination.
Oeko-Institut et al (2016), however, recognize that the load will differ over day and night and that most
of the charging would take place during evenings and nights. With references to numerous studies (see
section II of their study for further information), they believe that there is no cause to foresee any
relevant impact on the national transmission grid level. They admit, however, that the power require-
ments of electric vehicles can be expected to put local distribution grids under stress. Such problems
may occur relatively early as electric vehicle charging develops in urban and suburban environments,
among a rather homogenous owner group, and occurs most likely after work during the evening when
demand for electricity is already high. As local grids may not be designed for this type and intensity of
load, electric vehicles could bring them to their technical limits. Slow charging puts less stress on local
grids as the load is more evenly distributed over a longer period compared to fast charging.
Distribution grids and network capacities vary greatly within Europe. While countries with highly de-
veloped grids (e.g. Netherlands, Germany, and the Nordic countries) will be better capable of handling
the additional consumption, countries with less developed grids (e.g. Poland, Hungary, Estonia, and
Lithuania) are more prone to technical failures. However, based on current EV development trends the
latter will probably not be among the forerunners in electric vehicle market penetration. According to
Oeko-Institut et al (2016), the relevant question is how countries with intermediate energy systems
(e.g. UK, Spain, and Italy) and expected earlier uptake of electric vehicles will cope with the network
challenges.
64 We assume an average specific electricity consumption in 2030 of 0.21 kWh per vkm (including battery losses) and that 60% of the PHEV annual mileage at this time is in E-mode. As the average age of the EV fleet is very low we assume the average annual mileage to be 17,000 km in 2030. 65 With a significant share of FCEVs demand would be a great deal higher. 66 This is twice the rate assumed by us and would require a much faster early up-take.

54
Need for smart charging strategies
Research in Germany and the UK indicates that even in countries with relatively well-developed local
grids, management of charging might be needed in the medium-term in order to respect technical
restrictions and avoid causing voltage drops and thermal limit violations (several studies cited by Oeko-
Institut et al). This could be done by developing smart charging strategies that make use of the availa-
ble flexibility among vehicle owners. Making people delay charging a few hours to avoid coinciding
with peak demand in the afternoon and early evening is one obvious possibility. Additional flexibility
will occur if charging can take place both at home and at the workplace.
Management of charging cannot be done without the support of vehicle owners who must be willing
to give up some of the freedom to charge at any desired time. Financial incentives and flexible tariffs
will be needed, and it may turn out that most car owners will put a high value of having access to fully
charged batteries at any time when they anticipate potentially having a need for the vehicle.
Currently most European countries have a power production over-capacity during the night, which is
caused by the dominating role of fossil-fueled power plants and/or nuclear reactors. This pattern,
though, can be expected to change rather rapidly when coal is being phased out for climate and eco-
nomic reasons and reactors are being decommissioned due to high age or deliberate government pol-
icy. When production in these plants is being replaced by intermittent types of power production, such
as wind and solar power, output capacity may coincide with vehicle electricity demand to a lesser de-
gree. For countries with highly fluctuating renewable electricity supplies the new situation may be-
come a major challenge. With increasing contributions from solar power, charging during day-time will
become highly relevant in some electricity markets.
Effect on carbon emissions and the EU ETS
An 80 per cent share of electric vehicles in the 2050 car fleet will substantially reduce emissions of air
pollutants and carbon dioxide without causing carbon emissions from power production to rise. This
is explained by the fact that CO2 emissions from power plants are subject to the cap of the European
Emissions Trading Scheme (EU ETS) which is currently being lowered by 38 million tons (1.74%) per
year. The average amount of CO2 emitted per kWh produced shrunk from 348 g in 2005 to 276 g by
2014.67 A proposal from the European Commission to raise the annual reduction to 48 million tons
(2.2%) between 2020 and 2030 has been approved by both governments and the European Parliament.
Based on the new rules, no further emissions will take place after 2057 provided that no emission
allowances have been banked by the participants for later use. “Banking” is allowed but does not alter
the total European volume of allowances, the permitted “emission bubble”.
Assuming that the EU ETS remains in place, and there is currently no sign of it being abolished or re-
placed, a growing demand for electricity cannot result in higher emissions, though it will, all else being
equal, drive the price of CO2 emission allowances upwards. Oeko-Institut et al (2016) do not trust that
the ETS will function as intended and have therefore calculated the additional emissions of CO2 that
may be caused by a shift to electric propulsion. They refer to existing criticism regarding the effective-
ness of the ETS based on the fact that over-supply of allowances has led to very low carbon prices.
However, they do not attempt to analyze why this has been the case.
67 https://www.eea.europa.eu/data-and-maps/indicators/overview-of-the-electricity-production-2/assessment

55
The EU Emissions Trading Scheme (EU ETS)
The current stock of unused emission allowances and the prolonged low market price in the EU ETS
has been caused by five factors that have worked in the same direction;
- The initial cap was set too high (after intensive lobbying from those affected).
- The economic downturn that followed from the financial crises depressed industrial produc-
tion and resulted in less need for allowances.
- Picking of “low-hanging fruit” provided inexpensive means for reducing emissions and thereby
demand for allowances.
- The ETS system initially provided affected industries an opportunity to substitute emission
credits from projects in developing countries for ETS allowances, which proved to be cheaper.
The permissible use of such credits, however, was limited to 1.6 billion (each worth 1 ton of
CO2).
- Extensive subsidies to investment in renewable electricity production have prevented the in-
cremental cost of such plants to affect the price of emission allowances.
Four of the five factors mentioned above will have limited or no effect on the price formation beyond
2020. The effects of the financial crises and the initial over-supply will gradually diminish when the cap
is further reduced and the bank of old allowances is consumed. Use of emission credits will not be
allowed post-2020, and when most “low-hanging fruit” have been picked, the companies affected by
the cap will have to turn to more expensive means for reducing their emissions further.
The only long-term threat to an undistorted price formation is the existence of subsidies to fossil-free
power production. It is therefore essential that, when grants or exemptions from taxes are used to
promote early market penetration of new energy technologies, the support is only temporary. If an
abundant use of state aid is allowed to hold back the price of emission allowances, Europe will find
itself in a situation where essentially no measure to reduce emissions can be utilized without being
subsidized. This is what economists refer to as a “lock-in effect” when subsidies to favored technolo-
gies prevent competing solutions from being developed and used.
To depress emissions far enough, Europe may as a last resort have to contemplate using Carbon Cap-
ture and Storage (CCS). This might bring the marginal abatement cost to levels above €40 per ton of
CO2 (ZEP, 2011, Global CCS Institute, 2015), which is around eight times the current price of emission
allowances. It is therefore essential that the market price starts picking up relatively soon in order to
avoid a steep increase in the future that would perhaps be so drastic that it makes politicians consider
reducing the tempo by which the cap is lowered. This is the only political risk that we have been able
to identify that may harm the future functioning of the ETS.
A sensitivity analysis
The amount of electricity required for moving electric cars depends on the size of the fleet, average
annual mileage, specific consumption (electricity per km), battery losses and the split between BEVs
and PHEVs. Alternative assumptions concerning mileage and specific consumption may each increase
or reduce demand for electricity by around 10 per cent. The growth of the fleet and how it is divided
between BEVs and PHEVs play a greater role. In our calculations we have assumed the split to be 50/50.
If the entire new EV fleet was made up of BEVs, demand for vehicle electricity would increase by ap-
proximately 25 per cent.

56
In the less likely case that fuel-cells will represent a substantial proportion of the electric vehicle fleet
in 2050, demand for electricity will rise considerably when electrolysis is used for producing the hydro-
gen needed. If, in the scenario presented above, FCEVs were to make up a quarter of all EVs, demand
would increase considerably and bring the total amount of electricity used directly or indirectly for
propelling cars to something in the order of 750 TWh in 2050. This figure amounts to 25 per cent of
current demand for electricity in EU28. For reasons explained in chapter 5 we believe that a high share
of FCEVs is unlikely to materialize.
In the context of rising power demand it should be recalled that, besides passenger cars, light duty
vehicles and some buses and heavy trucks will also use electricity.
The lead-times for adding new capacity
In a normal situation adding around 15 per cent new capacity to the grid over a period of 30 years
would not be very challenging. What makes the current situation problematic is that the need for add-
ing new capacity coincides with the need to replace a large number of existing power plants in the near
future and to equip some of them with CCS. In this context even the marginal effect of having to add
4-5 per cent additional capacity by 2030 for charging vehicles may turn out to be challenging.
In 2015, conventional thermal power plants accounted for 48 per cent of electricity production in EU28
and nuclear power for 27 per cent, the latter mostly delivered from reactors that due to old age will
be decommissioned within 10-20 years.
Among the 131 commercial reactors that were operating in EU28 in 2014 (or had a permit to operate)
86 began generating prior to 1985. A few have been decommissioned since 2014, and by 2030 at least
80 per cent of the remaining reactors will be 45 years or older. They were in most cases designed for
an operational life of 40 years. Some may have their life extended after approval based on upgrading
and/or replacement of parts that are particularly essential for the safe operation of the plants, but in
many cases this will probably prove too expensive. Germany has already taken a political decision to
decommission all nuclear reactors by 2022 (i.e. 9 reactors, some of them younger than the 86 men-
tioned above), and the new French government has stated its intention to reduce the country´s de-
pendence on nuclear power. At least half of the existing nuclear capacity might have been taken out
of production by 2030, and the current replacement rate is low. A few new reactors are under con-
struction in Europe but in most cases way behind schedule. Finland, Hungary, Poland, France and the
UK are contemplating additional new reactors, but they are as yet only in an early phase of planning.
Construction may take ten years after a final decision to build them. A conservative assumption is that
the contribution of nuclear power may fall from 27 per cent of annual output to around 15 per cent by
2030.
The EU ETS cap will be lowered by approximately 30 per cent between 2015 and 2030. In 2015, plants
for power and heat production made up 68 per cent of the CO2 emissions that were subject to the cap
(EEA, 2016). The reductions required may not become evenly distributed among all types of industrial
facilities concerned. It may for instance turn out to be less expensive to reduce emissions from the
chemical industry or refineries than from power plants. Where the latter are concerned it may be
cheaper to close coal-fired plants compared to shutting down power stations running on natural gas.
We have not been able to investigate this matter in any detail, but we assume that the lowering of the
cap means that at least 25 per cent of current fossil-fueled power production will either have to close
or become equipped with CCS. Trials with CCS are still in an early stage. To be on the safe side, it might

57
therefore be necessary to assume that 25 per cent of the current production in conventional thermal
power plants will have to be replaced by fossil-free power production by 2030.
In summary, this means that new capacity equal to around 45 per cent of current total power produc-
tion in EU28 will have to be created in the remaining 13 years until 2030, including the 4-5 per cent
needed for satisfying demand in road traffic.
Intermittent power production and need for new business models
Adding 5 per cent and replacing 40 per cent of current supply in 13 years is not impossible. Back in the
1960s, electricity production and consumption grew by 6-10 per cent per year in many countries, albeit
from lower levels. However, replacing large power plants that run more or less around the clock by a
huge number of small wind and solar power installations that produce during much fewer hours per
year is a different matter.
One advantage, though, is that the lead-time from investment decision to grid-connection is much
shorter for wind and solar power plants. But the fact that power from variable renewable energy
sources has to be balanced by other forms of production during periods when output falls short of
demand is a serious challenge. Another obstacle is that spot-market prices are low in times of over-
production. This affects the earning capacity of solar and wind power negatively as the price is low (or
sometimes even negative) during periods when a large share of their annual production takes place.
This may harm further investment if the expected average future price falls short of estimated produc-
tion cost (including investment).
One potential way of overcoming at least part of the profitability problem is to store electricity from
hours of over-capacity for use at times when demand is higher. Batteries will play a role in this context
but not necessarily of the type used in vehicles.
Electric vehicle batteries could potentially be used to store electricity and feed it back into the grid
when needed, a concept called “vehicle-to-grid” (V2G). However, various studies based on pilot pro-
jects and market simulations, referred to by Oeko-Institut et al (2016), conclude that the potential
benefits of V2G concepts are rather limited. One major constraint is that increasing the number of
charging cycles will lead to a faster degradation of batteries for which the owners will have to be com-
pensated. Another obstacle, not mentioned by Oeko-Institut et al, is that vehicle owners tend to ap-
preciate the enormous flexibility that having access to a private car brings them. Many of them may
not be willing to compromise this flexibility unless being greatly rewarded. For both reasons we agree
with Oeko-Institut et al that extensive use of electric vehicles as storage capacity is not likely to be
economically viable and that the potentially available storage capacity in electric vehicles would be
relatively limited compared to other storage technologies. However, the trend towards larger batteries
(80-100 kWh) may provide more room for using cars for storing grid electricity. It is a matter of devel-
oping business-models that are attractive to both car owners or fleet operators and utilities. In one
ongoing trial, car owners are offered the equivalent of $1,530 a year for feeding power into grids in
Europe.68 That appears to be a high price for storing electricity.
1. 68 https://www.bloomberg.com/news/articles/2017-08-11/parked-electric-cars-earn-1-530-feeding-
power-grids-in-europe

58
Investment in storage capacity will add to the cost of intermittent power production and affect the
future price of electricity. However, in the short term part of the balance problem can be met by mak-
ing optimal use of dispatchable power69 than can be used during periods of high demand. The condi-
tions in this respect vary greatly across Europe. Countries with large hydro power capacity are better
suited than those that currently rely heavily on coal and nuclear power. Extending the network of high-
voltage power transmission between regions and countries would be a supplementary way to iron out
imbalances caused by variable power production.
Considerable investment will thus also be needed in the grids of countries and regions where demand
for electricity could not be expected to increase much. Part of this is a consequence of adding large
amounts of non-dispatchable power production. In addition, the local distribution grids will have to be
strengthened in order to allow higher loads associated with vehicle charging. On top of this there is a
need for investing substantial amounts of capital in storage of electricity in order to balance fluctua-
tions in wind and solar power production.
One factor that needs to be taken into account when trying to assess the lead-times associated with
investment in new power production and new transmission lines is public resistance and the risk that
some projects will be delayed by appeals to higher courts.
Another factor that may make decision makers postpone investment is that the current strong supply
of electricity is holding back the wholesale price. Growing solar and wind power output is part of the
problem as the variable cost of production in these plants is close to zero and helps keep prices low in
times of over-capacity. In deregulated markets this makes investment in additional capacity risky.
There is an urgent need for new business models that can address this problem.
Prices, though, will start climbing when coal-fired power production becomes unprofitable due to the
lowering of the ETS cap, and when additional nuclear power stations are closed. This will result in
higher prices of emission allowances and better room for investment in intermittent power production
and facilities for energy storage. However, in a case when investment is postponed for too long, lack
of capacity may push wholesale prices upwards quite rapidly and depress demand. If so, this will also
affect the competitive position of electric vehicles.
Charging infrastructure
Availability of private and public charging infrastructure is a prerequisite for electric mobility. Several
studies show that in addition to reducing the purchasing cost of electric vehicles, the availability of
charging is a significant predictor of EV adoption rates (Sierzchula et al, 2014). Moreover, “living in a
place where a plug is easily accessible at home” (Hidrue et al, 2011), is especially important for increas-
ing the propensity to buy an EV. Next in importance is the availability of workplace charging, followed
by local public charging. All these forms tend to be of a slow-charging, low-power type.
In addition, there are several efforts to build high-power, fast-charging stations along highway net-
works intended to alleviate range anxiety and make EVs compatible with conventional vehicles in long-
69 Dispatchable generation refers to sources of electricity that can be dispatched at the request of power grid operators or of the plant owner; that is, generating plants that can be turned on or off, or can adjust their power output accordingly to an order.

59
distance driving. One example is the much-publicized Tesla campaign to install dedicated ´super-
chargers´ across North America and Europe.
The two types of charging infrastructure (technically referred to as EVSE: electric vehicle supply equip-
ment) are very different in terms of technology, cost, user need, and investing actors. Local EVSEs are
technically simple, inexpensive and easy to install in developed countries. The most common device is
a so-called Level 2-type, specified for 230V and a power maximum of 7.4 kW, which results in 4-8 hours
charging time for a full recharge of a battery. Level 2 stations build on the existing electricity grid and
use the EV´s internal charger with its AC/DC converter. The simplest type is a wall-mounted box and
cord used in home installations. Workplace and public EVSEs use the same technology, but often fitted
in more expensive pedestal units and also involve more installation expenses due to siting issues, aes-
thetic considerations, space constraints, etc. On the other hand, they are often of a dual-port type,
which permits the charging of two vehicles simultaneously or sequentially.
A simple home unit including installation tends to cost no more than €1,000 including installation,
according to various market sources.70 The hardware for workplace and public installations could cost
between $1,200 and $6,000, plus $3,000 to $4,000 per installation (DoE, 2015). A variety of actors are
investing in local charging systems, from private house owners and housing associations for home
charging, employers for workplace charging, and electric utilities and municipal authorities for public
charging installations. Compared to Li-ion batteries the technology is mature, but according to DoE
(2015) there is an industry consensus that hardware costs are declining due to increasing volumes and
levels of competition. For installation costs, however, it is more difficult to plot any trend.
Fast charging requires high-power stations of at least 22 kW, often much more, which make it possible
to recharge a battery in 20-30 minutes. These stations include their own AC/DC converters, control
units, high-power cables and protective systems. Moreover, fast chargers involve significant and highly
variable project costs for siting, construction, connection of power cables, etc. According to estimates
by DoE (2015), the cost per installation may vary from $14,000 to $91,000! The average cost in Sweden
is estimated by Power Circle at €50,000, i.e. 50 times more than a home charging unit, and at least 10
times more expensive than a well-designed local public station for slow charging.
Adding to the costs and complexity of fast chargers is the lack of a common standard with three in-
compatible systems competing outside China: the Japanese CHAdeMo, which is supported by Nissan,
Mitsubishi and Toyota; the CCS system propagated by most European, American and Korean vehicle
manufactures; and Tesla´s proprietary supercharger systems. Nevertheless, several corporate actors
are investing in fast charger networks to promote their vehicles. It started with Tesla´s initiative to
launch an infrastructure of high-powered (135 kW) superchargers as a way to extend the long-distance
capabilities and competitive position of its luxury sedans. At the end of 2016, this had resulted in al-
most 300 fast charging stations across Europe. As a response, an alliance of BMW, Daimler, Ford and
70 The June 2015 report from the EV connect project, Roadmap for the Deployment of the Electric Vehicle Charging Infrastructure, estimates the cost of a simple Level 2 station at €400 – 700, including installation. The executive of Power Circle, an interest group for the Swedish electric utility industry estimates the average cost of a low-voltage charging station at approximately €1,000 (interview May 5, 2017).

60
the Volkswagen Group launched an initiative in November 2016, promising to build a European net-
work of ultrafast chargers with 400 sites being the ´initial target´. Moreover, the new network would
operate at a higher power-level than previous networks, making the charging time even shorter71.
Several countries support the expansion of both local and long-distance charging infrastructures with
various subsidies. According to IEA (2016), the stock of publicly accessible charging units (i.e. not count-
ing private home chargers) has grown impressively and closely matched the growth of the global EV
stock. In 2015, Europe was home to 6,000 fast-charging stations and approximately 71,000 publicly
available slow chargers (IEA, 2016). France, Germany, Norway, Netherlands and Sweden were the most
active investors.
Norwegian experiences of charging
A recent survey among Norwegian owners of BEVs and PHEVs is particularly interesting in the context
of battery charging, as Norway has the highest rate of electric vehicle penetration in the world: more
than 100,000 cars on a population of 5.2 million. The Institute of Transport Economics asked 3,111 BEV
owners and 2,065 PHEV owners to respond to a questionnaire that, among a large number of issues,
covered how the vehicles are used and when and where charging takes place (Figenbaum and Kol-
benstvedt, 2016). 72
The survey shows that the average PHEV owner uses electric mode for 60 per cent of total kilometers
driven in summer and 53 per cent of distance driven in winter. The share of driving in e-mode declines
with increasing annual mileage for all PHEVs analyzed except for the Opel Ampera, which has a longer
range in e-mode than the other vehicles and allows much more of daily driving to be in e-mode as well
as a higher share of longer-distance trips.
Almost all owners charge their vehicles at home or in a nearby parking space. The survey shows that
59 per cent of BEV owners and 74 per cent of PHEV owners charge daily in these locations. A further
20 per cent of BEV owners and 15 per cent of PHEV owners do so 3-5 times a week. The high degree
of daily charging among PHEV owners indicates a desire to achieve a high e-mode share.
The peak period for initiating a normal charge at home is between 2 and 8pm and charging lasts for 3-
7 hours. The peak charge period is between 4 and 8pm in the summer and 4 and 11pm in the winter.
Charging at work is relatively common among Norwegian BEV owners: 28 per cent do it more than
twice a week, 38 per cent weekly. About 21 per cent of PHEV owners do it at least weekly. Data on
distances to work for PHEV owners suggests that approximately two-thirds can make a return trip in
e-mode without charging at work.
71 Lambert, F., “Five major automakers join forces to deploy 400 ultra-fast (350 kW) charging stations for elec-tric vehicles in Europe”, Electrek Nov. 29, 2016. The announcement of the new initiative referred to power lev-els of up to 350 kW, without specifying which battery types that would be able to tolerate such high-power charging with-
out implications for battery life time. 72 Despite a relatively low response rate, the researchers found the BEV sample to be mostly representative of
the total BEV fleet, apart from an overrepresentation of Tesla Model S, and the PHEV sample to be relatively
representative of private owners.

61
Norway has a dense network of chargers at public charging stations and shopping centers. Public low-
speed charging is used at least once per month by one third of BEV owners and by 8 per cent of PHEV
owners; 11 per cent of BEV owners use public low-speed chargers at least once a week.
In 2016, 8 per cent of the BEVs used fast public charging weekly and 29 per cent at least once per
month. The share of BEV owners that never use fast chargers was 30 per cent. Only 1 per cent of PHEV
owners use fast chargers, which is partly explained by the Mitsubishi Outlander being the only PHEV
capable of fast charging. The benefit of fast charging of PHEVs is small given the limited range in e-
mode and the large range of the ICE.
The share of fast charging
There is little information available on how charging is split between slow and fast charging in terms
of kWh per year. However, the Norwegian 2016 survey indicates that fast charging plays only a minor
role. The different BEV models used fast charging on average only 13-16 times a year (but 26 times for
Tesla owners). According to information from Erik Figenbaum,73 fast charging of BEVs (Teslas not in-
cluded) took place around 1.2 million times in 2016 with an average duration of around 20 minutes.
Assuming that each minute on average represents 0.7 kWh, fast charging resulted in transmission of
only around 200 kWh per BEV per year. The average total annual mileage of the fleet of BEVs was
estimated by Figenbaum and Kolbenstvedt (2016) to be around 15,500 km. Assuming that each BEV
vehicle km on average consumed 0.22 kWh (losses included), one might conclude that fast charging
represented less than 6 per cent of the total annual electricity demand (3,100 kWh) of an average BEV
(depending on model and duration of each charge), and next to nothing among PHEVs.
The above conclusion based on Norwegian experience is broadly in line with a rough estimate by the
Swedish Energy Agency that 80 to 90 per cent of all charging takes place at non-public charging stations
(Energimyndigheten, 2017). The American situation appears to be similar. Lin and Greene (2012) con-
clude that improvements in home charging would have a higher value than improvements in public
charging or charging at the workplace.
The increase in driving range offered by new EV models may result in more long-distance journeys,
and thus an increased interest in fast charger availability. However, driving range beyond 500 km,
which several automakers predict will be offered in many models around 2025, may operate in the
opposite direction as fast charging will be less needed for journeys over medium distances. Thus local
and residential charging will most probably maintain its dominant role. This means that the burden on
national and local budgets for providing support to public EV charging infrastructure will remain lim-
ited.
A possible conclusion might therefore be that fast charging will never make up more than a tiny frac-
tion of overall charging of electric vehicles. The price difference will make most BEV owners prefer
slow charging whenever possible. Unsubsidized fast public charging is at least three times more expen-
sive than slow charging at home.74 In Norway the price at fast public chargers is NOK 3 per minute75
which corresponds to NOK 4.29 per kWh (€0.46). As noted above, local chargers have the advantage
73 E-mail 19.4.2017 74 E-mail from Anders Lewald, the Swedish Energy Agency, 30.6.2017. 75 According to e-mail from Erik Figenbaum 19.4.2017 and his comment on our draft manuscript.

62
of using low-cost equipment with a falling cost trend, and also enjoy the involvement of a variety of
investing actors, private home owners, housing associations and municipalities.
To sum up
If electric vehicles make up 20 per cent of new sales in EU28 in 2025 and 50 per cent by 2030, around
14 per cent of the car fleet will be electric (BEV or PHEV) in 2030. The demand for electricity caused by
the electrification of cars would only add around 4 per cent to overall demand in 2030. This would not
be challenging under normal conditions but will now take place during a period when many of Europe´s
nuclear reactors will be decommissioned for political reasons or because of old age, while at the same
time a large share of the coal-fired power plants will either have to close or become equipped with
CCS in order meet climate change requirements. Scarcity and higher costs associated with renewable
power production and/or investment in CCS may push electricity prices upwards, in particular during
winters when the contribution of solar power will be limited.
Slow charging at home or close to home dominates battery charging. Fast public charging is unlikely
ever to account for more than around 5 per cent of total vehicle battery electricity demand. Priority
should therefore be given to developing the infrastructure for charging at home and at work places.
Local grids will need enforcement in countries with less developed grids.

63
9. Vehicle policy instruments and design issues
This part of the report is an assessment of policy instruments that can potentially be used for promot-
ing a rapid transition to zero-emission cars in the European Union.
One option for making a rapid electrification take place would be to continue to fight for stringent
requirements on traditional fuels and engines and argue in favor of attractive national and local incen-
tives for BEVs and PHEVs. The cost of such subsidies would, however, risk becoming a substantial bur-
den on government budgets unless financed by high taxes on traditional cars that reflect the social
costs of air pollution and urban noise, or unless battery costs fall fast enough to allow the grants to be
gradually reduced. The outcome of such a strategy is hard to predict.
Another way to ensure that a certain market penetration of BEVs and PHEVs takes place would be to
enforce a mandatory sales quota for such cars that gradually rises over the years. Such a strategy,
however, is associated with several difficulties, among them uncertainty regarding the size of the fu-
ture market of which the zero- or low-emission car quota forms a percentage. Resource scarcity may
be tricky to handle in such a scheme as it provides little flexibility.
However, a quota system may become necessary if policymakers in the EU want to be certain about
being able to prevent any new sales of traditional ICEVs post 2040. To make such a target realistic
would require EVs to make up a substantial part of the market already by 2030. The focus in this report
is therefore on how to design a common mandate that would make this happen.
As a background to our considerations concerning an optimal choice of instrument, we start by provid-
ing a brief overview of some instruments which have been used in recent years in the United States
and Europe.
California´s ZEV program
The Zero-Emission Vehicle (ZEV) program is a California state regulation that requires automakers to
sell electric cars and light trucks in numbers linked to the automaker’s overall sales within the
state. The program’s objective is to make the automotive industry develop and market electric vehi-
cles, which generate fewer global warming emissions than fossil-fuel-powered cars and do not produce
any tailpipe pollution.
The zero-emission mandate started in 1990 and has been modified several times over the years. The
program is managed by the California Air Resources Board (CARB) although in recent years it has also
been adopted by nine other states (Connecticut, Maine, Maryland, Massachusetts, New Jersey, New
York, Oregon, Rhode Island, and Vermont). Together the ten participating states account for more than
a quarter of US new-car registrations. California alone has more than 250,000 ZEVs on the road, which
account for about half of the total national number.
Under the regulation, three vehicle designs are considered “zero-emission,” though to varying degrees:
plug-in hybrid vehicles, battery electric vehicles, and hydrogen fuel cell vehicles. The program assigns
each automaker “ZEV credits” that stem from the company’s sales of electric cars and trucks. Each
manufacturer is required to maintain ZEV credits equal to a set percentage of non-electric sales. The
credit requirement is 4.5 per cent of sales in 2018, rising to 22 per cent in 2025.

64
The credit received per ZEV vehicle varies with powertrain type and electric range. From 2018 onwards,
plug-in hybrids will receive between 0.4 and 1.3 credits per vehicle sold. Battery electric and fuel cell
vehicles receive between 1 and 4 credits, based on range. For example, the Tesla Model S, with a range
of more than 200 miles, is eligible for 3.3 credits, while the 84-mile range Nissan Leaf receives 1.8 ZEV
credits per car sold. However, there are restrictions on the amount of credits that can come from plug-
in hybrid vehicles. Being equipped with both an electric motor and an internal combustion engine,
PHEVs are considered ‘transitional’ ZEVs and may in 2018 only account for 55 per cent of credits, mean-
ing that at least 45 per cent must originate from BEVs or FCEVs.
As most ZEV vehicles receive more than one credit per sale, the total number of such vehicles sold falls
well below the number of credits awarded. The all-electric range has gradually increased and resulted
in more credits, which means that it now takes fewer ZEVs to meet the standard than anticipated at
the time when the current rules were adopted.
Automakers can trade ZEV credits with each other. Tesla has produced and sold a significant number
of credits to traditional carmakers. Manufacturers are allowed to carry over excess credits from one
year to the next. “Banking”, as this practice is called, has grown substantially since 2012.
The rules currently in force were adopted in 2012 and predicted by CARB to lead to 15.4 per cent of
new cars being ZEVs in 2025. CARB´s Midterm Review indicates that the existing program in California
will add at least 1 million zero-emission vehicles on its roads and highways by 2025. PHEVs are pro-
jected to make up more than 60 per cent of all ZEVs on the road by 2025 (CARB, 2017).
However, according to a study commissioned by the Natural Resources Defense Council, the credit glut
is likely to make it possible for automakers to be able to fulfill their requirements with as little as 6 per
cent of their sales in 2025 consisting of electric vehicles (Shulock Consulting, 2016).
CARB´s midterm report says that approximately three million additional ZEVs and PHEVs will be needed
in 2026-30. To reach these volumes with any certainty, modifications of the regulation will be required
in order to provide a more direct connection between credits and vehicle volumes. However, according
to the report, for significant revisions to the regulation to be successful, it would require greater mar-
ket acceptance, more technology advancements, and lower technology costs than is known with cer-
tainty today. Given the uncertainties, the agency believes that a regulatory stability of the 2018-25
model year standards can best help ensure a continued path of increasing ZEV volumes.
European incentives
In 2009, the European Union introduced a regulation (443/2009) that required average new car CO2
emissions not to exceed 130g per km (measured on the NEDC test) in 2015. The current targets are 95
g/km for new cars in 2021 and 147g for new vans in 2020. No targets are yet in place beyond these.
The EU´s ambition to cut overall greenhouse gas emissions by at least 80 per cent between 1990 and
2050 will in the longer term require a significant contribution from ultralow carbon vehicles (ULCVs)
such as PHEVs, BEVs and FCEVs. In order to make a shift to such vehicles possible, the Commission has
recognized the need for an early deployment of ULCVs. To encourage ULCV development, the EU
therefore provides “super-credits” to new cars with emissions less than 50g CO2/km (NEDC). The sys-
tem allows manufacturers to count such vehicles multiple times in their calculation of average new
vehicle emissions to comply with the CO2 standard. The first super-credit scheme ran from 2012 to

65
2015, and additional use of super-credits will be allowed between 2020 and 2022. The system has been
criticized for effectively allowing average emissions from new vehicles to be higher than specified by
the standard. In addition its impact on ULCV sales has been insufficient as the share of such vehicles
only amounted to 1.24 per cent of new registrations in 2015.
The EU CO2 standard has been supplemented by numerous incentives in individual member states and
cities. Grants are offered to buyers of new electric vehicles in several countries, either in the form of
exemption from a national registration tax or as a lump sum. The value of such subsidies generally falls
within the range of €4,000 to €6,000 per BEV, while PHEVs are offered less and with the rate in most
cases dependent on the all-electric range of the vehicle. Some countries exempt EVs from annual cir-
culation tax. France offers a bonus to EVs under its CO₂-based bonus-malus car purchasing scheme —
previously up to €10,000 on BEVs, and currently set at €6,300 (Fergusson, 2016, ICCT, 2016a).
Besides national vehicle subsidies, numerous other incentives have been used to promote electric ve-
hicles. They include public procurement programs, access to low-emission city zones, access to bus
lanes, free or preferential parking, partial funding of charging infrastructure and home chargers, and
in some cases free public charging. In London, vehicles emitting 75g CO2 per km or less are exempt
from the city´s congestion charge. ICCT (2016a) provides a complete overview of the use of such sup-
plementary policy measures in six European countries in its report Comparison of Leading Electric Ve-
hicle Policy and Deployment in Europe.
Concessions on company car taxes are also used for the promotion of electric vehicles, and are often
of greater total value than subsidies offered to private car owners (Mock and Yang, 2014). Nine out of
ten EVs in the Netherlands have been registered by companies.
The Norwegian case is very special
Among the countries in ICCT´s comparison of European countries, Norway has by far the highest fiscal
incentives and the highest EV market shares. BEVs are exempted from the country´s very high regis-
tration tax and from Value Added Tax (25%). Taxes on company cars are also reduced for BEVs. In
addition to these fiscal subsidies, Norwegian BEV owners enjoy exemption from to road tolls, reduced
ferry rates for the vehicle, free parking, access to bus lanes, and until 2015 free charging at public
charging stations. In 2014 these additional incentives were estimated at approximately 16,000 kroner
(€1,915) per year for an electric vehicle owner (ICCT, 2016a). Most of them are financed from the state
budget, some are cross-subsidies among motorists and a few do not carry any direct cost (e.g. access
to bus lanes).
The Norwegians can afford such largesse. The government runs a large budget surplus and saves rev-
enues from the petroleum sector in the world’s largest sovereign wealth fund, valued at nearly $900
billion.76
Negative side-effects of current policies The policy instruments used for speeding-up the market penetration of EVs have not been without negative side-
effects. The biggest negative side effect of the EU´s EV incentives would be the hot air created through super credits – a multiplyer for each EV sold that OEMs benefit from when their CO2 average is calcu-lated. Element Energy (2016) finds that this causes annual losses of 31 million tons of CO2.
76 The Economist April 8th 2017, page 66.

66
Another major obstacle is that exempting electric cars from registration fees and annual road taxes in
several member states provides a much larger benefit to heavy and energy consuming electric vehicles
because in most countries they are subject to higher taxes than smaller and more efficient vehicles. As
a result, two large PHEV models made up 57 per cent of all EV sales in the Netherlands in 2014 because
of a flaw in the design of the tax incentive and use of EU super credits. The high share of large EVs in
the Netherlands and other EU member states is also linked to tax reductions for company cars, which
are on average a great deal larger and heavier than privately owned cars.
The shift from internal combustion engines to electric motors reduces substantially the variable costs
of driving. Less energy is needed and electricity is generally taxed a great deal less per unit of energy
than petrol and diesel. This causes a rebound effect as the diminishing cost of running the vehicle
results in more miles driven. In addition free charging at shopping malls and work places, as well as
exemption from congestion charges and parking fees in some cities, relieve owners of electric cars of
most of the remaining variable costs of driving. Such incentives may be worth considering in the first
phase in order to encourage people to become early adopters, but they clearly turn negative from an
overall environmental perspective if used for many years and extended to a large fleet. The same is
true for giving cars access to bus lanes. Figenbaum and Kolbenstvedt (2016) estimate the current re-
bound effect in Norway to be around 10 per cent.
In the next stage of electrifying road transport, it is clear that a different set of policy instruments and
incentives must be employed than during the first phase. An additional reason for this is that only a
little more than half of the EU member states levy registration taxes from which EVs can potentially be
exempted, and it is only in countries where such excise duties are high (such as Norway, the Nether-
lands and Denmark) that they provide ample room for incentives. Most countries with car manufac-
turing industries do not enforce any registration tax at all or charge only a small fee covering the costs
of the government agency in charge. Such countries have to rely on grants to EVs that are financed
from the general state budget. In member states with large budget deficits this is clearly a problem,
and even rich countries may have problems financing subsidies to a growing number of annual EV
registrations unless the grants can be gradually lowered as batteries become cheaper. Making motor-
ists pay the incremental cost through some kind of cross-subsidization (e.g. bonus-malus) may, how-
ever, reduce the burden.
A European ZEV mandate
In a recent report for T&E, Element Energy (2016) suggests that a European zero-emission vehicle man-
date should grow linearly in the 2020s to 45 per cent of new registrations in 2030. In order to simulta-
neously reduce emissions from conventional cars, a ULCV mandate combined with a set of CO2 targets
was also explored. The intention would be to encourage automakers to meet increasingly low CO2
targets with more ULCVs, without disrupting the planned deployment of efficiency technologies in
conventional ICEs and hybrid electric vehicles. For cars, the report concludes that 10 per cent ZEVs are
required in 2025 in order to meet a proposed overall target of 75g CO2/km, and 32 per cent are needed
in 2030 to meet a 50g CO2/km objective. According to the report, PHEVs may be included in the man-
date through a credit system where ZEVs are worth one credit and PHEVs between zero and one credit
depending on their all-electric range.

67
The report says that a ULCV mandate could be incorporated into the CO2 standards regulation through
a Flexible Mandate, which would allow the CO2 target of an automaker to be adjusted for the com-
pany´s performance against the ULCV Mandate. An automaker that exceeds the mandate would be
rewarded by having its CO2 target relaxed by an amount relative to its exceedance, and vice versa. The
authors admit that the proposed flexibility suffers from the drawback that, if the market as a whole
exceeds the ULCV mandate, the CO2 standards are diluted (Element Energy, 2016). As explained below,
there are additional problems with the suggested integration of ULCV mandates and CO2 standards.
ZEV mandate issues that need to be considered
Assuming that all sales of BEVs and FCEVs are given one ZEV-credit per new registration, we propose
that a PHEV with a range of 50 km or more in e-mode should be awarded half a credit. Whether all
cars, regardless of size, should be counted as equal in this context is an issue that policy-makers need
to decide on and a matter we do not discuss in this report.
The targets for different years need to be expressed as the number of full ZEV-credits required per 100
new cars sold on the EU market. To make it feasible to reach an ambitious target for 2030, an interme-
diate target for 2025 needs to be set well in advance. One may also contemplate an even earlier inter-
mediate target, to be reached in, say, 2022. One possibility may be to decide on different targets for
all years between 2020 and 2030 or, perhaps, a target for every second year.
To reach the market share of EVs discussed in this report (split 50/50 between BEVs and PHEVs), the
mandatory corporate target for 2030 would have to be set at 37.5 ZEV-credits per 100 new cars.
In economic theory it is generally accepted that for each goal at least one policy instrument is needed.
Trying to achieve two or more goals by just one policy lever is less effective than using separate instru-
ments that are designed and optimized for reaching a particular goal. However, it should be recognized
that a measure aimed at cutting one type of emission may simultaneously reduce other nuisances.
A broad introduction of electric vehicles is regarded as necessary for reducing carbon emissions from
road transport, and a major shift away from ICEs will simultaneously cut air pollution and urban noise
substantially. However, improving the energy efficiency of new vehicles is a different issue, albeit one
of several measures that may indirectly reduce CO2 emissions. Energy efficiency is not only about im-
proving the efficiency of engines and motors. Other ways of making a kWh of fuel or electricity go
further is to reduce vehicle weight, drag and rolling resistance and the energy consumed by various
accessories, in particular the climate system.
It can thus be argued that efficiency should be regarded a goal in its own right in view of making it
easier to supply growing vehicle fleets with electricity or fuel with minimum threat to human health
or natural ecosystems. Whether flexibility in terms of being assigned a weaker efficiency target for
having over-fulfilled a ZEV mandate (or vice versa) should be allowed is a matter that requires in-depth
analysis. It is not self-evident that permission to trade different targets against each other would lead
to optimal overall efficiency. If each target is considered important in its own right, it may be better to
design both policy instruments in ways that guarantee an optimal outcome.
Europe will in the next few decades struggle to reduce carbon emissions from its power production.
Replacing coal, oil and gas with fossil-free power production is an important part of the strategy but

68
should be supplemented by measures that guarantee efficient use of the electricity. Therefore, im-
proving the energy efficiency of electric vehicles is important so long as it consumes fewer resources
and less money per kWh compared to extending power production. This may argue in favor of making
new EVs subject to a separate vehicle energy efficiency regulation, particularly when the aim is to make
EVs dominate the future vehicle market. This would also be a way of stimulating energy efficient meth-
ods for producing comfort heat and air conditioning.
Flexibility in meeting the ZEV target can be achieved by other means than by making the mandate and
the CO2 standard interchangeable requirements of the same legislation. Automakers could be allowed
to bank and trade ZEV credits. However, in order to guarantee liquidity and prevent market leaders
from benefitting disproportionately there may be cause to rule that banking should not be permitted
for longer periods than, say, 12 months and that surplus credits should be sold at a common auction
to which all automakers have full access. This should provide a reasonable degree of security and allow
everyone to meet the mandate. However, to be able to handle a possible case of a temporary deficit
it is essential to stipulate fiscal penalties for non-compliance. The penalty should be set at a level that
by a margin exceeds the incremental cost of producing additional ZEVs.
Combining a ZEV mandate with other incentives?
A possible consequence of enforcing a ZEV mandate is that member states of the EU will no longer be
allowed to subsidize such vehicles by grants or by exemption from vehicle taxes. Making the state
(including regional authorities and local municipalities) pay part of the cost of meeting a mandatory
requirement is considered a non-permissible form of state aid under EU legislation. This rule is already
applied to the use of mandatory biofuel obligations which cannot be used in combination with dero-
gations from fuel tax. However, it would probably still be possible to differentiate registration taxes
and annual vehicles taxes to the size and the environmental performance of vehicles so long as the EU
principle of proportionality is observed. Member states would also be free to subsidize the use of elec-
tric vehicles by exempting them from parking fees and congestion charges. Whether this would be
clever is another matter.
A decreased reliance on incentives is in the longer term essential for building a self-sustaining market,
which should be possible as a result of falling costs of EVs relative to conventional cars and a broader
understanding and acceptance of the new vehicle technologies among ordinary citizens. Short-term,
however, it is unclear what the consumer response will be without tax incentives and other subsidies.
Such incentives, all else being equal, make buying and using an EV less expensive and thus more at-
tractive.
However, in a case where a common ZEV mandate applies to the total sales in the European Union of
each automaker, ambitious member states need to contemplate whether they want to pay a larger
share of the total incremental cost than necessary by providing subsidies to cars registered and used
within their jurisdiction. By making it less expensive to purchase and use such vehicles they will make
a larger share of required registrations take place in their countries than would have been the case
under equal conditions across Europe. That means subsidizing motorists in other member states who
would otherwise have been forced to share the full cost of their part of the common mandate. With
an EU-wide obligation, grants and other subsidies offered by individual member states would not add
to the size of the total fleet of electric vehicles but would allow car producers to do less in other parts
of Europe.

69
Moving incentives to the first phase of electrification of heavy vehicles
In the context of electrification it is essential to realize that buses and delivery trucks can also run fully
or partially on electricity. Allocating the incremental cost of a ZEV mandate for cars and vans according
to the Polluter Pays Principle (i.e. being paid by vehicle owners rather than from the state budget) will
make it financially feasible for central and local governments to spend funds on incentives that pro-
mote an early adoption of electric powertrains in heavy duty vehicles. They may also consider provid-
ing incentives to electric two- and three-wheelers.
A common ZEV mandate and how to share the burden
A challenge when trying to find political support for an ambitious ZEV target is that there is currently
no common EV market in Europe. Some member states have hitherto done next to nothing to promote
a shift to electric vehicles, and the market share of such cars varies widely across Europe. While the
Netherlands and Norway (outside the EU but part of the European Economic Area) aim at phasing out
the internal combustion engine completely in new cars in the relatively near future, other EU members
do not have any such goal at all and may even oppose an ambitious plan, which at least for some time
would raise the cost of buying new cars.
In this context is important to understand that individual member states cannot ban technologies that
have been type-approved according to the common safety and environmental requirements of the EU.
After having joined the EU in the mid-1990s, Sweden learned that it could no longer prohibit sales of
jet scooters as manufacturers should be allowed to market them in any part of the internal market. All
Sweden could do was to prohibit the use of such vehicles in particularly sensitive waters.
One possible way around the problem of greatly differing national ambitions could be to rule that
dissimilar ZEV mandates may apply in different member states. In order to prevent the least ambitious
from becoming free-riders it may be wise in this context to differentiate the mandate by income per
capita or the number of registered passenger cars per 1,000 inhabitants.
Based on our predictions (see chapter 8) for population growth and the number of cars per 1,000 in-
habitants, and an assumption that the current rate of scrapping old vehicles remains unchanged, an-
nual sales of new passenger cars will rise from 13.6 million in 2015 to 15.8 million in 2030. With a
common target (or an average mandate among EU states) reaching 50 per cent in 2030, 7.9 million EVs
would have to be sold in EU28 at that time. A mandate for 2025 set at 20 per cent of new sales would
translate into approximately 3 million new EVs per year.
Tradeable ICEV permits
A different variant of a ZEV mandate would be to enforce a cap on the number of registrations of new
cars with internal combustion engines (or other types of engines with tailpipe emissions) which is grad-
ually lowered over the years. One possibility could be to launch an EU-wide scheme that enters into
force by 1 January 2020 and runs through 2030 when the permissible number of new ICEVs must be
cut by half compared with 2020. The cap could be lowered in a way that reflects the trajectory of a
similar ZEV mandate.
However, if annual vehicle sales grow faster than predicted, automakers will be affected differently by
an ICEV cap than by the ZEV mandate. In the former case they would have to rely entirely on EVs for
any additional sales, while with a ZEV mandate every other extra vehicle sold could be an ICEV. In this

70
context it might be wise to recall that in 2016, new passenger car registrations in EU28 increased by
6.8 per cent. This marked the third consecutive year of growth.77 On the other hand, increasing pro-
duction of EVs at an even faster rate might be manageable in a situation of strong overall demand.
There may be cause to consider if the cap should apply to total sales in EU28 or whether it would be
better to enforce different caps in individual member states. The latter may have the advantage of
building on existing national registration schemes and the governance of state agencies, and may also
provide opportunity for setting caps that take the wealth of each nation into account.
The ICEV permits could be allocated to automakers based on their share of total registrations during
the previous year, but in order to facilitate for new entrants and for rapidly expanding businesses,
grandfathering ought to be limited to, say, 90 per cent of total allocations. The remaining 10 per cent
of the permits would be sold at auction by the EU. The proceeds could be split among member states
according to their share of total population or total sales and used, for instance, to fund state support
for battery charging infrastructure.
Imports of used cars from countries not belonging to the EU should be regarded as new registrations
and thus subject to the cap. Any company or private citizen that wants to buy a second-hand ICEV from
a non-participating country would thus have to purchase and submit an ICEV permit. Norway, Iceland
and Switzerland could be invited to become Parties to the scheme.
A cap on ICEV permits would also allow banking of permits and trade with permits in order to provide
sufficient flexibility (see the above section on a ZEV mandate). As a last resort non-complying automak-
ers would have to pay a penalty, which would be set somewhat above the average permit price in the
previous year.
The role of PHEVs
A majority of all trips by car are very short and the average daily mileage of motorists is low (US DOT,
2003, BMVBS, 2004, Gonder et al, 2007). The driving profile of the average German car user reveals
that some 80 per cent of the individual trips are shorter than 18 km and 80 per cent of daily total routes
do not exceed 60 km (BMVBS, 2004). Based on driving behavior statistics in the US, PHEVs with a 40-
mile range (64 km) would cover 65-80 per cent of total vehicle mileage in electric mode (Weiller, 2011,
based on US DOT, 2003).
Recent travel data from Scandinavia confirms this picture. In sparsely populated Sweden, the private
car is on average only used 4.4 times per year for trips exceeding 300 km.78 In Norway only 3 per cent
of single car trips are longer than 80 km, and in Denmark 4 per cent. The length of car-based trip chains
(from home to home) is also relatively short. In Norway and Denmark 85 and 75 per cent respectively
of the chains are shorter than 50 km (Hjorthol et al, 2014).
Per unit of battery capacity, the CO2 reduction ability of a PHEV is a great deal higher than that of a
BEV as each kWh is on average used many more times per year. In addition, PHEVs do not need public
fast charging.
77 http://www.acea.be/uploads/news_documents/20170117_PRPC_1612_FINAL.PDF 78 E-mail 9.6.2017 from Andreas Holmström, Trafikanalys, Stockholm.

71
Table 2 illustrates the effect on exhausts and CO2 car emissions per kWh of battery capacity in similar
BEV and PHEV models. The comparison is made between a PHEV with 10 kWh battery, corresponding
to an all-electric range of around 50 km (under real driving conditions), and a BEV with 80 kWh and a
range of around 400 km. Assuming that both vehicles are driven 14,000 km per year and that the PHEV
emits on average 100 g CO2 per km when propelled by its ICE, each kWh of battery capacity is used
4.0-5.6 times more efficiently in the PHEV depending on assumptions concerning the vehicle´s annual
share in e-mode.
Table 2. CO2 avoided per year and kWh of battery capacity. The PHEV´s e-mode share assumed to fall
between 50 and 70 per cent of its annual mileage.
BEV 17.5 kg
PHEV 50 % e-mode 70.0 kg
PHEV 70 % e-mode 98.0 kg
In the event that the lead-time for producing enough battery materials, in particular cobalt, to allow a
general shift to BEVs turns out to be long, allowing half of all new EVs to be PHEVs would reduce battery
demand by around 44 per cent compared to a situation when all new EVs are BEVs.
An important side-benefit of PHEVs is that driving in electric mode provides a possibility to avoid cold
start exhaust emissions caused during all trips shorter than the vehicle´s e-mode range. This is partic-
ularly important in air-polluted urban areas. With a minimum e-mode range of 50 km, most urban
driving can take place entirely in e-mode.
Driving a PHEV in electric mode is much less costly than to use its internal combustion engine. For
privately owned vehicles the choice is obvious. Several scenarios forecast high electric driving rates for
PHEVs (80% by 2030) (IEA, 2017). However, where company cars are concerned the user may refrain
from plugging in if the fuel is paid for by the company and the driver finds it more convenient to fill up
once in a while at a service station rather than connect the vehicle to the grid on a daily basis. Real
world data from the Netherlands suggest that this may be the case. Dutch drivers of company PHEVs
drive only 35 per cent of the distance in electric mode (Element Energy, 2016). The battery capacity of
most PHEVs should allow them to use electricity at least 50 per cent, and in usage dominated by short
trips 60-80 per cent. The problem can be avoided if a country´s company car regulation states that the
driver is taxed for the benefit of having access to a car paid for by his employer but has to pay for fuel
and electricity directly out of his/her own pocket (with a possibility to retrieve money corresponding
to miles driven on behalf of the company). This is how the current regulation in Sweden works.
The participation of PHEVs complicates a ZEV mandate or ICEV permit regulation, which need to con-
sider their all-electric range under realistic driving circumstances. It is also essential to prevent them
from becoming high-emitters when using the ICE. With batteries becoming gradually less expensive it
makes sense to rule that the all-electric range should be at least 50 km under real driving conditions
for making a PHEV eligible for part of a ZEV credit or ICEV permit. Such a PHEV would reduce CO2
emissions and other exhausts by at least 50 per cent compared to a similar car which is equipped with
only an ICE, and in most cases by more. Based on these conditions, it makes sense to award PHEVs half
a credit for a range of 50 km or more.

72
But in order to prevent the marketing of gas-guzzling PHEVs (such as today´s Mitsubishi Outlander),
the system with super credits should be scrapped, and all cars with an ICE should be equally treated in
the EU´s cars and CO2 regime. It is essential that the PHEV rules promote the development of platforms
and engines that are optimized for fuel and electricity efficiency. Today, the PHEV suffers from not
being built on dedicated platforms. Its ICE should ideally be designed and optimized for propelling the
car under constant speed and for charging the batteries when the capacity is not fully used for moving
the vehicle. It should always be possible for the driver to turn off the ICE completely during all trips
anticipated to be possible completely in e-mode
The role of company cars
Company cars that are used as private cars by employees make up a substantial part of new registra-
tions in Member States that for taxation values this benefit below its real cost. Copenhagen Economics
concluded in a report for the European Commission that this resulted in carbon emissions from pas-
senger cars in EU27 being 4-8 per cent higher than would have been the case if the value of the benefit
had been fully taxed. The subsidy was calculated to be on average 23 per cent of the full value of the
benefit for company cars that were sparsely used for private purposes, and 29 per cent for cars with a
higher annual mileage (Copenhagen Economics, 2010). A Swedish study found that for the most com-
mon models used as company cars the part of the benefit value that was not subject to income tax
amounted to between 53 and 70 per cent (Ynnor, 2013). A recent calculation by the Swedish National
Financial Management Authority concludes that this means that Sweden (10 million inhabitants) an-
nually is subsidizing company car users with SEK 1.5-2.0 billion (M€160-210).79
If Member States want to continue to link EV incentives to the taxation of company car benefits it is
essential that they do not subsidize large, heavy and high consuming vehicles. The nominal tax rate
should reflect the company´s true cost of leasing the car, and EV rebates should only apply to vehicles
that have a better than average mileage per kWh and (for PHEVs) per liter of fuel.
Cost efficiency issues
Before deciding on stringent measures aimed directly at facilitating a rapid switch to electric mobility,
it is essential to assess whether such a policy would be socio-economically viable. Some economists
argue that taxing carbon would be more efficient as it provides incentives to motorists to choose a
fuel-efficient car, to reduce annual mileage and involve in eco-driving. Another argument in favor of a
general policy measure is that it would be technically neutral and not cause any lock-in effects.
The strongest argument in favor of using supplementary policy instruments is lack of time. If the UN-
FCCC´s climate goal of preventing the mean global temperature of exceeding its pre-industrial level by
more than 1.5-2.0 per cent is to be achieved, emissions must rapidly be reduced. One obstacle in this
context is that a complete replacement of the current passenger car stock will take more than 20 years.
An additional problem is that scaling-up production of electric vehicles to mass-fabrication is not done
overnight. Building the charging infrastructure will also take time. Urgency, thus, is a good reason to
use special policy instruments (in combination with fuel and vehicle taxation) to accelerate the market
penetration of EVs.
However, the risk of hampering the development and market introduction of competing greenhouse
gas abatement technologies by focusing on and supporting electrification also needs to be considered.
79 http://www.esv.se/contentassets/e3b69dee46a34ba6ad2c2b4f05abf438/prognos-april-2017.pdf

73
The two main competing options, based on today´s knowledge, are improving the efficiency of the ICE
powertrain and shifting from fossil fuels to biofuel. The policy measures discussed above will, however,
leave ample room for further development and improvement of the ICE-technology, in particular in
hybrid configurations. The potential use of biofuels is relatively small due to limited supply of sustain-
able resources and the need for replacing fossil energy with bioenergy in other sectors. Harrison et al
(2014) estimate that residuals from forestry and agriculture together with organic household waste, if
used for production of advanced biofuels, may replace 16 per cent of expected demand for road fuels
in Europe in 2030.
Another concern is to prevent the marginal abatement cost from exceeding the socio-economic ben-
efits. As electrification will not only cut carbon emissions (given that power plant emissions are subject
to a common European cap) but also reduce urban noise and substantially improve the air quality of
many heavily polluted cities there is no reason to doubt that it will become cost effective in urban
areas. In addition, electrification of road transport will improve Europe´s security of energy supply and
support industry development and jobs. However, it is important to observe that production of bat-
teries may cause new environmental externalities that require attention.
Additional needs of rules and policy instruments
Before taking a final decision on the level of a ZEV mandate or ICEV cap it is essential to ensure that
Member States take enough action on grid development and charging infrastructure. According to Di-
rective 2014/94/EU, they shall ensure, by means of their national policy frameworks, that an appro-
priate number of public recharging points are put in place by 31 December 2020, in order to ensure
that electric vehicles can circulate at least in urban/suburban agglomerations and other densely pop-
ulated areas, and, where appropriate, within networks determined by the Member States. The number
of such recharging points shall be established taking into consideration the number of electric vehicles
estimated to be registered by the end of 2020. Member States shall also take measures within their
national policy frameworks to encourage and facilitate the deployment of recharging points not acces-
sible to the public. In its proposal for an Energy Performance of Buildings Directive, the Commission in
2016 proposed mandatory deployment of charging infrastructure or pre-cabling in new residential
buildings with more than ten parking spaces as well as the deployment of one charging point per ten
parking spaces in non-residential buildings. The proposal is currently under review; the Council has,
unfortunately, responded by wanting to reduce the requirements substantially.80
With 50 per cent of new sales still being ICEVs by 2030 (and all PHEVs being equipped with an ICE),
traditional engines and cars must become much more fuel efficient than they are today. This may not
be possible without compromising top-speed and acceleration. After the introduction of a mandatory
ZEV target there is no need to give manufacturers any CO2 credits (or super credits) for their sales of
EVs. It might be better to enforce a CO2 per kilometer limit (or energy efficiency requirement) on new
ICEVs that takes account of what should be technically possible to achieve in the absence of grid elec-
tricity. This regulation should apply to ICEVs as well as to PHEVs when making use of the ICE (with no
credit for its ability to use grid electricity for part of its annual mileage).
80 http://data.consilium.europa.eu/doc/document/ST-10288-2017-INIT/en/pdf

74
In order not to distort competition between BEV/PHEV and FCEV it is essential that electricity or natu-
ral gas used for production of hydrogen is taxed on par with electricity used for charging batteries. This
is particularly important in countries with high taxes on household electricity such as Germany, Den-
mark and Sweden.
There may also be cause for the EU to strengthen the regulations concerning recycling of battery ma-
terials and to act in order to ensure that the environmental impact from producing and up-grading of
such materials is minimized regardless of where these processes take place.
Making use of city zones where more stringent exhaust requirements apply may provide an extra in-
centive to go electric in metropolitan areas. An additional tool is to support a shift to EVs through
public and commercial procurement. Such policy instruments could of course also be used in parallel
with a ZEV mandate.
A choice to be made
In order to provide investors and potential buyers of EVs a clear signal of the future market prospects
Europe needs to make up its mind on which kind of policy framework that it wants to employ for help
speeding up sales.
It is difficult to forecast the precise years when the TCO of EVs will be equal the TCO of conventional
cars in different Member States. They may become attractive rather soon as a result of falling costs
and a growing number of people becoming acquainted with them. Rising electricity prices, caused by
climate change mitigation, and/or falling petroleum prices would, on the other hand, slow down mar-
ket penetration. The uncertainty is problematic for law-makers who want decide on the level and du-
ration of economic incentives. It is much less problematic for governments considering introducing a
ZEV mandate. With subsidies there is also the risk of paying too much, and the risk of running out of
funds because of budget restrictions. The latter is an obvious challenge in countries with large budget
deficits.
Setting the target of a mandate is also challenging. In order to give automakers a clear signal of what
lays ahead, the mandate has to be fixed, year by year, for a period of at least 5 to 10 years, and the
first calendar year covered cannot be closer to the date of decision than 2 or 3 years in order to give
the industry and the car dealers adequate time to adjust to the new situation. Since the mandate pref-
erably would be pan-European there is an obvious risk that deciding on the scheme might take years
and for some time involve uncertainty about the probable outcome. Setting the mandate too low
means not making use of the momentum, but taking a very ambitious position, on the other hand,
increases the risk of failure and may lead policy makers to a situation where they want to soften up
the rules. That, however, would be unfair and potentially disastrous as it would make the pioneers lose
to less ambitious competitors.
Introducing new policy instruments is the start of a process that will eventually end with liquidation.
Subsidies will, no doubt, be scrapped when no longer needed, but politicians may find it difficult or
impossible to end a scheme in advance after having made promises. In a situation where BEVs and
PHEVs become affordable sooner than anticipated, payments may therefore continue for a while, at
the expense to tax payers. A situation where electric vehicles become competitive sooner than ex-
pected is more easily handled with a ZEV mandate. In such a case the mandate ceases to be a ceiling
and turns into a floor.

75
In a case where Europe seriously contemplates the introduction of a ZEV mandate or a cap on ICEV
sales it is essential for ambitious member states not to discontinue their EV grants or tax breaks before
the common legislation takes effect.
To sum up
BEVs and PHEVs will in the long run probably become cost-competitive even without government sup-
port, but in order to honor the long-term climate commitments made by the EU, it is essential to try
to speed-up the market penetration of electric vehicles. This can best be achieved by a common zero
emission vehicle mandate or a cap on ICEV sales that requires automakers to gradually increase the
share of electric vehicles among new sales. These alternatives are less vulnerable to budget restraints,
miscalculations and changing relative prices than financial incentives but suffer from the risk of taking
long to establish through a common European political decision.

76

77
10. Main conclusions
Making electric vehicles grow from a market share of around 1 per cent of all new cars in 2016 to 50
per cent by 2030 should be technically feasible provided that the lead-times are shortened for ex-
tended battery material production and battery manufacturing. Numerous strategic investment deci-
sions must be taken rather soon, some of them involving large sums of money.
Several studies conclude that battery electric vehicles will reach parity with traditional cars in terms of
total cost of ownership (TCO) by the mid-2020s provided that battery production costs keep falling and
that manufacturing of EVs can gain from economies of scale. The support of strong government incen-
tives is essential in this context and may be a prerequisite for allowing demand to grow rapidly enough
to make mass production feasible in the near future. The date when TCO parity is reached may differ
significantly depending on differences in the national taxation of road fuels and electricity. This date
may also be influenced by future changes in the relative prices potentially caused by falling crude oil
prices and the effect on the electricity market from a growing price of CO2 emission allowances.
Setting a 50 per cent target for the market share of EVs by 2030 would bring multiple challenges with
it, and will therefore require the use of stronger government policy instruments compared with a lower
ambition. Above all, investors need to know that the EU is serious about its goal and that the shift to
electrification has the full support of governments, otherwise crucial investment decisions may be de-
layed to the extent that it becomes impossible to reach the target. In this context enforcing a manda-
tory EV target for 2025 that rises gradually to 50 per cent by 2030 might be a prerequisite for success.
The alternative of relying on a combination of government subsidies and increasingly stringent energy
efficiency requirements on all new cars with some kind of credit for EVs forms a much weaker and less
reliable set of policy instruments.

78
References
Al-Thyabat, S., T. Nakamura, E. Shibata, A. Iizuka. 2013. Adaptation of minerals processing operations for lith-
ium-ion (LiBs) and nickel metal hydride (NiMH) batteries recycling, Minerals Engineering, 45, 4-17.
Amnesty 2016. “This is what we die for.” Human rights abuses in the Democratic Republic of Congo power the global trade in cobalt. Amnesty International.
Berg, H. 2016. Marknadsprognoser för batterier – hur ändras prognoserna? OMEV, Omvärldsanalys av energieffektiva vägfordon.
Bergek, A., Berggren, C., Magnusson, T., Hobday, M. 2013. Technological discontinuities and the challenge for incumbent firms: Destruction, disruption or creative accumulation? Research Policy 42, 1210 – 1224.
Berger, R. 2016. E-mobility index Q1 2017. Roland Berger Automotive Competence Center.
Berggren, C., Magnusson, T. and Sushandoyo, D. 2015. Transition pathways revisited: established firms as mul-tilevel actors in the heavy vehicle industry. Research Policy, 44, 5, 1017-1028.
BEUC 2016. Low carbon cars in the 2020s. Consumer impacts and EU policy implications. BEUC, the European Consumer Organization, Nov. 2016.
BMVBS 2004. Mobilität in Deutschland 2002. Study by Infas and DIW. Bundesministeriums für Verkehr-, Bau- und Stadtentwicklung, Berlin.
Capros, P., Vita, A. de, Tasios, N., Papadopoulus, D., Siskos, P., Apostolaki, E., Zampara, M., Paroussos, L., Fragiadakis, K., Kouvaritakis, N., Höglund-Isaksson, L., Winiwarter, W., Purohit, P., Böttcher, H., Frank, S., Havlik, P., Gusti, M. and Witzke, H. P. 2013. EU energy, transport and GHG emissions: Trends to 2050. Reference sce-nario 2013. Technical University of Athens, International Institute for Applied Systems Analysis, EuroCARE. Commissioned by European Commission, Directorate-General for Energy, Directorate-General for Climate Ac-tion and Directorate-General for Mobility and Transport.
CARB 2017. California’s Advanced Clean Cars Midterm Review. Summary Report for the Technical Analysis of the Light Duty Vehicle Standards. California Environmental Protection Agency.
Copenhagen Economics 2010. Company Car Taxation. Working Paper No 22 for the European Commission.
Chung, D., Elgqvist, E. and Santhanagopalan, S. 2016, Automotive Lithium-Ion Cell Manufacturing: Regional Cost Structures and Supply Chain Considerations. CEMAC, April.
Decourt, B. et al. 2014. Hydrogen-Based Energy Conversion, More Than Storage: System Flexibility, SBC Energy Institute, Paris.
Desjardins, 2017. China Leading the Charge for Lithium-Ion Megafactories, Benchmark Mineral Intelligence, re-produced by the Visual Capitalist, February 17.
DIRECTIVE 2014/94/EU of the European Parliament and of the Council of 22 October 2014 on the deployment of alternative fuels infrastructure.
DoE 2015. Costs associated with non-residential electric vehicle supply equipment. U.S. Department of Energy, Energy Efficiency & Renewable Energy, November 2015.
Dewulff, J., Van der Vorst, G., Kim Denturck, G, van Langenhove, H., Ghyoot, W., Tytgat,, J., Vandeputte, K. 2010. Recycling rechargeable lithium ion batteries: Critical analysis of natural resource savings, Resources, Con-servation and Recycling, 54, 4, 229–234.

79
Dunn, J.B, Gaines, L., Kell, L,. C., James, C. and Gallagher, K.G. 2015. The significance of Li-ion batteries in elec-tric vehicle life-cycle energy and emission and recycling´s role in its reduction. Energy & Environmental Science, 8, 158-168.
E4tech Sàrl and Element Energy 2014. Development of Water Electrolysis in the European Union. Final Report for the Fuel Cells and Hydrogen Joint Undertaking.
ECF 2010. Roadmap 2050. European Climate Foundation, Den Haag.
Edström, K. 2017. Interview with battery researcher Professor Kristina Edström, Uppsala University, 170413.
EEA 2016. Trends and projections in the EU ETS in 2016. The EU Emissions Trading System in numbers. EEA Re-port No 24/2016
Element Energy Limited 2016. Towards a European Market for Electro-Mobility. Final report for Transport & Environment.
Ellingsen, L.A., Majeau-Bettetz, G., Singh, B., Srivavasta, A.K., Valöen, L.O., and Strömman, A.H. 2014. Life-cycle assessment of a lithium-ion battery vehicle pack. Journal of industrial ecology, 113-124.
Energimyndigheten 2017. Laddinfrastruktur. http://www.energimyndigheten.se/klimat--miljo/fossilfria-transporter/laddinfrastruktur/
EU Commission 2017. Electrification of the Transport System. Studies and reports. EU Commission Directorate-General for Research and Innovation, Brussels. Fergusson, M. 2016. Electric Vehicles in Europe – 2016. Ap-proaching adolescence. In-house analysis by Transport & Environment.
European Environment Agency 2016. Overview of electricity production and use in Europe. https://www.eea.europa.eu/data-and-maps/indicators/overview-of-the-electricity-production-2/assessment.
Figenbaum, E. and Kolbenstvedt, M. 2016. Learning from Norwegian Battery Electric and Plug-in Hybrid Vehicle users – Results from a survey of vehicle owners. Institute of Transport Economics, TØI Report: 1492/2016.
Gaines, L. and Nelson, P. 2010. Lithium-Ion Batteries: Examining materials demand and recycling issues. Ar-gonne National Laboratory.
Gandon, S. 2017. No cobalt, no Tesla? Benchmark Mineral Intelligence, download 170307.
Gao, W., Xihua Zhang, Xiaohong Zheng, Xiao Lin, Hongbin Cao, Yi Zhang, and Zhi Sun. 2017. Lithium
Carbonate Recovery from Cathode Scrap of Spent Lithium-Ion Battery: A Closed-Loop Process. Envi-
ron. Sci. Technology, 51, 3, 1662-1669.
Global CCS Institute 2015. The costs of CCS and other low-carbon technologies in the United States - 2015 up-date.
Goldman & Sachs 2016. The Low Carbon Economy. Technology in the Driver´s Seat. Goldman & Sachs Equity Research, Nov. 28.
Gonder, J., Markel, T., Thornton, M., Simpson, A., 2007. Using global positioning system travel data to assess real-world energy use of plug-in hybrid electric vehicles. Transportation Research Record, 26–32. doi:10.3141/2017-04.
Greene, D., 2010. Why the Market for New Passenger Cars Generally Undervalues Fuel Economy. Joint Transport Research Centre Round Table 18–19 February 2010. OECD/-International Transport Forum, Paris.
Hacker, F., Harthan, R., Matthes, F., Zimmer, W. 2009. Environmental Impacts and impact on the electricity market of a large scale introduction of electric cars in Europe - Critical Review of Literature, ETC/ACC Technical paper 2009/4 July 2009.

80
Harrison, P., Malins, C., Searle, S., Baral, A., Turley, D., & Hopwood, L. 2014. Wasted: Europe's untapped re-source. International Council on Clean Transportation ICCT.
He, L. Shu-Ying Sun, Xing-Fu Song, Jian-Guo Yu. 2015. Recovery of cathode materials and Al from spent lithium-
ion batteries by ultrasonic cleaning. Waste Management, 46, 523-528.
Hidrue, M.K., Parsons, G., Kempton, W., Gardner, M. 2011. Willingness to pay for electric vehicles and their at-tributes. Resource and Energy Economics, 33, 686-705.
Hjorthol, R., Vågane, L., Foller, J. Emmerling, B. 2014. Everyday mobility and potential use of electric vehicles.
TØI report 1352/2014. Institute of Transport Economics, Oslo.
IEA 2015. Technology Roadmap. Hydrogen and Fuel Cells. International Energy Agency. https://www.iea.org/publications/freepublications/publication/TechnologyRoadmapHydrogenandFuelCells.pdf
IEA 2016. Global EV Outlook 2016. Beyond one million electric cars. International Energy Agency.
IEA 2017. Global EV Outlook 2017. Two million and counting. International Energy Agency.
ICCT 2016a. Comparison of Leading Electric Vehicle Policy and Deployment in Europe. International Council on Clean Transportation Europe.
ICCT 2016b. Reducing CO2 emissions from road transport in the European Union: An evaluation of policy op-
tions. International Council on Clean Transportation Working Paper 2016-10.
Karabag, S. F., Berggren, C .2017. Struggling with Knowledge Boundaries and Stickiness. Case Studies of Innovat-ing Firms in an Emerging Economy. In Tell, F, Berggren, C., Brusoni, S., Van de Ven, A. 2016 (eds.) Managing Knowledge Integration across Boundaries, p.139-154. Oxford. Oxford University Press.
Kim, H. C., Wallington, T., Arsenault, R., Bae, C., Ahn, S., and Lee, J. 2016. Cradle-to-Gate Emissions from a Com-mercial Electric Vehicle Li-Ion Battery: A Comparative Analysis. Environ. Sci. Technol, 50 14, 7715–7722.
Kittner, N., Lill F. and Kammen, D. 2017. Energy storage deployment and innovation for the clean energy transi-
tion. Nature Energy 2, 17125. Published online: 31 July 2017
Korea Country Profile, 2016. Brown to green: G20 transition to a low carbon economy Republic of Korea - Country Profile, http://www.climate-transparency.org/wp-content/uploads/2016/09/Korea_Country-Pro-file.pdf
Lin, Z. and Greene, D.L. 2012. Promoting the market of plug-in hybrid and battery electric vehicles: role of re-charge availability. Transp. Res. Rec., 2252.
Maycher, K. 2015. What Happened to the Rare-Earths Crisis? MIT Technology Review 25.2.
McKinsey 2017. Electrifying insights: How automakers can drive electrified vehicle sales and profitability. McKinsey & Company Advanced Industries, Jan. 2017.
Macquarie 2016. Global Lithium Report. Fully Charged No shortage. Macquarie Research
Mock, P. and Yang, Z. 2014. Driving Electrification. A global comparison of fiscal incentive policy for electric ve-hicles. International Council on Clean Transportation ICCT.
Notter, D.A., Gauch, M., Widmer, R., Wager, P., Stamp, A., Zah, R., Althaus, H-J. 2010 Contribution of Li-Ion Bat-teries to the Environmental Impact of Electric Vehicles, Environmental Science & Technology, 44, 17, 6550-6556.
Novinsky, P., Glöser, S., Kuehn, A., Walz, R. 2014. Modeling the Feedback of Battery Raw Material Shortages on the Technological Development of Lithium-Ion Batteries. Paper presented at the 32nd International Conference of the System Dynamics Society, Delft, Netherlands, July 2014.

81
Nykvist, B. and Nilsson, M., 2014. Rapidly falling costs of battery packs for electric vehicles, Nature Climate Change, 5, April, p. 329-332
Oeko-Institut et al. 2016 2016. Electric mobility in Europe – Future impact on the emissions and the energy sys-tems. Final report of task 2 - Assessing the status of electrification of road transport passenger vehicles and po-tential future implications for the environment and European energy system. Report commissioned by the EEA. Oeko-Institut, Mobility Leuven (TML), Trinomics, and TNO.
OPEC 2016. World Oil Outlook 2015-2040, Organization of the Petroleum Exporting Countries.
Patel, P., Gaines, L. 2016. Recycling Li batteries could soon make economic sense. MRS Bulletin 4106:430-431, June 17.
Pehlken, A., Albach, S. and Vogt, Th. 2017. Is there a resource constraint related to lithium ion battery cars? Int Journal of Life Cycle Assessment, 22, 40-53.
Pillot, C. 2015. Future trends in the rechargeable battery market. Avicenne Energy, September 23-25, 2015 Montreux, Switzerland.
Ricardo 2016. Economics of Hydrogen Refueling Stations. CaFCP Bus Team Meeting, August 30.
Romare, M., Dahllöf, L. 2017. The Life Cycle Energy Consumption and Greenhouse Gas Emissions from Lithium-ion Batteries, Stockholm: IVL Report No. C 243.
Sauer A., Thielmann, A., Isenmann, R. 2016. Modularity in Roadmapping – Integrated foresight of technologies, products applications, markets and society: The case of Lithium Ion Battery LIB 2015. Technological Forecasting and Social Change.
Shulock Consulting 2016. Manufacturer Sales under the Zero Emission Vehicle Regulation. 2012 Expectations and Governors’ Commitments Versus Today’s Likely Outcomes. Prepared for Natural Resources Defense Coun-cil.
Sierzchula, W., Bakker, S., Maat, K., van Wee, B. 2014. The influence of financial incentives and other socio-eco-nomic factors on electric vehicle adoption. Energy Policy, 183-194.
Stassin, F., Meeus, M. 2016. European approach on battery cell production in Europe. EMIRI. June 24.
Sushandoyo, D., Magnusson, T, Berggren, C. 2012. ‘Sailing Ship Effects’ in the Global Automotive Industry? Competition between ‘New’ and ‘Old’ Technologies in the Race for Sustainable Solutions. In Calabrese, G. ed. The Greening of the Automotive Industry, pp. 103-123. Palgrave.
Thiel, C., Nijs, W., Simoes, S., Schmidt, J., van Zyl, A., Schmid, E. 2016. The Impact of the EU Car CO2 Regulation on the Energy System and the Role of Electro-Mobility to Achieve Transport Decarbonisation. Energy Policy 96, 153–166. T&E 2016. Electrical Vehicles in Europe. Approaching adolescence, Transport & Environment.
US DOT 2003. The 2001 national household travel survey. /http://www.eia.doe. gov/emeu/recs
Tollefson, J. 2007. Worth its weight in platinum: booming mineral prices leave car makers scrambling to eke out more catalytic performance out of precious metal, Nature, 450, 7168, 334-337 .
Weiller, C. 2011. Plug-in hybrid electric vehicle impacts on hourly electric demand in the United States. Energy Policy 39 3766-3778.
Wu, G., Inderbitzin, A., Bening, C. 2015. Total cost of ownership of electric vehicles compared to conventional vehicles: A probabilistic analysis and proje4ction across market segments. Energy Policy, 80, 196-214.
Yang, C-J. 2009. An impending platinum crisis and its implications for the future of the automobile, Energy Pol-icy, 37, 5, 1805-1808.

82
ZEP 2011. The Costs of CO2 Capture, Transport and Storage. Post-demonstration CCS in the EU. European Tech-nology Platform for Zero Emission Fossil Fuel Power Plants.
Zhang, JS, et al. 2016. Assessing Economic Modulation of Future Critical Materials Use: The Case of Automotive-Related Platinum Group Metals, Environmental Science & Technology, 50, 14, 7687-7695.
Zeng, X., Jinhui Li & Narendra Singh 2014. Recycling of Spent Lithium-Ion Battery: A Critical Review. Critical Reviews in Environmental Science and Technology 44, 10, 1129-1165.
Ynnor 2013. Beskattning av förmånsbilar. Underlag till utredningen om fossilfri fordonstrafik. Ynnor AB, Malmö.