speedway, indiana, wwtp biosolids upgrade - storage
TRANSCRIPT
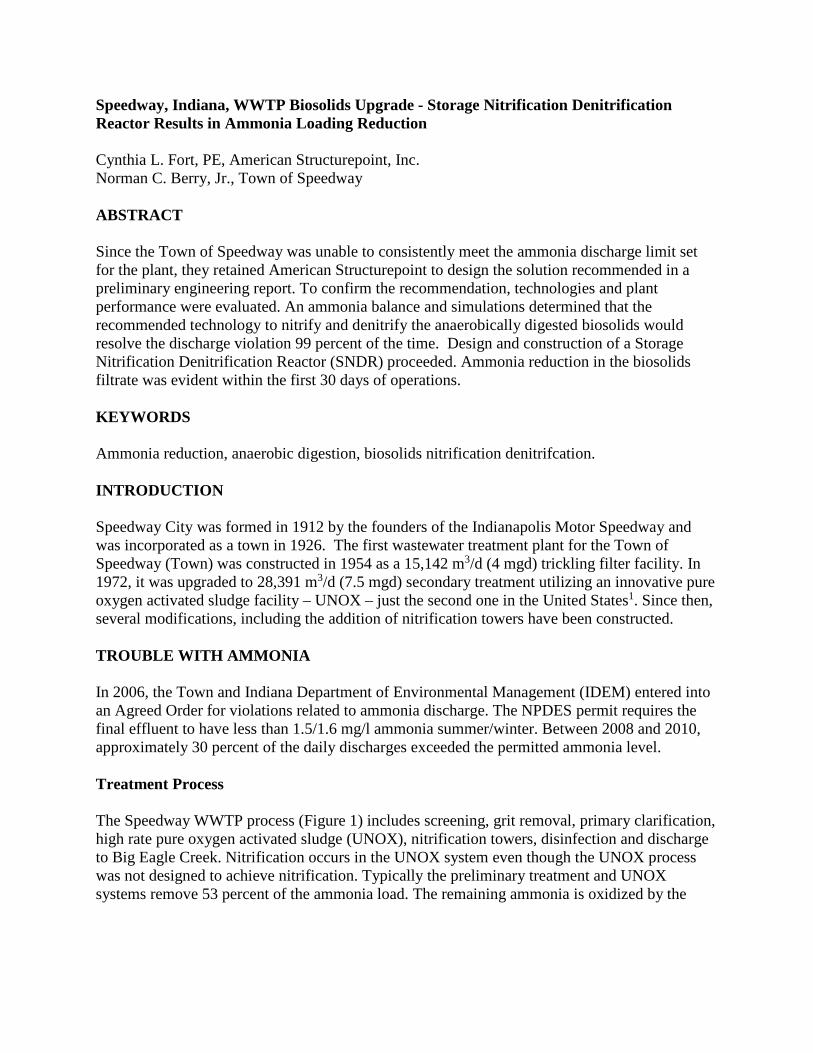
Speedway, Indiana, WWTP Biosolids Upgrade - Storage Nitrification Denitrification Reactor Results in Ammonia Loading Reduction Cynthia L. Fort, PE, American Structurepoint, Inc. Norman C. Berry, Jr., Town of Speedway ABSTRACT Since the Town of Speedway was unable to consistently meet the ammonia discharge limit set for the plant, they retained American Structurepoint to design the solution recommended in a preliminary engineering report. To confirm the recommendation, technologies and plant performance were evaluated. An ammonia balance and simulations determined that the recommended technology to nitrify and denitrify the anaerobically digested biosolids would resolve the discharge violation 99 percent of the time. Design and construction of a Storage Nitrification Denitrification Reactor (SNDR) proceeded. Ammonia reduction in the biosolids filtrate was evident within the first 30 days of operations. KEYWORDS Ammonia reduction, anaerobic digestion, biosolids nitrification denitrifcation. INTRODUCTION Speedway City was formed in 1912 by the founders of the Indianapolis Motor Speedway and was incorporated as a town in 1926. The first wastewater treatment plant for the Town of Speedway (Town) was constructed in 1954 as a 15,142 m3/d (4 mgd) trickling filter facility. In 1972, it was upgraded to 28,391 m3/d (7.5 mgd) secondary treatment utilizing an innovative pure oxygen activated sludge facility – UNOX – just the second one in the United States1. Since then, several modifications, including the addition of nitrification towers have been constructed. TROUBLE WITH AMMONIA In 2006, the Town and Indiana Department of Environmental Management (IDEM) entered into an Agreed Order for violations related to ammonia discharge. The NPDES permit requires the final effluent to have less than 1.5/1.6 mg/l ammonia summer/winter. Between 2008 and 2010, approximately 30 percent of the daily discharges exceeded the permitted ammonia level. Treatment Process The Speedway WWTP process (Figure 1) includes screening, grit removal, primary clarification, high rate pure oxygen activated sludge (UNOX), nitrification towers, disinfection and discharge to Big Eagle Creek. Nitrification occurs in the UNOX system even though the UNOX process was not designed to achieve nitrification. Typically the preliminary treatment and UNOX systems remove 53 percent of the ammonia load. The remaining ammonia is oxidized by the
existing nitrification towers, which were designed to remove 321 kg (687 lbs) of ammonia/day.
Figure 1: Speedway Wastewater Treatment Plant Process Diagram While the nitrification towers can effectively remove the remaining average day ammonia load of 165 kg (346 lbs), the maximum day load of 692 kg (1,524 lbs) clearly exceeds the capacity of the nitrification towers (data period 1/1/2008 through 8/31/2010). To consistently meet the permit requirements, the ammonia in the recycle stream had to be reduced so the total ammonia load to the plant was less than 800 pounds per day. The existing biosolids process included mixed, but unaerated, storage of the waste activated sludge (WAS) prior to thickening with a gravity belt thickener (GBT). The thickened WAS and primary sludge were fed to the anaerobic digestion process, which consisted of one primary anaerobic digester with a detention time of approximately 30 days and a second open tank for digested sludge storage. The primary digester is fitted with a floating steel gas holder cover and three external heated mixing tubes. Processed biosolids are pumped to two existing belt filter presses for dewatering. Belt filter press filtrate is returned to the head of the plant, while solids are sent to the existing sludge storage building. A major source of ammonia was from the belt filter press filtrate – typically 202 kg/d (445 lbs/day) of ammonia are recycled to the headworks. It appears the ammonia permit limits violations were generally a result of the variability and peak loading of ammonia to the plant and occasional process upsets.
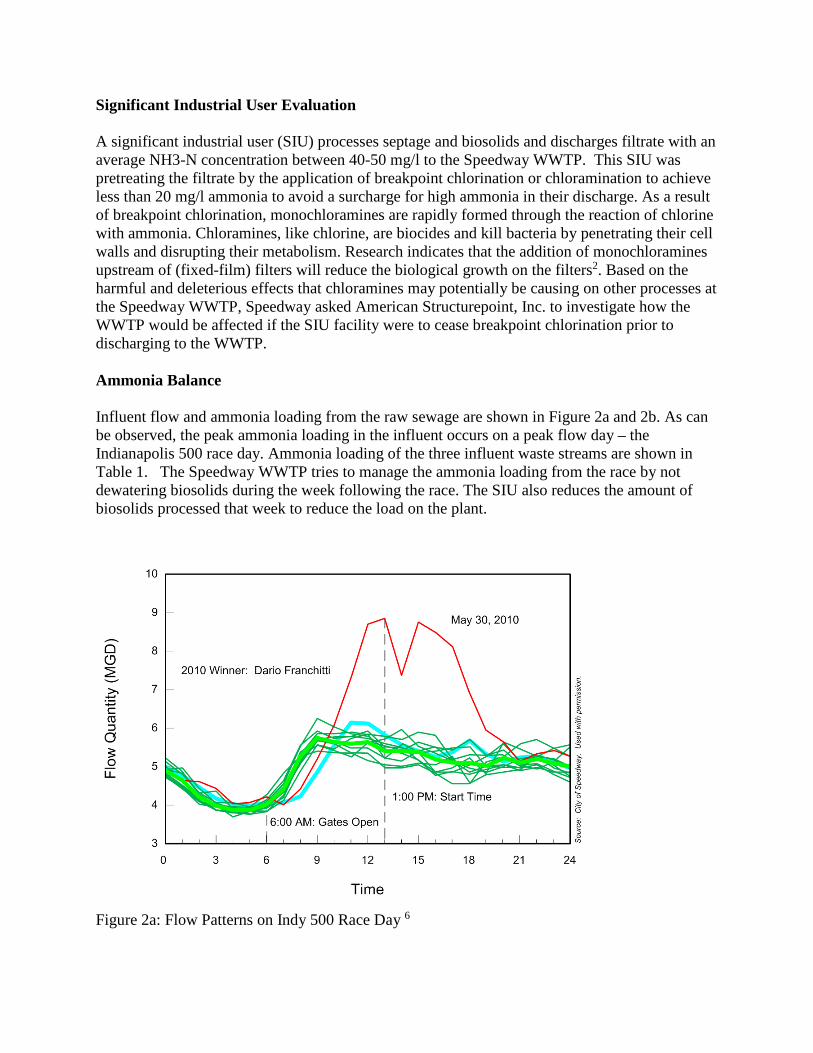
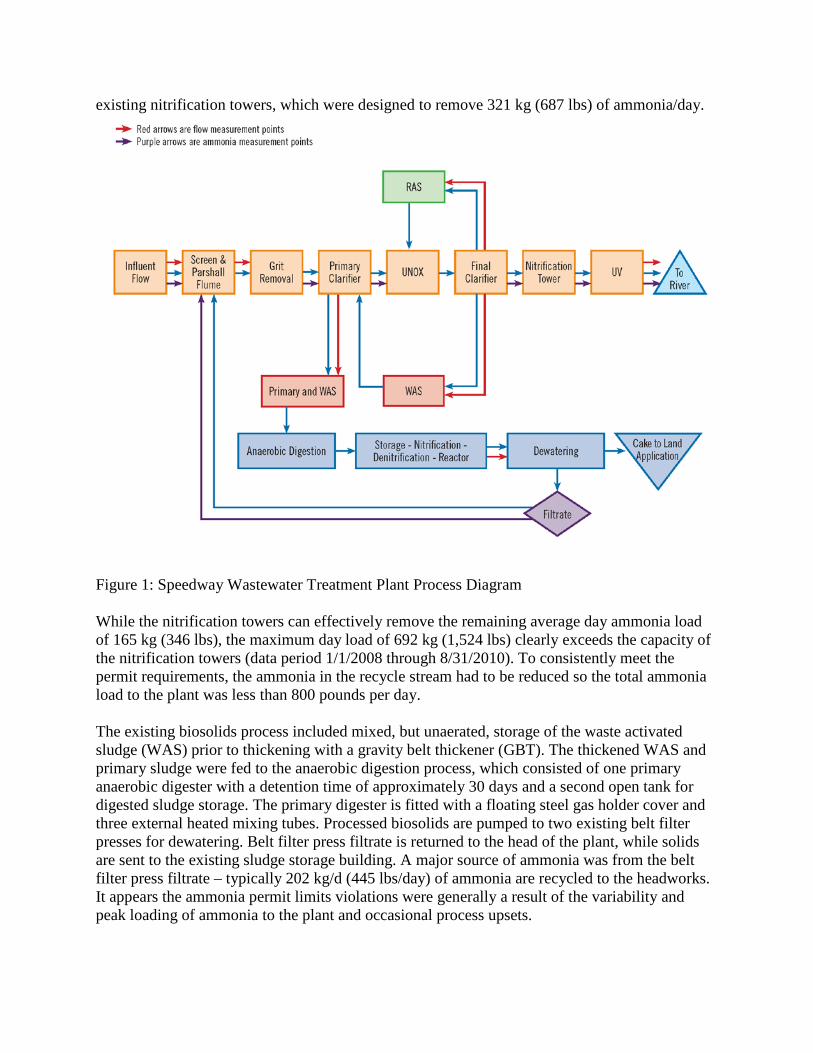
Significant Industrial User Evaluation A significant industrial user (SIU) processes septage and biosolids and discharges filtrate with an average NH3-N concentration between 40-50 mg/l to the Speedway WWTP. This SIU was pretreating the filtrate by the application of breakpoint chlorination or chloramination to achieve less than 20 mg/l ammonia to avoid a surcharge for high ammonia in their discharge. As a result of breakpoint chlorination, monochloramines are rapidly formed through the reaction of chlorine with ammonia. Chloramines, like chlorine, are biocides and kill bacteria by penetrating their cell walls and disrupting their metabolism. Research indicates that the addition of monochloramines upstream of (fixed-film) filters will reduce the biological growth on the filters2. Based on the harmful and deleterious effects that chloramines may potentially be causing on other processes at the Speedway WWTP, Speedway asked American Structurepoint, Inc. to investigate how the WWTP would be affected if the SIU facility were to cease breakpoint chlorination prior to discharging to the WWTP. Ammonia Balance Influent flow and ammonia loading from the raw sewage are shown in Figure 2a and 2b. As can be observed, the peak ammonia loading in the influent occurs on a peak flow day – the Indianapolis 500 race day. Ammonia loading of the three influent waste streams are shown in Table 1. The Speedway WWTP tries to manage the ammonia loading from the race by not dewatering biosolids during the week following the race. The SIU also reduces the amount of biosolids processed that week to reduce the load on the plant.
Figure 2a: Flow Patterns on Indy 500 Race Day 6
Figure 2b: 2012 Ammonia Loading Table 1 Ammonia Loading Location Average
Concentration mg/l
Maximum Concentration mg/l
Average Loading kg/d (lb/d)
Maximum Loading kg/d (lb/d)
Raw Sewage 9.92 30.2 209 (460) 828 (1,824) SIU stream w/o pretreatment 32 41 10 (23) 45 (100) Filtrate recycle 1,023 3,460 175 (386) 485 (1,069) The primary treatment process and the UNOX process typically remove 53 percent of the ammonia in the influent stream. The nitrification towers remove an average of 84 percent of the ammonia applied to the towers. Based on the nitrification balance, if the ammonia concentration from the plant’s biosolids process was reduced, the SIU could discharge their waste stream without breakpoint chlorination. While the performance of the nitrification towers with and without the breakpoint chlorination was essentially the same, removal across the UNOX system improved from 41 percent to 53 percent. Process Modification In April 2010, the plant staff tested a process modification aimed at reducing the ammonia loading in the recycle stream. The waste activated sludge (WAS) was pumped to the plant drain so that thickening was accomplished in the primary clarifier instead of storing the raw WAS for
-
100.00
200.00
300.00
400.00
500.00
600.00
700.00
800.00
900.00
1,000.00
4/26 5/1 5/6 5/11 5/16 5/21 5/26 5/31 6/5 6/10 6/15
Amm
onia
, lb/
day
Date
2012 Raw NH3,Lb/Day
Race Day
thickening with the GBT. The settled sludge was fed on a more continuous basis to the digester and a reduction in the ammonia in the recycle stream was observed. This process change resulted in an average reduction of 21.4 percent (an average of 80 lb/day less) in ammonia loading from the thickening/dewatering recycle stream. The reduction was not sufficient to eliminate the effluent ammonia violations, but was sufficient to allow the SIU to stop breakpoint chlorination. ALTERNATIVE EVALUATION Alternatives under consideration included3:
• Modify the UNOX process to increase nitrification. This alternative was rejected due to the significant expense of replacing the oxygen system and increasing tank capacity.
• Eliminate anaerobic digestion. This alternative was rejected due to the reduction of volatile solids destruction, loss of gas which is utilized by the plant. This alternative was estimated to cost the plant $40,000 more per year in disposal costs for biosolids
• Equalization tank for the filtrate to allow the ammonia load to be distributed over 24 hours instead of the 8 operating hours. This did not reduce the ammonia loading nor provide any positive benefits for improved digestion and dewatering and could limit the SIU’s operations.
• Construct an aerobic digestion process (biosolids nitrification denitrification reactor) to reduce the ammonia in the recycle stream. Research (4) indicated dual digestion process would increase the volatile solids destruction from 46 to 65 percent; reduce ammonia by 80 percent and improve the dewaterablity of the biosolids.
SELECTED ALTERNATIVES After evaluation of alternatives, it was decided to design and construct a Storage Nitrification Denitrification Reactor (SNDR) to reduce the ammonia in the recycle stream. Anaerobic digestion followed by aerobic digestion can be specifically designed to increase ammonia removal. The dual digestion process was estimated to reduce ammonia levels from a maximum of 2,000 mg/L to between 150 and 400 mg/l in the filtrate from the dewatering operations. Based on the initial analysis, a reduction in the ammonia load to the plant will reduce the peak day ammonia load from the biosolids process by 440 pounds/day of ammonia if GBT thickening of the WAS was not resumed. It was also evident from the data analyses that influent ammonia in the raw sewage continues to impact the ability of the plant to oxidize the ammonia sufficiently to meet permit limits during the Indianapolis 500 race. The Storage Nitrification Denitrification Reactor (SNDR) system, manufactured by Thermal Process Systems (Crown Point, Indiana), was developed and designed for oxidizing extraordinarily high concentration of ammonia resulting from their ThermAir process – an Advanced Thermophillic Biosolids Treatment. The system is designed to transfer oxygen in high solids applications. The application of the SNDR process at Speedway is the first application of this technology for treating high ammonia in an anaerobically digested biosolids stream.
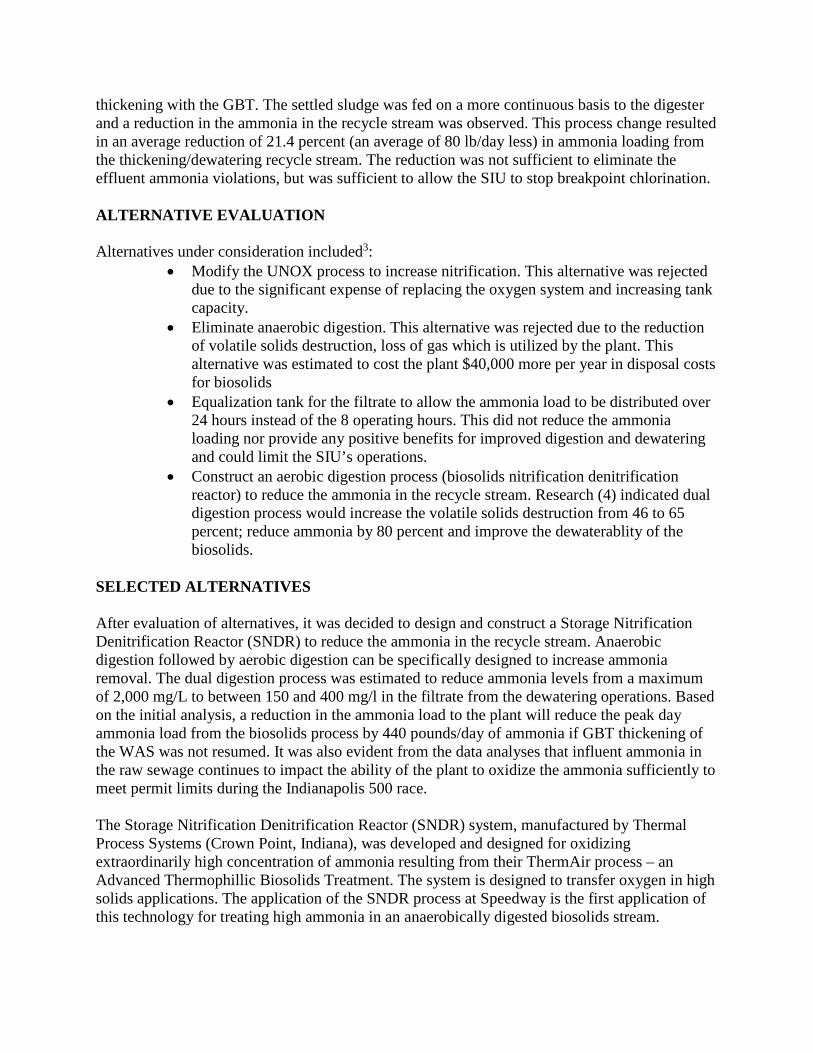
Speedway’s SNDR system consists of utilizing the existing sludge storage tank as the main reactor for nitrification and denitrification. The existing tank was modified and equipped specifically for the operation. The addition of a fixed cover, mixing pump, blower, and odor control system were designed and constructed.
Figure 3. SNDR fixed Roof, jet pump discharge and air supply line
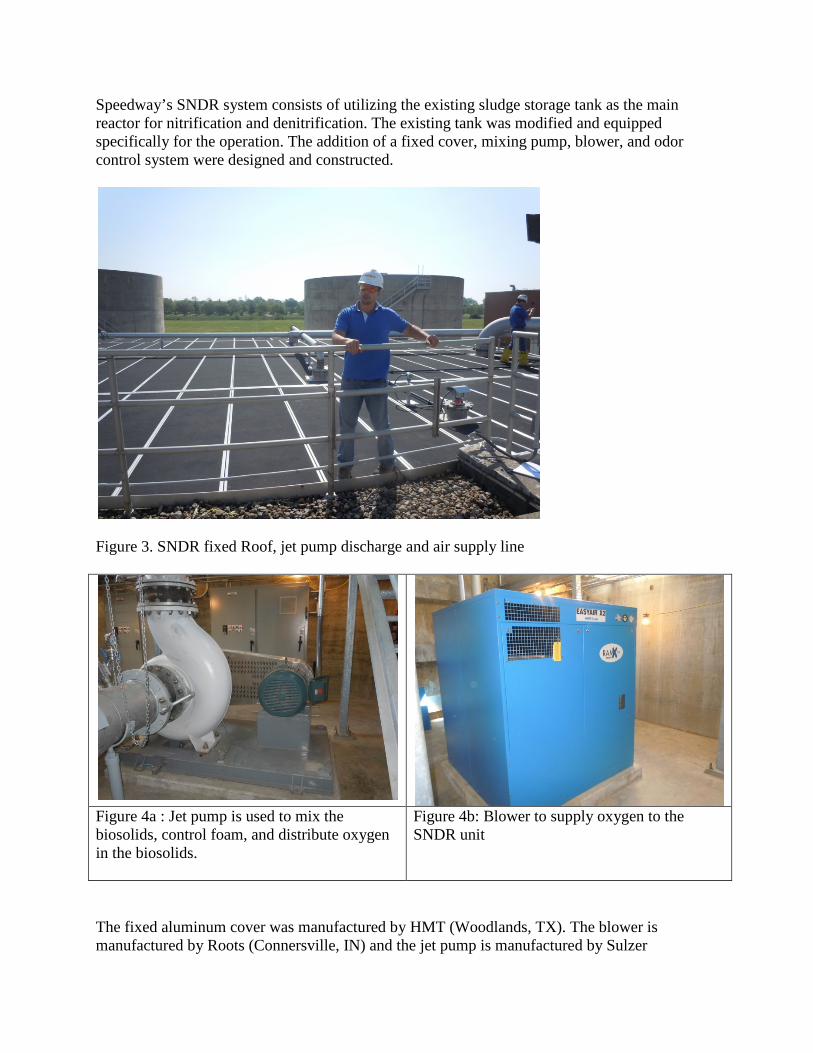
Figure 4a : Jet pump is used to mix the biosolids, control foam, and distribute oxygen in the biosolids.
Figure 4b: Blower to supply oxygen to the SNDR unit
The fixed aluminum cover was manufactured by HMT (Woodlands, TX). The blower is manufactured by Roots (Connersville, IN) and the jet pump is manufactured by Sulzer
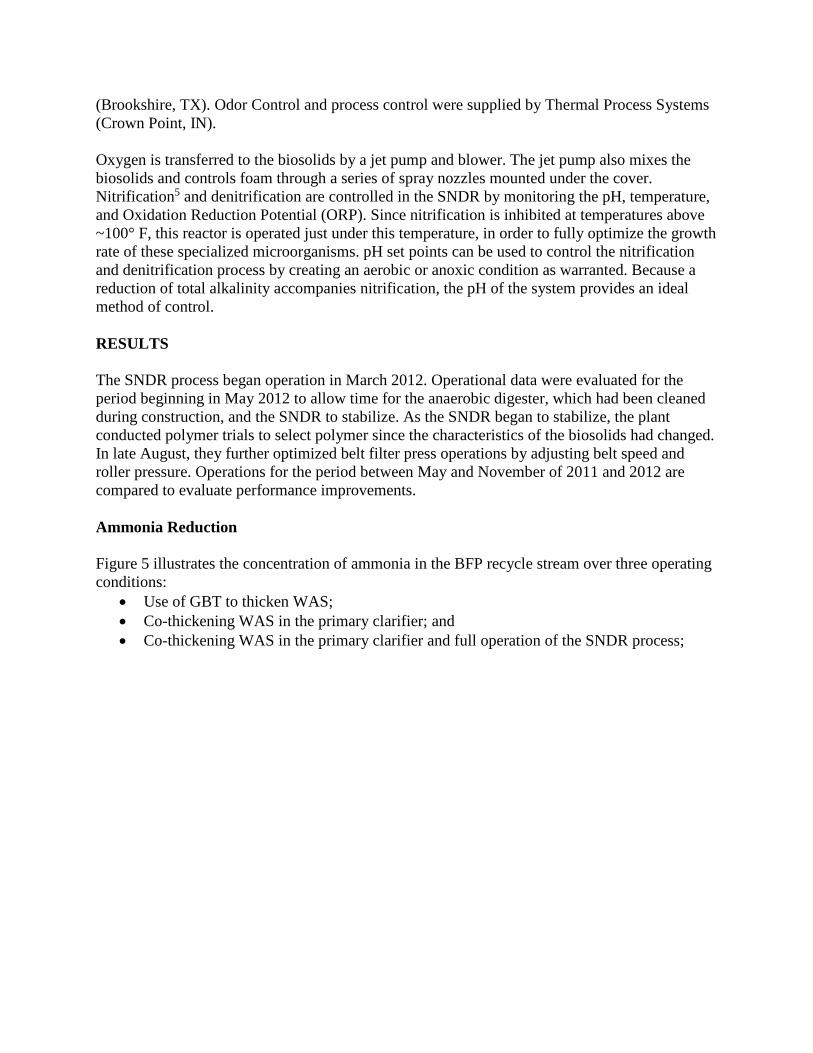
(Brookshire, TX). Odor Control and process control were supplied by Thermal Process Systems (Crown Point, IN). Oxygen is transferred to the biosolids by a jet pump and blower. The jet pump also mixes the biosolids and controls foam through a series of spray nozzles mounted under the cover. Nitrification5 and denitrification are controlled in the SNDR by monitoring the pH, temperature, and Oxidation Reduction Potential (ORP). Since nitrification is inhibited at temperatures above ~100° F, this reactor is operated just under this temperature, in order to fully optimize the growth rate of these specialized microorganisms. pH set points can be used to control the nitrification and denitrification process by creating an aerobic or anoxic condition as warranted. Because a reduction of total alkalinity accompanies nitrification, the pH of the system provides an ideal method of control. RESULTS The SNDR process began operation in March 2012. Operational data were evaluated for the period beginning in May 2012 to allow time for the anaerobic digester, which had been cleaned during construction, and the SNDR to stabilize. As the SNDR began to stabilize, the plant conducted polymer trials to select polymer since the characteristics of the biosolids had changed. In late August, they further optimized belt filter press operations by adjusting belt speed and roller pressure. Operations for the period between May and November of 2011 and 2012 are compared to evaluate performance improvements. Ammonia Reduction Figure 5 illustrates the concentration of ammonia in the BFP recycle stream over three operating conditions:
• Use of GBT to thicken WAS; • Co-thickening WAS in the primary clarifier; and • Co-thickening WAS in the primary clarifier and full operation of the SNDR process;
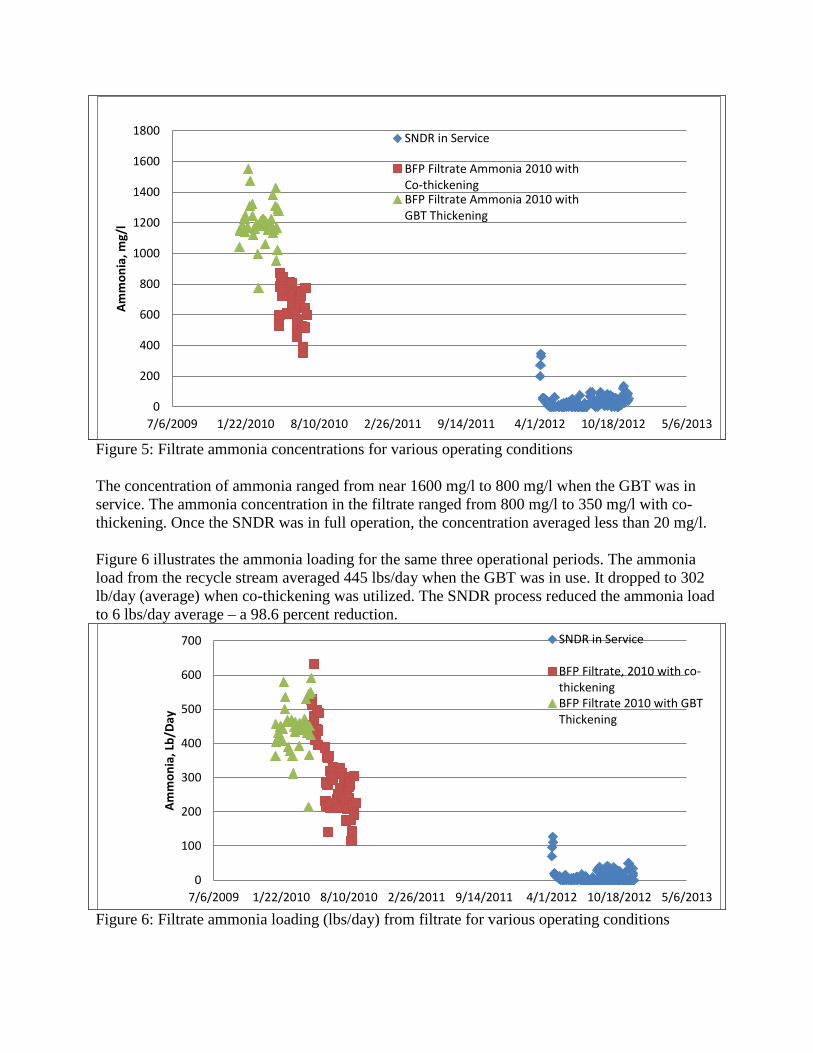
Figure 5: Filtrate ammonia concentrations for various operating conditions The concentration of ammonia ranged from near 1600 mg/l to 800 mg/l when the GBT was in service. The ammonia concentration in the filtrate ranged from 800 mg/l to 350 mg/l with co-thickening. Once the SNDR was in full operation, the concentration averaged less than 20 mg/l. Figure 6 illustrates the ammonia loading for the same three operational periods. The ammonia load from the recycle stream averaged 445 lbs/day when the GBT was in use. It dropped to 302 lb/day (average) when co-thickening was utilized. The SNDR process reduced the ammonia load to 6 lbs/day average – a 98.6 percent reduction.
Figure 6: Filtrate ammonia loading (lbs/day) from filtrate for various operating conditions
0
200
400
600
800
1000
1200
1400
1600
1800
7/6/2009 1/22/2010 8/10/2010 2/26/2011 9/14/2011 4/1/2012 10/18/2012 5/6/2013
Amm
onia
, mg/
lSNDR in Service
BFP Filtrate Ammonia 2010 withCo-thickeningBFP Filtrate Ammonia 2010 withGBT Thickening
0
100
200
300
400
500
600
700
7/6/2009 1/22/2010 8/10/2010 2/26/2011 9/14/2011 4/1/2012 10/18/2012 5/6/2013
Amm
onia
, Lb/
Day
SNDR in Service
BFP Filtrate, 2010 with co-thickeningBFP Filtrate 2010 with GBTThickening
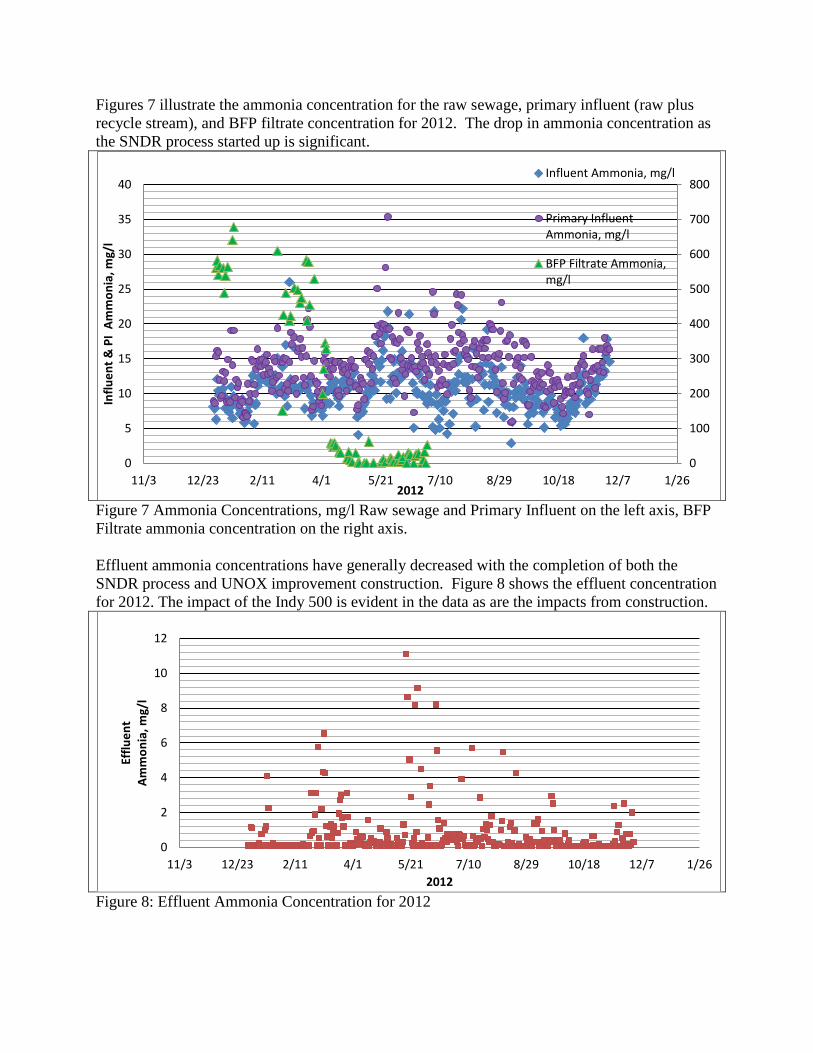
Figures 7 illustrate the ammonia concentration for the raw sewage, primary influent (raw plus recycle stream), and BFP filtrate concentration for 2012. The drop in ammonia concentration as the SNDR process started up is significant.
Figure 7 Ammonia Concentrations, mg/l Raw sewage and Primary Influent on the left axis, BFP Filtrate ammonia concentration on the right axis. Effluent ammonia concentrations have generally decreased with the completion of both the SNDR process and UNOX improvement construction. Figure 8 shows the effluent concentration for 2012. The impact of the Indy 500 is evident in the data as are the impacts from construction.
Figure 8: Effluent Ammonia Concentration for 2012
0
100
200
300
400
500
600
700
800
0
5
10
15
20
25
30
35
40
11/3 12/23 2/11 4/1 5/21 7/10 8/29 10/18 12/7 1/26
Influ
ent &
PI
Amm
onia
, mg/
l
2012
Influent Ammonia, mg/l
Primary InfluentAmmonia, mg/l
BFP Filtrate Ammonia,mg/l
0
2
4
6
8
10
12
11/3 12/23 2/11 4/1 5/21 7/10 8/29 10/18 12/7 1/26
Efflu
ent
Amm
onia
, mg/
l
2012
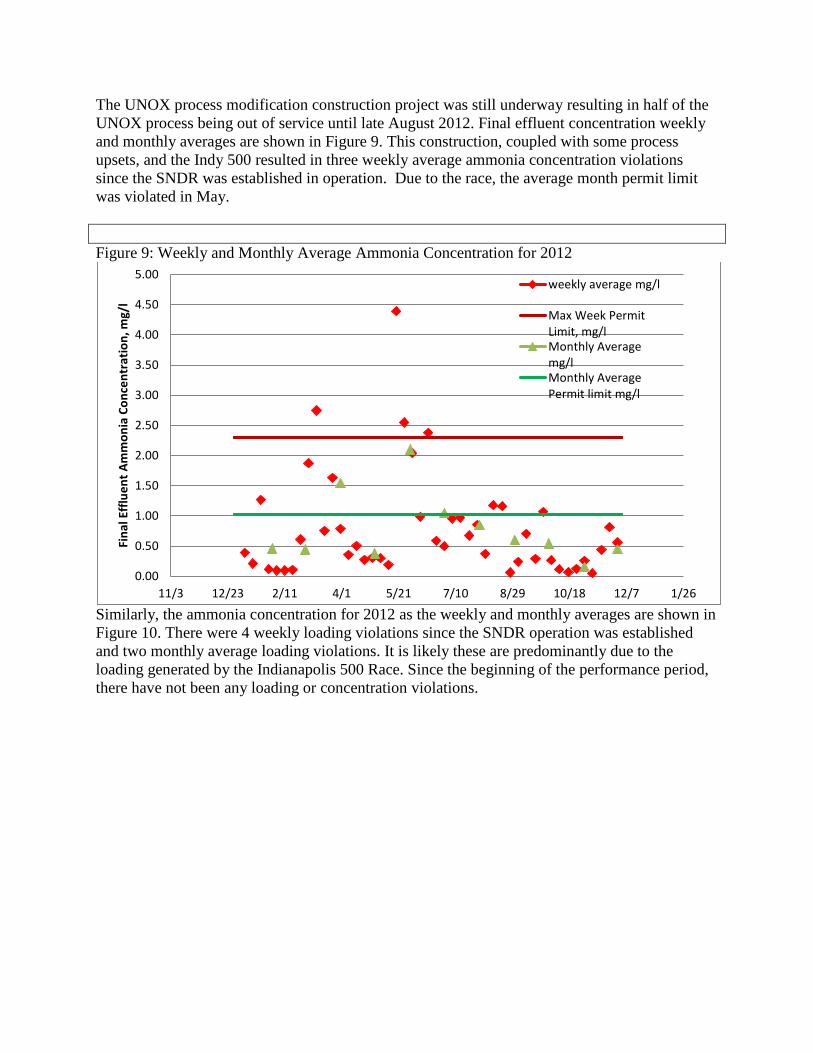
The UNOX process modification construction project was still underway resulting in half of the UNOX process being out of service until late August 2012. Final effluent concentration weekly and monthly averages are shown in Figure 9. This construction, coupled with some process upsets, and the Indy 500 resulted in three weekly average ammonia concentration violations since the SNDR was established in operation. Due to the race, the average month permit limit was violated in May. Figure 9: Weekly and Monthly Average Ammonia Concentration for 2012
Similarly, the ammonia concentration for 2012 as the weekly and monthly averages are shown in Figure 10. There were 4 weekly loading violations since the SNDR operation was established and two monthly average loading violations. It is likely these are predominantly due to the loading generated by the Indianapolis 500 Race. Since the beginning of the performance period, there have not been any loading or concentration violations.
0.00
0.50
1.00
1.50
2.00
2.50
3.00
3.50
4.00
4.50
5.00
11/3 12/23 2/11 4/1 5/21 7/10 8/29 10/18 12/7 1/26
Fina
l Effl
uent
Am
mon
ia C
once
ntra
tion,
mg/
l
weekly average mg/l
Max Week PermitLimit, mg/lMonthly Averagemg/lMonthly AveragePermit limit mg/l
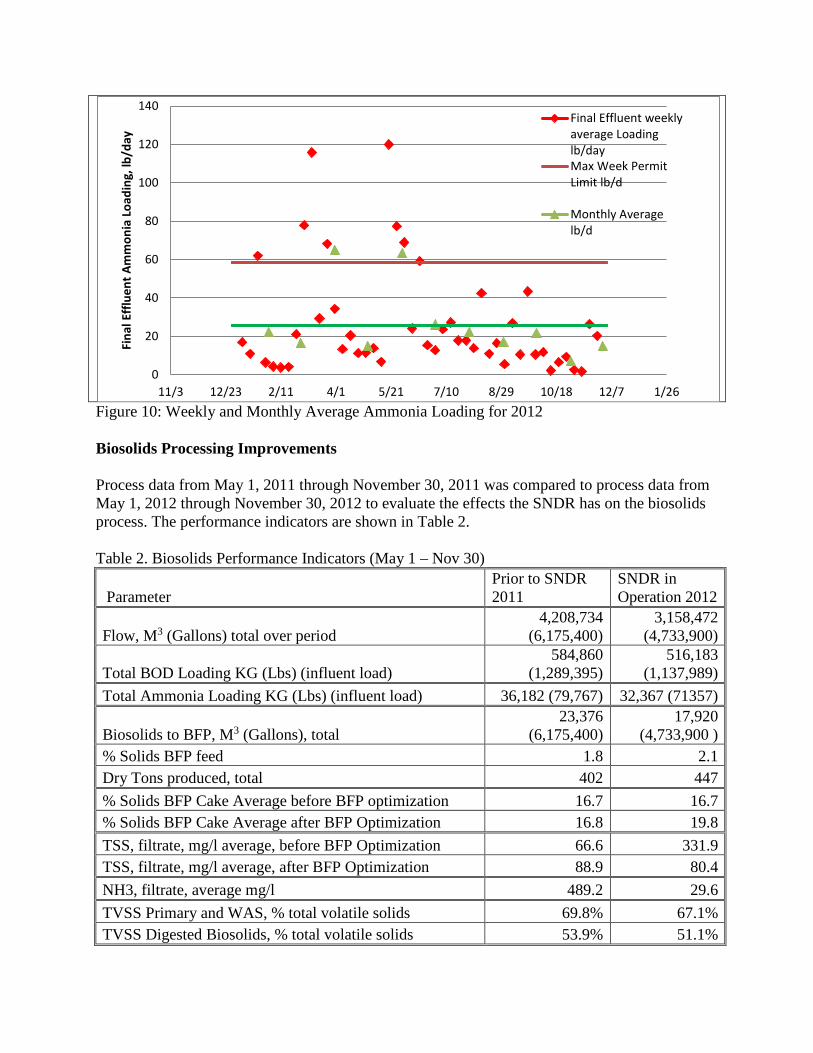
Figure 10: Weekly and Monthly Average Ammonia Loading for 2012 Biosolids Processing Improvements Process data from May 1, 2011 through November 30, 2011 was compared to process data from May 1, 2012 through November 30, 2012 to evaluate the effects the SNDR has on the biosolids process. The performance indicators are shown in Table 2. Table 2. Biosolids Performance Indicators (May 1 – Nov 30)
Parameter Prior to SNDR 2011
SNDR in Operation 2012
Flow, M3 (Gallons) total over period 4,208,734
(6,175,400) 3,158,472
(4,733,900)
Total BOD Loading KG (Lbs) (influent load) 584,860
(1,289,395) 516,183
(1,137,989)
Total Ammonia Loading KG (Lbs) (influent load) 36,182 (79,767) 32,367 (71357)
Biosolids to BFP, M3 (Gallons), total 23,376
(6,175,400) 17,920
(4,733,900 ) % Solids BFP feed 1.8 2.1 Dry Tons produced, total 402 447
% Solids BFP Cake Average before BFP optimization 16.7 16.7 % Solids BFP Cake Average after BFP Optimization 16.8 19.8
TSS, filtrate, mg/l average, before BFP Optimization 66.6 331.9 TSS, filtrate, mg/l average, after BFP Optimization 88.9 80.4
NH3, filtrate, average mg/l 489.2 29.6
TVSS Primary and WAS, % total volatile solids 69.8% 67.1% TVSS Digested Biosolids, % total volatile solids 53.9% 51.1%
0
20
40
60
80
100
120
140
11/3 12/23 2/11 4/1 5/21 7/10 8/29 10/18 12/7 1/26
Fina
l Effl
uent
Am
mon
ia L
oadi
ng, l
b/da
yFinal Effluent weeklyaverage Loadinglb/dayMax Week PermitLimit lb/d
Monthly Averagelb/d
The BFP performance has been improved since the SNDR began operations and the BFP operations was optimized. The cake solids have increased 3 percent. It is evident that in the initial operation after the SNDR was producing biosolids that the BFP performance had some significantly bad days where large quantizes of biosolids were returned to the plant. After the optimization, the filtrate suspended solids are slightly less than in the prior year. The reduction in volatile solids prior to and after the SNDR is approximately the same. Other Benefits Due to the hydrogen sulfide in the anaerobically digested sludge, the belt filter press operator historically has put a penny on the window ledge in the press room and the penny tarnished quickly. Once the SNDR process was on line, the operator put another, new penny on the window ledge. After 10 months, it is still shiny copper! The sludge feed to the BFP is also more consistent since the storage tank is mixed allowing more consistent operation of the press. The operations staff is working on further automation of the press to allow the operator to perform other duties and check the press on a regular basis, instead of only watching the press operation. Conversion of ammonia to nitrogen gas in the SNDR process has eliminated the need for the SIU to use breakpoint chlorination to control ammonia discharge. This reduces potential disinfectants and potentially toxic constituents from their waste stream. CONCLUSIONS The first application of the SNDR process for further digesting the anaerobically digested biosolids to reduce the amount of ammonia in the biosolids has resulted in a reduction of ammonia in the filtrate recycle stream. It appears that once construction is completed the reduction in ammonia recycle will be sufficient to eliminate discharge violations, except during the Indianapolis 500 race. The plant operations staff utilizes the CSO equalization basin to store the peak ammonia load during the race and process it over time. The plant does not process biosolids during the week after the race to reduce the recycle load to the plant. The combination of these operational changes will allow the plant to meet its discharge permit requirements. Additional benefits include a more easily dewatered biosolids and significantly less odors during dewatering operations. REFERENCES 1. Van Overmeiren, Frank; Pratt, Julia; Frazier, Elizabeth; Speedway Pride Brochure, Town of Speedway web site. 2. 1999 EPA Guidance Manual: Alternative Disinfectants and Oxidants 3. Commonwealth Engineers, 2009, Preliminary Engineering Report 4. Kumar, Nitin; Novac, John; Murthy, Sudhir; Sequential Anaerobic-Aeration Digestion for Enhanced Volatile Solids Reduction and Nitrogen Removal, 2006 WEF, Residuals and Biosolids Management Conference

5. TPS literature 6. Stevens, Pat; Enfinger, Kevin, Water Environment Technology, May 2012