spent 22 months collecting fine scale data on the composition & abundance of bat species in...
TRANSCRIPT

Spent 22 Months Collecting Spent 22 Months Collecting Fine Scale Data on the Fine Scale Data on the Composition & Abundance of Composition & Abundance of Bat Species in Caatinga & Bat Species in Caatinga & Edaphic Cerrado Biomes of Edaphic Cerrado Biomes of Northeastern BrazilNortheastern Brazil
COMMUNITY ECOLOGISTCOMMUNITY ECOLOGIST

Time ConsumingTime Consuming
Narrow SpecificityNarrow Specificity
Insufficient for Addressing Insufficient for Addressing Broad QuestionsBroad Questions
Unclear Comparative ContextUnclear Comparative Context
LIMITATIONSLIMITATIONS

RANGE MAPS:RANGE MAPS:
Wealth of Biogeographic,Wealth of Biogeographic,
Ecological, andEcological, and
Evolutionary InformationEvolutionary Information

BAT RANGE MAPS:BAT RANGE MAPS:
Hall for North AmericaHall for North America
Koopman for South Koopman for South AmericaAmerica
Supplemented by “Others”Supplemented by “Others”

RANGE MAPS:RANGE MAPS:
Expert OpinionExpert Opinion
Metadata ProblemsMetadata Problems
Heterogeneous QualityHeterogeneous Quality

GRADIENTS OF RICHNESSGRADIENTS OF RICHNESSAND RANGE AND RANGE SIZE:SIZE:
BATS ANDBATS ANDMARSUPIALS MARSUPIALS IN THE NEW WORLDIN THE NEW WORLD

LATITUDINALLATITUDINALGRADIENTGRADIENT
OFOFSPECIES SPECIES
RICHNESSRICHNESS

CAUSESCAUSES
• Competition• Population Size• Growth Rates• Epiphyte Load• Harshness• Predation
• Heterogeneity• Niche Width• Patchiness• Host Diversity• Mutualism• Epidemics

CAUSESCAUSES
• Stability• Productivity• Heterogeneity• Aridity• Habitat Number
• Predictability• Rarefaction• Area• Seasonality• Range Size
• Evolutionary Speed

LIMITATIONSLIMITATIONS• Qualitative PredictionsQualitative Predictions
• Non Mutually ExclusiveNon Mutually Exclusive
• Unspecified FormUnspecified Form
• No Expected ValuesNo Expected Values

Hemispheric PatternsHemispheric Patterns
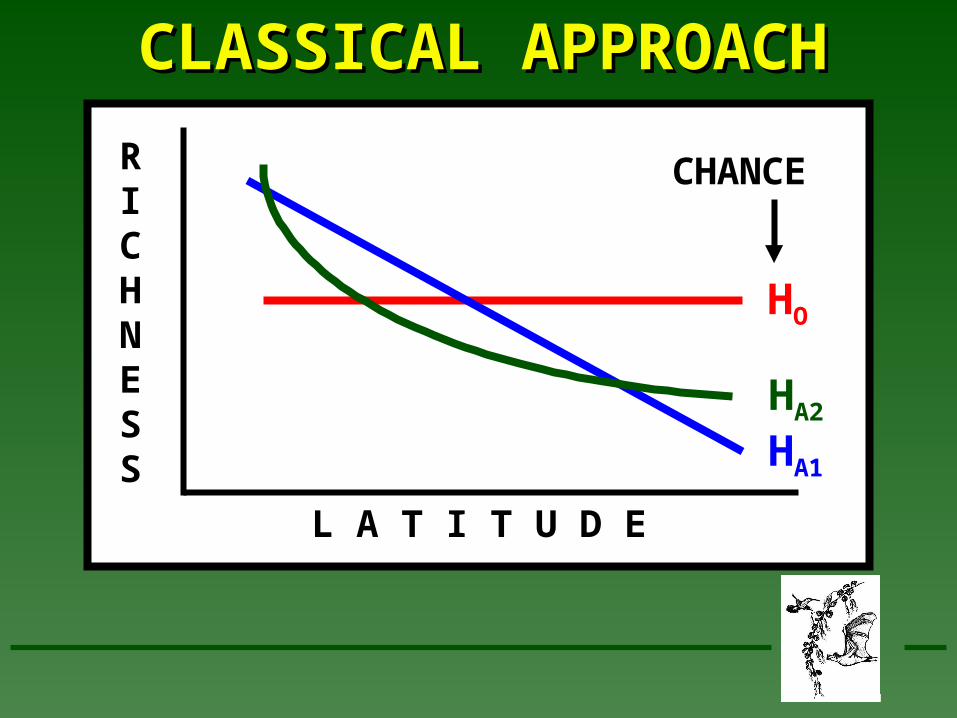
CLASSICAL APPROACHCLASSICAL APPROACH
RICHNESS
L A T I T U D E
HO
HA1
HA2
CHANCE

STOCHASTICSTOCHASTIC
PROCESSES PROCESSES
ANDAND
NULL MODELSNULL MODELS

SIMULATION NULL MODELSIMULATION NULL MODEL
LATITUDE
0
1
3
4
5
7
5
3
2
2
RICHNESS

SIMULATION APPROACHSIMULATION APPROACH
•Randomly generate N & S termini for a Randomly generate N & S termini for a speciesspecies
•Repeat until S = richness of species poolsRepeat until S = richness of species pools
•Calculate richness at each latitudeCalculate richness at each latitude
•Repeat 1,000 timesRepeat 1,000 times
•Calculate mean and variance of richness Calculate mean and variance of richness per latitudeper latitude

EFFECT OF SPECIES POOL SIZEEFFECT OF SPECIES POOL SIZESIMULATION RESULTSSIMULATION RESULTS

1q
p
P
0
PROBABALISTIC APPROACHPROBABALISTIC APPROACH
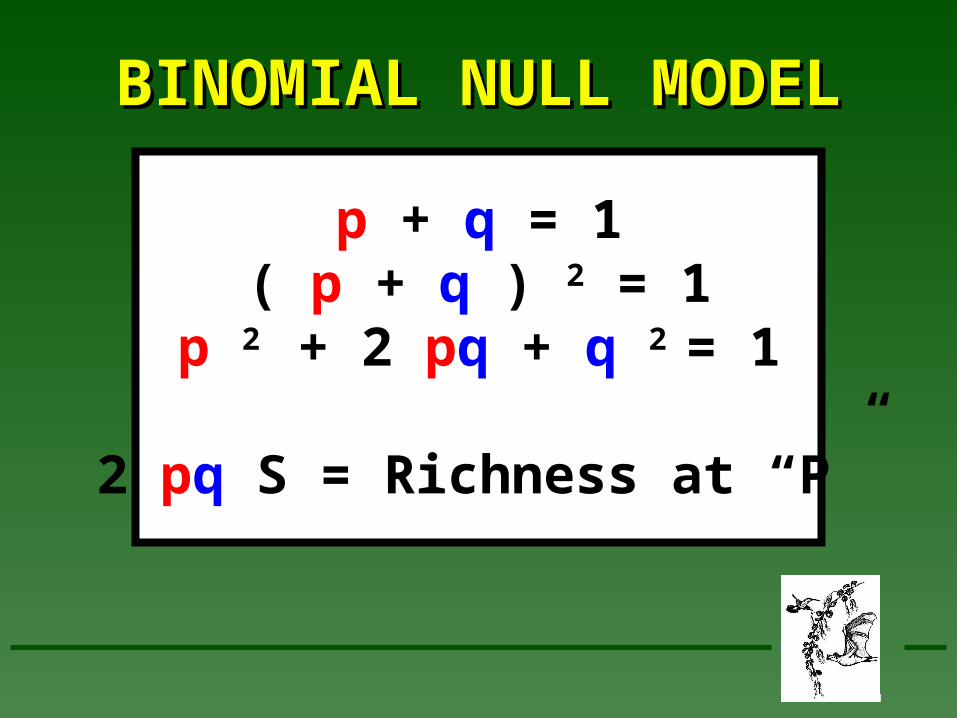
BINOMIAL NULL MODELBINOMIAL NULL MODEL
p + q = 1( p + q ) 2 = 1
p 2 + 2 pq + q 2 = 1
2 pq S = Richness at “P”

1
0
q
p
P
SPECIES RICHNESS
GRAPHIC REPRESENTATIONGRAPHIC REPRESENTATION
2pqS
Domain

NULL MODELNULL MODEL
• Predicts Form of Predicts Form of RelationRelation
• Quantitative PredictionsQuantitative Predictions
• FalsifiableFalsifiable

NEW WORLDNEW WORLDBATSBATSANDAND
MARSUPIALSMARSUPIALS

Chrotopterus auritus

Neoplatymopsmattogrossensis

BATSBATS
Species richSpecies rich
Trophically richTrophically rich
Abundant in tropicsAbundant in tropics

BATS – ENTIRE CONTINENTBATS – ENTIRE CONTINENT
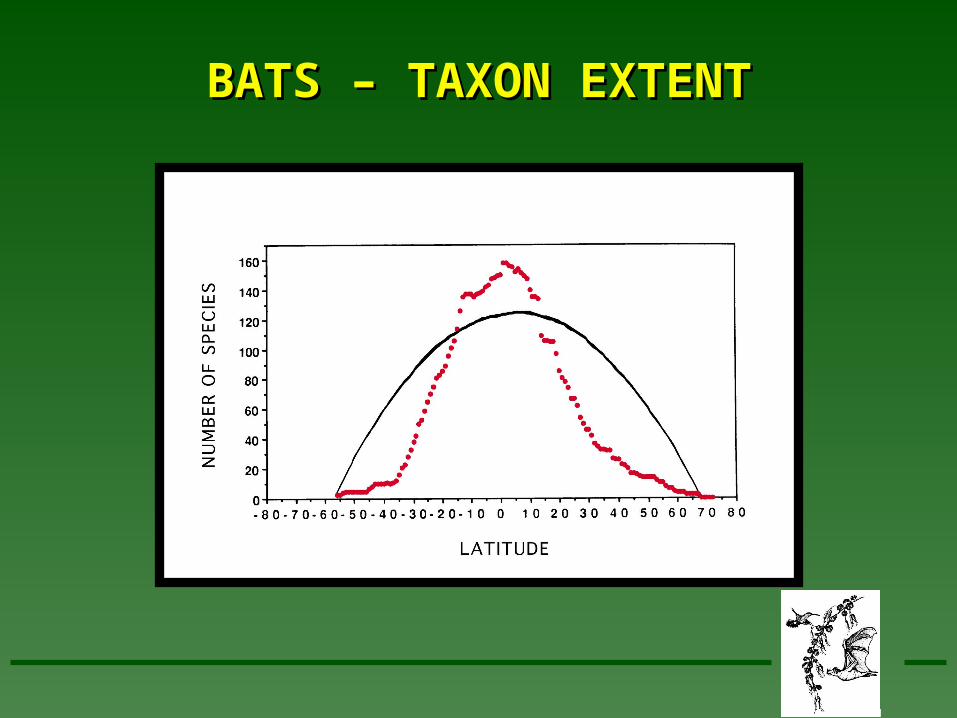
BATS – TAXON EXTENTBATS – TAXON EXTENT

BATS – 95% OF EXTENTBATS – 95% OF EXTENT

Didelphis virginiana

Marmosa cinerea

MARSUPIALSMARSUPIALS
Ancient group of mammalsAncient group of mammals
Moderate species richnessModerate species richness
Trophically diverse in pastTrophically diverse in past

MARSUPIALS – ENTIRE CONTINENTMARSUPIALS – ENTIRE CONTINENT

MARSUPIALS – TAXON EXTENTMARSUPIALS – TAXON EXTENT

MARSUPIALS – 95% OF EXTENTMARSUPIALS – 95% OF EXTENT

MODEL UTILITYMODEL UTILITY
• Deviations from the model Deviations from the model differ between bats and differ between bats and marsupialsmarsupials
• Deviations are not related to Deviations are not related to the area of latitudinal bandsthe area of latitudinal bands

RANDOM SUBSETSRANDOM SUBSETS
• 20 Ranges20 Ranges
• 2020oo Latitude Latitude
• 20 Species20 Species

RANDOM SUBSETSRANDOM SUBSETS
SPECIES RICHNESS1
0
q
p
BATS20 ***r = 0.77
MARSUPIALS19 ***r = 0.73
P

ASSESSMENTASSESSMENT
Although stochastic mechanisms Although stochastic mechanisms may not be the only factors may not be the only factors affecting gradients, they play an affecting gradients, they play an appreciable role throughout the appreciable role throughout the distribution of a biotadistribution of a biota

MODEL UTILITYMODEL UTILITY
• Deviations from the model Deviations from the model differ between bats and differ between bats and marsupialsmarsupials
• Deviations are not related to Deviations are not related to the area of latitudinal bandsthe area of latitudinal bands

MULTIFACTORIALMULTIFACTORIAL
• Many FactorsMany Factors
• Species-Specific LimitsSpecies-Specific Limits
• Factor-Specific N and S Factor-Specific N and S Limits Limits

EXTRAPOLATIONSEXTRAPOLATIONS
• Disturbance GradientsDisturbance Gradients
• Productivity GradientsProductivity Gradients
• Abiotic GradientsAbiotic Gradients

LATITUDINAL LATITUDINAL
GRADIENT OF GRADIENT OF
SPECIES RANGE SIZESPECIES RANGE SIZE
RAPOPORT’S RAPOPORT’S RULE RULE

METHODOLOGICAL BIASESMETHODOLOGICAL BIASES
TropicalSpecies
TemperateSpecies
0o

SIMULATION APPROACHSIMULATION APPROACH
•Randomly generate N & S termini for a Randomly generate N & S termini for a speciesspecies
•Repeat until S = richness of species poolsRepeat until S = richness of species pools
•Calculate correlation between latitudinal Calculate correlation between latitudinal range size and mid-latituderange size and mid-latitude
•Repeat 1,000 timesRepeat 1,000 times
•Calculate mean and variance of correlationsCalculate mean and variance of correlations

SOUTH AMERICA NORTH AMERICAL
AT
ITU
DIN
AL
RA
NG
E
0
150
100
50
MID-LATITUDE-70 -50 -30 -10 10 30 50 70
BATSBATS

SOUTH AMERICA NORTH AMERICAL
AT
ITU
DIN
AL
RA
NG
E
0
150
100
50
MID-LATITUDE-70 -50 -30 -10 10 30 50 70
MARSUPIALSMARSUPIALS

BATS
0
100
200
FR
EQ
UE
NC
Y
-0.56 -0.53 -0.49 -0.45 -0.42 -0.38 -0.35 -0.31
CORRELATION COEFFICIENT
MARSUPIALS
-0.63 -0.56 -0.49 -0.42 -0.35 -0.29 -0.22 -0.150
100
200
MID-LATITUDE RESULTSMID-LATITUDE RESULTSLess
Negative
LessNegative

LATITUDE
RA
NG
E S
IZE
MID-LATITUDE RESULTSMID-LATITUDE RESULTS
Rapoport’s Rule
Empirical Pattern
Empirical Pattern
Stochastic Pattern

Comparisons of Gradients Comparisons of Gradients of Diversity of Diversity at Two at Two Scales:Scales:
Communities Versus Communities Versus Regional Species PoolsRegional Species Pools

SCALE
Regional Patterns
Local Patterns

LATITUDINAL LATITUDINAL GRADIENTS OFGRADIENTS OF
COMMUNITYCOMMUNITYORGANIZATIONORGANIZATION
DESIGN DESIGN
• Geographical Constraints (50 km)Geographical Constraints (50 km)
• Ecological Constraints (biome)Ecological Constraints (biome)
• Sampling Constraints (asymptote)Sampling Constraints (asymptote)
• Temporally Constrained (1-5 yr)Temporally Constrained (1-5 yr)

32 Sites32 Sites
TemperateTemperate
SubtropicalSubtropical
TropicalTropical
SubtropicalSubtropical
TemperateTemperate
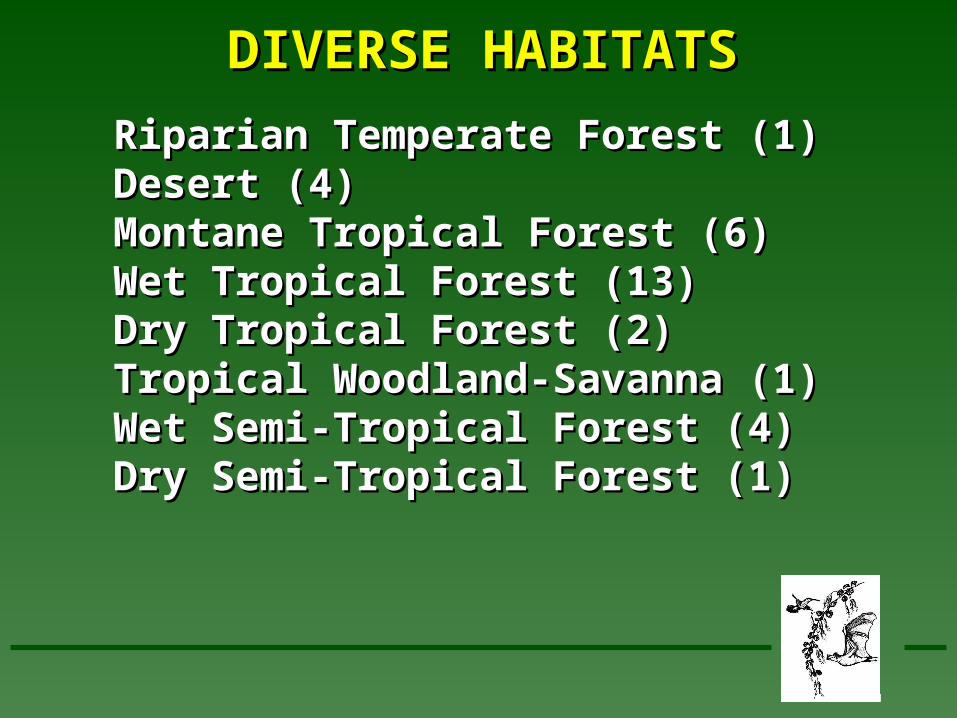
DIVERSE HABITATSDIVERSE HABITATS
Riparian Temperate Forest (1)Riparian Temperate Forest (1)Desert (4)Desert (4)Montane Tropical Forest (6)Montane Tropical Forest (6)Wet Tropical Forest (13)Wet Tropical Forest (13)Dry Tropical Forest (2)Dry Tropical Forest (2)Tropical Woodland-Savanna (1)Tropical Woodland-Savanna (1)Wet Semi-Tropical Forest (4)Wet Semi-Tropical Forest (4)Dry Semi-Tropical Forest (1)Dry Semi-Tropical Forest (1)

FAUNAL POOL - SPECIFIC DATAFAUNAL POOL - SPECIFIC DATA
• Number of species whose Number of species whose geographic range overlaps a geographic range overlaps a communitycommunity
• Identities of species whose range Identities of species whose range overlaps a community overlaps a community

COMMUNITY - SPECIFIC DATACOMMUNITY - SPECIFIC DATA
• Species identities &Species identities & abundances in each abundances in each communitycommunity
• Indexes of diversity that are sensitive to Indexes of diversity that are sensitive to richness (3), evenness (4), dominance (3), richness (3), evenness (4), dominance (3), diversity (4)diversity (4)

BIODIVERSITY INDICIESBIODIVERSITY INDICIESRICHNESSRICHNESSCommunity RichnessCommunity RichnessMargalef IndexMargalef IndexMenhinick IndexMenhinick Index
EVENNESSEVENNESSShannon IndexShannon IndexPIE IndexPIE IndexCamargo’s IndexCamargo’s IndexShoener’s IndexShoener’s Index
DIVERSITYDIVERSITYCamargo IndexCamargo IndexLog Series AlphaLog Series AlphaBrillouin IndexBrillouin IndexShannon IndexShannon Index
DOMINANCEDOMINANCESimpson’s IndexSimpson’s IndexBerger-Parker IndexBerger-Parker IndexMcIntosh IndexMcIntosh Index

3
-3 3-3
0
0
FACTOR 1
FA
CT
OR
2
TropicalSubtropicalTemperate
Evenness DominanceDiversityRichness
Factor AnalysisFactor Analysis
CE O
BP PIESI
MD
SHDB
CD
AMAR
R
SHE
MER

Latitudinal GradientsLatitudinal Gradients
-3
0
3
0 15 30 45-3
0
3
0 15 30 45
TropicalSubtropicalTemperate
TropicalSubtropicalTemperate
Latitude Latitude
Fac
tor
1
Fac
tor
2
RichnessRichness EvennessEvennessBB1 1 = 0.0002; r= 0.0002; r22 < 0.01; P = 0.999 < 0.01; P = 0.999BB1 1 = -0.055; r= -0.055; r22 = 0.37; P < 0.001 = 0.37; P < 0.001

REGIONAL & LOCAL GRADIENTSREGIONAL & LOCAL GRADIENTS
Latitude
Ric
hn
ess
RegionalRegionalLocalLocal
12O
90
60
90
10 20 30 40

LATITUDINAL GRADIENTSLATITUDINAL GRADIENTS