sphera franchise group · kfc kfc italy pizza hut taco bell. significant further growth...
TRANSCRIPT

1
Interim results: Jan-Sep 2017
Sphera Franchise Group

2
Disclaimer
This presentation is not, and nothing in it should be construed as, an offer, invitation or recommendation in respect of shares issued by Sphera
Franchise Group SA ("Sphera"), or an offer, invitation or recommendation to sell, or a solicitation of an offer to buy shares in Sphera.
Neither this presentation nor anything in it shall form the basis of any contract or commitment. This presentation is not intended to be relied upon as
advice or recommendation to investors or potential investors and does not take into account the investment objectives, financial situation or needs of
any investor.
All investors should consider this presentation in consultation with a professional advisor of their choosing when deciding if an investment is
appropriate.
Sphera has prepared this presentation based on information available to it, including in-formation derived from public sources that have not been
independently verified. No representation or warranty, express or implied, is provided in relation to the fairness, accuracy, correctness, completeness
or reliability of the information, opinions or conclusions ex-pressed herein.
This presentation should not be considered a comprehensive representation of Sphera's business, financial performance or results.
This presentation may contain forward-looking statements. These statements reflect Sphera’s current knowledge and its expectations and projections
about future events and may be identified by the context of such statements or words such as “anticipate,” “believe”, “estimate”, “expect”, “intend”,
“plan”, “project”, “target”, “may”, “will”, “would”, “could” or “should” or similar terminology.
Sphera undertakes no obligation to update or revise these forward–looking statements to reflect events or circumstances that arise after the date made
or to reflect the occurrence of unanticipated events. Inevitably, some assumptions may not materialize, and un-anticipated events and circumstances
may affect the ultimate financial results. Projections are inherently subject to substantial and numerous uncertainties and to a wide variety of significant
business, economic and competitive risks.
Therefore, the final results achieved may vary significantly from the forecasts, and the variations may be material.

3
Sphera – 2017 key events
▪ Successful IPO & listing on the BSE
▪ EUR 62m @ RON 29/share
▪ +14% stock price growth in first trading week
▪ Strong sales & operational performance
▪ Double-digit same-store sales growth
▪ YTD net openings: 11
▪ On plan to reach 116 units by YE (+18 Y/Y)
▪ Leading top of mind awareness for both KFC and Pizza Hut
▪ Taco Bell launches with a big bang!
▪ Consolidated nine-month Financials
▪ Sales +33.6%
▪ EBITDA +11.4%
▪ net profit +17.5%

4
holds the franchise
rights to operate KFC-
branded restaurants in
Moldova
holds the franchise
rights to operate KFC-
branded restaurants in
certain regions of Italy
holds the franchise
rights to operate Taco
Bell-branded
restaurants in Romania
holds the franchise
rights to operate Pizza
Hut-branded restaurants
in Romania (Pizza Hut
Dine-In and Pizza Hut
Delivery)
holds sub-franchise
rights
holds the franchise
rights to operate KFC-
branded restaurants in
Romania
Sphera at a glance
US Food Network S.A.American Restaurant
System S.A.
California Fresh Flavors
S.R.L.
US Food Network S.R.L.
- Italy
US Food Network
S.R.L. - Moldova
99.9% 99.9% 99.9% 100% 80%
Corporate structure

5
Sphera at a glance
#2
#1
#2
QSR
Opened 12-Oct-2017
player on the QSR segment (18% market share)
and #1 on the chicken segment
#2 player on the overall chained foodservice market (15% market share)
✓ 81% spontaneous brand awareness among Romanian
customers (Q2 2017)
✓ customer base consists mainly of young and
middle aged people (78%), mostly educated
(at least 35% high school), with an average
household income
✓ 69 restaurants as of 15-Nov-2017
player on the FSR segment
(nearly 3% market share)
#3 player on the overall chained
foodservice market (7% market share)
✓ 49% spontaneous brand awareness among
Romanian customers
✓ customer base consists mainly of young and middle
aged people (78%), mostly educated (at least 41% high
school & 32% university), with a focus on families with
an average to medium-high household income
✓ 21 restaurants as 31 August 2017
player on the Home delivery segment (nearly 21%
market share)
✓ Order accessibility: classic call center lines,
dedicated website platform, mobile
application
✓ 17 restaurants as of
15-Nov-2017
✓ As of June 2017: 28% electronic
orders
Source: Company information; Euromonitor, Consumer Foodservice in Romania, May 2017
Leading restaurant group in Romania by sales, network and sector coverage

6
Sphera at a glance
▪ Careful selection of
restaurants' location
▪ Extensive research in
order to choose optimal
area and restaurant
format
▪ Focus on Bucharest
with continuous
expansion into other
major cities and smaller
cities
▪ Aggressive approach
while entering new
markets
Locations
▪ Offering products
popular among local
clientele
▪ Attracting customers by
introducing value
options and deals and
increasing convenience
of ordering
▪ Expanding the menu to
retain current
customers and attract
potential ones
Pro
duct
▪ Cooperation with the
best specialists to
maximize the results of
marketing exercises
▪ Wide range of
communication
channels
▪ Increased technology
and digital focus across
all brands
▪ Driving brand loyalty
and consumer
awareness up
Mark
eting
Bra
nds
▪ Operating brands with a
successful market
recognition, locally and
internationally
▪ Complementary brand
portfolio with no
product overlaps
▪ Focus on continuous
expansion and
diversification of the
brand portfolio
The Company’s Value Proposition

7
Sphera at a glance
Note: Size of segments do not constitute indication to their contribution to the overall growth.
Text
Long-term growth strategy based on four key pillars
Maintain Strong LFL Sales Growth
Continue Organic Network Roll-out
Develop a Significant KFC Business in Italy
Expand Brand Portfolio – Taco Bell

Sales performance by brands
9
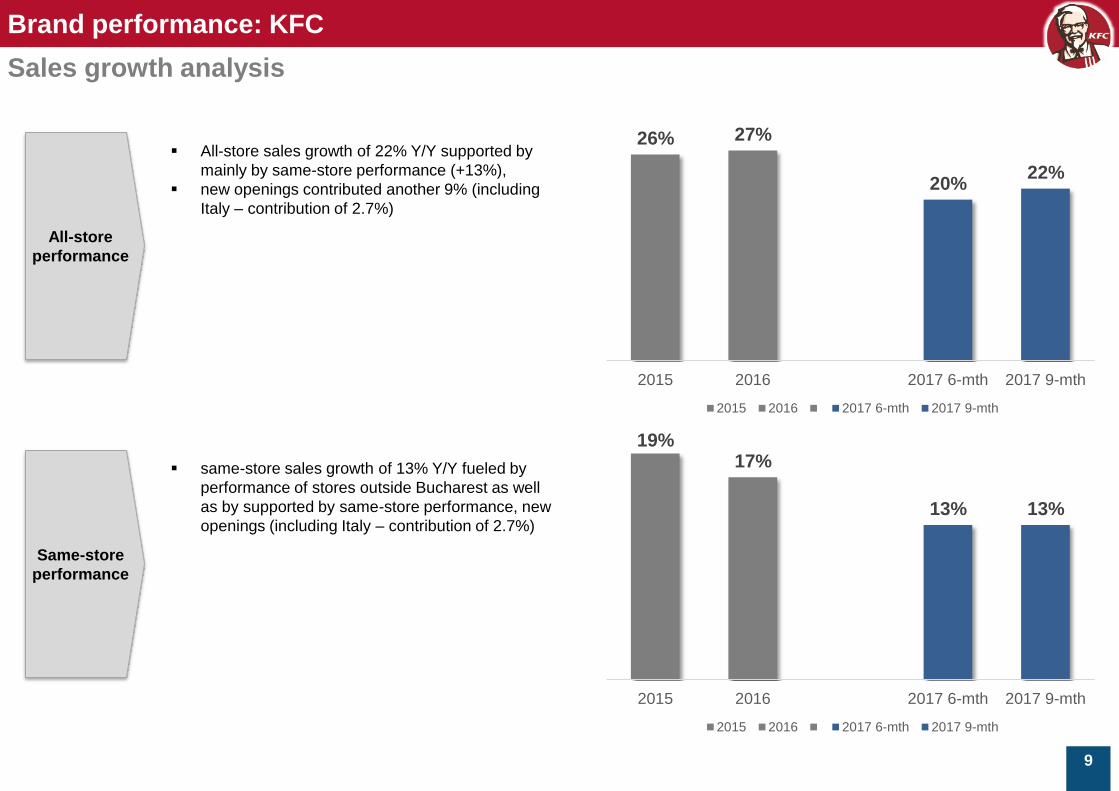
Brand performance: KFC
Sales growth analysis
19%17%
13% 13%
2015 2016 2017 6-mth 2017 9-mth
2015 2016 2017 6-mth 2017 9-mth
Same-store
performance
26% 27%
20%22%
2015 2016 2017 6-mth 2017 9-mth
2015 2016 2017 6-mth 2017 9-mth
All-store
performance
▪ All-store sales growth of 22% Y/Y supported by
mainly by same-store performance (+13%),
▪ new openings contributed another 9% (including
Italy – contribution of 2.7%)
▪ same-store sales growth of 13% Y/Y fueled by
performance of stores outside Bucharest as well
as by supported by same-store performance, new
openings (including Italy – contribution of 2.7%)

10
Brand performance: Pizza Hut
Sales growth analysis
Same-store
performance
All-store
performance
10%
13%
3%4%
2015 2016 2017 6-mth 2017 9-mth
2015 2016 2017 6-mth 2017 9-mth
19%17% 17%
16%
2015 2016 2017 6-mth 2017 9-mth
2015 2016 2017 6-mth 2017 9-mth
▪ All-store sales growth of 16% Y/Y supported by
mainly by new openings (contribution of 12% to
the overall growth), especially coming from the
new delivery units
▪ same-store sales growth of 4% Y/Y fueled mainly
by the better performance of the delivery units

Development
12
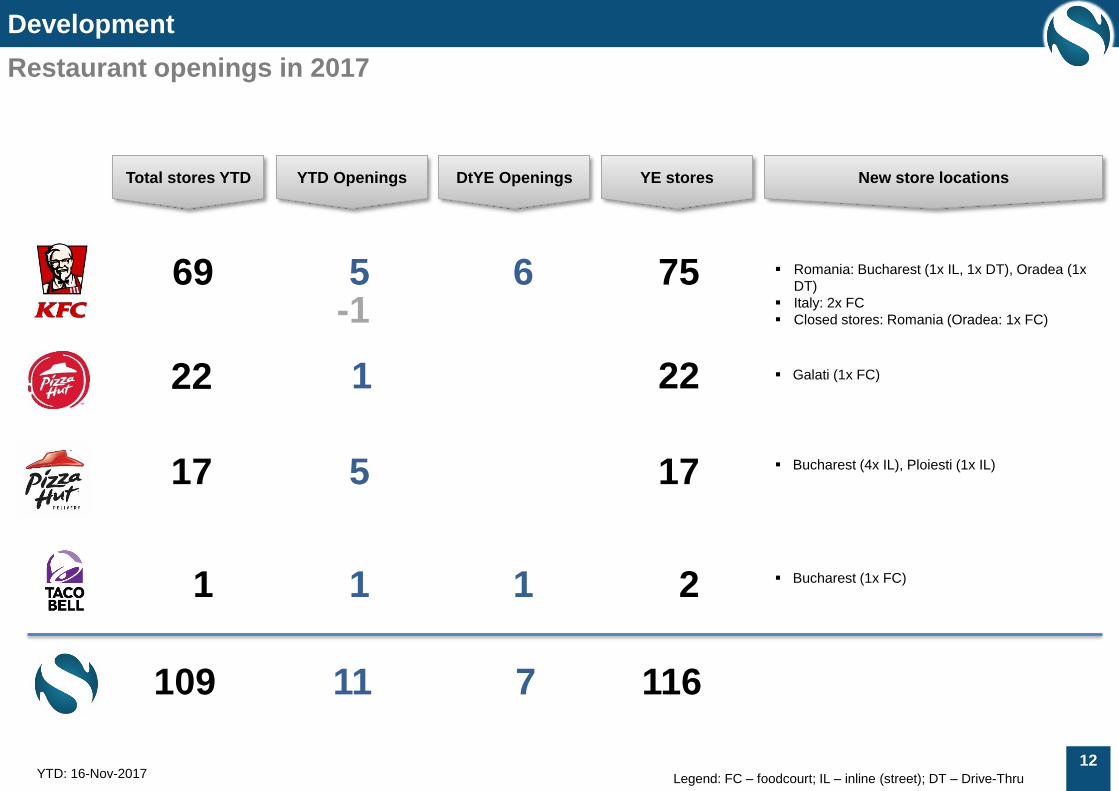
Development
Restaurant openings in 2017
YTD OpeningsTotal stores YTD New store locations
5
5
1
69
17
1
22
▪ Romania: Bucharest (1x IL, 1x DT), Oradea (1x
DT)
▪ Italy: 2x FC
▪ Closed stores: Romania (Oradea: 1x FC)
▪ Bucharest (4x IL), Ploiesti (1x IL)
▪ Bucharest (1x FC)
Legend: FC – foodcourt; IL – inline (street); DT – Drive-Thru
-1
DtYE Openings YE stores
6
1
1
75
17
2
22
11109 7 116
YTD: 16-Nov-2017
▪ Galati (1x FC)

13

14

15

16
5360 65
7279
8696
106116
3
9
17
25
32
34
23
27
33
39
46
53
61
69
77
2
5
10
12
14
14
0
50
100
150
200
250
2014 2015 2016 2017 2018 2019 2020 2021 2022
KFC KFC Italy Pizza Hut Taco Bell
Significant Further Growth Opportunities
Source: Company information
Notes: (1) Includes KFC Romania and KFC Moldova (2) Exception 2017 with actual expected total number of units (two units above target)
(1)
76
87
98
116
139
166
194
221
241
Total Restaurants
Total Restaurants at year-end (considering target roll-out2)

17
Significant Further Growth Opportunities
KFC RomaniaCommitment 4 6 7 8 9 9 43
Target 7 7 7 10 10 10 51
Pizza Hut: Commitment 6 7 7 8 8 8 44
Delivery Target 5 5 5 6 6 6 33
Dine in Target 1 2 2 2 2 2 11
Taco Bell RomaniaCommitment 2 3 5 - - - 10
Target 2 3 5 2 2 - 14
KFC Italy (North-East
& Piemonte)
Commitment 3 6 8 7 7 1 32
Target 3 6 8 8 7 2 34
Restaurants roll-out plan by brands
TOTAL OPENINGSCommitment 15 22 27 23 24 18 129
Target 18 23 27 28 27 20 143
2017 2018 2019 2020 2021 2022 Total

Marketing / CSR

19
Marketing
Note: (1) size of campaigns’ pictures are not an indication of exact duration of the respective campaign
Continuous activities to promote our brands
January February March April May June July August September October November December

20
Marketing
Q3-2017 highlights
▪ KFC focused on value innovation for Q3, successfully launching a new recipe for Duetos
after researching it with consumers; sales results were above expectations with +11.2%
same-store sales growth and the product was bought almost half a million times during the
campaign
▪ KFC and Pizza Hut were leaders in top of mind awareness in Q3 surpassing their main
competitor: 39% for KFC vs 29% McDonald’s and 26% for Pizza Hut vs 5% Trattoria
▪ Taco Bell launched with a big bang in Bucharest, creating lines for weeks, flooding social
media channels and setting a new European record for the opening week
▪ Pizza Hut flagship store (Dorobanti) was elevated through modern design and a new menu
including burgers and ribs in the context of moving the brand to a positioning of
“experience”; after the redesign of the store sales grew by 14% compared to last year
▪ Pizza Hut Delivery launched a media campaign to generate downloads of its Mobile App;
the campaign resulted in 3,500 no of downloads in the first month and 7.2% of all
customers have ordered through the mobile app. Today, overall online ordering represents
over 29% of total delivery sales, one of the highest in Europe

21
‘Hospice, House of Hope’“SOS Children’s Villages Bucharest”
‘Physics (taught) differently’ (with CEAE)‘I want to go to high-school’ (with World Vision Romania)
Corporate Social Responsibility
Ongoing CSR campaigns & programs
EUR 130k
raised in
2017, to
finance
school for 200
children

Financials
23
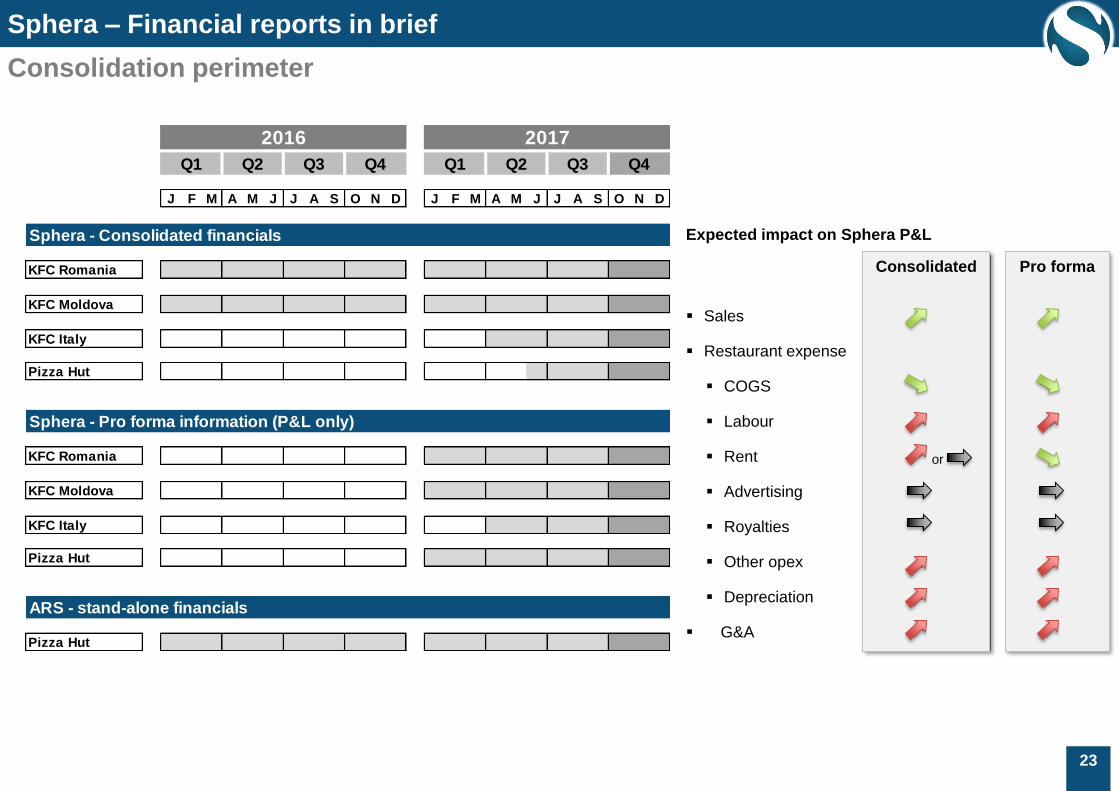
Sphera – Financial reports in brief
Consolidation perimeter
2016 2017
Q1 Q2 Q3 Q4 Q1 Q2 Q3 Q4
J F M A M J J A S O N D J F M A M J J A S O N D
Sphera - Consolidated financials
KFC Romania
KFC Moldova
KFC Italy
Pizza Hut
Sphera - Pro forma information (P&L only)
KFC Romania
KFC Moldova
KFC Italy
Pizza Hut
ARS - stand-alone financials
Pizza Hut
Consolidated
Expected impact on Sphera P&L
▪ Sales
▪ Restaurant expense
▪ COGS
▪ Labour
▪ Rent
▪ Advertising
▪ Royalties
▪ Other opex
▪ Depreciation
▪ G&A
Pro forma
or

Pro forma financials
25
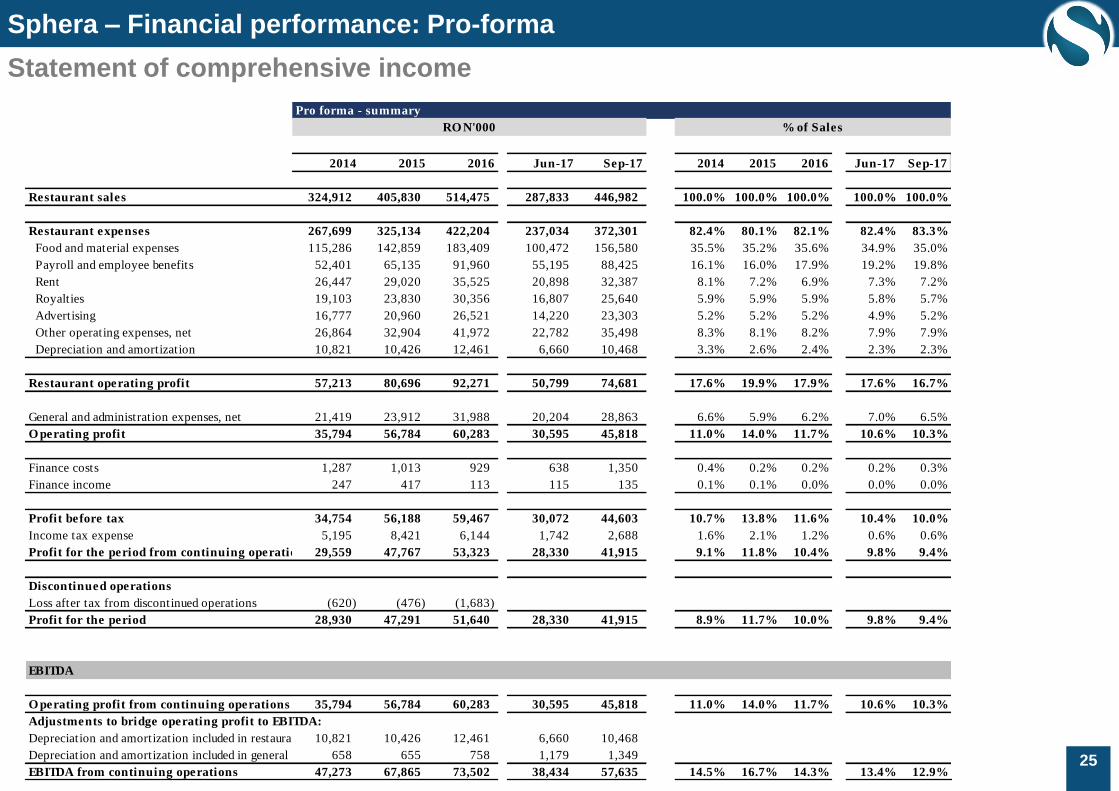
Sphera – Financial performance: Pro-forma
Statement of comprehensive income
Pro forma - summary
RO N'000 % of Sales
2014 2015 2016 Jun-17 Sep-17 2014 2015 2016 Jun-17 Sep-17
Restaurant sales 324,912 405,830 514,475 287,833 446,982 100.0% 100.0% 100.0% 100.0% 100.0%
Restaurant expenses 267,699 325,134 422,204 237,034 372,301 82.4% 80.1% 82.1% 82.4% 83.3%
Food and material expenses 115,286 142,859 183,409 100,472 156,580 35.5% 35.2% 35.6% 34.9% 35.0%
Payroll and employee benefits 52,401 65,135 91,960 55,195 88,425 16.1% 16.0% 17.9% 19.2% 19.8%
Rent 26,447 29,020 35,525 20,898 32,387 8.1% 7.2% 6.9% 7.3% 7.2%
Royalties 19,103 23,830 30,356 16,807 25,640 5.9% 5.9% 5.9% 5.8% 5.7%
Advertising 16,777 20,960 26,521 14,220 23,303 5.2% 5.2% 5.2% 4.9% 5.2%
Other operating expenses, net 26,864 32,904 41,972 22,782 35,498 8.3% 8.1% 8.2% 7.9% 7.9%
Depreciation and amortization 10,821 10,426 12,461 6,660 10,468 3.3% 2.6% 2.4% 2.3% 2.3%
Restaurant operating profit 57,213 80,696 92,271 50,799 74,681 17.6% 19.9% 17.9% 17.6% 16.7%
General and administration expenses, net 21,419 23,912 31,988 20,204 28,863 6.6% 5.9% 6.2% 7.0% 6.5%
O perating profit 35,794 56,784 60,283 30,595 45,818 11.0% 14.0% 11.7% 10.6% 10.3%
Finance costs 1,287 1,013 929 638 1,350 0.4% 0.2% 0.2% 0.2% 0.3%
Finance income 247 417 113 115 135 0.1% 0.1% 0.0% 0.0% 0.0%
Profit before tax 34,754 56,188 59,467 30,072 44,603 10.7% 13.8% 11.6% 10.4% 10.0%
Income tax expense 5,195 8,421 6,144 1,742 2,688 1.6% 2.1% 1.2% 0.6% 0.6%
Profit for the period from continuing operations 29,559 47,767 53,323 28,330 41,915 9.1% 11.8% 10.4% 9.8% 9.4%
Discontinued operations
Loss after tax from discontinued operations (620) (476) (1,683)
Profit for the period 28,930 47,291 51,640 28,330 41,915 8.9% 11.7% 10.0% 9.8% 9.4%
EBITDA
O perating profit from continuing operations 35,794 56,784 60,283 30,595 45,818 11.0% 14.0% 11.7% 10.6% 10.3%
Adjustments to bridge operating profit to EBITDA:
Depreciation and amortization included in restaurant expenses10,821 10,426 12,461 6,660 10,468
Depreciation and amortization included in general and administration expenses658 655 758 1,179 1,349
EBITDA from continuing operations 47,273 67,865 73,502 38,434 57,635 14.5% 16.7% 14.3% 13.4% 12.9%

Consolidated financials

27
Sphera – Consolidated financial performance
Breakdown by main companies
Sphera (Consolidated) Sphera USFN-C ARS
Data in RON'000 Sep-16 Sep-17 Δ% Y/Y % of Sales Sep-17
Restaurant sales 300,482 401,353 33.6% 100.0% 100.0% 401,353 365,776 35,577
Food and material 114,913 144,052 25.4% 38.2% 35.9% 144,052 134,519 9,533
Payroll and employee benefits 48,143 76,660 59.2% 16.0% 19.1% 76,660 67,098 9,562
Rent 19,803 28,490 43.9% 6.6% 7.1% 28,490 25,241 3,249
Royalties 17,699 22,958 29.7% 5.9% 5.7% 22,958 20,909 2,049
Advertising 14,615 20,807 42.4% 4.9% 5.2% 20,807 18,015 2,792
Other operating expenses 21,158 31,190 47.4% 7.0% 7.8% 31,190 27,006 4,184
Depreciation 6,260 8,580 37.1% 2.1% 2.1% 8,580 7,340 1,240
Restaurant operating profit 57,891 68,616 18.5% 19.3% 17.1% 68,616 65,648 2,968
G&A expenses 16,534 24,491 48.1% 5.5% 6.1% 24,491 20,490 4,001
Operating profit 41,357 44,125 6.7% 13.8% 11.0% 44,125 45,158 -1,033
Finance costs 820 1,152 40.5% 0.3% 0.3% 1,152 944 208
Finance income 73 129 76.7% 0.0% 0.0% 129 128 1
Profit before tax 40,610 43,102 6.1% 13.5% 10.7% 43,102 44,342 -1,240
Income tax expense 5,755 2,135 -62.9% 1.9% 0.5% 2,135 1,505 630
Profit for the period 34,855 40,967 17.5% 11.6% 10.2% 40,967 42,837 -1,870
Profit for the period 34,855 40,967 17.5% 11.6% 10.2% 40,967 42,837 -1,870
Statement of comprehensive income

28
Sphera – Consolidated financial performance
All data are in RON’000 unless
otherwise stated 31-Dec-16 30-Jun-17 30-Sep-17
Assets
Non-current assets 54,245 143,055 155,503
Property, plant and equipment 47,551 81,159 91,991
Intangible assets 6,365 60,475 61,485
Trade and other receivables_LT 285 163
Deposits for guarantees 290 668 1,368
Deferred tax assets 39 468 496
Current assets 65,399 51,769 56,545
Inventories 5,744 7,458 7,545
Trade and other receivables 8,780 5,077 6,118
Prepayments 1,907 3,418 3,195
Cash and short-term deposits 48,968 35,816 39,687
Assets held for sale 195 195
Total assets 119,644 195,019 212,243
All data are in RON’000 unless
otherwise stated 31-Dec-16 30-Jun-17 30-Sep-17
Equity and liabilities
Total equity 58,253 100,342 114,094
Equity attributable to equity holders of the parent58,292 100,339 114,053
Issued capital 190 581,990 581,990
Other capital reserves 19 0 0
Retained earnings 58,124 38,977 52,705
Share premium -520,557 -520,578
Foreign currency translation reserve -41 -71 -64
Non-controlling interests -39 3 41
Non-current liabilities 16,304 33,223 34,826
Interest-bearing loans and borrowings 14,630 31,227 33,539
Trade and other payables 1,674 1,996 1,287
Deferred revenue 0 0 0
Deferred tax liabilities 0 0 0
Current liabilities 45,087 61,454 63,323
Trade and other payables 37,291 45,650 45,967
Interest-bearing loans and borrowings 7,796 15,804 17,356
Deferred revenue 0 0 0
Provisions 0 0 0
Total liabilities 61,391 94,677 98,149
Total equity and liabilities 119,644 195,019 212,243
Statement of financial position