spheres: 45th anniversary edition
DESCRIPTION
A periodic magazine covering the broad range of research done at the Cooperative Institute for Environmental Sciences at the University of Colorado at Boulder.TRANSCRIPT
xx
20 12
editio
n 07
SPECIALCOOPERATIVE INSTITUTE FOR RESEARCH IN ENVIRONMENTAL SCIENCES
sph resC I R SE
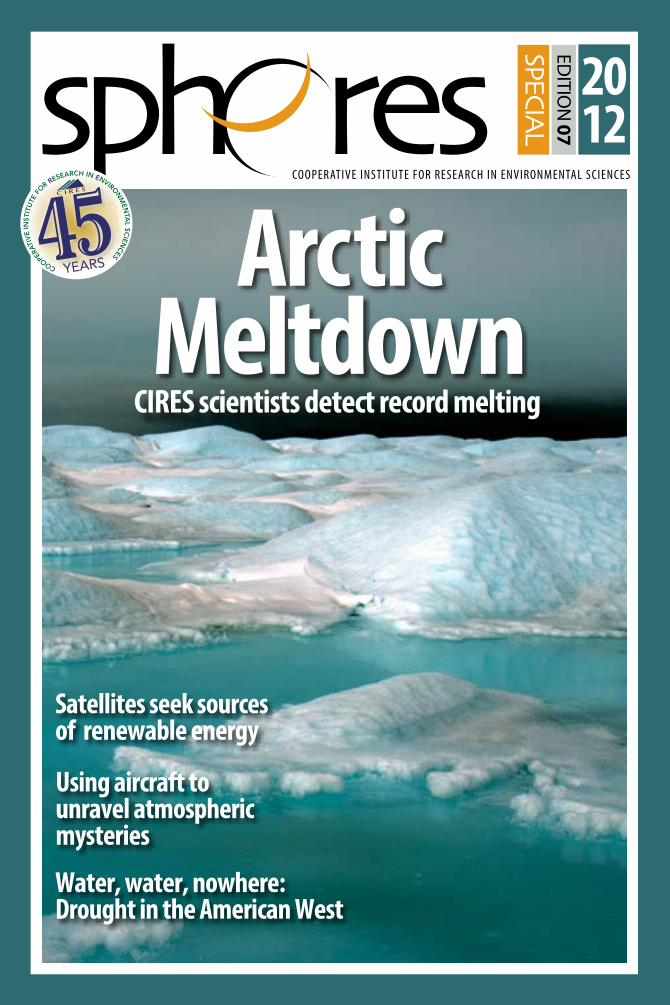
ArcticMeltdown
Satellites seek sources of renewable energy
CIRES scientists detect record melting
Using aircraft tounravel atmospheric mysteries
Water, water, nowhere: Drought in the American West
On the cover: Refrozen melt ponds en route to the automated weather station JAR2; Sermeq Avannarleq Glacier north of Jakobshavn Isbrae, West Greenland. ©Nikko Bayou
Background: El Tatio geyser field located in northern Chile. CIRES scientists are using remote-sensing techniques to locate less obvious geothermal activity for renewable energy applications. iStock Photo
This issue
Energy Alternatives: Sowing the SeedsHow former CIRES Director Susan Avery positioned CIRES to tackle one of the globe’s greatest challenges Sensing the HeatUsing satellites to seek out renewable energy “hot spots”
Where the Wind BlowsA CIRES scientist investigates the unknown: offshore wind at the heights of modern wind turbines.
Dueling with NatureCSTPR researchers investi-gate decision-making in an uncertain climate.
Walking on Thin IceDisappearing Arctic sea ice cover has far-reaching implications.
HighfliersThree decades of aircraft-aided atmospheric research at CIRES
2
4
26
6
28
367
30
32
10
12
34
17
19
2224
Sea ChangeResearchers discover a surprising new mechanism behind increasing land temperatures.
Science ‘n’ Schools SymbiosisCIRES Education and Outreach program creates win-win projects for all involved.
Plant PowerInvestigating how city greenspaces could mitigate impacts of climate change
MySphere: Science at Every Scale
A Forty-Year Lake OdysseyCIRES Interim Director’s quest to compare and contrast lakes across the globe
Breathe EasyInhalable antibiotics could revolutionize tuberculosis treatment.
From Ice to WaterWatching Greenland melt
Aqua-ShockThirsty power plants tap nation’s water resources
Seismic Shake-UpThe technology-inspired evolution of CIRES’s Solid Earth Sciences Division
Aerial ProspectingTailor-made technology reveals atmosphere’s hidden story.
sph resCOOPERATIVE INSTITUTE FOR RESEARCH IN ENVIRONMENTAL SCIENCES
Editorial StaffKristen Averyt, Ph.D.
Associate Director for ScienceJane Palmer, Ph.D.
Executive Editor/ Science News WriterKristin Bjornsen, M.A.
Senior EditorRobin L. StrelowGraphic Designer
David OonkMultimedia Producer
Kiki HollWeb Master
Eight CIRES ScientistsReceived the 2007 Nobel Peace Prize for their contributions to the ground-breaking international report of the Intergovernmental Panel on Climate Change. They shared the prize with co-authors from around the world and former Vice President Al Gore.
Number of times researchers at the CIRES Center for Science and Technology Policy Research (CSTPR) have testified before Congress in the last 10 years
Typical number of CIRES studies published in peer-reviewed scientific journals each year
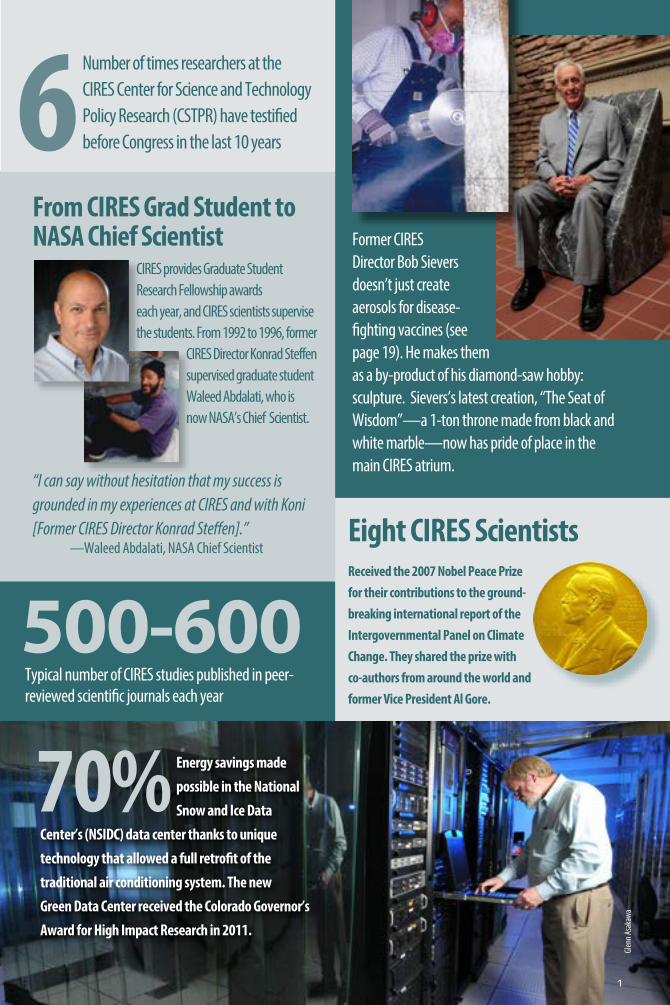
CIRES provides Graduate StudentResearch Fellowship awardseach year, and CIRES scientists supervise the students. From 1992 to 1996, former
CIRES Director Konrad Steffen supervised graduate student Waleed Abdalati, who is
now NASA’s Chief Scientist.
6
Glen
n Asa
kawa
Energy savings made possible in the National Snow and Ice Data
Center’s (NSIDC) data center thanks to unique technology that allowed a full retrofit of the traditional air conditioning system. The new Green Data Center received the Colorado Governor’s Award for High Impact Research in 2011.
70%
Former CIRES Director Bob Sievers doesn’t just create aerosols for disease-fighting vaccines (see page 19). He makes them as a by-product of his diamond-saw hobby: sculpture. Sievers’s latest creation, “The Seat of Wisdom”—a 1-ton throne made from black and white marble—now has pride of place in the main CIRES atrium.
500-600
From CIRES Grad Student to NASA Chief Scientist
“I can say without hesitation that my success is grounded in my experiences at CIRES and with Koni [Former CIRES Director Konrad Steffen].” —Waleed Abdalati, NASA Chief Scientist
1
2
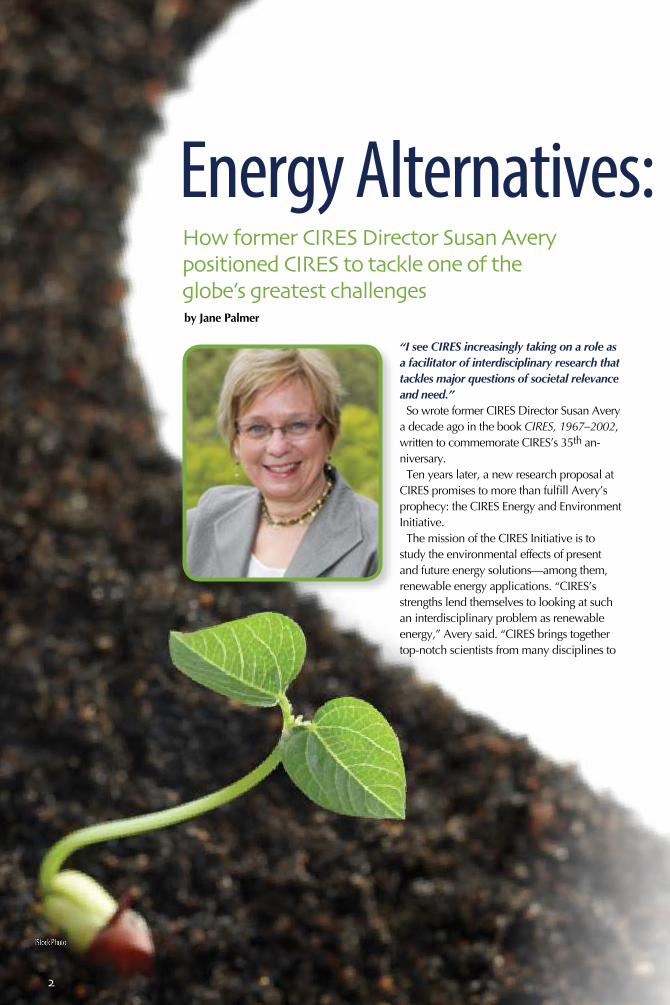
How former CIRES Director Susan Avery positioned CIRES to tackle one of the globe’s greatest challenges
Energy Alternatives: Sowing the Seeds
iStock Photo
“I see CIRES increasingly taking on a role as a facilitator of interdisciplinary research that tackles major questions of societal relevance and need.”So wrote former CIRES Director Susan Avery
a decade ago in the book CIRES, 1967–2002, written to commemorate CIRES’s 35th an-niversary. Ten years later, a new research proposal at
CIRES promises to more than fulfill Avery’s prophecy: the CIRES Energy and Environment Initiative. The mission of the CIRES Initiative is to
study the environmental effects of present and future energy solutions—among them, renewable energy applications. “CIRES’s strengths lend themselves to looking at such an interdisciplinary problem as renewable energy,” Avery said. “CIRES brings together top-notch scientists from many disciplines to
by Jane Palmer
3
Energy Alternatives: Sowing the Seedsthink creatively about the environment from a holistic point of view.”Also, CIRES’s connections with other national insti-
tutes—NOAA, the National Renewable Energy Labora-tories (NREL), and the National Center for Atmospheric Research (NCAR)—are invaluable in examining renew-able energy sources, Avery said. Coupling the resources available from these institutes with CIRES’s expertise in the environmental sciences will allow scientists to explore not only alternative energy sources, but also the environmental impact of those sources, she said.Even the most innocent-looking energy sources can
have impacts on the environment, Avery said. Wind farms, for example, might have a negative impact on wildlife habitats, and increased crop production for biofuels could lead to soil degradation. “There is a big difference between pilot testing a
renewable energy solution and bringing it up to scale for commercial production,” Avery said, “and you re-ally have to look carefully at the environmental risks of bringing it up to scale.”
Science serving society The time for solutions is now. In October 2011, the planet’s population topped 7 billion people. Seven billion people—most using fuel to cook food,
heat (or cool) houses, and travel to and from work. Currently, most of humanity’s energy needs are met by
fossil fuels—petroleum, coal, and natural gas—which can have negative consequences for the planet. Also, since the world may one day run out of these fossil fuels, “we need to be looking at renewable energy sources as additional options for our energy portfolio,” Avery said. Enter the new CIRES initiative to study the environmen-
tal effects of future energy solutions. CIRES is uniquely positioned for such an initiative, said CIRES Fellow Joost de Gouw, as CIRES research covers most of the affected environments (air quality, climate, cryosphere, ecosys-tems, meteorology, oceans, soils, solid earth, and water resources). CIRES scientists have also already studied the envi-
ronmental effects of existing energy sources for years. For example, they have investigated the emissions from refineries; coal- and gas-fired power plants; and automobiles and trucks. The institute’s research has also looked into how those emissions react chemically
to form pollutants such as ozone and aerosol. “To extend this work to future energy solutions is a natu-ral progression that ties into CIRES’s strengths,” de Gouw said. The initiative focuses
initially on environmental impacts of natural gas production and biofuels. Society increasingly uses ethanol as a fuel in vehicles, de Gouw said. As ethanol is made from corn and other crops, producing it requires agricultural lands, water, and fertilizers to grow—all of which can affect the environ-ment, he said. “We’d like to understand these effects so society can
make an informed decision whether or not ethanol is a good choice for the future,” de Gouw said. “The same is true for other future energy sources.”
Building the foundation CIRES’s ability to pioneer the Energy and Environment Initiative is thanks in no small part to Avery’s legacy as director. During her tenure (1994–2004), Avery facilitated
new interdisciplinary research efforts spanning the geological, social, and biological sciences; founded the Center for Science and Technology Policy Re-search; and established the CIRES Innovative Re-search Program designed to provide seed money for inventive, sometimes unconventional research. “That really allowed the scientists to think outside the box a little bit, push the envelope, and feed new ideas,” Avery said. “Innovative thinking is a requirement when we are facing these great challenges.”Now, as the president and director of the Woods Hole
Oceanographic Institution (WHOI) in Massachusetts, Avery continues to champion both investigation into re-newable energy sources and the environmental impacts of using those sources. “There is always an impact when you do commercial production,” Avery said. “The real question is how people might be able to minimize that impact and restore the environment.”“That is a question that CIRES is uniquely positioned to
address,“ Avery said.
TheScienceThe CIRES Energy and
Environment Initiative studies the
environmental effects of present and
future sources of energy.
4
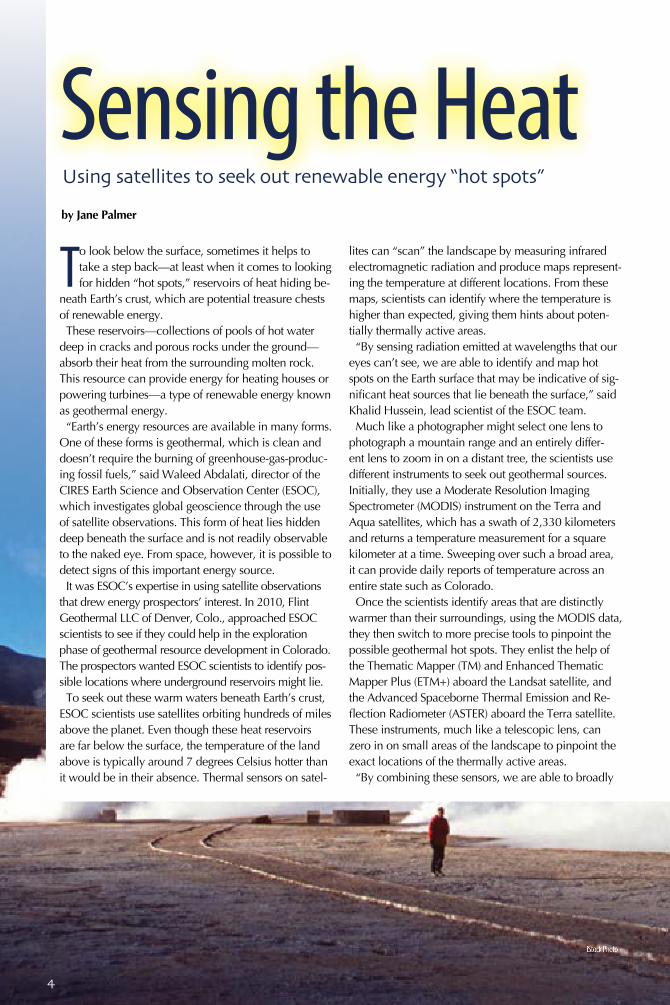
Sensing the HeatUsing satellites to seek out renewable energy “hot spots”
To look below the surface, sometimes it helps to take a step back—at least when it comes to looking for hidden “hot spots,” reservoirs of heat hiding be-
neath Earth’s crust, which are potential treasure chests of renewable energy. These reservoirs—collections of pools of hot water
deep in cracks and porous rocks under the ground—absorb their heat from the surrounding molten rock. This resource can provide energy for heating houses or powering turbines—a type of renewable energy known as geothermal energy. “Earth’s energy resources are available in many forms.
One of these forms is geothermal, which is clean and doesn’t require the burning of greenhouse-gas-produc-ing fossil fuels,” said Waleed Abdalati, director of the CIRES Earth Science and Observation Center (ESOC), which investigates global geoscience through the use of satellite observations. This form of heat lies hidden deep beneath the surface and is not readily observable to the naked eye. From space, however, it is possible to detect signs of this important energy source. It was ESOC’s expertise in using satellite observations
that drew energy prospectors’ interest. In 2010, Flint Geothermal LLC of Denver, Colo., approached ESOC scientists to see if they could help in the exploration phase of geothermal resource development in Colorado. The prospectors wanted ESOC scientists to identify pos-sible locations where underground reservoirs might lie. To seek out these warm waters beneath Earth’s crust,
ESOC scientists use satellites orbiting hundreds of miles above the planet. Even though these heat reservoirs are far below the surface, the temperature of the land above is typically around 7 degrees Celsius hotter than it would be in their absence. Thermal sensors on satel-
lites can “scan” the landscape by measuring infrared electromagnetic radiation and produce maps represent-ing the temperature at different locations. From these maps, scientists can identify where the temperature is higher than expected, giving them hints about poten-tially thermally active areas. “By sensing radiation emitted at wavelengths that our
eyes can’t see, we are able to identify and map hot spots on the Earth surface that may be indicative of sig-nificant heat sources that lie beneath the surface,” said Khalid Hussein, lead scientist of the ESOC team. Much like a photographer might select one lens to
photograph a mountain range and an entirely differ-ent lens to zoom in on a distant tree, the scientists use different instruments to seek out geothermal sources. Initially, they use a Moderate Resolution Imaging Spectrometer (MODIS) instrument on the Terra and Aqua satellites, which has a swath of 2,330 kilometers and returns a temperature measurement for a square kilometer at a time. Sweeping over such a broad area, it can provide daily reports of temperature across an entire state such as Colorado. Once the scientists identify areas that are distinctly
warmer than their surroundings, using the MODIS data, they then switch to more precise tools to pinpoint the possible geothermal hot spots. They enlist the help of the Thematic Mapper (TM) and Enhanced Thematic Mapper Plus (ETM+) aboard the Landsat satellite, and the Advanced Spaceborne Thermal Emission and Re-flection Radiometer (ASTER) aboard the Terra satellite. These instruments, much like a telescopic lens, can zero in on small areas of the landscape to pinpoint the exact locations of the thermally active areas. “By combining these sensors, we are able to broadly
by Jane Palmer
iStock Photo
Sensing the Heat
determine areas with warm signatures and then zoom in to pinpoint the source of these emission anomalies,” Hus-sein said. “By studying their character, we can make informed decisions about what locations offer the greatest potential for geothermal heat sources.” Temperature isn’t the only indicator the scientists use
to sniff out warm waters. Hydrothermal discharges can alter the mineral content of the surrounding land sur-face, so the presence of certain types of minerals can also signal geothermal sites. Each mineral has its own spectral “signature,” and the scientists also use images from the Landsat and Terra satellites to produce “min-eral maps” of an area, for example, Colorado. They then inspect these maps to identify which minerals are present in certain locations. “By combining our analysis of the temperature char-
acteristics with this additional geological information, we develop multiple lines of evidence for potential geothermal heat sources,” Hussein said. “This can help us make decisions on where investments in drilling will provide the greatest likelihood of success.” Once the scientists have analyzed the satellite data,
they give each unit of the landscape a rank reflecting its potential as a geothermal resource site. The rank takes into account unusual temperatures, mineral com-
position, and other indicators such as lines of faulting and the presence of hot springs. But in addition to these geological considerations, the researchers also use social and political informa-tion to guide their selection.“Considerations
such as difficulty of access, charac-teristics of the land
area, proximity to transportation routes, proximity to transmission networks, and land ownership feed into the determination of the best potential geothermal energy sources and help dictate where to focus extraction ef-forts,” Hussein said. In the last year, the scientists have drawn up a short
list of five potential sites, which they passed on to Flint Geothermal. In the second stage of the experi-ment, energy prospectors will visit those potential sites and perform a field-based assessment. “By using satellites to produce the first short list of potential sites, significant financial savings are realized,” Ab-dalati said. “Satellites can perform observations across broad areas, with consistency.” If successful, the scientists hope that the methodol-
ogy could be automated and used to find geothermal energy resources in other states in the U.S. or even internationally. “Satellites provide a very powerful tool for locating
these tremendously valuable energy sources in an efficient and cost-effective way,” Abdalati said. “Our efforts on this project represent an important step toward meeting society’s energy needs with minimal environmental impact.”
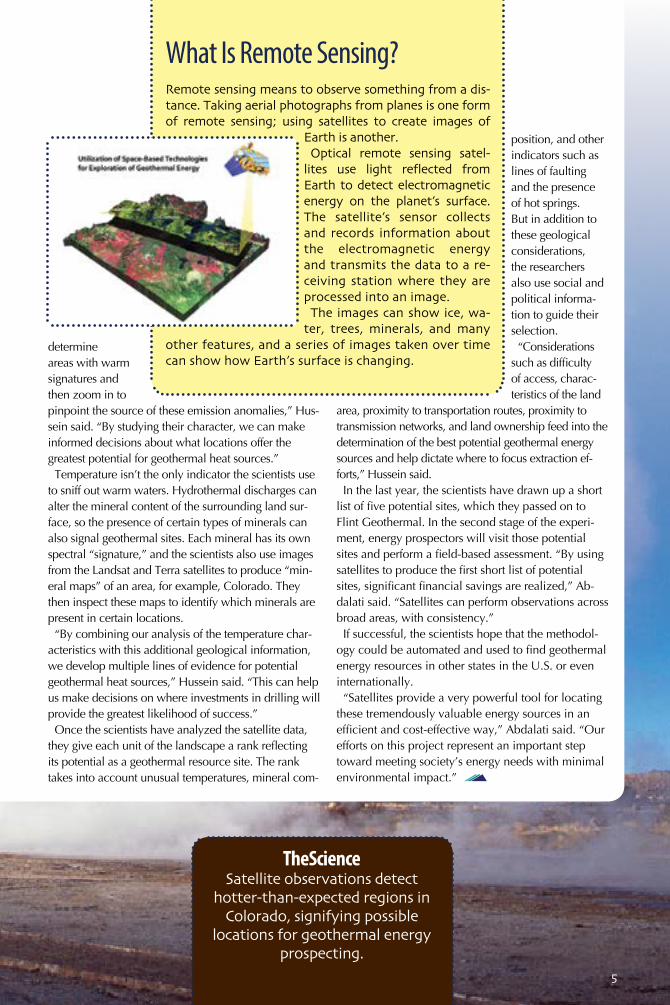
What Is Remote Sensing?Remote sensing means to observe something from a dis-tance. Taking aerial photographs from planes is one form of remote sensing; using satellites to create images of
Earth is another.Optical remote sensing satel-
lites use light reflected from Earth to detect electromagnetic energy on the planet’s surface. The satellite’s sensor collects and records information about the electromagnetic energy and transmits the data to a re-ceiving station where they are processed into an image. The images can show ice, wa-
ter, trees, minerals, and many other features, and a series of images taken over time can show how Earth’s surface is changing.
5
TheScienceSatellite observations detect
hotter-than-expected regions in Colorado, signifying possible
locations for geothermal energy prospecting.
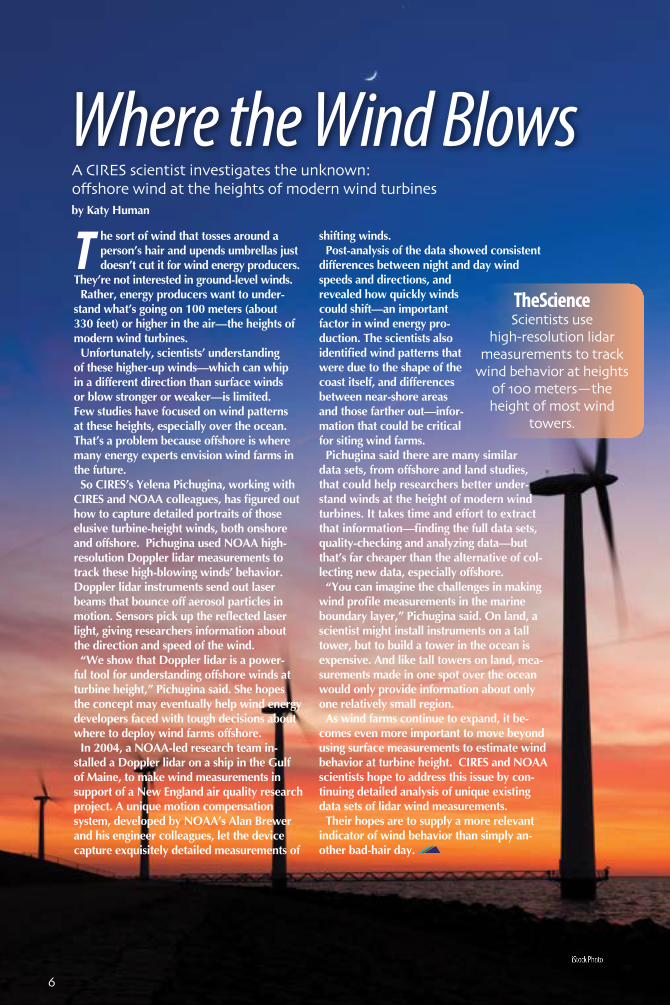
T he sort of wind that tosses around a person’s hair and upends umbrellas just doesn’t cut it for wind energy producers.
They’re not interested in ground-level winds. Rather, energy producers want to under-
stand what’s going on 100 meters (about 330 feet) or higher in the air—the heights of modern wind turbines. Unfortunately, scientists’ understanding
of these higher-up winds—which can whip in a different direction than surface winds or blow stronger or weaker—is limited. Few studies have focused on wind patterns at these heights, especially over the ocean. That’s a problem because offshore is where many energy experts envision wind farms in the future. So CIRES’s Yelena Pichugina, working with
CIRES and NOAA colleagues, has figured out how to capture detailed portraits of those elusive turbine-height winds, both onshore and offshore. Pichugina used NOAA high-resolution Doppler lidar measurements to track these high-blowing winds’ behavior. Doppler lidar instruments send out laser beams that bounce off aerosol particles in motion. Sensors pick up the reflected laser light, giving researchers information about the direction and speed of the wind. “We show that Doppler lidar is a power-
ful tool for understanding offshore winds at turbine height,” Pichugina said. She hopes the concept may eventually help wind energy developers faced with tough decisions about where to deploy wind farms offshore.In 2004, a NOAA-led research team in-
stalled a Doppler lidar on a ship in the Gulf of Maine, to make wind measurements in support of a New England air quality research project. A unique motion compensation system, developed by NOAA’s Alan Brewer and his engineer colleagues, let the device capture exquisitely detailed measurements of
shifting winds. Post-analysis of the data showed consistent
differences between night and day wind speeds and directions, and revealed how quickly winds could shift—an important factor in wind energy pro-duction. The scientists also identified wind patterns that were due to the shape of the coast itself, and differences between near-shore areas and those farther out—infor-mation that could be critical for siting wind farms.Pichugina said there are many similar
data sets, from offshore and land studies, that could help researchers better under-stand winds at the height of modern wind turbines. It takes time and effort to extract that information—finding the full data sets, quality-checking and analyzing data—but that’s far cheaper than the alternative of col-lecting new data, especially offshore. “You can imagine the challenges in making
wind profile measurements in the marine boundary layer,” Pichugina said. On land, a scientist might install instruments on a tall tower, but to build a tower in the ocean is expensive. And like tall towers on land, mea-surements made in one spot over the ocean would only provide information about only one relatively small region. As wind farms continue to expand, it be-
comes even more important to move beyond using surface measurements to estimate wind behavior at turbine height. CIRES and NOAA scientists hope to address this issue by con-tinuing detailed analysis of unique existing data sets of lidar wind measurements. Their hopes are to supply a more relevant
indicator of wind behavior than simply an-other bad-hair day.
Where the Wind BlowsA CIRES scientist investigates the unknown: offshore wind at the heights of modern wind turbines
TheScienceScientists use
high-resolution lidar measurements to track
wind behavior at heights of 100 meters—the height of most wind
towers.
iStock Photo
6
by Katy Human
7
Where the Wind Blows
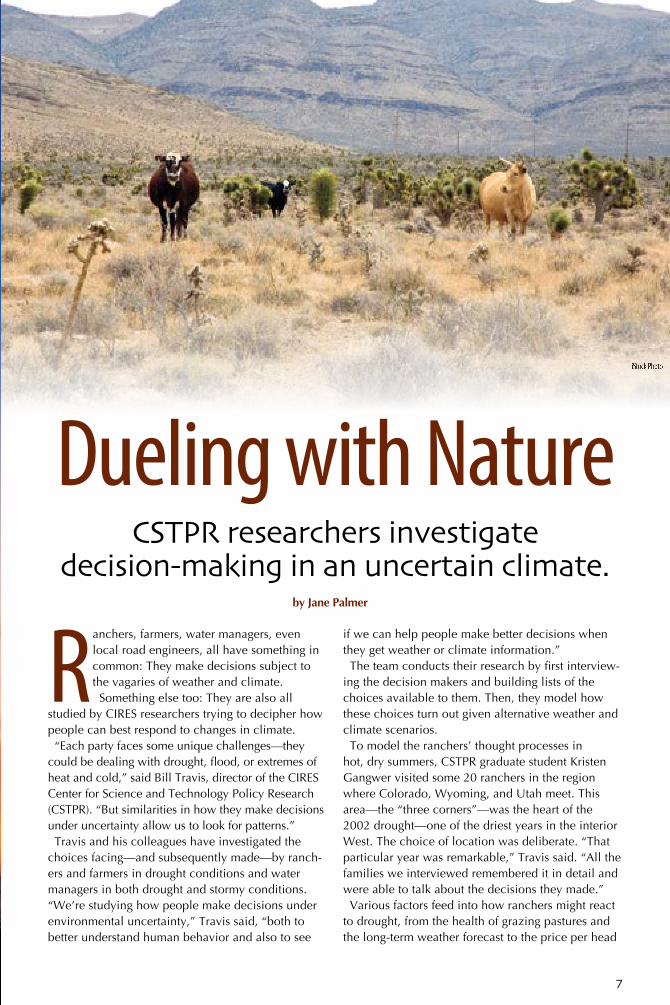
Ranchers, farmers, water managers, even local road engineers, all have something in common: They make decisions subject to the vagaries of weather and climate. Something else too: They are also all
studied by CIRES researchers trying to decipher how people can best respond to changes in climate. “Each party faces some unique challenges—they
could be dealing with drought, flood, or extremes of heat and cold,” said Bill Travis, director of the CIRES Center for Science and Technology Policy Research (CSTPR). “But similarities in how they make decisions under uncertainty allow us to look for patterns.” Travis and his colleagues have investigated the
choices facing—and subsequently made—by ranch-ers and farmers in drought conditions and water managers in both drought and stormy conditions. “We’re studying how people make decisions under environmental uncertainty,” Travis said, “both to better understand human behavior and also to see
if we can help people make better decisions when they get weather or climate information.”The team conducts their research by first interview-
ing the decision makers and building lists of the choices available to them. Then, they model how these choices turn out given alternative weather and climate scenarios. To model the ranchers’ thought processes in
hot, dry summers, CSTPR graduate student Kristen Gangwer visited some 20 ranchers in the region where Colorado, Wyoming, and Utah meet. This area—the “three corners”—was the heart of the 2002 drought—one of the driest years in the interior West. The choice of location was deliberate. “That particular year was remarkable,” Travis said. “All the families we interviewed remembered it in detail and were able to talk about the decisions they made.” Various factors feed into how ranchers might react
to drought, from the health of grazing pastures and the long-term weather forecast to the price per head
CSTPR researchers investigate decision-making in an uncertain climate.
by Jane Palmer
Dueling with NatureiStock Photo
8
of cattle and what neighboring ranchers are doing, Travis said. “Ranchers can take actions to reduce the impacts of drought but can’t reduce risks to zero,” Travis said. Opportunely—solely for the research study—
when the scientists were halfway through one cycle of analysis, a severe drought hit the entire nation. Suddenly, the study went “live” as ranchers nationwide faced the same stark decisions that the CSTPR team were investigating.
Managing their “stock” portfolioThe immediate weather isn’t the only factor that plays in to whether a rancher will sell his cattle, Travis said. Although cattle need healthy grass to feed on, ranchers are often thinking about the bigger picture, he said. “If it is a dry year and the rancher has 400 head of cattle, he might know that if he is careful, he can graze them enough to get them to market weight and break even that first dry year,” Travis said. “But what if it is dry again next year? That is the big unknown.”Farmers, ranchers, and water managers are always
thinking about next year, Travis said. If a rancher believes it is going to be dry again the following summer, it will affect decisions in the current year. In one sense, the rancher is “gaming” the environ-ment, he said. “What is the probability of next year being a drought and even the year after that?”If the rancher believes next year the weather will
return to normal, he will graze the cattle more this year knowing that the grass will grow back and the rangeland will recover, Travis said. If he is worried that this is the beginning of a few years of drought, he may act more conservatively, reducing the cattle’s grazing and their subsequent market weight. If the rancher is really concerned, he may even sell some of the cows early and reduce the herd size, often taking a loss, Travis said. “That is a big decision because once a rancher
sells, it can take years to build the stock back up,” Travis said. If the next year is a better one and the grazing lands are healthy, the rancher won’t have the stock to take advantage of it, he said. But if he keeps his stock and he grazes down his land, he could damage the land’s ecology. “Either way it takes time for the recovery,” Travis said.The weather isn’t all the ranchers have to think
about—the behavior of other ranchers also factors into their deductions. If a lot of ranchers believe that this is the beginning of a longer drought, then many of them might cull their herds, and the price of cattle goes down, Travis said. “So the rancher might
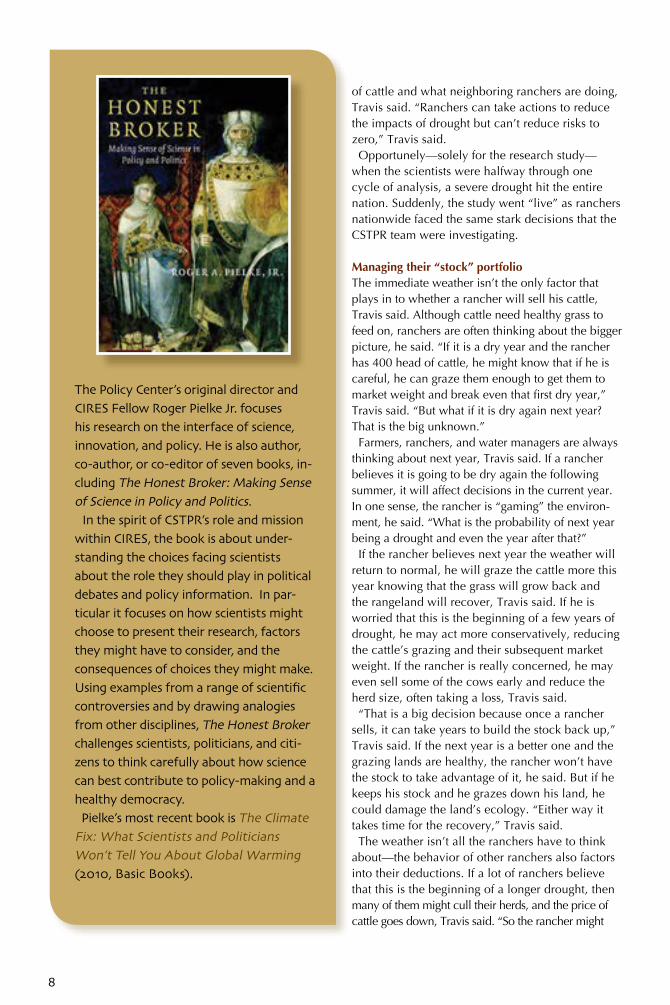
The Policy Center’s original director and CIRES Fellow Roger Pielke Jr. focuses his research on the interface of science, innovation, and policy. He is also author, co-author, or co-editor of seven books, in-cluding The Honest Broker: Making Sense of Science in Policy and Politics.
In the spirit of CSTPR’s role and mission within CIRES, the book is about under-standing the choices facing scientists about the role they should play in political debates and policy information. In par-ticular it focuses on how scientists might choose to present their research, factors they might have to consider, and the consequences of choices they might make. Using examples from a range of scientific controversies and by drawing analogies from other disciplines, The Honest Broker challenges scientists, politicians, and citi-zens to think carefully about how science can best contribute to policy-making and a healthy democracy.
Pielke’s most recent book is The Climate Fix: What Scientists and Politicians Won’t Tell You About Global Warming (2010, Basic Books).
9
think, ‘What if I sell sooner? Maybe I better sell some of my herd right away to get the price I want and just live with the consequences,” he said. So ranchers are trying to outguess fellow ranchers as
well as to outguess nature, Travis said. But even then the decision is not as simple as just trying to predict future weather scenarios. Just as in stock market trading, where the decision to buy or sell might depend not just on price trends of a few stocks, but on the overall portfolio of more or less risky stocks, some ranchers might be able to “run out” the drought because of the diverse landscapes they can graze. “Some ranchers we inter-
viewed have told us, ‘I was able to wait because I have got some land that is down by the river, which even in a drought has some green grass,” Travis said. Stock market traders have a portfolio, and ranch-
ers also have a portfolio—one that reflects grazing resources at varying elevations that respond differently to climate conditions, Travis said.
Mimicking the ranchers’ dilemmaUsing the data they have collected from the interviews, another CSTPR graduate student, Mary Huisenga, is creating a model that will reflect the difficult calls that
ranchers must make in the face of climate and market uncer-tainty. Once this model is fully developed, the team will test the probability of success and failure of the ranchers’ decisions under different drought scenarios: one-year droughts, two-year droughts, and three-year droughts and throw long-term climate change on top of all that. “It is really about understanding
what cognitive model the ranch-ers are using and what kind of risk they take based on what they know about the climate,” Travis said.
The ranchers are supportive of the study, Travis said. “They have a lot of enthusiasm for the subject of risks and decision-making because it is their daily life,” Travis said. “If you want to talk about climate and weather, then go talk to ranchers and farmers; I think the students enjoy the field work.”
CIRES Policy Center Turns 10Summer 2002: Former CIRES Director Su-san Avery initiated the Center for Science and Technology Policy Research (CSTPR) within CIRES to create an institute that would seek to improve how science and tech-nology policies would address societal needs.
“Having people who think about policy, how you do policy analysis, what the framework is for doing policy, and how policy might use science is pretty critical within CIRES,” Avery said. “That is very different than scientists
themselves deciding what is important to policy makers.”
The Center aims to meet the demand by public and private decision makers for “usable” sci-entific information. By linking research science with the needs of decision makers, the center plays a valuable role in helping the research community better
focus its efforts on issues of importance to society, and decision makers more effec-tively incorporate scientific and technologi-cal advances into their decision processes.
C I R SE
P O L I C Y R E S E A R C H
C E N T E R FORSCIENCE&TECHNOLOGY
YEARSCENTER F
OR
SCIE
NCE AND TECHNOLOGY POLICY RESEARCH
P O L I C Y R E S E A R C H
CC EE NN T E R FORSCIENCE TECHNOLOGY
C R SE
10
“We’re studying how people make decisions under
environmental uncertainty both to better
understand human behavior and also to see if we can help people make better
decisions when they get weather or climate
information.”
10
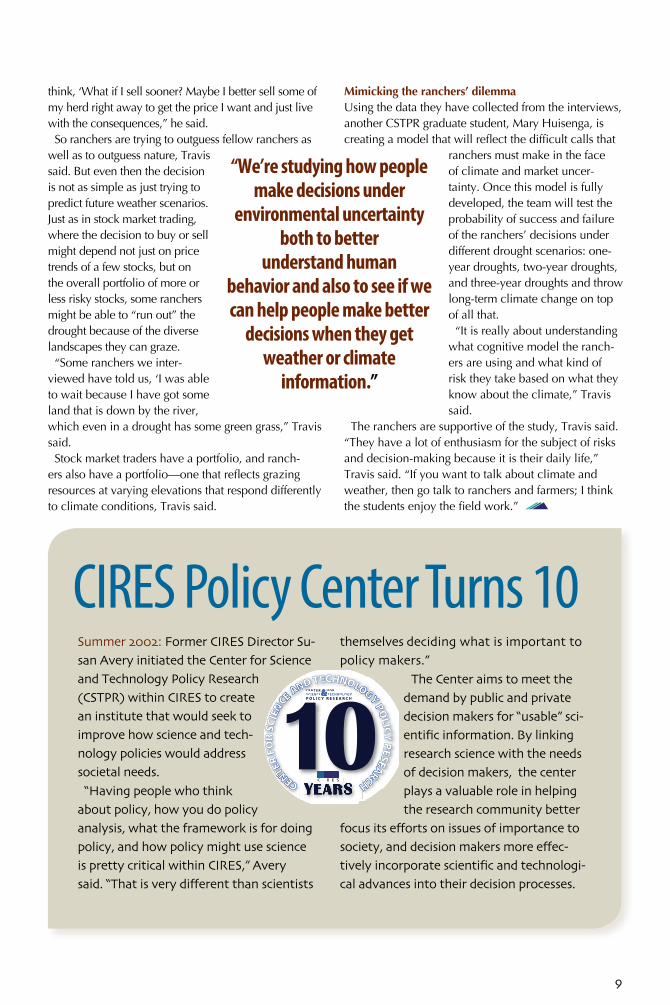
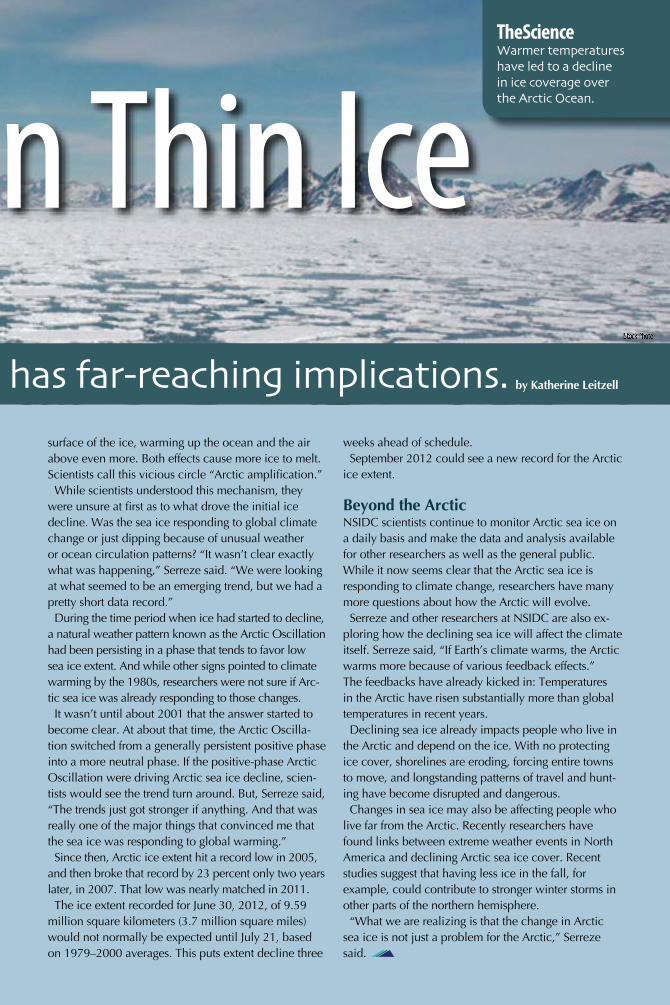
What happens in the Arctic stays in the Arctic. Unfortunately not. If the blanket of ice coating Earth’s northern-
most seas were to melt, much of the northern hemi-sphere, if not the planet, would feel the aftershock. “Warming of the Arctic is not just an issue for the Arctic,” said Mark Serreze, director of the CIRES National Snow and Ice Data Center (NSIDC). “It’s an issue for all of us.”
The sea ice that stretches for more than 3 million square miles atop the Arctic Ocean works to keep life cool in the Arctic, as the icy cover reflects sunlight and stops the sun’s rays from heating up the ocean beneath. This ocean-cooling dynamic also means the Arctic sea ice acts as an air conditioner for the northern hemi-sphere, keeping the oceans and surrounding land masses chillier than they would be in its absence. Remove some of that icy cover, however, and the sun’s
rays can now warm the exposed water, creating a ripple effect throughout the northern seas. Due to its climatic importance, NSIDC scientists have tracked sea ice extent year-round since 1979. They also track the “sea ice minimum,” the lowest coverage or extent of the ice across the ocean each year. Just as the moon waxes and wanes, sea ice extent
grows and shrinks each year with the seasons. In winter, colder temperatures build up the extent of the ice, and each summer brings partial melting of the coverage. Typically mid-September marks the end of the melt season when the sea ice cover is at its lowest. After that date, the sunlight is almost gone from the top of the world, and the ice cover begins to expand again. In constant climatic conditions, scientists would
expect to see little change in the coverage from one
year to the next. But that isn’t what they have seen.
The “not so slow” decline “The first indications that Arctic sea ice was declining really came out in the late 1980s,” Serreze said. “We started to see this overall downward trend.” Scientists at NSIDC were some of the first researchers
to notice the decline, and they have since measured the ice retreating to record-low extents in late summer and becoming thinner year-round. Since 1979, Arctic sea ice extent has declined by more than 30 percent in summer months. This rapid speed of decline has been helped along by
a simple feedback mechanism. As the sea ice melts, the dark water absorbs much more heat than the white
Walking o n Thin IceDisappearing Arctic sea ice cover has far-reaching implications.
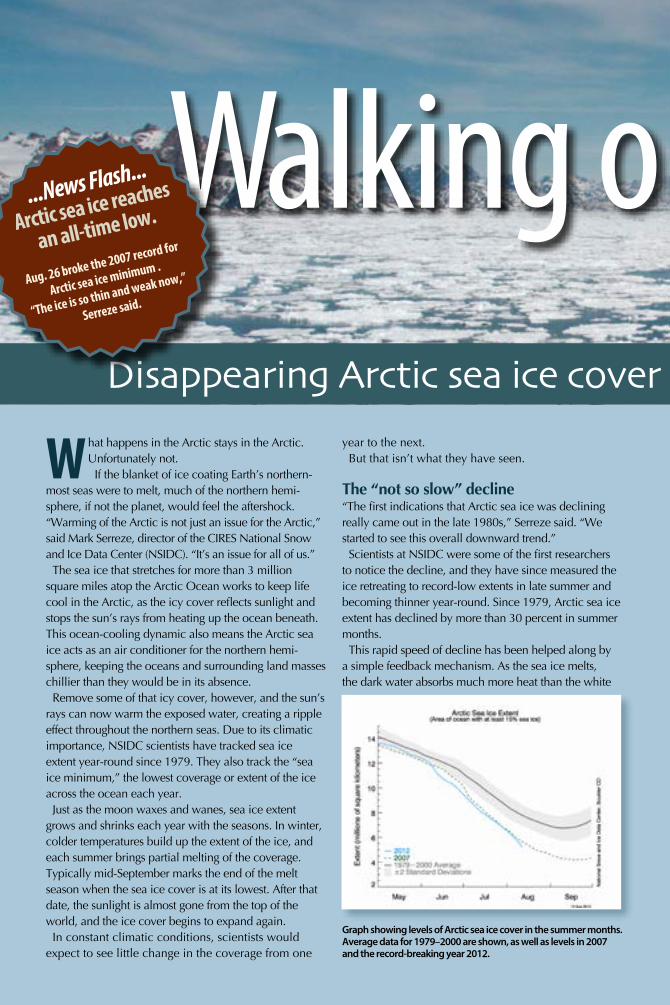
Graph showing levels of Arctic sea ice cover in the summer months. Average data for 1979–2000 are shown, as well as levels in 2007 and the record-breaking year 2012.
...News Flash...
Arctic sea ice reaches
an all-time low.
Aug. 26 broke the 2007 record for
Arctic sea ice minimum .
“The ice is so thin and weak now,”
Serreze said.
11
surface of the ice, warming up the ocean and the air above even more. Both effects cause more ice to melt. Scientists call this vicious circle “Arctic amplification.”
While scientists understood this mechanism, they were unsure at first as to what drove the initial ice decline. Was the sea ice responding to global climate change or just dipping because of unusual weather or ocean circulation patterns? “It wasn’t clear exactly what was happening,” Serreze said. “We were looking at what seemed to be an emerging trend, but we had a pretty short data record.”During the time period when ice had started to decline,
a natural weather pattern known as the Arctic Oscillation had been persisting in a phase that tends to favor low sea ice extent. And while other signs pointed to climate warming by the 1980s, researchers were not sure if Arc-tic sea ice was already responding to those changes. It wasn’t until about 2001 that the answer started to
become clear. At about that time, the Arctic Oscilla-tion switched from a generally persistent positive phase into a more neutral phase. If the positive-phase Arctic Oscillation were driving Arctic sea ice decline, scien-tists would see the trend turn around. But, Serreze said, “The trends just got stronger if anything. And that was really one of the major things that convinced me that the sea ice was responding to global warming.” Since then, Arctic ice extent hit a record low in 2005,
and then broke that record by 23 percent only two years later, in 2007. That low was nearly matched in 2011. The ice extent recorded for June 30, 2012, of 9.59
million square kilometers (3.7 million square miles) would not normally be expected until July 21, based on 1979–2000 averages. This puts extent decline three
weeks ahead of schedule. September 2012 could see a new record for the Arctic
ice extent.
Beyond the ArcticNSIDC scientists continue to monitor Arctic sea ice on a daily basis and make the data and analysis available for other researchers as well as the general public. While it now seems clear that the Arctic sea ice is responding to climate change, researchers have many more questions about how the Arctic will evolve. Serreze and other researchers at NSIDC are also ex-
ploring how the declining sea ice will affect the climate itself. Serreze said, “If Earth’s climate warms, the Arctic warms more because of various feedback effects.” The feedbacks have already kicked in: Temperatures in the Arctic have risen substantially more than global temperatures in recent years. Declining sea ice already impacts people who live in
the Arctic and depend on the ice. With no protecting ice cover, shorelines are eroding, forcing entire towns to move, and longstanding patterns of travel and hunt-ing have become disrupted and dangerous. Changes in sea ice may also be affecting people who
live far from the Arctic. Recently researchers have found links between extreme weather events in North America and declining Arctic sea ice cover. Recent studies suggest that having less ice in the fall, for example, could contribute to stronger winter storms in other parts of the northern hemisphere.“What we are realizing is that the change in Arctic
sea ice is not just a problem for the Arctic,” Serreze said.
Walking o n Thin IceDisappearing Arctic sea ice cover has far-reaching implications.
TheScienceWarmer temperatures have led to a decline in ice coverage over the Arctic Ocean.
by Katherine Leitzell
iStock Photo
iStock Photo
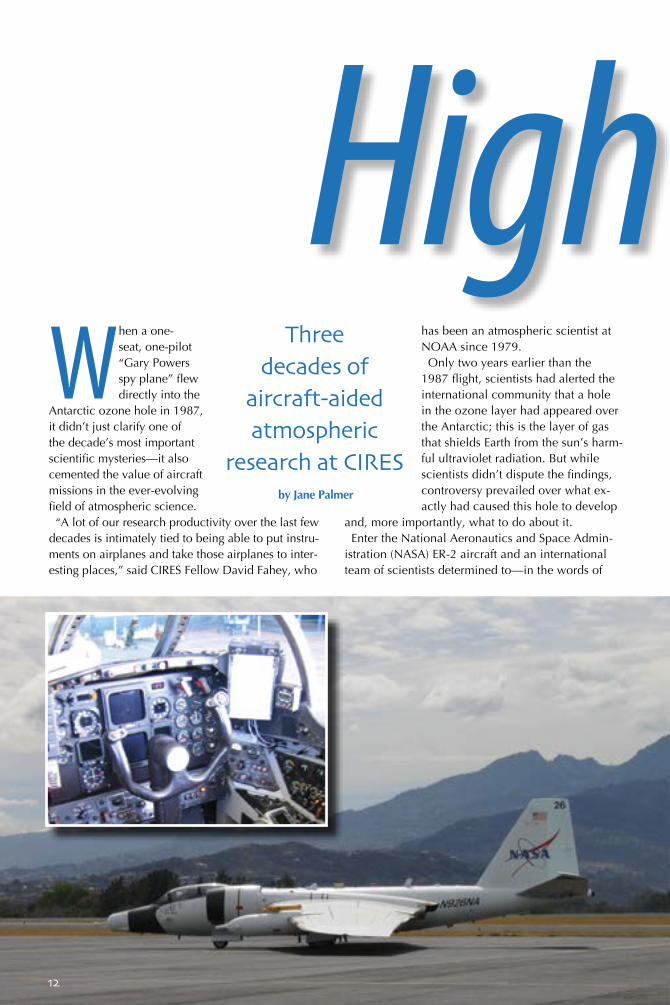
When a one-seat, one-pilot “Gary Powers spy plane” flew directly into the
Antarctic ozone hole in 1987, it didn’t just clarify one of the decade’s most important scientific mysteries—it also cemented the value of aircraft missions in the ever-evolving field of atmospheric science. “A lot of our research productivity over the last few
decades is intimately tied to being able to put instru-ments on airplanes and take those airplanes to inter-esting places,” said CIRES Fellow David Fahey, who
has been an atmospheric scientist at NOAA since 1979. Only two years earlier than the
1987 flight, scientists had alerted the international community that a hole in the ozone layer had appeared over the Antarctic; this is the layer of gas that shields Earth from the sun’s harm-ful ultraviolet radiation. But while scientists didn’t dispute the findings, controversy prevailed over what ex-actly had caused this hole to develop
and, more importantly, what to do about it. Enter the National Aeronautics and Space Admin-
istration (NASA) ER-2 aircraft and an international team of scientists determined to—in the words of
Three decades of
aircraft-aided atmospheric
research at CIRESby Jane Palmer
12
Highfliers

“Star Trek”—“boldly go where no man has gone before” as part of the Airborne Antarctic Ozone Experiment (AAOE). The AAOE team, which included Fahey, fitted the
plane with 12 instruments designed to measure key atmospheric variables. The aircraft, which was typi-cally used for military reconnaissance missions thanks to its ability to fly at high altitudes, would take off at 8 a.m. and return late each afternoon laden with ob-
(NASA) ER-2
Bottom left: NASA’s WB-57 aircraft carried the Fahey team’s instruments during NASA’s Mid-latitude Airborne Cirrus Properties Experiment (MACPEX).Bottom right: The WB-57 aircraft in Houston and the NOAA payload instruments for ozone, black carbon, and water vapor in the spring of 2011. Members of the Fahey team include (from left to right): Ru-Shan Gao, Richard McLaughlin, Anne Perring, Laurel Watts, Fahey, Troy Thornberry, Andrew Rollins, and Steven Ciciora (Joshua Schwartz not pictured).
13
Highfliers
14
servational data. “There was no other way of obtain-ing that information in those times,” Fahey said. After months of carefully inspecting the data, the sci-
entists could determine exactly the culprits behind the hole: Chemicals such as chlorofluorocarbons (CFCs), which were increasingly being used for refrigeration, air conditioning, foam blowing, and industrial clean-ing, were depleting the ozone layer, stripping the planet of its “protective sunscreen.”At an international meeting in Canada in 1987,
the Montreal Protocol on Substances that Deplete the Ozone Layer was adopted. With results from the AAOE mission and subsequent studies, this protocol laid the foundation for the subsequent recovery of the ozone hole, which current models predict will now recover completely by the year 2050. “To have an aircraft program provide such a pivotal
contribution at the crux of what the world is trying to understand,” Fahey said, “that was a big prize for aircraft missions.”
Aircraft adventures After the important role the NASA ER-2 played in understanding ozone layer depletion, atmospheric scientists expanded their use of aircraft missions to investigate all manner of scientific problems. Air-planes can carry instruments designed to measure the atmosphere’s key gases as well as its aerosols—tiny airborne particles that can cause severe health prob-lems and also affect climate. Airborne research complements other techniques
scientists use to understand the atmosphere, such as satellites and ground-based measurements. While airborne missions have their disadvantages in terms of the required manpower and finances, they also have unique advantages, Fahey said. “There are things that aircraft can see that satellites
can’t see,” Fahey said. “And satellites can’t see the things they do see with the same kind of accuracy and comprehensiveness that a well-designed aircraft mission can.”While aircraft missions have also contributed to
understanding the troposphere—the layer stretch-ing out from Earth’s surface to approximately 8 to 17 kilometers (5 to 10 miles) depending on latitude—the largest fraction of Fahey’s aircraft-assisted research has focused on the lower stratosphere—the layer stretching from the top of the troposphere to approxi-mately 20 kilometers (12.5 miles). Following his early research on the ozone hole, he took part in airborne missions in both the Arctic and the Antarctic to study atmospheric processes that control ozone amounts. “During that time, we came away with a lot of prizes in terms of understanding key atmospheric processes in more detail,” Fahey said. One of those prizes was made during the last NASA
ER-2 campaign to study ozone depletion when Fa-hey’s research group discovered a new class of polar stratospheric cloud particles by using a gas phase instrument developed by his group. “There was no expectation within the community that that class of particles could exist, and here we stumbled upon it,” Fahey said. The discovery illuminated a missing piece of the
ozone hole puzzle—in particular, a key mechanism that enhances ozone depletion in the Arctic as well as the Antarctic. “It really helped connect the dots in terms of allowing the community to much more quantitatively simulate what they see going on with ozone,” Fahey said. These particles were invisible at the time to other
techniques used to study the stratosphere, providing yet another example of how airborne missions are invalu-able to the field of atmospheric science, Fahey said.
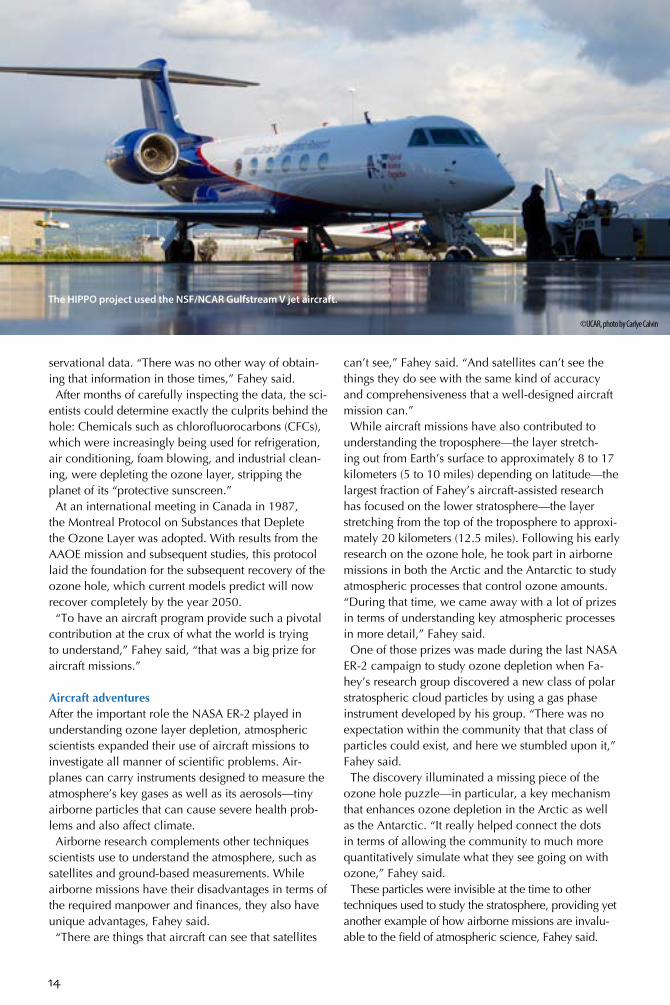
©UCAR, photo by Carlye Calvin
The HIPPO project used the NSF/NCAR Gulfstream V jet aircraft.
From ozone to climate More recently Fahey and his team were involved in the HIPPO (HIAPER Pole-to-Pole Observations) project—the most extensive airborne global sampling of carbon dioxide and other greenhouse gases in the atmosphere to date.The HIPPO project used the NSF/NCAR Gulfstream
V jet aircraft, which housed specialized instruments for measuring atmospheric gases, aerosols, and me-teorological parameters that were mounted in pods under the wings or inside the cabin. On five separate missions between January 2009 and January 2011, the plane flew pole to pole between latitudes 67° S to 85° N—roller-coastering continuously from 0.5 kilo-meters (0.3 miles) to 8.5 kilometers (5.3 miles), while continuously sampling the ambient air. “When you put all the data together, it looks like
what they call in the satellite world ‘a curtain file,’” Fahey said. “We get latitude and height measure-ments between both ends of the globe.”Fahey and his team used the mission to study black
carbon in the atmosphere. The burning of coal, diesel, biofuel, such as firewood, and biomass (for example, agricultural waste, forests, and grasslands) releases black carbon, a fine particulate that makes up soot. Because these tiny particles penetrate deep into the lungs, long-term exposure can cause chronic bron-chitis and asthma, while the organic by-products that often coat the particles may raise cancer risk. In terms of global climate, black carbon is also an
important heat-trapping agent, absorbing solar radia-tion and affecting cloud formation. “We’re interested in exactly how much there is, where it came from, and what its fate is,” Fahey said. As well as analyzing the high-altitude measure-
ments of black carbon, yielding information about the climate impacts of the particles, Fahey’s team also
took lower-elevation measurements on the NOAA WP-3D aircraft, which are more relevant to the air we breathe, in the Los Angeles region. These yielded encouraging results. Despite a steady increase in the use of diesel in
L.A., black carbon concentrations are lower now than in 1965 because of government regulations. “Without such stringent standards, L.A. could have looked more like what you see in the Pearl River Delta in China, where levels are up to 10 times higher,” Fahey said. “If we know how much black carbon there is, we
can ask, ‘How many people are breathing this? Is that bad for them? How bad? Where are the hot spots?’” Fahey said. The work being done by Fahey and other atmospheric scientists will help policy makers decide how to best achieve reductions in the amount of black carbon in the air we breathe, and such work was only possible using airborne research, Fahey said.
Who needs a pilot? While the role of aircraft data collection in under-standing Earth’s atmosphere remains undisputed in the research community, Fahey conjectures the nature of airborne missions will change in future research. In particular, he sees a greater role for un-manned aircraft, or drones. “Consider the HIPPO project: If you can send out
a drone to do that, you wouldn’t have to stop on an island in the South Pacific and give everybody a night to sleep and eat,” Fahey said. “A drone can go and make observations autonomously with humans overseeing in the background.”
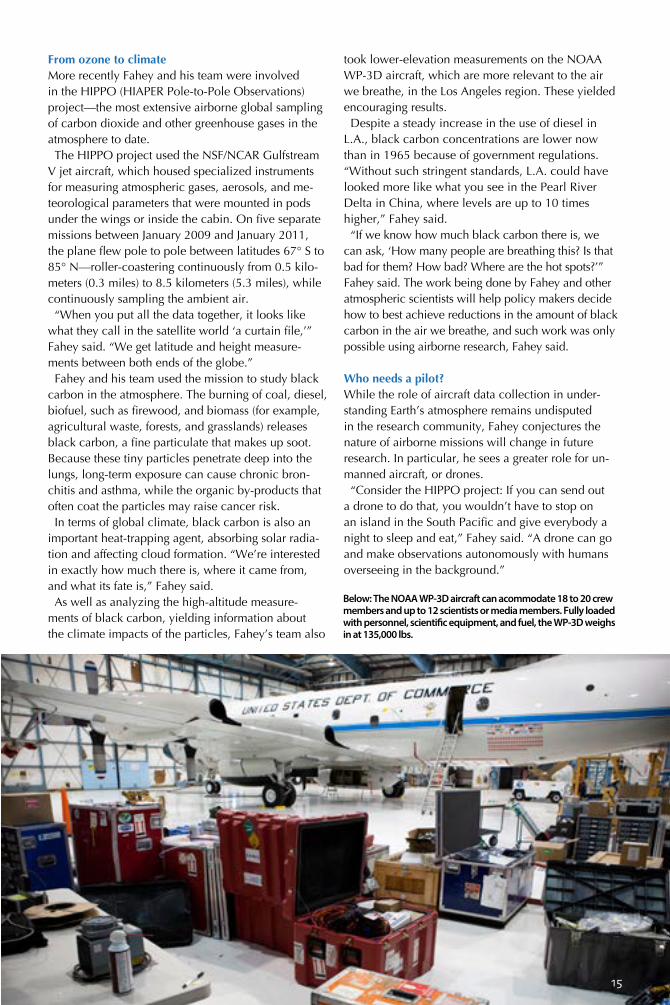
Below: The NOAA WP-3D aircraft can acommodate 18 to 20 crew members and up to 12 scientists or media members. Fully loaded with personnel, scientific equipment, and fuel, the WP-3D weighs in at 135,000 lbs.
15
16
U.S. Coast Guard
As scientists engi-neer smaller instru-mentation, the range of research aircraft CIRES uses could extend from NOAA’s Global Hawk—a 25,000-pound airplane that can carry 1,000 pounds to unmanned drones that fit in the palm of a hand. “That whole
spectrum of airborne technical devices will allow us to explore things in a way that we haven’t explored before,” Fahey said.Fahey sees drones
addressing a basic problem facing atmospheric scientists: the difficulty in obtaining enough measurements over time to adequate-ly characterize the atmosphere—termed the “under-sampling” problem. “We would benefit as an atmo-spheric science community to have more high-quality data from the atmosphere,” Fahey said. “We have an ap-petite for that data, but we don’t have a path right now to get to that point.” Drones may be part of that path, Fahey believes. The
cost savings of such unmanned aircraft can immediately be turned back into “Let’s fly some more,” he said. But while drones might help scientists to gather more of the same type of information, hopefully solving the under-sampling problem, they could also enable scientists to measure an entirely different type of data, he said. “What about flying along with an air parcel for a week
or month and making continuous measurements?” Fahey said, momentarily appearing lost in the land of possibility. Seems like the evolution of aircraft might free imagina-
tions—as well as planes—to soar.
NOAA’s Global Hawk drone Photo courtesy of NOAA
“To have an aircraft program provide such a pivotal contribution at the crux of what the world is trying to understand,” Fahey
said, “that was a big prize for aircraft missions.”
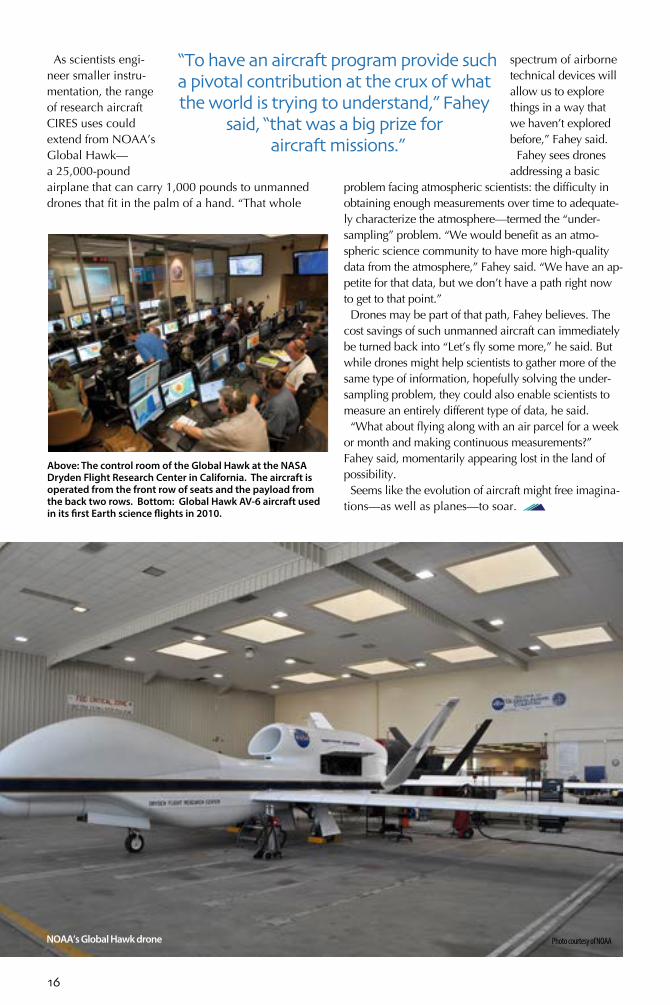
Above: The control room of the Global Hawk at the NASA Dryden Flight Research Center in California. The aircraft is operated from the front row of seats and the payload from the back two rows. Bottom: Global Hawk AV-6 aircraft used in its first Earth science flights in 2010.
17
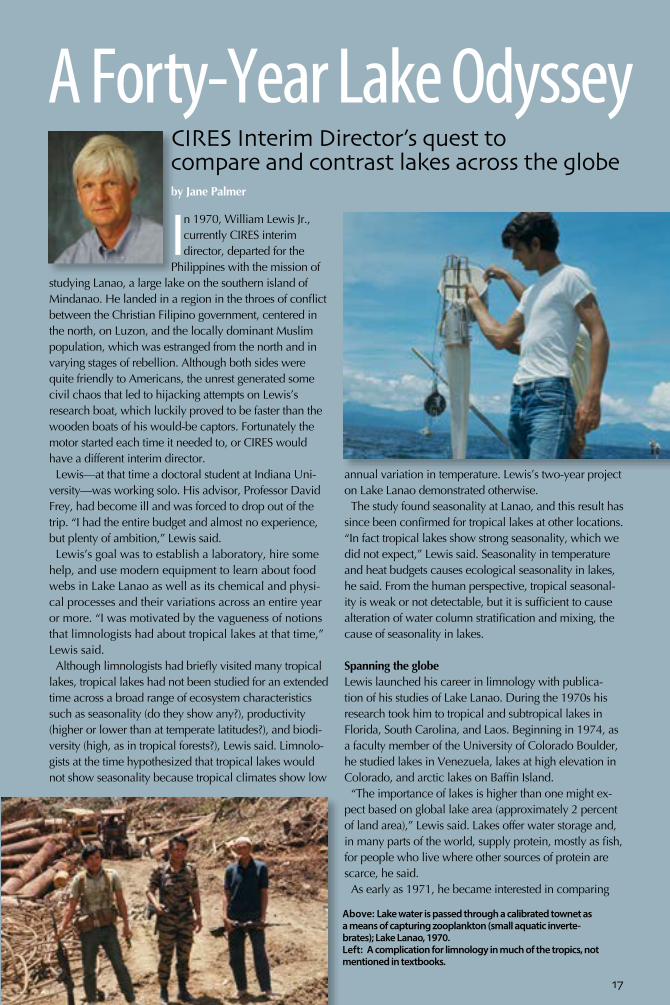
in 1970, William Lewis Jr., currently CIRES interim director, departed for the
Philippines with the mission of studying Lanao, a large lake on the southern island of Mindanao. He landed in a region in the throes of conflict between the Christian Filipino government, centered in the north, on Luzon, and the locally dominant Muslim population, which was estranged from the north and in varying stages of rebellion. Although both sides were quite friendly to Americans, the unrest generated some civil chaos that led to hijacking attempts on Lewis’s research boat, which luckily proved to be faster than the wooden boats of his would-be captors. Fortunately the motor started each time it needed to, or CIRES would have a different interim director.Lewis—at that time a doctoral student at Indiana Uni-
versity—was working solo. His advisor, Professor David Frey, had become ill and was forced to drop out of the trip. “I had the entire budget and almost no experience, but plenty of ambition,” Lewis said. Lewis’s goal was to establish a laboratory, hire some
help, and use modern equipment to learn about food webs in Lake Lanao as well as its chemical and physi-cal processes and their variations across an entire year or more. “I was motivated by the vagueness of notions that limnologists had about tropical lakes at that time,” Lewis said.Although limnologists had briefly visited many tropical
lakes, tropical lakes had not been studied for an extended time across a broad range of ecosystem characteristics such as seasonality (do they show any?), productivity (higher or lower than at temperate latitudes?), and biodi-versity (high, as in tropical forests?), Lewis said. Limnolo-gists at the time hypothesized that tropical lakes would not show seasonality because tropical climates show low
annual variation in temperature. Lewis’s two-year project on Lake Lanao demonstrated otherwise. The study found seasonality at Lanao, and this result has
since been confirmed for tropical lakes at other locations. “In fact tropical lakes show strong seasonality, which we did not expect,” Lewis said. Seasonality in temperature and heat budgets causes ecological seasonality in lakes, he said. From the human perspective, tropical seasonal-ity is weak or not detectable, but it is sufficient to cause alteration of water column stratification and mixing, the cause of seasonality in lakes.
Spanning the globeLewis launched his career in limnology with publica-tion of his studies of Lake Lanao. During the 1970s his research took him to tropical and subtropical lakes in Florida, South Carolina, and Laos. Beginning in 1974, as a faculty member of the University of Colorado Boulder, he studied lakes in Venezuela, lakes at high elevation in Colorado, and arctic lakes on Baffin Island.“The importance of lakes is higher than one might ex-
pect based on global lake area (approximately 2 percent of land area),” Lewis said. Lakes offer water storage and, in many parts of the world, supply protein, mostly as fish, for people who live where other sources of protein are scarce, he said. As early as 1971, he became interested in comparing
CIRES Interim Director’s quest to compare and contrast lakes across the globe
A Forty-Year Lake Odyssey
Above: Lake water is passed through a calibrated townet as a means of capturing zooplankton (small aquatic inverte-brates); Lake Lanao, 1970.Left: A complication for limnology in much of the tropics, not mentioned in textbooks.
by Jane Palmer
tropical lakes and lakes farther from the equator, and his re-search over the next three decades al-lowed him to explore their similarities and differences. In the new millennium, his goal became more ambitious: to map fundamental properties of lakes across latitude. “Latitude controls the differences between tropi-cal and temperate lakes, but the underlying mechanisms have been a mystery,” Lewis said. As a starting point, Lewis chose to focus on a key prop-
erty of lakes: biomass production by photosynthesis—a measure of how much plant matter a lake produces. “We have estimates of the production of oceans and terrestrial environments,” Lewis said, “but even in 2009 we did not have estimates of the total production of lakes. My study was intended as a companion piece to the information we have about other components of the global environment.”Using data collected over the previous four decades by
many investigators, Lewis and colleagues in 2010 cre-ated a model of the global biomass production of lakes. The researchers modeled the seasonal cycle for every latitude, taking into account a range of factors that influ-ence production, such as lake depth and area, nutrients, and water temperature. “Controlling factors interact, and a look across latitudes
shows how they interact,” Lewis said. “Understanding what controls lake production was a major motivation of the latitude study.” Lake productivity has direct conse-quences for the ability of lakes to sustain water of good quality and production of useful biomass, he said.
Pollution-powered productivity Not all the factors controlling lake production are entirely natural. The global model constructed by Lewis dem-onstrated that lakes across latitudes have become more fertile and, thus, now produce more biomass than previ-ously. The source of additional nutrients is anthropogenic pollution such as fertilizer runoff, wastewater effluent, and nitrate mobilized through the atmosphere by fossil fuel combustion. While increased fertility might be good for soil, it is
generally undesirable for lakes, at least from the human perspective, Lewis said. For example, coldwater fish—trout and salmon—suffer in more fertile lakes where certain unfavorable fish and plant species thrive. “From nutrient pollution, we get nuisance species that
are not useful, and we lose species of high value,” Lewis said. Nutrient pollution is not now fully addressed in lake management, he said. New regulations are intended to protect lakes and other inland waters against nutrient pol-lution in the future.
The model also revealed striking differences in lake productivity at differ-ent latitudes, Lewis said. Near the equa-tor, more sunshine and higher tempera-tures cause lakes to produce more
biomass with a given influx of nutrients than do lakes at higher latitudes. “In the tropics, lakes must be managed very carefully because they respond strongly to increased nutrient supply,” he said. Limnologists have believed that the largest lakes ac-
count for most global lacustrine biomass production. Lewis’s model, which takes into account all lakes, demonstrates that smaller lakes make a large contribution to the global total.Does Lewis ever worry that there are now no vague no-
tions left to clarify? “Global environmental studies, now a frontier in ecology, open new subjects for study,” Lewis said. “The global lake story has become more interesting, not less.”Fast-forward 20 years: a 60-year lake odyssey?
What Is Limnology?The word limnology takes its name from the Greek word for lake—limnē—and the root –ology, meaning “study of.” The term, first coined by the Swiss scientist Francois-Alphonse Forel, now refers to the study of all inland waters—lakes, streams, and wetlands.
Lewis established the Center for Limnology within CIRES in 1985. “Limnology takes in physics, chemistry, and biology, so it is ideal for a limnologist to be in CIRES, where these complemen-tary sciences work together,” Lewis said.
18
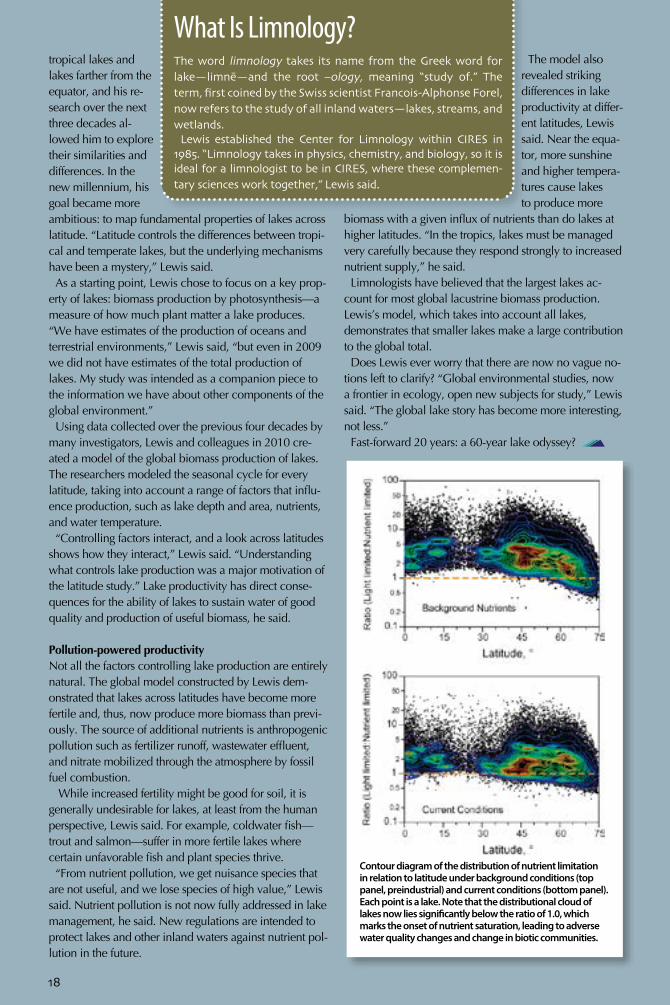
Contour diagram of the distribution of nutrient limitation in relation to latitude under background conditions (top panel, preindustrial) and current conditions (bottom panel). Each point is a lake. Note that the distributional cloud of lakes now lies significantly below the ratio of 1.0, which marks the onset of nutrient saturation, leading to adverse water quality changes and change in biotic communities.

19
F ight fire with fire, and airborne diseases with airborne drugs. That’s the strategy the CIRES Global Health
Research Group is using to transform the way doctors deliver medicine. “Our goal is to develop inhalable dry powder pharmaceuticals, including vaccines and antibiotics, that would replace needle injections,” said CIRES Fellow Bob Sievers, who leads the group. “Needle injections of pharmaceuticals are problematic, especially in developing countries, because they spoil without refrig-eration, often causing enormous waste, and they also can spread bloodborne diseases such as HIV and hepatitis B.”Inhalable medicine skirts those problems since a
patient simply has to breathe in a puff of dry powder. Sievers’s team already has successfully created an in-
halable vaccine for measles—an accomplishment that earned Sievers the 2009 American Chemical Society Astellas Award and the 2009 Colorado Governor’s Award for High-Impact Research.
Paradigm shiftThe group’s inhalable measles vaccine is currently in the first phase of clinical trials, and “In about four years, if we can find money for more trials, we could have a new measles vaccine that would save tens of thousands of lives,” said Sievers, director of CIRES from 1980 to 1993. “This supports CIRES’s mission because our intent is to
Breathe EasyInhalable antibiotics could
revolutionize tuberculosis treatment.
Above: The aerosol cloud of vaccine or antibiotic (inset) is inhaled from the dry-powder inhaler’s pink reservoir bag for needle-free delivery of pharmaceuticals.
by Kristin Bjornsen
20
make sure the whole global system, including humans and their protection from diseases, is attended to, not just the inanimate chemistry and physics part.”
The group is now turning its attention to tuberculo-sis, which kills 1.4 million people a year. In collabo-ration with the Infectious Disease Research Institute in Seattle, scientists at CIRES and Aktiv-Dry LLC (co-founded by Sievers) are trying to develop inhal-able TB antibiotics and an inhalable TB vaccine. The latest coup is the development of a respirable form of three TB antibiotics. Along with being needle-free, the new drugs may actually be more potent than tradi-tional antibiotics because they penetrate deep into the lungs, reaching bacteria that evade conventional antibiotics. “The inhalable particles of TB antibiotics target par-
ticularly hard-to-get bacteria, so they have the poten-tial to reduce treatment times,” said lead researcher J’aime Manion, a former CIRES graduate student in Sievers’s group.
Shortening treatment times isn’t just a matter of con-venience. The typical course of oral, and sometimes injected, antibiotics takes six to nine months—or in cases of drug-resistant TB, up to two years. That can cause people to prematurely stop treatment. Conse-quently, the person doesn’t get better, and the surviving bacteria might develop antibiotic resistance. “By reduc-ing treatment time, you can potentially end the cycle of noncompliance and antibiotic resistance,” Manion said.
An ancient enemyWith the rise of multiple drug–resistant tuberculosis, the need has never been greater. Tuberculosis has been around for millennia, showing up even in mum-mies from 3000-2400 BC. Today it is the second most common cause of death from a single infectious agent (after HIV/AIDS). “Prior to joining Dr. Sievers’s group, I thought TB
wasn’t that prevalent and existed mostly as a tragic cause of death in operas,” Manion said. Realiza-
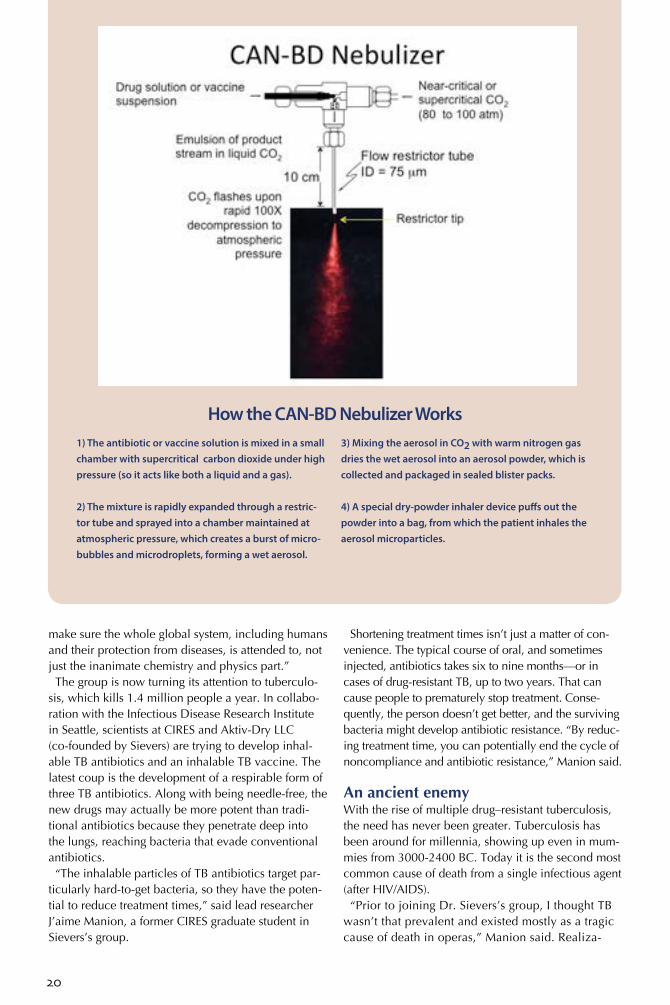
1) The antibiotic or vaccine solution is mixed in a small chamber with supercritical carbon dioxide under high pressure (so it acts like both a liquid and a gas).
2) The mixture is rapidly expanded through a restric-tor tube and sprayed into a chamber maintained at atmospheric pressure, which creates a burst of micro-bubbles and microdroplets, forming a wet aerosol.
3) Mixing the aerosol in CO2 with warm nitrogen gas dries the wet aerosol into an aerosol powder, which is collected and packaged in sealed blister packs.
4) A special dry-powder inhaler device puffs out the powder into a bag, from which the patient inhales the aerosol microparticles.
How the CAN-BD Nebulizer Works
21
tion of TB’s far-reaching effects drew her to this research.
Hallmark manifestations include a chronic, bloody cough, fever, night sweats, and weight loss (hence, the moniker “consumption”). The rod-shaped bacterium responsible for these symptoms is called Mycobacterium tuberculosis. When an infected person coughs, sneezes, speaks,
or sings, the bacteria are propelled into the air as aerosol droplets that nearby people can breathe in. The invaders travel to the alveoli, which are small, hollow pockets deep in the lungs. If the person’s im-mune system isn’t strong enough to keep the bacteria from growing, he or she will develop active TB.The bacterium’s actions once it reaches the alveoli
make killing it tricky: It commandeers immune cells known as macrophages that normally would devour the bacterium. The macrophage sends out a “help signal,” and the body walls off the infected macro-phage in a lesion—a nodule of clumped immune cells that pre-vents the bacteria from spread-ing and cuts them off from the blood supply.“The last walled-off bacteria
take the longest time to kill because traditional medicine cannot easily reach them,” Manion said. “One might ask why we care about this last 1 percent of bacteria, but the walled-off state can be reversed when the immune system is challenged, at which time that last 1 percent of bacteria are back in business.”Not only does the person get sick again, but also
those lingering bacteria may have acquired resis-tance to the drugs used to kill the other 99 percent.
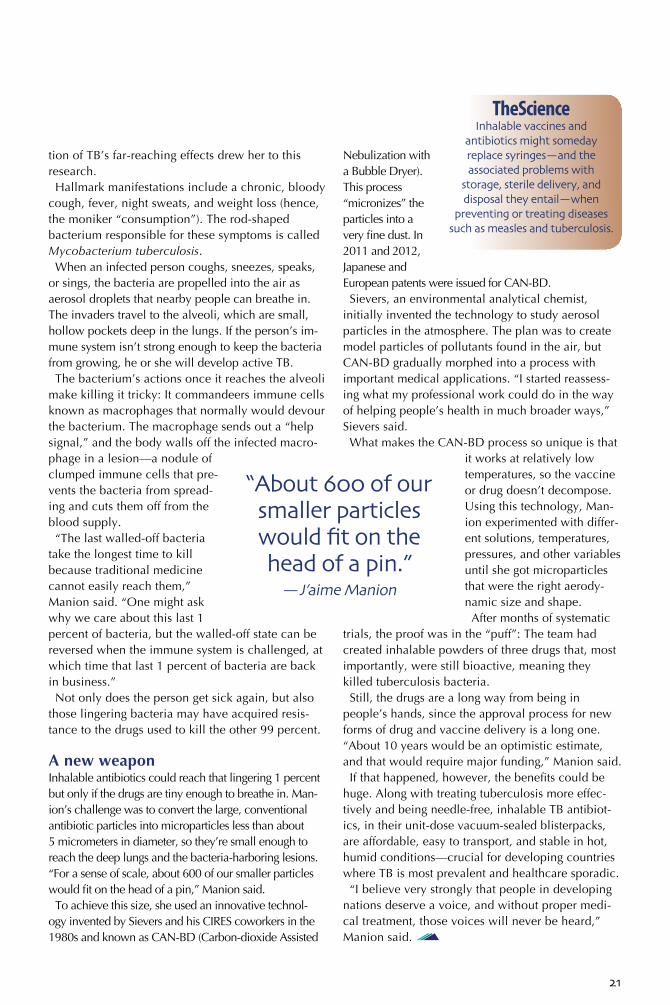
A new weaponInhalable antibiotics could reach that lingering 1 percent but only if the drugs are tiny enough to breathe in. Man-ion’s challenge was to convert the large, conventional antibiotic particles into microparticles less than about 5 micrometers in diameter, so they’re small enough to reach the deep lungs and the bacteria-harboring lesions. “For a sense of scale, about 600 of our smaller particles would fit on the head of a pin,” Manion said.
To achieve this size, she used an innovative technol-ogy invented by Sievers and his CIRES coworkers in the 1980s and known as CAN-BD (Carbon-dioxide Assisted
Nebulization with a Bubble Dryer). This process “micronizes” the particles into a very fine dust. In 2011 and 2012, Japanese and European patents were issued for CAN-BD. Sievers, an environmental analytical chemist,
initially invented the technology to study aerosol particles in the atmosphere. The plan was to create model particles of pollutants found in the air, but CAN-BD gradually morphed into a process with important medical applications. “I started reassess-ing what my professional work could do in the way of helping people’s health in much broader ways,” Sievers said. What makes the CAN-BD process so unique is that
it works at relatively low temperatures, so the vaccine or drug doesn’t decompose. Using this technology, Man-ion experimented with differ-ent solutions, temperatures, pressures, and other variables until she got microparticles that were the right aerody-namic size and shape.After months of systematic
trials, the proof was in the “puff”: The team had created inhalable powders of three drugs that, most importantly, were still bioactive, meaning they killed tuberculosis bacteria.Still, the drugs are a long way from being in
people’s hands, since the approval process for new forms of drug and vaccine delivery is a long one. “About 10 years would be an optimistic estimate, and that would require major funding,” Manion said.If that happened, however, the benefits could be
huge. Along with treating tuberculosis more effec-tively and being needle-free, inhalable TB antibiot-ics, in their unit-dose vacuum-sealed blisterpacks, are affordable, easy to transport, and stable in hot, humid conditions—crucial for developing countries where TB is most prevalent and healthcare sporadic. “I believe very strongly that people in developing
nations deserve a voice, and without proper medi-cal treatment, those voices will never be heard,” Manion said.
TheScienceInhalable vaccines and
antibiotics might someday replace syringes—and the associated problems with
storage, sterile delivery, and disposal they entail—when
preventing or treating diseases such as measles and tuberculosis.
“About 600 of our smaller particles would fit on the head of a pin.”
—J’aime Manion
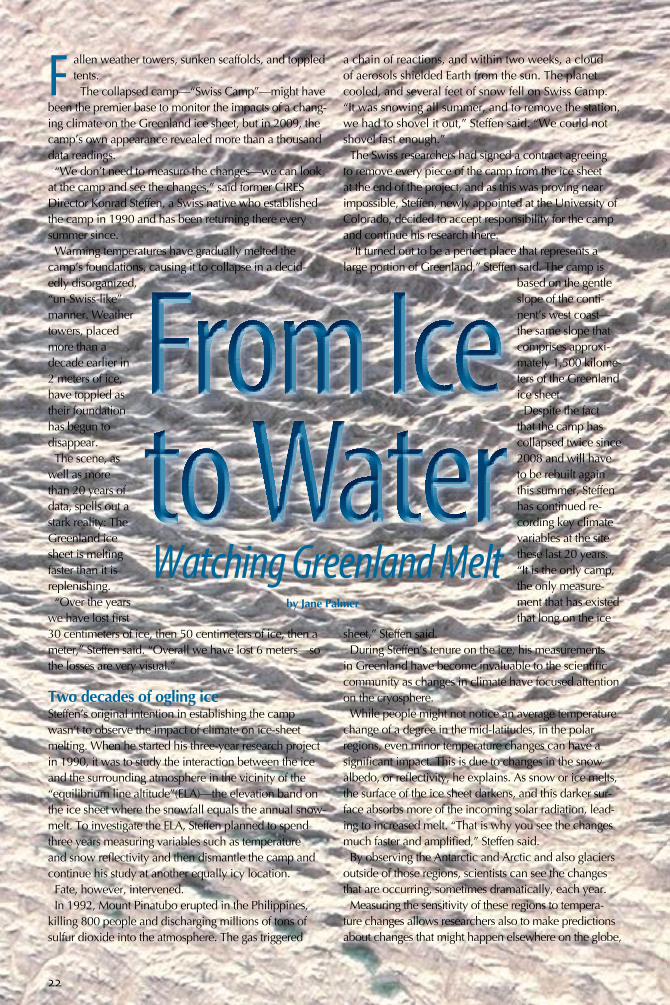
F allen weather towers, sunken scaffolds, and toppled tents. The collapsed camp—“Swiss Camp”—might have
been the premier base to monitor the impacts of a chang-ing climate on the Greenland ice sheet, but in 2009, the camp’s own appearance revealed more than a thousand data readings. “We don’t need to measure the changes—we can look
at the camp and see the changes,” said former CIRES Director Konrad Steffen, a Swiss native who established the camp in 1990 and has been returning there every summer since.Warming temperatures have gradually melted the
camp’s foundations, causing it to collapse in a decid-edly disorganized, “un-Swiss-like” manner. Weather towers, placed more than a decade earlier in 2 meters of ice, have toppled as their foundation has begun to disappear. The scene, as
well as more than 20 years of data, spells out a stark reality: The Greenland ice sheet is melting faster than it is replenishing. “Over the years
we have lost first 30 centimeters of ice, then 50 centimeters of ice, then a meter,” Steffen said. “Overall we have lost 6 meters—so the losses are very visual.”
Two decades of ogling iceSteffen’s original intention in establishing the camp wasn’t to observe the impact of climate on ice-sheet melting. When he started his three-year research project in 1990, it was to study the interaction between the ice and the surrounding atmosphere in the vicinity of the “equilibrium line altitude”(ELA)—the elevation band on the ice sheet where the snowfall equals the annual snow-melt. To investigate the ELA, Steffen planned to spend three years measuring variables such as temperature and snow reflectivity and then dismantle the camp and continue his study at another equally icy location. Fate, however, intervened. In 1992, Mount Pinatubo erupted in the Philippines,
killing 800 people and discharging millions of tons of sulfur dioxide into the atmosphere. The gas triggered
a chain of reactions, and within two weeks, a cloud of aerosols shielded Earth from the sun. The planet cooled, and several feet of snow fell on Swiss Camp. “It was snowing all summer, and to remove the station, we had to shovel it out,” Steffen said. “We could not shovel fast enough.” The Swiss researchers had signed a contract agreeing
to remove every piece of the camp from the ice sheet at the end of the project, and as this was proving near impossible, Steffen, newly appointed at the University of Colorado, decided to accept responsibility for the camp and continue his research there. “It turned out to be a perfect place that represents a
large portion of Greenland,” Steffen said. The camp is based on the gentle slope of the conti-nent’s west coast—the same slope that comprises approxi-mately 1,500 kilome-ters of the Greenland ice sheet. Despite the fact
that the camp has collapsed twice since 2008 and will have to be rebuilt again this summer, Steffen has continued re-cording key climate variables at the site these last 20 years. “It is the only camp, the only measure-ment that has existed that long on the ice
sheet,” Steffen said. During Steffen’s tenure on the ice, his measurements
in Greenland have become invaluable to the scientific community as changes in climate have focused attention on the cryosphere. While people might not notice an average temperature
change of a degree in the mid-latitudes, in the polar regions, even minor temperature changes can have a significant impact. This is due to changes in the snow albedo, or reflectivity, he explains. As snow or ice melts, the surface of the ice sheet darkens, and this darker sur-face absorbs more of the incoming solar radiation, lead-ing to increased melt. “That is why you see the changes much faster and amplified,” Steffen said. By observing the Antarctic and Arctic and also glaciers
outside of those regions, scientists can see the changes that are occurring, sometimes dramatically, each year. Measuring the sensitivity of these regions to tempera-
ture changes allows researchers also to make predictions about changes that might happen elsewhere on the globe,
Watching Greenland Melt
From Ice to Water
by Jane Palmer
22
Steffen said. “The polar regions are, for us, an early warn-ing signal,” he said. “We can tell people, ‘This is what is happening here—if you wait a certain amount of time, this is what will happen in the lower latitudes also.’”
Early warning signsThe first canary cry to alert Steffen to the melting ice sheet was a fallen instrument tower in 1995, an excep-tionally warm year. On his team’s return to camp, the re-searchers had to dig for a week to find the tower, which had since been buried beneath the winter’s snowfall. The tower’s collapse surprised Steffen. “If you build a tower in the ELA, you drill it 2 meters into the ice and assume it stays,” he said. By the new millennium, the changes had become more
visual as Steffen and the scientific community began to see an increase in the surface melting and runoff on the ice sheet. Over the last 20 years, Steffen has recorded an increase of 50 Watts per square meter in absorbed shortwave radiation on the ice. “The source is stable—the sun’s radiation is not increasing,” Steffen said. Neither has the atmosphere changed to allow more of the sun’s rays to reach Earth, he said. The culprit for the increased absorption is the albedo effect, by which the decrease in reflectivity, due to ice melt, has caused Greenland to absorb more of the sun’s rays. ”Fifty watts is huge,” he said, “many times bigger than the global warming signal from carbon dioxide.”
The initiator of this feedback loop was an increase in temperature. Over the last 20 years, Steffen has recorded a 4-degree Celsius (7.2-degree Fahrenheit) increase in the average temperature at the camp, nearly 2 degrees per decade. “It is probably one of the biggest warming signals we have on Earth,” he said. The implications of these changes and the subsequent
melting of the ice sheet are huge, Steffen said. As the ice sheet melts and sections of it calve off into the ocean, global sea level rises. With 10 percent of Earth’s population—about 600 million people—living in low-lying areas, such a rise could have significant impacts. Scientists now estimate that sea level will rise by nearly a meter by 2100. While 1 meter is the estimated global sea level rise,
certain regions could experience less sea level rise while other regions might see double that amount, Steffen said. Some of the areas that might see the largest sea level rise, such as Florida, are the most densely populated, he said.Steffen’s first inkling to the possibility of this scenario
came when he measured increasing temperatures in the region. He showed the results to his program manager, whose reaction was one of disbelief. “He said, ‘Go back and do the analysis again—it is not pos-sible,’” Steffen said. In spring 2012, when Steffen steps out of his helicop-
ter and looks at the camp, the evidence will be staring him in the face.
23
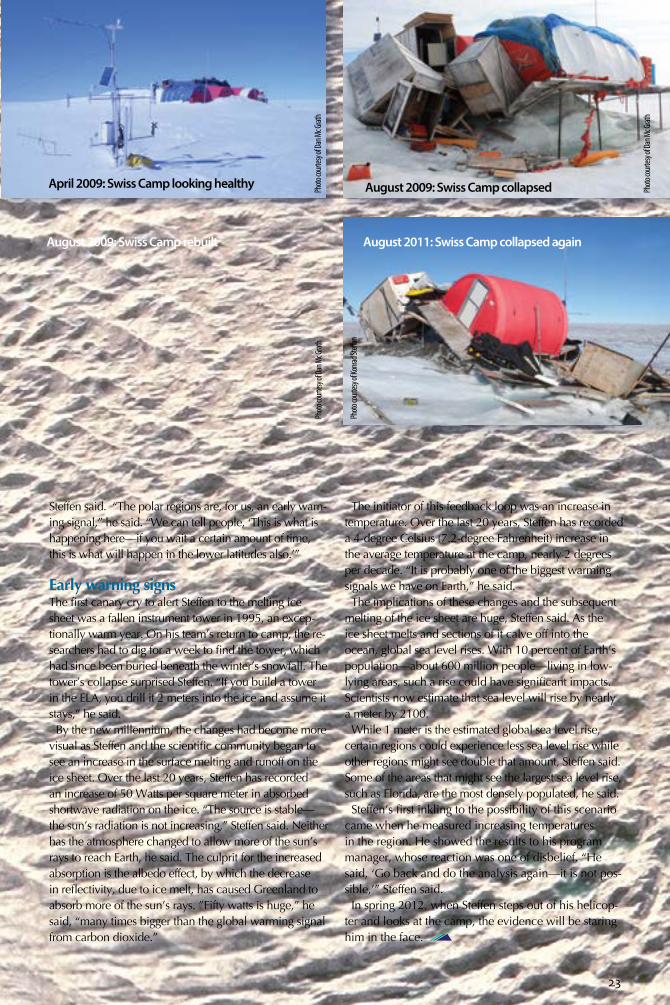
April 2009: Swiss Camp looking healthy Photo
court
esy of
Dan M
c Grat
h Ph
oto co
urtesy
of Da
n Mc G
rath
Photo
court
esy of
Dan M
c Grat
h
Photo
court
esy of
Konra
d Stef
fan
August 2009: Swiss Camp collapsed
August 2009: Swiss Camp rebuilt August 2011: Swiss Camp collapsed again
24
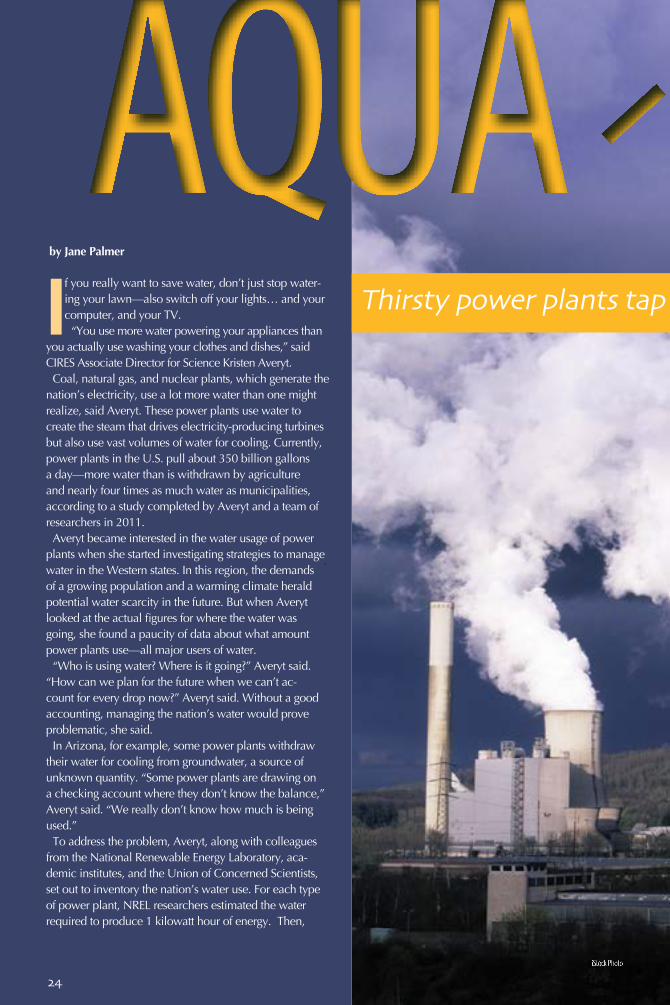
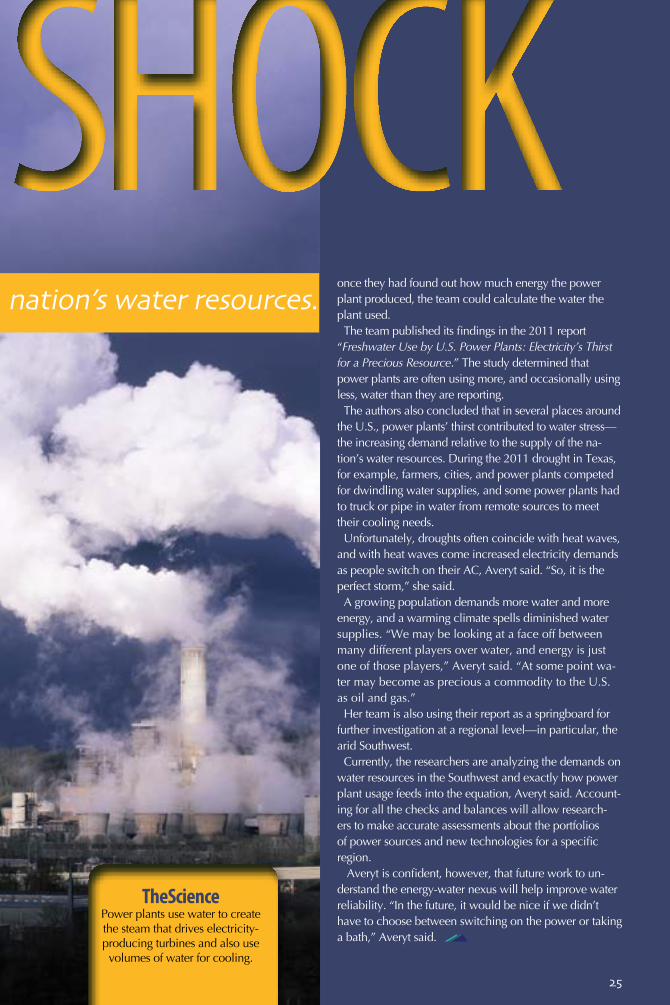
If you really want to save water, don’t just stop water-ing your lawn—also switch off your lights… and your computer, and your TV.
“You use more water powering your appliances than you actually use washing your clothes and dishes,” said CIRES Associate Director for Science Kristen Averyt. Coal, natural gas, and nuclear plants, which generate the
nation’s electricity, use a lot more water than one might realize, said Averyt. These power plants use water to create the steam that drives electricity-producing turbines but also use vast volumes of water for cooling. Currently, power plants in the U.S. pull about 350 billion gallons a day—more water than is withdrawn by agriculture and nearly four times as much water as municipalities, according to a study completed by Averyt and a team of researchers in 2011. Averyt became interested in the water usage of power
plants when she started investigating strategies to manage water in the Western states. In this region, the demands of a growing population and a warming climate herald potential water scarcity in the future. But when Averyt looked at the actual figures for where the water was going, she found a paucity of data about what amount power plants use—all major users of water. “Who is using water? Where is it going?” Averyt said.
“How can we plan for the future when we can’t ac-count for every drop now?” Averyt said. Without a good accounting, managing the nation’s water would prove problematic, she said. In Arizona, for example, some power plants withdraw
their water for cooling from groundwater, a source of unknown quantity. “Some power plants are drawing on a checking account where they don’t know the balance,” Averyt said. “We really don’t know how much is being used.” To address the problem, Averyt, along with colleagues
from the National Renewable Energy Laboratory, aca-demic institutes, and the Union of Concerned Scientists, set out to inventory the nation’s water use. For each type of power plant, NREL researchers estimated the water required to produce 1 kilowatt hour of energy. Then,
AQUA SHOCKThirsty power plants tap nation’s water resources.
by Jane Palmer
iStock Photo
25
once they had found out how much energy the power plant produced, the team could calculate the water the plant used. The team published its findings in the 2011 report
“Freshwater Use by U.S. Power Plants: Electricity’s Thirst for a Precious Resource.” The study determined that power plants are often using more, and occasionally using less, water than they are reporting. The authors also concluded that in several places around
the U.S., power plants’ thirst contributed to water stress—the increasing demand relative to the supply of the na-tion’s water resources. During the 2011 drought in Texas, for example, farmers, cities, and power plants competed for dwindling water supplies, and some power plants had to truck or pipe in water from remote sources to meet their cooling needs. Unfortunately, droughts often coincide with heat waves,
and with heat waves come increased electricity demands as people switch on their AC, Averyt said. “So, it is the perfect storm,” she said.A growing population demands more water and more
energy, and a warming climate spells diminished water supplies. “We may be looking at a face off between many different players over water, and energy is just one of those players,” Averyt said. “At some point wa-ter may become as precious a commodity to the U.S. as oil and gas.” Her team is also using their report as a springboard for
further investigation at a regional level—in particular, the arid Southwest. Currently, the researchers are analyzing the demands on
water resources in the Southwest and exactly how power plant usage feeds into the equation, Averyt said. Account-ing for all the checks and balances will allow research-ers to make accurate assessments about the portfolios of power sources and new technologies for a specific region. Averyt is confident, however, that future work to un-
derstand the energy-water nexus will help improve water reliability. “In the future, it would be nice if we didn’t have to choose between switching on the power or taking a bath,” Averyt said.
AQUA SHOCKThirsty power plants tap nation’s water resources.
TheSciencePower plants use water to create the steam that drives electricity-producing turbines and also use volumes of water for cooling.
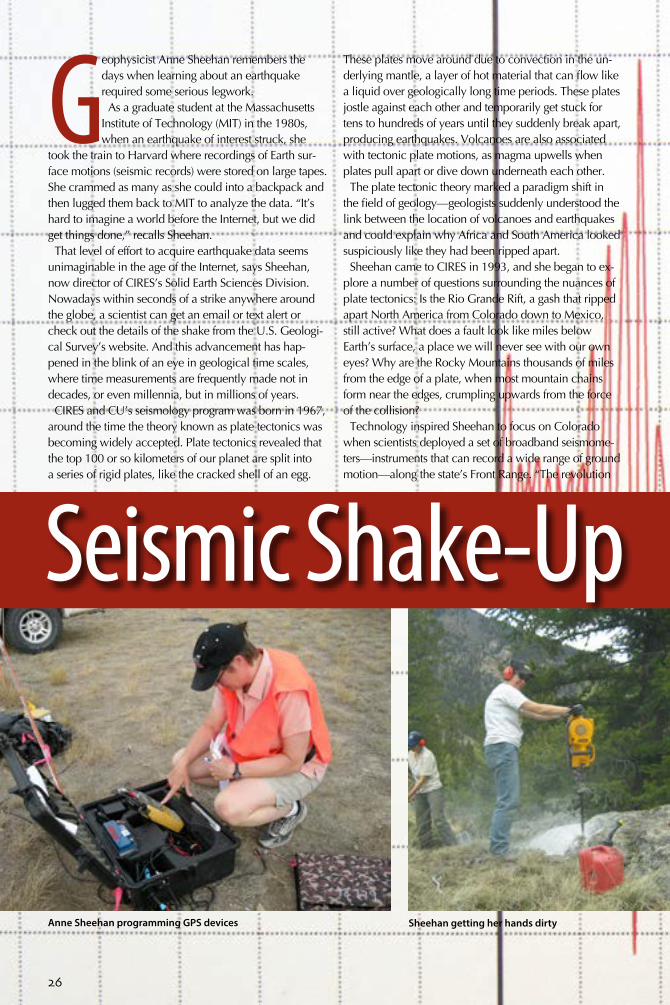
Geophysicist Anne Sheehan remembers the days when learning about an earthquake required some serious legwork. As a graduate student at the Massachusetts
Institute of Technology (MIT) in the 1980s, when an earthquake of interest struck, she
took the train to Harvard where recordings of Earth sur-face motions (seismic records) were stored on large tapes. She crammed as many as she could into a backpack and then lugged them back to MIT to analyze the data. “It’s hard to imagine a world before the Internet, but we did get things done,” recalls Sheehan.That level of effort to acquire earthquake data seems
unimaginable in the age of the Internet, says Sheehan, now director of CIRES’s Solid Earth Sciences Division. Nowadays within seconds of a strike anywhere around the globe, a scientist can get an email or text alert or check out the details of the shake from the U.S. Geologi-cal Survey’s website. And this advancement has hap-pened in the blink of an eye in geological time scales, where time measurements are frequently made not in decades, or even millennia, but in millions of years. CIRES and CU’s seismology program was born in 1967,
around the time the theory known as plate tectonics was becoming widely accepted. Plate tectonics revealed that the top 100 or so kilometers of our planet are split into a series of rigid plates, like the cracked shell of an egg.
These plates move around due to convection in the un-derlying mantle, a layer of hot material that can flow like a liquid over geologically long time periods. These plates jostle against each other and temporarily get stuck for tens to hundreds of years until they suddenly break apart, producing earthquakes. Volcanoes are also associated with tectonic plate motions, as magma upwells when plates pull apart or dive down underneath each other.The plate tectonic theory marked a paradigm shift in
the field of geology—geologists suddenly understood the link between the location of volcanoes and earthquakes and could explain why Africa and South America looked suspiciously like they had been ripped apart. Sheehan came to CIRES in 1993, and she began to ex-
plore a number of questions surrounding the nuances of plate tectonics: Is the Rio Grande Rift, a gash that ripped apart North America from Colorado down to Mexico, still active? What does a fault look like miles below Earth’s surface, a place we will never see with our own eyes? Why are the Rocky Mountains thousands of miles from the edge of a plate, when most mountain chains form near the edges, crumpling upwards from the force of the collision?Technology inspired Sheehan to focus on Colorado
when scientists deployed a set of broadband seismome-ters—instruments that can record a wide range of ground motion—along the state’s Front Range. “The revolution
Seismic Shake-Up
26
Anne Sheehan programming GPS devices Sheehan getting her hands dirty
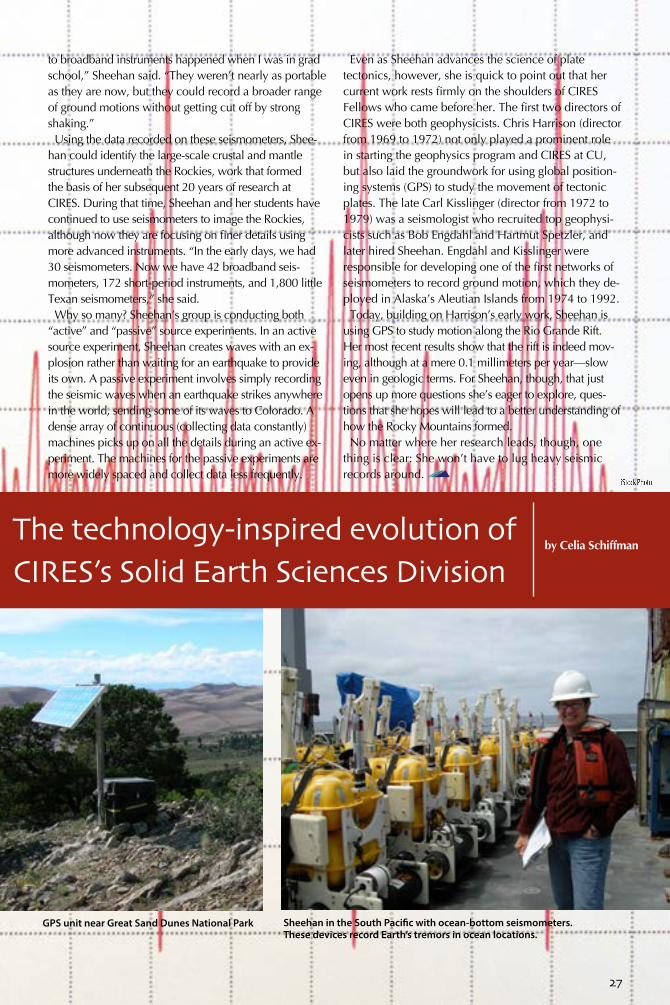
to broadband instruments happened when I was in grad school,” Sheehan said. “They weren’t nearly as portable as they are now, but they could record a broader range of ground motions without getting cut off by strong shaking.” Using the data recorded on these seismometers, Shee-
han could identify the large-scale crustal and mantle structures underneath the Rockies, work that formed the basis of her subsequent 20 years of research at CIRES. During that time, Sheehan and her students have continued to use seismometers to image the Rockies, although now they are focusing on finer details using more advanced instruments. “In the early days, we had 30 seismometers. Now we have 42 broadband seis-mometers, 172 short-period instruments, and 1,800 little Texan seismometers,” she said. Why so many? Sheehan’s group is conducting both
“active” and “passive” source experiments. In an active source experiment, Sheehan creates waves with an ex-plosion rather than waiting for an earthquake to provide its own. A passive experiment involves simply recording the seismic waves when an earthquake strikes anywhere in the world, sending some of its waves to Colorado. A dense array of continuous (collecting data constantly) machines picks up on all the details during an active ex-periment. The machines for the passive experiments are more widely spaced and collect data less frequently.
Even as Sheehan advances the science of plate tectonics, however, she is quick to point out that her current work rests firmly on the shoulders of CIRES Fellows who came before her. The first two directors of CIRES were both geophysicists. Chris Harrison (director from 1969 to 1972) not only played a prominent role in starting the geophysics program and CIRES at CU, but also laid the groundwork for using global position-ing systems (GPS) to study the movement of tectonic plates. The late Carl Kisslinger (director from 1972 to 1979) was a seismologist who recruited top geophysi-cists such as Bob Engdahl and Hartmut Spetzler, and later hired Sheehan. Engdahl and Kisslinger were responsible for developing one of the first networks of seismometers to record ground motion, which they de-ployed in Alaska’s Aleutian Islands from 1974 to 1992. Today, building on Harrison’s early work, Sheehan is
using GPS to study motion along the Rio Grande Rift. Her most recent results show that the rift is indeed mov-ing, although at a mere 0.1 millimeters per year—slow even in geologic terms. For Sheehan, though, that just opens up more questions she’s eager to explore, ques-tions that she hopes will lead to a better understanding of how the Rocky Mountains formed. No matter where her research leads, though, one
thing is clear: She won’t have to lug heavy seismic records around.
The technology-inspired evolution of CIRES’s Solid Earth Sciences Division
by Celia Schiffman
27
GPS unit near Great Sand Dunes National Park Sheehan in the South Pacific with ocean-bottom seismometers. These devices record Earth’s tremors in ocean locations.
iStock Photo
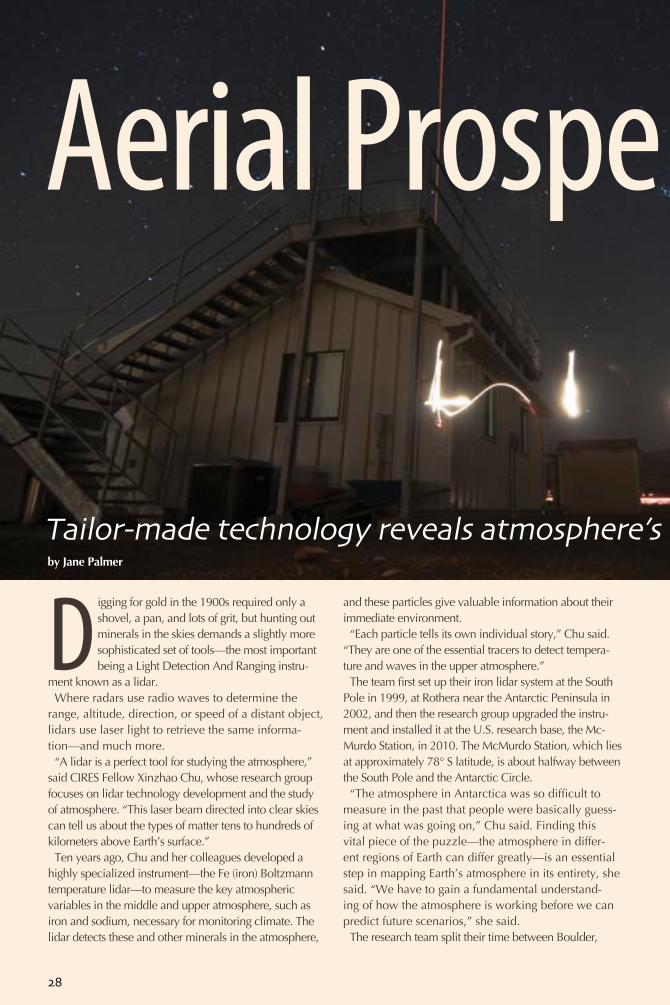
28
Digging for gold in the 1900s required only a shovel, a pan, and lots of grit, but hunting out minerals in the skies demands a slightly more sophisticated set of tools—the most important being a Light Detection And Ranging instru-
ment known as a lidar. Where radars use radio waves to determine the
range, altitude, direction, or speed of a distant object, lidars use laser light to retrieve the same informa-tion—and much more. “A lidar is a perfect tool for studying the atmosphere,”
said CIRES Fellow Xinzhao Chu, whose research group focuses on lidar technology development and the study of atmosphere. “This laser beam directed into clear skies can tell us about the types of matter tens to hundreds of kilometers above Earth’s surface.” Ten years ago, Chu and her colleagues developed a
highly specialized instrument—the Fe (iron) Boltzmann temperature lidar—to measure the key atmospheric variables in the middle and upper atmosphere, such as iron and sodium, necessary for monitoring climate. The lidar detects these and other minerals in the atmosphere,
and these particles give valuable information about their immediate environment. “Each particle tells its own individual story,” Chu said.
“They are one of the essential tracers to detect tempera-ture and waves in the upper atmosphere.” The team first set up their iron lidar system at the South
Pole in 1999, at Rothera near the Antarctic Peninsula in 2002, and then the research group upgraded the instru-ment and installed it at the U.S. research base, the Mc-Murdo Station, in 2010. The McMurdo Station, which lies at approximately 78° S latitude, is about halfway between the South Pole and the Antarctic Circle. “The atmosphere in Antarctica was so difficult to
measure in the past that people were basically guess-ing at what was going on,” Chu said. Finding this vital piece of the puzzle—the atmosphere in differ-ent regions of Earth can differ greatly—is an essential step in mapping Earth’s atmosphere in its entirety, she said. “We have to gain a fundamental understand-ing of how the atmosphere is working before we can predict future scenarios,” she said. The research team split their time between Boulder,
Aerial Prospe cting
Tailor-made technology reveals atmosphere’s hidden story.by Jane Palmer
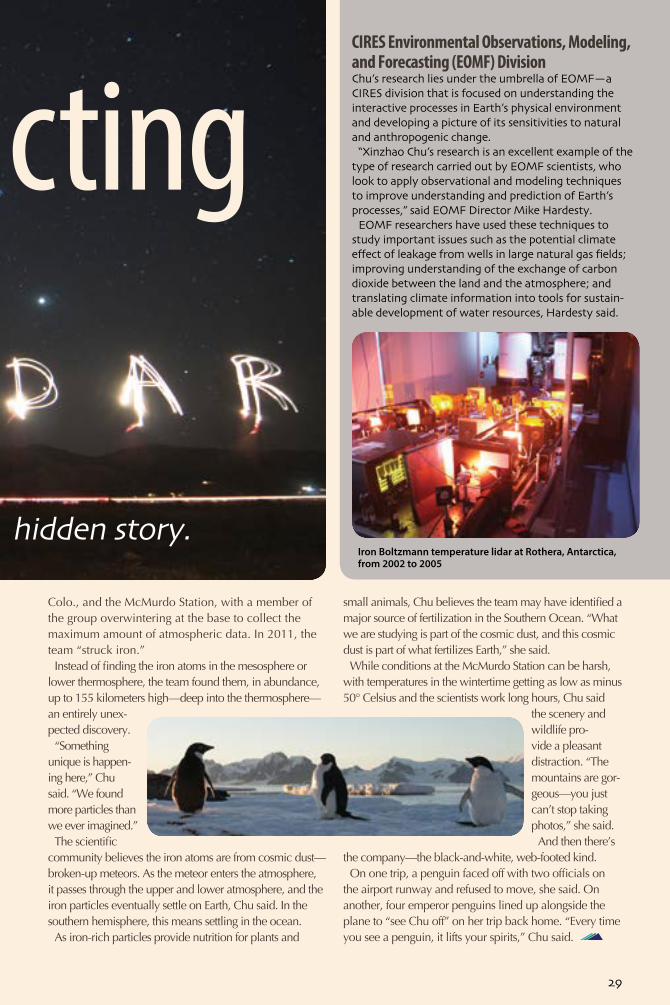
29
Colo., and the McMurdo Station, with a member of the group overwintering at the base to collect the maximum amount of atmospheric data. In 2011, the team “struck iron.”Instead of finding the iron atoms in the mesosphere or
lower thermosphere, the team found them, in abundance, up to 155 kilometers high—deep into the thermosphere—an entirely unex-pected discovery. “Something
unique is happen-ing here,” Chu said. “We found more particles than we ever imagined.” The scientific
community believes the iron atoms are from cosmic dust—broken-up meteors. As the meteor enters the atmosphere, it passes through the upper and lower atmosphere, and the iron particles eventually settle on Earth, Chu said. In the southern hemisphere, this means settling in the ocean. As iron-rich particles provide nutrition for plants and
small animals, Chu believes the team may have identified a major source of fertilization in the Southern Ocean. “What we are studying is part of the cosmic dust, and this cosmic dust is part of what fertilizes Earth,” she said. While conditions at the McMurdo Station can be harsh,
with temperatures in the wintertime getting as low as minus 50° Celsius and the scientists work long hours, Chu said
the scenery and wildlife pro-vide a pleasant distraction. “The mountains are gor-geous—you just can’t stop taking photos,” she said. And then there’s
the company—the black-and-white, web-footed kind. On one trip, a penguin faced off with two officials on
the airport runway and refused to move, she said. On another, four emperor penguins lined up alongside the plane to “see Chu off” on her trip back home. “Every time you see a penguin, it lifts your spirits,” Chu said.
Aerial Prospe cting
Tailor-made technology reveals atmosphere’s hidden story.
CIRES Environmental Observations, Modeling, and Forecasting (EOMF) DivisionChu’s research lies under the umbrella of EOMF—a CIRES division that is focused on understanding the interactive processes in Earth’s physical environment and developing a picture of its sensitivities to natural and anthropogenic change.
“Xinzhao Chu’s research is an excellent example of the type of research carried out by EOMF scientists, who look to apply observational and modeling techniques to improve understanding and prediction of Earth’s processes,” said EOMF Director Mike Hardesty.
EOMF researchers have used these techniques to study important issues such as the potential climate effect of leakage from wells in large natural gas fields; improving understanding of the exchange of carbon dioxide between the land and the atmosphere; and translating climate information into tools for sustain-able development of water resources, Hardesty said.
Iron Boltzmann temperature lidar at Rothera, Antarctica, from 2002 to 2005
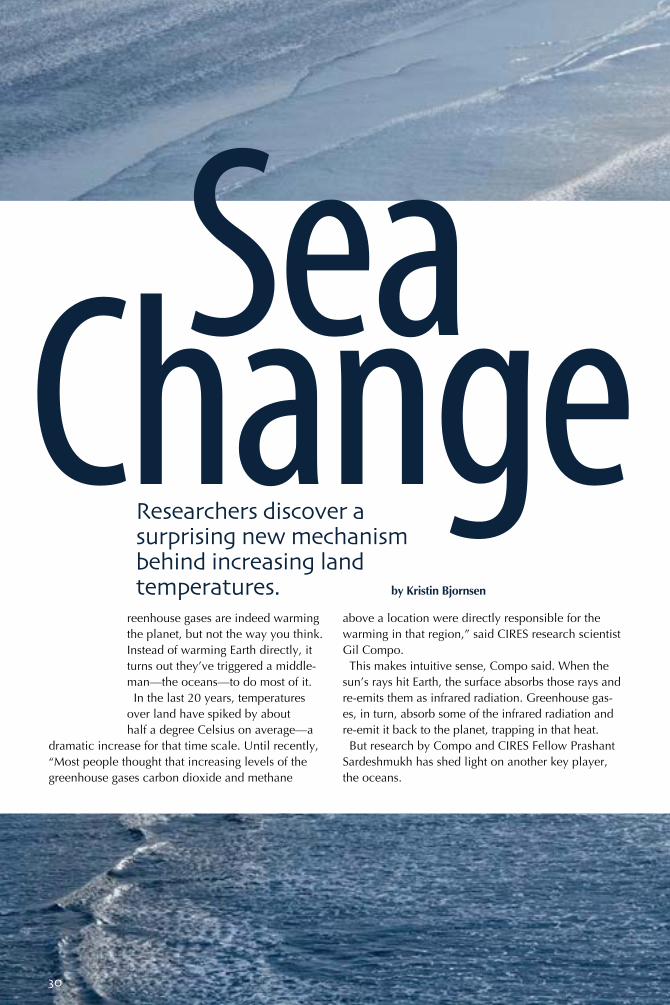
Greenhouse gases are indeed warming the planet, but not the way you think. Instead of warming Earth directly, it turns out they’ve triggered a middle-man—the oceans—to do most of it.In the last 20 years, temperatures
over land have spiked by about half a degree Celsius on average—a
dramatic increase for that time scale. Until recently, “Most people thought that increasing levels of the greenhouse gases carbon dioxide and methane
above a location were directly responsible for the warming in that region,” said CIRES research scientist Gil Compo.This makes intuitive sense, Compo said. When the
sun’s rays hit Earth, the surface absorbs those rays and re-emits them as infrared radiation. Greenhouse gas-es, in turn, absorb some of the infrared radiation and re-emit it back to the planet, trapping in that heat. But research by Compo and CIRES Fellow Prashant
Sardeshmukh has shed light on another key player, the oceans.
SeaChangeResearchers discover a surprising new mechanism behind increasing land temperatures.
30
by Kristin Bjornsen
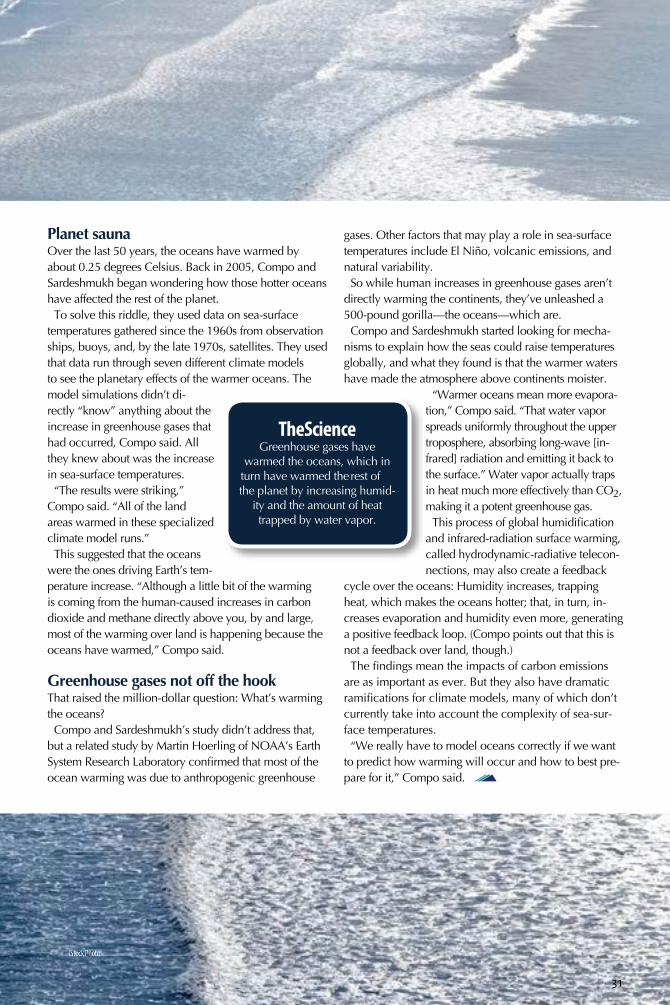
SeaChangePlanet saunaOver the last 50 years, the oceans have warmed by about 0.25 degrees Celsius. Back in 2005, Compo and Sardeshmukh began wondering how those hotter oceans have affected the rest of the planet.To solve this riddle, they used data on sea-surface
temperatures gathered since the 1960s from observation ships, buoys, and, by the late 1970s, satellites. They used that data run through seven different climate models to see the planetary effects of the warmer oceans. The model simulations didn’t di-rectly “know” anything about the increase in greenhouse gases that had occurred, Compo said. All they knew about was the increase in sea-surface temperatures.“The results were striking,”
Compo said. “All of the land areas warmed in these specialized climate model runs.” This suggested that the oceans
were the ones driving Earth’s tem-perature increase. “Although a little bit of the warming is coming from the human-caused increases in carbon dioxide and methane directly above you, by and large, most of the warming over land is happening because the oceans have warmed,” Compo said.
Greenhouse gases not off the hookThat raised the million-dollar question: What’s warming the oceans? Compo and Sardeshmukh’s study didn’t address that,
but a related study by Martin Hoerling of NOAA’s Earth System Research Laboratory confirmed that most of the ocean warming was due to anthropogenic greenhouse
gases. Other factors that may play a role in sea-surface temperatures include El Niño, volcanic emissions, and natural variability. So while human increases in greenhouse gases aren’t
directly warming the continents, they’ve unleashed a 500-pound gorilla—the oceans—which are.Compo and Sardeshmukh started looking for mecha-
nisms to explain how the seas could raise temperatures globally, and what they found is that the warmer waters have made the atmosphere above continents moister.
“Warmer oceans mean more evapora-tion,” Compo said. “That water vapor spreads uniformly throughout the upper troposphere, absorbing long-wave [in-frared] radiation and emitting it back to the surface.” Water vapor actually traps in heat much more effectively than CO2, making it a potent greenhouse gas.This process of global humidification
and infrared-radiation surface warming, called hydrodynamic-radiative telecon-nections, may also create a feedback
cycle over the oceans: Humidity increases, trapping heat, which makes the oceans hotter; that, in turn, in-creases evaporation and humidity even more, generating a positive feedback loop. (Compo points out that this is not a feedback over land, though.)The findings mean the impacts of carbon emissions
are as important as ever. But they also have dramatic ramifications for climate models, many of which don’t currently take into account the complexity of sea-sur-face temperatures. “We really have to model oceans correctly if we want
to predict how warming will occur and how to best pre-pare for it,” Compo said.
31
TheScienceGreenhouse gases have
warmed the oceans, which in turn have warmed the rest of the planet by increasing humid-
ity and the amount of heat trapped by water vapor.
iStock Photo
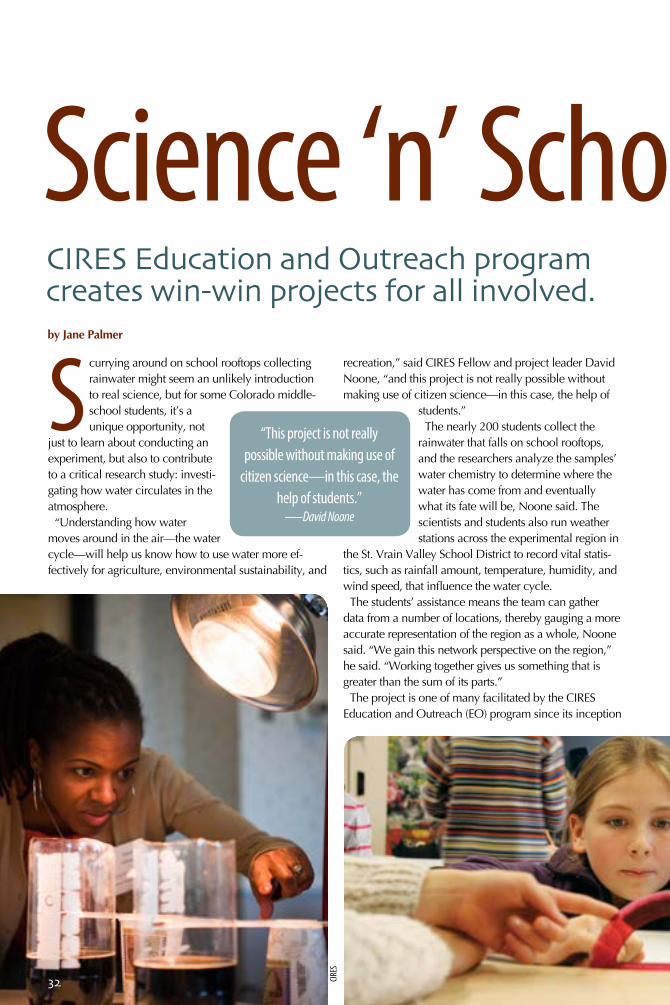
Scurrying around on school rooftops collecting rainwater might seem an unlikely introduction to real science, but for some Colorado middle-school students, it’s a unique opportunity, not
just to learn about conducting an experiment, but also to contribute to a critical research study: investi-gating how water circulates in the atmosphere. “Understanding how water
moves around in the air—the water cycle—will help us know how to use water more ef-fectively for agriculture, environmental sustainability, and
recreation,” said CIRES Fellow and project leader David Noone, “and this project is not really possible without making use of citizen science—in this case, the help of
students.”The nearly 200 students collect the
rainwater that falls on school rooftops, and the researchers analyze the samples’ water chemistry to determine where the water has come from and eventually what its fate will be, Noone said. The scientists and students also run weather stations across the experimental region in
the St. Vrain Valley School District to record vital statis-tics, such as rainfall amount, temperature, humidity, and wind speed, that influence the water cycle. The students’ assistance means the team can gather
data from a number of locations, thereby gauging a more accurate representation of the region as a whole, Noone said. “We gain this network perspective on the region,” he said. “Working together gives us something that is greater than the sum of its parts.”The project is one of many facilitated by the CIRES
Education and Outreach (EO) program since its inception
CIRES Education and Outreach program creates win-win projects for all involved.
Science ‘n’ Schools Symbiosisby Jane Palmer
CIRES
“This project is not really possible without making use of
citizen science—in this case, the help of students.”
—David Noone
32
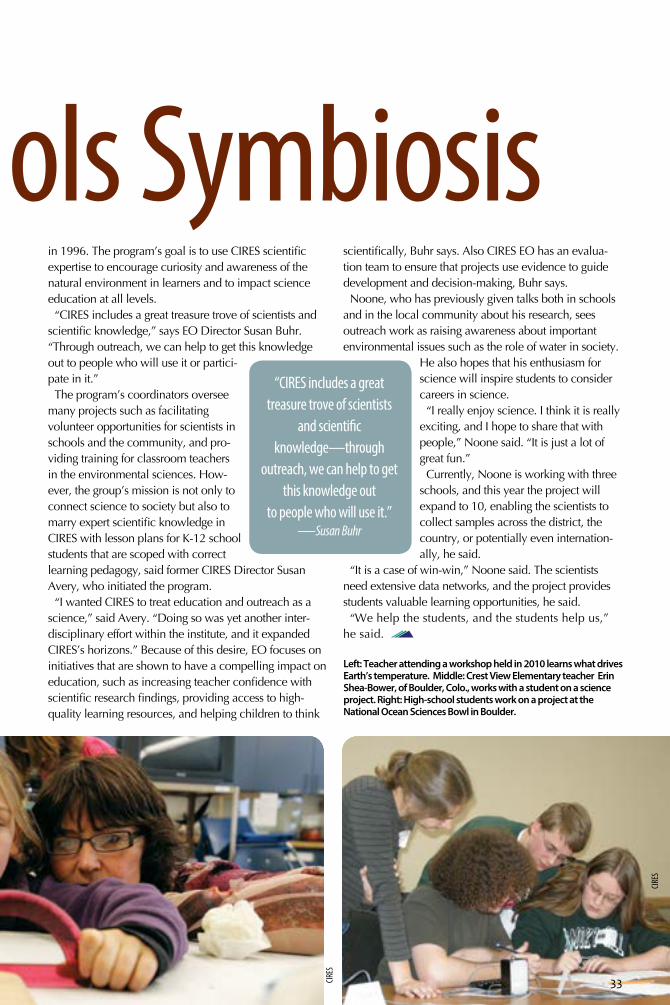
33
Science ‘n’ Schools Symbiosisin 1996. The program’s goal is to use CIRES scientific expertise to encourage curiosity and awareness of the natural environment in learners and to impact science education at all levels. “CIRES includes a great treasure trove of scientists and
scientific knowledge,” says EO Director Susan Buhr. “Through outreach, we can help to get this knowledge out to people who will use it or partici-pate in it.” The program’s coordinators oversee
many projects such as facilitating volunteer opportunities for scientists in schools and the community, and pro-viding training for classroom teachers in the environmental sciences. How-ever, the group’s mission is not only to connect science to society but also to marry expert scientific knowledge in CIRES with lesson plans for K-12 school students that are scoped with correct learning pedagogy, said former CIRES Director Susan Avery, who initiated the program.“I wanted CIRES to treat education and outreach as a
science,” said Avery. “Doing so was yet another inter-disciplinary effort within the institute, and it expanded CIRES’s horizons.” Because of this desire, EO focuses on initiatives that are shown to have a compelling impact on education, such as increasing teacher confidence with scientific research findings, providing access to high- quality learning resources, and helping children to think
scientifically, Buhr says. Also CIRES EO has an evalua-tion team to ensure that projects use evidence to guide development and decision-making, Buhr says. Noone, who has previously given talks both in schools
and in the local community about his research, sees outreach work as raising awareness about important environmental issues such as the role of water in society.
He also hopes that his enthusiasm for science will inspire students to consider careers in science. “I really enjoy science. I think it is really
exciting, and I hope to share that with people,” Noone said. “It is just a lot of great fun.”Currently, Noone is working with three
schools, and this year the project will expand to 10, enabling the scientists to collect samples across the district, the country, or potentially even internation-ally, he said.
“It is a case of win-win,” Noone said. The scientists need extensive data networks, and the project provides students valuable learning opportunities, he said. “We help the students, and the students help us,”
he said.
“CIRES includes a great treasure trove of scientists
and scientific knowledge—through
outreach, we can help to get this knowledge out
to people who will use it.”—Susan Buhr
Left: Teacher attending a workshop held in 2010 learns what drives Earth’s temperature. Middle: Crest View Elementary teacher Erin Shea-Bower, of Boulder, Colo., works with a student on a science project. Right: High-school students work on a project at the National Ocean Sciences Bowl in Boulder.
CIRES
CIRES
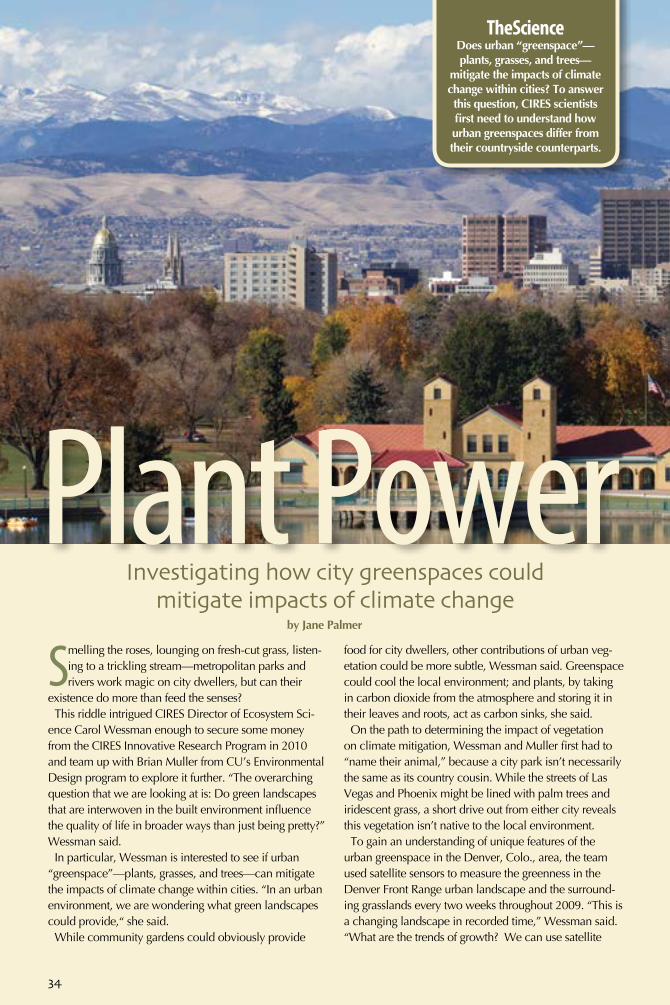
34
Smelling the roses, lounging on fresh-cut grass, listen-ing to a trickling stream—metropolitan parks and rivers work magic on city dwellers, but can their
existence do more than feed the senses? This riddle intrigued CIRES Director of Ecosystem Sci-
ence Carol Wessman enough to secure some money from the CIRES Innovative Research Program in 2010 and team up with Brian Muller from CU’s Environmental Design program to explore it further. “The overarching question that we are looking at is: Do green landscapes that are interwoven in the built environment influence the quality of life in broader ways than just being pretty?” Wessman said. In particular, Wessman is interested to see if urban
“greenspace”—plants, grasses, and trees—can mitigate the impacts of climate change within cities. “In an urban environment, we are wondering what green landscapes could provide,“ she said. While community gardens could obviously provide
food for city dwellers, other contributions of urban veg-etation could be more subtle, Wessman said. Greenspace could cool the local environment; and plants, by taking in carbon dioxide from the atmosphere and storing it in their leaves and roots, act as carbon sinks, she said. On the path to determining the impact of vegetation
on climate mitigation, Wessman and Muller first had to “name their animal,” because a city park isn’t necessarily the same as its country cousin. While the streets of Las Vegas and Phoenix might be lined with palm trees and iridescent grass, a short drive out from either city reveals this vegetation isn’t native to the local environment. To gain an understanding of unique features of the
urban greenspace in the Denver, Colo., area, the team used satellite sensors to measure the greenness in the Denver Front Range urban landscape and the surround-ing grasslands every two weeks throughout 2009. “This is a changing landscape in recorded time,” Wessman said. “What are the trends of growth? We can use satellite
Investigating how city greenspaces could mitigate impacts of climate change
Plant Powerby Jane Palmer
TheScienceDoes urban “greenspace”—plants, grasses, and trees—
mitigate the impacts of climate change within cities? To answer this question, CIRES scientists first need to understand how urban greenspaces differ from their countryside counterparts.
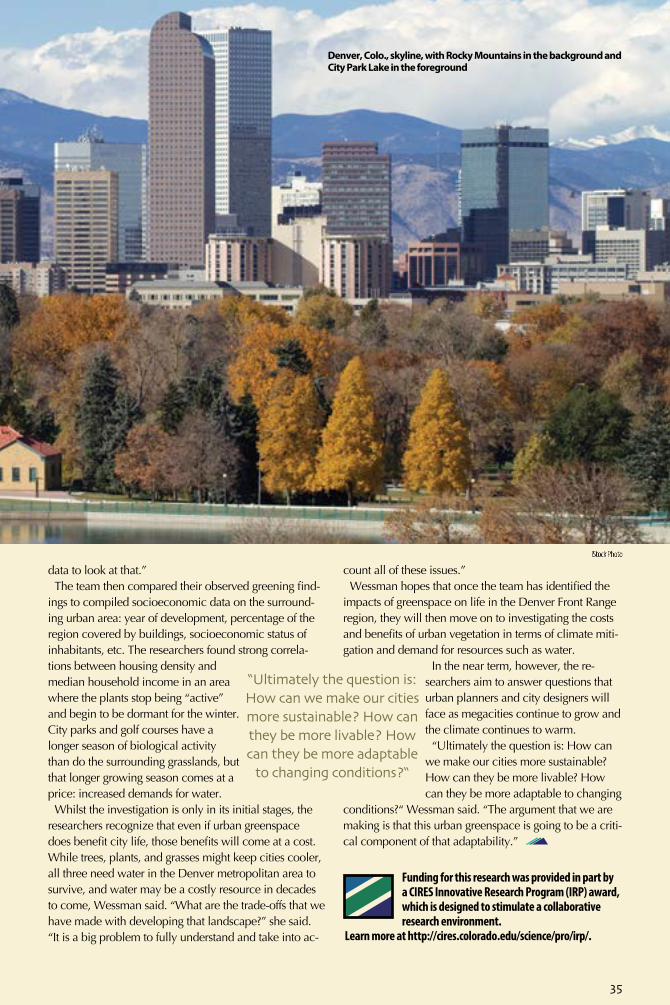
35
Funding for this research was provided in part by a CIRES Innovative Research Program (IRP) award, which is designed to stimulate a collaborative research environment.
Learn more at http://cires.colorado.edu/science/pro/irp/.
data to look at that.” The team then compared their observed greening find-
ings to compiled socioeconomic data on the surround-ing urban area: year of development, percentage of the region covered by buildings, socioeconomic status of inhabitants, etc. The researchers found strong correla-tions between housing density and median household income in an area where the plants stop being “active” and begin to be dormant for the winter. City parks and golf courses have a longer season of biological activity than do the surrounding grasslands, but that longer growing season comes at a price: increased demands for water. Whilst the investigation is only in its initial stages, the
researchers recognize that even if urban greenspace does benefit city life, those benefits will come at a cost. While trees, plants, and grasses might keep cities cooler, all three need water in the Denver metropolitan area to survive, and water may be a costly resource in decades to come, Wessman said. “What are the trade-offs that we have made with developing that landscape?” she said. “It is a big problem to fully understand and take into ac-
count all of these issues.”Wessman hopes that once the team has identified the
impacts of greenspace on life in the Denver Front Range region, they will then move on to investigating the costs and benefits of urban vegetation in terms of climate miti-gation and demand for resources such as water.
In the near term, however, the re-searchers aim to answer questions that urban planners and city designers will face as megacities continue to grow and the climate continues to warm. “Ultimately the question is: How can
we make our cities more sustainable? How can they be more livable? How can they be more adaptable to changing
conditions?“ Wessman said. “The argument that we are making is that this urban greenspace is going to be a criti-cal component of that adaptability.”
iStock Photo
Denver, Colo., skyline, with Rocky Mountains in the background and City Park Lake in the foreground
C I R SE
“Ultimately the question is: How can we make our cities more sustainable? How can they be more livable? How can they be more adaptable
to changing conditions?“
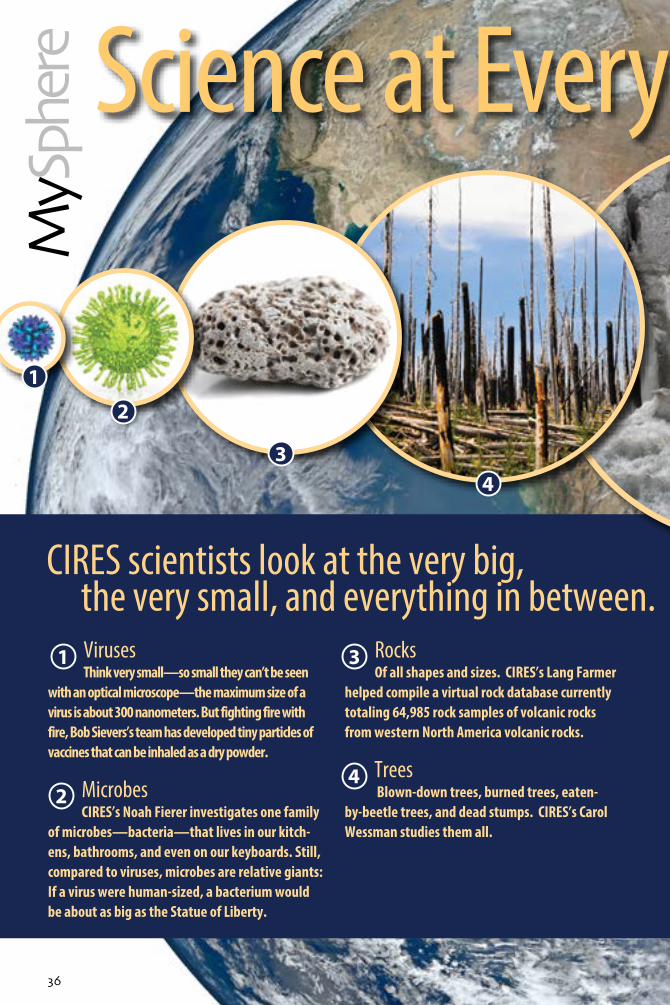
xx
MyS
pher
e Science at Every Scale
CIRES scientists look at the very big, the very small, and everything in between.
VirusesThink very small—so small they can’t be seen
with an optical microscope—the maximum size of a virus is about 300 nanometers. But fighting fire with fire, Bob Sievers’s team has developed tiny particles of vaccines that can be inhaled as a dry powder.
MicrobesCIRES’s Noah Fierer investigates one family
of microbes—bacteria—that lives in our kitch-ens, bathrooms, and even on our keyboards. Still, compared to viruses, microbes are relative giants: If a virus were human-sized, a bacterium would be about as big as the Statue of Liberty.
RocksOf all shapes and sizes. CIRES’s Lang Farmer
helped compile a virtual rock database currently totaling 64,985 rock samples of volcanic rocks from western North America volcanic rocks.
Trees Blown-down trees, burned trees, eaten-
by-beetle trees, and dead stumps. CIRES’s Carol Wessman studies them all.
1
2
34
4
3
2
1
36
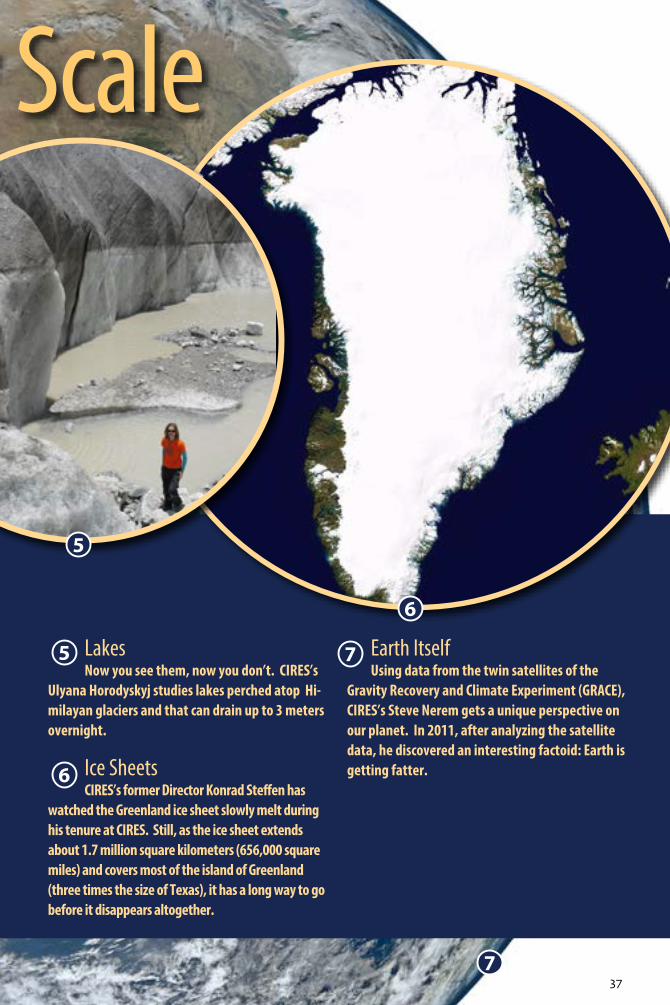
xx37
Science at Every Scale
LakesNow you see them, now you don’t. CIRES’s
Ulyana Horodyskyj studies lakes perched atop Hi-milayan glaciers and that can drain up to 3 meters overnight.
Ice SheetsCIRES’s former Director Konrad Steffen has
watched the Greenland ice sheet slowly melt during his tenure at CIRES. Still, as the ice sheet extends about 1.7 million square kilometers (656,000 square miles) and covers most of the island of Greenland (three times the size of Texas), it has a long way to go before it disappears altogether.
Earth ItselfUsing data from the twin satellites of the
Gravity Recovery and Climate Experiment (GRACE), CIRES’s Steve Nerem gets a unique perspective on our planet. In 2011, after analyzing the satellite data, he discovered an interesting factoid: Earth is getting fatter.
5
6
7
7
6
5

Printed on 100% recycled PaPer
Apply for a CIRES Visiting FellowshipJoin a thriving research community in Boulder, colo., for unique opportunities to conduct challenging research with recognized leaders in earth system science.
the Visiting Fellows program invites scientists ranging from recent doctoral graduates, to those on sabbatical, to senior scientists from many disciplines to continue their education in research positions that may foster interdisciplin-ary training and exposure to scientific assessments and policy research. these positions are open to scientists with research interests in the areas of the cireS research themes.
applications are due december 2012. For more information, visit: http://cires.colorado.edu/collaboration/fellowships/apply/
the cooperative institute for research in environmental Sciences is a research institute dedicated to better understanding the earth system. our research is essential for understanding the processes and feedbacks in many earth science disciplines, and to foster cross-disciplinary understanding of the cryosphere, biosphere, atmosphere, geosphere, and hydrosphere. cireS scientists are identifying and quantifying changes in a warming climate, providing baseline data against which to measure change, and informing the public and policy makers about these changes.
cireS is a cooperative institute of the University of colorado Boulder and the national oceanic and atmospheric administration.
William M. Lewis, Ph.D., interim director Kristen Averyt, Ph.D., associate director for Science
http://cires.colorado.edu • twitter.com/theCIRESwire • Facebook/CIRESnews
Contact CIRES communications:[email protected]