spi insurance company limited
TRANSCRIPT

www.saudipakinsurance.com.pk
Annual Report | for the year ended December 31, 2012
GROWING VALUES
SAUDI PAK INSURANCE COMPANY LIMITED

A commitment to
Growing ValuesSAUDI PAKINSURANCE
SAUDI PAK INSURANCE COMPANY LIMITED
Annual Report | for the year ended December 31, 2012
GROWING VALUES
“Saudi Pak insurance Company Limited” has always lived up to its name by
being one step ahead in the insurance industry, and finding new and affordable
insurance solutions. we have refocused our strategy to better use of expertise in
our business to secure our customers. we are trying to manage our business to
reduce volatility improve returns and accelerate growth through prudent
management and hard working. we will capture a profitable share of the many
opportunities we see around the country -helping customers achieve lifetime
financial security and creating long lasting values for shareholders. This is how
saudi pak is growing value.
Saudi Pak Insurance Company Limited.Major Share Holders of
United International Group
Silk Bank Limited
SAUDI PAK LEASING COMPANY LIMITED

In the Name of ALLAH, The Most Beneficent, The Most Merciful

”
”
Our strategy is based on key principles of execution, financial and underwriting discipline, and above all, focusing on our core business of insurance.

Contents
What is inside?
Overview
Business review& Governance
Financial Highlights
Financial Statements
Vision MissionAbout Us
At Saudi PakAt a GlanceFive Year At a Glance
Company InformationOur Core ManagementServices We OfferBoard of DirectorsSenior ManagementA Message from the ChairmanDirectors’ Report to the Members
Pattern of ShareholdingAuditor’s Report to the MembersBalance SheetProfit and Loss AccountStatement of Comprehensive IncomeStatement of Changes in EquityStatement of Cash FlowsStatement of PremiumsStatement of ClaimsStatement of ExpensesStatement of Investment IncomeNotes to the Financial StatementsOur Network

When we think about our future, the word that comes to mind is promise. Our promise to our people, our customers, our investors, our
communities and our suppliers is thatwe are going to build the best
insurance company in the Pakistan.
We believe we are well on our way.

1
Vision 6
Mission 7
About Us 8

6 Saudi Pak Insurance Company Limited
Our vision is to be the quality insurance service provider, recognized and appraised by performance and product development to cater the changing needs of customers and continuous growth of human resources.
Vision
We wish to become a dynamic insurance service provider, maintaining credibility and reputation while growing revenues over the coming years and improving insurance products by utilizing latest technologies. Saudi Pak Insurance Company Limited focusing to build up a team of professionals by imparting exhaustive training, education and career orientation for the benefit of the insurance industry. We shall endeavor our utmost to render the best possible services to our clients.
Mission

Annual Report | for the year ended December 31, 2012 7

8 Saudi Pak Insurance Company Limited
About Us
Ownership & Paid Up Capital
The company commenced its operations with a paid up capital of Rs. 200 million which has been raised to Rs. 325 million with an authorized capital of Rs. 500 million, thus providing a strong base for operations and substantial capacity for accommodating large industrial risks.
Professional Strength
The company is manned by duly qualified and experienced professionals of all discipline of insurance having substantial knowledge
of underwriting various products and claims management.
Claim Management
Claims are the end product of the insurance. At Saudi Pak Insurance, we believe in the philosophy that every claim is a service to the client and therefore must be handled in the most professional and judicious manner. We therefore give great emphasis to expeditious claim handling including assistance to the client in the risk management, loss mitigation, fast settlements
and early payments. For this purpose the Company’s claim department is led by a veteran who is assisted by a very efficient technical team of professionals. Believing in the quality of service the company employs the leading loss adjusters of the country who have foreign affiliation and years of experience to their credit.
Major Shareholders:
United International GroupSaudi Pak Industrial & Agricultural Investment Company Ltd.Silk Bank Ltd.Saudi Pak Leasing Co. Ltd.
Saudi Pak Insurance Company is a
general Insurance Company providing
insurance coverage to various
renowned companies and financial
institutions of Pakistan. Saudi Pak
Insurance started its operations from
April 14, 2005 and since then it has
managed to emerge as one of the
successful company of the insurance
industry. Fortunately to its credit, it is
jointly supported by the strong Saudi
Pak Group, UIG Group and Silk Bank
Limited.

Annual Report | for the year ended December 31, 2012 9
Branches
With 29 online branches across Pakistan, Saudi Pak Insurance enjoys unique position when it comes to client service. A suitable number of strategically located branches and desirable for an insurance company which plans to expand its operations nationwide in order to provide services to its clients who may situated at remote and far reaching places. With the above credentials we are Confident that our company has desired financial strength
and expertise to provide coverage to Clients various insurance requirements and hope that they will consider us to be the potential insurers of your valuables assets.
Technology is oneof the key
success factors in the business today. It serves as the backbone for all operational functions. The Company intends to establish itself as a technology oriented financial institution. The company has adopted top level
technologies like Oracle and IBM Servers and invested generously towards the infrastructure which is providing online real time branch connectivity which serves as means for data warehousing, catering of basic transaction and meeting the clients’ needs.

Over the course of 2012,we expect to see improvement
in our insurance operations,in terms of policy growth.

2
At Saudi Pak 12
At a Glance 13
Five Year At a Galance 15
12 Saudi Pak Insurance Company Limited
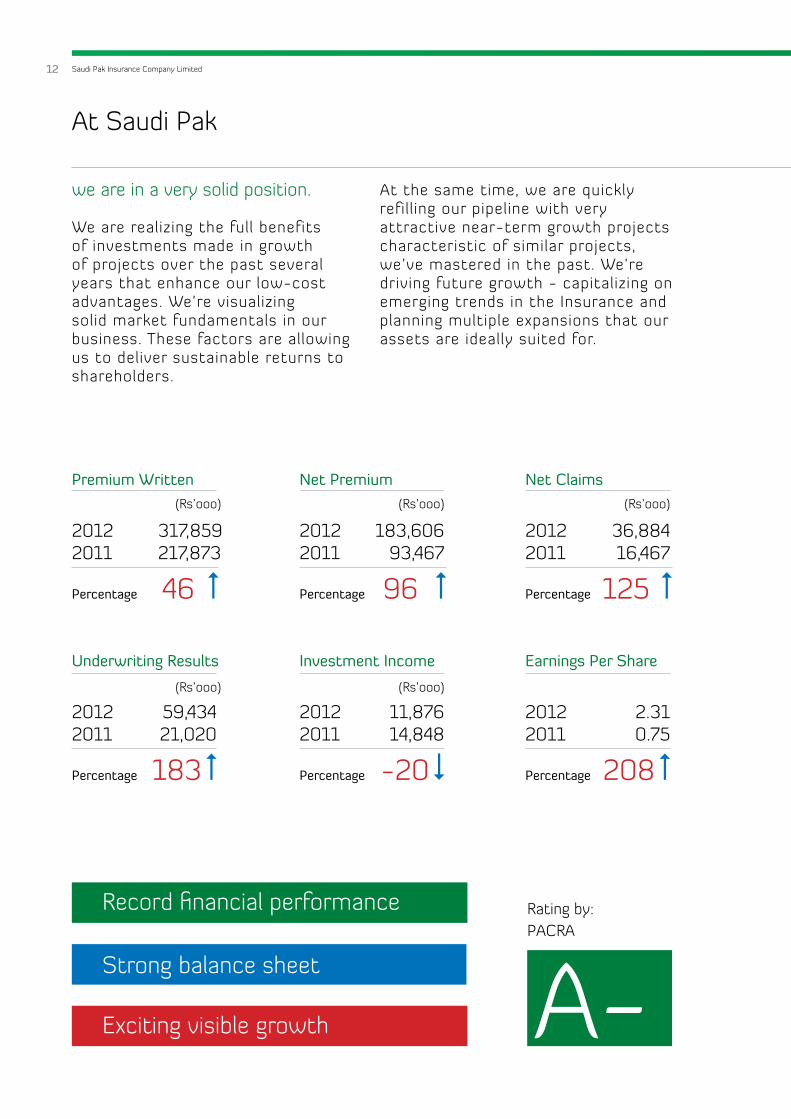
we are in a very solid position.
We are realizing the full benefits of investments made in growth of projects over the past several years that enhance our low-cost advantages. We’re visualizing solid market fundamentals in our business. These factors are allowing us to deliver sustainable returns to shareholders.
At the same time, we are quickly refilling our pipeline with very attractive near-term growth projects characteristic of similar projects, we’ve mastered in the past. We’re driving future growth - capitalizing on emerging trends in the Insurance and planning multiple expansions that our assets are ideally suited for.
Strong balance sheet
Exciting visible growth
Record financial performance Rating by: PACRA
A-
At Saudi Pak
Premium Written(Rs’ooo)
(Rs’ooo)
(Rs’ooo)
(Rs’ooo)
(Rs’ooo)
20122011
317,859217,873
46Percentage
Net Premium
20122011
183,60693,467
96Percentage
Net Claims
20122011
36,88416,467
125Percentage
Underwriting Results
20122011
59,43421,020
183Percentage
Investment Income
20122011
11,87614,848
-20 Percentage
Earnings Per Share
20122011
2.310.75
208 Percentage

Annual Report | for the year ended December 31, 2012 13
At a Glance“Excellence is not an act but a habit”

14 Saudi Pak Insurance Company Limited

Annual Report | for the year ended December 31, 2012 15
(RUPEES IN MILLIONS)
2012 2011 2010 2009 2008
Financial Data:
Paid up capital 325.00 325.00 325.00 325.00 325.00
Equity 257.49 182.54 158.14 200.87 200.73
Underwriting Provisions 245.78 228.72 228.63 299.82 401.26
Investment at cost 93.66 82.34 77.63 100.49 78.61
Total Assets (book value) 529.82 428.87 401.97 522.70 634.71
Fixed Assets (WDV) 56.61 32.79 25.98 31.28 38.27
Cash and bank deposits 70.41 62.99 50.67 32.39 99.82
Assets - Others 309.15 250.75 247.68 358.54 417.99
OPERATING DATA:
Gross Premium 317.86 217.87 193.60 230.46 282.47
Net Premium 183.61 93.47 82.07 124.85 145.28
Net Claims expenses 36.88 16.43 69.76 69.94 103.30
Management expenses 134.73 66.55 63.89 73.70 99.03
Underwriting Profit / (Loss) 59.43 21.02 (41.54) (8.22) (44.63)
Investment Income / (Loss) 10.21 7.45 3.26 10.79 (12.60)
Profit / (Loss) before Tax 23.86 25.34 (41.54) 1.47 (59.88)
Provision for Tax (51.08) 0.93 1.18 0.62 -
Profit / (Loss) after Tax 74.95 24.40 (42.73) 0.85 (59.88)
FINANCIAL RATIOS:
Profit before tax / Gross Premium (%) 7.5% 11.6% -21.5% 0.6% -21.2%
Profit before tax / Net Premium (%) 13.0% 27.1% -50.6% 1.2% -41.2%
Profit after tax / Gross Premium (%) 23.6% 11.2% -22.1% 0.4% -21.2%
Profit after tax / Net Premium (%) 40.8% 26.1% -52.1% 0.7% -41.2%
Management Expenses to Gross Premium (%) 42.4% 30.5% 33.0% 32.0% 35.1%
Management Expenses to Net Premium (%) 73.4% 71.2% 77.8% 59.0% 68.2%
Underwriting Profit / Net Premium (%) 32.4% 22.5% -50.6% -6.6% -30.7%
Net Claims / Net Premium (%) 20.1% 17.6% 85.0% 56.0% 71.1%
Return on Assets (%) 14.1% 5.7% -10.6% 0.2% -9.4%
LIQUIDITY / LEVERAGE RATIOS:
Current Ratio (Times) 1.20 1.27 1.22 1.21 1.19
Total Assets Turnover (Times) 1.67 1.97 2.08 2.27 2.25
Fixed Assets Turnover (Times) 0.18 0.15 0.13 0.14 0.14
Total Liability / Equity (Times) 1.06 1.35 1.54 1.60 2.16
Return on Capital Employed (%) 9.3% 13.9% -26.3% 0.7% -29.8%
Paid up Capital / Total Assets (%) 61.3% 75.8% 80.9% 62.2% 51.2%
Equity / Total Assets (%) 48.6% 42.6% 39.3% 38.4% 31.6%
RETURN TO MEMBERS:
Return on Equity -PBT (%) 9.3% 13.9% -26.3% 0.7% -29.8%
Return on Equity -PAT (%) 29.1% 13.4% -27.0% 0.4% -29.8%
Earnings per Share (Rs.) 2.31 0.75 (1.31) 0.03 (2.63)
Breakup Value per Share (Rs.) 7.92 5.62 4.87 6.18 6.18
Five years at a glance

16 Saudi Pak Insurance Company Limited
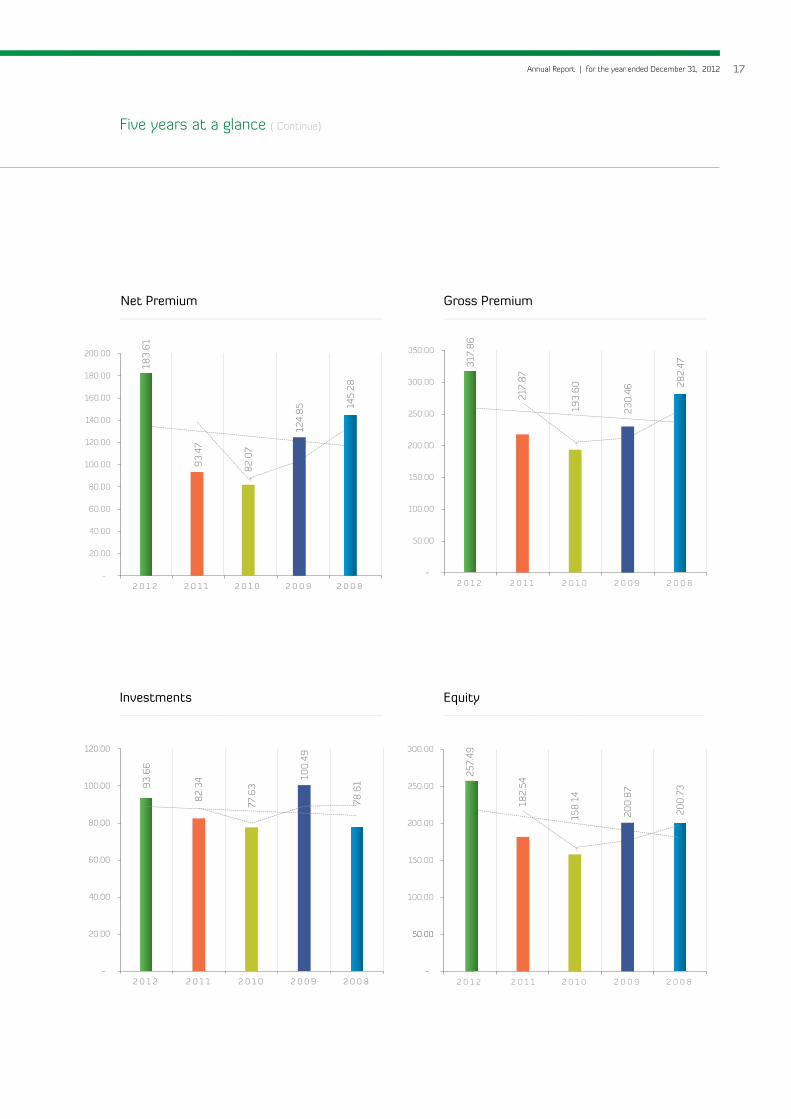
Five years at a glance ( Continue)
(59.43)
21.02 (41.54)
8.22
44.63
Underwriting Profit / (Loss)
2012
201020092008
2011 2012
201020092008
2011
Earnings per Share
44%
Deferred Tax
11% 18%
10%
18%
Investments
Receivables Other Assets
Assets 2012
Fixed Assets
5%
0%
46%
49%
Underwritin g Provisiions Deferred Liabilities
Creditors & Accruals Equity
Liabilities 2012
5%
0%
2.31
0.75
(1.31)
0.03
(2.63)
Annual Report | for the year ended December 31, 2012 17
Five years at a glance ( Continue)
93.4
7
82.0
7
124.
85 145.
28
-
20.00
40.00
60.00
80.00
100.00
120.00
140.00
160.00
180.00
200.00
2 0 1 2 2 0 1 1 2 0 1 0 2 0 0 9 2 0 0 8
Net Premium
183.
61
Gross Premium
317.
86
217.
87
193.
60
230.
46 28
2.47
-
50.00
100.00
150.00
200.00
250.00
300.00
350.00
2 0 1 2 2 0 1 1 2 0 1 0 2 0 0 9 2 0 0 8
93.6
6
82.3
4
77.6
3
100.
49
78.6
1
-
20.00
40.00
60.00
80.00
100.00
120.00
2 0 1 2 2 0 1 1 2 0 1 0 2 0 0 9 2 0 0 8
Investments
257.
49
182.
54
158.
14
200.
87
200.
73
-
50.00
100.00
150.00
200.00
250.00
300.00
2 0 1 2 2 0 1 02 0 1 1 2 0 0 9 2 0 0 8
Equity
Given the high cost of customeracquisition in the insurance sector,
insurers need to build customeradvocacy and minimise the value
leakage of existing customers.

3
Board of Directors 20
Company Information 22
Our Core Management 25
Services we offer 28
Senior Management 32
A Massage from the Chairman 34
Directors’ Report to the Members 35

20 Saudi Pak Insurance Company Limited
Mian M. A. ShahidChief Executive Officer
Syed Ammar Ali ZaidiDirector
Mr. Adnan AfridiChairman
Board of Directors

Annual Report | for the year ended December 31, 2012 21
Mr. Muhammad Saeed AkhterDirector
Mr. Abdul Majeed Director
Ms.Perveen Akhtar MalikDirector
Shiekh Aftab AhmedDirector

22 Saudi Pak Insurance Company Limited
Company Information
Audit CommitteeSyed Ammar Ali Zaidi (Chairman)
Mr. Muhammad Saeed Akhter (Member)
Mr. Abdul Majeed (Member)
Chief Internal AuditorMian Mohsin Aslam
AuditorsM/s Avais Hyder Liaquat Nauman
Chartered Accountants
M/s Sarwars
Chartered Accountants
Tax ConsultantM/s Muhammad Bilal & Company
Chartered Accountants
Registered OfficeSuite # 204-A, Second Floor,
Madina City Mall, Abdullah Haroon Road,
Karachi.
Phone # (021) 37010190, 35221805-6
Fax # (021) 37010191
Head Office1st Floor, UIG House,
6 - D, Upper Mall
Lahore.
Phone # (042) 35776561-64
Fax # (042) 35776560
E-mail: [email protected]
Website: www.saudipakinsurance.com.pk
ChairmanMr. Adnan Afridi
Managing Director & Chief ExecutiveMian M. A. Shahid
DirectorsMs. Parveen Akhter Malik
Mr. Muhammad Saeed Akhter
Mr. Abdul Majeed
Syed Ammar Ali Zaidi
Sheikh Aftab Ahmed
Chief Financial OfficerMr. Naeem Tariq
Company SecretaryMr. Noshad Ahmed
Legal AdvisorsM/s Mandviwalla & Zafar
M/s Abdullah Associates
Human Resources CommitteeMs. Parveen Akhter Malik (Chairperson)
Mian M. A. Shahid (Member)
Syed Ammar Ali Zaidi (Member)
Risk Management CommitteeMr. Adnan Afridi (Chairman)
Mian M. A. Shahid (Member)
Ms. Parveen Akhter Malik (Member)

Annual Report | for the year ended December 31, 2012 23
Managing Director & Chief Executive Officer Mian M. A. Shahid
Deputy Managing Director Mr. Shaheryar Akbar Raja
Advisors Maj. Gen (R) Asif Duraiz Akhter
Mr. Naseer Ahmed(Former Member Revenue CBR)
(Former Additional Secretary Military Finance)
(Former Additional Secretary Finance)
Mr. Azizullah Memon(Former President Bolan Bank & UBL)
General Manager Admin Mr. Jamil Ahmed
Chief Manager Underwriting Mr. Imtiaz Ali
Chief Manager Health Mr. Muneer Khan
Manager Claims Motor Mr. Khalid Nazeer bajwa
Manager Claims Non Motor Mr. Naveed ul Haq Nomani
Chief Manager Accounts Mr. Faisal Akbar (FCA)
Manager I.T Mr. Munir Ahmed
Manager Re-Insurance Mr. Asif Azeem
Key Management Personnel

24 Saudi Pak Insurance Company Limited
Company Information
Apna Microfinance Bank
Bank Al-Falah Limited
Bank Al-Falah Islamic
Bank Al-Habib Limited
Habib Bank Limited
HSBC Bank Limited
KASB Bank Limited
National Bank of Pakistan
NIB Bank
SILKBANK Limited
Sindh Bank Limited
Soneri Bank Limited
Standard Chartered Bank Limited
State Bank of Pakistan
Tameer Microfinance Bank
The Bank Of Punjab
United Bank Limited
Allied Bank Limited
Askari Bank Limited
Faysal Bank Limited
Habib Metropolitan Bank Limited
Summit Bank Limited
MCB Bank Limited
SME Bank Limited
Dubai Islamic Bank Limited
Samba Bank Limited
Bankers

Annual Report | for the year ended December 31, 2012 25
We are well positioned to outperform in
an environment which remains challenging.
Our Core Management

26 Saudi Pak Insurance Company Limited
Our Core Management

Annual Report | for the year ended December 31, 2012 27

28 Saudi Pak Insurance Company Limited
Fire
Fire is not friendly with anyone, but our Fire policy is. The basic cover and the most essential for any business concern safeguards insurer’s interest against fire, which can be extended to include additional perils like Riot & Strike Damages, Malicious Damages, Earthquake Fire & Shock, Explosion, Impact Damage, Aircraft Damage, Atmospheric Disturbance and Burglary & House Breaking .

Annual Report | for the year ended December 31, 2012 29
Marine
This type of insurance relates to cargo handling while in transit in different modes of transportation. The Marine Cargo insurance is classified into three classes – Institute Cargo Clause A, B & C, offered to the client depending on their needs.

30 Saudi Pak Insurance Company Limited
Motor
A motor vehicle, being automobile, is exposed to several risks. We at Saudi Pak Insurance, offer comprehensive motor insurance for vehicles of all types i.e. private, commercial and motorcycle.

Annual Report | for the year ended December 31, 2012 31
Miscellaneous
This specialized insurance policy indemnifies an insured for any liability arising due to violation of duties out of negligence by the insured. Architects, Engineers, Consultants, Doctors, Surveyors etc can benefitfrom this cover.
32 Saudi Pak Insurance Company Limited
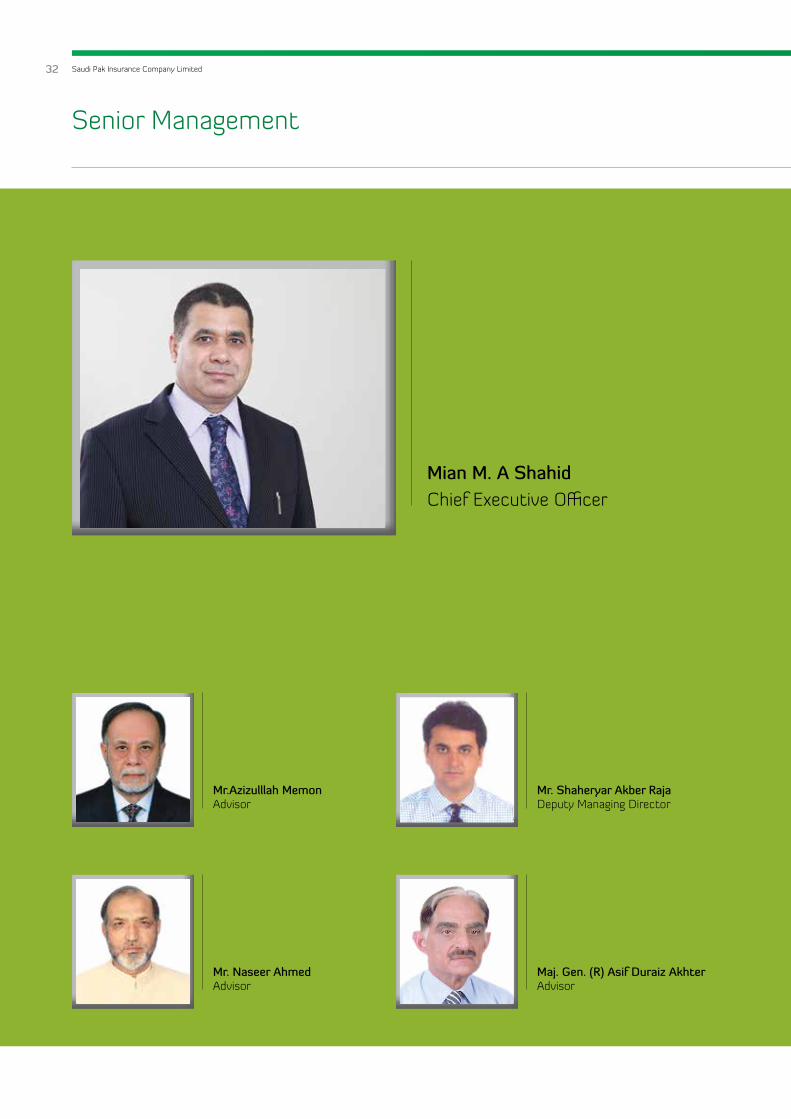
Mian M. A ShahidChief Executive Officer
Mr. Naseer AhmedAdvisor
Maj. Gen. (R) Asif Duraiz AkhterAdvisor
Mr. Shaheryar Akber RajaDeputy Managing Director
Mr.Azizulllah MemonAdvisor
Senior Management

Annual Report | for the year ended December 31, 2012 33
Mr, Naeem TariqChief Financial Officer
Mr. Khalid Nazeer Bajwa Manager Claims Motor
Mr. Munir AhmedManager I.T
Mr. Asif AzeemManager Re-Insurance
Mr. Muneer KhanChief Manager Health
Mr. Faisal AkbarChief Manager Accounts
Mr. Imtiaz AliChief Manager Underwriting
Mr. Noshad AhmedCompany Secretary
Mian Mohsin AslamChief Internal Auditor

34 Saudi Pak Insurance Company Limited
A Message from the
Chairman
SPICL achieved unprecedented record results for 2012. This performance success is the direct result of the remarkable efforts of our employees and our management to create a more robust, highly dynamic,continuously improving.
“We believe the
challenges we face
as a society present
us with an opportunity
to add value for
everyone, including
our shareholders.”
Despite economic conditions being impacted by deteriorating law and order conditions and political instability in the country, the year end results are reflective of the management’s continuing commitment in meeting the expectations of the shareholders who have invested and have trust in us. This has been made possible through attention to several core issues, including but not limited to, investing in the infrastructure and enhancing the geographical reach of the Company with a clear vision. I am confident that going forward, the Company will reap healthy returns from these investments.
During the year 2012, the Company continued to improve its performance and achieved outstanding results. Despite the challenges of the future in the form of increasing competition, difficult socio economic and political situation of the country, we remain committed to our vision, mission & core values. The Company is
geared up to meet the challenges of tomorrow and will continue to capitalize on new investments made in infrastructure, human resources and geographical outreach opportunities.
I would like to extend my appreciation to the management for their commitment, dedication and hard work in achieving these excellent results. I would also like to express my sincere appreciation to the Board members whose valuable guidance has always enlightened us in our decision making. Finally I express my gratitude to our stakeholders, regulators and our valued customers for their support and continued confidence in SPICL.
Adnan AfridiChairman
Karachi: March 28, 2013

Annual Report | for the year ended December 31, 2012 35
Directors‘ Report to the members
The Board of Directors is pleased to present the annual report of the Company together with the audited financial statements for the year ended December 31, 2012.
Economic Review
Pakistan’s economy witnessed a modest improvement in FY12 – real GDP grew by 3.7 percent during the year, compared with 3.0 percent in FY11. Although the economy underperformed compared with the growth target of 4.2 percent, this outcome was expected given the energy shortages; security concerns; and floods in two consecutive years. Nevertheless, growth was more broad-based compared to FY11, as it was evenly distributed across agriculture, industry and the services sector.
On the external front, remittances posted yet another year of strong growth, which not only helped narrow the current account deficit, but also contributed to economic activity. In overall terms, the external sector has been less worrying than anticipated at the beginning of the year; however, as financial inflows dried up, the burden of financing the current account deficit and external debt, has fallen on the country’s FX reserves.
The macro economic landscape was dominated by discount rate cuts by SBP from 12 percent to 9.5 percent on the back of easing inflation. However, the Rupee remained under pressure throughout the year due to external debt obligations.
Performance Analysis 2012
In 2012, despite a challenging economic environment, the total assets of the Company have recorded a growth of 23.5 percent to Rs. 529 million. The Company has shown an immense improvement across all segments of operations and business. Also, the Company has underwritten premium of Rs. 317.86 million (2011: Rs. 217.87 millions) posting an increase of Rs.100 million (46 percent) over the last year, with an increase of Rs. 90.14 million (96 percent) in the net premium income during the year.
The Company has invested into the infrastructure to increase our geographical reach forming a foundation for the future growth of our organization consequently resulting in an increase in expenses from Rs. 64 million to Rs. 115 million respectively. The Management is confident that this investment will provide a strong base to further increase revenues in the years to come.
Dear Shareholders,
December 31,2012
December 31,2011
Inc / (Dec)in %
(Rupees in thousands)
The Financial highlights are given hereunder:
Premium Written 317,859 217,873 46
Net Premium 183,606 93,467 96
Net Claims 36,884 16,427 125
Management & other expenses 115,266 64,690 78
Underwriting results 59,434 21,020 183
Investment and other Income 11,876 14,848 -20
Profit for the year before Tax 23,859 25,337 -6
Profit for the year after Tax 74,944 24,402 207
E.P.S. 2.31 0.75 208
Credit Rating
The Company is rated “A-“ by PACRA.
36 Saudi Pak Insurance Company Limited
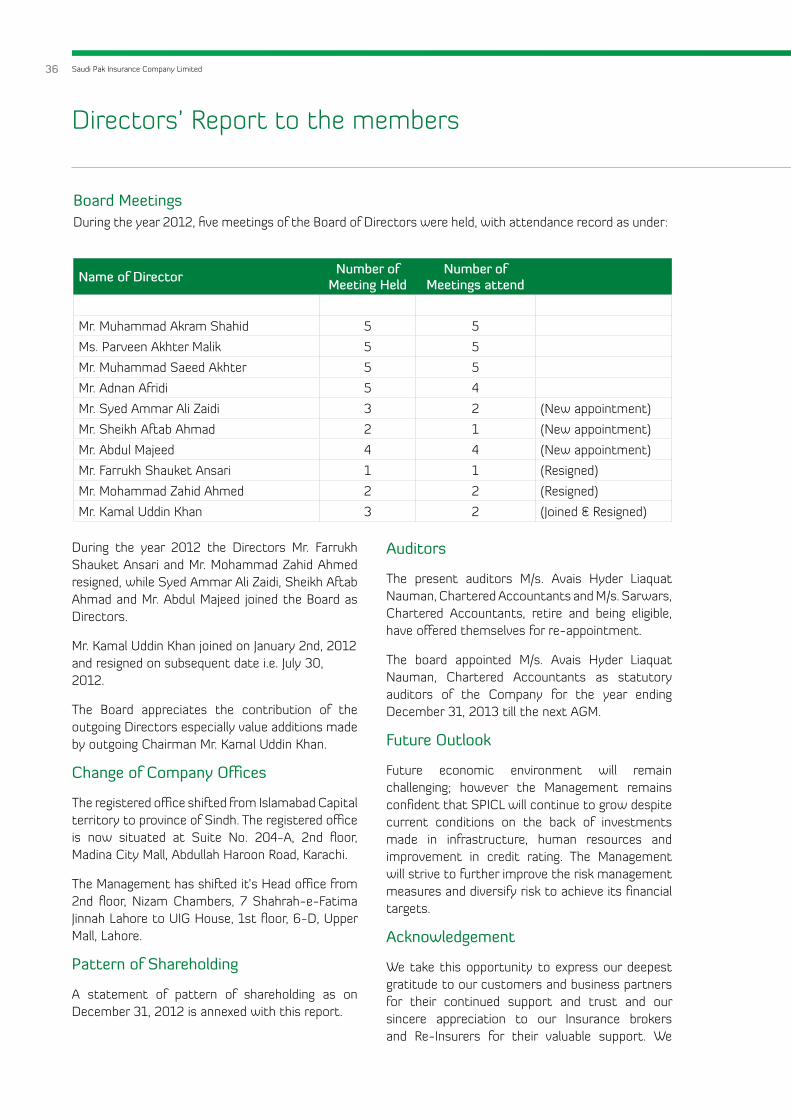
During the year 2012 the Directors Mr. Farrukh Shauket Ansari and Mr. Mohammad Zahid Ahmed resigned, while Syed Ammar Ali Zaidi, Sheikh Aftab Ahmad and Mr. Abdul Majeed joined the Board as Directors.
Mr. Kamal Uddin Khan joined on January 2nd, 2012 and resigned on subsequent date i.e. July 30, 2012.
The Board appreciates the contribution of the outgoing Directors especially value additions made by outgoing Chairman Mr. Kamal Uddin Khan.
Change of Company Offices
The registered office shifted from Islamabad Capital territory to province of Sindh. The registered office is now situated at Suite No. 204-A, 2nd floor, Madina City Mall, Abdullah Haroon Road, Karachi.
The Management has shifted it’s Head office from 2nd floor, Nizam Chambers, 7 Shahrah-e-Fatima Jinnah Lahore to UIG House, 1st floor, 6-D, Upper Mall, Lahore.
Pattern of Shareholding
A statement of pattern of shareholding as on December 31, 2012 is annexed with this report.
Auditors
The present auditors M/s. Avais Hyder Liaquat Nauman, Chartered Accountants and M/s. Sarwars, Chartered Accountants, retire and being eligible, have offered themselves for re-appointment.
The board appointed M/s. Avais Hyder Liaquat Nauman, Chartered Accountants as statutory auditors of the Company for the year ending December 31, 2013 till the next AGM.
Future Outlook
Future economic environment will remain challenging; however the Management remains confident that SPICL will continue to grow despite current conditions on the back of investments made in infrastructure, human resources and improvement in credit rating. The Management will strive to further improve the risk management measures and diversify risk to achieve its financial targets.
Acknowledgement
We take this opportunity to express our deepest gratitude to our customers and business partners for their continued support and trust and our sincere appreciation to our Insurance brokers and Re-Insurers for their valuable support. We
Board MeetingsDuring the year 2012, five meetings of the Board of Directors were held, with attendance record as under:
Name of Director Number ofMeeting Held
Number ofMeetings attend
Mr. Muhammad Akram Shahid 5 5
Ms. Parveen Akhter Malik 5 5
Mr. Muhammad Saeed Akhter 5 5
Mr. Adnan Afridi 5 4
Mr. Syed Ammar Ali Zaidi 3 2 (New appointment)
Mr. Sheikh Aftab Ahmad 2 1 (New appointment)
Mr. Abdul Majeed 4 4 (New appointment)
Mr. Farrukh Shauket Ansari 1 1 (Resigned)
Mr. Mohammad Zahid Ahmed 2 2 (Resigned)
Mr. Kamal Uddin Khan 3 2 (Joined & Resigned)
Directors’ Report to the members

Annual Report | for the year ended December 31, 2012 37
Directors’ Report to the members
would like to extend our appreciation to Securities Exchange Commission of Pakistan and State Bank of Pakistan for their guidance. We are also thankful to our clients for their patronage and Shareholders for their continue support. We are also equally thankful to our associates, staff and colleagues for their committed services to SPICL and look forward to their continued support.
For and on behalf of the Board of Directors
(Mian M. A. Shahid)Chief Executive Officer / Director
Karachi: March 28, 2013
In order to deliver and grow, your
Company depends greatly on
management at every level.

In 2012 we delivered a good result for our shareholders by executing on ourunderwriting strategies, improving
our customer orientation and protecting our strong capital position.

4
Pattern of Shareholding 40
Auditor’s Report to the Members 42
Balance Sheet 44
Profit and Loss Account 46
Statement of Comprehensive Income 47
Statement of Changes in Equity 48
Statement of Cash Flows 49
Statement of Premiums 51
Statement of Claims 52
Statement of Expenses 53
Statement of Investment Income 54
Notes to the Financial Statements 55
Our Network 93
40 Saudi Pak Insurance Company Limited
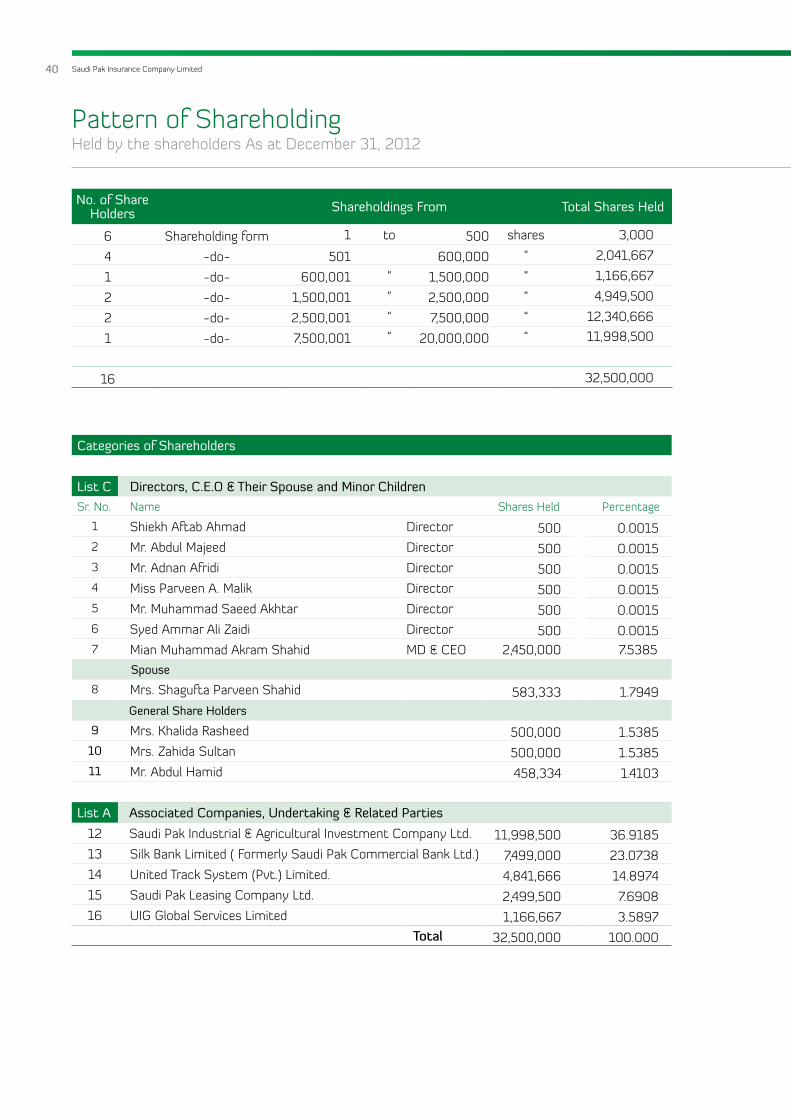
Categories of Shareholders
List C Directors, C.E.O & Their Spouse and Minor ChildrenSr. No. Name Shares Held Percentage
1 Shiekh Aftab Ahmad Director 500 0.0015 2 Mr. Abdul Majeed Director 500 0.0015 3 Mr. Adnan Afridi Director 500 0.0015 4 Miss Parveen A. Malik Director 500 0.0015 5 Mr. Muhammad Saeed Akhtar Director 500 0.0015 6 Syed Ammar Ali Zaidi Director 500 0.0015 7 Mian Muhammad Akram Shahid MD & CEO 2,450,000 7.5385
Spouse
8 Mrs. Shagufta Parveen Shahid 583,333 1.7949 General Share Holders
9 Mrs. Khalida Rasheed 500,000 1.5385 10 Mrs. Zahida Sultan 500,000 1.5385 11 Mr. Abdul Hamid 458,334 1.4103
List A Associated Companies, Undertaking & Related Parties
12 Saudi Pak Industrial & Agricultural Investment Company Ltd. 11,998,500 36.9185 13 Silk Bank Limited ( Formerly Saudi Pak Commercial Bank Ltd.) 7,499,000 23.0738 14 United Track System (Pvt.) Limited. 4,841,666 14.8974 15 Saudi Pak Leasing Company Ltd. 2,499,500 7.6908 16 UIG Global Services Limited 1,166,667 3.5897
Total 32,500,000 100.000
No. of Share Holders Shareholdings From Total Shares Held
6 Shareholding form 1 to 500 shares 3,000
4 -do- 501 600,000 “ 2,041,667
1 -do- 600,001 “ 1,500,000 “ 1,166,667
2 -do- 1,500,001 “ 2,500,000 “ 4,949,500
2 -do- 2,500,001 “ 7,500,000 “ 12,340,666
1 -do- 7,500,001 “ 20,000,000 “ 11,998,500
16 32,500,000
Pattern of ShareholdingHeld by the shareholders As at December 31, 2012

Financial StatementFor the year ended December 31, 2012

42 Saudi Pak Insurance Company Limited
Avais Hyder Liaquat Nauman Sarwars(Chartered Accountants) (Chartered Accountants)
Avais Chambers, Office # 12, II-Floor Lahore Centre, 1/C-5, Sikander Malhi Road 77-D Main Boulevard, Gulberg-III,Canal Park, Gulberg II, Lahore – Pakistan.Lahore - Pakistan Telephone: (92-42) 35782920-22Telephone: (92-42) 35872731/2/3 Telefax: (92-42) 35773825Telefax: (92-42) 35872734 E-mail: [email protected] E-mail: [email protected]
We have audited the annexed financial statements comprising of:
(i) Balance Sheet;(ii) Profit and Loss Account;(iii) Statement of Comprehensive Income;(iv) Statement of Changes in Equity;(v) Statement of Cash Flows;(vi) Statement of Premiums;(vii) Statement of Claims;(viii) Statement of Expenses; and(ix) Statement of Investment Income
of Saudi Pak Insurance Company Limited (“the Company”) as at 31 December, 2012 together with the notes forming part thereof, for the year then ended.
It is the responsibility of the Company’s Board of Directors to establish and maintain a system of internal control, and prepare and present the financial statements in conformity with the approved Accounting Standards as applicable in Pakistan and the requirements of the Insurance Ordinance, 2000 (XXXIX of 2000) and the Companies Ordinance, 1984 (XLVII of 1984). Our responsibility is to express an opinion on these statements based on our audit.
We conducted our audit in accordance with the Auditing Standards as applicable in Pakistan. Those standards require that we plan and perform the audit to obtain reasonable assurance about whether the financial statements are free of material misstatement. An audit includes examining, on a test basis, evidence supporting the amounts and disclosures in the financial statements. An audit also includes assessing the accounting policies used and significant estimates made by management, as well as, evaluating the overall financial statements presentation. We believe that our audit provides a reasonable basis for our opinion.
In our opinion:
(a) proper books of accounts have been kept by the Company as required by the Insurance Ordinance, 2000 and Companies Ordinance, 1984;
(b) the financial statements together with the notes thereon have been drawn up in conformity with the Insurance Ordinance, 2000 and the Companies Ordinance, 1984, and accurately reflect the books and records of the Company and are further in accordance with accounting policies consistently applied;
Auditors’ Report to the members

Annual Report | for the year ended December 31, 2012 43
(c) the financial statements together with the notes thereon present fairly, in all material respects, the state of the Company’s affairs as at 31 December 2012 and of the profits, its comprehensive income, its cashflows and changes in equity for the year then ended in accordance with approved accounting standards as applicable in Pakistan, and give the information required to be disclosed by the Insurance Ordinance, 2000 and the Companies Ordinance, 1984; and
(d) no Zakat was deductible at source under the Zakat and Usher Ordinance, 1980.
___________________________________ _______________________
AVAIS HYDER LIAQUAT NAUMAN SARWARS
Chartered Accountants Chartered Accountants
Audit Engagement Partner: Syed Ali Adnan Tirmizey Rashid Sarwar
Date: March 29, 2013
Place: Lahore

44 Saudi Pak Insurance Company Limited
Note2012 2011
Rupees Rupees
Share Capital And Reserves
Authorized Share Capital
50,000,000 (2011 : 50,000,000)
ordinary shares of Rs.10 each 500,000,000 500,000,000
Issued, subscribed and paid up share capital 5 325,000,000 325,000,000
Accumulated (loss) (67,510,963) (142,455,661)
257,489,037 182,544,339
Underwriting Provisions
Provision for outstanding claims (including IBNR) 80,911,792 112,663,524
Provision for unearned premium 145,874,535 105,136,280
Additional provision for unexpired risks 6,741,166 2,000,656
Commission income unearned 12,250,183 8,920,405
245,777,676 228,720,865
Deferred Liabilities
Staff retirement gratuity 6 2,294,644 944,644
Creditors And Accruals
Premium received in advance 1,660,784 -
Amount due to other insurers/re-insurers 7,576,658 3,555,785
Accrued expenses 7 6,790,489 4,346,136
Other creditors and accruals 8 8,235,495 8,761,420
24,263,426 16,663,341
Total Liabilities 272,335,746 246,328,850
Total Equity And Liabilities 529,824,783 428,873,189
Contingencies And Commitments 9 - -
Balance SheetAs at December 31, 2012
Mian M.A. Shahid Adnan Afridi Chief Executive Officer Chairman

Annual Report | for the year ended December 31, 2012 45
Balance SheetAs at December 31, 2012
Note2012 2011
Rupees Rupees
Cash And Bank Deposits 10
Cash and other equivalents 918,117 377,987
Current and other accounts 28,434,551 16,977,051
Deposits maturing within 12 months 40,966,000 45,431,000
Cash with State Bank of Pakistan 89,639 200,000
70,408,307 62,986,038
Loans To Employees 11 501,116 347,149
Investments 12 93,659,604 82,342,045
Deferred Tax Asset 13 52,003,623 -
Current Assets - Others
Premium due but unpaid 14 48,702,076 61,160,304
Amount due from other insurers/re-insurers 15 45,544,938 41,811,499
Prepaid reinsurance premium ceded 49,466,557 38,815,241
Accrued investment income 16 3,758,916 3,359,440
Reinsurance recoveries against outstanding claims 17 71,288,878 80,478,357
Taxation - payment less provision 4,541,771 3,874,189
Deferred commission expense 20,759,255 13,022,299
Prepayments 18 5,801,962 3,268,005
Sundry receivables 19 6,777,826 4,614,720
256,642,179 250,404,054
Fixed Assets 20
Tangible
Office improvements 10,330,878 8,368,591
Furniture and fixture 2,892,391 2,114,786
Office equipment 4,645,249 3,894,015
Computer equipment 2,124,800 2,066,562
Motor vehicles 36,361,369 16,030,865
56,354,687 32,474,819
Intangible
Computer software 255,267 319,084
TOTAL ASSETS 529,824,783 428,873,189
The annexed notes 1 to 32 form an integral part of these financial statements.
Sheikh Aftab Ahmed Syed Ammar ALi Zaidi Director Director

46 Saudi Pak Insurance Company Limited
Note
2012 2011
Fire and Property Damage
Marine Aviation And
TransportMotor Miscellneous Aggregate Aggregate
- - - - - - - - - - - - - - - - - R u p e e s - - - - - - - - - - - - - - - -
Revenue AccountNet premium revenue 34,047,317 16,094,142 82,970,819 50,494,457 183,606,735 93,467,937
Net claims (5,154,961) (2,272,662) (32,924,651) 3,468,563 (36,883,711) (16,426,926)
Premium deficiency reserve (6,741,166) - 1,025,018 975,638 (4,740,510) -
Management expenses 21 (30,199,156) (6,412,718) (23,306,687) (7,895,701) (67,814,262) (54,160,156)
Net commission (1,150,449) (1,878,567) (7,047,551) (4,657,071) (14,733,638) (1,860,655)
Underwriting Results (9,198,415) 5,530,195 20,716,948 42,385,886 59,434,614 21,020,200
Investment income 10,211,896 7,452,909
Other income 22 1,664,495 7,394,908
General and administration expenses 21 (47,451,896) (10,530,488)
Profit before tax 23,859,109 25,337,529
Less: Taxation
Current 23 (918,034) (934,679)
Deferred 13 52,003,623 -
51,085,589 (934,679)
Profit after tax 74,944,698 24,402,850
Profit And (Loss) Appropriation Account
Balance at commencement of year (142,455,661) (166,858,511)
Comprehensive income 74,944,698 24,402,850
Balance of accumulated (loss) at end of the year (67,510,963) (142,455,661)
Earnings Per Share
- basic and diluted 24 2.31 0.75
The annexed notes 1 to 32 form an integral part of these financial statements.
Profit and Loss Accountfor the year ended December 31, 2012
Mian M.A. Shahid Adnan Afridi Sheikh Aftab Ahmed Syed Ammer Ali Zaidi Chief Executive Officer Chairman Director Director

Annual Report | for the year ended December 31, 2012 47
Note2012 2011
Rupees Rupees
Profit / (loss) after tax 74,944,698 24,402,850
Other comprehensive income - -
74,944,698 24,402,850
The annexed notes 1 to 32 form an integral part of these financial statements.
Statement of Comprehensive Incomefor the year ended December 31, 2012
Mian M.A. Shahid Adnan Afridi Sheikh Aftab Ahmed Syed Ammer Ali Zaidi Chief Executive Officer Chairman Director Director

48 Saudi Pak Insurance Company Limited
Share capitalAccumulated (loss)/ profit
Total
- - - - - - - - - R u p e e s - -- - - -- - - -
Balance as at January 01, 2011 325,000,000 (166,858,511) 158,141,489
Comprehensive income/(loss) for the year - 24,402,850 24,402,850
Balance as at December 31, 2011 325,000,000 (142,455,661) 182,544,339
Balance as at January 01, 2012 325,000,000 (142,455,661) 182,544,339
Comprehensive income/(loss) for the year - 74,944,698 74,944,698
Balance as at December 31, 2012 325,000,000 (67,510,963) 257,489,037
The annexed notes 1 to 32 form an integral part of these financial statements.
Statement of Changes In Equityfor the year ended December 31, 2012
Mian M.A. Shahid Adnan Afridi Sheikh Aftab Ahmed Syed Ammer Ali Zaidi Chief Executive Officer Chairman Director Director

Annual Report | for the year ended December 31, 2012 49
Note2012 2011
Rupees Rupees
Operating Cash Flows
a) Underwriting activities
Premium received 331,978,178 188,933,588
Reinsurance premium paid (100,144,619) (87,552,285)
Claims paid (134,925,215) (74,138,498)
Reinsurance and other recoveries received 71,745,812 56,614,123
Commission paid (45,396,608) (27,867,185)
Commission received 26,255,792 20,437,270
Other underwriting payments (56,363,501) (42,894,728)
Net cash flow from underwriting activities 93,149,839 33,532,285
b) Other operating activities
Income tax paid (1,585,617) (789,365)
General and administrative expenses paid (47,451,896) (10,530,488)
Other operating payments (4,697,063) (2,443,229)
Other operating receipts 1,918,428 1,926,711
Loan (disbursed)/ refunded (153,967) 525,328
Net cash flow from other operating activities (51,970,115) (11,311,043)
Total cash flow from operating activities 41,179,724 22,221,242
Investment Activities
Profit/ return received 9,773,120 5,071,701
Dividend received 39,300 36,000
Payments for investments (11,317,559) (4,908,801)
Proceeds from disposal of investments - 200,000
Fixed capital expenditure (32,252,316) (12,544,118)
Proceeds from disposal of fixed assets - 2,234,017
Total cash flow from investing activities (33,757,455) (9,911,201)
Financing Activities
Total cash inflow from financing activities - -
Net cash inflow/(outflow) from all activities 7,422,269 12,310,041
Cash at the beginning of the year 62,986,038 50,675,997
Cash at the end of the year 70,408,307 62,986,038
The annexed notes 1 to 32 form an integral part of these financial statements.
Statement of Cash Flowsfor the year ended December 31, 2012

50 Saudi Pak Insurance Company Limited
Note2012 2011
Rupees Rupees
Reconciliation to Profit and Loss Account
Operating cash flows 41,179,724 22,221,242
Depreciation/ amortization expenses (8,436,265) (4,122,555)
(Loss)/ gain on disposal of fixed assets - 631,302
Provision for doubtful debts (6,256,996) (338,696)
Premium deficiency reserve (4,740,510) -
(Decrease) / Increase in assets other than cash 13,167,646 1,996,190
(Increase)/ Decrease in liabilities (21,266,386) (2,502,863)
Other income 10,172,596 7,416,909
Dividend income 39,300 36,000
Reversal/ (Provision) for taxation 51,085,589 (934,679)
Profit after taxation 74,944,698 24,402,850
Definition of cash
Cash comprises of cash in hand, policy stamps and bank balances which are readily convertible to cash in hand and which are used in the cash management function on a day-to-day basis.
Cash for the purpose of statement of cash flows consists of:
Cash and cash equivalents 10
Cash and other equivalents
Cash and other equivalents 918,117 377,987
918,117 377,987
Current and other accounts
Current accounts 26,104,724 13,423,411
PLS savings accounts 2,329,827 3,553,640
28,434,551 16,977,051
Deposits maturing within 12 months 40,966,000 45,431,000
Cash with State Bank of Pakistan 89,639 200,000
70,408,307 62,986,038
The annexed notes I to 32 from an integral part of these financial statements.
Statement of Cash Flowsfor the year ended December 31, 2012
Mian M.A. Shahid Adnan Afridi Sheikh Aftab Ahmed Syed Ammer Ali Zaidi Chief Executive Officer Chairman Director Director

Annual Report | for the year ended December 31, 2012 51
Busi
ness
Und
erw
ritte
n In
side
Pak
ista
n
Cla
ssPr
emiu
m
Writ
ten
Une
arne
d pr
emiu
mRe
serv
ePr
emiu
m
Earn
ed
Rein
sura
nce
Prem
ium
C
eded
Prep
aid
rein
sura
nce
prem
ium
ced
edRe
insu
ranc
e Ex
pens
e
Net
pre
miu
m r
even
ue
Ope
ning
Clo
sing
Ope
ning
Clo
sing
2012
2011
- -
- -
- -
- -
- -
- -
- -
- -
- -
- -
- -
- R
u p
e e
s -
- -
- -
- -
- -
- -
- -
- -
- -
- -
- -
- -
Dire
ct a
nd f
acul
tati
ve
Fire
and
pro
pert
y da
mag
e 1
41,5
49,5
54
32,
478
,68
7 7
3,8
38,9
60
10
0,1
89,
281
77,
916,
103
28
,870
,595
4
0,6
44,7
34
66,
141,
964
34,
047
,317
1
0,0
93,5
38
Mar
ine,
avi
atio
n an
d tr
ansp
ort
30
,057
,70
5 1
,295
,732
3
,544
,637
2
7,8
08
,80
0
12,
796,
058
4
27,6
10
1,5
09,
010
1
1,71
4,65
8
16,
094
,142
6
,70
3,58
3
Mot
or 1
09,
243,
160
2
4,53
9,43
1 4
7,67
0,3
98
86,
112,
193
2,0
26,8
68
1,9
98,9
70
88
4,46
4 3
,141
,374
8
2,97
0,8
19
40
,833
,963
Mis
cella
neou
s 3
7,0
08
,747
4
6,8
22,4
30
20
,820
,540
6
3,0
10,6
37
11,
426,
463
7,5
18,0
66
6,4
28,3
49
12,
516,
180
5
0,4
94,4
57
35,
836
,853
Tota
l 3
17,8
59,1
66
105,
136,
280
14
5,8
74,5
35
277
,120
,911
1
04,
165,
492
38
,815
,241
4
9,46
6,55
7 9
3,51
4,17
6 18
3,60
6,73
5 9
3,46
7,93
7
The
anne
xed
note
s 1
to 3
2 fo
rm a
n in
tegr
al p
art
of t
hese
fina
ncia
l sta
tem
ents
.
Sta
tem
ent
of P
rem
ium
sfo
r the
yea
r end
ed D
ecem
ber 3
1, 2
012
M
ian
M.A
. Sha
hid
Adn
an A
frid
i S
heik
h A
ftab
Ahm
ed
Sye
d A
mm
er A
li Za
idi
Chi
ef E
xecu
tive
Offi
cer
Cha
irman
D
irect
or
Dire
ctor

52 Saudi Pak Insurance Company Limited
Busi
ness
Und
erw
ritte
n In
side
Pak
ista
n
Cla
ss C
laim
s Pa
id
Out
stan
ding
cla
ims
Cla
im
Expe
nses
Rei
nsur
ance
an
d ot
her
Reco
verie
s Re
ceiv
ed
Rein
sura
nce
and
oth
er
Reco
verie
s in
res
pect
O
f ou
tsta
ndin
g c
laim
s
Rei
nsur
ance
A
nd o
ther
Re
cove
ries
Reve
nue
Net
cla
ims
expe
nses
Ope
ning
C
losi
ng
Ope
ning
C
losi
ng
2012
2011
- -
- -
- -
- -
- -
- -
- -
- -
- -
- -
- -
- -
- -
- R
u p
e e
s -
- -
- -
- -
- -
- -
- -
- -
- -
- -
- -
- -
- -
- -
Dire
ct a
nd f
acul
tati
ve
Fire
and
pro
pert
y da
mag
e 6
0,9
28,6
20
56,
680
,50
7 4
3,58
1,63
4 4
7,8
29,7
47
50
,78
6,97
1 4
9,51
5,59
8
41,
403,
413
42,
674,
786
5,1
54,9
61
765
,951
Mar
ine,
avi
atio
n an
d t
rans
port
10
,240
,054
5
,725
,30
7 4
,097
,521
8
,612
,268
6
,246
,459
1
,48
5,8
61
1,5
79,0
08
6
,339
,60
6 2
,272
,662
1
95,7
20
Mot
or 5
3,12
8,6
59
17,
88
0,4
68
11,
375,
686
46,
623,
877
1
1,8
56,6
07
4,9
95,3
81
6,8
38,0
00
1
3,69
9,22
6 3
2,92
4,65
1 1
0,5
83,
754
Mis
cella
neou
s 1
0,6
27,8
82
32,
377,
242
21,
856
,951
1
07,
591
6,5
89,
214
24,
481,
517
21,
468
,457
3
,576
,154
(3
,468
,563
) 4
,88
1,50
1
Tota
l 1
34,9
25,2
15
112
,663
,524
8
0,9
11,7
92
103,
173,
483
75,
479,
251
80
,478
,357
7
1,28
8,8
78
66,
289,
772
36,
88
3,71
1 1
6,42
6,92
6
The
anne
xed
note
s 1
to 3
2 fo
rm a
n in
tegr
al p
art
of t
hese
fina
ncia
l sta
tem
ents
.
Sta
tem
ent
of C
laim
sfo
r the
yea
r end
ed D
ecem
ber 3
1, 2
012
M
ian
M.A
. Sha
hid
Adn
an A
frid
i S
heik
h A
ftab
Ahm
ed
Sye
d A
mm
er A
li Za
idi
Chi
ef E
xecu
tive
Offi
cer
Cha
irman
D
irect
or
Dire
ctor

Annual Report | for the year ended December 31, 2012 53
Busi
ness
und
erw
ritte
n in
side
Pak
ista
n
Cla
ssC
omm
issi
on
Paid
or
Paya
ble
Def
erre
d co
mm
issi
onN
et
Com
mis
sion
ex
pens
e
Oth
er
Man
agem
ent
expe
nses
(n
ote
# 2
1)
Und
erw
ritin
g ex
pens
es
Com
mis
sion
re
ceiv
ed f
rom
re
-ins
urer
s
Une
arne
d co
mm
issi
onC
omm
issi
on
from
re
insu
rers
Net
und
erw
ritin
gex
pens
es
Ope
ning
Clo
sing
Ope
ning
Clo
sing
2012
2011
- -
- -
- -
- -
- -
- -
- -
- -
- -
- --
- -
- -
- -
- -
- -
- -
- R
u p
e e
s -
- -
- -
- -
- -
- -
- -
- -
- -
--
- -
- -
- -
- -
- -
- -
- -
- -
- -
- -
Dire
ct a
nd f
acul
tati
ve
Fire
and
pro
pert
y da
mag
e 2
5,50
2,72
3 5
,426
,892
13,
303,
430
17
,626
,18
5 3
0,1
99,1
56
47,
825
,341
19
,80
9,77
9 6
,999
,677
10
,333
,720
16
,475
,736
3
1,34
9,60
5 1
4,27
3,0
87
Mar
ine,
avi
atio
n an
d tr
ansp
ort
5,8
72,7
45
20
7,64
5 6
92,5
60
5,3
87,
831
6
,412
,718
11
,80
0,5
48
3,8
38,8
17
123
,150
4
52,7
03
3,5
09,
264
8,2
91,2
84
3,2
44,9
18
Mot
or 8
,911
,861
2
,122
,042
3,
88
8,8
66
7,1
45,0
37 2
3,30
6,68
7 3
0,4
51,7
24
23,
837
8
4,0
51
10
,40
2 9
7,48
6 3
0,3
54,2
38
15,
160
,935
Mis
cella
neou
s 5
,10
9,27
8
5,2
65,7
20
2,8
74,4
00
7
,50
0,5
99
7,8
95,7
01
15,
396,
299
2,5
83,
360
1
,713
,526
1
,453
,358
2
,843
,528
1
2,55
2,77
1 2
3,34
1,8
71
TOTA
L 4
5,39
6,60
7 1
3,0
22,2
99 2
0,7
59,2
55
37,6
59,6
52
67,
814
,261
10
5,47
3,91
2 2
6,25
5,79
3 8
,920
,40
4 1
2,25
0,1
83
22,
926,
014
8
2,54
7,8
98
56,
020
,811
The
anne
xed
note
s 1
to 3
2 fo
rm a
n in
tegr
al p
art
of t
hese
fina
ncia
l sta
tem
ents
.
Sta
tem
ent
of E
xpen
ses
for t
he y
ear e
nded
Dec
embe
r 31,
20
12
M
ian
M.A
. Sha
hid
Adn
an A
frid
i S
heik
h A
ftab
Ahm
ed
Sye
d A
mm
er A
li Za
idi
Chi
ef E
xecu
tive
Offi
cer
Cha
irman
D
irect
or
Dire
ctor

54 Saudi Pak Insurance Company Limited
Note2012 2011
Rupees Rupees
Income from trading investments
(Loss)/gain on trading - -
Dividend income - -
- -
Income from non-trading investments
Held to maturity
Return on government securities 5,228,398 4,276,287
Return on TDRs 4,953,564 3,153,873
Available-for-sale
Dividend income 39,300 36,000
10,221,262 7,466,160
(Loss)/gain on sale of non-trading investments
- Available-for-sale - -
Impairment (loss) on non-trading investments
- Available-for-sale - -
Provision for impairment in the value of
-Available-for-sale-investments - -
Investment related expenses 12.4 (9,366) (13,251)
Net investment income 10,211,896 7,452,909
The annexed notes 1 to 32 form an integral part of these financial statements.
Statement of Investment Incomefor the year ended December 31, 2012
Mian M.A. Shahid Adnan Afridi Sheikh Aftab Ahmed Syed Ammer Ali Zaidi Chief Executive Officer Chairman Director Director

Annual Report | for the year ended December 31, 2012 55
1 LEGAL STATUS AND NATURE OF BUSINESS
Saudi Pak Insurance Company Limited (the Company) is an unquoted public limited company incorporated in Islamabad, Pakistan on February 15, 2005 under the Companies Ordinance, 1984. The Company is engaged in non-life insurance business mainly comprising of fire, marine, motor and miscellaneous. The Company commenced its commercial operations on April 13, 2005. The registered office of the Company is situated at Suite # 204-A, Second Floor, Madina City Mall, Abdullah Haroon Road, Karachi and principal office of the Company is situated at UIG House 6-D, 1st Floor, Upper Mall, Lahore, Pakistan.
2 BASIS OF PREPARATION
These financial statements have been prepared in accordance with the format of financial statements issued by the Securities and Exchange Commission of Pakistan (SECP) through Securities and Exchange Commission (Insurance) Rules, 2002 [SEC (Insurance) Rules, 2002].
2.1 Statement of compliance
These financial statements have been prepared in accordance with approved accounting standards as applicable in Pakistan. Approved accounting standards comprises of such International Financial Reporting Standards (IFRS) issued by the International Accounting Standards Board as are notified under the Companies Ordinance, 1984, provisions of and directives issued under the Companies Ordinance, 1984, the Insurance Ordinance, 2000 and SEC (Insurance) Rules, 2002. In case requirements differ, the provisions or directives of the Companies Ordinance. 1984, Insurance Ordinance, 2000 and SEC (Insurance) Rules, 2002 shall prevail.
The SECP has allowed the insurance companies to defer the application of International Accounting Standard-39 (IAS-39) “Financial Instruments: Recognition and Measurement” in respect of valuation of ‘available-for-sale investments’. Accordingly, the requirements of IAS-39, to the extent required by SECP as aforesaid, have not been considered in the preparation of these Financial Statements.
2.2 Basis of measurement
These financial statements have been prepared under the historical cost convention except that certain financial instruments are carried at fair value and staff retirement benefits are stated at present value.
2.3 Functional and presentation currency
These financial statements are presented in Pakistan Rupees, which is also the Company’s functional and presentation currency. All financial information presented in Pakistan rupees are rounded off to nearest rupees unless otherwise stated.
2.4 Use of estimates and judgments
The preparation of financial statements in conformity with the requirements of approved accounting standards as applicable in Pakistan requires management to make certain judgments,accounting estimates and assumptions. It also requires the management to exercise its judgment in the process of applying the Company’s accounting policies. Actual results may differ from these estimates and associated assumptions are continually evaluated and are based on historical experience, statutory requirements and other factors considered reasonable in the circumstances. Revision to accounting estimates are recognized in the period in which the estimate is revised and in any future periods affected. The estimates and assumptions that are expected to have a significant effect on the assets and liabilities, income and expenses have been disclosed in note 4.24 to these financial statements.
Notes to the Financial Statementsfor the year ended December 31, 2012

56 Saudi Pak Insurance Company Limited
Notes to the Financial Statementsfor the year ended December 31, 2012
3 APPLICATON OF NEW AND REVISED INTERNATIONAL FINANCIAL REPORTING STANDARDS
3.1 Standards, interpretations and amendments to published approved accounting standards that are not yet effective
The following revised standards, amendments and interpretations with respect to the approved accounting standards as applicable in Pakistan would be effective from the dates mentioned below against the respective standards:
Effective Date
Standard (accounting periods beginning on or after)
IFRS-7 Financial Instruments: Disclosures- (Amendments)
-Amendments enhancing disclosures about offsetting January 01, 2013
of financial assets and financial liabilities
Presentation of Financial Statements-Presentation of July 01, 2012
items of comprehensive income
IAS-27 Separate Financial Statements January 01, 2013
IAS-28 Investments in Associates and Joint Ventures January 01, 2013
IAS-32 Financial Instruments: Presentation (Amendment) January 01, 2014
IAS-19 Employee Benefits - (Amendments) January 01, 2013
The company expects that adoption of the above revisions and amendments of the standards will not materially effect the company’s financial statements in the period of initial application.
In addition to the above, the following new standards have been issued by IASB which are yet to be notified by the SECP for the purpose of applicability in Pakistan.
IASB Effective Date
Standard (annual periods beginning on or after)
IFRS-9 -Financial Instruments: Classification and Measurement January 01, 2015
IFRS-10 -Consolidated Financial Statements January 01, 2013
IFRS-11 -Joint Arrangements January 01, 2013
IFRS-12 -Disclosure of Interest in other Entities January 01, 2013
IFRS-13 -Fair Value Measurement January 01, 2013

Annual Report | for the year ended December 31, 2012 57
4 SUMMARY OF SIGNIFICANT ACCOUNTING POLICIES
The accounting policies adopted in the preparation of these financial statements are consistent with those of the previous financial year.
4.1 Adoption of new and amended international financial reporting standards (IFRSs)
The Company has adopted the following new and amended IFRS and IFRIC interpretations which become effective during the year:
Standard and Interpretation
Effective date
(accounting periodsbeginning on or after)
IFRS - 7 - Financial Instruments:
Disclosures - (Amendment) July 01, 2011
IAS - 12 - Income Taxes (Amendment) -
Recovery of underlying Assets January 01, 2012
The adoption of the above standard, amendments, interpretations and improvements did not have any material effect on the financial statements.
4.2 Insurance contracts
Insurance contracts are those contracts where the Company (the insurer) has accepted significant insurance risk from another party (the policyholders) by agreeing to compensate the policyholders if a specified uncertain future event (the insured event) adversely affects the policyholders.
Once a contract has been classified as an insurance contract it remains an insurance contract for the remainder of its lifetime, even if the insurance risk reduces significantly during this period, unless all rights and liabilities are extinguished or expired.
Insurance contracts are classified into following main categories, depending on the nature and duration of risk and whether or not the terms and conditions are fixed.
- Fire and property damages
- Marine, aviation and transport
- Motor
- Miscellaneous
Fire and property insurance contracts mainly compensate the Company’s customers for damage suffered to their properties or for the value of property lost.
Marine Insurance covers the loss or damage of vessels, cargo, terminals and any transport of property by which cargo is transferred, acquired or held between the points of origin and final destination.
Notes to the Financial Statementsfor the year ended December 31, 2012
58 Saudi Pak Insurance Company Limited
Motor insurance provides protection against losses incurred as a result of theft, traffic accidents and against third party liability that could be incurred in an accident.
Other various types of insurance are classified in miscellaneous category which includes mainly engineering, crop and livestock, personal accident, worker compensation, travel, products of financial institutions etc.
The Company does not issue any insurance contracts with discretionary participation features (DPF) or any investment contracts.
4.3 Premium
Premium written under a policy is recognized as income over the period of insurance from the date of issuance of the policy to which it relates to its expiry. Where the pattern of incidence of risk varies over the period of the policy, premium is recognized as revenue in accordance with the pattern of the incidence of risk. The portion of premium written relating to the unexpired period of coverage is recognized as unearned premium by the Company. This liability is calculated by applying 1/24 method as specified in the SEC (Insurance) Rules, 2002.
Premium income includes administrative surcharge that represents documentation and other charges recovered by the Company from policy holders in respect of policies issued, at the rate of 5% of the premium written restricted to a maximum of Rs. 2,000 per policy.
Receivables under insurance contracts are recognized when due, at the fair value of the consideration receivable less provision for doubtful debts, if any. If there is objective evidence that the receivable is impaired, the Company reduces the carrying amount of the receivable accordingly and recognizes that impairment loss in the profit and loss account.
Pakistan Reinsurance Company Limited (PRCL) retrocession business is booked on the basis of PRCL statements.
4.4 Reinsurance ceded
The Company enters into reinsurance contracts in the normal course of business in order to limit the potential for losses arising from certain exposures. Outward reinsurance premiums are accounted for in the same period as the related premiums for the direct or accepted reinsurance business being reinsured.
Reinsurance liabilities represent balances due to reinsurance companies. Amounts payable are estimated in a manner consistent with the related reinsurance contract. Reinsurance assets represent balances due from reinsurance companies. Amounts recoverable from reinsurers are estimated in a manner consistent with the provision for outstanding claims or settled claims associated with the reinsurance policies and are in accordance with the related reinsurance contract.
Reinsurance assets are not offset against related insurance liabilities. Income or expenses from reinsurance contract are not offset against expenses or income from related insurance assets.
Reinsurance assets or liabilities are derecognized when the contractual rights are extinguished or expired.
Notes to the Financial Statementsfor the year ended December 31, 2012

Annual Report | for the year ended December 31, 2012 59
The Company assesses its reinsurance assets for impairment on balance sheet date, if there is an objective evidence that the reinsurance asset is impaired, the Company reduces the carrying amount of the reinsurance asset to its recoverable amount and recognizes that impairment loss in the profit and loss account.
4.5 Claim expense
General insurance claims include all claims occurring during the year, whether reported or not, related internal and external claims handling costs that are directly related to the processing and settlement of claims, a reduction for the value of salvage and other recoveries and any adjustments to claims outstanding from previous years.
The Company recognizes liability in respect of all claims incurred up to the balance sheet date which is measured at the undiscounted value of the expected future payments. The claims are considered to be incurred at the time of the incident giving rise to the claim except as otherwise expressly indicated in an insurance contract. The liability for claims include amounts relating to unpaid reported claims, claims incurred but not reported (IBNR) and expected claims settlement costs.
Provision for liability in respect of unpaid reported claims is made on the basis of individual case estimates. Provision for IBNR is based on the management’s best estimate which takes into account the past trends, expected future patterns of reporting of claims and the claims actually reported subsequent to the balance sheet date.
4.6 Reinsurance recoveries against outstanding claims
Claims recoveries from the reinsurer are recognized as an asset at the same time as the claims which give rise to the right of recovery are recognized as a liability and are measured at the amount expected to be received. Claims expenses are reported net of reinsurance in the profit and loss accounts.
4.7 Commission expense and other acquisition costs
Commission expense and other acquisition costs are charged to the profit and loss account at the time the policies are accepted. Commission income from reinsurers is recognized at the time of issuance of the underlying insurance policy by the Company. This income is deferred and brought to account as revenue in accordance with the pattern of recognition of the reinsurance premium to which it relates. Profit commission, if any, which the Company may be entitled to under the terms of reinsurance is recognized on accrual basis.
4.8 Premium deficiency reserves
The Company is required as per SEC (Insurance) Rules, 2002, to maintain a provision in respect of premium deficiency for the class of business where the unearned premium liability is not adequate to meet the expected future liability, after reinsurance from claims and other supplementary expenses expected to be incurred after the balance sheet date in respect of the unexpired policies in that class of business at the balance sheet date. The movement in the premium deficiency reserve is recorded as an expense/ income in profit and loss account for the year.
Notes to the Financial Statementsfor the year ended December 31, 2012

60 Saudi Pak Insurance Company Limited
Percentage (%)
- Fire and property damage 90%
- Marine, aviation and transport 51%
- Motor 50%
- Miscellaneous 30%
The Company determines adequacy of liability of premium deficiency by carrying out analysis of its loss ratio of expired periods. For this purpose average loss ratio of last 3 years inclusive of claim settlement cost but excluding major exceptional claims are taken in to consideration to determine ultimate loss ratio to be applied on unearned premium.
4.9 Creditors, accruals and provisions
Liabilities for creditors and other amounts payable are carried at cost which is the fair value of the consideration to be paid in the future for the services received, whether or not billed to the Company.Provisions are recognized when the Company has a present legal or constructive obligation as a result of past events, it is probable that an outflow of resources embodying economic benefits will be required to settle the obligation and a reliable estimate of’ the amount can be made. Provisions are reviewed at each balance sheet date and adjusted to reflect the current best estimate.
4.10 Taxation
Income tax expense comprises current and deferred tax. Income tax expense is recognized in the profit and loss account, except to the extent that it relates to items recognized directly in other comprehensive income or below equity, in which case it is recognized in other com-prehensive income or below equity.
4.10.1 Current
Provision of current tax is based on the taxable income for the year determined in accordance with the prevailing law for taxation of income. The charge for current tax is calculated using prevailing tax rates or tax rates expected to apply to the profit for the year, if enacted. The charge for current tax also include adjustments, where considered necessary, relating to prior year arising from assessments made during the current year.
4.10.2Deferred
Deferred tax is accounted for using the balance sheet liability method in respect of all temporary differences at the balance sheet date between the tax bases and carrying amounts of assets and liabilities for financial reporting purposes. Deferred tax liabilities are generally recognized for all taxable temporary differences and deferred tax assets are recognized to the extent that it is
For this purpose, loss ratios for each class are estimated based on historical claim development. Judgment is used in assessing the extent to which past trends may not apply in future or the effetcts of one-off claims. If these ratios are adverse, premium deficiency is determined. The loss ratios estimated on these basis for the unexpired portion are as follows:
Notes to the Financial Statementsfor the year ended December 31, 2012

Annual Report | for the year ended December 31, 2012 61
probable that taxable profits will be available against which the deductible temporary differences, unused tax losses and tax credits can be utilized.
Deferred tax assets and liabilities are measured at the tax rates that are expected to apply to the period when the asset is realized or the liability is settled, based on the tax rates (and tax laws) that have been enacted or substantively enacted at the balance sheet date. Deferred tax is charged or credited in the profit and loss account, except in the case of items credited or charged to equity in which case it is included in equity.
4.11 Staff retirement benefits (Defined benefit plan)
The Company operates an approved defined gratuity scheme for all its permanent employees who attain the minimum qualification period for entitlement to gratuity. Contributions to the fund are made based on actuarial recommendations and in line with the provisions of the Income Tax Ordinance, 2001. The most recent actuarial valuation was carried out for the year ended December 31, 2012 using the Projected Unit Credit Method. Actuarial gains/ losses are recognized over the average remaining service life of the employees. Detail of the scheme given in note 6 to the financial statements.
4.12 Cash and cash equivalents
Cash and cash equivalents include cash and balances with banks in current and deposit accounts and stamps in hand.
4.13 Investments
4.13.1 Recognition
All investments are initially recognized at cost, being the fair value of the consideration given and include transaction costs, except for held for trading in which case transaction costs are charged to the profit and loss account. These are recognized and classified as follows: -
- Investment at fair value through profit and loss (held for trading)
- Held to maturity
- Available for sale
4.13.2 Measurement
4.13.2.1 Investment at fair value through profit or loss -held for trading
Investments which are acquired principally for the purposes of generating profit from short term fluctuation in market price or are part of the portfolio in which there is recent actual pattern of short term profit taking are classified as held for trading.
Subsequent to initial recognition, these investments are remeasured at fair value. Gains or losses on investments on remeasurement of these investments are recognized in the profit and loss account.
Notes to the Financial Statementsfor the year ended December 31, 2012

62 Saudi Pak Insurance Company Limited
4.14 Amount due to other insurers/reinsurers
Liabilities for other insurers / reinsurers are carried at cost which is the fair value of consideration to be paid in the future for services.
4.15 Fixed assets
4.15.1 Tangible
These are stated at cost less accumulated depreciation and impairment losses, if any.
Depreciation on all fixed assets is charged to profit and loss account on the reducing balance method so as to write-off depreciable amount of an asset over its useful life
4.13.2.2 Held to maturity
Investments with fixed maturity, where management has both the intent and the ability to hold to maturity, are classified as held to maturity and are initially measured at cost.
At subsequent reporting date, these are measured at amortized cost less provision for impairment, if any. Any premium paid or discount availed on acquisition of held to maturity investment is deferred and amortized over the term of the investment using the effective yield method.
4.13.2.3 Available for sale
Available for sale investments are those non-derivative investments that are designated as available for sale or are not classified in any other category. These are primarily those investments that are intended to be held for an undefined period of time or may be sold in response to the need for liquidity are classified as available for sale. It also includes investments in associated undertakings where the Company does not have significant influence. The Company follows trade date accounting for ‘regular way purchase and sales’ of investments.
Subsequent to initial recognition at cost, these are stated at lower of cost or market value (market value being taken as lower if fall is other than temporary) in accordance with the requirements of the S.R.O. 938 issued by the Securities and Exchange Commission of Pakistan (SECP) in December 2002. The Company uses latest stock exchange quotation to determine the market value of its quoted investments whereas, impairment of unquoted investments is computed by reference to net assets of the investee on the basis of the latest available audited / unaudited financial statements.
Dividend income and entitlement of bonus shares are recognized when the Company’s right to receive such dividend and bonus shares is established.
Gain/ (loss) on remeasurment of available for sale investments are taken to non-owner changes in equity.
Notes to the Financial Statementsfor the year ended December 31, 2012

Annual Report | for the year ended December 31, 2012 63
4.16 Impairment
A financial asset is assessed at each balance sheet date to determine whether there is any objective evidence that it is impaired. A financial asset is considered to be impaired if objective evidence indicates that one or more events have had a negative effect on the estimated future cash flows of that asset.
The carrying amount of non-financial assets is reviewed at each balance sheet date to determine whether there is any indication of impairment of any asset or a group of assets. If such indication exists, the recoverable amount of such assets is estimated. The recoverable amount of an asset is greater of its value in use and its fair value less costs to sell. An impairment loss is recognized if the carrying amount of an asset exceeds its estimated recoverable amount.
at the rates stated in note 20. Depreciation on additions to fixed assets is charged from the month in which an asset is available for use, while no depreciation is charged for the month in which the asset is disposed off.
The assets’ residual values and useful lives are reviewed, at each financial year end, and adjusted if impact on depreciation is significant.
Subsequent costs are included in an asset’s carrying amount or recognized as a separate asset as appropriate, only when it is probable that future benefits associated with the item will flow to the Company and the cost of the item can be measured reliably. All other repairs and maintenance are charged to the profit and loss account as and when incurred.
An item of property and equipment is derecognized upon disposal or when no future economic benefits are expected from its use or disposal. Any gain or loss arising on derecognition of the assets is recognized in the profit and loss account in the year when asset is derecognized.
4.15.2 Intangible
These are recorded initially at cost and subsequently carried at cost less accumulated amortization and accumulated impairment losses, if any.
Intangible assets having finite useful lives are stated at cost less accumulated amortization and accumulated impairment losses, if any. Intangible assets are amortized using the straight line method from the month, when these assets are put to use, over their estimated useful life.
Amortization on addition and deletion of intangible assets during the year is charged to profit and loss account in proportion to the period of use.
The useful life and amortization method are reviewed and adjusted, if appropriate, at the balance sheet date. Software development costs are only capitalized to the extent that future economic benefits are expected to be derived by the Company.
Notes to the Financial Statementsfor the year ended December 31, 2012

64 Saudi Pak Insurance Company Limited
4.20 Offsetting of financial assets and liabilities
Financial assets and financial liabilities are only offset and the net amount reported in the balance sheet when there is a legally enforceable right to set off the recognized amount and the Company intends to either settle on a net basis, or to realize the asset and settle the liability simultaneously.
4.21 Financial instruments
All the financial assets and financial liabilities are recognized at the time when the Company become a party to the contractual provisions of the instrument and derecognized when the Company losses control of contractual rights that comprises the financial assets and in the case of financial liabilities when the obligation specified in the contract is discharged, cancelled or expired. At the time of initial recognition all financial assets and financial liabilities are measured at cost, which is the fair value of the consideration given or received for it. Any gain or loss on derecognition of financial assets and financial liabilities is included in the profit and loss account for the year.
4.22 Segment reporting
A business segment is a distinguishable component of the Company that are subject to risks and returns that are different from those of other business segments. The Company accounts for segment reporting of operating results using the classes of business as specifiedunder the Insurance Ordinance, 2000 and SEC (Insurance) Rules, 2002. The reported
All impairment losses are recognized in the profit and loss account. Provisions for impairment are reviewed at each balance sheet date and adjusted to reflect the current best estimates. Changes in the provisions are recognized as income or expense.
4.17 Investment income
Income from held to maturity investments is recognized on a time proportion basis taking into account the effective yield method on the investments.
Dividend income and element of bonus are recognized when the right to receive the same is established, i.e., at the time of the closure of share transfer books of the Company declaring the dividend and / or bonus.
4.18 Management Expenses
Expenses of management are allocated to various classes of business in proportion to the respective premium written for the year. Expenses not allocable to the underwriting business are charged as general and administrative expenses.
4.19 Foreign currency transactions and translation
Foreign currency transactions are translated into Pak Rupees using the exchange rates prevailing at the dates of the transactions. All monetary assets and liabilities in foreign currencies are translated into Pak Rupees at the rates of exchange prevailing at the balance sheet date. Foreign exchange gains and losses on translation are recognized in the profit and loss account.
Notes to the Financial Statementsfor the year ended December 31, 2012

Annual Report | for the year ended December 31, 2012 65
4.23 Dividend distributions and appropriations
Dividend distributions and appropriations are recorded in the period in which the distributions and appropriations are approved.
4.24 Critical accounting judgments and key sources of estimation uncertainty
In the process of applying the Company’s accounting policies, as described in note 4, the management has made the following estimates and judgments which are significant to financial statements: -
- classification of investments (Note 4.13);
- determining the residual values and useful lives of fixed assets (Note 4.15);
- impairment (Note 4.16);
- accounting for post employment benefits (Note 4.11);
- recognition of taxation and deferred tax (Note 4.10);
- provisions for obligations (Note 4.9);
- recognition of outstanding claims incurred but not reported (Note 4.5);
- calculation of premium deficiency reserves (Note 4.8).
- allocation of management expenses (Note 4.18).
- segmental reporting (Note 4.22).
operating segments are also consistent with the internal reporting provided to Board of Directors which are responsible for allocating resources and assessing performance of the operating segments. The performance of segments is evaluated on the basis of underwriting results of each segment.
The Company has four primary business segments for reporting purposes namely fire, marine, motor and miscellaneous.
The fire and property damage insurance segment provides insurance covers against damages caused by fire, riot and strike, explosion, earthquake, atmospheric damage, flood and electric fluctuation and engineering losses.
Marine insurance segment provides coverage against cargo risk, war risk and damages occurring in inland transit.
Motor insurance provides comprehensive vehicle coverage and indemnity against third party losses.
Miscellaneous insurance provides cover against loss of cash in safe and cash in transit, personal accident, money, and other coverage.
Financing, investment and income taxes are managed on an overall basis and are therefore, not allocated to any segment. The accounting policies of operating segment are the same as those described in the summary of significant accounting policies.
Assets, liabilities and capital expenditures that are directly attributable to segments have been assigned to them while the carrying amount of certain assets pertaining to two or more segments have been allocated to segments on the net premium revenue basis. Those assets and liabilities which can not be allocated to a particular segment on the above basis are reported as unallocated corporate assets and liabilities.
Notes to the Financial Statementsfor the year ended December 31, 2012

66 Saudi Pak Insurance Company Limited
6 STAFF RETIREMENT GRATUITY
Staff Retirement Gratuity 2,294,644 944,644
2,294,644 944,644
6.1 Staff retirement gratuity-payable to the fund
The actuarial valuations are carried out annually and contributions are made accordingly. Following were the
significant assumptions used for valuation of the scheme:-
- - - -
Discount rate 12% (2011:13%) per annum
Expected rate of increase in the salary of employees 10% (2011:11%) per annum
Expected interest rate on plan assets of the fund 12% (2011: 13%) per annum
Expected service length of the employees 14.6 years (2011: 14.6 years)
5 Issued, subscribed and paid up share capital`Note 2012 2011
Rupees Rupees
2012 2011
(Number of Shares)
25,000,000 25,000,000 Ordinary shares of Rs. 10/- 250,000,000 250,000,000
each fully paid in cash
7,500,000 7,500,000 Ordinary shares of Rs. 10/- 75,000,000 75,000,000
each issued as fully paid right shares
32,500,000 32,500,000 325,000,000 325,000,000
Detail of the holdings of the associated companies and directors are as follows:
Saudi Pak Industrial & Agricultural Investment Company
Limited - Associated Company 119,985,000 178,318,333
Silk Bank Limited - Associated Company 74,990,000 74,990,000
Saudi Pak Leasing Company Limited 24,995,000 24,995,000
United Track System (Pvt.) Limited - Associated Company 48,416,660 8,750,000
UIG Global Services Limited 11,666,667 11,666,667
Directors 24,530,006 5,863,333
General Share Holders 20,416,667 20,416,667
325,000,000 325,000,000
Notes to the Financial Statementsfor the year ended December 31, 2012

Annual Report | for the year ended December 31, 2012 67
Note 2012 2011
Rupees Rupees
6.1.1 Reconciliation of payable / (receivable) to defined benefit plan
Present value of defined benefit obligations 3,674,382 3,898,507
Fair value of plan assets (982,251) (2,354,170)
Unrecognized actuarial gains / (losses) (397,487) (599,693)
2,294,644 944,644
6.1.2 Movement in payable / (receivable) to defined benefit plan
Opening balance 944,644 565,377
Charge to profit and loss account 1,914,355 1,259,527
Contributions (564,355) (880,260)
Closing balance 2,294,644 944,644
6.1.3 Charges for defined benefit plan
Current service cost 1,706,142 1,092,268
Interest cost 604,744 868,092
Expected return on plan assets (417,515) (707,907)
Recognition of loss 20,984 7,074
Amount charged to profit and loss account 1,914,355 1,259,527
6.1.4 Movement in present value of defined benefit obligation
Opening balance 3,898,507 5,623,277
Current service cost 1,706,142 1,092,268
Interest cost 604,744 868,092
Benefit paid during the year (1,993,295) (3,399,755)
Actuarial (loss) / gain (541,716) (285,375)
Closing balance 3,674,382 3,898,507
Notes to the Financial Statementsfor the year ended December 31, 2012

68 Saudi Pak Insurance Company Limited
Note 2012 2011
Rupees Rupees
6.1.5 Movement in fair value of plan assets
Opening balance 2,354,170 4,404,737
Expected return on plan assets 417,515 707,907
Contribution to the fund 564,355 880,260
Benefit paid during the year (1,993,295) (3,399,755)
Actuarial (loss) / gain (360,494) (238,979)
Closing balance 982,251 2,354,170
6.1.6 Actual return on plan assets
Expected return on plan assets 417,515 707,907
Actuarial (loss) on assets (360,494) (238,979)
57,021 468,928
6.1.7 Composition of fair valueof plan assets
2012 2012 2011
Fair Value Percentage Fair Value Percentage
Rupees Rupees
Cash and bank balances 982,251 100% 2,354,170 100%
982,251 100% 2,354,170 100%
6.1.7.1 Reconciliation with bank statementNote 2012 2011
Rupees Rupees
Balance as per bank statement as at December 31 982,251 2,354,170
Less: Unpresented cheques as at December 31 - -
Composition of fair value of plan assets 982,251 2,354,170
Notes to the Financial Statementsfor the year ended December 31, 2012

Annual Report | for the year ended December 31, 2012 69
7 ACCRUED EXPENSES Note2012 2011
Rupees Rupees
Audit fee payable 450,000 440,000
Salaries wages and benefits payable 5,485,622 3,795,525
Utilities payable 430,870 74,776
Others 423,997 35,835
6,790,489 4,346,136
8 OTHER CREDITORS AND ACCRUALS
Commission 1,969,467 2,150,933
Tracker charges - 1,301,253
Rent 18,000 335,925
Customer deposit - 754,800
Government levies payable 5,344,242 3,989,459
Liabilities against cancelled policies 81,614 36,966
Withholding tax 183,187 40,717
Others 638,985 151,367
8,235,495 8,761,420
9 CONTINGENCIES AND COMMITMENTS
There is no known contingency or commitment as at December 31, 2012 (2011: Nil).
6.1.8 Historical information2012 2011 2010 2009
-- - - - - - - Rupees - - - - - - - -
Present value of defined benefit
obligation 3,674,382 3,898,507 5,623,277 3,867,244
Fair value of plan assets (982,251) (2,354,170) (4,404,737) (4,354,853)
(Surplus)/ deficit 2,692,131 1,544,337 1,218,540 (487,609)
Expected adjustments
Actuarial (gain)/ loss on obligation (541,716) (285,375) 640,827 (508,116)
Actuarial gain/ (loss) on assets (360,494) (238,979) (70,066) 93,113
Notes to the Financial Statementsfor the year ended December 31, 2012

70 Saudi Pak Insurance Company Limited
10 CASH AND BANK DEPOSITS Note 2012 2011
Rupees Rupees
Cash and other equivalents
Cash in hand 567,619 293,341
Policy and revenue stamps in hand 350,498 84,646
918,117 377,987
Current and other accounts
Current accounts 26,104,724 13,423,411
PLS saving accounts 10.1 & 10.2 2,329,827 3,553,640
28,434,551 16,977,051
Deposits maturing within 12 months
Related party 10.3 39,966,000 41,931,000
Others 1,000,000 3,500,000
40,966,000 45,431,000
Cash with State Bank of Pakistan 89,639 200,000
70,408,307 62,986,038
10.1 This includes bank balance of Rs. 1,201,626 (2011: Rs. 953,597) with Silk Bank Limited - a related party, that
carries profit rate ranging between 5 % to 11% (2011: 5% to 11%) per annum.
10.2 Other PLS saving accounts carry profit rate of 5% (2011: 5%) per annum.
10.3 This represents term deposits with Silk Bank Limited - a related party carrying return at the rate ranging between
11% to 12% (2011: 11.5% to 13.5%) per annum. The above deposits are due to mature upto July 2013.
11 LOANS TO EMPLOYEES - secured, considered good. Note 2012 2011
Rupees Rupees
Due from - executives 11.1 20,000 133,881
- others 481,116 213,268
501,116 347,149
11.1 These represent short term advances to employees of the company in accordance with the terms of
their employment. These advances are recoverable in monthly installments over a period of one year.
Notes to the Financial Statementsfor the year ended December 31, 2012
11.2 Reconciliation of carrying amount of loans 2012 2011
Executives Others Executives Others
Opening balance 133,881 213,268 336,662 535,815
Disbursements 40,000 603,279 100,000 287,000
Repayments (153,881) (335,431) (302,781) (609,547)
Closing balance 20,000 481,116 133,881 213,268
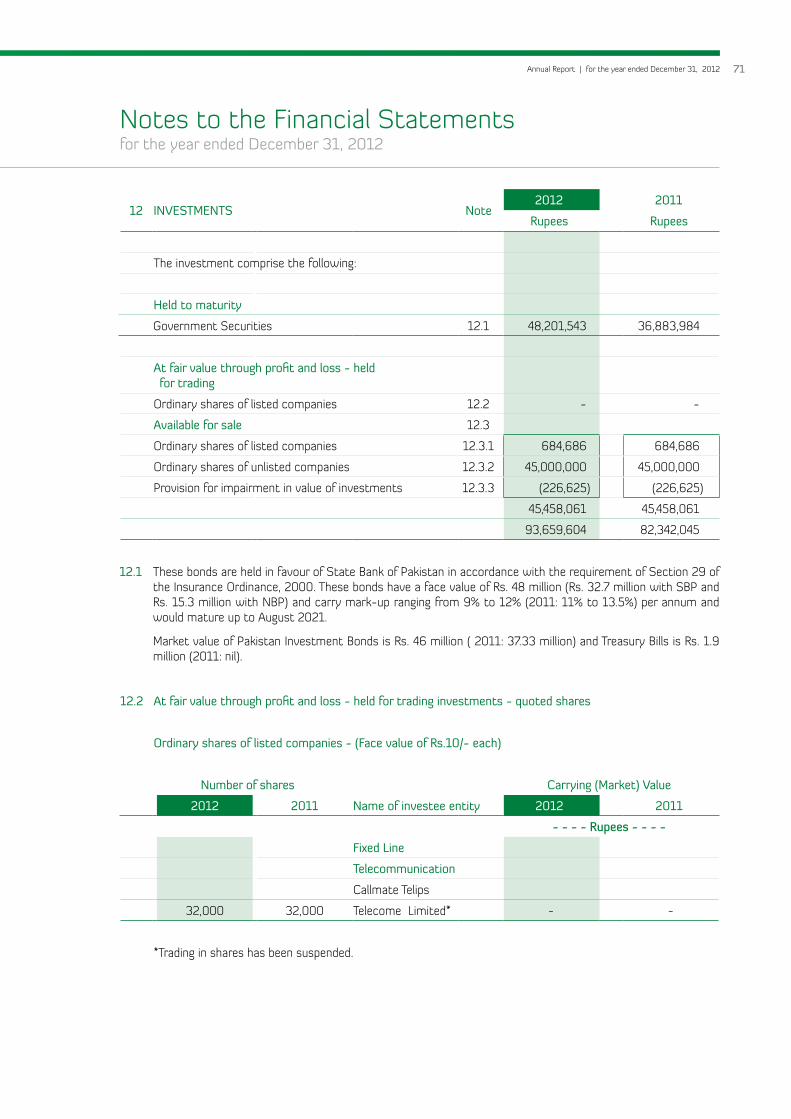
Annual Report | for the year ended December 31, 2012 71
12 INVESTMENTS Note2012 2011
Rupees Rupees
The investment comprise the following:
Held to maturity
Government Securities 12.1 48,201,543 36,883,984
At fair value through profit and loss - heldfor trading
Ordinary shares of listed companies 12.2 - -
Available for sale 12.3
Ordinary shares of listed companies 12.3.1 684,686 684,686
Ordinary shares of unlisted companies 12.3.2 45,000,000 45,000,000
Provision for impairment in value of investments 12.3.3 (226,625) (226,625)
45,458,061 45,458,061
93,659,604 82,342,045
12.1 These bonds are held in favour of State Bank of Pakistan in accordance with the requirement of Section 29 of the Insurance Ordinance, 2000. These bonds have a face value of Rs. 48 million (Rs. 32.7 million with SBP and Rs. 15.3 million with NBP) and carry mark-up ranging from 9% to 12% (2011: 11% to 13.5%) per annum and would mature up to August 2021.
Market value of Pakistan Investment Bonds is Rs. 46 million ( 2011: 37.33 million) and Treasury Bills is Rs. 1.9 million (2011: nil).
12.2 At fair value through profit and loss - held for trading investments - quoted shares
Ordinary shares of listed companies - (Face value of Rs.10/- each)
Number of shares Carrying (Market) Value
2012 2011 Name of investee entity 2012 2011
- - - - Rupees - - - -
Fixed Line
Telecommunication
Callmate Telips
32,000 32,000 Telecome Limited* - -
*Trading in shares has been suspended.
Notes to the Financial Statementsfor the year ended December 31, 2012

72 Saudi Pak Insurance Company Limited
12.3 Available for sale - investments
12.3.1 Ordinary shares of listed companies - (Face value of Rs.10/- each)
Number of shares Carrying (Market) Value
2012 2011 Name of investee entity 2012 2011
Oil and Gas
4,125 3,300 Pakistan Petroleum Limited* 449,394 449,394
Financial Services
16,065 16,065 Saudi Pak Leasing Company Limited** 226,625 226,625
Chemicals
900 900 Fatima Fertilizer Company Limited 8,667 8,667
21,090 20,265 684,686 684,686
* Bonus shares credited to CDC account on September 19, 2012 at the rate of one share for every four shares held.
** These shares are deposited into CDC account and blocked on the instructions of Securities and Exchange Commission of Pakistan (SECP) in accordance with Circular No. 9 of 2006 issued by the SECP, which requires promoters / majority shareholders of company to deposit their shares into CDC blocked account.
The market value of available for sale - equity securities as at December 31, 2012 is Rs. 805,230 (December 31, 2011: Rs. 583,795).
12.3.2 Ordinary shares of unlisted companies - (Face value of Rs.10/- each)
Number of shares Cost
2012 2011 Name of investee entity 2012 2011
- - - - Rupees - - - -
4,500,000 4,500,000 Pace Barka Properties Limited 45,000,000 45,000,000
12.3.3 Movement in provision for impairment is as follows:
Balance at January 01 226,625 226,625
Charge during the year - -
Reversal during the year - -
Balance at December 31 226,625 226,625
12.4 Investment related expenses (refer the statement of investment income)
Brokerage commission 9,366 9,251
Custodian fees - 4,000
9,366 13,251
Notes to the Financial Statementsfor the year ended December 31, 2012

Annual Report | for the year ended December 31, 2012 73
13 Deffered taxation Note2012 2011
Rupees Rupees
The asset / (liability) for deferred taxation comprises timing differences relating to:
Provision for doubtful receivable 5,059,516 -
Unused tax losses 46,944,107 -
52,003,623 -
14 Premium due but unpaid
Unsecured
- Considered good 48,702,076 61,160,304
- Considered doubtful 2,563,267 2,745,354
51,265,343 63,905,658
Provision for doubtful receivables 14.1 (2,563,267) (2,745,354)
48,702,076 61,160,304
14.1 Provision for doubtful receivables
Balance at the beginning of the year (2,745,354) (2,907,541)
Reversal/ (charge) for the year 182,087 162,187
Balance at the end of the year (2,563,267) (2,745,354)
15 Amount due from other insurers/reinsurers
Unsecured- Considered good 45,544,938 41,811,499
- Considered doubtful 11,892,492 5,453,409
57,437,430 47,264,908
Provision for doubtful receivables 15.1 (11,892,492) (5,453,409)
45,544,938 41,811,499
15.1 Provision for doubtful receivables
Balance at the beginning of the year (5,453,409) (4,952,526)
Charge for the year (6,439,083) (500,883)
Balance at the end of the year (11,892,492) (5,453,409)
16 Accrued investment income
Interest accrued on Pakistan Investment Bonds 1,752,864 1,241,143
Interest accrued on Term Deposit Receipts 2,006,052 2,118,297 3,758,916 3,359,440
Notes to the Financial Statementsfor the year ended December 31, 2012

74 Saudi Pak Insurance Company Limited
Note2012 2011
Rupees Rupees
17 Reinsurance recoveries against outstanding claims
These are unsecured and considered good.
18 Prepayments
Prepaid expenses 3,048,354 3,179,576
Tracker Charges 149,674 -
Other 2,603,934 88,429
5,801,962 3,268,005
19 Sundry receivables - unsecured, considered good
Deposit against office premises 2,947,597 2,376,097
Other receivables 3,830,229 2,238,623
6,777,826 4,614,720
Notes to the Financial Statementsfor the year ended December 31, 2012

Annual Report | for the year ended December 31, 2012 75
20O
WN
ED A
SS
ETS
DES
CRI
PTIO
N
TAN
GIB
LEIN
TAN
GIB
LEG
RAN
D
TOTA
LO
ffice
Im
prov
emen
tsFu
rnit
ure
and
Fixt
ure
Offi
ce
Equi
pmen
tC
ompu
ter
Equi
pmen
tM
otor
Ve
hicl
esTO
TAL
Com
pute
r S
oftw
are
- -
- -
- -
- -
- -
- -
- -
- -
- -
- -
- -
- -
- -
Rup
ees
- -
- -
- -
- -
-- -
- -
- -
- -
- -
- -
- -
- -
CO
ST
Bala
nce
as a
t Ja
nuar
y 0
1, 2
011
14,
612,
951
1,9
47,2
10
5,9
10,0
52
3,6
89,
556
23,
00
6,20
4 4
9,16
5,97
3 4
,68
2,19
6 5
3,8
48,1
69
Addi
tions
dur
ing
the
year
995
,367
1
,437
,277
1
,68
1,91
6 1
,666
,138
6
,763
,420
1
2,54
4,11
8
-
12,
544,
118
Dis
posa
ls (9
21,5
35)
(137
,263
) (5
74,9
73)
(41,
500
) (1
,88
3,31
5) (3
,558
,58
6) -
(3
,558
,58
6)
Bala
nce
as a
t D
ecem
ber
31, 2
011
14,
686,
783
3,2
47,2
24
7,0
16,9
95
5,3
14,1
94
27,
88
6,30
9 5
8,1
51,5
05
4,6
82,
196
62,
833
,70
1
Bala
nce
as a
t Ja
nuar
y 0
1, 2
012
14,
686,
783
3,2
47,2
24
7,0
16,9
95
5,3
14,1
94
27,
88
6,30
9 5
8,1
51,5
05
4,6
82,
196
62,
833
,70
1
Addi
tions
dur
ing
the
year
2,9
45,2
31
1,2
40,9
83
1,4
81,
421
770
,869
2
5,8
13,8
12
32,
252,
316
-
32,
252,
316
Dis
posa
ls -
-
-
-
-
-
-
-
Bala
nce
as a
t D
ecem
ber
31, 2
012
17,
632,
014
4
,48
8,2
07
8,4
98,4
16
6,0
85,
063
5
3,70
0,1
21
90
,40
3,8
21
4,6
82,
196
95,
08
6,0
17
Dep
reci
atio
n
Bala
nce
as a
t Ja
nuar
y 0
1, 2
011
5,7
84,
612
98
8,4
87
3,0
05,
164
2,9
77,6
80
1
0,8
33,8
30
23,
589,
773
4,2
83,
341
27,
873
,114
Cha
rge
for t
he y
ear
88
7,62
5 2
06,
279
473
,795
2
96,8
62
2,1
78,2
23
4,0
42,7
84
79,
771
4,1
22,5
55
Dep
reci
atio
n on
dis
posa
l (3
54,0
45)
(62,
328
) (3
55,9
79)
(26,
910
) (1
,156
,60
9) (1
,955
,871
) -
(1
,955
,871
)
Bala
nce
as a
t D
ecem
ber
31, 2
011
6,3
18,1
92
1,1
32,4
38
3,1
22,9
80
3
,247
,632
1
1,8
55,4
44
25,
676,
686
4,3
63,1
12
30
,039
,798
Bala
nce
as a
t Ja
nuar
y 0
1, 2
012
6,3
18,1
92
1,1
32,4
38
3,1
22,9
80
3
,247
,632
1
1,8
55,4
44
25,
676,
686
4,3
63,1
12
30
,039
,798
Cha
rge
for t
he y
ear
98
2,94
4 4
63,3
78
730
,18
7 7
12,6
31
5,4
83,
308
8
,372
,448
6
3,8
17
8,4
36,2
65
Dep
reci
atio
n on
dis
posa
l -
-
-
-
-
-
-
-
Bala
nce
as a
t D
ecem
ber
31, 2
012
7,3
01,
136
1,5
95,8
16
3,8
53,1
67
3,9
60,2
63
17,
338
,752
3
4,0
49,1
34
4,4
26,9
29
38
,476
,063
WD
V as
at
Dec
embe
r 31,
20
11 8
,368
,591
2
,114
,78
6 3
,894
,015
2
,066
,562
1
6,0
30,8
65
32,
474,
819
3
19,0
84
32,
793,
903
WD
V as
at
Dec
embe
r 31,
20
12 1
0,3
30,8
78
2,8
92,3
91
4,6
45,2
49
2,1
24,8
00
3
6,36
1,36
9 5
6,35
4,68
7 2
55,2
67
56,
609,
954
Rate
of d
epre
ciat
ion
(%)
10%
15%
15%
30%
15%
20%
Notes to the Financial Statementsfor the year ended December 31, 2012

76 Saudi Pak Insurance Company Limited
21M
AN
AG
EMEN
T A
ND
GEN
ERA
L A
DM
INIS
TRAT
IVE
EXPE
NS
ESN
ote
20
12
20
11
Man
agem
ent
Expe
nses
Gen
eral
&
Adm
inis
trat
ion
Expe
nses
T
otal
*
Man
agem
ent
Expe
nses
Gen
eral
&
Adm
inis
trat
ion
Expe
nses
T
otal
- -
- -
- -
- -
- -
- -
- -
- -
- -
- -
- R
upee
s -
- -
- -
- -
- -
- -
- -
- -
- -
- -
- -
Sal
arie
s, w
ages
and
ben
efits
21.1
3
1,28
0,7
06
23,
931,
580
5
5,21
2,28
6 2
8,8
63,5
13
5,0
93,5
61
33,
957,
074
D
irect
ors
fee
and
expe
nses
-
1,0
70,6
82
1,0
70,6
82
-
612
,777
6
12,7
77
Rent
exp
ense
s 6
27,6
00
1
0,7
74,5
66
11,
402,
166
4,8
23,5
86
851
,221
5
,674
,80
7 U
tiliti
es 5
,747
,438
1
,014
,254
6
,761
,692
3
,130
,259
5
52,3
99
3,6
82,
658
Le
gal a
nd p
rofe
ssio
nal e
xpen
ses
2,5
55,9
97
451
,058
3
,00
7,0
55
1,7
24,9
36
30
4,40
1 2
,029
,337
D
epre
ciat
ion
20 7
,116
,58
1 1
,255
,867
8
,372
,448
3
,436
,366
6
06,
418
4
,042
,78
4 Am
ortiz
atio
n 5
4,24
4 9
,573
6
3,8
17
67,
80
5 1
1,96
6 7
9,77
1 Ve
hicl
e ex
pens
es 4
,476
,396
6
,70
3,19
1 1
1,17
9,58
7 4
,648
,993
8
20,4
11
5,4
69,4
04
Insu
ranc
e -
-
-
4
66,7
22
82,
363
549
,08
5 Tr
acke
r mon
itorin
g fe
e 9
86,
648
-
9
86,
648
2
78,7
22
-
278
,722
S
ervi
ce c
harg
es 9
85,
235
-
98
5,23
5 1
,265
,872
-
1
,265
,872
Pr
intin
g an
d st
atio
nery
exp
ense
s 8
93,7
23
157
,716
1
,051
,439
8
06,
362
142
,299
9
48,6
61
Trav
elin
g an
d co
nvey
ance
exp
ense
s 7
21,7
04
127
,360
8
49,0
64
596
,28
4 1
05,
227
70
1,51
1 Ad
vert
isem
ent
590
,729
1
04,
246
694
,975
3
22,4
47
56,
902
379
,350
Com
pute
r mai
nten
ance
78
4,92
3 1
38,5
16
923
,439
2
51,1
98
44,
329
295
,527
Offi
ce c
lean
ing
and
mai
nten
ance
1,4
55,7
41
256
,896
1
,712
,637
7
71,6
16
136
,168
9
07,7
84
Cre
dit
ratin
g fe
e 6
07,7
50
10
7,25
0
715
,00
0
255
,00
0
45,
00
0
30
0,0
00
Sub
scrip
tion
and
perio
dica
ls 6
6,60
9 1
1,75
4 7
8,3
63
63,
504
11,
207
74,
711
Com
mun
icat
ion
569
,323
1
00
,469
6
69,7
92
260
,78
6 4
6,0
21
30
6,8
07
Audi
tor’s
rem
uner
atio
n21
.2 -
6
54,0
00
6
54,0
00
-
5
50,0
00
5
50,0
00
Insp
ectio
n fe
e 8
4,46
3 1
4,90
5 9
9,36
8
91,
818
1
6,20
3 1
08
,022
Con
fere
nce
/ sem
inar
-
-
-
12,
240
2
,160
1
4,40
0
Ente
rtai
nmen
t 1
,215
,58
0
214
,514
1
,430
,094
8
39,5
41
148
,154
9
87,
695
Bank
cha
rges
-
226
,80
3 2
26,8
03
-
142
,38
2 1
42,3
82
Prov
isio
n fo
r dou
btfu
l deb
ts 6
,274
,922
-
6
,274
,922
3
38,6
96
-
338
,696
Mis
cella
neou
s 7
17,9
48
126
,697
8
44,6
45
843
,891
1
48,9
22
992
,813
67,
814
,261
4
7,451
,896
1
15,2
66,1
57
54,
160
,156
1
0,5
30,4
88
6
4,69
0,6
44
*C
omm
on e
xpen
ses
are
allo
cate
d on
the
bas
is o
f 85%
to
man
agem
ent
(und
erw
ritin
g) e
xpen
ses
and
15%
to
gene
ral a
nd a
dmin
istr
atio
n ex
pens
es h
owev
er in
the
cur
rent
yea
r’s fi
nanc
ial s
tate
men
ts S
alar
ies
wag
es a
nd b
enefi
ts, R
ent
expe
nses
and
Veh
icle
exp
ense
s ar
e al
loca
ted
on a
ctua
l bas
is.
Notes to the Financial Statementsfor the year ended December 31, 2012

Annual Report | for the year ended December 31, 2012 77
21.1
This
incl
udes
cha
rge
for
defin
ed b
enefi
t am
ount
ing
Rs. 1
.9 m
illio
n (2
011
: Rs.
1.2
mill
ion)
.
21.2
Aud
itor
s’ r
emun
erat
ion
Ava
is H
yder
Lia
quat
N
aum
an
SA
RWA
RS
20
12
Ava
is H
yder
Lia
quat
N
aum
an
SA
RWA
RS
20
11
CA’
s C
A’s
Rup
ees
CA’
s C
A’s
Rup
ees
Annu
al a
udit
fee
18
0,0
00
1
80
,00
0
360
,00
0
150
,00
0
150
,00
0
30
0,0
00
Fee
for h
alf y
early
rev
iew
65,
00
0
65,
00
0
130
,00
0
50
,00
0
50
,00
0
10
0,0
00
Fee
for r
egul
ator
y re
turn
3
0,0
00
3
0,0
00
6
0,0
00
3
0,0
00
3
0,0
00
6
0,0
00
Out
of p
ocke
t 5
2,0
00
5
2,0
00
1
04,
00
0
45,
00
0
45,
00
0
90
,00
0
327
,00
0
327
,00
0
654
,00
0
275
,00
0
275
,00
0
550
,00
0
22O
ther
inco
me
Not
e20
1220
11
Rupe
esRu
pees
Inte
rest
on
PLS
sav
ing
acco
unts
1
38,0
42
1,7
72,6
80
Gai
n on
sal
e of
fixe
d as
sets
-
631
,30
2
Exch
ange
gai
n / (
loss
) (6
6,0
90)
(12,
365)
Bala
nces
writ
ten
back
1,0
57,3
36
3,6
19,7
89
Mis
cella
neou
s in
com
e 5
35,2
07
1,3
83,
502
1,6
64,4
95
7,3
94,9
08
Notes to the Financial Statementsfor the year ended December 31, 2012

78 Saudi Pak Insurance Company Limited
23 Taxation
The numerical reconciliation between the average tax rate and applicable tax rate has not been presented in these financial statements as during the year the Company has paid minimum tax u/s 113 of Income Tax Ordinance, 2001 due to available tax losses.
24 Earnings per share Note2012 2011
Rupees Rupees
Basic earnings per share are calculated by dividing the net profit for the year by the weighted average number of shares as at the year end as follows:
Profit after tax for the year 74,944,698 24,402,850
(Number of shares)
Weighted average number of ordinary shares outstanding during the year of Rs. 10/- each 32,500,000 32,500,000
(Rupees per share)
Earnings per share of Rs. 10/- each 2.31 0.75
24.1 No figure of diluted earnings per share has been presented as the company has not issued any instrument
which would have an impact on earnings per share when exercised.
25 Remuneration of chief executive, directors and executives
Aggregate amount charged in the financial statements for the year for remuneration, including all benefits to Chairman, Chief Executive, and Directors of the Company are as follows:
Notes to the Financial Statementsfor the year ended December 31, 2012

Annual Report | for the year ended December 31, 2012 79
Description
Chief Executive Executives Total
2012 2011 2012 2011 2012 2011
Rupees Rupees Rupees Rupees Rupees Rupees
Managerial Remuneration 2,925,000 2,681,250 10,941,890 3,758,424 13,866,890 6,439,674
House rent allowance 990,000 907,500 3,037,714 1,345,900 4,027,714 2,253,400
Utilities 292,500 268,125 951,681 402,838 1,244,181 670,963
Medical allowance 292,500 268,125 951,681 402,838 1,244,181 670,963
Total 4,500,000 4,125,000 15,882,966 5,910,000 20,382,966 10,035,000
Number of persons 1 1 20 8 21 9
25.1 In addition to the above, these executives are entitled to free use of company maintained vehicles.
26 Administrative surcharge Note2012 2011
Rupees Rupees
Net premium revenue include administrative surcharge, class wise details of which is given below:
Direct and facilitative
Fire and property damage 1,213,002 584,008
Marine 1,099,947 390,498
Motor 3,525,875 1,555,174
Miscellaneous 202,387 181,051
6,041,211 2,710,731
Notes to the Financial Statementsfor the year ended December 31, 2012

80 Saudi Pak Insurance Company Limited
27O
pera
ting
Seg
men
t
Cla
ss o
f bus
ines
s w
ise
reve
nue
and
resu
lts h
ave
been
dis
clos
ed in
the
pro
fit a
nd lo
ss a
ccou
nt p
repa
red
in a
ccor
danc
e w
ith t
he re
quire
men
ts o
f Ins
uran
ce O
rdin
ance
, 20
00
and
The
SEC
(Ins
uran
ce) R
ules
, 20
02.
The
com
pany
has
four
prim
ary
busi
ness
seg
men
ts fo
r rep
ortin
g pu
rpos
e na
mel
y fir
e, m
arin
e, m
otor
and
mis
cella
neou
s.
Asse
ts a
nd li
abili
ties,
whe
reve
r po
ssib
le, h
ave
been
ass
igne
d to
the
fol
low
ing
segm
ents
bas
ed o
n sp
ecifi
c id
entifi
catio
n or
allo
cate
d on
the
bas
is o
f gr
oss
prem
ium
w
ritte
n by
the
seg
men
ts.
Fire
Mar
ine
Mot
orM
isce
llane
ous
Tota
l
2012
2011
2012
2011
2012
2011
2012
2011
2012
2011
- -
- -
- -
- -
- -
- -
- -
- -
- -
- -
- -
- -
- -
- -
- -
R u
p e
e s
- -
- -
- -
- -
- -
- -
- -
- -
- -
- -
- -
- -
- -
- -
- -
- -
-
Seg
men
t A
sset
s
Seg
men
t as
sets
137
,321
,80
9 11
9,28
7,94
6 12
,692
,855
7,
050
,80
1 10
0,2
91,4
17
31,
562,
911
60
,813
,717
7
7,38
6,0
42
311
,119
,798
2
35,2
87,7
00
Una
lloca
ted
corp
orat
e as
sets
218
,70
4,98
5 1
93,5
85,
489
Con
solid
ated
Tot
al A
sset
s 5
29,8
24,7
83
428
,873
,18
9
Seg
men
t Li
abili
ties
Seg
men
t lia
bilit
ies
131
,128
,364
9
7,38
3,8
76
8,8
11,3
32
7,3
14,4
19
61,
660
,463
4
3,27
9,0
65
45,
013
,00
9 8
2,29
8,6
32
246
,613
,168
2
30,2
75,9
92
Una
lloca
ted
corp
orat
e lia
bilit
ies
25,
722,
578
1
6,0
52,8
58
Con
solid
ated
tot
al li
abili
ties
272
,335
,746
2
46,3
28,8
50
Cap
ital e
xpen
ditu
re 1
4,36
2,65
3 4
,321
,58
0
3,0
49,8
75
60
0,5
39
11,
08
4,61
0
2,7
34,4
55
3,7
55,1
78
4,8
87,
545
32,
252,
316
12,
544,
119
Dep
reci
atio
n 3
,169
,167
1
,420
,263
6
72,9
65
197
,364
2
,445
,856
8
98,6
64
828
,593
1
,60
6,26
4 7
,116
,58
1 4
,122
,555
Notes to the Financial Statementsfor the year ended December 31, 2012

Annual Report | for the year ended December 31, 2012 81
28 Transactions with related parties
The related parties comprise of Saudi Pak Industrial & Agricultural Investment Company Limited, Silk Bank Limited, Saudi Pak Leasing Company Limited and United Track Systems (Pvt.) Limited on the basis of related group companies, entities under common control, entities with common directors, major shareholders, directors, key management personnel and employee retirement benefits fund. Amount due to/from and other significant transactions, other than those disclosed elsewhere in these financial statements, are as follows:
Transactions and balances with parentand associated companies
As at December
2012 2011
Rupees Rupees
Insurance premium
Balance at beginning of the period 32,421,665 3,289,321
Gross insurance premium written 19,729,050 61,743,773
(including administrative surcharge,
government levies and policies stamps)
Received / adjusted during the period 50,605,198 32,611,429
Balance at end of the period 1,545,517 32,421,665
Insurance claim expense
Outstanding claims at beginning of the period 6,946,040 7,099,794
Gross claim expense for the period 9,980,483 5,158,774
Claim paid during the period 11,828,944 5,312,528
Outstanding claims at end of the period 5,097,579 6,946,040
Other transactions during the year with parent and associated companies
Rental expense 1,887,000 1,083,900
Bank charges 74,989 126,011
Tracker charges 828,000 427,950
Profit on term deposit receipts 4,944,193 1,083,032
Profit on bank deposits 79,168 1,823,352
Advisory fee to Silk Bank Limited - -
Notes to the Financial Statementsfor the year ended December 31, 2012

82 Saudi Pak Insurance Company Limited
29 FINANCIAL RISK MANAGEMENT OBJECTIVES & POLICIES
The Company is exposed to a variety of financial risks: credit risk, liquidity risk, market risk (comprising currency risk, interest rate risk and other price risk) that could result in a reduction in Company’s net assets or a reduction in the profits. The Company’s overall risk management program focuses on unpredictability of financial markets and seeks to minimize potential adverse effects on the financial performance. Overall risks arising from the company’s financial assets and liabilities are limited. The Company consistently manages its exposure to financial risks without any material change from previous year in the manner described in the notes below. The Board of Directors has the overall responsibility for the establishment and oversight of Company’s risk management framework. The Board is also responsible for developing and monitoring the Company’s risk management policy.
29.1 Credit Risk
Credit risk is the risk, which arises with the possibility that one party to a financial instrument will fail to discharge its obligation and cause other party to incur a financial loss. The Company attempts to control credit risk by monitoring credit exposures by undertaking transactions with a large number of counterparties in various industries and by continually assessing the credit worthiness of counterparties.
2012 2011
Rupees Rupees
Other balances with associated companies
Term deposits 39,966,000 41,931,000
Profit and loss sharing accounts 1,026,666 958,638
Current accounts 5,552,784 5,031,604
Accrued investment income 2,006,052 2,118,297
Transactions during the year with other related parties(Key management personnel)
Contribution to the provident fund - 770,489
Contribution to defined benefit plan 564,355 880,260
Remuneration of key management personnel 20,382,966 10,035,000
Balances with other related parties
(Key management personnel)
(Payable) / receivable from defined benefit plan (2,294,644) (944,644)
Loan to key management personnel 20,000 133,881
Notes to the Financial Statementsfor the year ended December 31, 2012

Annual Report | for the year ended December 31, 2012 83
Concentration of credit risk arises when a number of counterparties have a similar type of business activities. As a result, any change in economic, political or other conditions would affect their ability to meet contractual obligations in similar manner. The Company’s credit risk exposure is not significantly different from that reflected in the financial statements. The management monitors and limits the Company’s exposure to credit risk through monitoring of clients exposure and conservative estimates of provision for doubtful assets, if any. The management is of the view that it is not exposed to the significant concentration of credit risk as its financial assets are adequately diversified in entities of sound financial standing, covering various industrial sectors.
The carrying amount of financial assets represents the maximum credit exposure, as specified below: -
2012 2011
Rupees Rupees
Bank deposits 69,400,551 62,408,051
Loan to employees 501,116 347,149
Investments 45,000,000 45,000,000
Premium due but unpaid 48,702,076 61,160,304
Amount due from other insurers/re-insurers 45,544,938 41,811,499
Accrued investment income 3,758,916 3,359,440
Reinsurance recoveries against outstanding claims 71,288,878 80,478,357
Sundry receivables 6,777,826 4,614,720
290,974,301 299,179,520
The Company did not hold any collateral against the above during the year. The impairment provision is written off when the Company expects that it cannot recover the balance due. During the year receivables of Rs. 6.44 million (2011: Rs. 0.5 million) were further provided for and the provision of Rs. 0.18 million (2011: Rs. 0.16 million) were reversed due to recoveries. The movement in the provision for doubtful debt account is shown in note 14 and 15 to the financial statements. The remaining past due balances were not impaired as they relate to a number of policy holders and other insurers / reinsurers for whom there is no recent history of default and/or Company held their credit balances in other accounts.
2012 2011
Rupees Rupees
The age analysis of receivables is follows: -
Up to 1 year 54,279,994 78,410,809
1-2 years 22,057,011 15,788,777
2-3 years 12,456,246 9,133,902
Over 3 years 19,909,522 7,837,078
108,702,773 111,170,566
Notes to the Financial Statementsfor the year ended December 31, 2012

84 Saudi Pak Insurance Company Limited
2012 2011
Rupees Rupees
Sector wise analysis of premium due but unpaid
Banks 657,539 4,015,036
Leasing companies 786,903 599,211
Textiles 11,530,605 23,997,756
Cement 180,534 1,917,058
Chemicals 996,164 1,908,157
Glass and ceramics 119,832 248,730
Hospital 265,829 -
Hotel - 45,576
Petrol/CNG pumps 1,105,930 925,470
Pharmaceuticals 67,649 282,342
Sugar factories 1,793,333 -
Telecommunications - 617,513
Oil Mills 117,909 -
Showrooms 1,012,924 429,520
Insurance - 195,478
Miscellaneous 32,630,192 28,723,811 51,265,343 63,905,658
The credit quality of Company’s bank balances and term deposit receipts can be assessed with reference to external credit ratings as follows: -
Ratings Ratings Agency
2012 2011
Short Term Long Term Rupees Rupees
Bank Al-Falah Limited A1+ AA PACRA 290,149 823,082
Bank Al-Habib Limited A1+ AA+ PACRA 1,192,974 1,006,347
Habib Bank Limited A-1+ AA+ JCR-VIS 4,227,855 4,127,806
HSBC Bank Limited P1 A1 MOODY’S 24,372 15,766
KASB Bank Limited A3 BBB PACRA 1,196,010 5,000
National Bank of Pakistan A1+ AAA JCR-VIS 21,651 337,560
Silkbank Limited A-2 A- JCR-VIS 46,767,796 47,921,241
Sindh Bank Limited A-1 AA- JCR-VIS 738,136 429,582
Soneri Bank Limited A1+ AA- PACRA 435,588 581,954
Standard Chartered Bank A1+ AAA PACRA 1,098,789 2,579,238
The Bank Of Punjab A1+ AA- PACRA 2,777,240 4,372,582
United Bank Limited A-1+ AA+ JCR-VIS 77,746 207,893
NIB Bank Limited A1+ AA- PACRA 368,770 -
Tameer Micro Finance Bank A-1 A JCR-VIS 70,750 -
Apna Micro Finance Bank A3 BBB PACRA 10,112,724 -
69,400,551 62,408,051
Notes to the Financial Statementsfor the year ended December 31, 2012

Annual Report | for the year ended December 31, 2012 85
The credit quality of amount due from other insurers and re-insurers can be assessed with reference to external credit rating as follows: -
Amount due from
other insurers/ reinsurers
Reinsurance recoveries
against outstanding
claims
Other reinsurance
assets2012 2011
- - - - - - - - - - - Rupees - - - - - - - - - - - -
A or above (including PRCL) 54,896,640 39,584,588 31,851,222 126,332,450 112,368,487
A- 1,167,212 21,892,278 17,615,335 40,674,825 46,610,198
BBB 956,744 - - 956,744 3,114,448
Others 416,834 9,812,012 - 10,228,846 4,465,373
Total 57,437,430 71,288,878 49,466,557 178,192,865 166,558,506
29.2 Liquidity risk
Liquidity risk is the risk that the Company will not be able to meet its financial obligations as they fall due. Prudent liquidity risk management implies maintaining sufficient cash and marketable securities. The Company finances its operations entirely through equity.
The following are the contractual maturities of financial liabilities, including estimated interest payments on an undiscounted cash flow basis: -
2012
Carrying amount
Contractual cash flows
up to one year
More than one year
- - - - - - - - - - - - Rupees - - - - - - - - - - - -
Financial liabilities
Provision for outstanding claims 80,911,792 80,911,792 80,911,792 -
Amount due to other insurer / reinsurers 7,576,658 7,576,658 7,576,658 -
Accrued expenses 6,790,489 6,790,489 6,790,489 -
Other creditors and accruals 8,235,495 8,235,495 8,235,495 -
103,514,434 103,514,434 103,514,434 -
Notes to the Financial Statementsfor the year ended December 31, 2012

86 Saudi Pak Insurance Company Limited
2011
Carrying amount
Contractual cash flows
up to one year
More then one year
- - - - - - - - - - - - Rupees - - - - - - - - - - - -
Financial liabilities
Provision for outstanding claims 112,663,524 112,663,524 112,663,524 -
Amount due to other insurer / reinsurers 3,555,785 3,555,785 3,555,785 -
Accrued expenses 4,346,136 4,346,136 4,346,136 -
Other creditors and accruals 8,761,420 8,761,420 8,761,420 -
129,326,865 129,326,865 129,326,865 -
29.3 Market risk
Market risk means that the fair value or future cash flows of a financial instrument will fluctuate because of the changes in the market prices. The objective is to manage and control market risk exposures within the acceptable parameters, while optimizing the return. The market risks associated within the Company’s business activities are the interest / markup rate risk and price risk. The Company is not exposed to material currency risk.
29.3.1 Interest /mark up rate risk
Interest /mark up rate risk is the risk that value of the financial instrument or future cash flows of a financial instrument will fluctuate due to changes in the market /mark up rates. Sensitivity to interest /mark up rate risk arises from the mismatch of financial assets and liabilities that mature or re-price in a given period. The Company manages these mismatches through risk management strategies where significant changes in gap position can be adjusted.
At the balance sheet date, the interest rate profile of the Company’s significant interest bearing financial instrument was as follows: -
2012 2011 2012 2011
(Effective interest rate) Carrying amounts
- - - - Rupees - - - -
Financial assets
Floating rate financial instruments
Bank deposits including term deposit receipts 5% to 12% 5% to 13.25% 43,295,827 48,984,640
Fixed rate financial instruments
Investments 9% to 12% 11 % to 13.5% 48,201,543 36,883,984
The company does not have any variable rate financial liabilities as at December 31, 2012.
Notes to the Financial Statementsfor the year ended December 31, 2012

Annual Report | for the year ended December 31, 2012 87
Sensitivity analysis
The Company does not account for any fixed rate financial assets and liabilities at fair value through profit or loss. Therefore, a change in interest rate will not effect fair value of any financial instrument. For cash flow sensitivity analysis of variable rate instruments a hypothetical change of 100 basis points in interest rates at the reporting date would have decreased/ (increased) profit for the year by the amounts shown below.
It is assumed that the changes occur immediately and uniformly to each category of instrument containing interest rate risk. Variations in market interest rates could produce significant changes at the time of early repayments. For these reasons, actual results might differ from those reflected in the details specified below. The analysis assumes that all other variables remain constant.
Increase/ (decrease) in basis points
Effect on profit before tax
Effect on equity
As at December 31, 2012
Cash flow sensitivity - variable rate financial assets 100 432,958 281,423
(100) (432,958) (281,423)
As at December 31, 2011
Cash flow sensitivity - variablerate financial assets
100 489,846 318,400
(100) (489,846) (318,400)
Notes to the Financial Statementsfor the year ended December 31, 2012
29.3.2 Price risk
Price risk represents the risk that the fair value of a financial instrument will fluctuate because of changes in the market prices (other than those arising from interest/mark up rate risk or currency risk), whether those changes are caused by factors specific to the individual financial instrument or its issuer, or factors affecting all or similar financial instruments traded in the market. The Company is exposed to equity price risk since it has investments in quoted equity securities amounting to Rs. 458,061 (2011 : Rs. 458,061) at the balance sheet date.
The carrying value of investments subject to equity price risk are based on quoted market prices as of the balance sheet date except for unquoted securities which are carried at cost less impairment and available for sale equity instruments which are stated at lower of cost or market value (market value on an individual investment basis being taken as lower if the fall is other than temporary) in accordance with the requirements of the SEC (Insurance) Rules, 2002 vide S.R.O. 938 dated December 2002.
Market prices are subject to fluctuation and consequently the amount realized in the subsequent sale of an investment may significantly differ from the reported market value. Furthermore, amount realized in the sale of a particular security may be affected by the relative quantity of the security being sold. The Company has no significant concentration of price risk.

88 Saudi Pak Insurance Company Limited
29.4 Fair value of financial instruments
29.4.1 Fair value is the amount for which an asset could be exchanged, or a liability settled, between
knowledgeable willing parties in an arms length transaction.
The carrying amount of the financial assets and liabilities reflected in the financial statements approximate their fair values.
29.4.2 Fair value estimation
The Company has adopted the amendment to IFRS 7 for financial instruments that are measured in the balance sheet at fair value. This amendment requires fair value measurement disclosures using following three level fair value hierarchy that reflects the significance of the inputs used in measured fair value of financial instruments.
- Level 1: Quoted prices (unadjusted) in active markets for identical assets or liabilities.
- Level 2: Inputs other than quoted prices included within level 1 that are observable for the asset or liability, either directly (i.e. as prices) or indirectly (i.e. derived from prices). The Exchange has no items to report in this level.
- Level 3: Inputs for asset or liability that are not based on observable market data (unobservable inputs).
The Company does not have any investments that fall in the above categories.
Notes to the Financial Statementsfor the year ended December 31, 2012
Sensitivity analysis
The table below summarizes Company’s equity price risk as of 31 December 2012 and 2011 and shows the effects of a hypothetical 10% increase and a 10% decrease in market prices as at the year end, The selected hypothetical change does not reflect what could be considered to be the best or worst case scenarios. Indeed, results could be worse in Company’s equity investment portfolio because of the nature of equity markets.
Had all equity investments, other than investment in unquoted securities, been measured at fair values as required by IAS 39 “Financial Instruments Recognition and Measurement”, the impact of hypothetical change would be as follows: -
Fair Value Hypothetical
Estimated fair value after hypothetical
change in prices
Hypothetical Increase/(decrease)
in shareholders’ equity
Hypothetical Increase/
(decrease) in profit/(loss) before tax
Rupees - - - - - - - - Rupees - - - - - - - -
December 31, 2012 805,230 10% increase 885,753 80,523 -
10% decrease 724,707 (80,523) -
December 31, 2011 583,795 10% increase 642,175 58,380 -
10% decrease 525,416 (58,380) -

Annual Report | for the year ended December 31, 2012 89
Notes to the Financial Statementsfor the year ended December 31, 2012
29.5 Insurance risk
The Company accepts the insurance risk through its insurance contracts where it assumes the risk of loss from persons or organizations that are directly subject to the underlying loss. The Company is exposed to the uncertainty surrounding the timing, frequency and severity of claims under these contracts.
The Company manages its risk through its underwriting and reinsurance strategy within an overall risk management. Reinsurance is purchased to mitigate the effect of potential loss to the Company from individual large or catastrophic events and also to provide access to specialist risks and to assist in managing capital. Insurance policies are written with approved reinsurers on either a proportional or excess of loss treaty basis.
A concentration of risk may also arise from a single insurance contract issued to a particular demographic type of a policyholder, within a geographical location or types of commercial business. The Company minimizes its exposure to significant losses by obtaining reinsurance from a number of reinsurers, who are dispersed over several geographical regions.
Geographical concentration of insurance risk
To optimize benefits from the principal of average and law of large numbers, geographical spread of risk is of extreme importance. There are a number of parameters which are significant in assessing the accumulation of risk with reference to the geographical location, the most important of which is risk survey.
Risk surveys are carried out on a regular basis for the evaluation of physical hazard associated with the commercial/industrial/residential occupation of the insured. Details regarding the fire separation/segregation with respect to the manufacturing processes, storage, utilities, etc are extracted from the layout plan of the insured facility. Such details are formed part of the reports which are made available to the underwriters/reinsurance personnel for their evaluation. Reference is made to the standard construction specification as laid down by IAP (Insurance Association of Pakistan). For instance, the presence of Perfect Party Walls, Double Fire Proof Iron Doors, Physical separation between the building within an insured’s premises. It is basically the property contained within an area which is separated by another property by sufficient distance to confine insured damage from uncontrolled fire and explosion under the most adverse conditions to that one area.
Address look-up and decoding is the essential field of the policy data interphase of IT systems. It provides instant location which is dependent on data collection provided under the policy schedule. All carried underwriting information is punched into the IT system/application through which a number of MIS reports can be generated to assess the concentration of risk.
For Marine risks, complete underwriting details, besides sums insured and premiums, like vessel identification, voyage input (sea/air/inland transit), sailing dates, origin and destination of the shipments, per carry limits, etc are fed into the system. The reinsurance module of the IT system is designed to satisfy the requirement as laid dawn in the proportional treaty agreement.
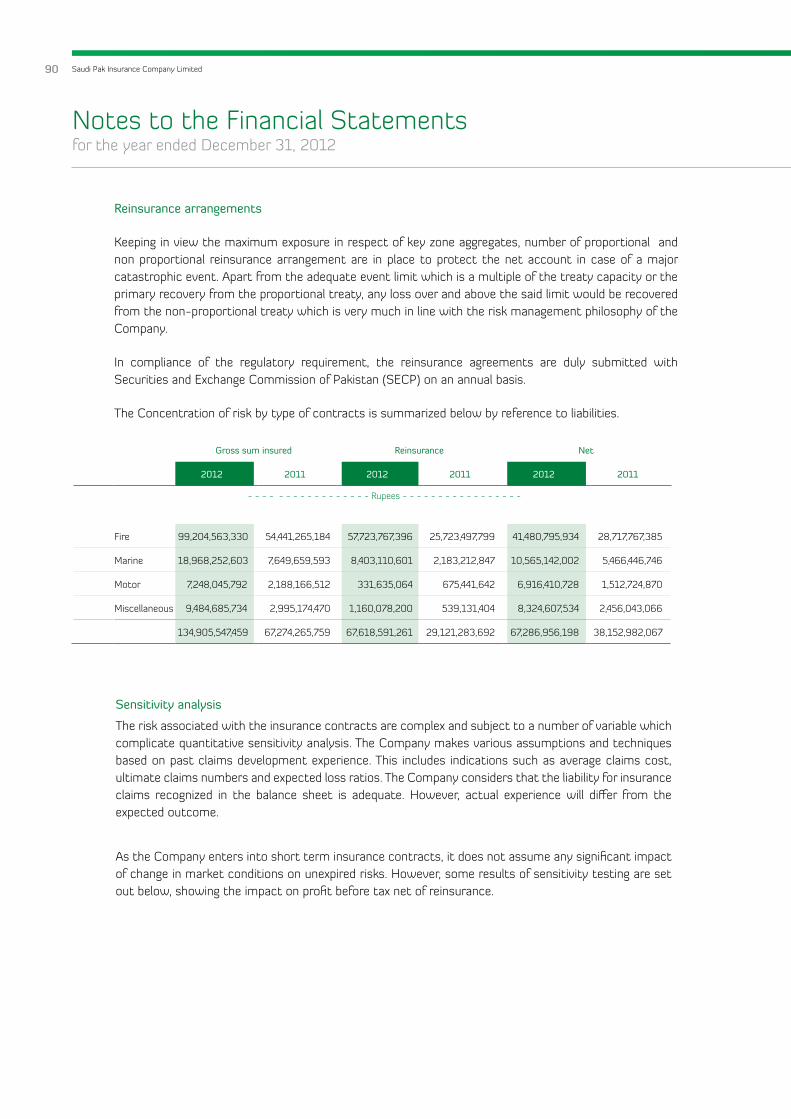
90 Saudi Pak Insurance Company Limited
Sensitivity analysis
The risk associated with the insurance contracts are complex and subject to a number of variable which complicate quantitative sensitivity analysis. The Company makes various assumptions and techniques based on past claims development experience. This includes indications such as average claims cost, ultimate claims numbers and expected loss ratios. The Company considers that the liability for insurance claims recognized in the balance sheet is adequate. However, actual experience will differ from the expected outcome.
As the Company enters into short term insurance contracts, it does not assume any significant impact of change in market conditions on unexpired risks. However, some results of sensitivity testing are set out below, showing the impact on profit before tax net of reinsurance.
Notes to the Financial Statementsfor the year ended December 31, 2012
Gross sum insured Reinsurance Net
2012 2011 2012 2011 2012 2011
- - - - - - - - - - - - - - - - - Rupees - - - - - - - - - - - - - - - - -
Fire 99,204,563,330 54,441,265,184 57,723,767,396 25,723,497,799 41,480,795,934 28,717,767,385
Marine 18,968,252,603 7,649,659,593 8,403,110,601 2,183,212,847 10,565,142,002 5,466,446,746
Motor 7,248,045,792 2,188,166,512 331,635,064 675,441,642 6,916,410,728 1,512,724,870
Miscellaneous 9,484,685,734 2,995,174,470 1,160,078,200 539,131,404 8,324,607,534 2,456,043,066
134,905,547,459 67,274,265,759 67,618,591,261 29,121,283,692 67,286,956,198 38,152,982,067
Reinsurance arrangements
Keeping in view the maximum exposure in respect of key zone aggregates, number of proportional and non proportional reinsurance arrangement are in place to protect the net account in case of a major catastrophic event. Apart from the adequate event limit which is a multiple of the treaty capacity or the primary recovery from the proportional treaty, any loss over and above the said limit would be recovered from the non-proportional treaty which is very much in line with the risk management philosophy of the Company.
In compliance of the regulatory requirement, the reinsurance agreements are duly submitted with Securities and Exchange Commission of Pakistan (SECP) on an annual basis.
The Concentration of risk by type of contracts is summarized below by reference to liabilities.

Annual Report | for the year ended December 31, 2012 91
Notes to the Financial Statementsfor the year ended December 31, 2012
Pre tax profit/(loss) Shareholders’ equity
2012 2011 2012 2011
- - - - - - - - -- - - - (Rupees) - - - - - - - - - - - - -
10% increase in loss
Fire (515,496) (76,595) (335,072) (49,786)
Marine (227,266) (19,572) (147,723) (12,722)
Motor (3,292,465) (1,058,375) (2,140,102) (687,944)
Miscellaneous 346,856 (488,150) 225,457 (317,298)
(3,688,371) (1,642,692) (2,397,441) (1,067,750)
10% decrease in loss
Fire 515,496 76,595 335,072 49,786
Marine 227,266 19,572 147,723 12,722
Motor 3,292,465 1,058,375 2,140,102 687,944
Miscellaneous (346,856) 488,150 (225,457) 317,298
3,688,371 1,642,692 2,397,441 1,067,750
Claims development tables
The following table shows the development of fire claims over a period of time. The disclosure goes back to the period when the earliest material claims arose for which there is still uncertainty about the amount and timing of the claims payments. For other classes of business the uncertainty about the amount and timings of claims payments is usually resolved within a year. Further claims with significant uncertainties are not outstanding as at December 31, 2012.
Analysis on gross basis
Accident year 2009 2010 2011 2012 Total
- - - - - - - - - - - - - - Rupees - - - - - - - - - - - - - - -
Estimate of ultimate claims cost
At end of accident year 71,107,481 44,778,859 21,156,298 52,312,773 189,355,411
One year later 66,627,526 20,594,452 13,519,664 - 100,741,642
Two years later 28,541,423 11,991,196 - - 40,532,619
Three years later 26,686,621 - - - 26,686,621
Estimate of cumulative claims 192,963,051 77,364,507 34,675,962 52,312,773 357,316,293
Cumulative payments to date (170,989,586) (65,697,828) (32,361,988) (52,086,738) (321,136,140)
Liability recognized in the balance sheet 21,973,465 11,666,679 2,313,974 226,035 36,180,153
92 Saudi Pak Insurance Company Limited
Notes to the Financial Statementsfor the year ended December 31, 2012
Mian M.A. Shahid Adnan Afridi Sheikh Aftab Ahmed Syed Ammer Ali Zaidi Chief Executive Officer Chairman Director Director
30 CAPITAL MANAGEMENT
The Company’s objectives when managing capital are to safeguard the Company’s ability to continue as the going concern in order to provide returns for share holders and benefit for other stakeholders and to maintain an optimal capital structure to reduce the cost of capital. In order to maintain or adjust the capital structure, the Company may adjust the amount of dividend to shareholders out of future profit, issue new shares and obtain new financing facilities. Further the Company meets the minimum paid-up capital requirements as required by Securities and Exchange Commission of Pakistan.
31 RECLASSIFICATION AND REARRANGEMENT
Following comparative figures have been reclassified and rearranged wherever necessary for the purpose of better presentation.
From ToAmount
in Rupees
Staff retirement gratuity Other creditors and accruals Deferred Liabilities 944,644
32 DATE OF AUTHORIZATION FOR ISSUE
These financial statements were authorized for issue in the Board of Directors meeting held onMarch 28, 2013.

Annual Report | for the year ended December 31, 2012 93
Karachi Zone
1. Central Office
2nd Floor, State Life Building
No.2-A, Wallace Road,
Karachi.
Ph: 021-32418430,
Fax: 021-32417885
2. Wallace Road Branch,
2nd Floor, State Life Building,
No.2-A, Wallace Road,Karachi.
Ph: 021-32418434
Fax: 021-32417885
3. M.A. Jinnah Road Branch
5th Floor, State Life Building # 6,
Habib Square, M.A. Jinnah Road,
Karachi.
Ph: 021-32415212-32413793-
32416918
Fax: 021-32410944
4. Shahrah-E-Faisal Branch
Suit no.504, 5th Floor, Caesar,s
Tower, National I.T Park,
Shahrah-e-Faisal, Karachi
Ph: 021-32783766-7
Fax: 021-32783768
5. Panorama Centre Branch
Office No. 302-A, Panoprama
Centre 2, Raja ghazanfer Ali Road,
Karachi.
Ph: 021-5655248, 5631178,
Fax: 021-5214682
6. Europa Centre Branch,
3rd Floor, 303-Europa Centre,
No.2, Raja Ghazanfer Ali Khan
Road, Saddar Karachi.
Ph: 021-32218975, 32636179,
Fax # 021-32218974
7. Hyderabad Branch
Mezzanine Floor, Mohsin Plaza,
upper KASB bank, Risala Road,
Hyderabad.
Ph: 022-2780770-2780603,
Fax: 022-2780765
Lahore Zone
8. Brandreth Road Branch
Room No. 215, 2nd Floor,
Shahzadi Rafaqat Market,
83-Brandreth Road, Lahore.
Ph: 042-37381566, 37381577,
Fax: 37672619
9. DHA Branch Lahore
1st Floor, Plaza No. 51-T, Phase II
Commercial, D.H.A Lahore-Cant.
Ph: 042-35707745
10. Empress Tower Brance
Suite No. 14, 1st Floor,
Empress Tower,
Lahore.
Ph: 042-36297548, 36297550
Fax: 042-36297549
11. Sharja Centre Branch
2nd Floor, Sharja Centre,
62-Shadman Market,
Lahore.
Ph: 0423634420
Fax: 042-3634421
12. Corporate Office
98 C.M.A, Colony Abid Majeed
Road, Lahore Cantt.
Ph: 36685023-4
Fax: 36685021
13. Eden Centre Branch
Eden Centre, 3rd floor,
Office No.303, Jail Road Branch,
Lahore.
Ph: 042-37500620-23
14. Raja Chamber Branch
Suit No.10, 11 3rd Floor
Raja Chamber, Mozang Chowk,
Shahrah-e- Fatima Jinnah,
Lahore.
Ph: 042-37521815, 37521816
15. Lahoer Branch
Office Address: 2nd Floor,
Khursheed Plaza, 10 Abbot
Road, Lahore.
Ph: 042-36364420-21
Fax: 042-36278917
Islamabad Offices
16. Islamabad Branch
Senior General Manager
Saudi Pak Insurance Co., Ltd.,
10th Floor, Saudi Pak Tower
61/A, Jinnah Avenue, Blue Area
Islamabad.
Ph: 051-2800352, 2800326,
(Direct) 2800351
Fax: 051-2800356
17. I-8 Markaz Branch,
Office No. 2 & 3 , 2nd Floor, M.B
City Mall, I-8 Markaz,
Islamabad.
Ph: 051- 4864591-92
Fax: 051-4864593
18. Blue Area Branch
106, 1st Floor, Dosal Arcade,
Jinnah Avenue, Blue Area,
Islamabad.
Ph: 051-2272888
Fax: 051-2272999
Our Network

94 Saudi Pak Insurance Company Limited
Our Network
19. F-10 Markaz Branch
Office # 304, 305, 3rd Floor,
Capital Business centre, F-10
Markaz, Islamabad.
Ph: 051-2809580-82
Fax: 051-2809583
20. Rawalpindi Branch
2nd Floor, Century Tower,
Opposite State Life Building,
The Mall, Rawalpindi.
Ph: 051-5564773-4
Other City Branches
21. Multan Branch
Room No. 3, 3rd Floor,
Trust Plaza, L.M.Q Road,
Multan.
Ph: 061-4579073-4
Fax: 061-4579075
22. Faisalabad Branch,
2nd Floor, Bilal Plaza, Liaquat
Road, Faisalabad.
Ph: 041-2605688,
2605788-89
Fax: 041-2605689
23. Sub - Office Faisalabad Branch
Room No.14, 15, 2nd Floor,
Taj Plaza, Kotwali Road,
Faisalabad.
Ph No: 041-2644581
24. Sialkot Branch
1st Floor, Saeed Centre, Iqbal
Town Defence Road, Sialkot.
Ph: 052-3572891-96
Fax: 052-3572895
25. Gujrat Branch
Shehroz Plaza, Near Sultan
Public school, G.T Road Gujrat.
Ph: 053-3514094
Fax: 053-3514095
26. Mirpur, Azad Kashmir, Branch
Al- Rahi square, sector C-1,
Mirpur Azad Kashmir.
Ph: 05827-452152
Fax: 05827-452153
27. Gujranwala Branch
Opposite general Bus Stand,
Near P.S.O Petrol Pump,
G.T Road, Gujranwala.
Ph: 055-3842948
28. Peshawar Branch
Deens Trade Centre,
3rd Floor, Room No. 266
Peshawar Cantt.
Ph: 091-5603257
Fax: 091-5603220
29. Jehlum Branch
Flat No.8, soldier Plaza, Civil
Lines, Jehlum.
Ph: 0544-626171

Notes

Notes

www.saudipakinsurance.com.pk
Annual Report | for the year ended December 31, 2012
GROWING VALUES
SAUDI PAK INSURANCE COMPANY LIMITED
Head Office:1ST Floor, 6-D, Upper Mall, Lahore. T: (92-42) 35776561-64F: (92-42) 35776560E: [email protected]
Concept, Design & Printed by: Al-Imran www.alimranprinters.com