spil march-11 ir usd
TRANSCRIPT

8/6/2019 SPIL March-11 IR USD
http://slidepdf.com/reader/full/spil-march-11-ir-usd 1/39
Creating Lasting
ValueInvestor Presentation- March 2011

8/6/2019 SPIL March-11 IR USD
http://slidepdf.com/reader/full/spil-march-11-ir-usd 2/39
Disclaimer
Except for the historical information contained herein, statements in this
presentation and the subsequent discussions, which include words or phrases such
as “will”, “aim”, “will likely result”, “would”, “believe”, “may”, “expect”, “will
continue”, “anticipate”, “estimate”, “intend”, “plan”, “contemplate”, “seek to”,
“future”, “objective”, “goal”, “likely”, “project”, “should”, “potential”, “will pursue”
and similar expressions or variations of such expressions may constitute "forward-
looking statements". These forward-looking statements involve a number of risks,
uncertainties and other factors that could cause actual results to differ materiallyfrom those suggested by the forward-looking statements. These risks and
uncertainties include, but are not limited to our ability to successfully implement our
strategy, our growth and expansion plans, obtain regulatory approvals, our
provisioning policies, technological changes, investment and business income, cash
flow projections, our exposure to market risks as well as other risks. Sun
Pharmaceutical Industries Limited does not undertake any obligation to update
forward-looking statements to reflect events or circumstances after the date thereof.
8/6/2019 SPIL March-11 IR USD
http://slidepdf.com/reader/full/spil-march-11-ir-usd 3/39
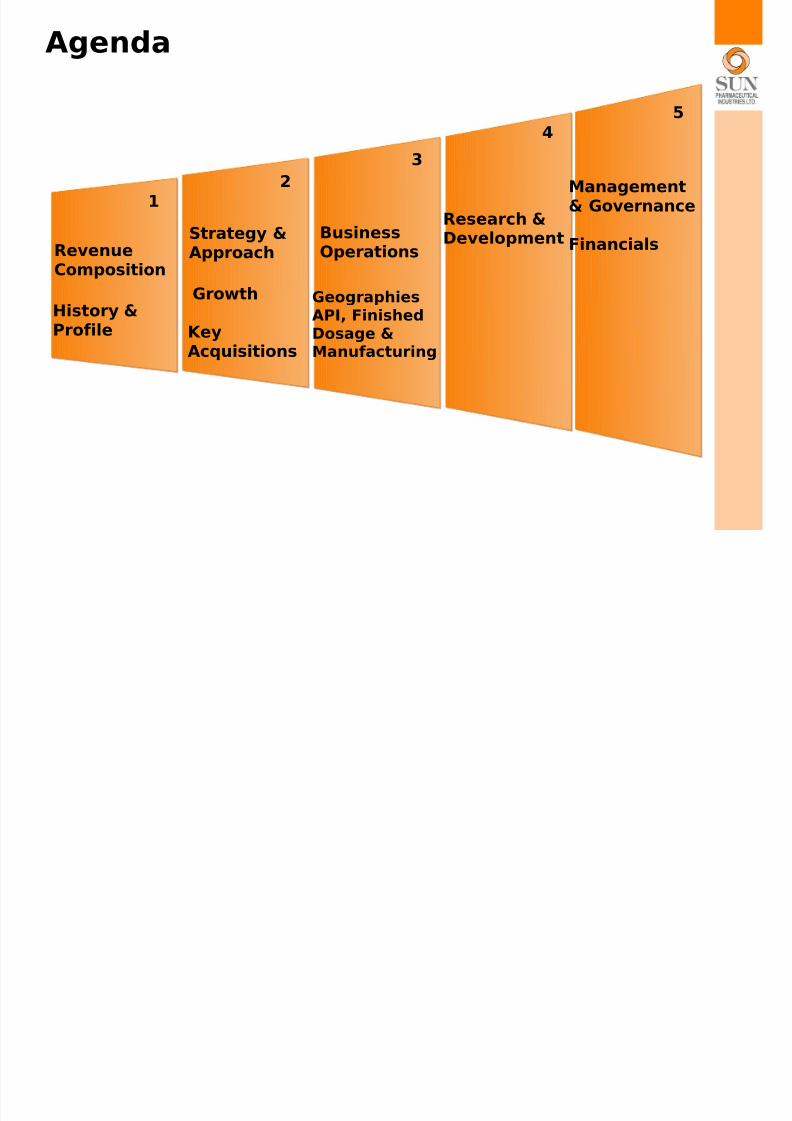
Agenda
RevenueComposition
1
Strategy &Approach
History &Profile
Growth
KeyAcquisitions
BusinessOperations
GeographiesAPI, FinishedDosage &Manufacturing
Research &Development
Management& Governance
Financials
2
3
4
5

8/6/2019 SPIL March-11 IR USD
http://slidepdf.com/reader/full/spil-march-11-ir-usd 4/39
Agenda
Revenue
Composition
1
Strategy &Approach
History &Profile
Growth
KeyAcquisitions
BusinessOperations
GeographiesAPI, FinishedDosage &Manufacturing
Research &Development
Management& Governance
Financials
2
3
4
5
8/6/2019 SPIL March-11 IR USD
http://slidepdf.com/reader/full/spil-march-11-ir-usd 5/39
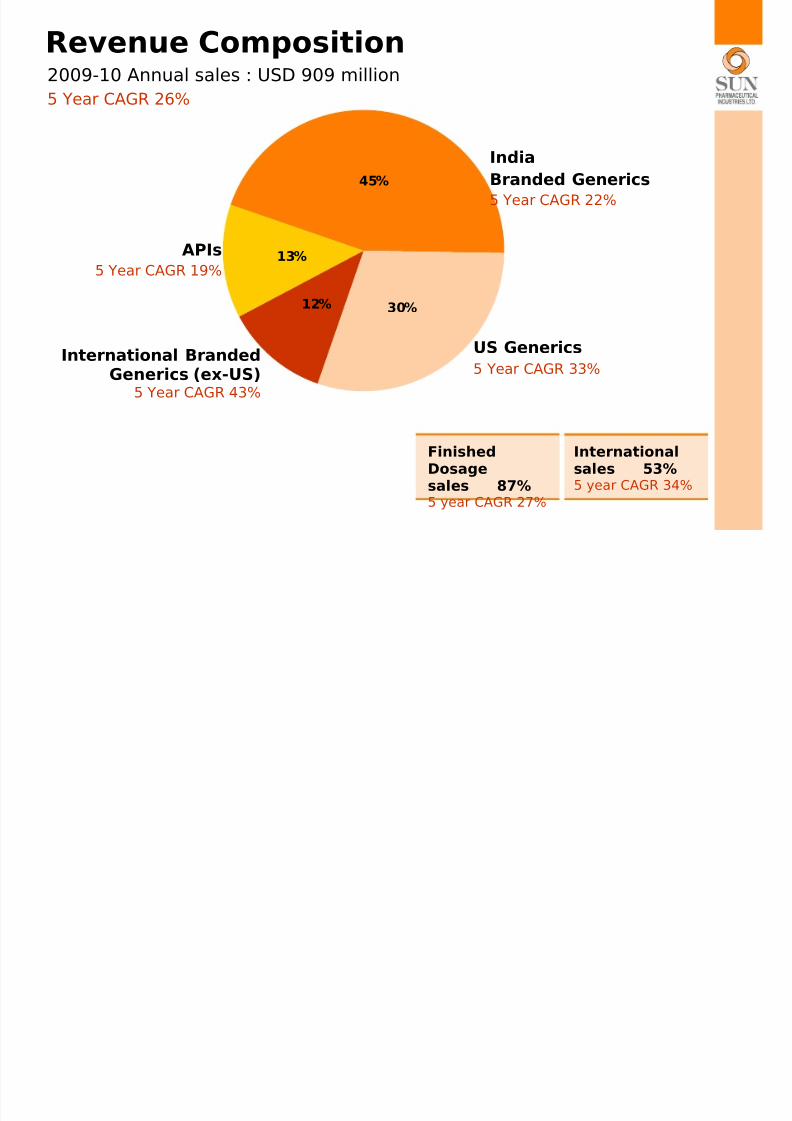
45%
30%12%
13%
Revenue Composition
India
Branded Generics
5 Year CAGR 22%
US Generics
5 Year CAGR 33%
APIs
5 Year CAGR 19%
International BrandedGenerics (ex-US)
5 Year CAGR 43%
FinishedDosagesales 87%5 year CAGR 27%
Internationalsales 53%5 year CAGR 34%
2009-10 Annual sales : USD 909 million
5 Year CAGR 26%
8/6/2019 SPIL March-11 IR USD
http://slidepdf.com/reader/full/spil-march-11-ir-usd 6/39
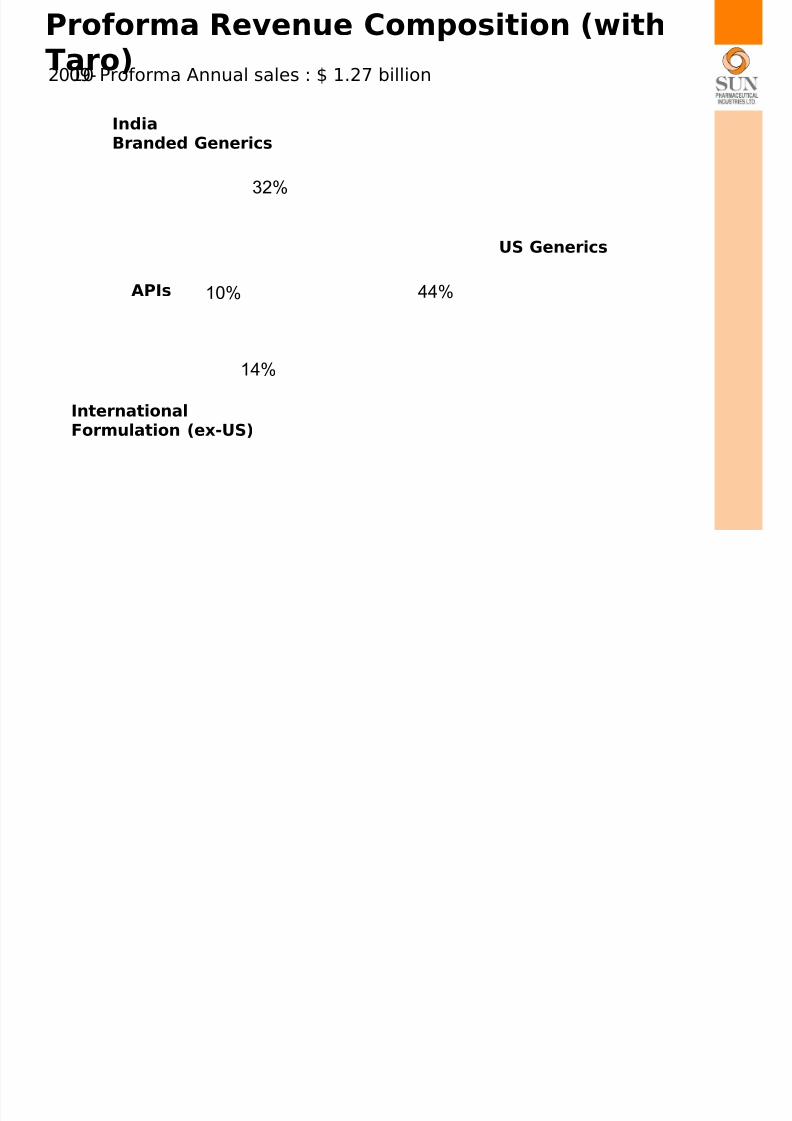
Proforma Revenue Composition (withTaro)2009-10 Proforma Annual sales : $ 1.27 billion
44%
32%
10%
14%
InternationalFormulation (ex-US)
APIs
IndiaBranded Generics
US Generics
8/6/2019 SPIL March-11 IR USD
http://slidepdf.com/reader/full/spil-march-11-ir-usd 7/39
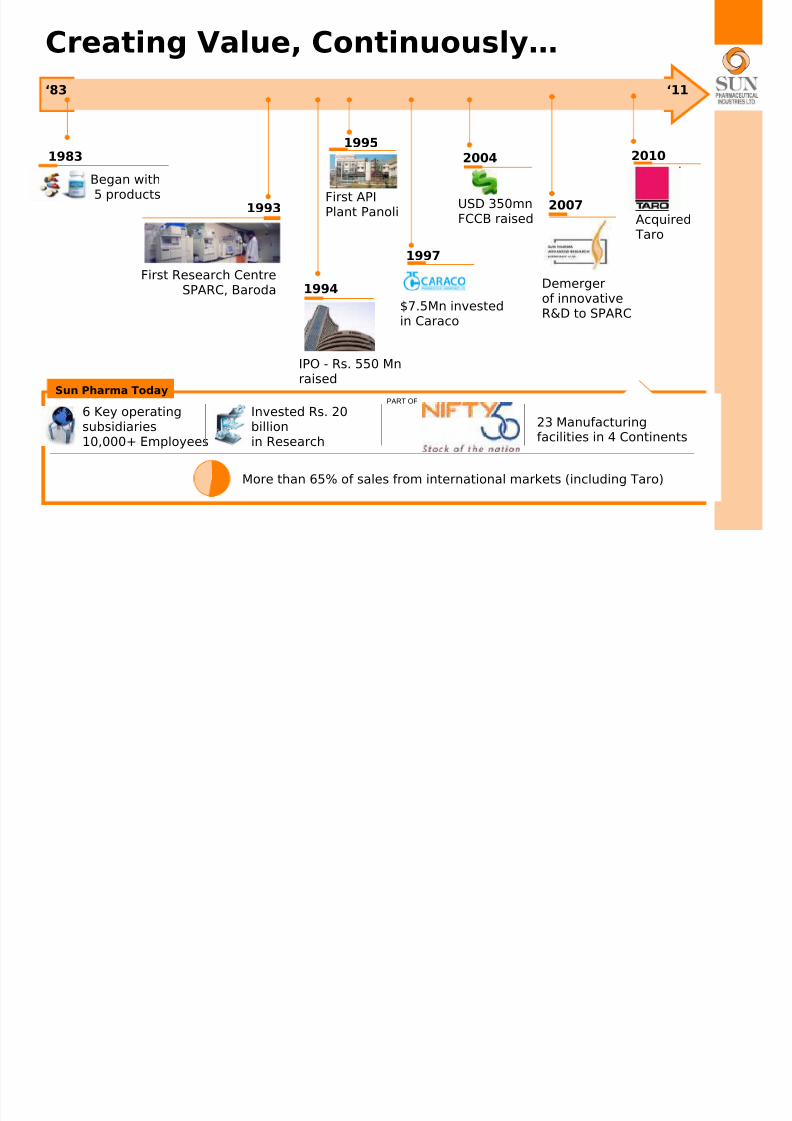
Creating Value, Continuously…
1983
Began with5 products
1993
First Research CentreSPARC, Baroda 1994
IPO - Rs. 550 Mnraised
1995
First APIPlant Panoli
1997
$7.5Mn investedin Caraco
2004
USD 350mnFCCB raised
2007
Demergerof innovativeR&D to SPARC
6 Key operatingsubsidiaries10,000+ Employees
Invested Rs. 20billionin Research
More than 65% of sales from international markets (including Taro)
Sun Pharma Today
‘83 ‘11
23 Manufacturingfacilities in 4 Continents
PART OF
2010
Acquired Taro
8/6/2019 SPIL March-11 IR USD
http://slidepdf.com/reader/full/spil-march-11-ir-usd 8/39
Agenda
Revenue
Composition
1
Strategy &Approach
History &Profile
Growth
KeyAcquisitions
BusinessOperations
GeographiesAPI, FinishedDosage &Manufacturing
Research &Development
Management& Governance
Financials
2
34
5

8/6/2019 SPIL March-11 IR USD
http://slidepdf.com/reader/full/spil-march-11-ir-usd 9/39
Strategy and Approach
Create sustainablerevenue streams
• Focus: Chronic therapies
• Differentiation:
Technically complex
products• Speed to market
Seek cost leadership
• Vertical integration :
Development through
Manufacturing (API and
Finished Dosage) to
Marketing
• Optimize operational costs
Balance profitabilityand investments for
future• Acquisitions yielding high ROI
• Development of complex generics

8/6/2019 SPIL March-11 IR USD
http://slidepdf.com/reader/full/spil-march-11-ir-usd 10/39
Growing SteadilyConsistent top-line and bottom-line growth;
continuing the trend despite increasing size
Net Sales Net Profit
(Figures in USD million)
264
88
5 0
3 5 0
00 -0 1 0 1- 02 0 2- 03 0 3- 04 04 -0 5
5
1 0 0
893
302
1 0 0
1 ,
2 0 0
0 5- 06 0 6- 07 0 7- 08 0 8- 09 0 9- 10
0
5 0 0
100
19
0
1 2 0
95-96 96-97 97-98 98-99 99-00
0
2 5
8/6/2019 SPIL March-11 IR USD
http://slidepdf.com/reader/full/spil-march-11-ir-usd 11/39
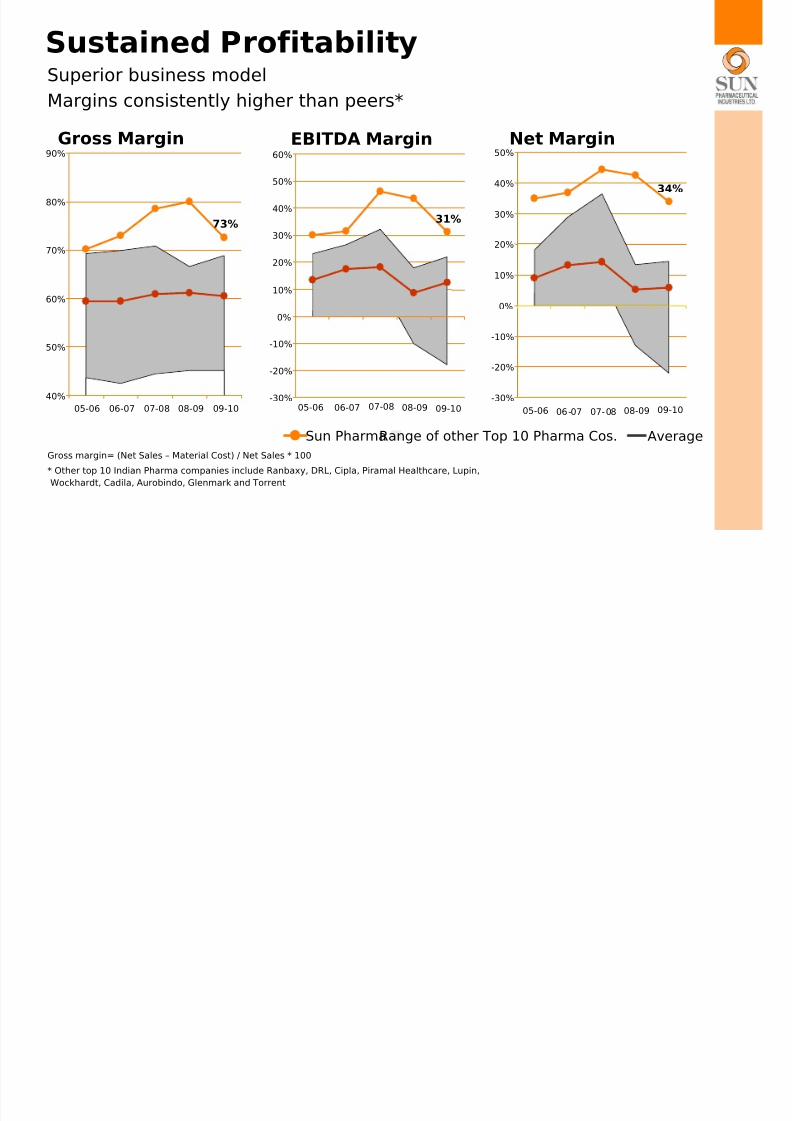
Sustained ProfitabilitySuperior business model
Margins consistently higher than peers*
Sun PharmaRange of other Top 10 Pharma Cos. Average
Gross margin= (Net Sales – Material Cost) / Net Sales * 100
* Other top 10 Indian Pharma companies include Ranbaxy, DRL, Cipla, Piramal Healthcare, Lupin,
Wockhardt, Cadila, Aurobindo, Glenmark and Torrent
Net Margin
34%
-30%
-20%
-10%
0%
10%
20%
30%
40%
50%
05-06 06-07 07-08 08-09 09-10
EBITDA Margin
31%
-30%
-20%
-10%
0%
10%
20%
30%
40%
50%
60%
05-06 06-07 07-08 08-09 09-10
Gross Margin
73%
40%
50%
60%
70%
80%
90%
05-06 06-07 07-08 08-09 09-10
8/6/2019 SPIL March-11 IR USD
http://slidepdf.com/reader/full/spil-march-11-ir-usd 12/39
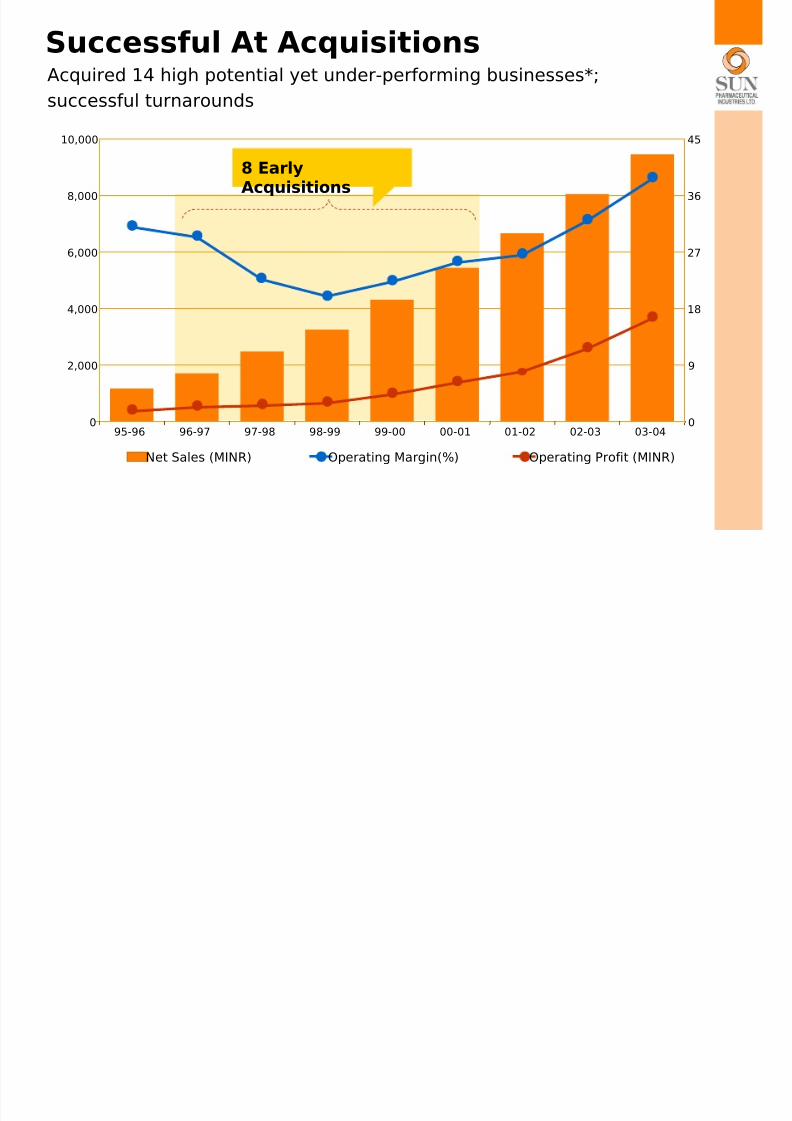
Successful At AcquisitionsAcquired 14 high potential yet under-performing businesses*;
successful turnarounds
Net Sales (MINR) Operating Margin(%) Operating Profit (MINR)
0
2,000
4,000
6,000
8,000
10,000
95-96 96-97 97-98 98-99 99-00 00-01 01-02 02-03 03-040
9
18
27
36
45
8 EarlyAcquisitions

8/6/2019 SPIL March-11 IR USD
http://slidepdf.com/reader/full/spil-march-11-ir-usd 13/39
Key Acquisitions & Rationale Year Acquisition Country Rationale
2010 Acquired Taro PharmaceuticalIndustries Ltd.
Israel Dermatology & Topical ProductManufacturing Plant at Israel &Canada
2009 Caraco acquired some products of Forest’s Inwood business
US Increased generic product offerings
2008 Acquired Chattem Chemicals, Inc. Tennessee, US Import registration with DEA, API Plantapproved by DEA in Tennessee, US
2005 Assets of Able labs New Jersey, US Dosage form plant (NJ, US) and IP
2005 Formulation plant in Bryan Ohio, US Dosage form plant (Ohio, US)
2005 Acquired ICN Hungary Hungary API and dosage form plant (Hungary)
2004 Womens Health Brands US Brands in womens health (US)
2004 Merged Phlox Pharma Baroda, India API Plant
2000 Merged Pradeep DrugCompany Ltd (PDCL)
Chennai, India API Plant
1999 Merged Milmet Labs India Ophthalmology brands
1998 Brands from Natco India Respiratory brands1997 Acquired Caraco Detroit, US Dosage form Plant
1997 Merged Tamilnadu DadhaPharmaceuticals Ltd (TDPL)
Chennai, India Gynecology and oncology brands; APIand dosage form plant
1996 Acquired MJ Pharma Halol, India Dosage form plant (now USFDAapproved)
1996 Acquired Gujarat Lyka Ankleshwar, India API plant

8/6/2019 SPIL March-11 IR USD
http://slidepdf.com/reader/full/spil-march-11-ir-usd 14/39
Agenda
Revenue
Composition
1
Strategy &Approach
History &Profile
Growth
KeyAcquisitions
BusinessOperations
GeographiesAPI, FinishedDosage &Manufacturing
Research &Development
Management& Governance
Financials
2
34
5

8/6/2019 SPIL March-11 IR USD
http://slidepdf.com/reader/full/spil-march-11-ir-usd 15/39
Creating Lasting Value - Investor Presentation15
India Branded Generics : Strong Base
• Market Share :
4.4%*
• Leadership in
chronic segment;
Top 3 in over 50% of
more than 500
brands
Neuro-Psychiatry
27%
Cardiology19%
Diabetology11%
Gastroenterology14%
Gynecology &
Urology- 7%
Musculo-Skeletal
& Pain- 5%
Antiasthamatic &Antiallergic- 5%
Opthalmology- 4%Others8%
Therapywise Break-up
* As per AWACS
8/6/2019 SPIL March-11 IR USD
http://slidepdf.com/reader/full/spil-march-11-ir-usd 16/39
Creating Lasting Value - Investor Presentation16
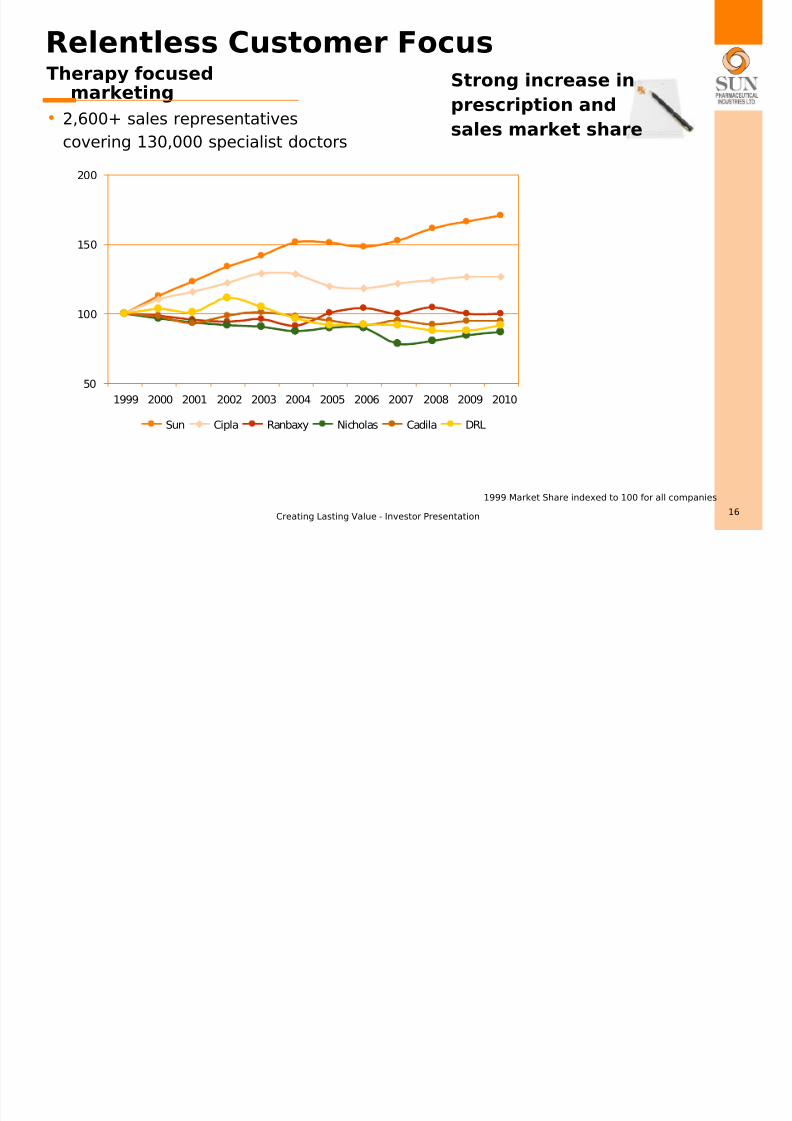
Relentless Customer Focus
1999 Market Share indexed to 100 for all companies
Therapy focusedmarketing
• 2,600+ sales representatives
covering 130,000 specialist doctors
Strong increase in
prescription and
sales market share
50
100
150
200
1999 2000 2001 2002 2003 2004 2005 2006 2007 2008 2009 2010
Sun Cipla Ranbaxy Nicholas Cadila DRL
8/6/2019 SPIL March-11 IR USD
http://slidepdf.com/reader/full/spil-march-11-ir-usd 17/39
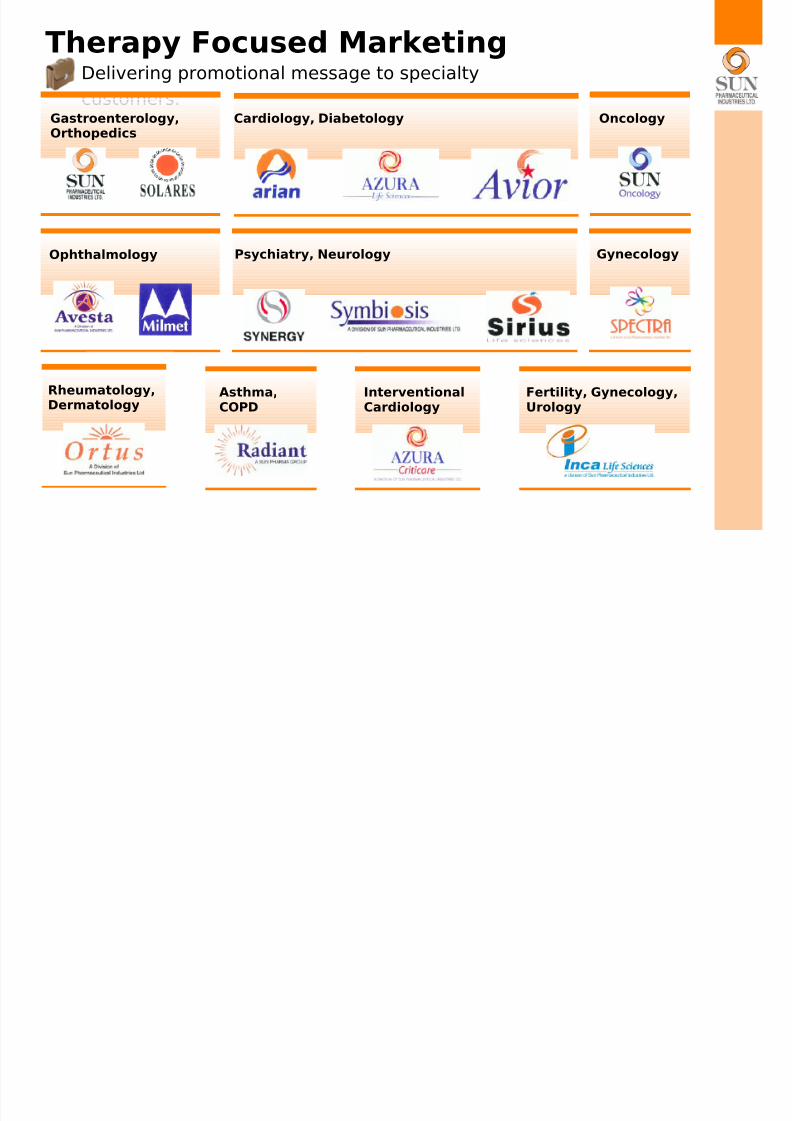
Therapy Focused MarketingDelivering promotional message to specialty
customers.Cardiology, DiabetologyGastroenterology,
Orthopedics
Oncology
Rheumatology,Dermatology
Asthma,COPD
InterventionalCardiology
Fertility, Gynecology,Urology
Psychiatry, Neurology GynecologyOphthalmology
8/6/2019 SPIL March-11 IR USD
http://slidepdf.com/reader/full/spil-march-11-ir-usd 18/39
Creating Lasting Value - Investor Presentation18
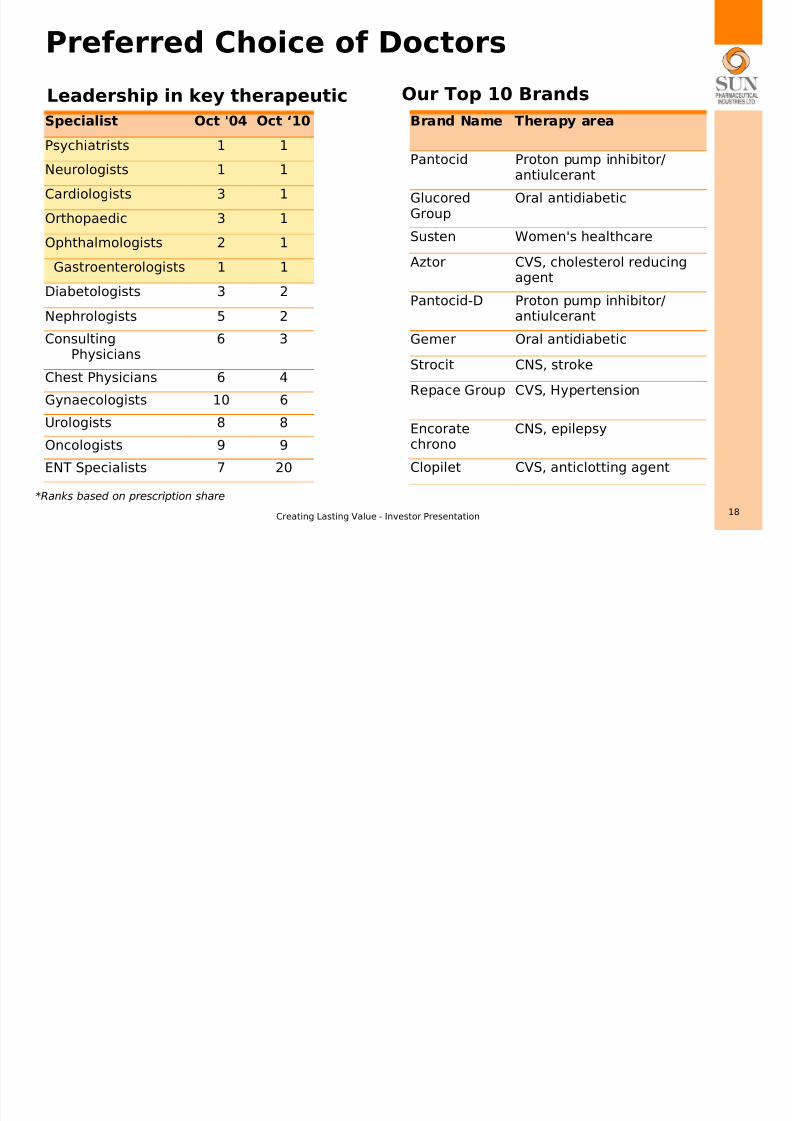
Preferred Choice of Doctors
Our Top 10 BrandsLeadership in key therapeutic
areas*Specialist Oct '04 Oct ‘10
Psychiatrists 1 1
Neurologists 1 1
Cardiologists 3 1
Orthopaedic 3 1
Ophthalmologists 2 1
Gastroenterologists 1 1
Diabetologists 3 2
Nephrologists 5 2
ConsultingPhysicians
6 3
Chest Physicians 6 4
Gynaecologists 10 6Urologists 8 8
Oncologists 9 9
ENT Specialists 7 20
Brand Name Therapy area
Pantocid Proton pump inhibitor/antiulcerant
GlucoredGroup
Oral antidiabetic
Susten Women's healthcare
Aztor CVS, cholesterol reducingagent
Pantocid-D Proton pump inhibitor/antiulcerant
Gemer Oral antidiabetic
Strocit CNS, stroke
Repace Group CVS, Hypertension
Encoratechrono
CNS, epilepsy
Clopilet CVS, anticlotting agent
*Ranks based on prescription share
8/6/2019 SPIL March-11 IR USD
http://slidepdf.com/reader/full/spil-march-11-ir-usd 19/39
Creating Lasting Value - Investor Presentation19
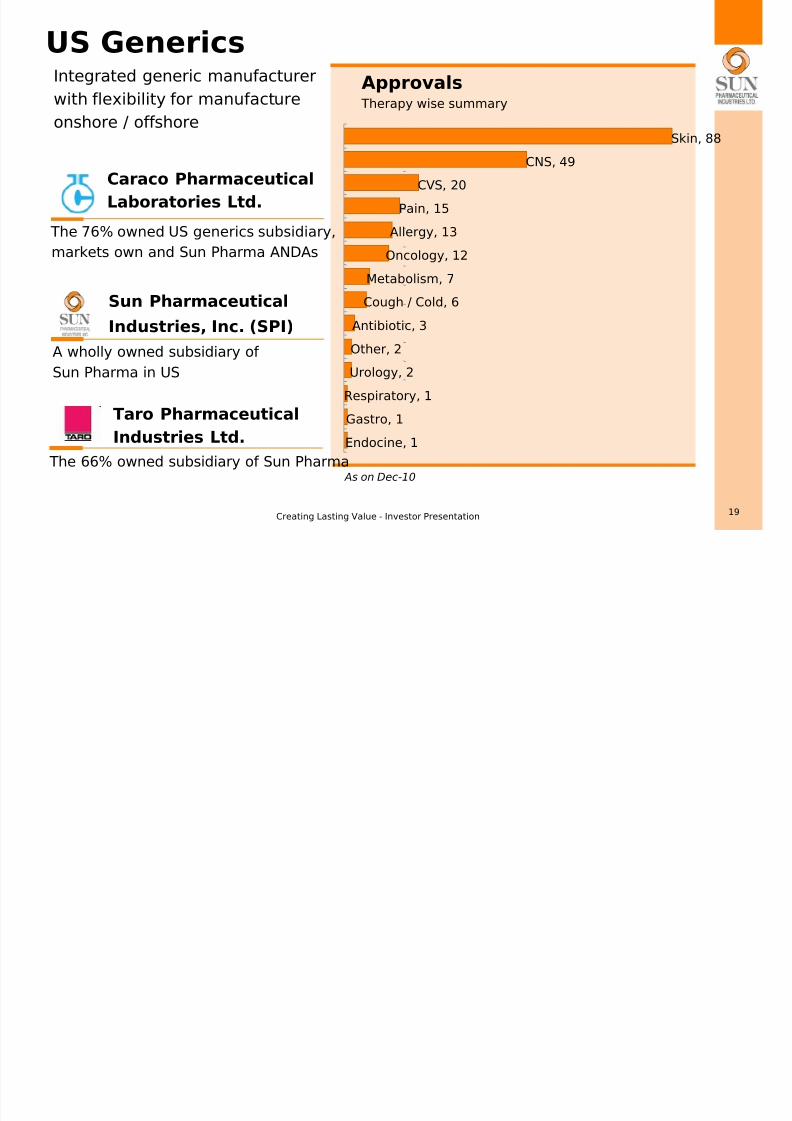
US GenericsIntegrated generic manufacturer
with flexibility for manufacture
onshore / offshore
The 76% owned US generics subsidiary,
markets own and Sun Pharma ANDAs
Sun Pharmaceutical
Industries, Inc. (SPI)
Caraco Pharmaceutical
Laboratories Ltd.
A wholly owned subsidiary of
Sun Pharma in US
Approvals Therapy wise summary
As on Dec-10
Taro Pharmaceutical
Industries Ltd.
The 66% owned subsidiary of Sun Pharma
Endocine, 1
Gastro, 1Respiratory, 1
Urology, 2
Other, 2
Antibiotic, 3
Cough / Cold, 6
Metabolism, 7
Oncology, 12
Allergy, 13
Pain, 15
CVS, 20
CNS, 49
Skin, 88
8/6/2019 SPIL March-11 IR USD
http://slidepdf.com/reader/full/spil-march-11-ir-usd 20/39
Creating Lasting Value - Investor Presentation20
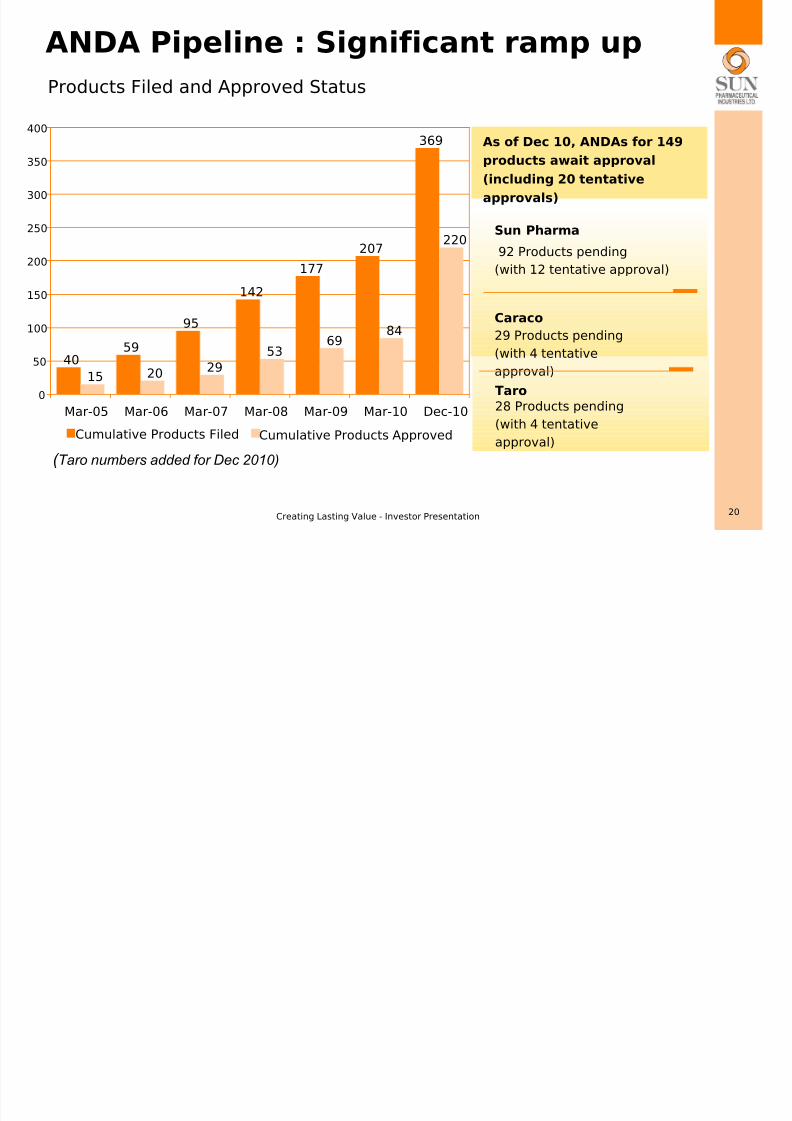
ANDA Pipeline : Significant ramp up
Products Filed and Approved Status
As of Dec 10, ANDAs for 149
products await approval
(including 20 tentative
approvals)
92 Products pending
(with 12 tentative approval)
Sun Pharma
29 Products pending
(with 4 tentative
approval)
Caraco
Taro
28 Products pending
(with 4 tentative
approval)
( Taro numbers added for Dec 2010)
4059
95
142
177
207
369
15 20 29
5369
84
220
0
50
100
150
200
250
300
350
400
Mar-05 Mar-06 Mar-07 Mar-08 Mar-09 Mar-10 Dec-10
Cumulative Products Filed Cumulative Products Approved
8/6/2019 SPIL March-11 IR USD
http://slidepdf.com/reader/full/spil-march-11-ir-usd 21/39
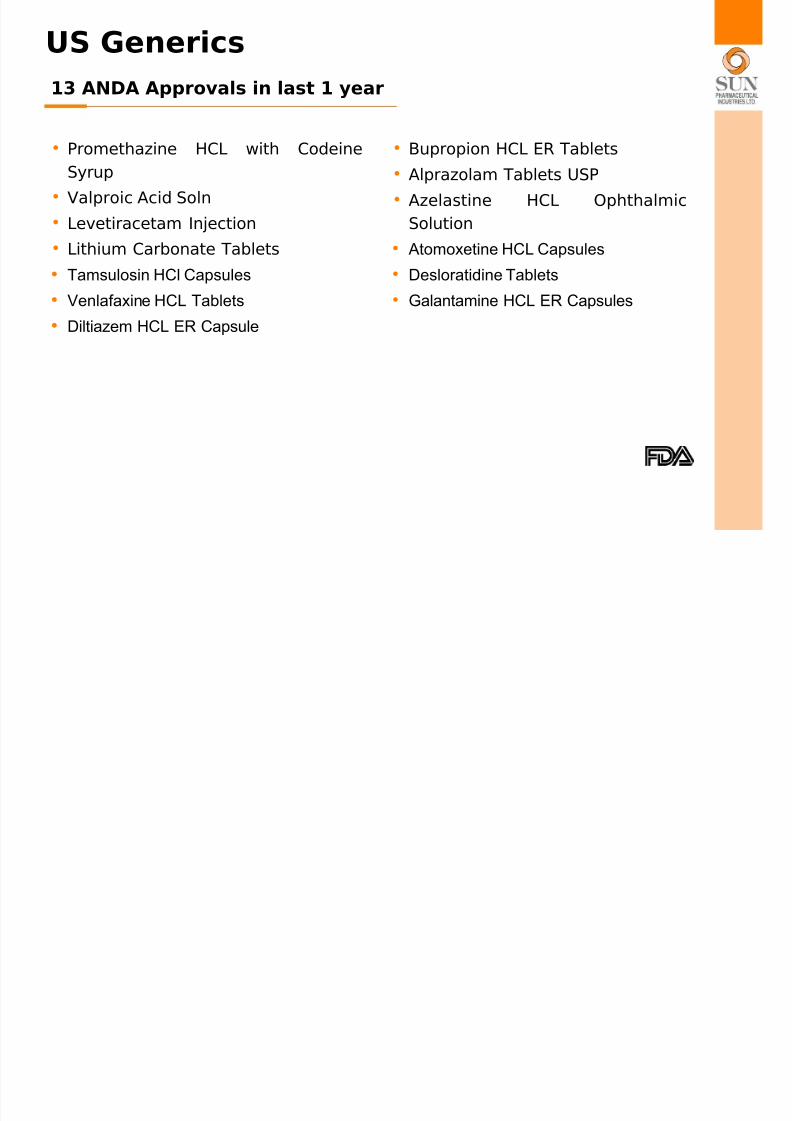
US Generics
• Promethazine HCL with Codeine
Syrup
• Valproic Acid Soln
• Levetiracetam Injection
• Lithium Carbonate Tablets
• Tamsulosin HCl Capsules
• Venlafaxine HCL Tablets
• Diltiazem HCL ER Capsule
13 ANDA Approvals in last 1 year
• Bupropion HCL ER Tablets
• Alprazolam Tablets USP
• Azelastine HCL Ophthalmic
Solution
• Atomoxetine HCL Capsules
• Desloratidine Tablets
• Galantamine HCL ER Capsules
8/6/2019 SPIL March-11 IR USD
http://slidepdf.com/reader/full/spil-march-11-ir-usd 22/39

8/6/2019 SPIL March-11 IR USD
http://slidepdf.com/reader/full/spil-march-11-ir-usd 23/39
Creating Lasting Value - Investor Presentation23
Europe Generic Markets
Plan to enter key
markets• Working on complex generic
products, including
injectables• Filings from Indian site
An API and Finished Dosage
manufacturing site in Hungarywith controlled substance
capacity
Focus Countries
8/6/2019 SPIL March-11 IR USD
http://slidepdf.com/reader/full/spil-march-11-ir-usd 24/39
Creating Lasting Value - Investor Presentation24
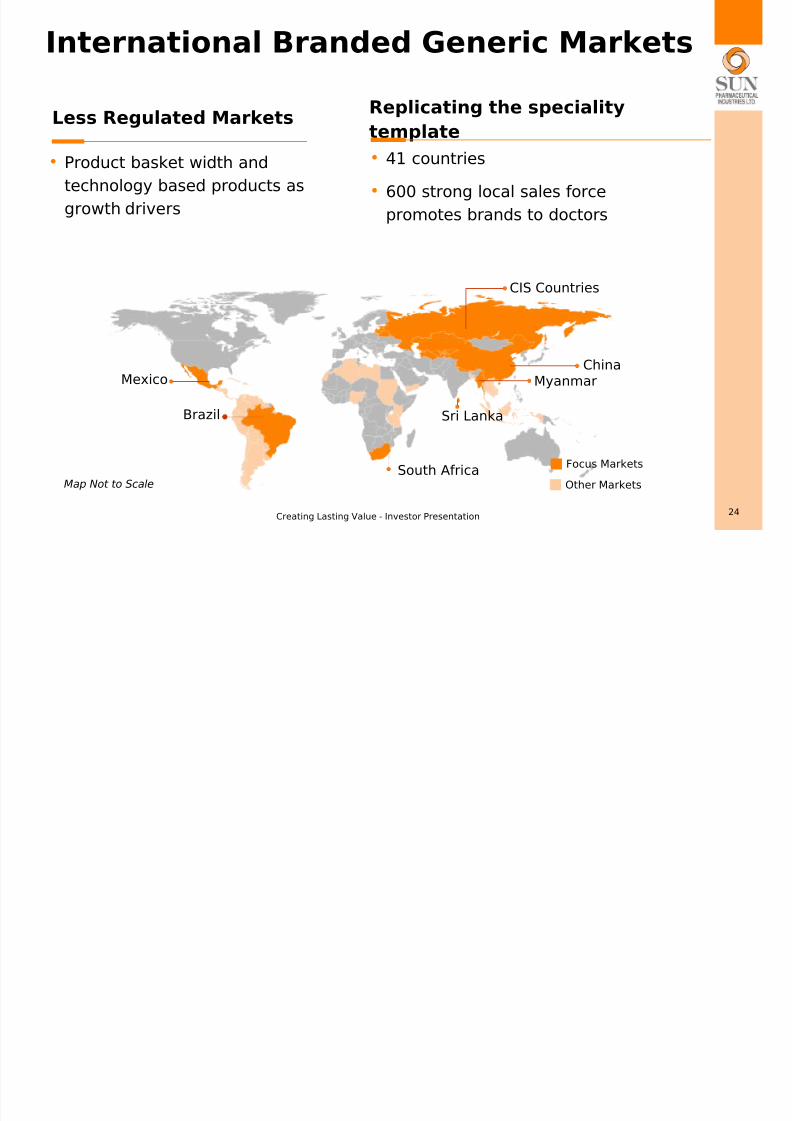
International Branded Generic Markets
Less Regulated Markets
• Product basket width and
technology based products as
growth drivers
Replicating the speciality
template• 41 countries
• 600 strong local sales force
promotes brands to doctors
CIS Countries
China
Sri Lanka
Map Not to Scale
Mexico
South AfricaOther Markets
Focus Markets
Brazil
Myanmar
i li
8/6/2019 SPIL March-11 IR USD
http://slidepdf.com/reader/full/spil-march-11-ir-usd 25/39
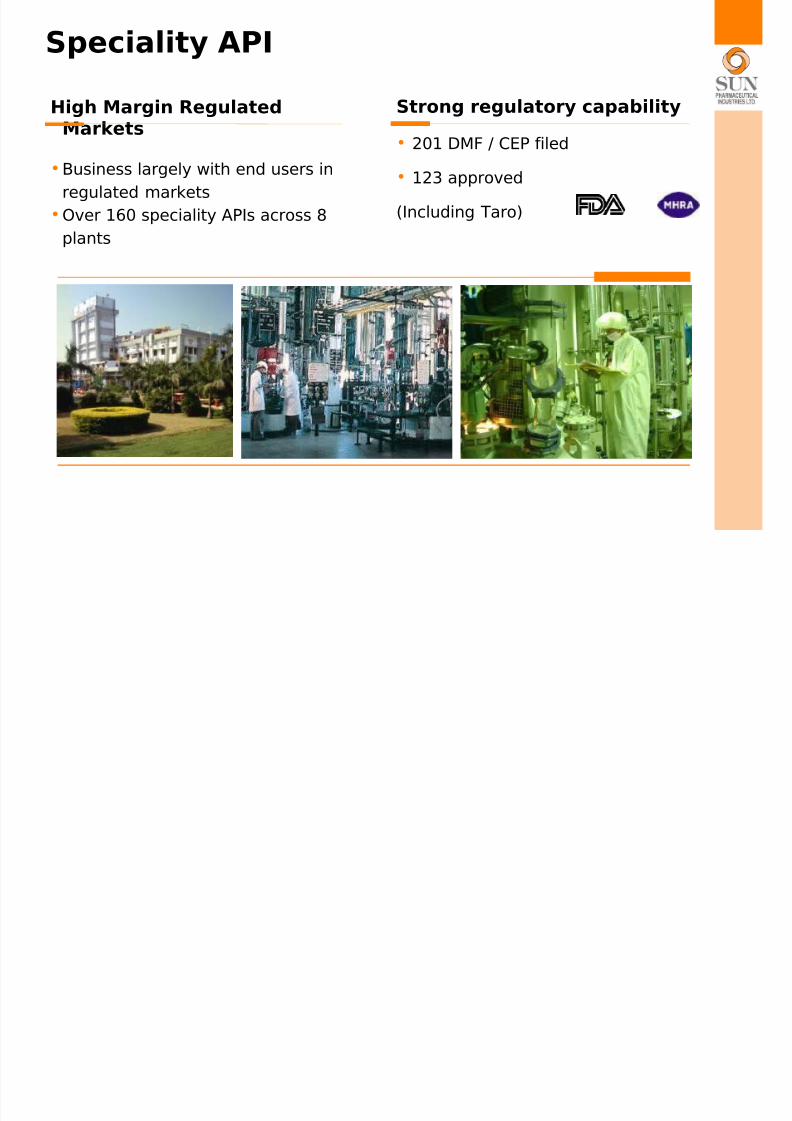
Speciality API
High Margin RegulatedMarkets
•Business largely with end users in
regulated markets
•Over 160 speciality APIs across 8
plants
Strong regulatory capability
• 201 DMF / CEP filed
• 123 approved
(Including Taro)
St R l t C bilit
8/6/2019 SPIL March-11 IR USD
http://slidepdf.com/reader/full/spil-march-11-ir-usd 26/39
Creating Lasting Value - Investor Presentation26
Strong Regulatory CapabilityInternational level quality processes and documentation
240
Integrated product dev and manufacturing
8/6/2019 SPIL March-11 IR USD
http://slidepdf.com/reader/full/spil-march-11-ir-usd 27/39
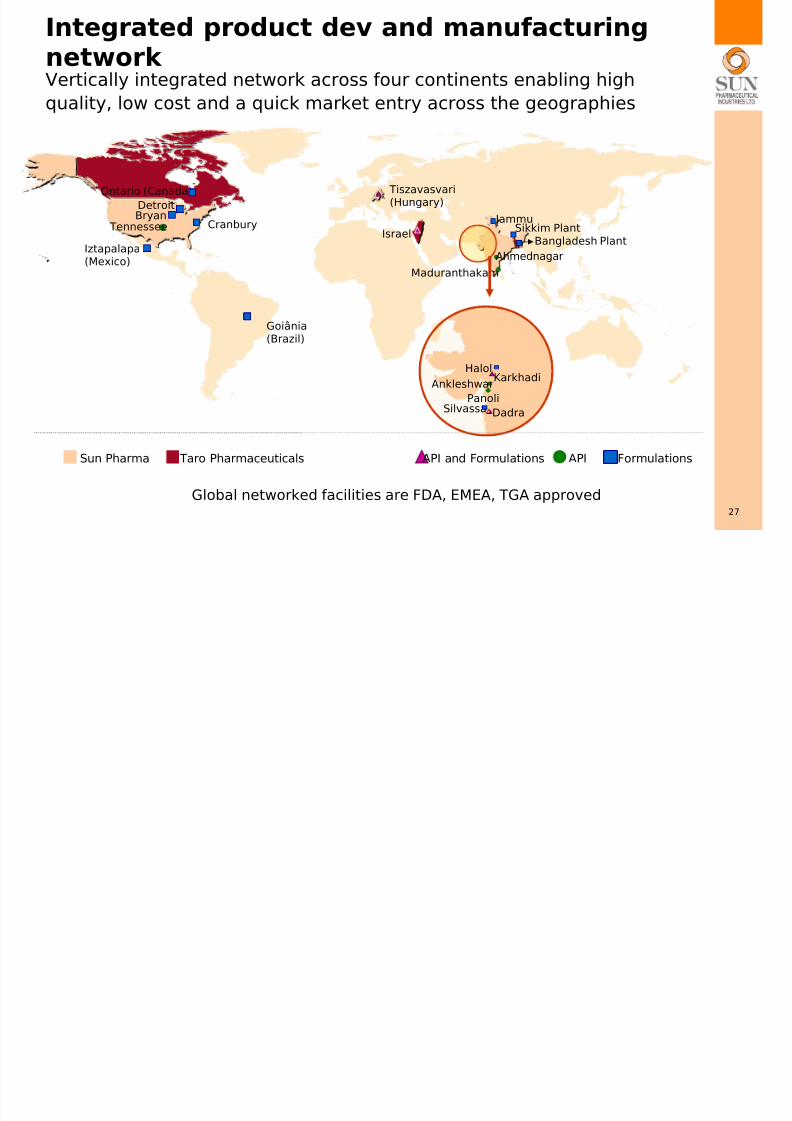
Integrated product dev and manufacturingnetwork
27
Vertically integrated network across four continents enabling high
quality, low cost and a quick market entry across the geographies
Halol
Ankleshwar
PanoliDadraSilvassa
Karkhadi
Bangladesh Plant
Ahmednagar
Maduranthakam
Sikkim Plant Jammu
Tiszavasvari(Hungary)
Goiânia(Brazil)
Iztapalapa(Mexico)
Israel
API and Formulations API Formulations
Global networked facilities are FDA, EMEA, TGA approved
Ontario (Canada)
CranburyBryan
Tennessee
Detroit
Taro PharmaceuticalsSun Pharma
Fi i h d D M f t i
8/6/2019 SPIL March-11 IR USD
http://slidepdf.com/reader/full/spil-march-11-ir-usd 28/39
Creating Lasting Value - Investor Presentation28
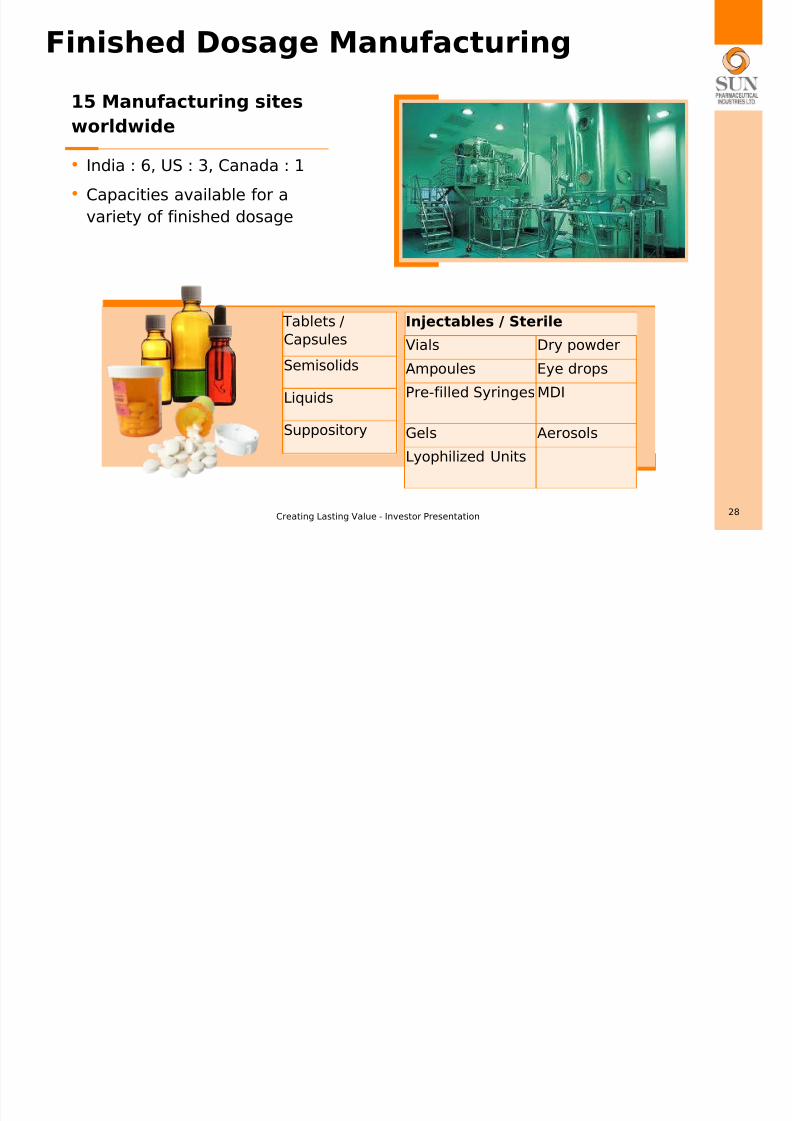
Finished Dosage Manufacturing
15 Manufacturing sites
worldwide
• India : 6, US : 3, Canada : 1
• Capacities available for a
variety of finished dosage
Tablets /
Capsules
Semisolids
Liquids
Suppository
Injectables / Sterile
Vials Dry powder
Ampoules Eye drops
Pre-filled SyringesMDI
Gels Aerosols
Lyophilized Units
API M f t i
8/6/2019 SPIL March-11 IR USD
http://slidepdf.com/reader/full/spil-march-11-ir-usd 29/39
Creating Lasting Value - Investor Presentation29
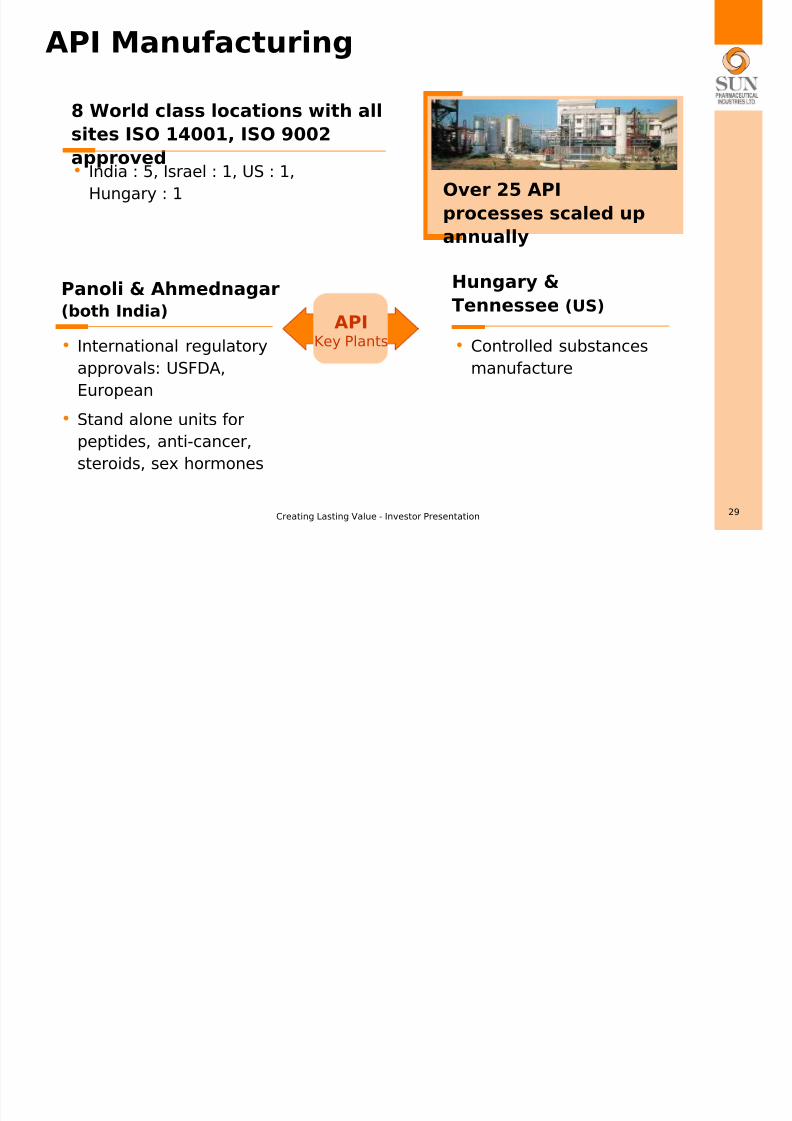
API Manufacturing
8 World class locations with all
sites ISO 14001, ISO 9002approved• India : 5, Israel : 1, US : 1,
Hungary : 1 Over 25 API
processes scaled up
annually
APIKey Plants
Panoli & Ahmednagar(both India)
• International regulatory
approvals: USFDA,
European
• Stand alone units for
peptides, anti-cancer,
steroids, sex hormones
Hungary &
Tennessee (US)
• Controlled substances
manufacture
Agenda

8/6/2019 SPIL March-11 IR USD
http://slidepdf.com/reader/full/spil-march-11-ir-usd 30/39
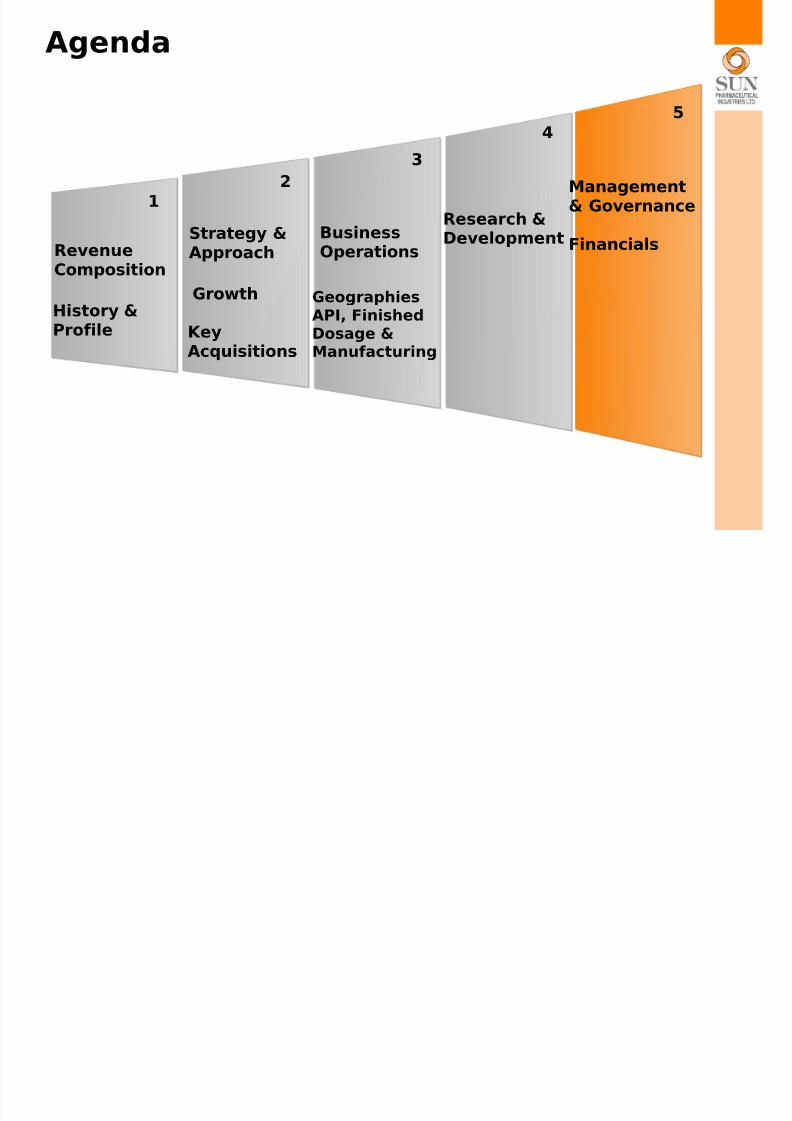
Agenda
Revenue
Composition
1
Strategy &Approach
History &Profile
Growth
KeyAcquisitions
BusinessOperations
GeographiesAPI, FinishedDosage &Manufacturing
Research &Development
Management& Governance
Financials
2
34
5
Research and Development
8/6/2019 SPIL March-11 IR USD
http://slidepdf.com/reader/full/spil-march-11-ir-usd 31/39
Creating Lasting Value - Investor Presentation31
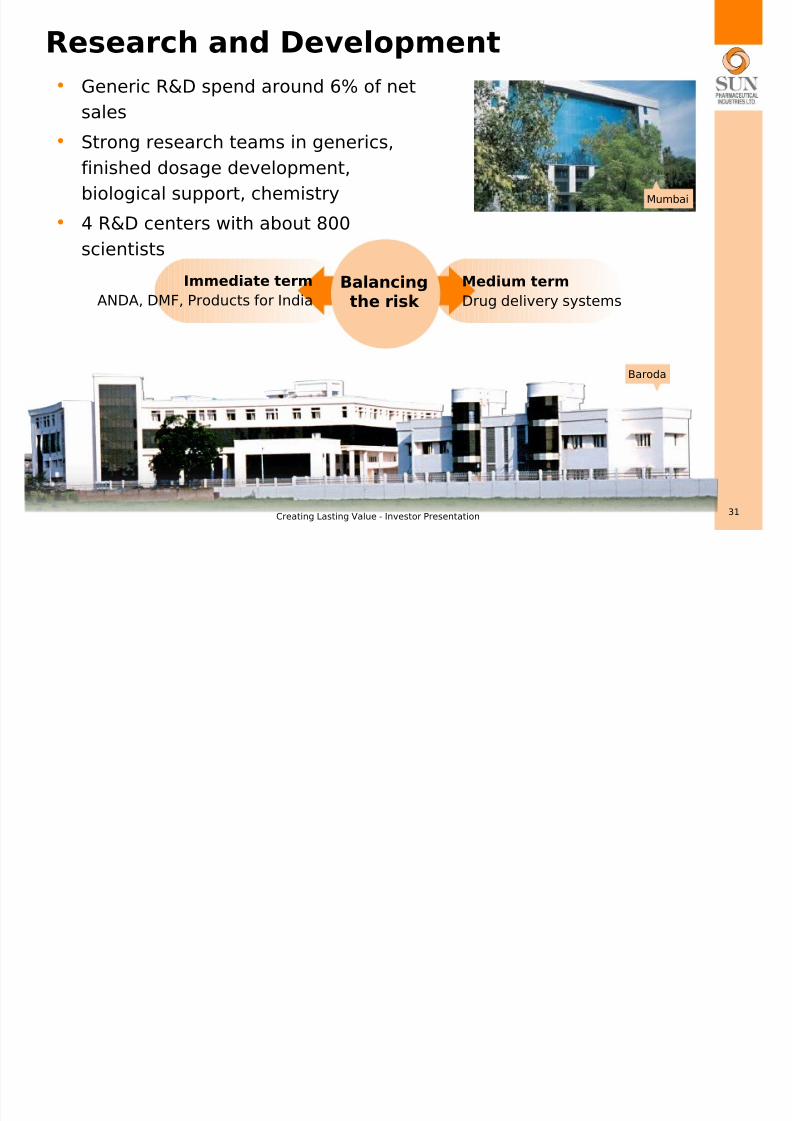
Research and Development
• Generic R&D spend around 6% of net
sales
• Strong research teams in generics,finished dosage development,
biological support, chemistry
• 4 R&D centers with about 800
scientists
Mumbai
Balancingthe risk
Medium term
Drug delivery systems
Immediate term
ANDA, DMF, Products for India
Baroda
Agenda

8/6/2019 SPIL March-11 IR USD
http://slidepdf.com/reader/full/spil-march-11-ir-usd 32/39
Agenda
Revenue
Composition
1
Strategy &Approach
History &Profile
Growth
KeyAcquisitions
BusinessOperations
GeographiesAPI, FinishedDosage &Manufacturing
Research &Development
Management& Governance
Financials
2
34
5
Corporate Governance

8/6/2019 SPIL March-11 IR USD
http://slidepdf.com/reader/full/spil-march-11-ir-usd 33/39
Corporate Governance
Our philosophy on corporate governance
envisages working towards high levels of transparency, accountability and consistent
value systems across all facets of operations
Committee chaired by Keki
Mistry comprises Hasmukh Shah
and
S. Mohanchand Dadha
Audit CommitteeEminent Independent Directors
Hasmukh Shah
Chairman Gujarat Gas
Former Chairman and
Managing Director,
IPCL
Keki Mistry
Vice Chairman and
CEO, HDFC
S. MohanchandDadha
Former Chairman &
Managing Director,
TDPL
Ashwin Dani Vice Chairman and
Managing Director,
Asian Paints Ltd.
Agenda
8/6/2019 SPIL March-11 IR USD
http://slidepdf.com/reader/full/spil-march-11-ir-usd 34/39
Agenda
Revenue
Composition
1
Strategy &Approach
History &Profile
Growth
KeyAcquisitions
BusinessOperations
GeographiesAPI, FinishedDosage &Manufacturing
Research &Development
Management& Governance
Financials
2
3
4
5
Shareholding Pattern

8/6/2019 SPIL March-11 IR USD
http://slidepdf.com/reader/full/spil-march-11-ir-usd 35/39
Creating Lasting Value - Investor Presentation35
Shareholding Patternas on Dec 31, 2010
• Rs 1,000 Invested
in the 1994 IPO is
currently worthmore than Rs.
174,000
• Earned dividend of
Rs. 5,000
Mutual Funds3%
Promoter and
promoter group
64%
Bodies Corporate5%
Individuals and Others5%
Financial Inst / Banks4%
FIIs / Foreign Banks
19%
Financials

8/6/2019 SPIL March-11 IR USD
http://slidepdf.com/reader/full/spil-march-11-ir-usd 36/39
FinancialsMarket Capitalisation USD 9.70 billion* Figures in USD million
*Exchange Rate : 1 USD = Rs45.18
P&L Summary
Net Sales
Financial Ratios
8/6/2019 SPIL March-11 IR USD
http://slidepdf.com/reader/full/spil-march-11-ir-usd 37/39
Financial Ratios
Growth (% )
Net Sales
Financials Q3 FY11

8/6/2019 SPIL March-11 IR USD
http://slidepdf.com/reader/full/spil-march-11-ir-usd 38/39
Financials Q3 FY11
Net Sales
Gross ProfitGross Margin
8/6/2019 SPIL March-11 IR USD
http://slidepdf.com/reader/full/spil-march-11-ir-usd 39/39
For updates and specific queries, please visit
www.sunpharma.comor feel free to contactUday Baldota
Tel : +91 22 6645 5645, Ext
605
Tel Direct : +91 22 66455605
Mobile : +91 98670 10529
Mira Desai
Tel : +91 22 6645 5645, Ext 606
Tel Direct : +91 22 66455606
Mobile : +91 98219 23797
© 2010 Sun Pharmaceutical Industries Limited., All Rights Reserved.
“SUN Pharma”, The Sun Pharmaceutical Industries Logo are trademarks of Sun Pharmaceutical Industries Limited.
In addition to Company data, data from IMS – ORG, CMARC, Stock Exchanges and industry publications has been used for this presentation.
This material was used during an oral presentation; it is not a complete record of the discussion. This work may not be used, sold, transferred, adapted,
abridged, copied or reproduced in whole on or in part in any manner or form or in any media without the prior written consent. All product names and
company names and logos mentioned herein are the trademarks or registered trademarks of their respective owners.