spin asymmetries of the nucleon experiment - beta analysis ...spin asymmetries of the nucleon...
TRANSCRIPT

Spin Asymmetries of the Nucleon ExperimentBETA Analysis Update
Whitney R. Armstrong The SANE Collaboration
Temple University
January 14, 2012
W. Armstrong (Temple) SANE January 14, 2012 1 / 36

1 Introduction
2 SANEMeasurement and Motivating PhysicsOperator Product ExpansionExisting Data
3 BETA AnalysisOverview of Detectors
BigcalGas CerenkovLucite HodoscopeForward Tracker
Polarized TargetBackground
4 AsymmetriesExtracting Spin Structure FunctionsPreliminary Results
5 Conclusion and Future Work
W. Armstrong (Temple) SANE January 14, 2012 2 / 36

Outline1 Introduction2 SANE
Measurement and Motivating PhysicsOperator Product ExpansionExisting Data
3 BETA AnalysisOverview of Detectors
BigcalGas CerenkovLucite HodoscopeForward Tracker
Polarized TargetBackground
4 AsymmetriesExtracting Spin Structure FunctionsPreliminary Results
5 Conclusion and Future Work
W. Armstrong (Temple) SANE January 14, 2012 3 / 36

SANE
4.7GeV and 5.9GeV beam energiesPolarized Ammonia TargetBig Electron Telescope Array
BETA is a unique detector
Large solid angle 200mSrOpen configurationNo momentum selecting magnet
W. Armstrong (Temple) SANE January 14, 2012 4 / 36

SANE
4.7GeV and 5.9GeV beam energiesPolarized Ammonia TargetBig Electron Telescope Array
BETA is a unique detector
Large solid angle 200mSrOpen configurationNo momentum selecting magnet
W. Armstrong (Temple) SANE January 14, 2012 4 / 36

SANE
W. Armstrong (Temple) SANE January 14, 2012 5 / 36

Physics
1 Measured A‖ and A80
2 Determine A1 and A2
3 Evaluate g1 and g2 as functions of a scaling variable.4 Calculate Moments → dp
2
W. Armstrong (Temple) SANE January 14, 2012 6 / 36

Physics
1 Measured A‖ and A80
2 Determine A1 and A2
3 Evaluate g1 and g2 as functions of a scaling variable.4 Calculate Moments → dp
2
W. Armstrong (Temple) SANE January 14, 2012 6 / 36

Physics
1 Measured A‖ and A80
2 Determine A1 and A2
3 Evaluate g1 and g2 as functions of a scaling variable.
4 Calculate Moments → dp2
W. Armstrong (Temple) SANE January 14, 2012 6 / 36

Physics
1 Measured A‖ and A80
2 Determine A1 and A2
3 Evaluate g1 and g2 as functions of a scaling variable.4 Calculate Moments → dp
2
W. Armstrong (Temple) SANE January 14, 2012 6 / 36

Operator Product Expansion
... the whole point of the operator product expansion is toseparate the parts of Feynman diagrams where every linecarries a large momentum, which in asymptotically freetheories can be calculated using perturbation theory, from thecontribution of the parts of Feynman diagrams through whichsmall momenta flow, which cannot be calculated perturbatively1
1S. Weinberg, The Quantum Theory of Fields, Vol 2, p 288W. Armstrong (Temple) SANE January 14, 2012 7 / 36

A twist-3 sum rule
Using the Operator Product Expansion for the non-local operatorsshowing up in the S matrix, one can arrive a the infinite set of sumrules below. For n ≥ 3 and n odd, we have∫ 1
0dxxn−1{g1 +
n
n− 1g2} =
12
∑i
δidin−1E
n2,i(Q
2, g) (1)
For n = 3 ∫ 1
0x2{g1 +
32g2}dx =
12d2 (2)
Interpretations of d2
Color Polarizabilities (X.Ji)
Average Color Lorentz force (M.Burkardt)
W. Armstrong (Temple) SANE January 14, 2012 8 / 36

A twist-3 sum rule
Using the Operator Product Expansion for the non-local operatorsshowing up in the S matrix, one can arrive a the infinite set of sumrules below. For n ≥ 3 and n odd, we have∫ 1
0dxxn−1{g1 +
n
n− 1g2} =
12
∑i
δidin−1E
n2,i(Q
2, g) (1)
For n = 3 ∫ 1
0x2{g1 +
32g2}dx =
12d2 (2)
Interpretations of d2
Color Polarizabilities (X.Ji)Average Color Lorentz force (M.Burkardt)
W. Armstrong (Temple) SANE January 14, 2012 8 / 36

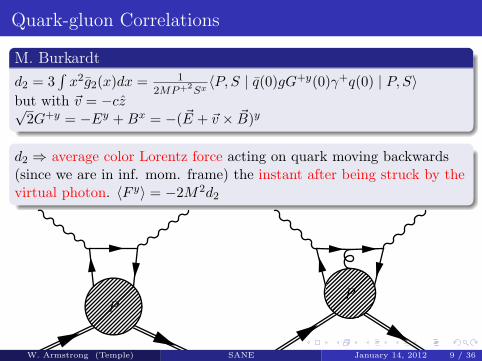
Quark-gluon Correlations
M. Burkardt
d2 = 3∫x2g2(x)dx = 1
2MP+2Sx〈P, S | q(0)gG+y(0)γ+q(0) | P, S〉
but with ~v = −cz√2G+y = −Ey +Bx = −( ~E + ~v × ~B)y
d2 ⇒ average color Lorentz force acting on quark moving backwards(since we are in inf. mom. frame) the instant after being struck by thevirtual photon. 〈F y〉 = −2M2d2
PP
W. Armstrong (Temple) SANE January 14, 2012 9 / 36

gp1 Data
Figure: World data on gp1(x). The red data points fall within the SANE Q2
range.
W. Armstrong (Temple) SANE January 14, 2012 10 / 36

gp2 Data
Figure: World data on gp2(x). The red data points fall within the SANE Q2
range.
W. Armstrong (Temple) SANE January 14, 2012 11 / 36

d2 =∫ 1
0 x2{2g1 + 3g2}dx
x0.1 0.2 0.3 0.4 0.5 0.6 0.7 0.8 0.9 1
-0.05
-0.04
-0.03
-0.02
-0.01
0
0.01
0.02
0.03
0.04
0.05 2 = 4 GeV2Q p
1SLAC_E143 g
p
1SLAC_E155 g
p
1EMC g
p
1SMC g
p
1HERMES g
p
1CLAS g
p
1RSS g
<6.502 2.50 <Qp
1All g1p data gxg1p BB xg1p DNS2005 xg1p AAC xg1p GS
)2= 4.5 GeV2(x,Qp1
g2x
Figure: The gp1(x) contribution to thedp2 integrand.
x0.1 0.2 0.3 0.4 0.5 0.6 0.7 0.8 0.9 1
-0.06
-0.04
-0.02
0
0.02
0.04
0.06
2 = 4 GeV2Qp
2SLAC_E143 g
p
2SLAC_E155 g
p
2SMC g
p
2RSS g
<6.502 2.50 <Qp
2WWAll g2p data g
g2pWW BB
g2pWW DNS2005 g2pWW AAC g2pWW GS
)2= 4.5 GeV2(x,Qp2
g2x
Figure: The gp2(x) contribution to thedp2 integrand.
W. Armstrong (Temple) SANE January 14, 2012 12 / 36

d2 =∫ 1
0 x2{2g1 + 3g2}dx
Figure: dp2(Q2)
W. Armstrong (Temple) SANE January 14, 2012 13 / 36

Outline1 Introduction2 SANE
Measurement and Motivating PhysicsOperator Product ExpansionExisting Data
3 BETA AnalysisOverview of Detectors
BigcalGas CerenkovLucite HodoscopeForward Tracker
Polarized TargetBackground
4 AsymmetriesExtracting Spin Structure FunctionsPreliminary Results
5 Conclusion and Future Work
W. Armstrong (Temple) SANE January 14, 2012 14 / 36

Big Electron Telescope Array
SANE used BETA to detect inclusive electrons with a large acceptanceat angles around 40◦for energies above about 1 GeV.
W. Armstrong (Temple) SANE January 14, 2012 15 / 36

Bigcal
Two Sections
The upper section from YerevanPhysics Institute used during RCSexperiment.
It consists of 4x4x40cm3
lead-glass blocksThey are arranged in a 30x24array
Lower section from IHEP inProtvino, Russia.
It consists of 3.8x3.8x45cm3
lead-glass blocksThey are arranged in 32x32array
1,744 lead glass blocks total.
Figure: Bigcal lead-glass blocks
Bigcal was previously used in theGEp series of experiments
W. Armstrong (Temple) SANE January 14, 2012 16 / 36
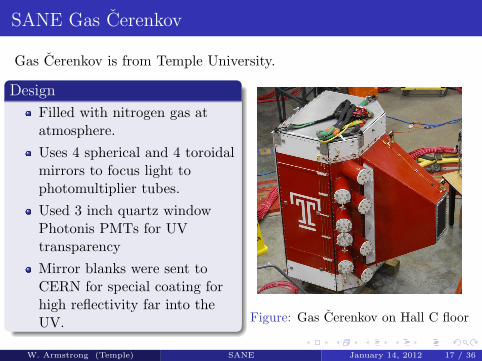
SANE Gas Cerenkov
Gas Cerenkov is from Temple University.
Design
Filled with nitrogen gas atatmosphere.Uses 4 spherical and 4 toroidalmirrors to focus light tophotomultiplier tubes.Used 3 inch quartz windowPhotonis PMTs for UVtransparencyMirror blanks were sent toCERN for special coating forhigh reflectivity far into theUV. Figure: Gas Cerenkov on Hall C floor
W. Armstrong (Temple) SANE January 14, 2012 17 / 36

Lucite Hodoscope
Lucite Hodoscope is from North Carolina A&T State University.
Design
28 curved Lucite bars withlight guides mounted to edgescut at 45◦
PMT with light guide mountedat both ends of each bar.
Figure: Lucite Hodoscope in Hall C
W. Armstrong (Temple) SANE January 14, 2012 18 / 36

Forward Tracker
Forward tracker is from Norfolk State University and University ofRegina
Design
3 layers of 3mmx3mm scintillators.1 horizontally segmented layer closestto the target consisting of 72 segments2 vertically segmented layersconsisting of 128 segments eachWLS fibers glued to each bar withfibers connected to Hamamatsu64-Channel PMTs Figure: Forward tracker in
position between Cerenkovsnout and target OVC
W. Armstrong (Temple) SANE January 14, 2012 19 / 36

Polarized Target
W. Armstrong (Temple) SANE January 14, 2012 20 / 36

Polarized Target
0%
20%
40%
60%
80%
100%
72100 72200 72300 72400 72500 72600 72700 72800 72900 73000 73100
Abs
olut
e P
olar
izat
ion
Run Number
Preliminary Absolute Target Polarization for All SANE Runs
Positive PolarizationNegative Polarization
Figure: Target polarization during the experiment by James Maxwell
Average polarization was about 70%
W. Armstrong (Temple) SANE January 14, 2012 21 / 36

Pair Symmetric Background
Sources
π0 → γγ∗ → γe+e− (primary source)γ → e+e−
Figure: π0 asymmetry vs run number courtesy of Luwani Ndukum
W. Armstrong (Temple) SANE January 14, 2012 22 / 36

Figure: Starting at the top left plot: φπ0 vs θπ0, ∆ycluster vs ∆xcluster,∆ycluster vs θπ0, jpeakvsipeak, Cherenkov TDC (red showing tdc cut), Numberof Electrons Detected (red = TDC cut, blue = Events with 3 clusters), Eπ0,Mπ0
W. Armstrong (Temple) SANE January 14, 2012 23 / 36

Outline1 Introduction2 SANE
Measurement and Motivating PhysicsOperator Product ExpansionExisting Data
3 BETA AnalysisOverview of Detectors
BigcalGas CerenkovLucite HodoscopeForward Tracker
Polarized TargetBackground
4 AsymmetriesExtracting Spin Structure FunctionsPreliminary Results
5 Conclusion and Future Work
W. Armstrong (Temple) SANE January 14, 2012 24 / 36

Direct access to the polarized structure functions can be obtainedutilizing the following
A‖ = D(A1 − ξA2) (3)
A⊥ = d(A2 − ξA1) (4)
A1 =g1 − (4M2x2/Q2)g2)
F1(5)
A2 =2Mx√Q2
g1 + g2F1
(6)
W. Armstrong (Temple) SANE January 14, 2012 25 / 36

Kinematic Coverage
Plot by James Maxwell
W. Armstrong (Temple) SANE January 14, 2012 26 / 36

Preliminary Results
Preliminary results for Ap1 and Ap
2 courtesy of James Maxwell
W. Armstrong (Temple) SANE January 14, 2012 27 / 36

Outline1 Introduction2 SANE
Measurement and Motivating PhysicsOperator Product ExpansionExisting Data
3 BETA AnalysisOverview of Detectors
BigcalGas CerenkovLucite HodoscopeForward Tracker
Polarized TargetBackground
4 AsymmetriesExtracting Spin Structure FunctionsPreliminary Results
5 Conclusion and Future Work
W. Armstrong (Temple) SANE January 14, 2012 28 / 36

Conclusion and Future Work
Analysis in progress
Dilution factors for BETA from MC.Optimize pair symmetric background cutsUnderstand kinematic cutsRadiative CorrectionsDetermining the systematic errors
More results soon to come...
W. Armstrong (Temple) SANE January 14, 2012 29 / 36

Thank You!
W. Armstrong (Temple) SANE January 14, 2012 30 / 36

Backup Slides
W. Armstrong (Temple) SANE January 14, 2012 31 / 36
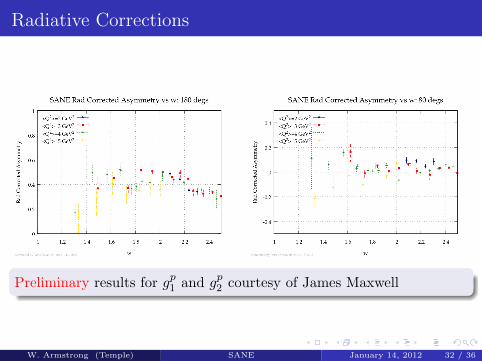
Radiative Corrections
Preliminary results for gp1 and gp
2 courtesy of James Maxwell
W. Armstrong (Temple) SANE January 14, 2012 32 / 36

Preliminary Results
Preliminary results for gp1 and gp
2 courtesy of James Maxwell
W. Armstrong (Temple) SANE January 14, 2012 33 / 36

InSANE Event Display
Figure:
W. Armstrong (Temple) SANE January 14, 2012 34 / 36

InSANE
Focus on physics analysisNot a CODA decoderMultiple analysis passesMake full use of ROOT I/OEasier transition MC → DATA
W. Armstrong (Temple) SANE January 14, 2012 35 / 36
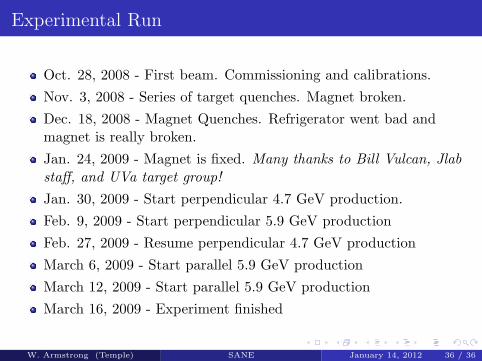
Experimental Run
Oct. 28, 2008 - First beam. Commissioning and calibrations.Nov. 3, 2008 - Series of target quenches. Magnet broken.Dec. 18, 2008 - Magnet Quenches. Refrigerator went bad andmagnet is really broken.Jan. 24, 2009 - Magnet is fixed. Many thanks to Bill Vulcan, Jlabstaff, and UVa target group!Jan. 30, 2009 - Start perpendicular 4.7 GeV production.Feb. 9, 2009 - Start perpendicular 5.9 GeV productionFeb. 27, 2009 - Resume perpendicular 4.7 GeV productionMarch 6, 2009 - Start parallel 5.9 GeV productionMarch 12, 2009 - Start parallel 5.9 GeV productionMarch 16, 2009 - Experiment finished
W. Armstrong (Temple) SANE January 14, 2012 36 / 36