spin-off could unleash dividend potential of hk sogo … · spin-off could unleash dividend...
TRANSCRIPT

April 27, 2016
ACTION
Buy Lifestyle International Holdings (1212.HK)
Return Potential: 32% Equity Research
Spin-off could unleash dividend potential of HK SOGO store; add to CL
Source of opportunity
With a mix of HK/China dept stores, Lifestyle has been adversely affected in the
past in two ways — its FCF-generative HK SOGO asset being weighed down by
China’s capex needs, and China assets worth HK$10bn at cost not being well
appreciated by the market. We think Lifestyle’s proposed spinoff of China ops
(announced on Apr 22) could change this and unlock value. We expect a higher
payout from its HK assets to HK$1.3bn in 2017E, +30% from HK$1bn (2015).
With a more “REIT” like payout profile, we see rerating potential as investors
benchmark its value on DPS. We estimate its HK assets are worth HK$18bn,
implying negligible value for China operations. Maintain Buy, add to CL.
Catalyst
As investors gain clarity on Lifestyle HK’s dividend plans, we believe the stock
has the potential to rerate. Although we do not take a view on the likelihood
of the spin-off materializing, if it were to happen, we would expect the first
indication of a higher payout in 1H16 results in Aug, with a potential dividend
hike likely coming through during its 2016 full year results. Fundamentally,
the reversal of losses from its Shenyang store closure and concessionaire
margin hikes from HK SOGO should help keep a well anticipated 1H16 EBIT
decline at -8%, better than -20% for other HK retailers under coverage.
Valuation
We switch our methodology to SOTP from P/E, with a 12-m TP of HK$15.3
(from HK$14.5) — a combination of its HK and China value. HK (HK$18bn,
similar to the group’s current mkt cap): With stable cash flows and a
higher payout (85% in 2017E), we value the HK business with an average of
dividend yield (7% 2017E target yield), P/E (12X 2017E), and DDM (8% COE,
0.5% terminal growth), benchmarking our assumptions vs leading HK REITs;
China (HK$6bn): We value its department store business at 9X 2017E
EV/EBITDA, JVs at 0.4X book, and Zhabei project at paid construction cost.
Key risks
If the spin-off does not materialize, Lifestyle could revert to a P/E trading
pattern; 12X ‘17E P/E (China dept store avg), implies a value of HK$14.5/shr.
INVESTMENT LIST MEMBERSHIP
Asia Pacific Buy List
Asia Pacific Conviction Buy List
Coverage View: Neutral
Ricky Tsang, CFA +852-2978-6631 [email protected] Goldman Sachs (Asia) L.L.C. Goldman Sachs does and seeks to do business with companies
covered in its research reports. As a result, investors should be aware that the firm may have a conflict of interest that could affect the objectivity of this report. Investors should consider this report as only a single factor in making their investment decision. For Reg AC certification and other important disclosures, see the Disclosure Appendix, or go to www.gs.com/research/hedge.html. Analysts employed by non-US affiliates are not registered/qualified as research analysts with FINRA in the U.S.
Joshua Lu +852-2978-1024 [email protected] Goldman Sachs (Asia) L.L.C.
Alan Lee +852-2978-0953 [email protected] Goldman Sachs (Asia) L.L.C.
The Goldman Sachs Group, Inc. Global Investment Research
Growth
Returns *
Multiple
Volatility Volatility
Multiple
Returns *
Growth
Investment Profile
Low High
Percentile 20th 40th 60th 80th 100th
* Returns = Return on Capital For a complete description of the investment
profile measures please refer to the
disclosure section of this document.
Lifestyle International Holdings (1212.HK)
Asia Pacific Consumer Peer Group Average
Key data Current
Price (HK$) 11.58
12 month price target (HK$) 15.30
Market cap (HK$ mn / US$ mn) 18,934.5 / 2,441.1
Foreign ownership (%) --
12/15 12/16E 12/17E 12/18E
EPS (HK$) New 1.17 1.15 1.15 1.18
EPS revision (%) 0.0 (2.8) (7.3) (7.9)
EPS growth (%) (10.7) (1.7) 0.3 2.1
EPS (dil) (HK$) New 1.17 1.15 1.15 1.18
P/E (X) 11.2 10.1 10.0 9.8
P/B (X) 1.9 1.6 1.5 1.4
EV/EBITDA (X) 9.4 9.6 10.4 11.7
Dividend yield (%) 4.8 6.1 7.0 7.1
ROE (%) 17.2 16.3 15.4 15.0
CROCI (%) 15.4 13.0 11.4 9.4
Price performance chart
18,000
20,000
22,000
24,000
26,000
28,000
30,000
9
10
11
12
13
14
15
Apr-15 Aug-15 Nov-15 Feb-16
Lifestyle International Holdings (L) Hang Seng Index (R)
Share price performance (%) 3 month 6 month 12 monthAbsolute 21.4 4.9 (23.2)
Rel. to Hang Seng Index 8.3 13.6 2.2
Source: Company data, Goldman Sachs Research estimates, FactSet. Price as of 4/27/2016 close.

April 27, 2016 Lifestyle International Holdings (1212.HK)
Goldman Sachs Global Investment Research 2
Lifestyle International Holdings: Summary Financials
Analyst Contributors
Ricky Tsang, CFA
Joshua Lu
Alan Lee
Profit model (HK$ mn) 12/15 12/16E 12/17E 12/18E Balance sheet (HK$ mn) 12/15 12/16E 12/17E 12/18E
Total revenue 6,171.4 5,726.5 5,698.1 5,839.0 Cash & equivalents 8,669.6 7,576.1 6,005.8 5,016.8
Cost of goods sold (2,464.5) (2,265.0) (2,252.4) (2,306.5) Accounts receivable 273.2 203.2 202.1 207.0
SG&A (1,518.2) (1,437.0) (1,460.9) (1,496.0) Inventory 79.3 75.8 76.5 77.4
R&D -- -- -- -- Other current assets 5,204.0 5,204.0 5,204.0 5,204.0
Other operating profit/(expense) 188.3 177.4 176.5 180.7 Total current assets 14,226.2 13,059.1 11,488.3 10,505.1
EBITDA 2,615.3 2,444.5 2,422.4 2,491.9 Net PP&E 7,392.9 9,072.3 11,112.7 12,494.2
Depreciation & amortization (238.3) (242.5) (261.2) (274.7) Net intangibles 3,425.5 3,425.5 3,425.5 3,425.5
EBIT 2,377.0 2,202.0 2,161.2 2,217.2 Total investments 3,713.6 4,138.5 4,560.8 4,999.0
Interest income 150.7 138.7 113.6 90.1 Other long-term assets 46.1 46.1 46.1 46.1
Interest expense (284.7) (303.5) (228.4) (215.9) Total assets 28,804.3 29,741.6 30,633.4 31,469.9
Income/(loss) from uncons. subs. 438.5 424.9 422.2 438.2
Others (6.2) 153.7 153.7 153.7 Accounts payable 2,470.6 2,364.5 2,348.9 2,337.6
Pretax profits 2,675.4 2,615.8 2,622.4 2,683.3 Short-term debt 3,165.2 3,165.2 3,165.2 3,165.2
Income tax (504.1) (489.2) (489.4) (501.4) Other current liabilities 356.5 356.5 356.5 356.5
Minorities (256.9) (243.9) (245.4) (253.8) Total current liabilities 5,992.2 5,886.1 5,870.5 5,859.2
Long-term debt 9,351.3 9,351.3 9,351.3 9,351.3
Net income pre-preferred dividends 1,914.4 1,882.7 1,887.6 1,928.1 Other long-term liabilities 364.6 364.6 364.6 364.6
Preferred dividends 0.0 0.0 0.0 0.0 Total long-term liabilities 9,715.9 9,715.9 9,715.9 9,715.9
Net income (pre-exceptionals) 1,914.4 1,882.7 1,887.6 1,928.1 Total liabilities 15,708.1 15,602.0 15,586.4 15,575.1
Post-tax exceptionals 0.0 0.0 0.0 0.0
Net income 1,914.4 1,882.7 1,887.6 1,928.1 Preferred shares 0.0 0.0 0.0 0.0
Total common equity 11,123.1 11,922.6 12,584.6 13,178.7
EPS (basic, pre-except) (HK$) 1.17 1.15 1.15 1.18 Minority interest 1,973.1 2,217.0 2,462.3 2,716.1
EPS (basic, post-except) (HK$) 1.17 1.15 1.15 1.18
EPS (diluted, post-except) (HK$) 1.17 1.15 1.15 1.18 Total liabilities & equity 28,804.3 29,741.6 30,633.4 31,469.9
DPS (HK$) 0.63 0.71 0.81 0.83
Dividend payout ratio (%) 53.5 61.3 70.0 70.0 BVPS (HK$) 6.80 7.29 7.70 8.06
Free cash flow yield (%) 6.3 3.3 1.5 4.7
Growth & margins (%) 12/15 12/16E 12/17E 12/18E Ratios 12/15 12/16E 12/17E 12/18E
Sales growth 3.4 (7.2) (0.5) 2.5 CROCI (%) 15.4 13.0 11.4 9.4
EBITDA growth (0.7) (6.5) (0.9) 2.9 ROE (%) 17.2 16.3 15.4 15.0
EBIT growth (0.1) (7.4) (1.9) 2.6 ROA (%) 6.9 6.4 6.3 6.2
Net income growth (10.7) (1.7) 0.3 2.1 ROACE (%) 13.0 11.5 10.2 10.4
EPS growth (10.7) (1.7) 0.3 2.1 Inventory days 12.3 12.5 12.3 12.2
Gross margin 60.1 60.4 60.5 60.5 Receivables days 19.3 15.2 13.0 12.8
EBITDA margin 42.4 42.7 42.5 42.7 Payable days 376.1 389.6 381.9 370.8
EBIT margin 38.5 38.5 37.9 38.0 Net debt/equity (%) 29.4 34.9 43.3 47.2
Interest cover - EBIT (X) 17.7 13.4 18.8 17.6
Cash flow statement (HK$ mn) 12/15 12/16E 12/17E 12/18E Valuation 12/15 12/16E 12/17E 12/18E
Net income pre-preferred dividends 1,914.4 1,882.7 1,887.6 1,928.1
D&A add-back 238.3 242.5 261.2 274.7 P/E (analyst) (X) 11.2 10.1 10.0 9.8
Minorities interests add-back 0.0 0.0 0.0 0.0 P/B (X) 1.9 1.6 1.5 1.4
Net (inc)/dec working capital (24.6) (32.5) (15.2) (17.0) EV/EBITDA (X) 9.4 9.6 10.4 11.7
Other operating cash flow 189.2 (16.2) (62.1) (58.6) EV/GCI (X) 1.3 1.2 1.1 1.1
Cash flow from operations 2,317.3 2,076.5 2,071.5 2,127.1 Dividend yield (%) 4.8 6.1 7.0 7.1
Capital expenditures (828.9) (1,375.2) (1,754.7) (1,109.4)
Acquisitions 0.0 0.0 0.0 0.0
Divestitures 220.3 0.0 0.0 0.0
Others (1,295.6) (408.1) (433.2) (456.7)
Cash flow from investments (1,904.2) (1,783.3) (2,187.9) (1,566.1)
Dividends paid (common & pref) (1,025.1) (1,083.2) (1,225.5) (1,334.1)
Inc/(dec) in debt 1,992.6 0.0 0.0 0.0
Common stock issuance (repurchase) (868.6) 0.0 0.0 0.0
Other financing cash flows (27.8) (303.5) (228.4) (215.9)
Cash flow from financing 71.1 (1,386.7) (1,454.0) (1,550.0)
Total cash flow 484.2 (1,093.5) (1,570.3) (988.9) Note: Last actual year may include reported and estimated data.
Source: Company data, Goldman Sachs Research estimates.

April 27, 2016 Lifestyle International Holdings (1212.HK)
Goldman Sachs Global Investment Research 3
Proposed spin-off splits FCF rich HK asset from China projects
Background of the spin-off of Lifestyle China
On April 22, Lifestyle announced the proposed spin-off of its China business (Lifestyle
China) to a separate listing.
The spin-off will be done via distribution in specie, i.e., shareholders will be entitled to
shares of Lifestyle China at the same ownership percentage in the form of dividend.
Post spin-off, Lifestyle (1212.HK) will focus on the HK business (mainly CWB Sogo),
while Lifestyle China will be a separate listed entity.
The spin-off is pending listing approval and final decision of the Board of directors
(however, no shareholder vote/approval is required).
Timeline: There is a degree of uncertainty to the listing timeline given the need of
listing approval for Lifestyle China. However, taking into consideration historical
precedents of a dividend in specie spin-off (Li & Fung spinning off GBG), it took 3-4
months from application to listing.
Pro-forma capital structure (as announced by the company): Post spin-off, Lifestyle
would have zero net debt; while Lifestyle China will have c.HK$1.3bn net debt (with
c.Rmb1.9bn untapped bank loans for its Zhabei project).
Exhibit 1: Spin-off separates Lifestyle group into a mature, highly cash generative HK business; along with a China
business in investment phase Illustration of pro-forma P&L and Balance sheet, post proposed spin-off
Source: Company data, Goldman Sachs Global Investment Research.
Lifestyle (HK + China dept stores)
- 2015 gross sales: HK$14bn
- 2015 OP: HK$2.4bn
- 2015 NP: HK$1.9bn; EPS: HK$1.17
Balance sheet
Cash eq HK$8.7bn
Fin. assets 5.1bn
PP&E 10.8bn
JV + Assoc 3.7bn
(20% stake in Beiren)
Total 28.3bn
Lifestyle HK (Sogo dept stores)
- 2015 gross sales: HK$10bn
- 2015 OP: HK$2.1bn
- 2015 NP: HK$1.6bn
Balance sheet
Lifestyle China (PRC stores)
- 2015 gross sales: HK$3.8bn
- 2015 OP: HK$245mn
- 2015 NP: HK$305mn
Balance sheet
Debt + bonds 12.5bn
Equity 11.1bn
Minority int 2.0bn
Net work cap 2.7bn
Total 28.3bn
Cash eq HK$6.4bn
Fin. assets 5.1bn
PP&E 3.2bn
JV + Assoc 0.1bn
Total 14.8bn
Debt + bonds 11.5bn
Equity 1.0bn
Minority int 0.7bn
Net work cap 1.6bn
Total 14.8bn
Cash eq HK$2.3bn
PP&E 7.6bn
JV + Assoc 3.6bn
(20% stake in Beiren)
Total 13.5bn
Debt 1.0bn
Equity 10.1bn
Minority int 1.3bn
Net work cap 1.1bn
Total 13.5bn

April 27, 2016 Lifestyle International Holdings (1212.HK)
Goldman Sachs Global Investment Research 4
Investment thesis – Spin off likely to unlock dividend potential
With the announcement of the full financials for the Lifestyle China proposed spin off, we
now have visibility in the capital structure of its HK and China businesses. This affirms our
earlier view that the spin off could separate Lifestyle into two distinct businesses with
varying cash flow profiles – a HK entity with one of the most productive retail properties in
the world (CWB Sogo at US$1bn+ sales p.a.), and China entity with China department
stores and a Shanghai Zhabei project in development (Exhibits 1, 2).
The investment opportunity here lies in the fact that we see a significant potential for
Lifestyle HK to hike its 2017E payout to HK$1.3bn from HK$1.0bn (30% increase). With
limited capex needs, we note that Lifestyle HK could be perceived more like a REIT, and we
could see a higher payout from its strong FCF profile (Exhibit 2).
With the proposed spin off in progress, we expect investors to gradually view this business
as two separate entities, driving us to switch our valuation methodology to SOTP from P/E
to explore the value of the HK and China businesses separately.
Applying a 7% target dividend yield, the HK business is already at the group’s current
market cap (HK$18bn), implying negligible valuation for China (which has a HK$10bn book
value). And China, which is still earning decent profits (c.HK$300mn in 2015), are not
seeing sales declines YTD. Capex needs for its multi-billion Shanghai prime location
(Zhabei) project is also likely to be funded by existing debt and cash flows. We value China
at HK$5-7bn.
Exhibit 2: Cash flows: The HK business is a mature, cash generative property; without new projects in the pipeline, we
see the potential for a higher payout Illustration of cash flows post spinoff
Source: Company data, Goldman Sachs Global Investment Research.
Lifestyle (HK + China dept stores)
- 2015 OCF: HK$2.3bn
- 2015 Capex: HK$0.8bn
- 2015 FCF: HK$1.5bn
- 2015 dividend: HK$1.0bn(54% payout, 67% of FCF)
Lifestyle HK (Sogo dept stores) Lifestyle China (PRC stores)
No growth in OCF
HK$3.3bn capex in the next 3 years
Future cash flow profile
- 2015 OCF: HK$1.9bn
- 2015 Capex: HK$0.2bn
- 2015 FCF: HK$1.7bn
- May pay out most of FCF as dividend
Healthy FCF: HK$1.6bn p.a
Potential higher payout in sight (GSe: HK$1.3bn p.a. in 2017-18E, 85% payout on NP/FCF)
Future cash flow profile
Mature, productive, high FCF property
- 2015 OCF: HK$0.4bn
- 2015 Capex: HK$0.6bn
- 2015 FCF: -HK$0.2bn
FCF to stay negative on Zhabei project
(Rmb3bn capex needs in 2016-19)
Future cash flow profile
Existing stores + upcoming project

April 27, 2016 Lifestyle International Holdings (1212.HK)
Goldman Sachs Global Investment Research 5
‘REITizing’ HK value: Higher payout potential on better FCF profile
2017E DPS 30% higher than 2015 on higher FCF payout
We expect dividend payments to increase to HK$1.3bn by 2017E from HK$1.0bn in 2015,
implying an earnings payout of 70% for the current group (and 85% for the standalone HK
property’s earnings/FCF). Our view is based on:
Operating cash flows of HK$1.6bn: Overall we continue to view HK SOGO as a highly
cash generative asset even in a challenging environment. Even in a tough year for HK
retail, Lifestyle HK generated close to HK$2bn in FCF (flattish yoy). YTD trends have
remained weak, with a 10% drop in sales. We hence expect a FCF drop in a similar
magnitude, as negative operating leverage effect is partially offset by higher
concessionaire margins on a better business mix.
Limited capex needs: Most of SOGO’s capex needs are from maintenance and
renovation needs, which should be at a sub HK$100mn range. Since the group’s listing
in 2004, almost all of Lifestyle’s capex expansion has been in China, pointing to limited
capex needs in HK, further freeing up FCF available for dividends.
Debt fully covered by cash and financial assets: Lifestyle HK’s HK$11bn debt is fully
covered by its HK$6bn cash and HK$5bn in fixed income investments.
A higher payout in sight: With a much cleaner FCF profile, we expect a higher 85%
DPS payout for its HK properties on EPS in 2017E (first year post spin off), up from 54%
in 2015. Our estimates are still below that of a typical HK REITs which have similar cash
flow profiles, which pays out 100% of attributable FCF (Exhibit 3).
Exhibit 3: We have budgeted for a 10% decline in HK operating cash flows in 2016E, in-line with the YTD demand run-
rate HK vs China FCF progression estimates
Source: Company data, Goldman Sachs Global Investment Research.
Cash flow metrics (HK$mn) 2014 2015 2016E 2017E 2018E
Operating cash flows 2,384 2,317 2,076 2,072 2,127
HK 1,904 1,910 1,611 1,603 1,635 China 481 407 465 468 492
Capital expenditures (604) (809) (1,375) (1,755) (1,109)
HK (246) (168) (100) (80) (80) China (358) (641) (1,275) (1,675) (1,029)
Free cash flows 1,780 1,508 701 317 1,018
HK 1,657 1,743 1,511 1,523 1,555 China 123 (234) (810) (1,206) (537)
Dividends declared 965 1,025 1,153 1,321 1,350
HK NA NA NA 1,321 1,350 China NA NA NA - -
Payout (on FCF) 54% 68% 164% 417% 133%
HK NA NA NA 87% 87%China NA NA NA 0% 0%
Payout (on earnings) 45% 54% 61% 70% 70%
HK NA NA NA 85% 85%China NA NA NA 0% 0%
We expect a higher
payout ratio (both in
terms of FCF and
earnings) after the spin-
off of Lifestyle China

April 27, 2016 Lifestyle International Holdings (1212.HK)
Goldman Sachs Global Investment Research 6
Exhibit 4: Payout ratio to hit historical high
Dividend expectation (HK$) and payout (on group level)
Exhibit 5: DPS expectations should also improve despite
a flattish earnings outlook DPS expectation (HK$)
Source: Company data, Goldman Sachs Global Investment Research.
Source: Company data, Goldman Sachs Global Investment Research.
Exploring SOTP valuations: HK business at HK$18bn, similar to the
group’s current market cap
In our view, post the proposed spin-off, Lifestyle HK could be perceived more like a REIT,
given stable FCF, low net gearing, and limited development needs.
As such, we adopt a blended valuation methodology for Lifestyle HK, taking a simple
average of dividend yield, DDM, and P/E based valuations. The assumptions are
benchmarked to leading REITs and landlords in HK (Link REIT, Fortune REIT, Hysan).
Dividend yield: For our base case valuations, we assign a 7% target dividend yield to
Lifestyle’s HK$1.3bn dividend stream in 2017E, which implies a 20% higher yield than
REIT peers, in-line with historical average. This yields HK$18bn implied value for the
HK business. Our bull case assumes Lifestyle trades even closer to historical peak
levels, at 5% yield, implying a HK$26bn value. Our bear case assumes a historical high
9% yield, implying HK$14bn.
DDM: We have taken conservative assumptions to Lifestyle HK’s dividend growth
profile, assuming almost no growth from 2017E dividends. Our terminal growth rate is
at 0.5%, and COE is at 8% (our property team uses 2.5% TGR and 7% COE for Link
REIT). This yields a valuation of HK$18bn. We further stress our payout assumptions
under this scenario, and even with a 70% payout, Lifestyle HK would have an implied
value of HK$15bn.
P/E: Our P/E valuation helps address variances in the payout ratio. Our benchmark
valuations of 10X-15X yield a narrower valuation range, but a similar value of around
HK$20bn.
469 566
752 821
1,371
965 1,025 1,153
1,321
0%
10%
20%
30%
40%
50%
60%
70%
80%
90%
100%
-
200
400
600
800
1,000
1,200
1,400
1,600
2009 2010 2011 2012 2013 2014 2015 2016E 2017E
Divs declared (HK$mn) Payout % (RHS)
0.28 0.34
0.45 0.49
0.83
0.59 0.63
0.71
0.81
-
0.10
0.20
0.30
0.40
0.50
0.60
0.70
0.80
0.90
2009 2010 2011 2012 2013 2014 2015 2016E 2017E

April 27, 2016 Lifestyle International Holdings (1212.HK)
Goldman Sachs Global Investment Research 7
Exhibit 6: Our blended methodology values Lifestyle’s HK business at HK$18bn, similar to current group market cap Our blended (dividend yield, P/E and DDM) valuation ranges for Lifestyle HK and implied Lifestyle group
Source: Company data, Goldman Sachs Global Investment Research.
Adding China to the SOTP
We hence derive our target price using SOTP valuation — a combination of the HK and
China businesses. Our 12-m TP of HK$15.3 implies 32% upside potential.
Exhibit 7: Our 12-m SOTP-based TP of HK$15.3 implies 32% upside potential
SOTP valuation for Lifestyle International Holdings
Source: Company data, Goldman Sachs Global Investment Research.
10
14
18
22
26
30
34
Div yield P/E DDM
Valuing Lifestyle HK(HK$bn)
Current group mkt cap: c.HK$18bn
Bull (5%):
HK$25.6bn
Bear (9%):
HK$14.2bn
Base (7% div yield):
HK$18.3bn
15X:
HK$23.7bn
10X:
HK$15.8bn
12.5X:
HK$19.7bn
100% payout:
HK$20.7bn
85% payout:
HK$17.8bn
70% payout:
HK$14.8bn
Adding Lifestyle China
(HK$6.1bn)
10
14
18
22
26
30
34
Div yield P/E DDM
Valuation for the group level(HK$bn)
Current group mkt cap: c.HK$18bn
Bull: HK$31.8bn
Bear: HK$20.4bn
Base : HK$24.4bn
HK$29.8bn
HK$21.9bn
HK$25.9bn
HK$26.9bn
HK$23.9bn
HK$21.0bn
Lifestyle valuation Methodology HK$ bn Comments
HK business
Core business Avg of div. yield, P/E, DDM 18.6 Target div. yield of 7%, 12.5X P/E, 85% payoutTotal value for HK 18.6 Implied 2017E P/E is 12X
China business
China core ops 9X 2016E EV/EBITDA 3.2 Golden Eagle / Intime avg 13X EV/EBITDAZhabei 60% discount to construction cost 1.4 In-line with retail landlord NAV discountJV and assocciates 0.4X price/book 1.6 In-line with P/B for retail landlords in ChinaNet cash 1.3Less: minority interest (1.3) Mostly in Beiren associate stakeTotal value for China 6.1 Implied P/B is 0.6X
SOTP value 24.7
Per share (HK$) 15.3

April 27, 2016 Lifestyle International Holdings (1212.HK)
Goldman Sachs Global Investment Research 8
Exhibit 8: We set dividend yield based valuation range at
5%-9% Forward dividend yield: Lifestyle, Hysan, Link REIT, Fortune
REIT
Exhibit 9: Our P/E valuation cross check uses a 10X-15X
range NTM P/E: Lifestyle, Hysan, Link REIT, Fortune REIT
Source: Company data, Goldman Sachs Global Investment Research.
Source: Company data, Goldman Sachs Global Investment Research.
Exhibit 10: REITs are generally trading at a 5%-6% 2017E dividend yield, with a much larger P/E range owing to different
payout and gearing ratios Valuation profiles for Link REIT, Fortune REIT and Hysan, which we believe are key comps to Lifestyle
Source: Company data, Goldman Sachs Global Investment Research.
0.0%
1.0%
2.0%
3.0%
4.0%
5.0%
6.0%
7.0%
8.0%
9.0%
10.0%
Jan-
07
Jul-0
7
Jan-
08
Jul-0
8
Jan-
09
Jul-0
9
Jan-
10
Jul-1
0
Jan-
11
Jul-1
1
Jan-
12
Jul-1
2
Jan-
13
Jul-1
3
Jan-
14
Jul-1
4
Jan-
15
Jul-1
5
Jan-
16
Forward dividend yield
Lifestyle
Hysan
Link REIT
FortuneREIT
-
5.0
10.0
15.0
20.0
25.0
30.0
35.0
40.0
45.0
50.0
Jan-
07
Jul-0
7
Jan-
08
Jul-0
8
Jan-
09
Jul-0
9
Jan-
10
Jul-1
0
Jan-
11
Jul-1
1
Jan-
12
Jul-1
2
Jan-
13
Jul-1
3
Jan-
14
Jul-1
4
Jan-
15
Jul-1
5
Jan-
16
Forward P/E
Lifestyle
Hysan
Link REIT
FortuneREIT
HK REIT/landlords trade at c.5% div. yield on
avg, vs our 7% target for Lifestyle HKImplied 12X P/E for Lifestyle HK is also below
HK REIT/landlords
Payout ratio of 85% is comparable to the
REITsGearing ratio of Lifestyle HK is low
4.2%
5.5%
4.0%
7.0%
4.5%
5.5%
4.0%
7.0%
4.8%
5.6%
4.0%
0.0%
1.0%
2.0%
3.0%
4.0%
5.0%
6.0%
7.0%
8.0%
Lifestyle HK(target)
Link REIT Fortune REIT Hysan
Dividend yield
2015 2016E 2017E
25
1716
12
2321
16
12
21 20
17
-
5.0
10.0
15.0
20.0
25.0
30.0
Lifestyle HK(target)
Link REIT Fortune REIT Hysan
P/E
2015 2016E 2017E
101%94%
61%
85%
100%
114%
63%
85%
100%
114%
66%
0%
20%
40%
60%
80%
100%
120%
Lifestyle HK(target)
Link REIT Fortune REIT Hysan
Payout ratio
2015 2016E 2017E
24%
43%
3%0%
27%
44%
4%0%
27%
46%
4%
0%5%
10%15%20%25%30%35%40%45%50%
Lifestyle HK Link REIT Fortune REIT Hysan
Net debt / Equity
2015 2016E 2017E

April 27, 2016 Lifestyle International Holdings (1212.HK)
Goldman Sachs Global Investment Research 9
China business: Valuation range at HK$5-7bn
Lifestyle China generated solid earnings of HK$300mn even in a tough 2015, with stable
YTD trends, and an upcoming Zhabei project which could be internally funded. Post the
proposed spin off, Lifestyle China would be an asset with a HK$10bn book value, which is
most of its department store properties at cost. We value the China business at HK$5-7bn,
implying 0.5X-0.7X book. Our valuation is based on:
Core business (HK$2.5-3.9bn valuation range): Lifestyle’s core Shanghai and Suzhou
department stores are still making profits (c.HK$200mn in 2015), and are seeing stable
topline trends in 2016 YTD. With the closure of Shenyang store, we estimate a reversal
of losses of c.HK$100mn in 2016E, further lifting overall group profits. Our valuation for
its core business is based on 7X-11X 2016E EV/EBITDA, still at a discount vs national
peers such as Golden Eagle and Intime which are at 13X which have much larger scale.
Zhabei (HK$1-1.5bn valuation range): Lifestyle’s Zhabei project is a large scale multi-
purpose development property in Shanghai Zhabei, with a total GFA of 345,000 sqm
(81,000 sqm office, 264,000 sqm retail). The office space is likely to be available for sale
by end 2017, followed by the retail property in end 2018 which Lifestyle will operate.
So far, around HK$3bn has already been spent on construction, with another c.HK$4bn
capex needs for the next 3 years. Per mgmt, the project is expected to generate
HK$3bn cash inflows from office sales by end 2017, and continued cash flows from
operations of the retail property starting 2019. We value Zhabei at HK$1-1.5bn, which is
a 50%-70% NAV discount to the construction costs which are already spent. This may
be perceived to be conservative as this is only pricing in half of the unfinished project,
and does not mark-to-market to current value. We also highlight that the Zhabei
business is well funded even with existing funding sources, given HK$1.3bn in net cash,
and a Rmb1.9bn untapped bank loan.
Other components – JV and associates valued at 0.3X-0.5X P/B (HK$1.2-1.8bn), net
cash at HK$1.3bn, and a final deduction of minority interests at HK$1.3bn (as
announced by the company).
Exhibit 11: We expect Lifestyle China’s current funding sources to be able to cover capex
needs for the Zhabei project Funding sources vs capex needs: Lifestyle China
Source: Company data, Goldman Sachs Global Investment Research.
-
1,000
2,000
3,000
4,000
5,000
Funding/cash Capex need (2016-18E)
HK$mn
Untapped
bank loan
Operating
cash flows
(2016-18E)
Net cash
Zhabei
project
Maintenance
capex and
other projects
April 27, 2016 Lifestyle International Holdings (1212.HK)
Goldman Sachs Global Investment Research 10
Underlying earnings – Budgeting for a challenging 2016
HK (c.90% sales from CWB Sogo) retail environment remains tough. CWB Sogo sales
were down more than 10% yoy in 1Q16 (vs -7% in 2H15). Besides the downtrend of
visitor arrivals (PRC visitors to HK were down 18% yoy in Jan-Feb), weakness in local
spending was a key driver for the sales decline. HK’s outbound tourists were up 5%
yoy in 1Q16 (vs +5% in 2015, and flattish level in 2011-14) as overseas travel was
boosted by strong HKD, which may have impacted local spending. That said, we note
that CWB Sogo’s concessionaire margin has continued to improve (up to 24.0% in 2015,
vs 23.0%/23.7% in 2013/14) thanks to the optimization of tenant mix, which may help
offset the sales decline. For 2016, we still expect a 10% sales decline for CWB Sogo, but
sales could stabilize from 2017 onwards.
China could still have positive earnings growth (GSe: +6% in 2016E). Lifestyle closed
down the Shenyang Jiuguang store in Dec 2015; Shenyang Jiuguang had a loss of
>HK$100mn in 2015 (operating loss, one-off expense from store closure), that will not
recur in 2016 and imply a HK$100mn swing in China earnings. YTD, management
commented that sales of Shanghai Jiuguang (Lifestyle’s largest store in China, c.70%
of China sales) were still positive yoy.
Overall, we forecast a 2% earnings decline at group level in 2016E (before stabilizing in
2017E), as decline in HK could only be partially offset by higher profits from China. Our
2016E-2018E sales and EPS are slightly below IBES consensus, after factoring in the
YTD weakness and deteriorating outlook of the HK retail sector.
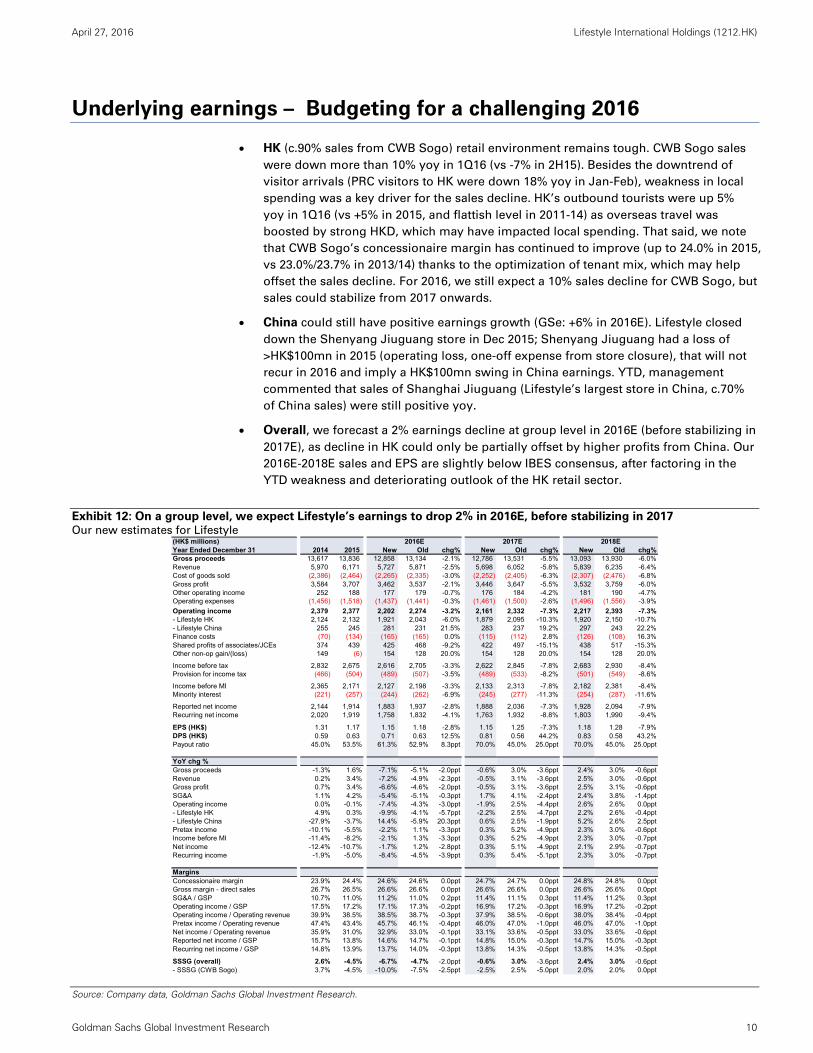
Exhibit 12: On a group level, we expect Lifestyle’s earnings to drop 2% in 2016E, before stabilizing in 2017 Our new estimates for Lifestyle
Source: Company data, Goldman Sachs Global Investment Research.
(HK$ millions) 2016E 2017E 2018EYear Ended December 31 2014 2015 New Old chg% New Old chg% New Old chg%Gross proceeds 13,617 13,836 12,858 13,134 -2.1% 12,786 13,531 -5.5% 13,093 13,930 -6.0%Revenue 5,970 6,171 5,727 5,871 -2.5% 5,698 6,052 -5.8% 5,839 6,235 -6.4%Cost of goods sold (2,386) (2,464) (2,265) (2,335) -3.0% (2,252) (2,405) -6.3% (2,307) (2,476) -6.8%Gross profit 3,584 3,707 3,462 3,537 -2.1% 3,446 3,647 -5.5% 3,532 3,759 -6.0%Other operating income 252 188 177 179 -0.7% 176 184 -4.2% 181 190 -4.7%Operating expenses (1,456) (1,518) (1,437) (1,441) -0.3% (1,461) (1,500) -2.6% (1,496) (1,556) -3.9%
Operating income 2,379 2,377 2,202 2,274 -3.2% 2,161 2,332 -7.3% 2,217 2,393 -7.3%- Lifestyle HK 2,124 2,132 1,921 2,043 -6.0% 1,879 2,095 -10.3% 1,920 2,150 -10.7%- Lifestyle China 255 245 281 231 21.5% 283 237 19.2% 297 243 22.2%Finance costs (70) (134) (165) (165) 0.0% (115) (112) 2.8% (126) (108) 16.3%Shared profits of associates/JCEs 374 439 425 468 -9.2% 422 497 -15.1% 438 517 -15.3%Other non-op gain/(loss) 149 (6) 154 128 20.0% 154 128 20.0% 154 128 20.0%
Income before tax 2,832 2,675 2,616 2,705 -3.3% 2,622 2,845 -7.8% 2,683 2,930 -8.4%Provision for income tax (466) (504) (489) (507) -3.5% (489) (533) -8.2% (501) (549) -8.6%
Income before MI 2,365 2,171 2,127 2,198 -3.3% 2,133 2,313 -7.8% 2,182 2,381 -8.4%Minority interest (221) (257) (244) (262) -6.9% (245) (277) -11.3% (254) (287) -11.6%
Reported net income 2,144 1,914 1,883 1,937 -2.8% 1,888 2,036 -7.3% 1,928 2,094 -7.9%Recurring net income 2,020 1,919 1,758 1,832 -4.1% 1,763 1,932 -8.8% 1,803 1,990 -9.4%
EPS (HK$) 1.31 1.17 1.15 1.18 -2.8% 1.15 1.25 -7.3% 1.18 1.28 -7.9%DPS (HK$) 0.59 0.63 0.71 0.63 12.5% 0.81 0.56 44.2% 0.83 0.58 43.2%Payout ratio 45.0% 53.5% 61.3% 52.9% 8.3ppt 70.0% 45.0% 25.0ppt 70.0% 45.0% 25.0ppt
YoY chg %Gross proceeds -1.3% 1.6% -7.1% -5.1% -2.0ppt -0.6% 3.0% -3.6ppt 2.4% 3.0% -0.6pptRevenue 0.2% 3.4% -7.2% -4.9% -2.3ppt -0.5% 3.1% -3.6ppt 2.5% 3.0% -0.6pptGross profit 0.7% 3.4% -6.6% -4.6% -2.0ppt -0.5% 3.1% -3.6ppt 2.5% 3.1% -0.6pptSG&A 1.1% 4.2% -5.4% -5.1% -0.3ppt 1.7% 4.1% -2.4ppt 2.4% 3.8% -1.4pptOperating income 0.0% -0.1% -7.4% -4.3% -3.0ppt -1.9% 2.5% -4.4ppt 2.6% 2.6% 0.0ppt- Lifestyle HK 4.9% 0.3% -9.9% -4.1% -5.7ppt -2.2% 2.5% -4.7ppt 2.2% 2.6% -0.4ppt- Lifestyle China -27.9% -3.7% 14.4% -5.9% 20.3ppt 0.6% 2.5% -1.9ppt 5.2% 2.6% 2.5pptPretax income -10.1% -5.5% -2.2% 1.1% -3.3ppt 0.3% 5.2% -4.9ppt 2.3% 3.0% -0.6pptIncome before MI -11.4% -8.2% -2.1% 1.3% -3.3ppt 0.3% 5.2% -4.9ppt 2.3% 3.0% -0.7pptNet income -12.4% -10.7% -1.7% 1.2% -2.8ppt 0.3% 5.1% -4.9ppt 2.1% 2.9% -0.7pptRecurring income -1.9% -5.0% -8.4% -4.5% -3.9ppt 0.3% 5.4% -5.1ppt 2.3% 3.0% -0.7ppt
MarginsConcessionaire margin 23.9% 24.4% 24.6% 24.6% 0.0ppt 24.7% 24.7% 0.0ppt 24.8% 24.8% 0.0pptGross margin - direct sales 26.7% 26.5% 26.6% 26.6% 0.0ppt 26.6% 26.6% 0.0ppt 26.6% 26.6% 0.0pptSG&A / GSP 10.7% 11.0% 11.2% 11.0% 0.2ppt 11.4% 11.1% 0.3ppt 11.4% 11.2% 0.3pptOperating income / GSP 17.5% 17.2% 17.1% 17.3% -0.2ppt 16.9% 17.2% -0.3ppt 16.9% 17.2% -0.2pptOperating income / Operating revenue 39.9% 38.5% 38.5% 38.7% -0.3ppt 37.9% 38.5% -0.6ppt 38.0% 38.4% -0.4pptPretax income / Operating revenue 47.4% 43.4% 45.7% 46.1% -0.4ppt 46.0% 47.0% -1.0ppt 46.0% 47.0% -1.0pptNet income / Operating revenue 35.9% 31.0% 32.9% 33.0% -0.1ppt 33.1% 33.6% -0.5ppt 33.0% 33.6% -0.6pptReported net income / GSP 15.7% 13.8% 14.6% 14.7% -0.1ppt 14.8% 15.0% -0.3ppt 14.7% 15.0% -0.3pptRecurring net income / GSP 14.8% 13.9% 13.7% 14.0% -0.3ppt 13.8% 14.3% -0.5ppt 13.8% 14.3% -0.5ppt
SSSG (overall) 2.6% -4.5% -6.7% -4.7% -2.0ppt -0.6% 3.0% -3.6ppt 2.4% 3.0% -0.6ppt- SSSG (CWB Sogo) 3.7% -4.5% -10.0% -7.5% -2.5ppt -2.5% 2.5% -5.0ppt 2.0% 2.0% 0.0ppt

April 27, 2016 Lifestyle International Holdings (1212.HK)
Goldman Sachs Global Investment Research 11
Appendix
Exhibit 13: Profit and loss statement split based on company announcement of China data
Source: Company data, Goldman Sachs Global Investment Research.
Exhibit 14: Balance sheet split based on company
announcement of China data
Exhibit 15: Cash flow statement split based on company
announcement of China data
Note: We adjusted for the amount due from Lifestyle China to Lifestyle,
which will be settled by way of capitalization according to the company.
Source: Company data, Goldman Sachs Global Investment Research.
Source: Company data, Goldman Sachs Global Investment Research.
HK$mn 2014 2015 2014 2015
Gross sales (GSP) 9,872 10,115 3,744 3,781
Net sales 4,614 4,790 1,356 1,381
COGS (2,039) (2,098) (347) (367) Gross profits 2,575 2,692 1,009 1,015
Opex, other operating items (451) (561) (754) (769) Operating income 2,124 2,132 255 245
Investment income (incl interest) 346 90 67 73 Share of profit of JVs and associates (24) 30 398 408 Finance costs (224) (258) (44) (27) Other non-ops (68) (19) - - Profits before tax 2,155 1,975 676 700
Tax charges (356) (361) (110) (143) Minority interests 20 (5) (241) (252) Net income 1,819 1,609 325 305
YoY %
Gross sales (GSP) -3% 2% 3% 1%Net sales -1% 4% 7% 2%Gross profits -2% 5% 7% 1%Operating profits 2% 0% -16% -4%Profits before tax -11% -8% -6% 3%Net earnings -13% -12% -11% -6%Margins
Operating income / GSP 21.5% 21.1% 6.8% 6.5%Pretax income / GSP 21.8% 19.5% 18.1% 18.5%Net income / GSP 18.4% 15.9% 8.7% 8.1%
HK China
HK$mn 2014 2015 2014 2015
Cash and equivalents 6,235 6,378 2,078 2,292 Financial assets at fair value through P&L 3,855 5,124 45 - Trade and other receivables 143 114 225 159 Inventories 39 41 48 38 Other current assets (85) (35) 191 116 Total current assets 10,186 11,621 2,587 2,605
PP&E 1,951 2,012 3,649 4,713 Investment properties 700 668 - - Prepaid lease payments 626 570 3,625 2,856 Interests in JV, associates 84 57 3,415 3,656 Other non-current assets 23 46 2 0 Total non-current assets 3,385 3,353 10,691 11,225
Total assets 13,570 14,974 13,278 13,830
Trade and other payables 1,399 1,313 1,209 1,118 Amount due to associates - - - 40 Short term borrowings 1,868 3,012 136 153 Other current liabilities 292 312 59 44 Total current liabilities 3,560 4,637 1,404 1,355
Long term bank borrowings 7,971 8,463 549 889 Other non-current liabilities 208 210 168 154 Total non-current liabilities 8,179 8,673 717 1,043
Total liabilities 11,738 13,310 2,121 2,398
Total common equity 1,152 1,011 9,951 10,112 Minority interest 680 653 1,206 1,320 Total equity 1,832 1,664 11,157 11,432
Total liabilities & equity 13,570 14,974 13,278 13,830
Net debt/(cash) (250) (26) (1,438) (1,250) Net debt/Total equity -14% -2% -13% -11%
HK China
HK$mn 2014 2015 2014 2015
Profit before taxation 2,155 1,975 676 700
Adjustments for:Depreciation & Amortization 64 92 189 146 Share of profit of JVs and associates 50 8 (398) (408) Other non-cash income/expenses (226) 271 62 55
Change in working capital 246 (96) 19 71 Total tax paid (386) (340) (69) (157)
Operating cash flows 1,904 1,910 481 407
Purchase of PP&E (246) (168) (358) (641) Acquisition/disposal of subsidiaries 343 - - (13) Dividend received 30 37 23 92 Net purchase of financial assets (380) (1,362) (45) 45 Other investing cash flows 38 57 16 50 Investing cash flows (216) (1,436) (364) (468)
Dividends paid (933) (1,002) (13) (24) Share repurchase (353) (369) - - Increase/(decrease) in debt (506) 1,630 205 393 Finance costs paid (221) (249) (205) (224) Change in minority interest - - (89) (89) Other financing cash flow items (357) (307) 372 311 Investing cash flows (2,370) (297) 270 368
Total cash flows (682) 178 387 307
HK China

April 27, 2016 Lifestyle International Holdings (1212.HK)
Goldman Sachs Global Investment Research 12
Disclosure Appendix
Reg AC
We, Ricky Tsang, CFA, Joshua Lu and Alan Lee, hereby certify that all of the views expressed in this report accurately reflect our personal views
about the subject company or companies and its or their securities. We also certify that no part of our compensation was, is or will be, directly or
indirectly, related to the specific recommendations or views expressed in this report.
Unless otherwise stated, the individuals listed on the cover page of this report are analysts in Goldman Sachs' Global Investment Research division.
Investment Profile
The Goldman Sachs Investment Profile provides investment context for a security by comparing key attributes of that security to its peer group and
market. The four key attributes depicted are: growth, returns, multiple and volatility. Growth, returns and multiple are indexed based on composites
of several methodologies to determine the stocks percentile ranking within the region's coverage universe.
The precise calculation of each metric may vary depending on the fiscal year, industry and region but the standard approach is as follows:
Growth is a composite of next year's estimate over current year's estimate, e.g. EPS, EBITDA, Revenue. Return is a year one prospective aggregate
of various return on capital measures, e.g. CROCI, ROACE, and ROE. Multiple is a composite of one-year forward valuation ratios, e.g. P/E, dividend
yield, EV/FCF, EV/EBITDA, EV/DACF, Price/Book. Volatility is measured as trailing twelve-month volatility adjusted for dividends.
Quantum
Quantum is Goldman Sachs' proprietary database providing access to detailed financial statement histories, forecasts and ratios. It can be used for
in-depth analysis of a single company, or to make comparisons between companies in different sectors and markets.
GS SUSTAIN
GS SUSTAIN is a global investment strategy aimed at long-term, long-only performance with a low turnover of ideas. The GS SUSTAIN focus list
includes leaders our analysis shows to be well positioned to deliver long term outperformance through sustained competitive advantage and
superior returns on capital relative to their global industry peers. Leaders are identified based on quantifiable analysis of three aspects of corporate
performance: cash return on cash invested, industry positioning and management quality (the effectiveness of companies' management of the
environmental, social and governance issues facing their industry).
Disclosures
Coverage group(s) of stocks by primary analyst(s)
Ricky Tsang, CFA: Asia Pacific Consumer and Retail, Hong Kong/China Consumer. Joshua Lu: Asia Pacific Consumer and Retail, Hong Kong/China
Consumer.
Asia Pacific Consumer and Retail: Ace Hardware Indonesia, Amorepacific, BGF Retail, China Resources Enterprise, CJ CheilJedang, CP ALL PCL, E-
Mart, Eclat Textile Co, Far Eastern Department Stores, GS Retail Co., Hyundai Department Store, KT&G, LG Household & Healthcare, Lotte Shopping,
Makalot Industrial Co, Matahari Department Store, Mitra Adiperkasa, MOMO.COM Inc., Orion, PChome Online Inc., Pou Sheng International Holdings,
President Chain Store, PT Gudang Garam Tbk, PT Hanjaya Mandala Sampoerna Tbk, PT Indofood CBP Sukses Makmur, PT Indofood Sukses Makmur
Tbk, PT Kalbe Farma Tbk, PT Unilever Indonesia Tbk, Shenzhou International Group Holdings Ltd, Shinsegae, Stella International Holdings, Sun Art
Retail Group, Taiwan FamilyMart Co. Ltd., Tingyi (Cayman Islands) Holdings, Tsingtao Brewery (A), Tsingtao Brewery (H), Uni-President China
Holdings, Uni-President Enterprises, WH Group Ltd., Yue Yuen Industrial.
Hong Kong/China Consumer: Anta Sports Products, Belle International Holdings, Chow Sang Sang Holdings, Chow Tai Fook Jewellery Group, Global
Brands Group Holding Limited, Golden Eagle Retail Group, Hengdeli Holdings, Intime Retail (Group), Li & Fung, Li Ning Co., Lifestyle International
Holdings, Luk Fook Holdings International, Sa Sa International Holdings, Samsonite International SA.
Company-specific regulatory disclosures
The following disclosures relate to relationships between The Goldman Sachs Group, Inc. (with its affiliates, "Goldman Sachs") and companies
covered by the Global Investment Research Division of Goldman Sachs and referred to in this research.
Goldman Sachs had a non-securities services client relationship during the past 12 months with: Lifestyle International Holdings (HK$11.58)
Distribution of ratings/investment banking relationships
Goldman Sachs Investment Research global Equity coverage universe
Rating Distribution Investment Banking Relationships
Buy Hold Sell Buy Hold Sell
Global 32% 53% 15% 65% 58% 51%
As of April 1, 2016, Goldman Sachs Global Investment Research had investment ratings on 3,029 equity securities. Goldman Sachs assigns stocks as
Buys and Sells on various regional Investment Lists; stocks not so assigned are deemed Neutral. Such assignments equate to Buy, Hold and Sell for
the purposes of the above disclosure required by the FINRA Rules. See 'Ratings, Coverage groups and views and related definitions' below. The
Investment Banking Relationships chart reflects the percentage of subject companies within each rating category for whom Goldman Sachs has
provided investment banking services within the previous twelve months.

April 27, 2016 Lifestyle International Holdings (1212.HK)
Goldman Sachs Global Investment Research 13
Price target and rating history chart(s)
Regulatory disclosures
Disclosures required by United States laws and regulations
See company-specific regulatory disclosures above for any of the following disclosures required as to companies referred to in this report: manager
or co-manager in a pending transaction; 1% or other ownership; compensation for certain services; types of client relationships; managed/co-
managed public offerings in prior periods; directorships; for equity securities, market making and/or specialist role. Goldman Sachs trades or may
trade as a principal in debt securities (or in related derivatives) of issuers discussed in this report.
The following are additional required disclosures: Ownership and material conflicts of interest: Goldman Sachs policy prohibits its analysts,
professionals reporting to analysts and members of their households from owning securities of any company in the analyst's area of
coverage. Analyst compensation: Analysts are paid in part based on the profitability of Goldman Sachs, which includes investment banking
revenues. Analyst as officer or director: Goldman Sachs policy prohibits its analysts, persons reporting to analysts or members of their
households from serving as an officer, director, advisory board member or employee of any company in the analyst's area of coverage. Non-U.S. Analysts: Non-U.S. analysts may not be associated persons of Goldman, Sachs & Co. and therefore may not be subject to FINRA Rule 2241 or FINRA
Rule 2242 restrictions on communications with subject company, public appearances and trading securities held by the analysts.
Distribution of ratings: See the distribution of ratings disclosure above. Price chart: See the price chart, with changes of ratings and price targets in
prior periods, above, or, if electronic format or if with respect to multiple companies which are the subject of this report, on the Goldman Sachs
website at http://www.gs.com/research/hedge.html.
Additional disclosures required under the laws and regulations of jurisdictions other than the United States
The following disclosures are those required by the jurisdiction indicated, except to the extent already made above pursuant to United States laws
and regulations. Australia: Goldman Sachs Australia Pty Ltd and its affiliates are not authorised deposit-taking institutions (as that term is defined in
the Banking Act 1959 (Cth)) in Australia and do not provide banking services, nor carry on a banking business, in Australia. This research, and any
access to it, is intended only for "wholesale clients" within the meaning of the Australian Corporations Act, unless otherwise agreed by Goldman
Sachs. In producing research reports, members of the Global Investment Research Division of Goldman Sachs Australia may attend site visits and
other meetings hosted by the issuers the subject of its research reports. In some instances the costs of such site visits or meetings may be met in part
or in whole by the issuers concerned if Goldman Sachs Australia considers it is appropriate and reasonable in the specific circumstances relating to
the site visit or meeting. Brazil: Disclosure information in relation to CVM Instruction 483 is available at
http://www.gs.com/worldwide/brazil/area/gir/index.html. Where applicable, the Brazil-registered analyst primarily responsible for the content of this
research report, as defined in Article 16 of CVM Instruction 483, is the first author named at the beginning of this report, unless indicated otherwise at
the end of the text. Canada: Goldman Sachs Canada Inc. is an affiliate of The Goldman Sachs Group Inc. and therefore is included in the company
specific disclosures relating to Goldman Sachs (as defined above). Goldman Sachs Canada Inc. has approved of, and agreed to take responsibility for,
this research report in Canada if and to the extent that Goldman Sachs Canada Inc. disseminates this research report to its clients. Hong Kong: Further information on the securities of covered companies referred to in this research may be obtained on request from Goldman Sachs
(Asia) L.L.C. India: Further information on the subject company or companies referred to in this research may be obtained from Goldman Sachs
(India) Securities Private Limited, Research Analyst - SEBI Registration Number INH000001493, 951-A, Rational House, Appasaheb Marathe Marg,
Prabhadevi, Mumbai 400 025, India, Corporate Identity Number U74140MH2006FTC160634, Phone +91 22 6616 9000, Fax +91 22 6616 9001. Goldman
Sachs may beneficially own 1% or more of the securities (as such term is defined in clause 2 (h) the Indian Securities Contracts (Regulation) Act,
1956) of the subject company or companies referred to in this research report. Japan: See below. Korea: Further information on the subject
company or companies referred to in this research may be obtained from Goldman Sachs (Asia) L.L.C., Seoul Branch. New Zealand: Goldman
Sachs New Zealand Limited and its affiliates are neither "registered banks" nor "deposit takers" (as defined in the Reserve Bank of New Zealand Act
1989) in New Zealand. This research, and any access to it, is intended for "wholesale clients" (as defined in the Financial Advisers Act 2008) unless
otherwise agreed by Goldman Sachs. Russia: Research reports distributed in the Russian Federation are not advertising as defined in the Russian
legislation, but are information and analysis not having product promotion as their main purpose and do not provide appraisal within the meaning of
the Russian legislation on appraisal activity. Singapore: Further information on the covered companies referred to in this research may be obtained
from Goldman Sachs (Singapore) Pte. (Company Number: 198602165W). Taiwan: This material is for reference only and must not be reprinted
without permission. Investors should carefully consider their own investment risk. Investment results are the responsibility of the individual
investor. United Kingdom: Persons who would be categorized as retail clients in the United Kingdom, as such term is defined in the rules of the
Financial Conduct Authority, should read this research in conjunction with prior Goldman Sachs research on the covered companies referred to
herein and should refer to the risk warnings that have been sent to them by Goldman Sachs International. A copy of these risks warnings, and a
glossary of certain financial terms used in this report, are available from Goldman Sachs International on request.
European Union: Disclosure information in relation to Article 4 (1) (d) and Article 6 (2) of the European Commission Directive 2003/125/EC is available
at http://www.gs.com/disclosures/europeanpolicy.html which states the European Policy for Managing Conflicts of Interest in Connection with
Investment Research.
Japan: Goldman Sachs Japan Co., Ltd. is a Financial Instrument Dealer registered with the Kanto Financial Bureau under registration number Kinsho
69, and a member of Japan Securities Dealers Association, Financial Futures Association of Japan and Type II Financial Instruments Firms
21.923.6
18.6 19 18.7
18.620
17.6
17.1
1614.5
10,00010,50011,00011,50012,00012,50013,00013,50014,00014,50015,000
5.007.009.00
11.0013.0015.0017.0019.0021.0023.0025.00
Lifestyle International Holdings (1212.HK)
Goldman Sachs rating and stock price target history
Stock Price Currency : Hong Kong Dollar
Source: Goldman Sachs Investment Research for ratings and price targets; FactSet closing prices as of 3/31/2016.
The price targets show n should be considered in the context of all prior published Goldman Sachs research, which may or may not have included price targets, as w ell as developments relating to the company, its industry and financial markets.
Rating
Price target
Price target at removal
Covered by Ricky Tsang, CFA,as of Jun 16, 2014
Not covered by current analyst
MSCI Hong Kong
Inde
xPr
ice
Sto
ckPr
ice
MB
J J A S O N D J F M A M J J A S O N D J F M A M J J A S O N D J F M
2013 2014 2015 2016

April 27, 2016 Lifestyle International Holdings (1212.HK)
Goldman Sachs Global Investment Research 14
Association. Sales and purchase of equities are subject to commission pre-determined with clients plus consumption tax. See company-specific
disclosures as to any applicable disclosures required by Japanese stock exchanges, the Japanese Securities Dealers Association or the Japanese
Securities Finance Company.
Ratings, coverage groups and views and related definitions
Buy (B), Neutral (N), Sell (S) -Analysts recommend stocks as Buys or Sells for inclusion on various regional Investment Lists. Being assigned a Buy
or Sell on an Investment List is determined by a stock's return potential relative to its coverage group as described below. Any stock not assigned as
a Buy or a Sell on an Investment List is deemed Neutral. Each regional Investment Review Committee manages various regional Investment Lists to a
global guideline of 25%-35% of stocks as Buy and 10%-15% of stocks as Sell; however, the distribution of Buys and Sells in any particular coverage
group may vary as determined by the regional Investment Review Committee. Regional Conviction Buy and Sell lists represent investment
recommendations focused on either the size of the potential return or the likelihood of the realization of the return.
Return potential represents the price differential between the current share price and the price target expected during the time horizon associated
with the price target. Price targets are required for all covered stocks. The return potential, price target and associated time horizon are stated in each
report adding or reiterating an Investment List membership.
Coverage groups and views: A list of all stocks in each coverage group is available by primary analyst, stock and coverage group at
http://www.gs.com/research/hedge.html. The analyst assigns one of the following coverage views which represents the analyst's investment outlook
on the coverage group relative to the group's historical fundamentals and/or valuation. Attractive (A). The investment outlook over the following 12
months is favorable relative to the coverage group's historical fundamentals and/or valuation. Neutral (N). The investment outlook over the
following 12 months is neutral relative to the coverage group's historical fundamentals and/or valuation. Cautious (C). The investment outlook over
the following 12 months is unfavorable relative to the coverage group's historical fundamentals and/or valuation.
Not Rated (NR). The investment rating and target price have been removed pursuant to Goldman Sachs policy when Goldman Sachs is acting in an
advisory capacity in a merger or strategic transaction involving this company and in certain other circumstances. Rating Suspended (RS). Goldman
Sachs Research has suspended the investment rating and price target for this stock, because there is not a sufficient fundamental basis for
determining, or there are legal, regulatory or policy constraints around publishing, an investment rating or target. The previous investment rating and
price target, if any, are no longer in effect for this stock and should not be relied upon. Coverage Suspended (CS). Goldman Sachs has suspended
coverage of this company. Not Covered (NC). Goldman Sachs does not cover this company. Not Available or Not Applicable (NA). The
information is not available for display or is not applicable. Not Meaningful (NM). The information is not meaningful and is therefore excluded.
Global product; distributing entities
The Global Investment Research Division of Goldman Sachs produces and distributes research products for clients of Goldman Sachs on a global
basis. Analysts based in Goldman Sachs offices around the world produce equity research on industries and companies, and research on
macroeconomics, currencies, commodities and portfolio strategy. This research is disseminated in Australia by Goldman Sachs Australia Pty Ltd
(ABN 21 006 797 897); in Brazil by Goldman Sachs do Brasil Corretora de Títulos e Valores Mobiliários S.A.; in Canada by either Goldman Sachs
Canada Inc. or Goldman, Sachs & Co.; in Hong Kong by Goldman Sachs (Asia) L.L.C.; in India by Goldman Sachs (India) Securities Private Ltd.; in
Japan by Goldman Sachs Japan Co., Ltd.; in the Republic of Korea by Goldman Sachs (Asia) L.L.C., Seoul Branch; in New Zealand by Goldman Sachs
New Zealand Limited; in Russia by OOO Goldman Sachs; in Singapore by Goldman Sachs (Singapore) Pte. (Company Number: 198602165W); and in
the United States of America by Goldman, Sachs & Co. Goldman Sachs International has approved this research in connection with its distribution in
the United Kingdom and European Union.
European Union: Goldman Sachs International authorised by the Prudential Regulation Authority and regulated by the Financial Conduct Authority
and the Prudential Regulation Authority, has approved this research in connection with its distribution in the European Union and United Kingdom;
Goldman Sachs AG and Goldman Sachs International Zweigniederlassung Frankfurt, regulated by the Bundesanstalt für
Finanzdienstleistungsaufsicht, may also distribute research in Germany.
General disclosures
This research is for our clients only. Other than disclosures relating to Goldman Sachs, this research is based on current public information that we
consider reliable, but we do not represent it is accurate or complete, and it should not be relied on as such. The information, opinions, estimates and
forecasts contained herein are as of the date hereof and are subject to change without prior notification. We seek to update our research as
appropriate, but various regulations may prevent us from doing so. Other than certain industry reports published on a periodic basis, the large
majority of reports are published at irregular intervals as appropriate in the analyst's judgment.
Goldman Sachs conducts a global full-service, integrated investment banking, investment management, and brokerage business. We have
investment banking and other business relationships with a substantial percentage of the companies covered by our Global Investment Research
Division. Goldman, Sachs & Co., the United States broker dealer, is a member of SIPC (http://www.sipc.org).
Our salespeople, traders, and other professionals may provide oral or written market commentary or trading strategies to our clients and principal
trading desks that reflect opinions that are contrary to the opinions expressed in this research. Our asset management area, principal trading desks
and investing businesses may make investment decisions that are inconsistent with the recommendations or views expressed in this research.
The analysts named in this report may have from time to time discussed with our clients, including Goldman Sachs salespersons and traders, or may
discuss in this report, trading strategies that reference catalysts or events that may have a near-term impact on the market price of the equity
securities discussed in this report, which impact may be directionally counter to the analyst's published price target expectations for such stocks. Any
such trading strategies are distinct from and do not affect the analyst's fundamental equity rating for such stocks, which rating reflects a stock's
return potential relative to its coverage group as described herein.
We and our affiliates, officers, directors, and employees, excluding equity and credit analysts, will from time to time have long or short positions in,
act as principal in, and buy or sell, the securities or derivatives, if any, referred to in this research.
The views attributed to third party presenters at Goldman Sachs arranged conferences, including individuals from other parts of Goldman Sachs, do
not necessarily reflect those of Global Investment Research and are not an official view of Goldman Sachs.
Any third party referenced herein, including any salespeople, traders and other professionals or members of their household, may have positions in
the products mentioned that are inconsistent with the views expressed by analysts named in this report.
This research is not an offer to sell or the solicitation of an offer to buy any security in any jurisdiction where such an offer or solicitation would be
illegal. It does not constitute a personal recommendation or take into account the particular investment objectives, financial situations, or needs of
individual clients. Clients should consider whether any advice or recommendation in this research is suitable for their particular circumstances and, if
appropriate, seek professional advice, including tax advice. The price and value of investments referred to in this research and the income from them

April 27, 2016 Lifestyle International Holdings (1212.HK)
Goldman Sachs Global Investment Research 15
may fluctuate. Past performance is not a guide to future performance, future returns are not guaranteed, and a loss of original capital may occur.
Fluctuations in exchange rates could have adverse effects on the value or price of, or income derived from, certain investments.
Certain transactions, including those involving futures, options, and other derivatives, give rise to substantial risk and are not suitable for all investors.
Investors should review current options disclosure documents which are available from Goldman Sachs sales representatives or at
http://www.theocc.com/about/publications/character-risks.jsp. Transaction costs may be significant in option strategies calling for multiple purchase
and sales of options such as spreads. Supporting documentation will be supplied upon request.
All research reports are disseminated and available to all clients simultaneously through electronic publication to our internal client websites. Not all
research content is redistributed to our clients or available to third-party aggregators, nor is Goldman Sachs responsible for the redistribution of our
research by third party aggregators. For research, models or other data available on a particular security, please contact your sales representative or
go to http://360.gs.com.
Disclosure information is also available at http://www.gs.com/research/hedge.html or from Research Compliance, 200 West Street, New York, NY
10282.
© 2016 Goldman Sachs.
No part of this material may be (i) copied, photocopied or duplicated in any form by any means or (ii) redistributed without the prior written consent of The Goldman Sachs Group, Inc.