spons agency national center for educational … of the country, sex, color ... recognizing literary...
TRANSCRIPT

ED 079 685
AUTHORTITLEINSTITUTION
SPONS AGENCY
REPORT NOPUB DATENOTEAVAILABLE FROM,
EDRS PRICEDESCRIPTORS
'IDENTIFIERS
ABSTRACT
DOCUMENT RESUME
CS 000 615
Brown, Rexford G..Literature: Summary Data..Education Commission of the States, Denver, Colo.:National Assessment-of Educational Progress..National Center for Educational Statistics (=WM,Washington, D.C.R-02-L-00Jun 73115p..Superintendent of DocuMents, U.S.. Government PrintingOfficee.WashingioP, D.C.-20402 ($1.251 -
MF-$0.65 HC-$6.58Age Differences; *Educational Diagnosis; EIeaentaryEducation; English Instruction; Fictiop; FigurativeLanguage; *Literary Discrimination; *Literary Genres;*Literature AppreciationvMythologyi Parody; Poetry;Racial Differences; *Reading Habits; ReadingInterests;' Secondary Education; Sex Differences*National Assessment of Educational Progress
This section of the 1970-1971 National Assessment ofEducational Progress presents summary_dati for the responses toliterature assessment...Data is presented in graph and tabular formand discussed in detail for the educational attainments of nine yearolds, thirteen year olds, seventeen year olds, and adults (ages.26-35)..The data is also categorized according to region of thecountry, sex, color (blacks and whites), level of parental education,size and type of-community, and size of community groups..The reportassessed attainments in four areas or themes: (1) understandingimaginative language, (2) responding to literature, (3,) recognizigg
literary works and characters, and (4) reading habits._Discussionsare provided of how various groups performed on each of these themes,the: results according to various objectives of the assessment, andhow the various age groups performed on these themes.. (DI)

U S. DEPARTME NT OF HEALTH,EDUCATION &WELFARENATIONAL INSTITUTE OF
EDUCATIONTHIS DOCUMENT HAS SEEN REPROOUCED EXACTLY AS RECEIVED PROMTHE PERSON OR ORGANIZATION ORIGINATING IT POINTS OF VIEW OR °pistolsSTATED DO NOT NECESSARILY RERESENT OFFICIAL NATIONAL INSTITUTE OFEDUCATION POSITION OR POLICY
-REPORT 02-L-00
SUMMARY DATA
1970-71 Asstssmont

NATIONAL ASSESSMENT OF EDUCATIONAL .PROGRESS
A PrOject of the Education Commission of the States
Winfield Dunn, Governor of Tennessee, Chairman, Education Commission of the StatesWendell H. Pierce, Executive Director, Education Commission of the States
James A. Hazlett, Administrative Director, National Assessment
I Assessment Reports
# 1 Science: National Results July, 1970# 2 Citizenship: National Results November, 1970# 3 Writing: National Results November, 1970# 4 Science: Group 'Results A 'April, 1971# 5 Writing: Group Results A April, 1971# 6 Citizenship: Group Results A July, 1971# 8 Writing: Writing Mechanics February, 1972# 9 Citizenship: Group Results B May, .1972#02-GIY Reading and Literature: General Information Yearbook May, 1972#10 Writing: Selected Essays November, 1972#02-R-09 Reading: Reading Rate and Comprehension (Theme 9) December, 1972#02-L-01 Literature: Understanding Imaginative
Language (Theme 1) March, 1973#02 -L-20- Literature: Released Exercises April, 1973#02 -L -02 Literature: Responding to Literature (Theme 2) April, 1973#02-R-01 Reading Understanding Words and Word Relationships
(Theme 1) April, 1973#02-L-03 Literature: Recognizing Literary Works
and Characters (Theme 3) April, 1973t Science: Group Results B May, 1973#11 Writing: Group Results A & B May, 1973#02-R-08 Reading: Critical Reading (Theme 8) May, 1973#02-L-04 Literature: A Survey of Reading Habits (Theme 4)_ May, 1973#02-R-03 Reading: Written Directions (Theme 8) May, 1973#02-R-05 Reading: Gleaning Significant Facts
from Passages (Theme 5) May, 1973#02-R-02 Reading: Graphic Materials (Theme 2) June, 1973#02 -L -00 Literature: Summary Data June, 1973
The project reported herein was performed pursuant to a grant from the NationalCenter for Educational Statistics of the U.S. Office of Education, Department of Health,Education, and Welfare. However, the. opinions expiessed herein do not necessarily re-flect the position or policy of the U.S. Office of Education, and no official endorsementby the U.S. Office of Education should be inferred.
This report was made possible in part by funds granted by Carnegie Corporation ofNew York and the Ford Foundation's Fund for the Advancement of Education. Thestatements made and views expressed are solely the responsibility of National Assess-ment of Educational Progress, a project of the Education Commission of the States.
Education Commission of the StatesSuits 300, 1860 Lincoln Street
Denver, Colorado 80203

NATIONAL
A Project of
ASSESSMENT OF EDUCATIONAL PROGRESS
the Education Commission of the States
REPORT
LITERATURE:
02 -L =00
SUMMARY DATA
June, 1973
For site by the Superintendent of Documents, U.S. Government Printing OfficeWashington; D.C. 20402

NATIONAL ASSESSMENT OF EDUCATIONAL. PROGRESS
James A. Hazlett J. Stanley AhmannAdministrative Director Staff Director
George H. Johnson- Associate Staff Director
This report was written by Rexford G. Brown, Assistant to theDirector, Research and Analysis Department, National Assessment
of Educational Progress.
Staff support was provided by:
Operations DepartmentExercise Development DepartmentInformatiCn Services DepartmentResearch and Analysis_ DepartmentUtilization/Applications DepartmentData Processing Services Department (ECS-)
The following members of the NAEP --Analysis Advisory Committeeprovided valuable guidance for-fhe-Literature reports:
William E. CoffmanUniversity of Iowa
John GilbertHarvard University
Lyle V. JonesUniversity of North Carolina
Frederick HostellerHarvard University
John W. Tukey (Chairman)Princeton University

TABLE.. OF CONTENTS
Introduction
Chapter 1: Theme 1: Understanding ImaginativeLanguage
Chapter 2: Theme '2: Responding to Literature 17
Chapter 3: Theme 3: Recognizing Literary.Worksand Characters 23
Chapter 4: Theme 4: A Survey of ReadingHabits 39
Chapter 5: Group Performance on Themes 55
Chapter 6: Results by Objectives 57
Chapter 7: Age Comparisons 63
Appendix A ,105
INTRODUCTION
Each year, beginning with its second assessment year, theNational Assessment of Educational Progress publishes a GeneralInformation Yearbook which describes all major aspects of theAssessment's operation. The reader who desires more detailedinformation about how National. Assessment defines its groups,prepares and scores its exercises, designs its'sample andanalyzes and reports its results, should consult the GeneralInformation Yearbook for. Year 02, Reading and LiteraTa7-(02-GIY).
Briefly, the National Assessment of Educational Progress isan information gathering project which surveys the educationalattainments of 9-year-olds, 13-year-olds, 17-year-olds and adults.(ages 26-35) in ten subject areas: Art, Career and OccupationalDevelopment, Citizenship, Literature, Mathematics, Music, Reading,Science, Social Studies and Writing. Two areas are assessedevery year and all areas are'periodically reassessed in order tomeasure educational progress. Each assessment is the product ofseveral years' work,by a great many educators, scholars and laypersons from all over the country. Initially, these peopledesign objectives for each area, proposing specific goals whichthey feel Americans should be achieving in the course of theireducation. These goals are reviewed by more people and thenpassed along to developers of tests, whose task it is to createmeasurement tools appropriate to the objectives.
When the exercises prepared by the test developers havepassed extensive reviews by specialists in the subject matter andin measurement, they are administered to probability samples ofvarious populations. The people who comprise those samples arechosen in such a way that the results of their assessment can begeneralized to an entire national population. That is, on thebasis of the performance of about 2,500 9-year-olds on a givenexercise, we can generalize about the probable performance ofall 9-year-olds in the nation.
After assessment data has been collected and analyzed,National Assessment publishes its theme and summary reports.Theme reports focus upon groups of exercises that are related toone, another. Usually, they are related because each representsan attempt to measure achievement of the same general objective,skill, knowledge or attitude. A summary report presents ageneral overview of. all results, with particular emphasis uponmedian group performances relative to national performance.

In Literature, there are four theme reports. The first,Understanding Imaginative Language, presents the results for allreleased exercises that measure specific competencies in dealingwith imaginative language. The second theme, Responding toLiterature, is comprised of all, released exercises that call forwritten or verbal responses to works of literature. The third,Recognizing Literary Works and Characters, presents the resultsof all exercises requiring knowledge of specific works orfigures. And the fourth, A Survey of Reading,Habits, deals withreading frequency ques,tiond, reading inventories and attitudequestions. The exercises. covered in Themes 1 and 2 relate toLiterature Objective II: become engaged, in, find meanings in,and evaluate a work of literature. ,Theme 3 exercises measureachievement of Objective I: read literature of excellence, andTheme 4. questions bear both on Objective I and Objective III:develop a continuing interest and participation in literatureand the literary experience.
Theme renorts present results exercise by exercise. Summary--reports like this one, however, deal with the larger picture and
rely more heavily on median-percentages derived from a number ofresults. The theme reports are more concrete and particularsince they include actual exercises, scoring rationales, sampleresponses and so on. The summary report is more general, shift-ing the emphasis to overall performance-patterns for variousgroups of people.
National Assessment divides the national population intogroups in order to provide data about certain types of schoolsand students. The variables it uses are region of the country,sex, color, parental education and size and type of community.Within each variable there are at least two groups. Each of thevariables and groups is fully defined in the General InformationYearbook, but the following explanations may serve the reader'spurposes:
Region. The country has been divided into four regions- -Southeast, West, Central and Northeast--in order to presentresults for various regions relative to the national results.
Sex. For every exercise we present the results obtained bymales and by females.
Color. Currently, we present results for Blacks and Whites.
Parental Education. The four parental education categoriesare defined by the highest level of education attained by eitherof .a person's parents. The no high school category is comprisedof all people who indicated that neither parent went to'highschool. The some high school category consists of all those whoindicated that the parent with the most education attended high
vi

school but did not graduate. In the graduated from high schoolcategory are all those who indicated that at least one parentgraduated from high school, and in the post high school group areall who indlcated that at least one parent received some posthigh school education. (This may mean college, but it alsoincludes adult education courses of any kind, vocational train -ing,,etc.)
Size and Type of Community (STOC). The categories or groupswithin this variable are defined by.the size of a person's com-munity and an-occupational profile of the area his school serves.Again, the reader should consult the General Information Yearbookfor precise definitions of these groups.
1. Extreme Inner City. People in this category attendschools in cities with populations greater than150,000; the schools serve areas in which.a highproportion of the residents are on welfare or notregularly employed.
2. Extreme Rural People in this category attendschools in a community having a population lessthan 3,500. Most residents in the area the schoolserves are farmers or firm workers.
3. Extreme Affluent Suburb. Individuals in thisgroup attend schools within the city limits orresidential area served by a city with & popula-tion greater than 150,000; the area served bythe school consists primarily of profesiional ormanagerial personnel.
4. Rest of Big City. These are students attendingschools in a big city (population gre r than.200,000) who are not included in*eitt theextreme inner city or extreme affluent suburbgroups.
5. Medium Size City. Individuals in this categoryattend schools in cities with populations between25,000 and 200,000.
6. Small City. People in this group attend schoolsin a community of less than 25,000 inhabitants.
7. Suburban Fringe. People in this group attendschools in the metropolitan area served by a citywith more than 200,000 inhabitants; the schooland the area it serves are outside of the citylimits.
vii

Size of Community Groups. The results for 9-, 13- and 17-year -olds who are in school can be presented in terms of theseSTOC categories. However, we do not have the information neces-sary to present the results for adults and out-of-school 17-year-olds in the same way. Consequently, the following less specificbreakdown of results appears for all 17-year-olds (in- and outof-school) and young adults:
1. Big City. In this group, are all-adults and out-of-school 17-year-olds who live in cities with morethan 200,000 inhabitants; also included are 17-year -olds who attend schools in the same sizedcities.
2. Urban Fringe. This category consists of adultsand out-of-school 17-year-olds who live in themetropolitan area served by a big city; but out-side of the city It also includes 17-year -olds attending school in such areas.
3. Medium Size City. This category is comprised ofadults and out-of-school 17-year-olds who livein communities with populations between 25,000and 200,000; it also includes 17-year-oldsattending schools in such communities.
4. Small Places Adults and 17-year-olds who liveor attend school in communities with populationsunder 25,000 fall into this group.
Limitations of the Data
Within the limitations due to measurement." and samplingerror,2 the obtained data as presented in National Assessment
'Measurement error stems from three sources: (1) the measuringinstrument--in our case, the exercises--may have imperfectionssuch as ambiguity or a built-in tipoff to the correct response;(2) the respondent's physical condition (permanent or temporary),emotional or attitudinal condition (again permanent or temporary)and motivation; and (3) the measurement situation--temperature,lighting, pleasantness of surroundings; noise level and the testadministrator.
2See Chapter 10 and Appendix C, General Information Yearbook(02-GIY) for a discussion of sampling error.
viii
J

reports accurately describe the educational, achievements ofcertain groups as they actually exist in the real world.
When t-41 data show that a group has achieved either aboveor below the nation as a whole, one must exercise great cautionin speculating about the causes of these obtained differences.Many factors may affect an individual's ability to give accept-able responses to exercises in the assessed subject areas.Consider, for example, a hypothetical group whose achievement iswell above the national. average. Most members of the group mayattend schools which have excellent physical facilities and highquality faculties, belong to families which have attained a highsocio-economic level, have well-educated parents, come from homeswith many reading materials and so on. All these factors couldcontribute to the group's high level of achievement, whilemembership in the group itself may contribute very little ornothing.
The name of a group is merely a categorical label. When welook at the data for a given group, therefore,. we cannot say thatany difference in achievement between that group and the nationas a whole is attributable solely to membership in that group.In other words, a group mus not be construed as necessarily beingthe cause or even being a cause for the comparatively high orow achievement of that group as compared to the nation as a
whole. Often, a disproportionately large percentage of the mem-bers of a group of interest are also members of particular groupsdefined by other factors. All these factors may contribute tothe group's high (or low) level of achievement.
All the limitations imposed on the data for-individual exer-cises apply to summary data as well. In addition, the readermust understand clearly the concept of the "median difference (oreffect)" which is used so often in our summary statistics. Agroup's difference is simply the difference between its percent-age of success on an exercise and the national percentage ofsuccess. In a theme consisting of 30 exercises, a group wouldhave 30 differences; its median difference for a theme or objectivewould be that difference above and below which half of its dif-ferences (15, to be exact) lie. Note that this is not the samething as a mean or average of then-NITUFEER7-NYFirraiira group's median effect to a national level of performance wecan determine whether, over a large number of exercises, a groupconsistently performs below or above a national performance level.The fewer exercises a median effect is based on, the less repre-sentative it may be of a group's performance.
When we compare the median effects for a given group acrossthemes, objectives or age levels, nearly equal median effectsindicate that the group's performance level has changed from themeto theme, objective to objective or age level to age level to
ix

about the same extent iagat the national performance level haschanged--whether such change be large or small. The group hasmaintained a constant position relative to the national level.To the degree that a group's median effects are unequal, the grouphas changed to a greater or lesser extent than the nation as awhole.
WheneVer data are summarized, same information is lott. Themedian effect provides a numerical value that describes a group'soverall performance on a set of exercises; it does not tell us,however, on which exercises a group performs quite differsantlythan we-would expect on the basis of its overall behavior. if agroup effect departs from the group's median effect by an amountat legst two and one half times as large as the pooled standarderror of all the group's effects for a given set of exercises(theie or objective), -the group's-performance on that exerciseis atypical.
For the limitations of age comparisons, see Repoe. 8, WritingMechanics, pp. 131-133.
S
3Chapter 10 and Appendix C of the General-Information Yearbook(Report 02-GIY) discuss the meaning ant use of the stars ad
Appendix C gives the formula for the pooled standard error we use.

CHAPTER 1
THEME 1: UNDERSTANDING IMAGINATIVE LANGUAGE
There are five kinds of exercises in the, first theme volume:missing line exercises, designed to assess rudimentary skill infollowing rhythm or logic (or both) in poetry; pun exercises,designed to determine ability to recognize puns in passages whichmay or may not contain puns; metaphor exercises, which assessrecognition of the tenor and vehicle of specific metaphors inpoems; form similarity exercises, requiring people to identifysimilar passages and choose the genre which best describes them;and inference exercises, requiring identification of the tone ormood of a passage and a written defense of the answer.
There was, as one might expect, a steady increase-in success-ful performance from age 9 to 13 to 17, followed by a slight dropin adult performance.
At,all age levels, certain groups of people usually hadhigher percentages of success than the entire population, andcertain groups performed below the national level. Regionally,for inscance, the Southeast was consistently below the nationallevel of achievement and- the Central region was consistentlyabove it. At age 13, the Northeast was about even with theCentral region, and at the adult level, the West joined it.
Females consistently performed better than males at the threelower age levels, but at the adult level there was little differ-ence betigeen them.
Blacks, as a group, always had lower percentages of successthan-the national percentage; Whites, as a group, consistentlydid better than the nation as a whole.
At all four ages, levels of parental education correlatedhighly with percentages of success: that is, as a group, peoplewhose parents have had no high school education consistentlyperformed less successfully than the nation did; those who hadat least one parent with some high school training performed some-what better but were often below the national percentage of suc-cess; those with at least one parent.who graduated from highschool usually did as well as the national population did; andthose who had at least one parent with post high school educationalmost always achieved percentages of success significantlygreater than the national figure.
1

The results according to size and type of community groupsreveal that students who attend inner city schools do not donearly as well as all students taken together, whereas studentsattending urban schools which serve predominantly professionalcommunities perform much better than the national population.
The performance of the various'groups relative to eachother and to the national performance is generally consistentthroughout-the four Literature themes and even the eight volumesof our report on the Reading assessment. Clearly, some groupsof people demonstrate a general reading disadvantage, not simplya disadvantage with respect to understanding imaginative language.For even on the most elementary reading tasks, those groups donot achieve percentages of success as high as the nation's;naturally, as tasks become more sophisticated their disadvantagebecomes more obvious.
`Following is a discussion of the overall Theme 1 results foreach age grOap. The median percentages used in this overview-enable us to compare the performances of various groups to thenational performance over a number of exercises.
In Exhibits A-D, each box represents the difference in per-formance between a group and the nation as a whole on a particularexercise. For example, in Exhibit A, the bottom box in the SEcolumn shows that the Southeast was 13% below the national per-centage on that exercise. The arrows depict the median of thedifferences for a group, enabling the reader to see how far aboveor below the national level each group's median difference lies.For example, the median difference for the Southeast in the sameexhibit is -4.6%. Empty boxes correspond to exercise differenceswhich were considered atypically above or below the group mediandifference. These exercises are referred to in the discussion ashaving produced unusually high or low results for a particulargroup relative to its median difference.
Overall Group Results for 9-Year=Olds
Percentages of success on 18 exercises in the theme rangedfrom 7% to 91%, and the median national percentage was 51.6 % --in other words, half the percentages were greater than 51.6%,half were less.
On most exercises (13 of the 18), females did better thanmales. This was especially noticeable on inference exercises,which required written responses, and form similarity questions.The female median difference was 1.5%, and the male median dif-ference was -1.5%.
2
The median difference between Black and national resultswas -13.7%. On no exercise reported in this theme was the Blackpercentage of success as high as the national level. On formSimilarity exercises, it was about 20 points lower. Nine-year-old Whites nearly always performed slightly better than all9-year-olds.
"Children in the no high school parental education categorygenerally performed less well than those whose parents had at leastsome-high school education. This group's results were particularlylow on metaphor and form exercises (see R113 and R117, for instance).Its median difference was -5.6%. The some high school group didsomewhat better (it was above the national percentage on five exer-cises) and the graduated from high school group generally performedon a par with all 9-year-olds. Children whose parents have hadmore than a high school education demonstrated a deesive advantagethroughout the Literature assessment. Their group percentage wasalways above the national level of achievement and their advantagewas particularly great on exercises which 9-year-olds in generalfound difficult.
The extreme inner city group performed consistently below thenational level of performance. On nine of the exercises its per-centage was more than 14.5 points below the national figure, andon eight it was between -14.5.and 0; only once was its percentageequal to or better than the national result. The extreme ruralgroup's median difference was -3.3%. On three exercises itsresults were better than the national results--see especially Exer-cise R101--but on the other 15 exercises, its percentages werealways lower. Over-all the exercises, students in the rest of bigcity, medium city and small city categories achieved results simi-lar to the national results. The'suburban fringe group had a per-centage of success equal to or greater than the national figureon 15 exercises. Its median difference was 2. -5 %. On no exercisedid the extreme affluent suburb group perform below the nationalpercentage of success.' On one form exercise (R117) its advantagewas 16.4%. Half the time its percentage of success was 6.8%above the national figure, and half the time it was less than 6.8%.But almost always this group registered significantly higher per-centages of success than all 9-year-olds together achieved.
Overall Group Results for 13-Year-Olds
Percentages of success on 29 exercises in this theme rangedfrom 10.3% to 87% and the median national percentage was 64.9%.Exhibit B reveals that the Northeast and Central regional groupsgenerally performed slightly better than all 13-year-olds. Themedian difference was 1.9% for both regions. For the West, it was1%. Southeastern students did not do as well as all 13-year-olds,
3

ZS.
Ma
I S -
worm P. DISTRIBUTION ar 6R13UP orresetices rot PLL
ma t exescses POE
R E 6 t N S E X COL OR
.
SEW C NE Pt F S W
s-aw 11X ax ia -tX is -137 VI
4

4
CCHEM R. DISTRIEMON Or GROUP DIFFERENCES run PLLTHEME I EXERCISES --- PEE 9
PORCH T Bite FIND T YPECD U Cfl TION o r COMM-UNITY
1
WNWMe OHM an PHI QC Qt pc NC PIIIC or am
ita PP -taw -2.2 Ala t a ZII Rd
5
since on all of the 29 exercises their figure was below thenational figure. Their median difference was -5.7%.
On 20 of the 29 exercises, the percentage of success forfemales was above the national percentage. They did particularlywell on the inference exercises, which required written responses.Males, with a -1.7% median difference, were generally below the
females. But on some exercises--notably missing-line ExerciseR103, and metaphor Exercises R114 A and B--they did unusually well.
As at age 9, Blacks did not register percentages as high asthe national figures--they were below it on all of the 29 exer-cises. However, on some exercises they did unusually well rela-tive to their normal performance--see, for instance, the secondpart of Exercise R114 B. The White, median difference was 2.9%.As.a group, Whites did unusually well on R114 A.
Thirteenryear-olds in the no high school parental educationgroup never achieved results as high as all 13-year-olds did onany of the 29 exercises. The median difference for that groupwas -11.6%, and for the some high school group it was -4.3%.The results for the graduated from high school group were equal toor better than the national results on 16 of the 29 exercises.This group did particularly well (relative to its usual perfor-mance) on R125, an inference exercise. The post high schoolgroup's median difference was 7.1%. The results for this groupwere always better than the results obtained by all 13-year-olds.
Of all the STOC groups, the extreme inner city group con-sistently registered the lowett percentages of success. Itsmedian difference was -7.5%. Rural students were often below thenational level of achievement too; their median difference was-4%. The rest of big city category's percentages were above thenational figure on 12 of 29 exercises; the group's results wereunusually low on exercises requiring writing. The medium sizecity and small city categories were at or above the nationalfigure about half the time, while the suburban fringe group wasusually at or slightly above the national figure. However, theextreme affluent suburb group achieved better results than all13-year-olds did on all but 3 of the exercises, as its median.difference of 5.6% indicates. People in this group did partic-ularly well on R109 A, a pun exercise, and R118, a form exercise.Their lowest percentage of success was on the second part of R114,a metaphor exercise.
Overall Group Results for 17-Year-Olds
Percentages of success on the 27 exercises in this themeranged from 16.3% to 94.5%; the median national percentage was80%.
6

On none of the exercises did the Southeastern 17-year-oldsperform at or above the national percentage of success. Peoplein this group did especially poorly on the inference exercises andone pun exercise (R110 A). Their median difference was -4.9%.The Western regional group was above the national level on abouthalf (56%) of the exercises, and, its median difference was .9%.The Northeastern percentage of success was above the nationalfigure on 3 of every 4 exercises. Its median difference was1.2%. The Central region had the highest median difference(1.7%) and the greatest percentage of exercises (85%) on whichits percentage of success was greater than the national one.
Females consistently outperformed males.. On 22 of the 27exercises they were above the national percentage of success andthe males were below it. They did particularly well on thewritten part of the inference exercises and on form questions.Males did quite poorly on those items, relative to their usualperformance. However, they did unusually well on metaphoi exer-cise R115 B. The median difference for females was 1.3%, whilefor males it was -1.3%.
,1
On no exercise in this theme was the percentage of successfor Blacks as great.as the national figure. On 6 exercises thedifference was-less than 10%, but usually it was greater; thegroup's median difference was - 15.7 %. Given their general per-formance, however, the Blacks did unusually well on two metaphorexercises (R112 A, R113). Their lowest percentages of successwere on the inference exercises, which required some writing.Whites as a group always registered percentagea of success abovethe national figure. Their median difference was 2.3%. Theydid particularly well (relative to their general performance) ontwo of the inference exercises (R126, R127) and on a pun exercise(R110 A). Their results were relatively poor on the second partsof Exercises R112 A and R113.
Neither of the two lower parental education categories everregistered a result at or above the national percentage of suc-cess. The graduated from high school group emerged above thenational level on 8 of the 27 exercises, and the post high schoolgroup was always above that level. On half of the exercises, theresults for the latter group were below 6%, and on half they wereabove: Relatively poor results appeared on parts of ExercisesR112 A and R113, but the group obtained exceptionally high per-ceAtages of success on inference exercises (R124, R126, R127),and a pun exercise (R110 A). Seventeen-year-olds in the smallplaces category did not do as well as those in other size ofcommunity groups. Their percentages of success were above thenational figure on only 6 of the 27.exercises. The big citiesgroup was above the national level on 9 exercises, and the mediumsize city on 13. The big' city fringe group consistently performedbest of these groups; its percentages of success were greater than
7

4
VV. ea., AO, 4,1 01101,, Rolt,writor

EXHIBIT 5. DISTRIBUTION Dr *DUP orromicts nit FILLTHEME I EXERCISES -- ROE 13
P F1 R E ki T SIZE AND TYPEEDUCATION Dr COMMUNITY
NHS WO t3rlfi P1 cc CH IC NC RUC Ws OMNEDiti
...11.111 4.-113 7.t .-"IX -'.a 41.t $1 .-1.1 LI' ra
9


EXHISIT C. DISTMOUTION or amour cirractices ran nu.THEME I EXERCISES - MBE I 7
PARENT SIZE o rEDUCFITION COM MUNIT Y
ifb
OHM 1114111 PHIS SC IIIP MC UP'NOM - Int sofa -al sa IA LI 40 XIII
11

the national figure on 24 of the 27 exercises. Its percentages ofsuccess were unusually high on the same exercises which the posthigh school group did well on: the inference exercises and thepun item. However, its achievement was sub-par on ExerciseR114 B, a metaphor exercise.
Overall Group Results for Adults
The results on 21 exercises taken by adults ranged from 10.8%to 95%; the median national percentage of success was 69.6%.
As at the other ages, the Southeast regional group did notperform as well as the other regions. It never recorded a per-centage of success at or above the national figure; the mediandifference was -7.8%. It did'relatively well on the second partof R111 A, a metaphor exercise, but its performance was unusuallylow on pun Exercise 8110 A and inference Exercise R127. TheNortheastern region performed above the national level on 12 of the21 exercises. Both the Central and Western regions, however,were above the national figures on 16 of the exercises. Westernersdid particularly well on the inference exercises which called forwritten responses.
Over the 21 exercises, adult males demonstrated an advantageover females 11 times. However, the difference between thesexes' median percentages is only 6/10ths of a percent, somales cannot be said to have much of an advantage.
Percentages of success for Black adults never equalled orsurpassed the national mark. The median Black difference was-19.9%. However, the group registered a relatively high figureon the second part of R112 A, a metaphor exercise. The resultsfor Whites as a group were always at or above the national per-centage of success.
As at the other age levels people whose parents have grad-uated from high school did better than those whose parents droppedout or never attended. The no high school parental education
. group never registered a percentage of success equal to or betterthan the national figure. 'The median difference was -9%. Itsshowing was unusually low on exercises requiring written responses.The some high school group's median difference was about -1%;on five of the exercises in this theme, this group performed abovethe national level. However, the graduated from high schoolcategory was above the national figure on 20 of the 21 exercises,and the post high school group's results were always better thanthe national results. The median difference for the former groupwas 4.2%; for the latter, it was 8.2%.- As we noted at the otherages, the people in the highest parental education category per-formed particularly well on written responses (see Exercise
12
R127); they also did unusually well on R115 B--a metaphor exercise--and 8110 A, a pun question.
The best overall performance by a size of community groupappeared in Cat medium sized city category. This group's percent-age of success was above the national figure on 15 of the 21exercises; the median difference was 1.7%. The urban fringe per-centage was greater than the national figure on 13 exercises,the small places category on 11. The big city group was belowthe national performance on 15 of the 21 exercises.
Table 1 lists all the preceding group median differences byage. The median differences for three groups (the Southeast,Blacks and the extreme rural group) tend to move farther belowthe national performance at each succeeding age level. In otherwords, performance in these groups differs least from the nationalperformance at age 9, most at the adult level.
Since Southeastern 17-year-olds and adults responded to manyof the same exercises, the three point drop in median difference(from -5.0 to -7.8) between those two ages is particularly note-worthy as an indicator that either (1) the adults in this grouphave forgotten some of their high school training; or (2) today's17-year-old has had more training than the adults did in the skillsthis theme requires. Probably both factors are at work.
One other observation: the Central region's median differ-ences declined with each age increase. Does this indicate thatelementary education in the midwest is in advance of the nationin emphasizing the skills called for in this theme?
This Literature theme should be read along with Volumes 5,6, 7 and 8 of the National Assessment Reading report. Combiningthe five themes, there were 124 exercises assessing variousliterary comprehension skills at the 9-year-old level; at age 13,there were 171; at age 17, there were 145; and for young adults,there were 79. The information gathered by all these itemsprovides baseline data about reading skills which are indispens-able for literary comprehension. At the moment, the data indi-cate that people in some socioeconomic groups are less likelyto fully comprehend the imaginative language of literature thanmost people. But there is a good deal more research ahead. Fornow, we at least have a ztarting point from which to launchinquiries that may one day tell us precisely which aspects ofreading skill are most difficult for what groups at which agelevels with what effect upon their capacity to enjoy and profitfrom literary art.
13


EXHIBIT D. DISTRIBUTION or GROUP DIFTERENCES FOR ALL.THEME I EXERCISES ADULT
PARENT SIZE OrEDUCATION COMMUNIT Y
NM MEI M1411 PHII SC SP MC UF-9.11 .41X 42 112 .-I2 OM 1.7 MI
15

TABLE 1. Group Median Differences onAll Theme 1 Exercises
Age
Group 9 13 . 17 Adult
RegionSoutheast -4.1 -5.7 -5.0 -7.8
West -0.5 1.0 0.8 1.5
Central 3.4 1.9 1.7 1.2
Nortaeast 0.5 1.8 1.1 1.2
SexMale -1.2 -1.8 -1.3 0.2
Female 1.1 1.8 1.3 -0.3
ColorBlack -13.7 -16.0 -15.8 -20.0
White 2.2 2.8 2.2 2.7
Parental EducationNo High School -6.2 -11.7 -10.2 -9.0
Some. High School -4.4 -4.3 -7.0 -0.8
Graduated from High School 0.3 0.2 -0.7 4.2
Post .High School 5.2 7.1 5.9 8.2
Size and Type of CommunityExtreme Inner City -14.1 -7.5 -8.1
Extreme Rural -3.2 -4.1 -5.0
Small City 0.4 -0.2 -0.1
Medium City -0.8 0.8 -0.4
Suburban Fringe 2.7 1.7 0.5
Rest of Big City -1.1 -0.4
Extreme Affluent Suburb 7.1* 5.6 5.3
Size of CommunityBig City -2.6 -1.1 -1.9 -1.3
Urban Fringe 3.8 2.8 2.5 0.8
Medium Size City -0.3 0.3 -0.3 1.6
Smaller Places -0.5 -1.2 -1.1 0.1
NOTE: Some of the numbers in this table differ slightly from those in the
previous exhibits. At ages 13, 17 and adult, the differences (.1%) are
due to the use of a different rounding procedure. At age 9, the differences
(ranging from .1 to .6%) reflect an updating of the results by the addition
of three more exercise results to .the 18 that appear in the previous discus-
sion of age 9 results. These minor changes do not alter in any way our
conclusions about the performances of the groups relative to the national
level of performance.
3.6

CHAPTER 2
THEME 2: RESPONDING TO LITERATURE
The results for all exercises which required verbal orwritten responses to a specific work appear in this volume ofthe Literature report. There were not a great many such exer-cises for the obvious reason that they are very time consuming;however, the results do provide interesting baseline data aswell as some very enjoyable reading.
All responses, whether written or verbal, were analyzed intwo ways. -First,,they were classified according to the responsecategories detailed by Alan Purves and Victoria Rippere in NCTEResearch Report No. 9, Elements of Writing about a Literary Work:A Study of Response to Literature. Once categorized, they werescored holistically on a one to four point scale.
Briefly, the Purves-Rippere categories describe variousrelationships between the writer of an essay and the work he iswriting about. The first category, termed engagement-involve-ment, defines personal approaches to the work--subjective reflec-tions or digressions and general discussions of the respondent'sinvolvement in it.
The second category is'termed perception and it encompassesresponses which separate respondent from work and attend to thework primarily as an object to be described or functionallyanalyzed. Essays or verbal comments in this category are usuallyformalistic or analytic in direction
Interpretation'is the third category and into it fall allresponses in which the essay writer attempts to find meanings inthe work and generalize about its content and implications.
The fourth major category is called evaluation; it encom-passes quality judgments and general reflections on the worth ofthe work and the value of reading it. When we found that agreat many people tended to retell the story or poem literally,we made a separate (fifth) category for retelling; in the Purves-Rippere scheme, this type of essay would -be in Category II, butit seemed useful to separate formalistic responses from thesequite different sorts of perception. We also addad a categoryfor maverick responses, many of which were very creative.
17

Verbal responses were obtained by presenting people withstories or poems and asking them what they most wanted to sayabout the work,.what they especially noticed and what theythought about it. We recorded their responses, transcribed themand categorized each state4nt made during the interview. Sincemost people expressed different reactions to each question, mostproduced statements in more than one category.
Results for essays, however, are a different matter. Thescorers categorized an essay according to its general thrust;they did not, as with the verbal responses, classify individual
statements. Thus, the category results for essay responsesrepresent percentages of-entire essays in a particular category.The two readers of each essay had to decidewhich of the framesof mind represented by the categories dominated the essay. This
turned out to be easier than it sounds, probably because theessays were quite short and written within definite time limits.
The four-point quality scoring system worked as follows: a"one" response was totally inadequate; a "two" was barely ade-quate, usually consisting of perfunctory, undocumented, usuallyvague, assertions; a "three" was an adequate response usingdetails in the work accurately to support an assertion about it;and a "four" was a superior_ response demonstrating insight,command of details and sophistication. The report details per-centages of people who received adequate or better scoresregardless of which category their responses fell into. It alsoreproduces sample responses ranging from the poorest to the mostexciting.
The stimuli for the tape recorded responses consisted ofthree poems apd the story "Sam, Bangs, and Moonshine," byHyaline Ness. Nine-year-olds reacted to the story and twopoems, 13-year-olds were given two poems, and the two older agegroups responded verbally to a single poem. As one mightexpect, there were definite changes in the distribution of state-ments among the categories depending on the stimulus and the ageof the respondent. Very few 9-year-olds approached "Sam, Bangs,and Moonshine " -as-an object to be analyzed, but a large percent-age of them made engagement-involvement and evaluative state-ments about it. A great many more made formalistic perceptionresponses when confronted with a poem, however. At all ages,about half or more of the people expressed some involvement witha work, but very few responses fell into the perception category.The proportion of interpretive statements increased with age.On one poem, fewer than one 9-year-old response in ten was
lEvaline Ness, Sam, Bangs, and Moonshine, New York: Holt,Rinehart and Winston, 1D66.
18

interpretive, but almost two thikds of the statements made by17-year-olds and adults fell into this category. Evaluativeresponses (Category IV), on the other hand, decreased in numberat the higher age levels. More than three 9-year-olds in fivemade evaluative statements, but at age 17 and at the adult levelthe proportion was between a third and a half. This is perhapspartly due to the tendency of the 9-year-old to reply "it'spretty good" regardless of the question, but it may also reflectthe greater attention older people devoted to interpretiveobservations.
TABLE 2. Percentage of Responses in Each Category
Literary Work AcLe
I II
.Category
IV VIII
"Sam, Bangs, etc." 9 62 2 28 62 43"If Apples, etc." 9 64 30 19 51 35"Space Travellers" 9 69 17 9 62 50"Space Travellers" 13 66 32 32 53 43"Closing of the Rodeo" 13 53 23 46 51 40"Closing of the Rodeo" 17 52 30 62 47 27"Closing of the Rodeo" Adult 47 13 63 37 30
I = Engagement-InvolvementII = Perception
III = InterpretationIV = EvaluationV = Retelling
Adequate or better responses were rare at the younger ages.Twenty-two percent of the 9-year-olds received adequate or betterscores for their responses to the story; but the figure droppedto 12% for the poem "If Apples Were Pears" and 6% for the poem"Space Travellers," by James Britton. Percentages were higherfor some groups--notably the extreme affluent suburb group andchildren whose parents had more than a high school education.For 13-year-olds, the percentages of adequate responses were 18%for one poem, 15% for the other. Twenty-eight percent of the17-year-olds' and 37% of the adults' remarks were at leastadequate.
There were four exercises'requiring written essays. Twowere administered to 13-year-olds, two to 17-year-olds andadults. People at each age level wrote in response to both poemsand short stories.
19

Because we used different categorizing techniques for theessays, till distribution of responses among the categorieschanged considerably. About 1 essay in 11 was an engagement-involvement response, though for an A.E. Housman poem, the pro-POrtion was 1 in 33. Regardless of-stimulus or age level, therewere always very few perception responses--in fact, never morethan 3%. Thirteen- year -olds wrote fewer interpretive essaysthan 17-year-olds or adults. For instance, 29% of their responsesto the poem "Space Traveller's" were interpretive, whereas 81%of the adult responses to Housman's "Into My Heart" were inter-pretive. At all'ages, however, a poetic stimulus prompted moreinterpretive essays and far fewer paraphrasings than did thestories. Evaluative compositions were almost as rare as form-alistically oriented onesat all ages, but especially at the twooldest age levels. Retellings appeared most frequently at age13--33% of the poetry responses and 55% of the story essays weremainly paraphrasings--but they almost disappeared at the higherage levels (see Table 3).
TABLE 3. Percentage of Essays in Each Category
Literary Work AA
I II
Category
V VIIII IV
"Space Travellers" 13 9 3 29 9 33 11"Half a Gift" 13 12 21 4 55 6
"Snake Dance" 17 9 1 56 5 25 4-
"Into My Heart" 17 3 1 86 1 1 3
"Snake Dance" Adult 8 1 69 2 16 1
"Into My Heart" Adult 9 1 81 1 3 2
I = Engagement-InvolvementII = Perception
III '= InterpretationIV = EvaluationV = Retelling
t-"*".;
In general, the percentage of acceptable responses wasgreater on the written exercises than on the taped ones. Twenty-one percent of the 13-year-olds' essayd About a poem receivedscores of 3 or 4, and 24% of their responses to a story were atleast adequate. Interestingly, students in the inner city groupdid very poorly on the poem but performed as well as all 13-year-olds in their response to the story "Half a Gift" by RobertZachs--a sensitive portrait of an impoverished inner city family.Their unusual success on this item Would seem to support theview that children become more involved in materials they can
20

relate to and that this involvement can often compensate fordeficiencies in writing skill.
In response to the story "Snake Dance," by Corey Ford, 44%of the 17-year-olds and 45% of the adults wrote adequate orbetter essays. There was a 15 point difference between the per-centages of males and females writing,good es'says, the girlshaving the advantage. At the adult level,, there was no sex dif-ference but there was a major difference between two regionalgroups: the Southeastern percentage was 17 points below thenational figure and the Western percentage was almost 12 pointsabove.
Essays about the Housman poem "Into My Heart" make fasci-nating reading even when they were not particularly well done.A number of people interpreted the phrase "air that kills" inthe opening line ("Into my heart an air that kills") as areference to pollution; others used the poem as a forum fortheir war views, assuming, apparently, that the speaker was areturning Vietnam veteran. Of the several thousand essayswritten about this poem, 19% of the 17-year-olds and 28% ofthe adults received adequate or superior scores.
21


CHAPTER 3
THEME 3: RECOGNIZING LITERARY WORKS AND CHARACTERS
The third theme includes most of the exercises written tosatisfy the first of the three major literature objectives:read literature of excellence. Five types of exercises assesseddifferent kinds of recognition of literary works: the firstpresented the student with a picture from awell-known nurseryrhyme, story or poemand asked him what work it illustrated; thesecond consisted of parodies of famous poems ("The Village Black-smith,"- "The Charge of the Light Brigade" and "Sea Fever," forinstance) and instructions to identify the source of the parody(these measured Objective IIB); the third type of exercisepresented the respondent with an allusion to some literary workor figure and asked for identification of the allusion; the fourthpresented people with a disguised myth or story pattern and askedfor identification of its source; and the fifth consisted ofstraightforward questions about specific works and figures.
Needless to say, there are so many important literary worksand characters in Western literatureialone that it would beimpossible to assess recognition of many. Therefore, the exer-cises involve a few selected names and works from folk literature,a few from Greek and Roman mythology, several from the Bible andfrom standard literary works often found on curriculum lists.Hopefully, data based on these few items will give us some ideaof the extent to which people are familiar with a much broaderrange of works and characters.
The results indicate that, in general, there was a steadyincrease from age to age in the percentage of people who recog-nized works and characters. For instance, 45% of the 9-year-oldsrecagnized an illustration of the Mad Hatter's Tea Party fromAlice in Wonderland; at age 13, the percentage was 72%; and atage 17, it was 78%. Two thirds of the 13-year-olds recognizedan allusion to Adam, but at age 17 the proportion was four fifths.
Some figures or works were not familiar to many people atany age level. Only 8% of the 13-year-olds recognized Don Quixote,for instance; at ages 17 and adult the figure was slightly over20%. Only half the teenagers and adults recognized a parody of"The Charge of the Light Brigade," and only 54% connected Davidwith the Psalms. Though half of the 9-year-olds said they had
23
heard of Cupid, only 28% were able to give an acceptable descrip-tion of him. The story of Job went unrecognized by many 13- and17-year-olds.
On the other hand, a good many exercises seemed to be rela-tively easy, especially for the older participants. More thanthree quarters of the teenagers and adults recognized SherlockHolmes from a silhouette profile; 87% of the 17-year-olds iden-tified Moby Dick (probably because it, is often taught in highschool);, more than 90% of the 17- year -olds and adults correctlyidentified allusions to Samson, Noah and Tom Sawyer.
The group results in this theme are particularly interestingsince they are far less stable on some exercises than they are
for most. On a typical Literature assessment exercise, one regiontends to dominate through the three lower age levels, femalesshow a consistent advantage across ages, while Blacks, certainextreme STOC groups, and the lower parental education groupstend to register percentages far below the national level. Buton some of the exercises in this theme, the customary patternsdisappeared. Notice Exercise R320, for instance, a parody ofLongfellow's "Village Blacksmith": at age 13 there was no South-eastern deficit or Black-White difference, but at age 17, theSoutheastern percentage was, 8 points, the Black percentage 19
points, below the national figure. The percentage of inner city9-year-olds who responded correctly to the Alice in Wonderlandillustration mentioned above was 24 points below the nationalfigure and 45 points lower than the figure posted by the affluentsuburb group; but at age 13, there was no significant differencebetween the performance of inner city children and all 13-year-
olds. It is possible that these radical changes in performancereflect somewhat the tumult in the English curriculum over thelast four or five years. Seventh and eighth graders today arebeing exposed to materials that differ considerably from thosethey would have encountered four years ago. But there areundoubtedly other factors involved in these atypical results andcareful analysis may tell us even more about their implications.
In general, the Central region performed best at the twolower age levels; 9-year-olds in this group were particularlygood at describing Paul Bunyan (their percentage of success was13 points above the national figure). The Northeast regiontendeoLto do slightly better than the Central and Western regions
at the two older age levels. Regardless of age, the Southeasterngroup was lowest; however, relative to its usual performance, theSoutheastern region did particularly well in recognition ofBiblical figures at ages 9 and 13.
At each age level, females demonstrated a slight advantageover all the exercises taken together. However, on certain
24

exercises there were very large differences between male andfemale performance. Nine percent more 9-year-old girls than boysrecognized an illustration from Winnie the Pooh, for instance, andtheir advantage on Alice in Wonderland was even larger (10%). Buton Moby Dick the 17-year-old males demonstrated a 12 point superi-ority and on Sherlock Holmes an 8 point advantage. In fact, ourresults over all the ages indicate a male advantage for masculinefigures such as Robin Hood, Paul Bunyan, Daniel Boone, Samson andJohn Henry, along with better than avbrage recognition of adven-turous works such as Moby Dick, Treasure Island and Gulliver'sTravels. Females outperformed m on poems, nursery rhymesand -works such as Charlotte's Web, Alice in Wonderland and Winniethe Pooh. The sexes seem 770 about equal success in recog-nizing Biblical figures.
Relative to their usual subnational performance, Blacks andpeople in the extreme inner city category did unusually well inrecognizing characters like Tom Sawyer, Achilles and John Henrybut quite poorly on works such as Alice in Wonderland, The Wizardof Oz, Winnie the. Pooh or Charlotte's Web. At all four agelevels, the extreme affluent suburb group consistently performedabove the national level, convincingly indicating that they aremore familiar with literature than people in the other groups.
Following is a discussion of the overall theme results foreach age group. The median percentages used in this overviewenable us to compare the performances of various groups to thenational performance over a number of exercises.1
In Exhibits E-H, each box represents the difference in per-formance between a group and the nation as a whole on a particularexercise. For example, in Exhibit El the bottom box in the SEcolumn shows that the Southeast was 23% below the national per-centage on that exercise. The arrows depict the median of thedifferences for a group, enabling the reader to see how far aboveor below the national level each group's median difference lies.For example, the median difference for the Southeast in the sameexhibit is -7%. Empty boxes correspond to exercise differenceswhich were considered atypically above or below the group mediandifference. These exercises are referred to in the discussion asunusually high or low results.
'Median percentages and median differences were based upon the"acceptable response" results for most exercises. For ExercisesU331A-R3331, medians were based on result 2, percentages of "ade-quate descriptions." In no case were the summary results formultipart exercises (e.g., M328Z) used to compute medians.
25

Exhibit E
Distribution of Effects by Group, Age 9
Region Sex Color
sc N c MC M r w
Median -7.1 0.0 2.5 1.0 -.4 .4 -16.1 3.0
I
9

a
a
Exhibit E
Distribution of Effects by Group, Age 9
ParentalEducation
Size and Type ofCommunity
NHS Ste OHM PHS CC CR SC MC RWC sr au
Median -11.2 -4.6 .8 8.5 -12.2 -5.7 -.3 -1.6 1.7 4.8 8.7
27
Overall Group Results for 9-Year-Olds
Nine-year-olds answered 29 exercises. Their percentages ofsuccess ranged from less thin 1% to 85.5% and their median nationalpercentage of success was 44.4%--in other words, half their per-centages were above 44.4%, half were below.
The Southeast group's median difference was -7.1%. Relativeto its median difference, this group did .911 on exercises requir-ing identification of Biblical figures and Daniel Boone. However,Southeast results were relatively low fdr such characters asRumpelstiltskin or Winnie the Pooh.
The Western regional group's median difference was almostzero. However, on Exercise R306, requiring identification of anillustration from Charlotte's Web, the group's percentage was8 points over the national figure.
The Central region's median difference was 2.5%. More chil-dren in this regional group were familiar with Paul Bunyan (Exer-cise R332G) then were in any other region.
The median difference was 1% for the Northeast group. Thisgroup displayed its greatest positive differences from nationalperformance in identifying Pinocchio (U313), Rumpelstiltskin(R3321), Thumbelina (U333G) and the Wizard of Oz (U314). It lidleast well on exercises requiring familiarity the Old Testa-ment Joseph and with Paul Bunyan.
Nine-year-old girls performed slightly better than thenation, boys slightly worse. Nevertheless, the sexes excelledin different sorts of exercises. Relative to their usual per-formance, males d unusually well on exercises requiring identA-fication of Robin Hood (U331G), Daniel Boone (R3311), the TrojanHorse (U333C), Paul Bunyan (R332G) and Thor (R332C). Girls didpoorly on these same exercises but excelled on exercises requiringknowledge of Alice in Wonderland (R305), Winnie the Pooh (R303),Charlotte's Web (R30;), nursery rhymes and fairy taleL.
The median difference for Blacks was -16%. They were best atrecognizing Achilles, Tom Sawyer, Thor and the Trojan Horse. TheWhite median difference was 3%. This group did particularly wellon exercises dealing with Pinocchio, fairy tales and longer workslike Alice in Wonderland.
The no high school group's median difference was -11.2%, thesome high school group's difference was -4.6% and the graduatesfrom high school group's was .8%. Students with at least oneparent who went beyond high school had a group median differenceof 8.5% and did especially well on Exercise R303, an illustrationfrom Winnie the Pooh.
28

The median difference for the extreme inner city group was-12.2%. The extreme rural group's median difference was -5.7%.As Exhibit E illustrates, the small city, medium city and restof big city STOC groups performed about as the natic did. Thesuburban fringe group's median difference, however, as almost 5%,and median difference for the extreme affluent suburb group was8.7%.
Overall Group Results for 13-Year-Olds
This age group answered 33 exercises. Percentages of successranged from 7.7% tc 94.2%, and the national median was 66.5%.
The median difference for the Southeastern regional group was-4.6%. The group did particularly well on Exercise.R334, a ques-tion about Job.
The median difference for the West was 1.2%. As at age 9,this group was outstanding when asked-to identify an illustrationfrom Charlotte's Web.
The median difference for the Central region was 2.1%; forthe Northeast it was 1.3%. This last group did unusually well onexercises dealing with Gulliver's Travels, Treasure Island andSherlock Holmes.
The median difference for males was 1 percentage point belowthe median difference for girls. As at age 9, the males, did beston ".xercises requiring familiarity with masculine figures likeJohn Henry (U329D), Samson (R328A), Galahad (R329C), Don Quixote(R307) and adventure stories like Treasure Island (U316). Femalesdid relatively poorly on those exercises but excelled the males inexercises dealing with Charlotte's Web, Alice in Wonderland,Winnie the Pooh and Hansel & Gretel (U312).
The median difference for Blacks was -17.4%. However, onsome particular exercises (allusions to John Henry or Job, forinstance, or Exercises R329C, R320 and half a dozen more) theirdifferences from the national percentage were not particularly
The median difference for Whites was about 3%.
Once again, asExhibit F reveals, there was a steady rise inmedian differences within the parental education groups. Thefigure for the no high school group was -11.9%, with particularlyhigh percentages on the Galahad and Job items (R329C and R334).For the some high school group, the median difference was -5.9%and for the graduated from high school group it was .3%. The posthigh school median difference was 6 percentage points.
29

Exhibit F
Distribution of Effects by Group, Age 13
4UP
Region Sex Color
ME $4 C NE M r 0 k
Median -4.6 1.2 2.1 1.3 -.6 .6 -17.4 2.9
30

Exhibit F
Distribution of Effects by Age 13
ParentalEducation
Size and Type ofCommunity
5115 ENO 1,4115 DC ER SC tiC NBC Sir ENS
Median-11.1 -4.9 .3 6.1 -5.6 -4.7 -1.5 -1.0 -1.6 1.6 6.6
31

Exhibit G
Distribution of Effects by Group, Age 17
Region
NE N
Sex Color
Median -4.8 .3 1.4 A.8 -.7 .7 -16.3 2.2
32

Exhibit G
Distribution of Effects by Group, Age 17
ParentalEducation Size of Community
NHS SUS OHS PHS SC SP MC ur
Median-13.4 -7.4 -.2 7.5 -1.1 -1.9 .5 3.6

The extreme inner city group's median difference was -5.6%.The rural group's difference was -4.7%. Its most distinctiveperformance was on Exercise R334, requiring recognition of thestory of Job.
Four of the remaining STOC groups display median differencesclose to zero. However, the extreme affluent suburb group'smedian difference was 6.6%.
Overall Group Results for 17-Year-Olds
Seventeen-year-olds were presented with 36 exercises. Theirpercentages of success ranged from 12.3 to 96, and their medianpercentage was 63.2.
The Southeast's median difference was -4.8%. This group per-formed particularly well on exercises requiring identification ofSir Galahad, Job and the poem "Sea Fever." The Western medianwas only .3%, but the Central region's was 1.4%. Central teen-agers did especially well on the Winnie the Pooh illustration-(R303). The greatest positive median difference appeared for theNortheast (1.8%). This group's difference from a national per-centage was particularly great on Exercise U318, an illustrationfrom Gulliver's Travels.
As at the other ages, the male median difference was negative(-.7%). But again males performed best on exercises dealing withmasculine figures like John Henry (U329D), Mercury (U330D),Sherlock Holmes (R308), Samson (R328A), Don Quixote (R307) andGulliver (U318). Females, while performing relatively poorly onsuch exercises, did exceptionally well identifying illustrationsfrom Alice in Wonderland (R305) and Winnie the Pooh (R303), andBiblical figures like Devid (R330C), Job (R334) and Cain andAbel (U339).
The median difference for Blacks was -16.3%; They did rela-tively well on questions about Samson, "Jabberwocky" (U322),Solomon (U330E), John Henry (U329D), Galahad (R329C) and RobinHood (U329E).
The median of the differences from national percentages forthe White group was 2.2%.
As Exhibit G reveals, the median differences for the parentaleducation groups differed considerably. The no high school group'smedian difference was -14%, the some high school group's was-7.4%, the graduated from high school group's was .2% and thepost high school group's was 7.5%. This last group did unusuallywell on four of the illustrations: U318 (Gulliver), R308 (SherlockHolmes), R303 (Winnie the Pooh),_U315 (Rip Van Winkle).
34
Median differences for the type of community groups wereundramatic. The big city group's figure was -1.1, the small placegroup's was -1.9, the medium city group's was .5 and the urban'fringe group's was 3.6.
Overall Results for Young Adults
Results for the 24 exercises answered by adults ranged from14.6% to 95.1%. The median national percentage at this age levelwas 73%.
The median of the differences from national percentages was-8.8% for the Southeast and 2.6% for the West. The Central
-region's median difference was .5% and the Northeast's was 3.6%.This last region did unusually well identifying an illustrationfrom Rip Van Winkle.
The median difference for male adults was .6%, as Exhibit Hreveals. Relative to their usual performance, males excelled onexercises dealing with John Henry (U329D), Troy (R336), Moby Dick(R309) and Sherlock Holmes (R308).
Females did poorly on these exercises but did exceptionallywell on questions about Alice in Wonderland (R305), Chicken Little(U328C), Adam (R328E) and Paul Revere (U319B).
The median difference for Blacks was -18.1%. Their resultswere atypically high for an exercise about Faust (U340). Themedian difference for Whites was 2.4%.
As at the other ages, the median differences for the parentaleducation groups followed a definite pattern. The no high schoolfigure was -7.9%, the some high school median difference was -1.4%,the graduated from high school was 2.8% and the post high school'swas 9.7%. This last group had a percentage of success 19 pointshigher than the nation's on the Don Quixote illustration (R307),17% higher on a parody of "Casey at the Bat" (R321) and 16 pointshigher on a parody of "The Village Blacksmith" (R320).
The median difference for the big city group was -4.8%; forthe small place and medium city groups it was close to zero; andfor the urban fringe group it was 2.2%.
As Table 4 reveals, several groups diverged from the nationallevel to different degrees at different ages. Southeast 9-year-olds, for instance, showed a median difference of -7%; at ages 13and 17, the group's median difference was -5%, but at the adultlevel it plunged to -9%. The Central region begins at age 9 withthe largest positive median difference of all the regional groups;but at each age its advantage diminishes until, at the adult level,both the West and the Northeast display greater median differences.
35

Exhibit H
Distribution of Effects by Group, Adults
IMP
/ IP
Za-
MO,
LIK.
Region Sex Color
-SM.SC w < me m F 5 W
Median -8.8 2.6 .5 3.6 .6 -.6 -18.1 2.4
36

WIN
an-
10.
a
Exhibit H
Distribution of Effects by Group, Adults
4
ParentalEducation Size of Community
NHS OHS -OHS PHO SC SP mc ur
Median -7.9 -1.4 2.7 9.7 -4.8 .1 .7 2.4
37

TABLE 4. Group Median Differences onAll Theme 3 Exercises
AgeGroup 9 13 17 Adult
RegionSoutheast -7.2 -4.7 -4.9 -8.9
West 0.0 1.2 0.3 2.5
Central 2.4 2.0 1.3 0.4
Northeast 1.0 1.2 1.7 3.5
SexMale -0.4 -0.6 -0.8 0.5
Female 0.3 0.5 0.6 -0.6
ColorBlack -16.1 -17.4 -16.3 -18.1
White 3.0 2.8 2.1 2.3
Parental EducationNo High School -11.2 -11.2 -13.5 -7.9
Some High School -4.7 -4.9 -7.4 -1.4
Graduated from High School 0.8 . 0.3 -0.2 2.7
Post High School 8.4 6.1 7.5 9.6
Size and Type of CommunityExtreme Inner City -12.2 -5.6 -8.5
Extreme Rural -5.8 -4.7 -2.5
Small City -0.4 -1.6 -1.0Medium City -1.7 -1.0 0.6
Suburban Fringe 4.8 1.6 1.8
Rest of Big City 1.6 -1.6 -0.6Extreme Affluent Suburb 8.7 6.6 7.6
Size of CommunityBig City -1.2 -0.1 -1.2 -4.8
Urban Fringe 5.1 4.0 3.5 2.2
Medium Size City -1.0 -0.7 0.,..4 0.7
Smaller Places -1.7 -2.1 ` -2.0 0.0
NOTE: Some of the numbers in this table differ by .1% from those in the
previous exhibits. These differences are entirely due to the use of differ-
ent rounding procedures.
38

CHAPTER 4
THEME.4: A SURVEY OF READING HABITS
Theme 4: A Surve- of Readin Habits contains two kinds ofexercises. Tne irst Kin was esigne to determine attitudestoward literary instruction and the second kind was designedto discover what types of literature individuals read and howoften they read. The national results indicate not only that agreat majority of Americans read works of literature, but thatthe majority feels that it is important to read and to teachliterature in school.
The first two exercises in this theme, for instance, ask13-year-olds, 17-year-olds and young adults if they feel it isimportant to teach literature in school. At age 13, slightlymore than three out of four children agreed that it is important,and in the two older age groups, the proportion was about nineout of ten. Although people had difficulty explaining theiranswers, about half or more of the individuals in each age groupgave reasonable statements about why they believe teachingliterature is important. At age 13, 49% gave reasonable state-ments; at age 17, the figure was 62%; and among adults, 49%.
Seventeen-year-olds and young adults were also asked if theythink that reading great literature is of any value. Only 10% ofthe 17-year-olds and 8% of the adults reported that they thOughtreading great literature was of no value. Among both groups,about four out of five individuals reported that they did feelthat reading great literature had value, and more than three outof five listed at least one reasonable explanation of the valueof reading great literature. At least one out of every fiveindividuals in both groups listed two or more good reasons forreading great literature.
After reporting sentiments such as these, what do Americanssay they actually read? In Exercise R410, 13-year-olds, 17-year-olds and young adults were asked if they read any of eight typesof literature, and if they could remember specific titles. Thetypes were: long stories or novels, short stories, biographiesor autobiographies, plays, poems that tell a story (i.e., epicor narrative poems), other poetry, essays and books of literaryhistory or criticism. Nationally, 98% of the 13-year-oldsreported that they read on their own--that is, apart from any
39

school assignment--at least one of the eight types; 95% of the17-year-olds and 89% of the adults made the same report.
The percentages remained high even when the respondents wereasked to name the titles of the works they reported they had
read. Among 13year-olds, 86% remembered titles; among 17-year-olds, the LIgure was 87%; and among adults, 76%.
Although the proportions reporting titles in a wide varietyof categories were not large, the figures indicate that Americans
do read a number of types of literature. Among 13-year-olds,22% named titles in only one of the eight categories, 26% named
titles in two categories, 20% named titles in three categoriesand 18% named titles in four or more categories. Among 17-year-
olds and adults, the figures were similar, but almost one infour of tilt? 17-year-olds and 22% of the adults named titles in
four or more categories.
The parts of Exercise R410 concerned with novels and with
poems are particularly interesting, since these are the two typesof literature most stressed in traditional education. In the
first, 72% of the 13-year-olds reported that they read novels or
long stories on their own; 79% of the 17-year-olds 4nd 76% of
the adults made the same claim. The percentages reporting titleswere lower than these, but they still represent a majority at
each age. Half the 13-year-olds, 69% of the 17-year-olds and
64% of the adults reported titles.
- The proportions at each age level that reported reading
poems are smaller than the proportions for novels, but thefigures still indicate a significant interest in poetry nation-
ally. More than 46% of the 13-year-olds reported that theyread poetry on their own; 43% of the 17-year-olds and 30% of
the adults reported that they did. The proportions giving titlesare smaller, but still represent a sizable number of individuals.At age 13, 24% gave titles; at 17, 25%; and among adults, 18%.
Overall Group Results by Age
The median percentages used in this overview enable us tocompare the performances of various groups to the national per-formance over all the exercises in this theme.
In Exhibits I-L, each box represents the difference inperformance between a group and the nation as a whole on a
40

particular exercise. For example, in Exhibit I, the bottom boxin the SE (Southeast) column shows that the Southeast was 6%below the national percentage on that exercise. Each arrowdepicts the median of all the exercise differences for a group,enabling the reader to see how far above or below the nationallevel each group's median difference (or median effect) lies.For example, the median difference for the Southeast in the sameexhibit is .7%. Empty boxes correspond to exercise differenceswhich were considered atypically above or below the group mediandifference; these exercises are referred to it the discussionas having produced unusually high or low results for that grouprelative to its median difference.
Overall Group Results for 9-Year-Olds
The national median response percentage for 9-year-olds wascomputed using the 11 response percentages listed in Appendix A.Response percentages ranged from 32.5% to 65.0%, and the mediannational response percentage was 43.6%.
As Exhibit I reveals, the median difference for the South-east (SE) was .7%. In other words, half its differences wereabove .7%, half were below. However, on Exercise R409, surveyingmagazine reading habits, the group's response percentage was 6%below-the national response percentage, an atypically largenegative difference for that group.
The median effect for the West (W) was -2.8%; however, ona survey of fiction reading habits (R404A), the Western per-centage was 4 points above the national response rate.
The median difference for the Central group (C) was 1.9%;for the Northeast (NE) group it was -.9%.
The male (M) median difference was -1%. However, malesperformed atypically well on items surveying nonfiction readinghabits, e.g., R404C, R404A, R404D and R404E.
The female (F) median difference was 1%. Though the 9-year-old girls' response percentages were lower than the males' onthe nonfiction questions just mentioned, their results wereunusually high on questions about the frequency with which theyread poetry and fiction, e.g., R407D, R406, R404A and R404B.
The median difference for Blacks (B) was 1%, but on a ques-tion asking then,l, if they liked to read poetry often (R4048),their response percentage was almost 10 points above the nation's.
The White (W) median effect was almost zero; in other words,half of the White differences were above the national percentage
41

EXHIBIT I
Distribution of Effects by Group, Age 9
Median
Region Sex Color
IIN
0.7 -2.9 1,8 -1.0 - -1.1 1.0 0.9 0.0
42

EXHIBIT I
Distribution of Effects by Group, Age 9
4B
a
ParentalEducation
3'3UM
rtIn MBI
I
Size and Type ofCommunity
3
j
NHS SiHS IN Si PHU,. QC :R SC MC PSC. sr EFIS
Median -3.6 -2.5 1.9 3.8 -3.4 -2.1 1.3 -1.0 -0.5 0.8 0.3

and half were below it. Particularly great positive effectsappeared on questions about their magazine reading habits (R409)and their involvement in fiction and biography (R407A, R408).
The median difference for the no high school group (NHS)was -3.5%, for the some high school group (SHS) it was -2.4%,for the graduated from high school group (GHS) it was about 2%and for the post high school group (PHS) it was 3.9%. Partic-ularly high results appeared for this latter group on surveys offiction,, biography and magazine reading habits (R407A, R408 andR409).
The median'differences for the STOC groups ranged from the-3.3W-of the extreme inner city group (EIC) to the 1.4% figurefor the small city group (SC). The rural group's (ER) differencewas -2.1% and the rest of big city group's (RBC) was -.5%. Thesuburban fringe group (SF), with a median difference of .9%,registered an atypically greater positive difference from thenational performance on R404D, a question about raw often people
...,==.=read nonfiction.
The medium city- group (MC) performed unusually well onR404A ("Do you like.to read- make - believe stories?") and had anoverall median difference of -.9%. Finally, the extreme-affluentsuburb group (EAS) had a median effect of .4% and performed.atypically well (12 points above the nation) on surveys of'fiction and magazine reading frequency.
Overall Group Results for 13-Year-Olds
The national'median response percentage for 13-year-oldswas computed with 27 response percentages (listed in Appendix A)ranging from 1.4% to 61.6%; the median response percentage was
As Exhibit J reveals, the Southeast median difference was.7%. However, on two exercises (R405B and R405C, surveys ofpoem and play reading habits) this group's percentage was morethan 8 points above the nation's. The West's median effect was1.5% and it performed unusually well on R410A, "Have you readany novels on your own?" The Central region's median effectwas -.9% and the. Northeast's, -.8%. Effects for the latter groupwere atypically high on R411A (a fiction survey) and R411F("Have you read any books a second time?").
The median difference for males was -2.5%, for females,2.4%. Male differences were again atypically high on surveysof nonfiction reading habits. Lee, for instance, R405G (newsmagazines), R405D, R405F (editorials), R410C and R411C (biog-raphies). Female effects were unusually high on items dealing
44

with fiction, e.g., R410A, R411A, R405A. Females also displayedhigher than usual differences on questions about the importanceof literature (R401) and the number of times people reread works(R411G and F).
As Exhibit J reveals, there was a wide distribution of Blackeffects and ,a narrow distribution for Whites. The Black mediandifference was -3.6%, but on several exercises their responsepercentage was at least 3 points above the national response.On R405B and R4C5C the percentages of Blacks indicating they liketo read poetry and plays often were 21 points above the nationallevel.
The White median` difference was .7%. Atypically highpositive effects apperaed on R411A, G and-F which dealt withrereading habits; on surveys of fiction books read (R410A, R405A);and on R401, an attitude question about the importance of readingliterature.
The median effect for the no high school group, which also-showed a wide distribution of results, was -4.8%. However, onR405B, "Do you like to read poems often?", this group's percent-age was 15 points higher than the ation's; and on R405C, asking
. the same question about plays, it was 11% higher. On anotherquestion about plays, requiring verifiable play titles, thisgroup's response percentage was 5 points above the national figure.
The some-high school parental education group's median dif- -
ference was -.6%, and it too had atypically high positive effectson R405B and C.
The graduated from high school group's median differencewas -1.1%. Its positive difference was unusually great on R405E("Do you like to read short storiesoften ? ") and R401, "Why doyma_think_it's important to study literature?"
The median difference for the post high school group was4.4%. However, its difference was around 10% on questions askingfor titles of novels and biographies read (R410A, C). Itspositive differences were also atypically high on most parts ofExercise R411.
No STOC group had a median difference higher than 2.8% (theaffluent suburb group) or lower than -2.2% (the extreme innercity). However, there were some atypically high positiveresults worth mentioning. The inner city group's effect was
'abciiit 10% on R405B ("Da you like to read poems often?") and onR411B (verified play titles). The extreme rural group's responsepercentage was 12 points above the nation's on R406, "Do youread for enjoyment often?" Though the rest of big city grouphad a median difference of .4%, it was 13 points above the
45
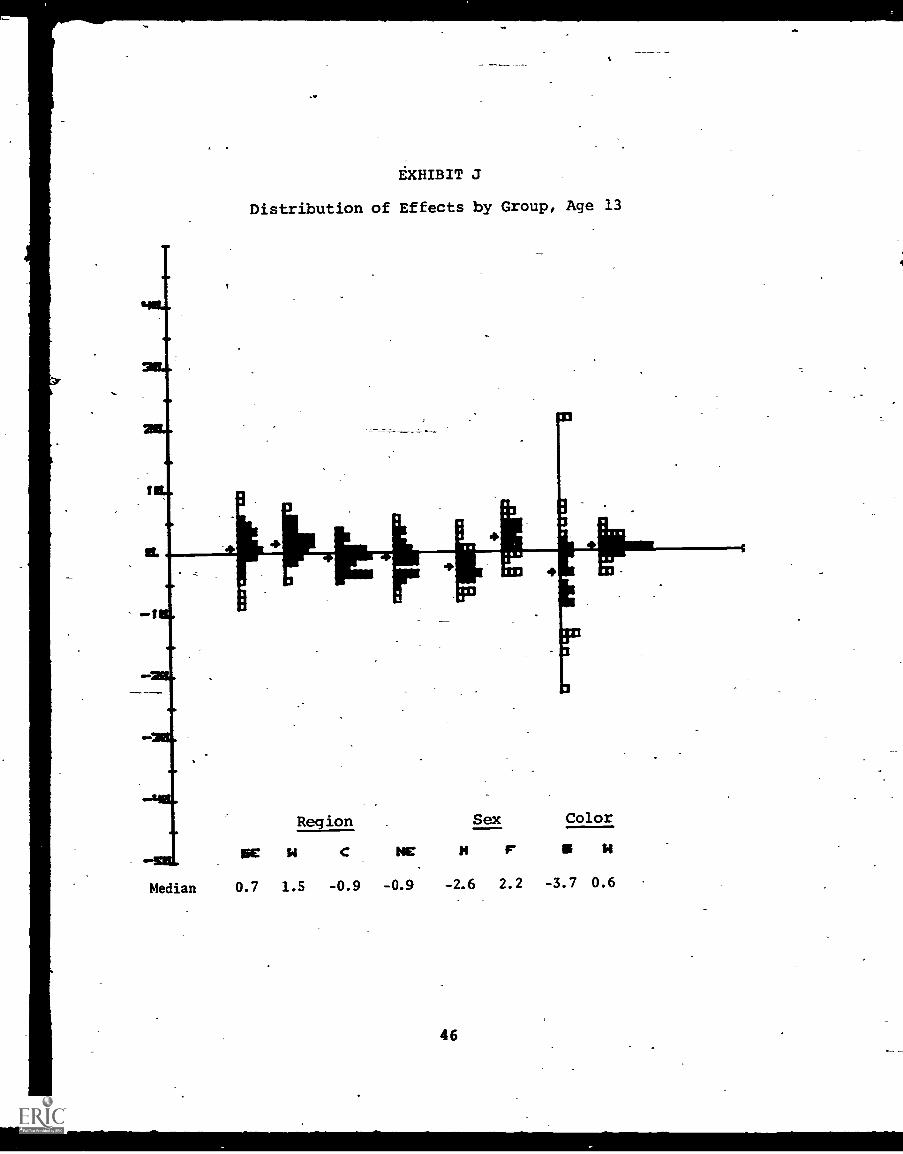
EXHIBIT J
Distribution of Effects by Group, Age 13
OM
I
3
Region Sex Color
SE 14 C NE M F II 14
Median 0.7 1.5 -0.9 -0.9 -2.6 2.2 -3.7 0.6
I
I

40
EXHIBIT J
Distribution of Effects by Group, Age 13
ParentalEducation /
Size and Type of. Community
NHS SHS OHS PHS QC CM SIC MC MSc sr EMS
Median-4. 8 -0.6 -1.1 4 . 3 -2.2 -1.2 -0.5 0.0 0.4 -0.9 2 . 8
. 47

EXHIBIT K
Distribution of Effects by Group, Age 17
Region Sex Color
SE W C NE M r S 14
Median -0.3 -0.2 -0.9 0.5 -2.2 2.1 -4.7 0.7
48

EXHIBIT K
Distribution of Effects by Group, Age 17
ParentalEducation Size of Community
NHS NHS OHS PHO mc 5P MC LW
Median -8.8 -4.2 -2.0 5.9 0.2 -0.8 0.5 1.0
49

national level on R411A, which required verifiable novel titles.
The extreme affluent suburb group's effect was 12% on a similaritem (R410A) and 15% on R410C, which required verifiable biog-
raphy titles.
Overall Results for 17-Year-Olds
The national median. response percentage for 17-year-olds(43.1%) was based on 21 results (listed in Appendix A) ranging
from 4.9% to 97.0%.
As Exhibit K reveals, the median differences for all four
regions were all within + or -1%. The Central group's effectwas atypically high on two items: R411B (verifiable play titles)
and R402 ("Do you,think literature should be taught in every
school?"). The Northeast had an atypically high positive effect
on R410D, which called for verifiable play titles.
The' median difference for males was -2.1%. Their positive
effects were unusually high on Exercises T411C (biographies),
R410G (essays) and R410H (literary history). Females, with a
median difference of 2.2%, showed their greater positive group
effects on R410A, D and F (novel titles, play titles and poem
.titles) and R411A, B, E and H (dealing with novels, plays and
rereading habits).
Effects for Blacks ranged from -19% to 11.5%; their median
effect was -4.7%. Atypical positive differences occurred in
R410C and R411C (both surveying biography reading "habits) and
R410D and R411B (both dealing with plays). The White mediandifference was .7%, but on a few que.zions about rereading andnovel titles (R411G and F, R410A) the-group's differences were
higher.
At this age, as at the other' ages, there was a steady
increase in median difference percentages among the parental
education groups. The no high school group's median difference
was -8.7%, the some high school group's difference was -4.1%,
the graduated from high school group's was -1.9% and the post
high school gtoup's was 5.9%. This last group posted partic-
ularly large positive differences on R410A and R411A, requiring
novel titles. It also did well on that part of R403 which
required reasons why literature should be taught in every school.
The median effects for the size of community groups ranged
from -.8% to 1.0%. However, the big city group registered an
atypically high positive difference on R410D, which required
verifiable play titles.
50

Overall Results for Adults
The national median response percentage for adults was 35.7%.It''was based upon 21 results (listed in Appendix A) ringing from4.8% to 95.8%.
As Exhibit L illustrates, the Southeast regional group'smedian effect was -7.3%, the West's was 1.6%, the Central region'swas -1.9% and the Northeast's was 2.9 %. The West had unusuallyhigh positive differences on R411G and ,F (about rereading works),R410A (requiring novel titles) and that part of R403 requiringreasons why literature is valuable.
The male median effect was -1.8%. Adult male's did partic-ularly well on the attitude questions R402 and R403. Females,witlia-a-median effect of 1.7%, had unusually high positive effectson R410A and R411A, both of which required verifiable titles ofnovels people had read.
The Black median difference was -7.5% and the White's was1.0%.
The parental education groups performed as they usually do.
The no high school group's median difference was -9.4%, and thesome high school group's median difference was -2.1 %. This lastgroup showed an atypically great positive effect on R402, "Shouldliterature be taught in every school?"
The third parental education group's median effect wasHowever, on R410A, assessing novel reading frequency, this group'sresponse percentage was almost 8 points above the nation's.
The post high school group's median difference was 12%.Effects were around 20% on R411F, G and H (assessing rereadingtendencies) as that part. R403 requiring reasons why literatureis important.
Three of the size of community groups displayed median dif-ferences around 2.5%; the small places group, however, had amedian difference of -2.5%.

EXHIBIT L
Distribution of Effects by Group, Adults
OP
MID
W. 411F
1
MID
t
IMID
-22L.
MEL
421.Region Sex Color
SC W C NC H F 8 W
Median -7.3 1.5 -2.0 2.9 -1.8 1.7 -7.5 0.9

L
EXHIBIT L
Distribution of Effects by Group, Adults
ParentalEducation Size of Community
NHa a1411 MO PHII IC SP PIC urMedian -9.4 -2.2 -0.2 12.4 2.9 -2.6 2.6 2.5
53
ri
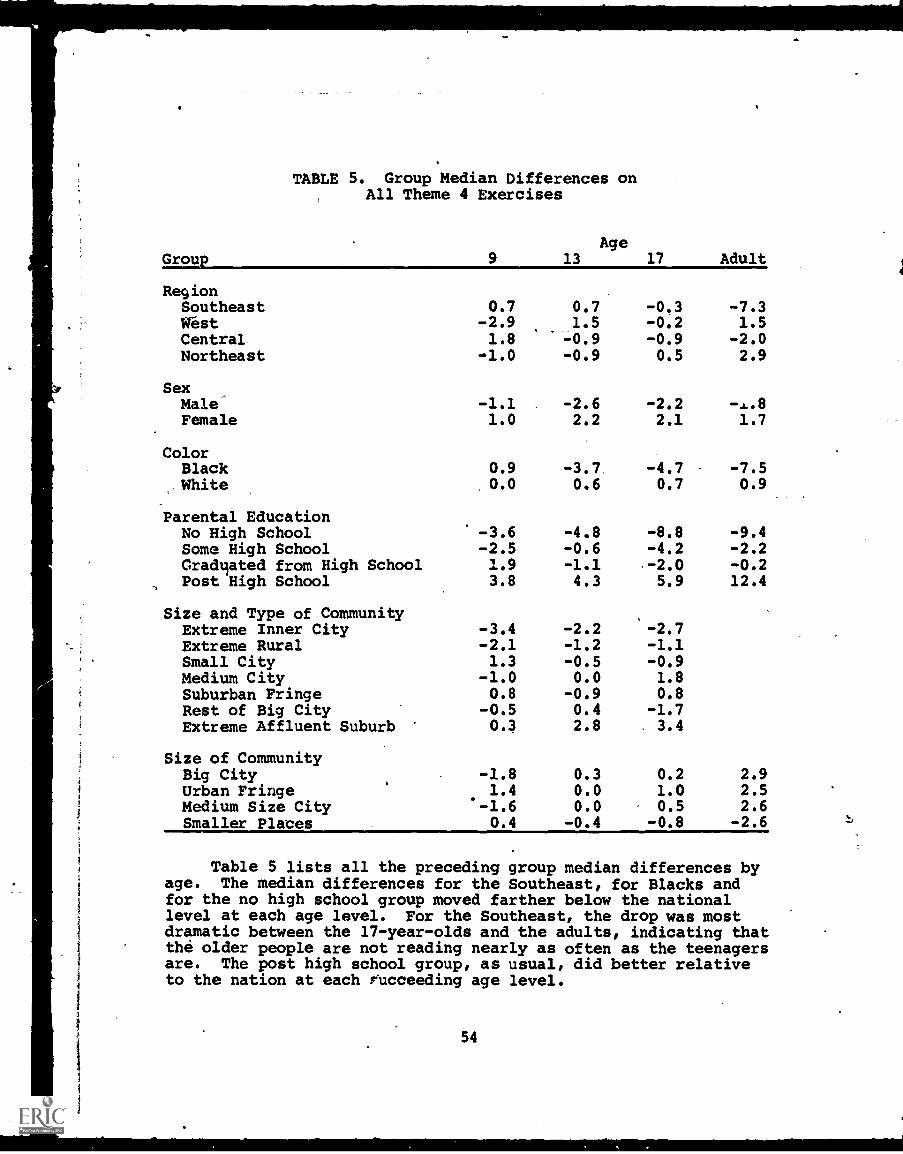
TABLE 5. Group Median Differences onAll Theme 4 Exercises
AgeGrou 9 13 17 Adult
RegionSoutheast 0.7 0.7 -0.3 -7.3Wrest -2.9 1.5 -0.2 1.5Central 1.8 -0.9 -0.9 -2.0Northeast -1.0 -0.9 0.5 2.9
SexMale -1.1 -2.6 -2.2Female 1.0 2.2 2.1 1.7
ColorBlack 0.9 -3.7. -4.7 -7.5White 0.0 0.6 0.7 0.9
Parental EducationNo High School -3.6 -4.8 -8.8 -9.4Some High School -2.5 -0.6 -4.2 -2.2Gradliated from High School 1.9 -1.1 -2.0 -0.2Post High School 3.8 4.3 5.9 12.4
Size and Type of CommunityExtreme Inner City -3.4 -2.2 -2.7Extreme Rural -2.1 -1.2 -1.1Small City 1.3 -0.5 -0.9Medium City -1.0 0.0 1.8Suburban Fringe 0.8 -0.9 0.8Rest of Big City -0.5 0.4 -1.7Extreme Affluent Suburb 0.3 2.8 3.4
Size of CommunityBig City -1.8 0.3 0.2 2.9Urban FringeMedium Size City -1 : :
0.00.0
1.00.5
2.52.6
Smaller Places 0.4 -0.4 -0.8 -2.6
Table 5 lists all the preceding group median differences byage. The median differences for the Southeast, for Blacks andfor the no high school group moved farther below the nationallevel at each age level. For the Southeast, the drop was mostdramatic between the 17-year-olds and the adults, indicating thatthe older people are not reading nearly as often as the teenagersare. The post high school group, as usual, did better relativeto the nation at each fucceeding age level.
54

CHAPTER 5
GROUP PERFORMANCE ON THEMES
When the median differences discussed in the previous chapterare reorganized in order to determine the theme(s) upon whicheach group performed best relative to the nation, some inte7tstingpatterns emerge (Table 6). The Southeast, for instance, performedbest on Theme 4: A Survey of Reading Habits, at all four agelevels. The same was true for Blacks and true for the no highschool and rural groups at ages 9, 13 and 17. The exerciaes inthe fourth theme werelall "self-report" survey items assessingattitudes toward literature, reading frequency and reading tastes;they did not assess skills or knowledges.
Males performed best relative to the nation on Theme 3 at allage levels. The exercises in this theme required knowledge ofspecific facts, particularly the names of important literary worksor characters. Other groups which performed best relative to thenation on Theme 3 were the Northeast (at ages 17 and adult) andthe extreme affluent suburb group (at ages 9, 13 and 17). Thiscould indicate that the English curricula used in the Northeastand in the suburban schools place a good deal of emphasis uponfactual knowledge; however, it could also reflect wider readingbackgrounds for people in those groups.
Theme 2 exercises required adequate written or verbalresponses to works of literature. Sev2ral groups performed bestrelative to the nation on this theme, indicating that of thevarious skills the assessment required of them, their strongestwas the ability to respond well to literary works. Northeastern9 and 13-year-olds showed strength in this area as did 13-year-olds, 17-year-olds and adults in the Western United States andin the post high school parental education group. Teenage womenalso performed best when asked to respond, in contrast to themales, whose forte is apparently factual recall.
The Theme 1 exercises assessed such skills as recognition offormal similarity comprehension of metaphors and sensitivity tomood and tone. It could well be that the groups which performedbest on this theme (the Central region, Whites, the medium sizecity STOC groyp) reflect exposure to curricula derived from theNew Criticism (101W quite old) and its emphasis upon language.
55
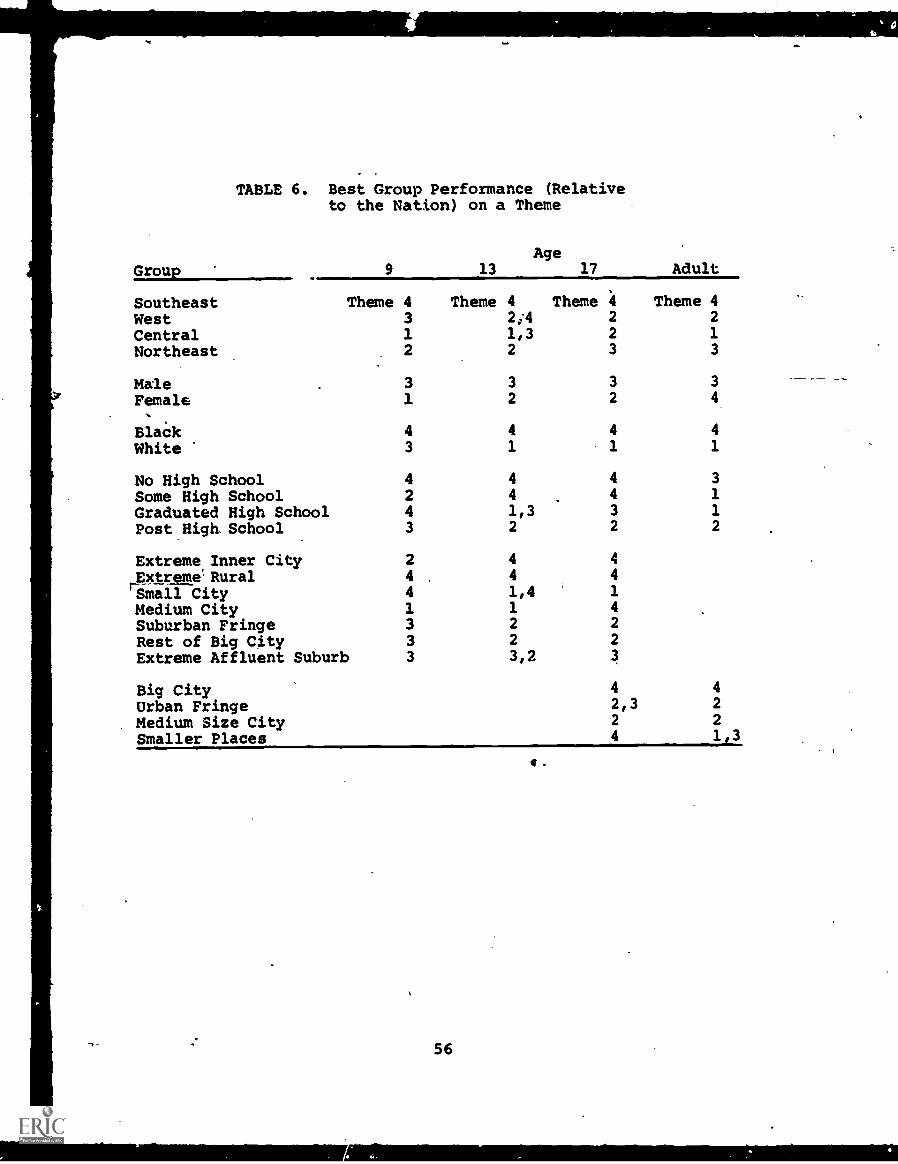
TABLE 6. Best Group Performance (Relativeto the Nation) on a Theme
Age
2E22P 9 13 17 Adult
Southeast Theme 4 Theme 4 Theme 4 Theme 4West 3 2i4 2 2
Central 1 1,3 2 1
Northeast 2 2 3 3
Male 3 3 3 3
Female 1 2 2 4
Black 4 4 4 4
White 3 1 1 1
No High School 4 4 4 3
Some High School 2 4 4 1
Graduated High School 4 1,3 3 1
Post High. School 3 2 2 2
Extreme Inner City 2 4 4
Extreme' Rural 4 4 4
Small City 4 1,4 1
Medium City 1 1 4
Suburban Fringe 3 2 2
Rest of Big City 3 2 2
Extreme Affluent Suburb 3 3,2 3
Big City 4 4
Urban Fringe 2,3 2
Medium Size City 2 2
Smaller Places 4 1,3
.
56

_CHAPTER6
RESULTS BY OBJECTIVES
There were three major Literature objectives, The first,read literature of excellence, assumed that it is important forpeople to read widt.ly and know something of the Western literarytradition. Accordingly, the first subobjective was: beacquainted with a wide variety of literary works, by many authors,in all genres, from diveise cultures, from diverse periods. Thesecond subobjective was: understand the basic metaphors andthemes thrcugh which man his expressed his values and tensions inWestern culture. The end of both goals:is not simply that oneknow works and themes but that one be able "to use this knowledgewhen confronting a new situation, either in literature or inlife."
The second major objective was: become engaged in, findmeanings in and evaluate a work of literature. The first sub-objective was: respond to a work of literature. The objectivesdid not assume that one kind of response would necessarily bebetter or more desirable than any other--they simply expressedthe hope that people would confront and react to a work ofliterature.
The second subobjective was: find meanings in a work ofliterature. Especially important in this subobjective' is thegoal, read a work with literary comprehension, which attempted tomeasure in some way all the Theme 1 exercises.
The third subobjective was: evaluate a work of literature.The objectives did not specify criteria for evaluation but didinsist that criteria be expressed in any written or verbalevaluation of a work.
The third major objective was: develop a continuing interestand participation in literature and the literary experience.More relevant to 17-year-olds and adult than to the younger agegroups, this goal was an expression of hope that literary experi-ence will play a continuing role in the life of the individualoutside of school and after graduation from school. The sub-objectives were: be intellectually oriented to literature, beaffectiveiy oriented to literature, be independently active andcurious about literature and relate literary experience to one'slife. These are all very difficult goals to measure, of course,
57

but they constitute for many educators the priMary rationale for
the teaching of literature.
The group results for Objective I achievement appear in
Table 7. The percentages are median differences based on exer-
cises included in Themes 3 and 4. At age 9, there were 38Objective I exercise results; at age 13, there were 54; at age
17, 49; and.at the adult level, 38.
TABLE 7. Group Median Differences onObjective I Exercises
-Age
Group 13 17 Adult
Region---Southeast -3.8 -2.1 -3.5 -8.1
West -0:5 1.4 0.4 2.5
Central 2.2 0.6 0.2 -0.7
Northeast 0.4 0.3 1.7 3.2
SexMale -0.7 -1.4 -1.0 -0.2
Female 0.6 143 0.9 0.0
Color.Black -13.1 -8.7 -12.7 -13.1
White 2.3 1.7 1.7 1.6
Parental EducationNo High School -9.2 -7.9 -11.9 -7.9
Some High School -4.3 -2.9 -6.0 -1.7
,Craduated from High School 1.2 -0.7 -0.6 1.5
Post High School 7.4 5.8 7.2 10.0
Size and Type of CommunityExtreme Inner City -9.2 -3.4 -5.9
Extreme Rural -4.6 -2.8 -2.5
Small City 0.0 -0.9 -1.2
Medium City -1.1 -0.2 0.8
Suburban Fringe 3.7 0.8 .1.6
Rest of Big City -0.3- -0.2 -0.8
Extreme Affluent Suburb 8.1 5.2 5.3
Size of CommunityBig City -1.6 0.3 0.2- -0.1
Urban Fringe 4.7 1.6 2.0 2.5
Medium Size City -1.1 -0.3 -0.7 1.8
Smaller Place -1.1 -1.2 -2.0 -1.3
58

The Southeast's median difference was between 2 and 4 points_below the national level at ages 9, 13 and 17; however, the mediandifference for adults was -8.1%. This indicates that, insofaras the exercises measure achievement of-Objective I, Southeastadults are reading less "literature of excellence" than schoolage southeasterners are; also, the-adults are probably lessfamiliar with important literary works and characters. Much ofthis difference is surely attributable to the fact that theyounger people, unlike the adults, are compelled to read in school.
The median differences for the West and Northeast contrastwith those for the Southeast, for in those groups the adults showthe best performance relative tc the nation. Though it is alsotrue in these areas that school age people are_compelled toread, a higher percentage of the adults nonethelesS appear to"read literature of excellence" and recognize important works _and characters. The same pattern appears for the post high schoolparental education group, as one might expect.
Finally, the median differences indicate that the mostactive readers live or attend schools in the "fringe" areasaround big cities, that-is, in the suburbs.
Table 8 presents the group median differences derived fromall exercises designed to measure_ performance of Objective II.There were two kinds of exercises involved: the multiple-choiceitems, most of which appear in Theme 1; and the items requiringwritten or verbal responses, most of which appear in-Theme 2.Consequently, the medianpercentages*are based upon two sorts ofpercentages: percentages of success and percentages of adequateor superior responses. At aqe9, the median percentages and dif-ferences were based on 26 exercise results; at age 13, 39 results;at age 17, 36 results; and at the adult level, 29 results.
The groups showing negative median differences performedless well than the nation as a whole on the two subobjectivesmost thoroughly covered by the assessment: read a work withliterary comprehension and respond to a work of literature. Itis logical to assume that failure to read with literary compre-hension (which means failure to understand figurative languageand its operation) correlates highly with failure to respondadequately.
Several groups performed worse, relative to the nation, ateach succeeding age level. This pattern is easily apparent forthe Southeast and for Blacks. The opposite situation appearsfor the West and the post high school group, both of whichimproved their relative positions at the higher age levels.

.
TABLE 8. Group Median Differences onObjective II Exercises
Age
Group 9 13 17 Adult
RegionSoutheast -4.1 -5.3 -5.0 -7.8
West -0.5 1.0 0.0 2.0
Central 2.5 1.0 1.8 O.'
Northeast 0.8 1.8 1.1 1.;)
SexMale -0.7 -1.7 -1.3 0.0
Female 0.6 1.7 1.2 -0.1
ColorBlack -11.1 -14.5 -15.2 -20.0
White 1.9 2.5 2.1 2.7
Parental EducationNo High School -6.3 -11.1 -10.6 -9.7
Some High School -3.9 -4.2 -7.2 -1.4
Graduated High School -0.1 0.0 -0.7 3.4
Post High School 5.1 6.4 5.9 11.5
Size and Type of CommunityExtreme Inner City -6.8 =7.9
Extreme Rural -2.8 -4.2 =2.4
Small City 0.3 -0.4 -0.1
Medium City -1.5 0.3- -0.3
Suburban Fringe 1.8 1.7 0.9
Rest of Big City -0.5 -1.1 -0.5
Extreme Affluent Suburb 6.2 6.1 6.0
Size of CommunityBig City -1.8 -1.0 -1.5 -1.6
Urban Fringe 3.6 2.8 2.9 0.8
Medium Size City -1.0 -0.3 4.2 1.6
Smaller Places- -0.4 -1.6 -1.2 0.1
The group median differences for Objective III appear in
Table 9. These are based upon 11 exercise results at age 9, 27
results at age 13 and 21'results for 17-year-olds and adults.
Insofar as the results accurately reflect extra curricular
participation and interec't in literary experience, it appears
that some groups show an increase in involvement with each
60

TABLE.9. Group Median Differences onObjective III Exercises
AgeGroup 9 13 17 AdultRegionSoutheast 0.7 0.7 -0.3 -7.3West -2.9 1.5 -0.2 1.5Central 1.8 -0.9 -0.9 -2.0Northeast -1.0 -0.9 0.5 2.9
SexMale -1.1 -2.6 -2.2 -1.8Female 1.0 2.2 2.1 1.7
ColorBlack 0.9 -3.7 -4.7 -7.5White 0.0 0.6 0.7 0.9
Parental EducationNo High School -3.6 -4.8 -8.8 -9.4Some High School
. --2.5 -0.6 -4.2 -2.2Graduated from High School' 1.9 -1.1 -2.0- -0.2.Post High School 3.8 4.3 .5.9 12.4
Size and Type of CommUnityExtreme Inner City -3.4 -2.2 -2.7Extreme Rural -2.1 -1.2 -1.1Small City 1.3 -0.5 -0.9Medium City -1.0 0.0 1.8Suburban Fringe 0.8 -0.9 0.8Rest of Big City -0.5 0.4 -1.7Extreme Affluent Suburb 0.3 2.8' 3.4
Size-of CommunityBig City -1.8 0.3 0.2 2.9Urban Fringe 1.4 0.0 1.0 2.5Medium Size City -1.6 0.0 0.5 2.6Smaller Place 0.4 -0.4 -0.8 -2.6
increase in age; other groups, however, demonstrate a decline ininvolvement. While the Northeast, West, post high school and bigcity groups tend to improve their standings relative to theAat::on, the Southeast, Central, Black, no high school and smallplace groups fall farther below the national level at the higherages. This indicates that the groups which generally performbelow the national standard do not evidence "continuing interestand participation in the literary experience" which could
61

conceivably improve their performance. Probably this is because
fewer people in those groups read as well or as often as do so in
other groups and in the nation as a whole.
62

CHAPTER 7
AGE COMPARISONS
The following graphs display several kinds of informationabout age by age results for Themes 1, 3 and 4 and Objectives I,II and III. Theme 2 is not included because there were too fewexercises in it for medians to be at all useful. The plottedpoints connected by solid lines represent the median differences(or effects) for "overlap exercises only--that is, exercisesadministered-at two age levels. Each of these lines displaysonly one age to age comparison: either age 9 results compared toage 13, age 13 compared to age 17 or age 17 compared to adult.If a -line running from left to right slopes away _from the 0 line,the median difference for the older of two age levels is fartherfrom the national level of performance; if a line slopes towardthe 0 line, the median difference for the older of two age levels.is closer to the national level of- performance. The broken linesabove and below each solid line depict the upper and lower quar-tiles (seventy-fifth percentile and'twenty-fifth percentile).They enable the reader to see immediately the range covered by50% of the overlap exercise effects- and to determine the degreeto which the slope of a line accurately reflects a trend from -
age to age. Finally, the crosses (+) depict for each age themedian difference based upon all exercises administered at thatage level in a theme. These Tants enable the reader to compareoverlap median differences to median differences#based on allexercises in a theme.
We can clarify this by discussing the first graph in Exhibit1., From this graph we learn that: (1) Southeastern 9-year-oldsperformed better relative to a national population of 9-year-oldsthan Southeastern 13-year-olds performed relative to a nationalpopulation of 13-year-olds. The slope of the 9-13 line is awayfrom (in this case, farther below) the national performance level,and this trend appears to be stable, since the quartile linesalso slope downwards. (2) On at least 75% of the 9-13 overlapexercises, the Southeastern percentage was lower than the nationalpercentage. (3) The median differences based on all the Theme 1exercises taken at each age (not just overlap exercises) werelower at each age than the overlap medians, indicating that peopleperformed a bit better on overlap exercises than they did on allexercises. (4) Seventeen-year-olds performed slightly betterthan 13-year-olds, relative to their national population. The13-17 line slopes upward and the quartiles also reflect this
63

improvement in performance. (5) There was very little difference
between performance on 13-17 overlap exercises and performance
on all Theme 1 exercises, since the overlap median points are-
almost identical to the crosses. (6) Southeastern adults per-
formed much worse, relative to a national population of adults,
than did 17-year-olds relative to their national population. The
narrowness of the quartiles suggests that this is a very stable
trend.
64

1
AGE COMPARISONS
65

EXHIBIT I. Age Comparisons for the Southeast Region
Treme %13 , li A
- _____ ---.-'''.. ......"'
.. .,,
,... .
IJ/ .+--------* %-,/
..''
-41erney13 n IA

The Southeast
Age comparisons for Theme 1 have just been made on the pre-ceding page. Since median effects for Objective II-overlap exer-cises are very similar to those for Theme 1, we can concludethat between ages 9 and 13 this group's performance Oh skillsassociated with Objective II declines somewhat, relative to thenation; however, between ages 13 and 17 there is an improvementin performance of Objective II skills. Finally, Southeasternadults perform considerably worse on Objective II exercises,relative to a national adult population, than 17-year-olds do,relative to their national population.
Theme 3 (Objective I) results present a different pattern.Between the ages of 9 and 13, southeasterners make considerableprogress in approaching the national, level of performance. Itwould appear that in these years they, are exposed to a great deal,
of specific information about literary works and-characters.Between the ages of 13 and 17, however, southeasterners cease togain on the nation and instead fall somewhat behind.the nationalpace. The fall is accelerated considerably between the 17-year-old and adult levels.
Theme 4 (Objective III) median differences preient yetanother pattern, probably because these exercises were almost allself-report survey and attitude questions. At age 9, about 60%of the group's percentages were above the national level; at age13, 75% of the results were at or above the national figure.Between the ages of 13 and 17, there is little change in perfor-mance. Teenagers in the Southeast appear to respond pretty muchas all teenagers do. Once again, however, there is a consider-able plunge below the national level between the 17-year-oldsand the adults.
67


The West
The West's median differences for overlap exercises inTheme 1 (Objective II) were near the national level at all ages.Between ages 9 and 13, performance improved (relative to thenation) very slightly. Between ages 13 and 17, performanceremained about the same. But--and this is a distinctive featureof the Western regional group--between the 17-year-old and adultlevels, performance improved relative to the nation. At age 17,fewer than 50% of the West's percentages were above the nationallevel; but the adults were above their national population onmore than 75% of the overlap exercises assessing skills relatedto the understanding of imaginative language.
Median differences for Theme 3 (Objective I) overlap exer-cises reveal an improvement in performance between ages 9 and 13.The quartile points indicate, however, that the distribution ofeffects at age 13 covered a much wider range than it did at age 9.Differences in the'distributions at ages 13 and 17 make the trendfrom 13 to 17 difficult to discern, though it would appear thatthe older students did not do quite as well, relative to thenation, as the 13-year-olds did. The trend from age 17 to theadult level is clear, however: the older people performed betterthan the 17-year-olds relative to the nation. Apparently theadults in the West continue to read after leaving school or haveabroader knowledge of literary works and characters.
Evidence that the Western adults do continue to read litera-ture after leaving school appears in the Theme 4 (Objective III)survey results: once again they improve upon the relative stand-ing of the 17-year-olds. The 17-year-olds, in fact, do not per-form as well relative to the nation as 13-year-olds do on identi-cal survey questions. There is also a slight decline in relativestanding between ages 9 and 13.
In contrast to the pattern revealed for the Southeast group,it appears that in all themes, Westernsadults improve upon thegroup's standing at age 17 relative to a national population.
69

f(01'so,Cr *CP4.66;re
4
q.

The Central Region
The median differences for the four age groups in Theme 1 domt seem to indicate much change in performance from age to age.At :east 75% of the effects were positive at each age, and thedownward slope of each line is too slight to mean anything"signi-ficant.
Very much the same situation appears in Theme 3 (Objective I),except that a smaller proportion of adult percentages were abovethe national level than were at age 17.
Theme 4 (Objective II.) overlap median differences revealthat.9-year-olds performed better relative to the nation than did13-year-olds. The relative position of 13 and 17-year-oldsremained much the same, but adult performance dropped off slightlyfrom the 17-yaar-old performance.
71


The Northeast
On Theme 1 (Objective II), there was a slight improvement inrelative performance between ages 9 and 13 and a slight declinebetween ages 13 and 17. Northeastern adults did as well as 17-year -olds relative to the national performance.
Theme 3 (Objective I) median differences for overlap exer-cises reveal a somewhat different pattern. Relative to the nation,13-year-olds did not distinguish'themselver; quite as much as 9-year -olds, even though 75% of the effects were above the nationallevel at each age. The position of the crosses at each age sug-gests, however, that at age 9 the overlap exercises were easierthan most exercises- Thirteen and 17-year-olds performed verymuch the same relative to the nation, but the 17-adult comparisons,..ggests that adults were a bit more knowledgeable about literaryworks and characters.
Theme 4 (Objective III) results suggest a steady improvementfrom age to age relative to the nation. It would appear, then,,that adults in this region continue to read beyond their formaleducation and lay claim to wider reading backgrounds than theirhigh school neighbors.
.73

.........

Males
Nine-year-old boys do not differ as much from the nationallevel of performance as 13-year-old boys do on the very sameTheme 1 (Objective II) exercises. The variability in the effectsis, however, greater at age 9 than at age 13. TPA same is trueof age 13 results compared to those achieved by 1/-year-olds. Forthis reason it is safest to say that the 9 -13 and 13-17 compari-sons reveal little change.' There does appear to bean improvementin standing (relative to the nation) between the age of 17 andachievement of adulthood, but this may simply reflect a declinein achievement among women, who comprise more than half thenational population.
On Theme 3 overlap exercises there was little change from -age-to age in median difference from the national level. However,the quaitile lines indicate that a greater proportion of effectson 9-13 overlap exercises.were below the national,level at age 13.
Theme 4 results again reveal a shift in the distribution of9-13 overlap effects at age 13; however, there is little evidenceof any age to age trends.
75


Females
1,s one might expect, the age trends for females mirror thosefor males. Thus, in Theme 1 (Objective II) there is a slightimprovement from age 9 to age 13, very little 13-17 differenceand an approach to the national level between age 17 and the adultlevel.
Theme 3 (Objective I) and Theme 4 (Objective III) median dif-ferences likewise reflect slight trends that are the reverse ofthose demonstrated by males.
77
a

EXHIBIT'7. Age Comparisons for Blacks
A
\,-, \
.... %
. \,
'4219:1)
3eme4 e n A
theme 313
0
17 R
78
Blacks
Though the quartile lines for Theme 1 (Objective II) overlaplines indicate rather wide distributions of differences, the trendsfrom are to age Ire clear: taking the same exercises, Black 13-year -olds do more. poorly, relative to the nation, than do 9-year-olds. In other words, though Black 13-year-olds undoubtedly dobetter than Black 9 -year olds', they do not improve as much on9-year-old performance as a national population of 13-year-oldsimproves upon a naticaal population of 9-year-olds--thus, they fallfarther below the national level. There is little change in theirrelative 'position between ages 13 and 17. However, after age 17,performance again drops farther below the national level.
The median differences for Theme 3 (Objective I) are more dif-ficult to interpret since the variabilities are so great. None-theless, it is apparent that on overlap exercises dealing withliterary workq,:and characcers, 13- year -olds do no worse, relativeto the nation, than 9-year-olds. There do not seem to be verygreat changes in performance at the other age levels.
Theme 4 (Objective III) results make 9-13 comparisons risky,since the variability in effects was so much greater at age 134-han at age 9. Thirteen-17 comparisons indicate that on this theme,as on the others, there was little change between seventh gradeperformance and eleventh grade performance relative to nationalpopulations.
79

It
EXHIBIT 8. Age. Comparisons for Whites
"The Alcove 313 11 13 11 R
-IC
It
t....
-S. .
-It.
-15..
n A
.. z ........ .......
so

Whites
The quartile lines above and below tne age trend lines forTheme 1 (Objective II) reveal that Whites as a group perform veryconsistently, with at least 50% of the effects within 2 percent-age points of each other and with performance on overlap exer-cises differing little from performance on all Theme 1 exercisesat each age: Relative to the nation, 13-year-olds improve uponthe pekformaTiCe of 9-year-olds. Seventeen-year-olds remain inabout the same relative position as 13- year - olds,, adults as 17-year -olds.
Theme 3 (Objective I) and Theme 4 (Objective III) median dif-ferences reveal little relative improvement from age to age.
81

EXHIBIT 9. Age Comparisons for the No High School Group
34Metm n A
Term13 11 f4
I-
P.
U
411L.
4L.
Zemt.13 n A
S.
ss.
.%
.....
82

4
Parental Education: No High School
Overlap exercise effects for Theme 1 reveal a definite dropin the relative performance between the ages of 9 and 13. However,between the ages of 13 and 17, this group improves its performancerelative to the nation. Adults whose parents have had no highschool perform much as 17-year-olds do, relative to the nation.
Theme 3 (Objective I) results are hard to interpret becausethe variability in the effects is so great at ages 9, 13 and 17.It does appear that 9 and 13-year-olds performed worse on theoverlap exercises than on all exercises in the theme. The onlystable age trend appears to be between the 17-yeaT-olds and theadults. Although the exercises in this theme require knowledgeof specific works and characters, adults did considerably better,relative to the nation, than did 17-year-olds.
The median difference. for Theme .4 point to a steady trendfronLage to age, away from the nat vel of performance.Since exercises in this theme a ss reading habits, it is safeto say that the reading habits of 9-year-olds in this group aremuch more like rational reading habits than are those of the 13-year -olds. Seventeen-year-olds are reading even less, relativeto a natiunal population than are '1-year-olds.
83

EXHIBIT 10. Age Comparisons for the Some High School
!erne 15 II A31erne 3
e
IIL
-61,1.
MI/
-C
zema.Li 11 Iq
-C....
84

Parental Education: Some High School
On Theme 1 (Objective II) overlap-exercises, 13-year-olds didnot perform better than 9-year-olds relative to the nation; theydid, however, perform more consistently, as the quartile linessuggest., Seventeen-year-olds did worse, relative to the nation,than 13-year-olds. The most dramatic age trend appeared. between17- year - olds -and adults. On the same exercises, adults in thisgroup perforh_d-very much as, all adults did, but"17-year-olds inthe group performed considerably poorer than all 17-year-olds.Apparently the factors that define people in this group operateless effectively as people _leave' school and move into the 25-36year-old, range.
Though the overlap median. differences for Theme 3 (ObjectiveI) appear` to describe trends from 9 to 13 and from 13to 17, thequartile lines suggest that we should be_skeptical. 'The changesare most likely very slight. -It does appear, however, that inthis theme as in Theme 1, adults improved considerably upon therelative standing of the group at age 17.
Slight age trends did appear in Theme 4 (Objective III)results. Thirteen-year-olds in this group did somewhat betterrelative to a national sample of 13-year-olds, than 9-year-oldsdid relative to their national population. Between the ages. of13 and 17 -, there was a slight-drop in relative performance, butbetween the 17-year-olds and the adults, performance once againmoved closer to the national level.
Exhibit 10 indicates that regardless of-theme or objective,this group's age to age trends were very similar. Though the9-13'trend appears dramatic in Theme 3, the quartile lines suggestthat it is not.
85
V
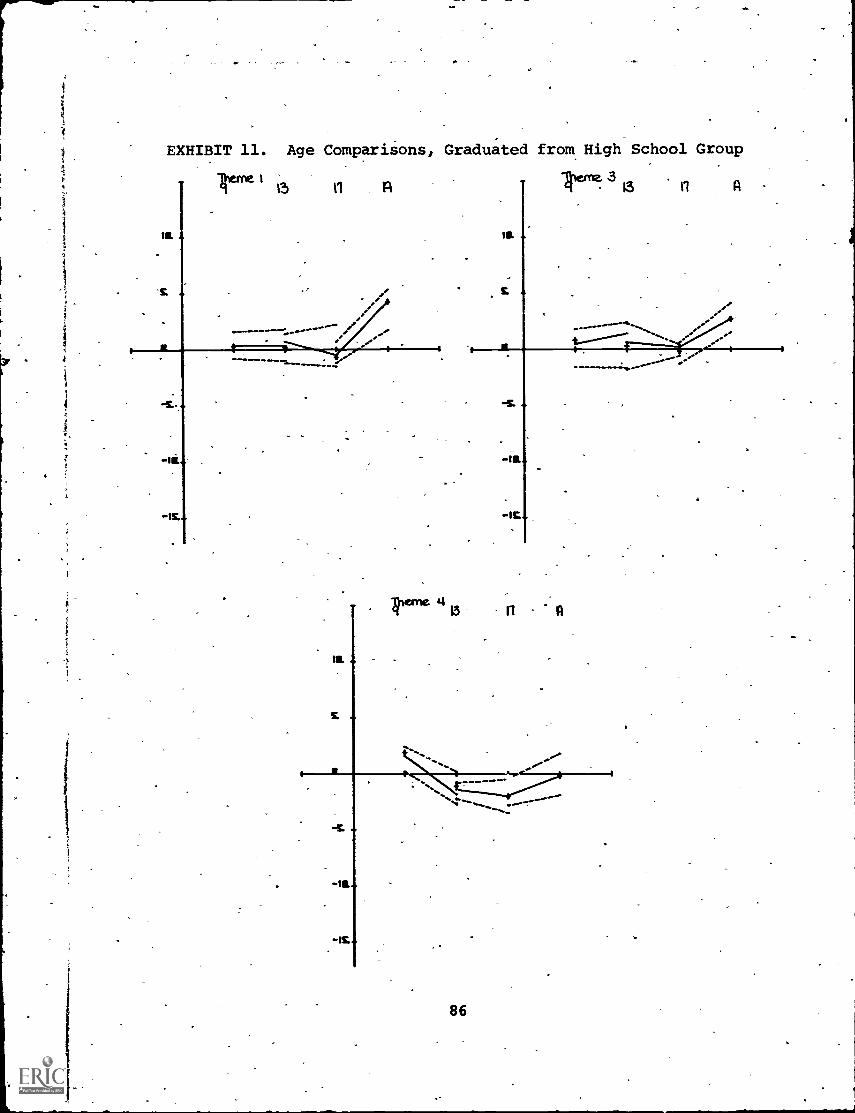
EXHIBIT 11. Age Comparisons, Graduated from High School Group
itur.315 n A 4 0 A

Parental Education: Graduated from Hi,h School
Theme 1 (Objective II) median differences reveal little 9-13and 13-17 change in performance. However, adults in this groupperformed much better than all adults, whereas 17-year-olds inthis group performed about as well as all 17 -year -olds did. Again,this would indicate thatriTe effects of being, in this group areless detrimental at the adult level than at the-17-year-old level.
Theme 3 (Objective I) results present much the same picture.Theme 4 (Objective III) results-7based.on,a survey .of reading.habits--suggest.slight age to age changes. However, no age groupoverlap median was more than 2 points above or-below the nationallevel of performance.
Regardless of theme or objective, adult median differencesfor this group are higher, relative to a national performancelevel achieved by adults, than 17-year-old medians afe, relativeto 17-year-old performance nationally.

EXHIBIT 12. Age Comparisons for the.Post High School Group
lberne.13 11 A
me313 11 A
"?
,..
-It-
-1E-
IL
IL ....".....<."*"'"... 0/,,,
-it
-It
11 A
-It
88

Parental Education: Post High School
In all themes, and at all ages, this group's performance isgenerally above the national performance. Theme 1 results indi-cate very slight changes from age to age. Post high school 9-year-olds perform about as much or better thanall 9-year-olds, aspost high school 13-year-olds perform above their peers nationally.There is a slight decline from age 13 to 17 and a slight increasefrom 17 to adult, but in general, the group behaves consistently
4,egarLdless of age.
Theme 3 results indicate a slight downward trend from Age9 to 13 and slight upward trends from 13 to 17-and from 17 to.adult. Again, at all ages the group performs considerably abovethe national level of performance.
Theme 4'median differences imply a steady age to age increasein the gap between people in this group and peoplein the nationas a whole. Reading experience obviously becomes broader as ageincreases, indicating that the already positive reading habitsthese people evidence are reinforced and extended even beyond theterminationof formal education.
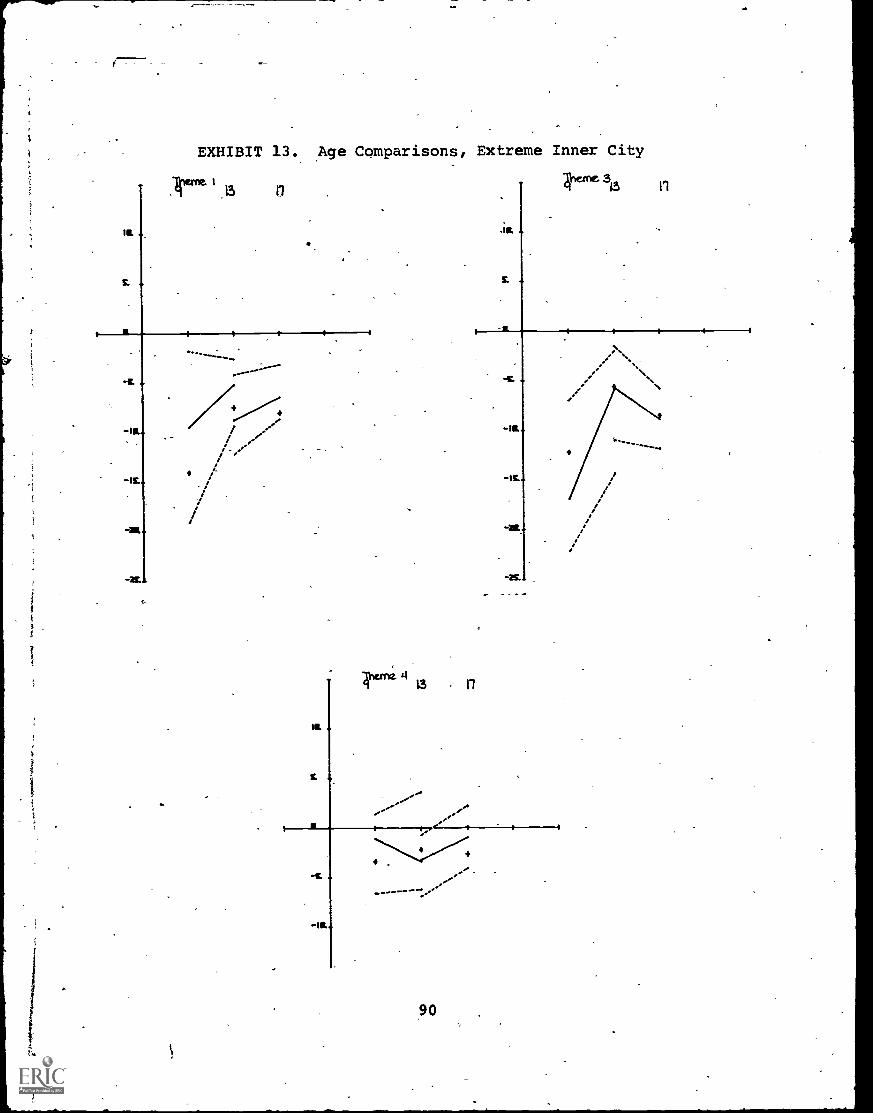
EXHIBIT 13. Age Comparisons, Extreme Inner City
IL -
:0*
41erne 31511
$
4

STOC: Extreme Inner City
Since we do not have STOC data for the adults are ableto make only two age comparisons for STOC groups. 4'
On Theme 1 9-13 overlap exercises, the teenagers performedmore consistently than the 9-year-olds, improving the group'sposition relative to its respective national population. Betweenthe ages of 13 and 17 there was yet another improvement upon thegroup's relative position. Note that the overlap medians arequite different than the medians based on all exercises.
On Theme 3 (Objective I) exercises, this group's 9-13 improve-ment in relative standing is even more dramatic. Though innercity 9-year-olds are more than 16 points below the national level.established by all 9-year-olds, inner city 13-year-olds are only6 points below the national level established by all 13-year-olds.Clearly, this'group improves. more between ages 9 and 13 than thenational population does.
Between the ages of 13 and 17 there is a drop in performancerelative to the national level. In other words; on'the sameexercises, 13-year-olds in the inner city group perform closerto a national population of 13-year-olds than 17-year-olds inthis group perform relative to all 17-year-olds.
The quartile lines defining 50% of the effects on 9-13 over-lap exercises in Theme 4 (Objective III) contradict the apparenttrend defined by the median effect at each age. Between ages 13and 17, howevel:, a slight improvement in performance relative tothe nation is more likely. Note that the median effects basedon all exercises in the theme (+) present quite a differentpicture of age to age performance.
91

EXHIBIT 14. Age Comparisons, Extreme Rural
rtne3t5

STOC: Extreme Rural
The median differences for overlap exercises in Theme 1indicate that 13-year-olds performed better, relative to thenation, than did 9-year-olds. The picture is less clear for the13- 17- year -old results, but it would appear that the 17 -year -oldsperformed somewhat Letter, relative to the nation, than did the13-year-olds.
Theme 3 (Objective I) differences reveal very wide distkibu-tions of effects at ages 9 and 13, making trend analysis hazardous.Between ages 13 and 17, however, there does appear to be a slightimprovement in relative standing.
Results for Theme 4 (Objective-III) reveal that there wasvery little change from age 9 to age 13 and from age 13 to age 17.Performance did appear to be more consistent on the 13-17 over-lap exercises.

.1
iL
EXHIBIT 15. Age Comparisons, Small Places
1 t3 n
NIONsv-
11
-IL
iL
-L
- IL
- IL
IL .
Wwme313 11
O M, ffffff
Alarm 413 11
94
O a.

STOC: Small Places
Median differences on overlap exercises in Aeme 1 reflectconiistent'and stable performance from age to age.
Theme 3 (Objective I) results, however, indicate that 9-year-olds in small towns performed better relative to all 9-year-oldsthan 13-year-olds did relative to their national population.Between the ages of 13 and 17 there was little change in thisgroup's relative position.
Theme 4 (Objective III) median effects show no strong agetrends.
95

EXHIBIT 16. Age Comparisons, Medium Size City
'Terns 113 n
i
1r
IL .
-Ia.
8a ,
5
len*. 313 11
4 e n
1'.411,.............
8
....""".-... ....."
96

STOC: Medium Size City.
Theme 1 (Objective II) results indicate no noteworthy agetrends. Theme 3 (Objective I) median differences reflect a slightimprovement in performance relative to national populations,between ages 9 and,13 and 13 and 17. Theme 4- (Objective III)results point to a'similar, but less stable, pattern.
97


STOC: Suburban Fringe
On exercises assessing understanding of imaginative language(Theme 1, Objective II), this group performed-quite consistentlyfrom age to age.
Exercises calling for more specific infOrmation about liter-_
ary works and characters (Theme 3, Objective I) produced a decreasein performance relative to national levels; between ages 9 and 13.When L3- year -olds and 17-year-olds took the same exercises, eachgroup's median alfference was at about the same distance from itsrespective national population. -
Theme 4 (Objective III) median differences reveal a strongdecrease in performance relative to a national population betweenages 9 and 13. Between age 13 and age 17 there is little changein the group's relative performance.

EXHIBIT 18. Age Comparisons, Rest of Big City
llerne I Ihenle13 11 1 313 11
- W.
- s-
s. -
-
Ia
n
100

STOC: Rest of Big City
. This group did not reveal strong age trends on Theme 1 exer-cisesi either from age 9 to age 13 or from age 13 to age 17.
Theme 3 (Objective I) results, however, indicate a markedshift in performance. The overlap median difference for 9-year-olds in this group was 5 points above the national level; however,for 13-year-olds, the median was a point below the national levelof performance. There was little- change from age_13 to age 17in the- performance of,this-group relative to their national per-formance.
,Theme 4 (Objective III), results reveal no strong age trends.
101

STOC: Extreme Affluent Suburb
Median differences on age 9-13 overlap exercises in Theme 1(Objective II) indicate that 9-year-olds in this group performsomewhat better, relative to all 9-year-olds, than 13-year-oldsperform relative to their national population. There'is littlechange between ages 13 and 17, though the 17-year-olds performeda good deal more consistently than the 13-year-olds.
Theme 3 (Objective I) results indicate a marked downwardtrend between age 9 and age 13, perhaps because 13-year-olds inother STOC groups have gained on the national population of 13-year -olds. Exercises taken by 13 and 17-year-olds did not pro-duce a change in the group's position relative to the nation.
Theme 4 (Objective III) median differences reflect a changein overall performance between the ages of 9 and 13. Threequarters of the group's effects were below the national level atage 9, but at. age 13, three fourths were slightly above thenational level. Overlap exercise differences do not indicate astrong trend between age 13 and age 17.
103

The previous discussion has dealt entirely with median dif-ferences. The following table presents the median national per-centages for each set of overlap results--9 and 13, 13 and 17,17 and adult. The numbers in parentheses represent the number ofexercises the medians are based upon.
TABLE 10. Raw National Percentages for Overlap Exercises
No.Ex. - Medians
Ages 9 13
No.Ex. Media-is
Ages 13 17
No.Ex. Medians
Ages 17 Adult
Obj. I (13) 48% 58%, (39) 54% 60% (38) 61% 61%
Obj. II (18)' 39 62 (20) 68 80 (29) 60 66
Obj. III Only 4 exercises (17) 37 38 (21) 43 36
Theme 1 (15) 40 56 (15) 69 84 (21) 80 70
Theme 3 (11) 48 72 (26) 63 76 (24) 73 '73
Theme 4 (4) 43 39 (17) 37 38 (21) 43 36
This completes the 'Summary of the National Assessment reporton Literature. Readers are encouraged to consult the four themevolumes and the Released Exercises. volume (Report 02-L-20) forfurther. information about the Literature Assessment results.
104

APPENDIX Ai
Following are the exercise results used to compute Th4me 4median response percentages and median differences at each age.The particular result number used for a given exercise appearsin parentheses. The reader can consult Appendix A, Theme 4, tofind, using the exercise and result numbers, the exact percentages.
Age
9 13 17 Adult
R404A(1) R401(2) R402(2) R402(2)R404B (1) R405A (1) R403 (15) R403 (15),R404C(1) R405B(1) ,., R410A(1) R410A(17)R404D(1) R405C(1) R410B(1) R410B(17)R404E(1) R405D(1) R410C(1) R410C(17)R404f(1) R405E(1) R410D(1) R410D(17)R406(1) R405F(1) R410E(1) R410E(17)R407A(15) R405G(1) R410F(1) R410F(17)R407D(15) R405H(1) R410G(1) R410G(17)R408(2) R406(1) R410H(1) R410H(17)R409(16) R410A(1) R411A(4) R411A(4)
R410B(1) R411B(4) R411B(4)R410C(1) R411C(4) R411C(4)R410D(1) R411D(4) R411D(4)R410E(1) R411E(4) R411E(4)R410F(1) R411F(3) R411F(3)R410G(1) R411G(3) R411G(3)R410H(1) R411H(3) R411H(3)R411A(4) R4111(3) R4111(3)R411B(4) R412(13) R412(13)R411C(4)R411D(4)R411E(4)R411F(3)R411G(3)R411H(3)R4111(3)
105
U.S, Government Printing Office: 1973-733406/191 Region it