spotless annualreport2014-15 v16
DESCRIPTION
annual reportTRANSCRIPT
We’ll take care of it.ANNUAL REPORT 2014/2015

With an amazing team of more than 39,000 people in Australia and New Zealand, Spotless provide innovativeand tailored solutions across a range of key service offerings. These services include catering, maintenance, security, technical and engineering services, laundry and linen, waste management, environmental services, cleaning, utility infrastructure services and many more.
Who is Spotless? ................................................................................. 3Chairman’s Report ............................................................................... 4CEO’s Report ...................................................................................... 6Directors’ Report ................................................................................. 8Corporate Governance Statement ..................................................... 34Financial Statements .......................................................................... 43Notes to the Consolidated Financial Statements ................................. 49Auditor’s Independence Declaration ................................................... 84Directors’ Declaration ......................................................................... 85Auditor’s Report ................................................................................ 86Shareholder Information ..................................................................... 88Corporate Directory ...........................................................................90
Contents
1

ANNUAL REPORT 2014/20152
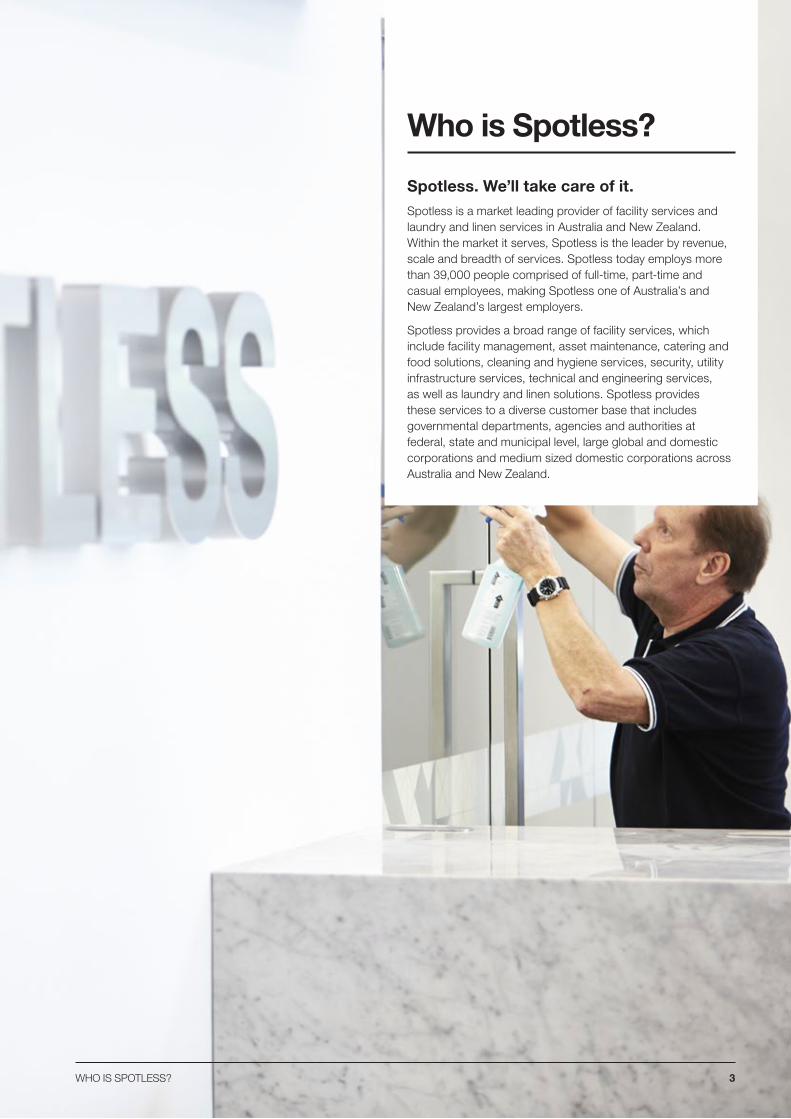
Spotless. We’ll take care of it.Spotless is a market leading provider of facility services and laundry and linen services in Australia and New Zealand. Within the market it serves, Spotless is the leader by revenue, scale and breadth of services. Spotless today employs more than 39,000 people comprised of full-time, part-time and casual employees, making Spotless one of Australia’s and New Zealand’s largest employers.
Spotless provides a broad range of facility services, which include facility management, asset maintenance, catering and food solutions, cleaning and hygiene services, security, utility infrastructure services, technical and engineering services, as well as laundry and linen solutions. Spotless provides these services to a diverse customer base that includes governmental departments, agencies and authorities at federal, state and municipal level, large global and domestic corporations and medium sized domestic corporations across Australia and New Zealand.
Who is Spotless?
WHO IS SPOTLESS? 3
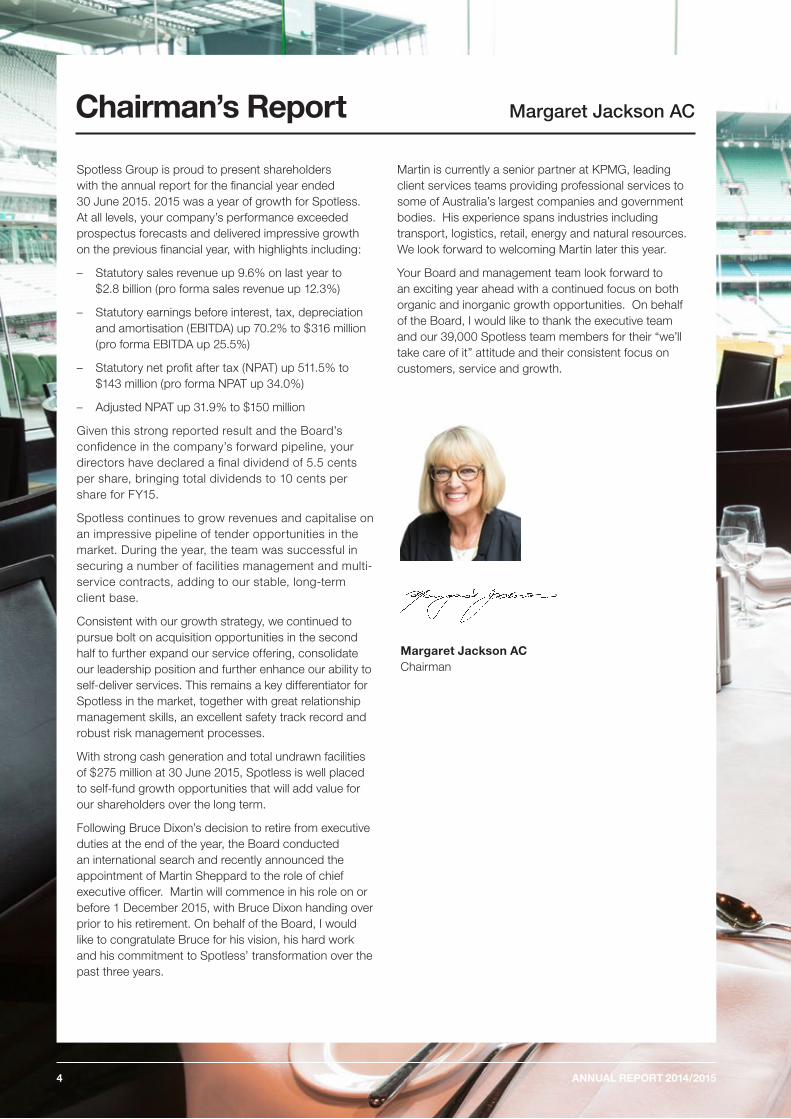
Chairman’s Report Margaret Jackson AC
Spotless Group is proud to present shareholders with the annual report for the financial year ended 30 June 2015. 2015 was a year of growth for Spotless. At all levels, your company’s performance exceeded prospectus forecasts and delivered impressive growth on the previous financial year, with highlights including:
– Statutory sales revenue up 9.6% on last year to $2.8 billion (pro forma sales revenue up 12.3%)
– Statutory earnings before interest, tax, depreciation and amortisation (EBITDA) up 70.2% to $316 million (pro forma EBITDA up 25.5%)
– Statutory net profit after tax (NPAT) up 511.5% to $143 million (pro forma NPAT up 34.0%)
– Adjusted NPAT up 31.9% to $150 million
Given this strong reported result and the Board’s confidence in the company’s forward pipeline, your directors have declared a final dividend of 5.5 cents per share, bringing total dividends to 10 cents per share for FY15.
Spotless continues to grow revenues and capitalise on an impressive pipeline of tender opportunities in the market. During the year, the team was successful in securing a number of facilities management and multi-service contracts, adding to our stable, long-term client base.
Consistent with our growth strategy, we continued to pursue bolt on acquisition opportunities in the second half to further expand our service offering, consolidate our leadership position and further enhance our ability to self-deliver services. This remains a key differentiator for Spotless in the market, together with great relationship management skills, an excellent safety track record and robust risk management processes.
With strong cash generation and total undrawn facilities of $275 million at 30 June 2015, Spotless is well placed to self-fund growth opportunities that will add value for our shareholders over the long term.
Following Bruce Dixon’s decision to retire from executive duties at the end of the year, the Board conducted an international search and recently announced the appointment of Martin Sheppard to the role of chief executive officer. Martin will commence in his role on or before 1 December 2015, with Bruce Dixon handing over prior to his retirement. On behalf of the Board, I would like to congratulate Bruce for his vision, his hard work and his commitment to Spotless’ transformation over the past three years.
Martin is currently a senior partner at KPMG, leading client services teams providing professional services to some of Australia’s largest companies and government bodies. His experience spans industries including transport, logistics, retail, energy and natural resources. We look forward to welcoming Martin later this year.
Your Board and management team look forward to an exciting year ahead with a continued focus on both organic and inorganic growth opportunities. On behalf of the Board, I would like to thank the executive team and our 39,000 Spotless team members for their “we’ll take care of it” attitude and their consistent focus on customers, service and growth.
Margaret Jackson AC Chairman
ANNUAL REPORT 2014/20154

5CHAIRMAN’S REPORT
CEO’s Report Bruce Dixon
During the 2015 financial year, Spotless continued to build on its strong operational base which has been reset over the past three years by looking for opportunities to deliver efficient, reliable, high quality services to our clients. We are pleased to report that our transformation has delivered sustainable efficiencies as we have reset, and continue to maintain, margins in line with our global peers.
FY15 revenue, EBITDA, NPAT and cash flow all exceeded both the prior year and our prospectus forecasts. These results were achieved through an unrelenting focus on current and prospective customers, resulting in significant new business wins and landmark contract renewals.
Track record of organic growthThe quality of our service to our customers continues to be reinforced by our success in securing new and extending existing customer contracts. During the year, Spotless was awarded a number of renewed and new contracts with annualised revenues of $1,300 million per annum.
Notable new wins included:
• Facilities management contracts for the Melbourne Airport Terminal, WA Department of Housing, the New Zealand Defence Force (Southern Region) and Aurrum Aged Care
• Catering contracts for Newcastle Airport, Emirates lounges nationally and Jetstar at Brisbane International Airport as well as Adelaide City Council and Auckland City Council and Calvary Health
• A combination of facilities management, township management, catering and cleaning contracts for Glencore’s Lady Loretta mine in Queensland, BHP’s Kurra Village near Newman, BHP Billiton’s Olympic Dam and Leonora Village in WA
Long term Spotless clients including Melbourne Cricket Ground, the South Australian Government, The Australian Department of Defence and the University of Western Australia also renewed long term contracts with Spotless during the year.
We are proud that Spotless has recently been selected as preferred bidder on both the WA Schools Public Private Partnership (PPP) and Victorian New Schools PPP with final decisions expected soon. Spotless is the leading operator of social infrastructure PPPs across Australia and New Zealand with 10 operational projects and four contracts currently mobilising. These contracts have a combined average tenor of ~27 years, providing a secure long-term revenue stream. Our PPP revenues were ~$112m in FY15 and the company expects incremental annualised revenue of ~$130m from projects reaching full operational phase in FY16 and FY17.
Expanding our service offeringOur stated growth framework includes disciplined acquisitive growth and we remain interested in opportunities that can both enhance our capacity and expand our service offering.
During the year, Spotless acquired and is currently integrating AE Smith, Australia’s leading air-conditioning and mechanical services provider. This acquisition provides a platform for growth into technical services.
We also recently reached an agreement to acquire Utility Service Group, Australia’s leading provider of retail meter reading and installation services, providing a growth platform in the utilities sector. The company had annual revenues of $200 million at the time of acquisition, which completed in July.
Spotless also made three smaller bolt-on acquisitions during FY15 – Aladdin Laundry, International Linen Service and TechGuard Security. Together, these transactions have enhanced and expanded our service offering to customers, complementing our existing services lines and have been instrumental in achieving our objective to increase self-delivery.
Spotless continues to evaluate a growing number of opportunities to acquire businesses with the objective of enhancing our client value proposition and reinforcing our position as Australia’s leading integrated facility services provider.
ANNUAL REPORT 2014/20156
Growing our teamSpotless has grown its front line team from 33,000 at the time of our initial public offering (IPO) in 2014 to 39,000 today. We have welcomed team members from businesses we’ve acquired and we have also grown the team organically – adding 1,000 new jobs in the 2015 financial year. We are proud of the role we play as a major employer in both Australia and New Zealand and we continue to invest in workforce diversity, indigenous employment and training opportunities.
Continued focus on safety and risk managementDuring the year, we continued to focus on identifying innovative solutions for managing safety risks. The Spotless team recently implemented an ErgoAnalyst program to address manual handling risks in the workplace, with great results. We also introduced an OHS Management System certification (Safety@Spotless), implemented a safety leadership training program and put a new incident reporting system in place.
These initiatives resulted in a 42% reduction in lost time injury frequency rate; a 30% reduction in days lost following injury (severity rate); and an 8% reduction in the number of claims.
Strong financial positionSpotless maintains its strong financial position with net debt of $563.5 million at 30 June 2015, representing a net debt to EBIDTA of 1.8 times. During the year, Spotless also took the opportunity to secure additional debt facilities of $200 million. These new facilities have significantly extended the Company’s debt maturity profile. With total undrawn facilities of $275 million at 30 June 2015, Spotless is well positioned to explore further growth opportunities.
Well placed for 2016The calibre and breadth of our customer base, along with the security of multi-year and long-term contracts provides high visibility of Spotless’ revenue and gives us confidence in the year ahead. Our margins remain in line with our global peers and we see further upside as we continue to improve revenue quality.
Management believes Spotless is uniquely placed to take advantage of consolidation opportunities in the services sector where we can create value for our clients and deliver returns to our shareholders. This will continue to be a focus for the team in 2016.
On a personal note, this will be my last annual report to shareholders as I retire from executive duties at the end of the calendar year. I have enjoyed a great career with Spotless and I have no doubt that the business will continue to provide great training, leadership and career opportunities for many. I’m proud to leave the business in a strong financial position with a solid pipeline of contracts and I look forward to meeting shareholders at the upcoming 2015 Annual General Meeting.
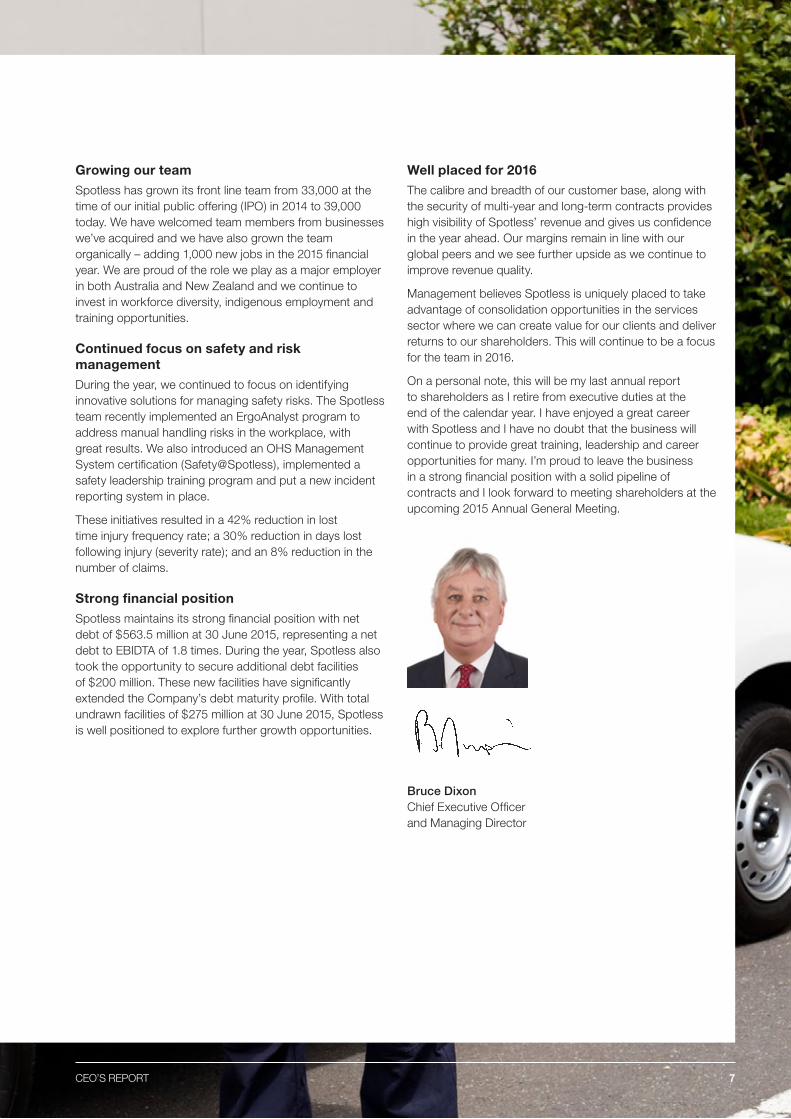
Bruce Dixon Chief Executive Officer and Managing Director
CEO’S REPORT 7
The Directors hereby present their report for the year ended 30 June 2015. In order to comply with the provisions of the Corporations Act 2001, the Directors report as follows
DIRECTORSThe names and details of Directors of Spotless Group Holdings Limited (the “Company”) during the entire financial year and up to the date of this report, unless otherwise stated were:
DIRECTOR PROFILES
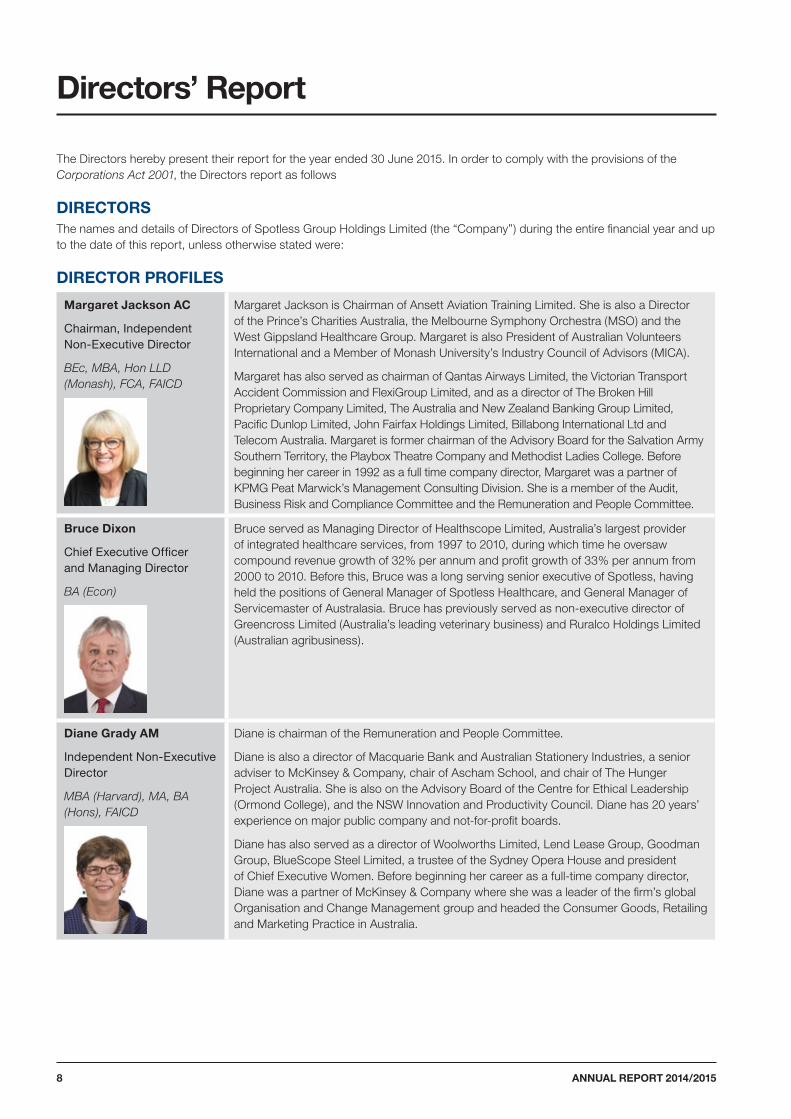
Margaret Jackson AC
Chairman, Independent Non-Executive Director
BEc, MBA, Hon LLD (Monash), FCA, FAICD
Margaret Jackson is Chairman of Ansett Aviation Training Limited. She is also a Director of the Prince’s Charities Australia, the Melbourne Symphony Orchestra (MSO) and the West Gippsland Healthcare Group. Margaret is also President of Australian Volunteers International and a Member of Monash University’s Industry Council of Advisors (MICA).
Margaret has also served as chairman of Qantas Airways Limited, the Victorian Transport Accident Commission and FlexiGroup Limited, and as a director of The Broken Hill Proprietary Company Limited, The Australia and New Zealand Banking Group Limited, Pacific Dunlop Limited, John Fairfax Holdings Limited, Billabong International Ltd and Telecom Australia. Margaret is former chairman of the Advisory Board for the Salvation Army Southern Territory, the Playbox Theatre Company and Methodist Ladies College. Before beginning her career in 1992 as a full time company director, Margaret was a partner of KPMG Peat Marwick’s Management Consulting Division. She is a member of the Audit, Business Risk and Compliance Committee and the Remuneration and People Committee.
Bruce Dixon
Chief Executive Officer and Managing Director
BA (Econ)
Bruce served as Managing Director of Healthscope Limited, Australia’s largest provider of integrated healthcare services, from 1997 to 2010, during which time he oversaw compound revenue growth of 32% per annum and profit growth of 33% per annum from 2000 to 2010. Before this, Bruce was a long serving senior executive of Spotless, having held the positions of General Manager of Spotless Healthcare, and General Manager of Servicemaster of Australasia. Bruce has previously served as non-executive director of Greencross Limited (Australia’s leading veterinary business) and Ruralco Holdings Limited (Australian agribusiness).
Diane Grady AM
Independent Non-Executive Director
MBA (Harvard), MA, BA (Hons), FAICD
Diane is chairman of the Remuneration and People Committee.
Diane is also a director of Macquarie Bank and Australian Stationery Industries, a senior adviser to McKinsey & Company, chair of Ascham School, and chair of The Hunger Project Australia. She is also on the Advisory Board of the Centre for Ethical Leadership (Ormond College), and the NSW Innovation and Productivity Council. Diane has 20 years’ experience on major public company and not-for-profit boards.
Diane has also served as a director of Woolworths Limited, Lend Lease Group, Goodman Group, BlueScope Steel Limited, a trustee of the Sydney Opera House and president of Chief Executive Women. Before beginning her career as a full-time company director, Diane was a partner of McKinsey & Company where she was a leader of the firm’s global Organisation and Change Management group and headed the Consumer Goods, Retailing and Marketing Practice in Australia.
Directors’ Report
ANNUAL REPORT 2014/20158
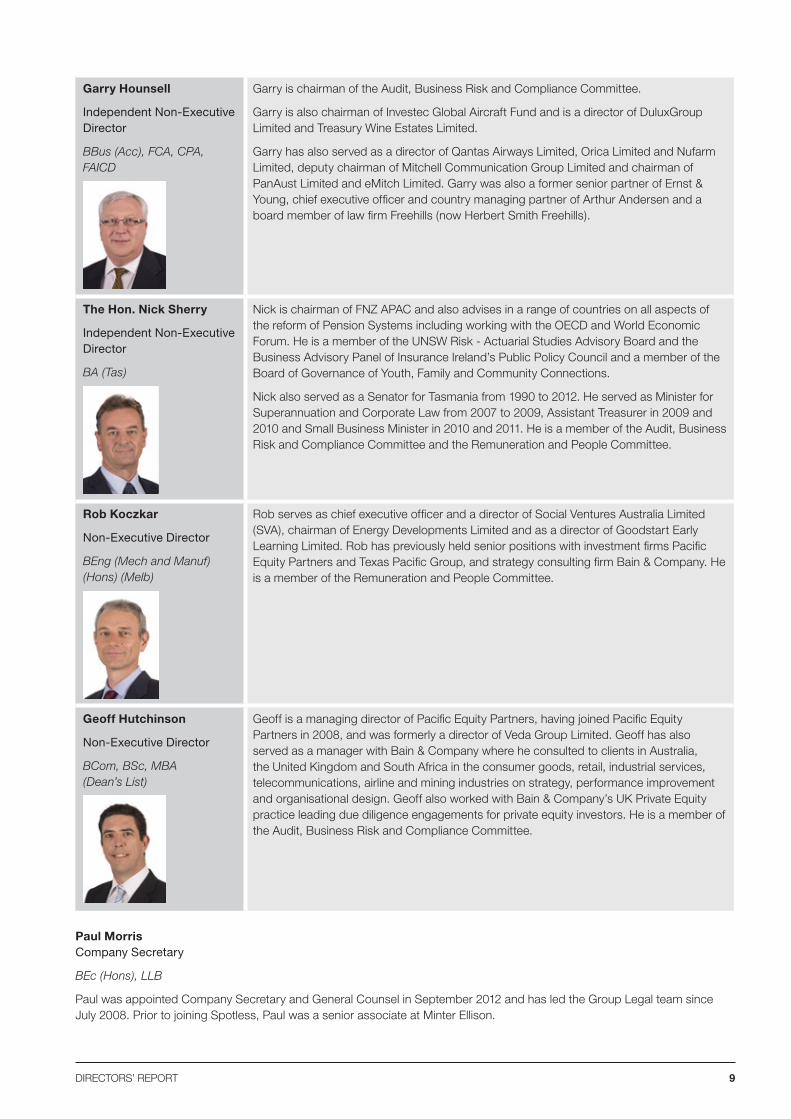
Garry Hounsell
Independent Non-Executive Director
BBus (Acc), FCA, CPA, FAICD
Garry is chairman of the Audit, Business Risk and Compliance Committee.
Garry is also chairman of Investec Global Aircraft Fund and is a director of DuluxGroup Limited and Treasury Wine Estates Limited.
Garry has also served as a director of Qantas Airways Limited, Orica Limited and Nufarm Limited, deputy chairman of Mitchell Communication Group Limited and chairman of PanAust Limited and eMitch Limited. Garry was also a former senior partner of Ernst & Young, chief executive officer and country managing partner of Arthur Andersen and a board member of law firm Freehills (now Herbert Smith Freehills).
The Hon. Nick Sherry
Independent Non-Executive Director
BA (Tas)
Nick is chairman of FNZ APAC and also advises in a range of countries on all aspects of the reform of Pension Systems including working with the OECD and World Economic Forum. He is a member of the UNSW Risk - Actuarial Studies Advisory Board and the Business Advisory Panel of Insurance Ireland’s Public Policy Council and a member of the Board of Governance of Youth, Family and Community Connections.
Nick also served as a Senator for Tasmania from 1990 to 2012. He served as Minister for Superannuation and Corporate Law from 2007 to 2009, Assistant Treasurer in 2009 and 2010 and Small Business Minister in 2010 and 2011. He is a member of the Audit, Business Risk and Compliance Committee and the Remuneration and People Committee.
Rob Koczkar
Non-Executive Director
BEng (Mech and Manuf) (Hons) (Melb)
Rob serves as chief executive officer and a director of Social Ventures Australia Limited (SVA), chairman of Energy Developments Limited and as a director of Goodstart Early Learning Limited. Rob has previously held senior positions with investment firms Pacific Equity Partners and Texas Pacific Group, and strategy consulting firm Bain & Company. He is a member of the Remuneration and People Committee.
Geoff Hutchinson
Non-Executive Director
BCom, BSc, MBA (Dean’s List)
Geoff is a managing director of Pacific Equity Partners, having joined Pacific Equity Partners in 2008, and was formerly a director of Veda Group Limited. Geoff has also served as a manager with Bain & Company where he consulted to clients in Australia, the United Kingdom and South Africa in the consumer goods, retail, industrial services, telecommunications, airline and mining industries on strategy, performance improvement and organisational design. Geoff also worked with Bain & Company’s UK Private Equity practice leading due diligence engagements for private equity investors. He is a member of the Audit, Business Risk and Compliance Committee.
Paul Morris Company Secretary
BEc (Hons), LLB
Paul was appointed Company Secretary and General Counsel in September 2012 and has led the Group Legal team since July 2008. Prior to joining Spotless, Paul was a senior associate at Minter Ellison.
DIRECTORS’ REPORT 9
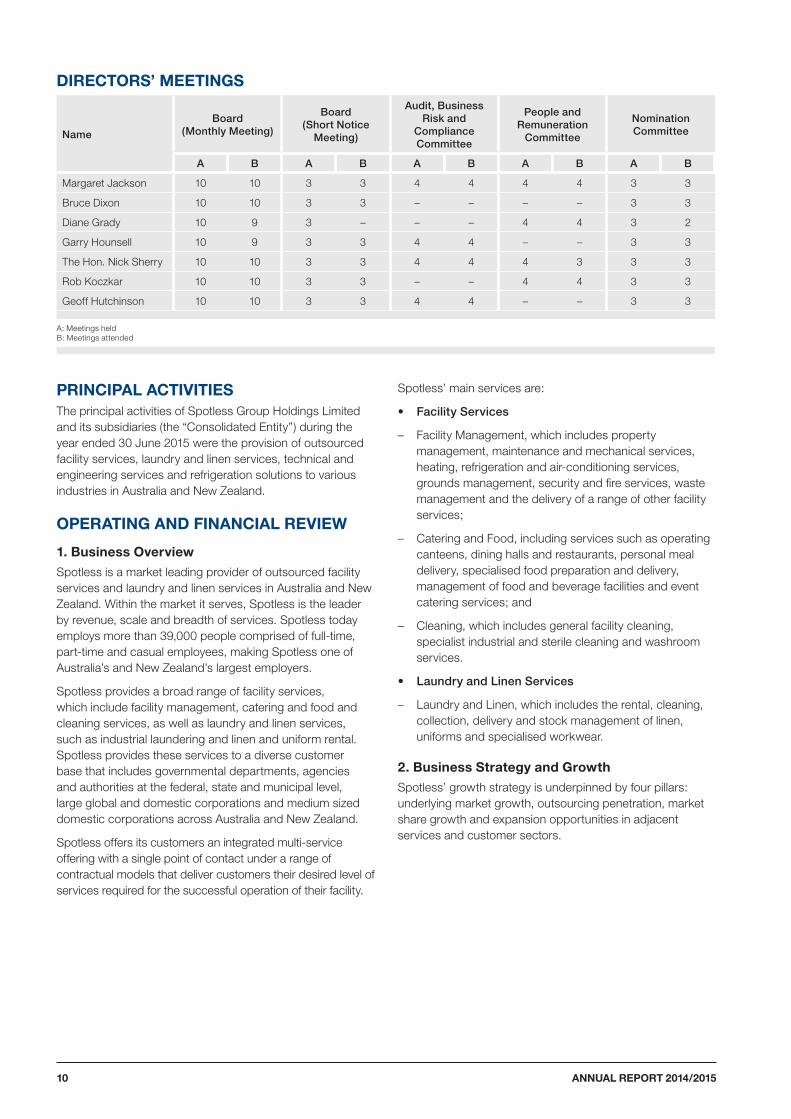
DIRECTORS’ MEETINGS
Name
Board (Monthly Meeting)
Board (Short Notice
Meeting)
Audit, Business Risk and
Compliance Committee
People and Remuneration
Committee
Nomination Committee
A B A B A B A B A B
Margaret Jackson 10 10 3 3 4 4 4 4 3 3
Bruce Dixon 10 10 3 3 – – – – 3 3
Diane Grady 10 9 3 – – – 4 4 3 2
Garry Hounsell 10 9 3 3 4 4 – – 3 3
The Hon. Nick Sherry 10 10 3 3 4 4 4 3 3 3
Rob Koczkar 10 10 3 3 – – 4 4 3 3
Geoff Hutchinson 10 10 3 3 4 4 – – 3 3
A: Meetings heldB: Meetings attended
PRINCIPAL ACTIVITIESThe principal activities of Spotless Group Holdings Limited and its subsidiaries (the “Consolidated Entity”) during the year ended 30 June 2015 were the provision of outsourced facility services, laundry and linen services, technical and engineering services and refrigeration solutions to various industries in Australia and New Zealand.
OPERATING AND FINANCIAL REVIEW
1. Business OverviewSpotless is a market leading provider of outsourced facility services and laundry and linen services in Australia and New Zealand. Within the market it serves, Spotless is the leader by revenue, scale and breadth of services. Spotless today employs more than 39,000 people comprised of full-time, part-time and casual employees, making Spotless one of Australia’s and New Zealand’s largest employers.
Spotless provides a broad range of facility services, which include facility management, catering and food and cleaning services, as well as laundry and linen services, such as industrial laundering and linen and uniform rental. Spotless provides these services to a diverse customer base that includes governmental departments, agencies and authorities at the federal, state and municipal level, large global and domestic corporations and medium sized domestic corporations across Australia and New Zealand.
Spotless offers its customers an integrated multi-service offering with a single point of contact under a range of contractual models that deliver customers their desired level of services required for the successful operation of their facility.
Spotless’ main services are:
• Facility Services
– Facility Management, which includes property management, maintenance and mechanical services, heating, refrigeration and air-conditioning services, grounds management, security and fire services, waste management and the delivery of a range of other facility services;
– Catering and Food, including services such as operating canteens, dining halls and restaurants, personal meal delivery, specialised food preparation and delivery, management of food and beverage facilities and event catering services; and
– Cleaning, which includes general facility cleaning, specialist industrial and sterile cleaning and washroom services.
• Laundry and Linen Services
– Laundry and Linen, which includes the rental, cleaning, collection, delivery and stock management of linen, uniforms and specialised workwear.
2. Business Strategy and GrowthSpotless’ growth strategy is underpinned by four pillars: underlying market growth, outsourcing penetration, market share growth and expansion opportunities in adjacent services and customer sectors.
ANNUAL REPORT 2014/201510

3. Material Business RisksSpotless is subject to various risk factors. Some of these are specific to its business activities. Others are of a more general nature.
Failure to renew existing contracts or win new contracts
Spotless’ ability to renew contracts with existing customers and win new contracts with existing and new customers is fundamental to its business, growth and profitability. Spotless faces competition in all the market sectors in which it operates. New contracts, including contracts entered into with an existing customer where a previous contract has expired, are usually subject to a competitive process. There is a risk that Spotless may not win these contracts for any of a number of reasons.
Failure to successfully renew existing contracts or to win new contracts could negatively impact Spotless’ financial performance, including, in the case of a failure to retain an existing customer, by leaving Spotless with excess capacity or redundancy costs, and adversely impact its ability to grow its operations.
Existing and target customers may choose to change from outsourcing to in-sourcing of services
Spotless’ financial performance depends on its customers continuing to outsource facility services and laundry and linen services. Spotless’ anticipated future growth depends in part on additional services being outsourced in the future. A decline in outsourcing in the industries in which Spotless’ customers operate, or an increase in customers taking services back in-house (i.e. in-sourcing) may adversely affect Spotless’ future revenue and profitability and its prospects for growth.
Rising input costs may lead to lower profitability
The profitability of Spotless’ contracts depends on its management of costs. This involves active management of input volumes and per-unit prices, and maintaining the ability to pass increases in costs through to customers in the form of price increases. A significant or sustained increase in input costs to which Spotless is unable to respond adequately, or at all, either through cost reduction measures or contract price increases, could have an adverse effect on the financial performance of the business and the ability of the business to deliver its forecast financial results. Some, but not all, customer contracts include price escalation provisions, but there is a risk that such provisions may not allow Spotless to recoup all cost increases.
General economic conditions in Australia and New Zealand may worsen
Spotless’ business is predominantly based in Australia, with the balance of its business based in New Zealand. The operating and financial performance of Spotless is influenced by the general economic conditions in Australia and New Zealand, as well as general economic conditions globally. A prolonged downturn in general economic conditions may impact the demand for Spotless’ services or make it difficult to win or renew contracts at equivalent or higher prices. Economic conditions in Australia and New Zealand may have a material adverse impact on Spotless’ financial performance and growth prospects.
DIRECTORS’ REPORT 11
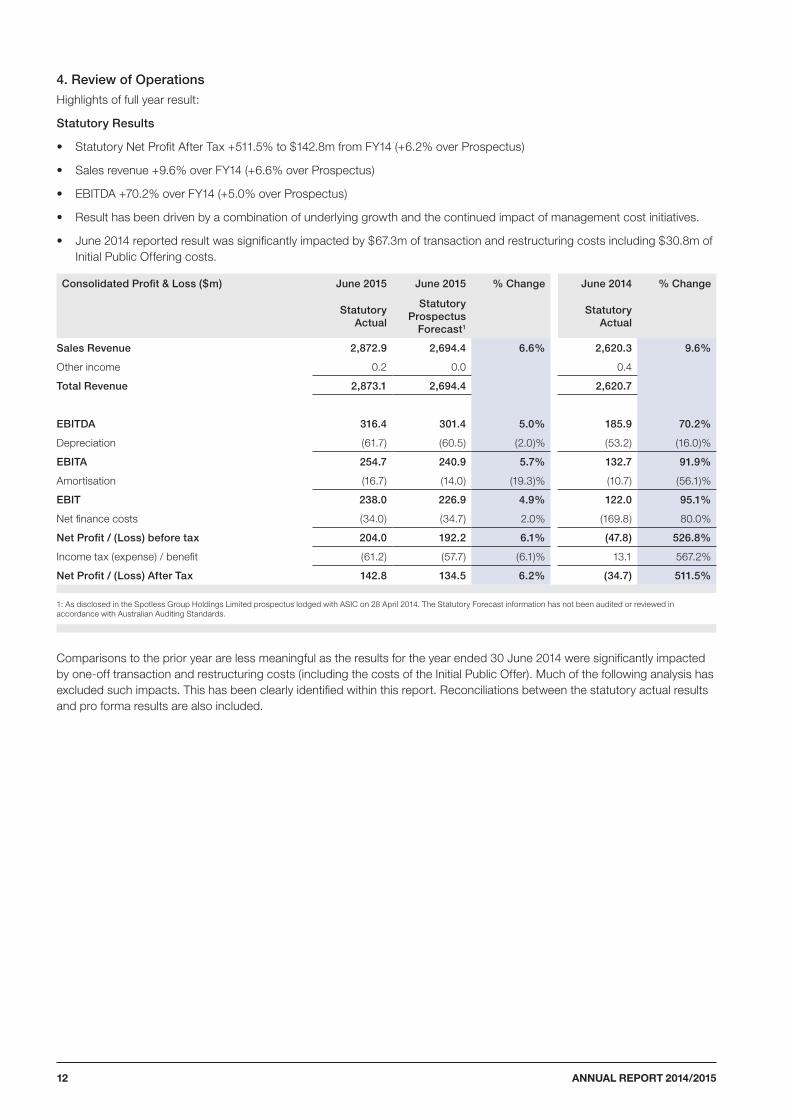
4. Review of Operations
Highlights of full year result:
Statutory Results
• Statutory Net Profit After Tax +511.5% to $142.8m from FY14 (+6.2% over Prospectus)
• Sales revenue +9.6% over FY14 (+6.6% over Prospectus)
• EBITDA +70.2% over FY14 (+5.0% over Prospectus)
• Result has been driven by a combination of underlying growth and the continued impact of management cost initiatives.
• June 2014 reported result was significantly impacted by $67.3m of transaction and restructuring costs including $30.8m of Initial Public Offering costs.
Consolidated Profit & Loss ($m) June 2015 June 2015 % Change June 2014 % Change
Statutory Actual
Statutory Prospectus
Forecast1
Statutory Actual
Sales Revenue 2,872.9 2,694.4 6.6% 2,620.3 9.6%
Other income 0.2 0.0 0.4
Total Revenue 2,873.1 2,694.4 2,620.7
EBITDA 316.4 301.4 5.0% 185.9 70.2%
Depreciation (61.7) (60.5) (2.0)% (53.2) (16.0)%
EBITA 254.7 240.9 5.7% 132.7 91.9%
Amortisation (16.7) (14.0) (19.3)% (10.7) (56.1)%
EBIT 238.0 226.9 4.9% 122.0 95.1%
Net finance costs (34.0) (34.7) 2.0% (169.8) 80.0%
Net Profit / (Loss) before tax 204.0 192.2 6.1% (47.8) 526.8%
Income tax (expense) / benefit (61.2) (57.7) (6.1)% 13.1 567.2%
Net Profit / (Loss) After Tax 142.8 134.5 6.2% (34.7) 511.5%
1: As disclosed in the Spotless Group Holdings Limited prospectus lodged with ASIC on 28 April 2014. The Statutory Forecast information has not been audited or reviewed in accordance with Australian Auditing Standards.
Comparisons to the prior year are less meaningful as the results for the year ended 30 June 2014 were significantly impacted by one-off transaction and restructuring costs (including the costs of the Initial Public Offer). Much of the following analysis has excluded such impacts. This has been clearly identified within this report. Reconciliations between the statutory actual results and pro forma results are also included.
ANNUAL REPORT 2014/201512
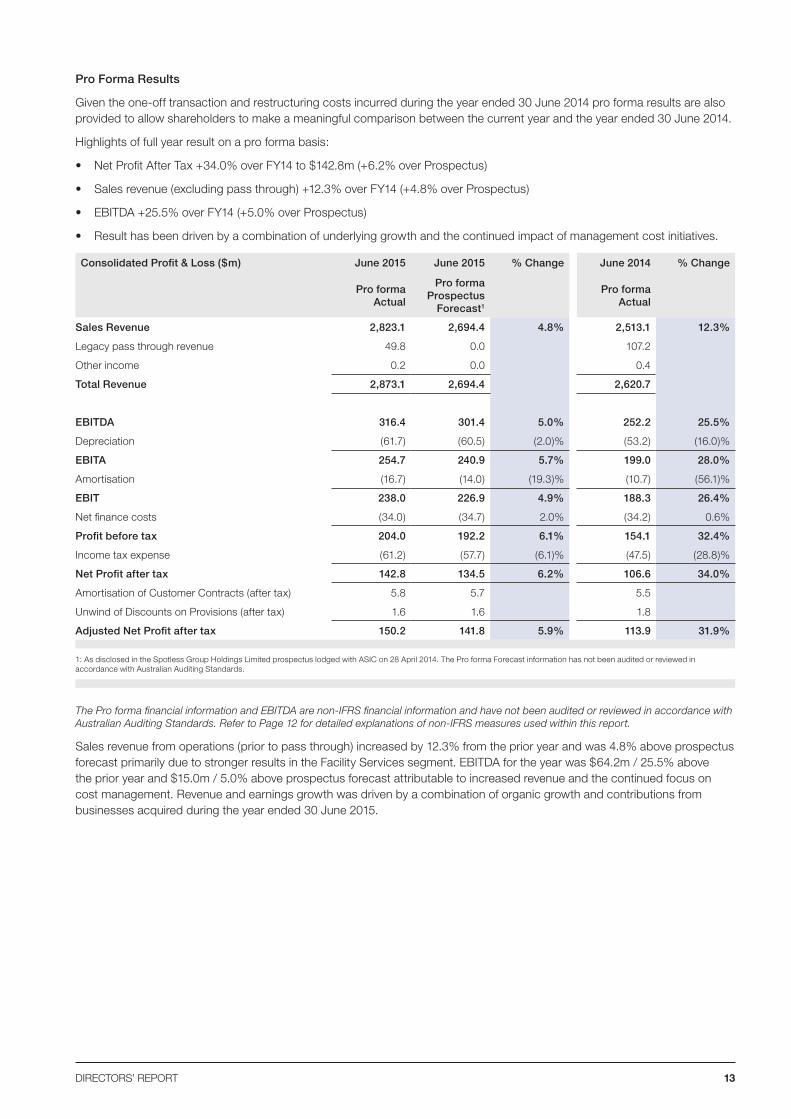
Pro Forma Results
Given the one-off transaction and restructuring costs incurred during the year ended 30 June 2014 pro forma results are also provided to allow shareholders to make a meaningful comparison between the current year and the year ended 30 June 2014.
Highlights of full year result on a pro forma basis:
• Net Profit After Tax +34.0% over FY14 to $142.8m (+6.2% over Prospectus)
• Sales revenue (excluding pass through) +12.3% over FY14 (+4.8% over Prospectus)
• EBITDA +25.5% over FY14 (+5.0% over Prospectus)
• Result has been driven by a combination of underlying growth and the continued impact of management cost initiatives.
Consolidated Profit & Loss ($m) June 2015 June 2015 % Change June 2014 % Change
Pro forma Actual
Pro forma Prospectus
Forecast1
Pro forma Actual
Sales Revenue 2,823.1 2,694.4 4.8% 2,513.1 12.3%
Legacy pass through revenue 49.8 0.0 107.2
Other income 0.2 0.0 0.4
Total Revenue 2,873.1 2,694.4 2,620.7
EBITDA 316.4 301.4 5.0% 252.2 25.5%
Depreciation (61.7) (60.5) (2.0)% (53.2) (16.0)%
EBITA 254.7 240.9 5.7% 199.0 28.0%
Amortisation (16.7) (14.0) (19.3)% (10.7) (56.1)%
EBIT 238.0 226.9 4.9% 188.3 26.4%
Net finance costs (34.0) (34.7) 2.0% (34.2) 0.6%
Profit before tax 204.0 192.2 6.1% 154.1 32.4%
Income tax expense (61.2) (57.7) (6.1)% (47.5) (28.8)%
Net Profit after tax 142.8 134.5 6.2% 106.6 34.0%
Amortisation of Customer Contracts (after tax) 5.8 5.7 5.5
Unwind of Discounts on Provisions (after tax) 1.6 1.6 1.8
Adjusted Net Profit after tax 150.2 141.8 5.9% 113.9 31.9%
1: As disclosed in the Spotless Group Holdings Limited prospectus lodged with ASIC on 28 April 2014. The Pro forma Forecast information has not been audited or reviewed in accordance with Australian Auditing Standards.
The Pro forma financial information and EBITDA are non-IFRS financial information and have not been audited or reviewed in accordance with Australian Auditing Standards. Refer to Page 12 for detailed explanations of non-IFRS measures used within this report.
Sales revenue from operations (prior to pass through) increased by 12.3% from the prior year and was 4.8% above prospectus forecast primarily due to stronger results in the Facility Services segment. EBITDA for the year was $64.2m / 25.5% above the prior year and $15.0m / 5.0% above prospectus forecast attributable to increased revenue and the continued focus on cost management. Revenue and earnings growth was driven by a combination of organic growth and contributions from businesses acquired during the year ended 30 June 2015.
DIRECTORS’ REPORT 13
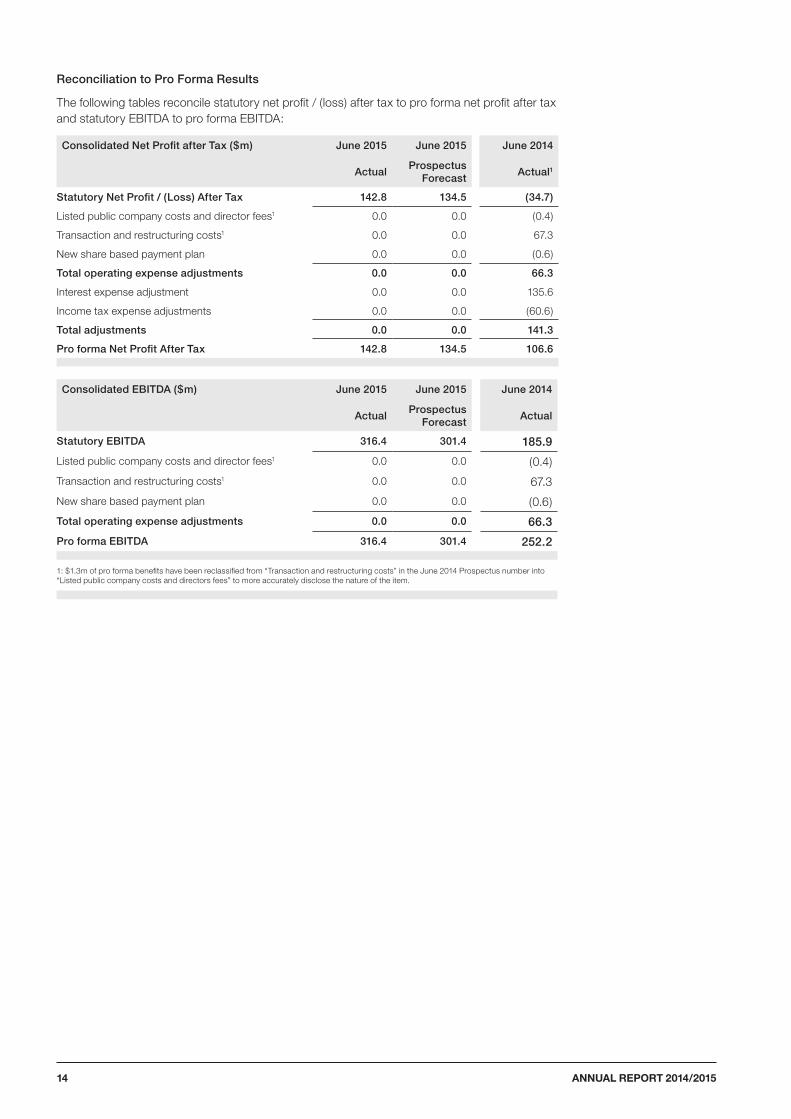
Reconciliation to Pro Forma Results
The following tables reconcile statutory net profit / (loss) after tax to pro forma net profit after tax and statutory EBITDA to pro forma EBITDA:
Consolidated Net Profit after Tax ($m) June 2015 June 2015 June 2014
ActualProspectus
ForecastActual1
Statutory Net Profit / (Loss) After Tax 142.8 134.5 (34.7)
Listed public company costs and director fees1 0.0 0.0 (0.4)
Transaction and restructuring costs1 0.0 0.0 67.3
New share based payment plan 0.0 0.0 (0.6)
Total operating expense adjustments 0.0 0.0 66.3
Interest expense adjustment 0.0 0.0 135.6
Income tax expense adjustments 0.0 0.0 (60.6)
Total adjustments 0.0 0.0 141.3
Pro forma Net Profit After Tax 142.8 134.5 106.6
Consolidated EBITDA ($m) June 2015 June 2015 June 2014
ActualProspectus
ForecastActual
Statutory EBITDA 316.4 301.4 185.9
Listed public company costs and director fees1 0.0 0.0 (0.4)
Transaction and restructuring costs1 0.0 0.0 67.3
New share based payment plan 0.0 0.0 (0.6)
Total operating expense adjustments 0.0 0.0 66.3
Pro forma EBITDA 316.4 301.4 252.2
1: $1.3m of pro forma benefits have been reclassified from “Transaction and restructuring costs” in the June 2014 Prospectus number into “Listed public company costs and directors fees” to more accurately disclose the nature of the item.
ANNUAL REPORT 2014/201514
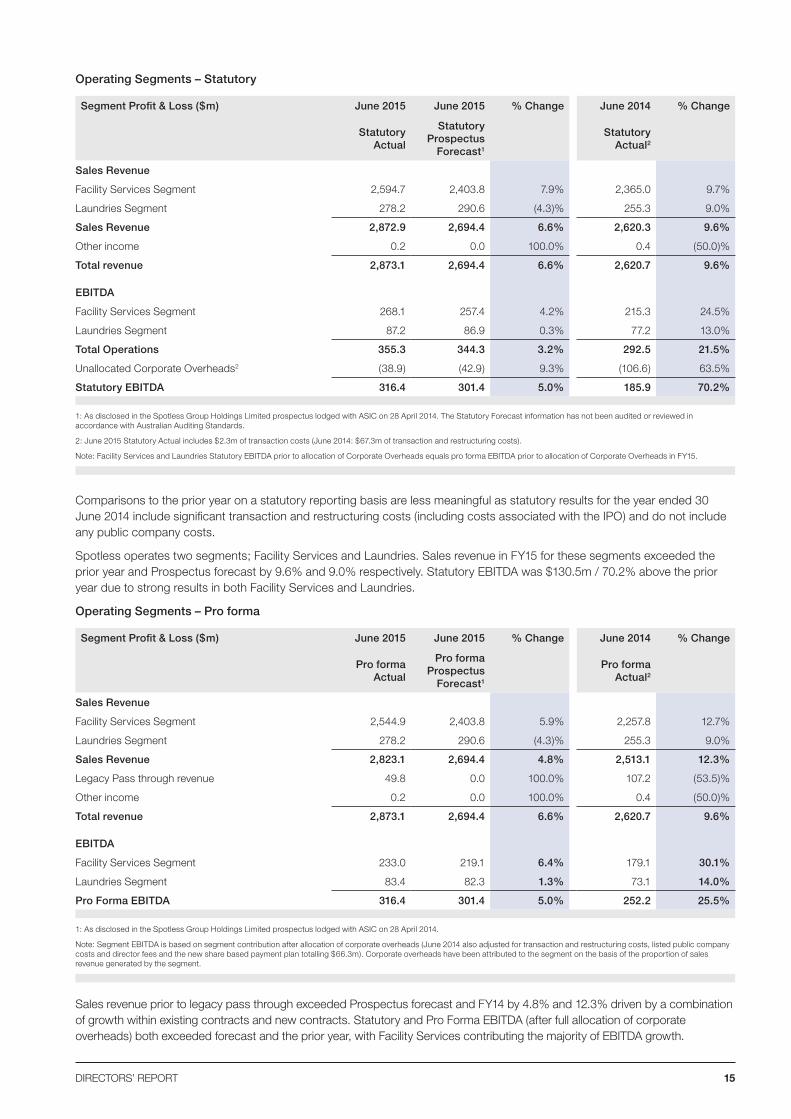
Operating Segments – Statutory
Segment Profit & Loss ($m) June 2015 June 2015 % Change June 2014 % Change
Statutory Actual
Statutory Prospectus
Forecast1
Statutory Actual2
Sales Revenue
Facility Services Segment 2,594.7 2,403.8 7.9% 2,365.0 9.7%
Laundries Segment 278.2 290.6 (4.3)% 255.3 9.0%
Sales Revenue 2,872.9 2,694.4 6.6% 2,620.3 9.6%
Other income 0.2 0.0 100.0% 0.4 (50.0)%
Total revenue 2,873.1 2,694.4 6.6% 2,620.7 9.6%
EBITDA
Facility Services Segment 268.1 257.4 4.2% 215.3 24.5%
Laundries Segment 87.2 86.9 0.3% 77.2 13.0%
Total Operations 355.3 344.3 3.2% 292.5 21.5%
Unallocated Corporate Overheads2 (38.9) (42.9) 9.3% (106.6) 63.5%
Statutory EBITDA 316.4 301.4 5.0% 185.9 70.2%
1: As disclosed in the Spotless Group Holdings Limited prospectus lodged with ASIC on 28 April 2014. The Statutory Forecast information has not been audited or reviewed in accordance with Australian Auditing Standards.
2: June 2015 Statutory Actual includes $2.3m of transaction costs (June 2014: $67.3m of transaction and restructuring costs).
Note: Facility Services and Laundries Statutory EBITDA prior to allocation of Corporate Overheads equals pro forma EBITDA prior to allocation of Corporate Overheads in FY15.
Comparisons to the prior year on a statutory reporting basis are less meaningful as statutory results for the year ended 30 June 2014 include significant transaction and restructuring costs (including costs associated with the IPO) and do not include any public company costs.
Spotless operates two segments; Facility Services and Laundries. Sales revenue in FY15 for these segments exceeded the prior year and Prospectus forecast by 9.6% and 9.0% respectively. Statutory EBITDA was $130.5m / 70.2% above the prior year due to strong results in both Facility Services and Laundries.
Operating Segments – Pro forma
Segment Profit & Loss ($m) June 2015 June 2015 % Change June 2014 % Change
Pro forma Actual
Pro forma Prospectus
Forecast1
Pro forma Actual2
Sales Revenue
Facility Services Segment 2,544.9 2,403.8 5.9% 2,257.8 12.7%
Laundries Segment 278.2 290.6 (4.3)% 255.3 9.0%
Sales Revenue 2,823.1 2,694.4 4.8% 2,513.1 12.3%
Legacy Pass through revenue 49.8 0.0 100.0% 107.2 (53.5)%
Other income 0.2 0.0 100.0% 0.4 (50.0)%
Total revenue 2,873.1 2,694.4 6.6% 2,620.7 9.6%
EBITDA
Facility Services Segment 233.0 219.1 6.4% 179.1 30.1%
Laundries Segment 83.4 82.3 1.3% 73.1 14.0%
Pro Forma EBITDA 316.4 301.4 5.0% 252.2 25.5%
1: As disclosed in the Spotless Group Holdings Limited prospectus lodged with ASIC on 28 April 2014.
Note: Segment EBITDA is based on segment contribution after allocation of corporate overheads (June 2014 also adjusted for transaction and restructuring costs, listed public company costs and director fees and the new share based payment plan totalling $66.3m). Corporate overheads have been attributed to the segment on the basis of the proportion of sales revenue generated by the segment.
Sales revenue prior to legacy pass through exceeded Prospectus forecast and FY14 by 4.8% and 12.3% driven by a combination of growth within existing contracts and new contracts. Statutory and Pro Forma EBITDA (after full allocation of corporate overheads) both exceeded forecast and the prior year, with Facility Services contributing the majority of EBITDA growth.
DIRECTORS’ REPORT 15
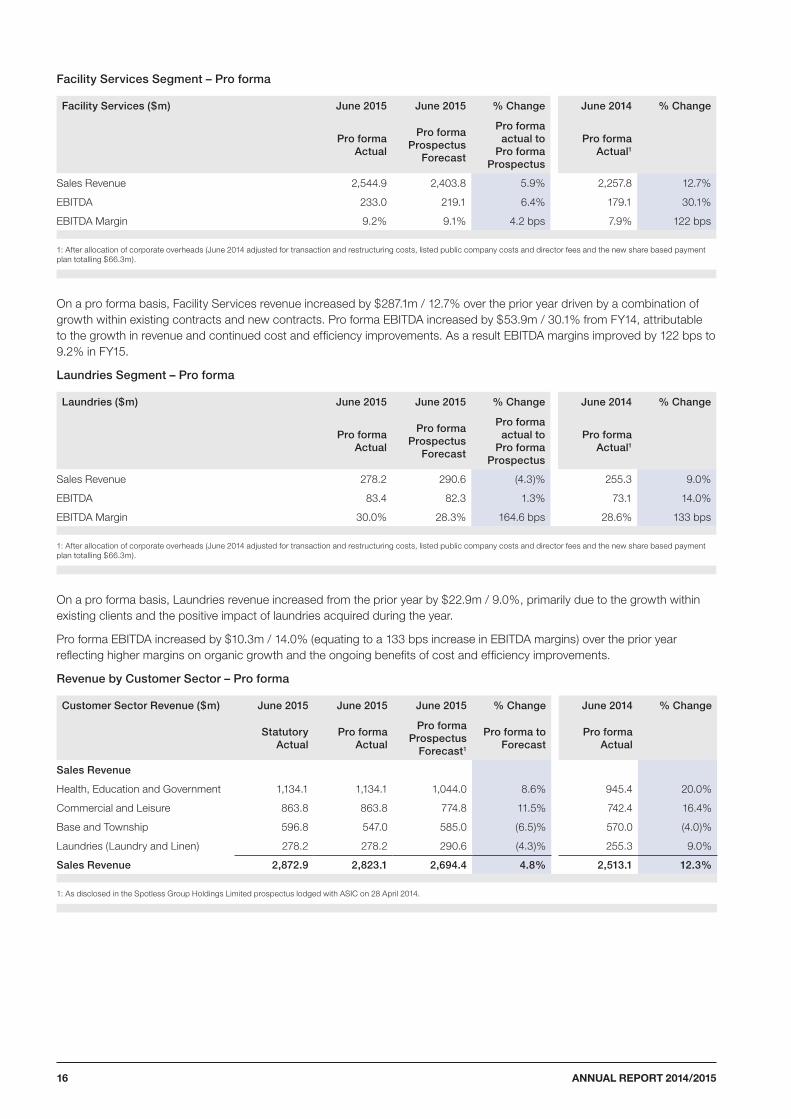
Facility Services Segment – Pro forma
Facility Services ($m) June 2015 June 2015 % Change June 2014 % Change
Pro forma Actual
Pro forma Prospectus
Forecast
Pro forma actual to
Pro forma Prospectus
Pro forma Actual1
Sales Revenue 2,544.9 2,403.8 5.9% 2,257.8 12.7%
EBITDA 233.0 219.1 6.4% 179.1 30.1%
EBITDA Margin 9.2% 9.1% 4.2 bps 7.9% 122 bps
1: After allocation of corporate overheads (June 2014 adjusted for transaction and restructuring costs, listed public company costs and director fees and the new share based payment plan totalling $66.3m).
On a pro forma basis, Facility Services revenue increased by $287.1m / 12.7% over the prior year driven by a combination of growth within existing contracts and new contracts. Pro forma EBITDA increased by $53.9m / 30.1% from FY14, attributable to the growth in revenue and continued cost and efficiency improvements. As a result EBITDA margins improved by 122 bps to 9.2% in FY15.
Laundries Segment – Pro forma
Laundries ($m) June 2015 June 2015 % Change June 2014 % Change
Pro forma Actual
Pro forma Prospectus
Forecast
Pro forma actual to
Pro forma Prospectus
Pro forma Actual1
Sales Revenue 278.2 290.6 (4.3)% 255.3 9.0%
EBITDA 83.4 82.3 1.3% 73.1 14.0%
EBITDA Margin 30.0% 28.3% 164.6 bps 28.6% 133 bps
1: After allocation of corporate overheads (June 2014 adjusted for transaction and restructuring costs, listed public company costs and director fees and the new share based payment plan totalling $66.3m).
On a pro forma basis, Laundries revenue increased from the prior year by $22.9m / 9.0%, primarily due to the growth within existing clients and the positive impact of laundries acquired during the year.
Pro forma EBITDA increased by $10.3m / 14.0% (equating to a 133 bps increase in EBITDA margins) over the prior year reflecting higher margins on organic growth and the ongoing benefits of cost and efficiency improvements.
Revenue by Customer Sector – Pro forma
Customer Sector Revenue ($m) June 2015 June 2015 June 2015 % Change June 2014 % Change
Statutory Actual
Pro forma Actual
Pro forma Prospectus
Forecast1
Pro forma to Forecast
Pro forma Actual
Sales Revenue
Health, Education and Government 1,134.1 1,134.1 1,044.0 8.6% 945.4 20.0%
Commercial and Leisure 863.8 863.8 774.8 11.5% 742.4 16.4%
Base and Township 596.8 547.0 585.0 (6.5)% 570.0 (4.0)%
Laundries (Laundry and Linen) 278.2 278.2 290.6 (4.3)% 255.3 9.0%
Sales Revenue 2,872.9 2,823.1 2,694.4 4.8% 2,513.1 12.3%
1: As disclosed in the Spotless Group Holdings Limited prospectus lodged with ASIC on 28 April 2014.
ANNUAL REPORT 2014/201516
Health, Education and Government
Pro forma revenue growth in the Health, Education and Government customer sector was primarily driven by significant increases in the Government and Health areas, partially offset by lower Education revenue. The majority of the growth in Government was attributable to additional activity within existing contracts. Growth in Health was driven by higher activity levels across a number of Health contracts, augmented by the first revenue contributions of two Health PPP contracts. The Education performance was primarily driven by the full year impact of the loss of a number of tertiary and secondary education contracts in the prior year.
Commercial and Leisure
Pro forma revenue growth in the Commercial and Leisure sector increased during the year driven by contributions from acquired businesses. This performance was partially offset by two factors; the full year impact of Business and Industry contracts exited during FY14 as well as lower revenue within existing contracts.
Base and Township
Pro forma revenue growth in the Base and Township sector was positively influenced by a number of Defence contracts, including two significant new Australian Defence base services contracts, partially offset by a broad decline across the Resources sector contract portfolio as customer activity levels and spending patterns slowed over the course of FY15.
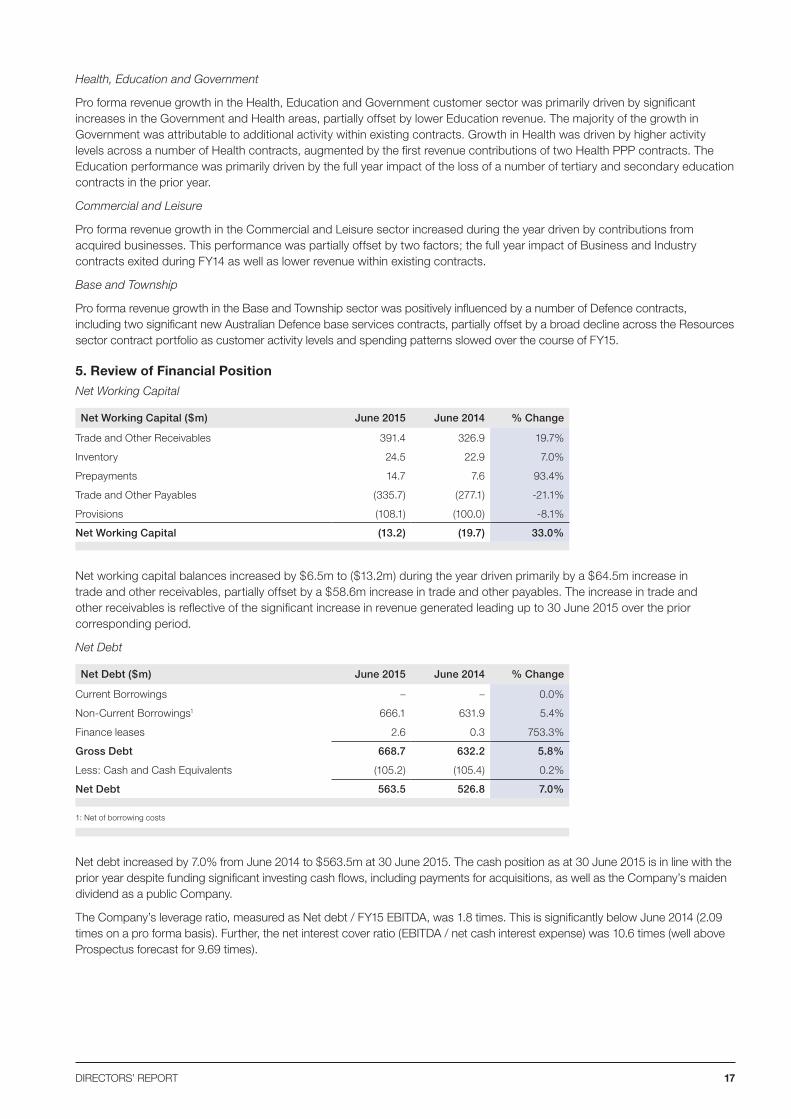
5. Review of Financial PositionNet Working Capital
Net Working Capital ($m) June 2015 June 2014 % Change
Trade and Other Receivables 391.4 326.9 19.7%
Inventory 24.5 22.9 7.0%
Prepayments 14.7 7.6 93.4%
Trade and Other Payables (335.7) (277.1) -21.1%
Provisions (108.1) (100.0) -8.1%
Net Working Capital (13.2) (19.7) 33.0%
Net working capital balances increased by $6.5m to ($13.2m) during the year driven primarily by a $64.5m increase in trade and other receivables, partially offset by a $58.6m increase in trade and other payables. The increase in trade and other receivables is reflective of the significant increase in revenue generated leading up to 30 June 2015 over the prior corresponding period.
Net Debt
Net Debt ($m) June 2015 June 2014 % Change
Current Borrowings – – 0.0%
Non-Current Borrowings1 666.1 631.9 5.4%
Finance leases 2.6 0.3 753.3%
Gross Debt 668.7 632.2 5.8%
Less: Cash and Cash Equivalents (105.2) (105.4) 0.2%
Net Debt 563.5 526.8 7.0%
1: Net of borrowing costs
Net debt increased by 7.0% from June 2014 to $563.5m at 30 June 2015. The cash position as at 30 June 2015 is in line with the prior year despite funding significant investing cash flows, including payments for acquisitions, as well as the Company’s maiden dividend as a public Company.
The Company’s leverage ratio, measured as Net debt / FY15 EBITDA, was 1.8 times. This is significantly below June 2014 (2.09 times on a pro forma basis). Further, the net interest cover ratio (EBITDA / net cash interest expense) was 10.6 times (well above Prospectus forecast for 9.69 times).
DIRECTORS’ REPORT 17
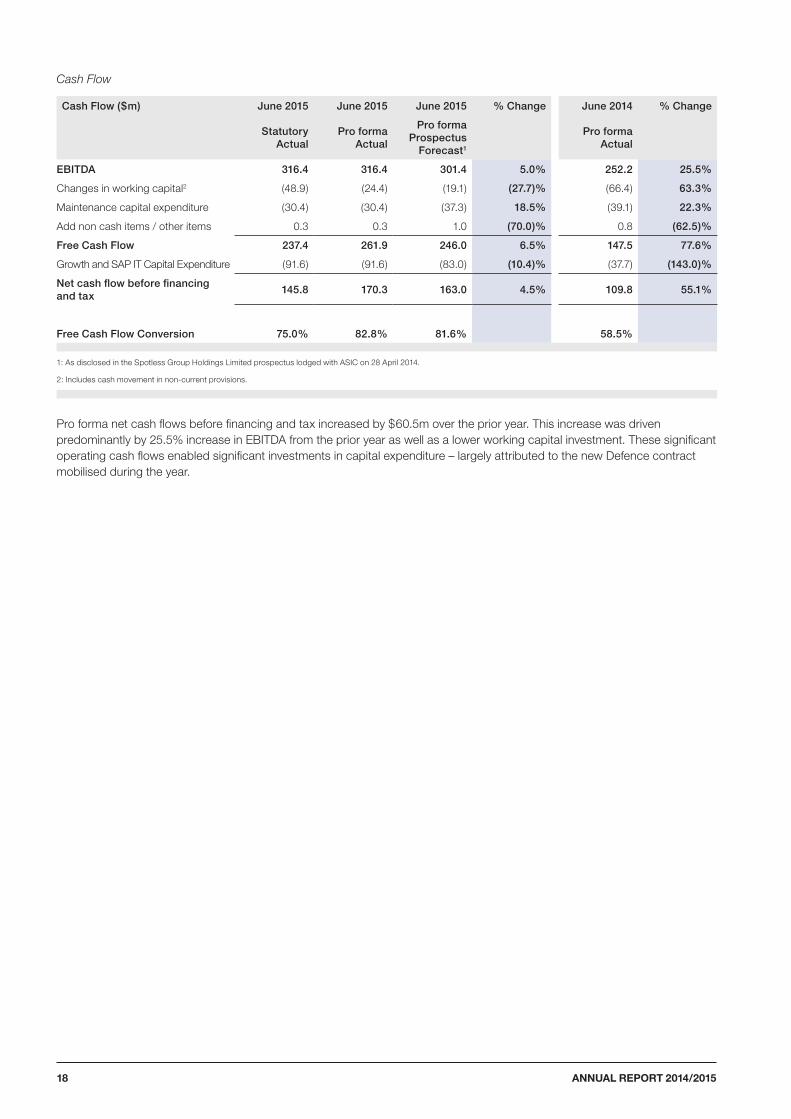
Cash Flow
Cash Flow ($m) June 2015 June 2015 June 2015 % Change June 2014 % Change
Statutory Actual
Pro forma Actual
Pro forma Prospectus
Forecast1
Pro forma Actual
EBITDA 316.4 316.4 301.4 5.0% 252.2 25.5%
Changes in working capital2 (48.9) (24.4) (19.1) (27.7)% (66.4) 63.3%
Maintenance capital expenditure (30.4) (30.4) (37.3) 18.5% (39.1) 22.3%
Add non cash items / other items 0.3 0.3 1.0 (70.0)% 0.8 (62.5)%
Free Cash Flow 237.4 261.9 246.0 6.5% 147.5 77.6%
Growth and SAP IT Capital Expenditure (91.6) (91.6) (83.0) (10.4)% (37.7) (143.0)%
Net cash flow before financing and tax
145.8 170.3 163.0 4.5% 109.8 55.1%
Free Cash Flow Conversion 75.0% 82.8% 81.6% 58.5%
1: As disclosed in the Spotless Group Holdings Limited prospectus lodged with ASIC on 28 April 2014.
2: Includes cash movement in non-current provisions.
Pro forma net cash flows before financing and tax increased by $60.5m over the prior year. This increase was driven predominantly by 25.5% increase in EBITDA from the prior year as well as a lower working capital investment. These significant operating cash flows enabled significant investments in capital expenditure – largely attributed to the new Defence contract mobilised during the year.
ANNUAL REPORT 2014/201518
6. OutlookSubject to economic conditions, we expect the FY16 results to materially exceed the FY15 results.
Defined TermsSpotless’ Financial Statements for the year ended 30 June 2015 have been prepared in accordance with Australian Accounting Standards.
Spotless uses certain measures to manage and report on its business that are not recognised under Australian Accounting Standards. These measures are referred to as non-IFRS financial measures and are intended to supplement the measures calculated in accordance with Australian Accounting Standards and not be a substitute for those measures. A reconciliation between statutory and pro forma NPAT and EBITDA has been provided on page 12.
Non-IFRS and pro forma measures have not been subject to audit.
The principal non-IFRS financial measures used in this report are described below:
Glossary
Adjusted NPAT NPAT adjusted to add back the non-cash impact of amortisation of customer contracts (after tax) and the unwind of discounts on provisions (after tax).
EBIT Earnings before interest and tax.
EBITDA Earnings before interest, tax, depreciation and amortisation.
Free Cash Flow Free cash flow is calculated as EBITDA less changes in working capital less maintenance capital expenditure.
Free Cash Flow Conversion Free cash flow conversion is Free Cash Flow divided by EBITDA expressed as a percentage.
Legacy pass through revenue Revenue received from one large government contract to procure certain goods and services on behalf of the customer. The customer reimburses Spotless for the cost of supply, with no margin.
Pro forma EBITDA Pro forma EBITDA is based on EBITDA, however pro forma adjustments have been made to remove the impact of one-off transaction and restructuring costs as well as include public company costs for the full financial year.
Pro forma NPAT Pro forma NPAT is based on NPAT, however pro forma adjustments have been made to remove the impact of one-off transaction and restructuring costs, write-off of borrowing costs and include public company costs for the full financial year. NPAT has also been adjusted to reflect the full year impact on interest expense of the post IPO debt structure.
Sales Revenue Sales revenue comprises revenue excluding legacy pass through revenue and other income.
Working Capital Working capital is defined as the total of current trade and other receivables, inventory, prepayments, trade and other payables, current provisions and other current creditors.
DIRECTORS’ REPORT 19
SIGNIFICANT CHANGES IN STATE OF AFFAIRSThere has not been any significant change in the state of the affairs of the Consolidated Entity during the financial year.
SIGNIFICANT EVENTS SUBSEQUENT TO BALANCE DATEOn 1 July 2015, the Consolidated Entity completed the acquisition of Utility Services Group Limited, Australia’s leading provider of retail meter reading and installation services in the electricity, gas and water sectors, and of end-to-end essential maintenance and inspection services in electricity distribution.
Other than the above, there has not been any matter or circumstance that has arisen since the end of the financial year that has significantly affected or may significantly affect the operations of the Consolidated Entity, the results of those operations or the state of affairs of the Consolidated Entity in future financial years.
LIKELY DEVELOPMENTSDetails of developments in the operations of the consolidated entity in future financial years and the expected results of those operations are disclosed in the Operating and Financial Review on pages 8 to 17.
DIVIDENDSOn 25 August 2015, the Directors declared an unfranked final dividend for the year ended 30 June 2015 of 5.5 cents per ordinary share (2014: nil), amounting to $60.4 million to be paid on 25 September 2015 to shareholders on the Register of Members on 4 September 2015.
On 31 March 2015, the Company paid an interim dividend for financial year 2015 of 4.5 cents per ordinary share (2014: 23.529 cents), amounting to $49.4 million.
No other dividends were paid or declared during the financial year or up until the date of this report.
SHARE OPTIONSNo share options were granted to senior executives of the Consolidated Entity during the year ended 30 June 2015 (2014: 9,358,816).
ENVIRONMENTAL REGULATIONThe Consolidated Entity has processes in place to ensure that it is aware of and, at a minimum, meets the intent of environmental legislation and regulations. It further has established programs to improve environmental performance (e.g. Laundry water reuse and heat exchange) which contributes to business effectiveness as well as providing socially responsible outcomes.
INDEMNIFICATION OF OFFICERSThe Company’s Constitution allows the Company to indemnify Directors and Officers against liability which results from their serving as a director or officer of the Company, subject to certain conditions.
During the year ended 30 June 2015, the Consolidated Entity paid a premium for insurance covering all Directors and Officers of the Consolidated Entity. The events covered by this policy are in respect of amounts that the Director or officer has become legally obliged to pay resulting from claims made during the policy period for loss caused or alleged to be caused by a wrongful act committed by a Director or officer while acting in that capacity. The contract of insurance prohibits the disclosure of the terms, the nature, the limit of liability and the amount of the premium, except where disclosure is required by law.
The Company and its Directors have entered into a deed of indemnity, insurance and access. The executive officers of the Consolidated Entity are also entitled to the benefits of the deed.
No amount has been paid pursuant to those indemnities in the year ended 30 June 2015 or since that date to the date of this report.
INDEMNIFICATION OF AUDITORSTo the extent permitted by law, the Company has agreed to indemnify its auditors, Ernst & Young Australia, as part of the terms of its audit engagement agreement against claims by third parties arising from the audit (for an unspecified amount). No payment has been made to indemnify Ernst & Young during or since the financial year.
AUDITOR’S INDEPENDENCE DECLARATIONThe auditor’s independence declaration is included on page 82.
ANNUAL REPORT 2014/201520
NON-AUDIT SERVICESErnst & Young, the external auditor to the Consolidated Entity, provided non statutory audit services to the Consolidated Entity during the year ended 30 June 2015. The directors are satisfied that the provision of non-audit services is compatible with the general standard of independence for auditors imposed by Corporations Act 2001. The nature and scope of each type of non-audit service provided means that auditor independence was not compromised.
Ernst & Young received or are due to receive $532,195 for the provision of non-audit services to the Consolidated Entity. Amounts paid or payable by the Consolidated Entity for audit and non-audit services are disclosed in Note 29 to the financial report.
PROCEEDINGS BROUGHT ON BEHALF OF SPOTLESS GROUP HOLDINGS LIMITED The Corporations Act allows members and other specified persons to bring actions on behalf of the Company. There have been no proceedings or applications brought on behalf of the Company pursuant to section 237 of the Corporations Act 2001.
ROUNDINGSpotless Group Holdings Limited is a company of the kind referred to in ASIC Class Order 98/100, dated 10 July 1998, and in accordance with that Class Order amounts in the Directors’ report and the financial report have been rounded to the nearest hundred thousand dollars, unless otherwise indicated.
DIRECTORS’ REPORT 21
REMUNERATION REPORT
OverviewThis Remuneration Report sets out the policy, framework and conditions for the remuneration of Key Management Personnel (KMP) of Spotless Group Holdings Limited (the Company) and the entities it controls (collectively referred to in this report as the Consolidated Entity) in accordance with the requirements of the Corporations Act 2001 and its regulations. This information has been audited as required by section 308(3C) of the Act.
This report is presented under the following sections:
• Our Key Management Personnel (KMP)
• Our approach to setting remuneration
• Remuneration policy framework
• Remuneration review for 2015
• Non-executive director remuneration
• Executive remuneration
• Executive contracts
• Shareholdings and other transactions
Our Key Management Personnel (KMP)Key Management Personnel are defined as those persons having authority and responsibility for planning, directing and controlling the major activities of the Consolidated Entity, directly or indirectly, including any director (whether executive or otherwise).
TABLE 1. KMP
Non-Executive Directors
Margaret Jackson AC Chairman Appointed 20 March 2014
Diane Grady AM Non-Executive Director Appointed 28 March 2014
Garry Hounsell Non-Executive Director Appointed 20 March 2014
The Hon Nick Sherry Non-Executive Director Appointed 26 March 2014
Rob Koczkar Non-Executive Director Appointed 11 November 2011
Geoff Hutchinson Non-Executive Director Appointed 12 September 2012
Executive Directors
Bruce Dixon Chief Executive Officer and Managing Director Appointed 12 September 2012
Other KMP
Vita Pepe* Chief Operating Officer Retired 17 August 2015
Dana Nelson* Chief Operating Officer Appointed 17 August 2015
Danny Agnoletto Chief Financial Officer Appointed 7 August 2013
* Following Vita Pepe’s retirement on 17 August 2015, Dana Nelson was appointed Chief Operating Officer. Dana Nelson, who has been with the Company since 2010, was previously Group General Manager Commercial, Leisure and Education. Prior to joining the Company, she was Managing Director of Delaware North (Australia/NZ).
As announced on 23 April 2015, Bruce Dixon is stepping down from full time executive duties. On 18 August 2015, the Company announced the appointment of Mr Martin Sheppard to the role of Chief Executive Officer and Managing Director of the Consolidated Entity. Mr Sheppard will join the Company as soon as transition arrangements have been finalised, commencing in the role of CEO no later than 1 December 2015. Mr Sheppard is currently a Senior Partner at KPMG, leading client service teams providing professional services to some of Australia’s largest companies. He is a member of the firm’s National Executive Committee with responsibility for Marketing, Brand, Innovation, Government Relations, Media, Communications and Corporate Citizenship. Mr Sheppard has a Bachelor of Economics degree from Australian National University and is a Member of the Institute of Chartered Accountants in Australia.
There were no other changes to KMP after the reporting period and before the date the financial report was authorised for issue.
Our Approach to Setting Remuneration
People and Remuneration Committee
The Board has established the People and Remuneration Committee to:
• review and make recommendations to the Board with respect to the Consolidated Entity’s human resources policies and obligations;
• make recommendations to the Board on remuneration packages and policies related to the directors and senior management; and
• ensure that the remuneration policies and practices are consistent with the Consolidated Entity’s strategic goals.
ANNUAL REPORT 2014/201522
The committee comprises non-executive directors Diane Grady AM (Chairman), Margaret Jackson AC, The Hon. Nick Sherry and Rob Koczkar.
Further information on the role of the Committee and meetings held throughout the year are set out in the Corporate Governance Statement and the Directors’ Report.
External advisors and remuneration advice
In performing their roles, the Board and the People and Remuneration Committee directly commission and receive information, advice and recommendations from independent external advisors. This assists the directors to make informed decisions when considering the Consolidated Entity’s remuneration policies and practices.
Mercer has been engaged as a remuneration consultant and has provided remuneration recommendations which were reviewed by the People and Remuneration Committee and the Board. This included the provision of a benchmarking review and recommendations for the purpose of the KMP remuneration review referred to below
The Board is satisfied that the remuneration recommendations received from Mercer during the year were free of undue influence. All communications between the Consolidated Entity and Mercer in relation to the remuneration recommendations were subject to strict guidelines, including that information provided to Mercer could not be selective or unbalanced, or imply that future work is contingent on Mercer giving particular recommendations.
In addition, Mercer provided a declaration to the Board that the remuneration recommendations it made were free from any undue influence from the Consolidated Entity’s KMP. For the year ended 30 June 2015, the Consolidated Entity paid fees totalling $33,000 to Mercer.
Remuneration policy framework
Non-executive directors
Fees and payments to non-executive directors reflect the demands and responsibilities of those directors. The amount of aggregate remuneration and the fee structure is reviewed annually against fees paid to non-executive directors of comparable companies. The Board considers advice from external consultants when undertaking the annual review process.
Executive KMP
The remuneration structure for executive KMP seeks to ensure that executive rewards are structured to attract and retain talent and deliver a balanced outcome for shareholders.
The remuneration structure for executive KMP provides a mix of fixed and variable pay, being a blend of short-term incentives (STIs) and long-term incentives (LTIs). This structure is designed to:
• encourage a performance-based workplace culture;
• reward capability and performance through recognition of contribution to meeting business objectives;
• have profit as a core component of reward design;
• focus on sustained growth in shareholder returns as well as focusing the executives on key non-financial drivers of value; and
• attract and retain high-calibre executives.
Remuneration Review for 2015During the year ended 30 June 2015, the People and Remuneration Committee undertook a review of the structure and quantum of non-executive director fees and remuneration of the executive KMP to ensure that the remuneration arrangements which had been established at the listing of Company in May 2014 continue to appropriately align remuneration to the creation of shareholder value, the implementation of business strategy and group performance and following consideration of industry and market practices.
In conducting this review the Committee engaged Mercer to provide advice and recommendations, including the provision of an industry benchmarking analysis of both non-executive director fees and executive KMP remuneration against relevant peer companies.
As a result of this review it was determined by the Board that:
• the Consolidated Entity’s existing remuneration framework, using a combination of fixed remuneration, STIs and LTIs, would be maintained;
• fixed remuneration for executive KMP and other senior executives should align to relevant peer benchmarks, with the ability for executive KMP and executives to achieve above peer average in total remuneration by achieving stretch performance on maximum STI and LTI vesting, and
• the framework and quantum of non-executive director fees should be revised to reflect relevant peer benchmarks.
DIRECTORS’ REPORT 23
Non-Executive Director RemunerationOn appointment to the Board, all non-executive directors sign a letter of appointment. The letter summarises the Board policies and terms relevant to the office of director (including remuneration).
In addition, the total amount of fees paid to all directors for their services (excluding, for these purposes, the salary of any executive director) must not exceed in aggregate in any financial year the amount fixed by the Company at the Annual General Meeting. This amount has been fixed at $2 million per annum. The aggregate sum includes any special and additional remuneration for special exertions and additional services performed by a director as determined appropriate by the Board. The Board will not seek any increase to this aggregate sum at the 2015 Annual General Meeting.
The remuneration of non-executive directors consists of directors’ fees and committee fees. The payment of additional fees for serving on a committee recognises the additional time commitment required by non-executive directors who serve on sub-committees. The Chairman of the Board attends all committee meetings but does not receive any fees in addition to directors’ fees.
As part of the 2015 remuneration review referred to above, the Board considered the framework and quantum of non-executive director fees in the context of benchmarking advice received from Mercer. As a result of the review it was determined that the remuneration arrangement for non-executive directors would be amended such that:
• a separate fee would be payable to Committee members (as opposed to just the Committee Chairs);
• the fees of the Chairman of the Board would be revised to reflect the demands of the role as well as relevant peer benchmarks;
• the fees of the Chair of the People and Remuneration Committee would be amended so as to align with the fees of the Chair of the Audit, Business Risk and Compliance Committee; and
• the base fees for non-executive directors would be increased by 2.5%.
The following annual directors’ fees currently apply:
TABLE 2. ANNUAL DIRECTORS’ FEES
Directors’ Fees
FY15 $ per annum
FY16 $ per annum
Chairman 320,000 492,000
Non-executive director 160,000 164,000
Additional Committee Fees
Chairman of the Audit, Business Risk and Compliance Committee
40,000 40,000
Chairman of the People and Remuneration Committee
35,000 40,000
Member of Committee Nil 10,000
All directors’ fees include superannuation. Non-executive directors do not receive retirement benefits, nor do they participate in any incentive programs.
ANNUAL REPORT 2014/201524
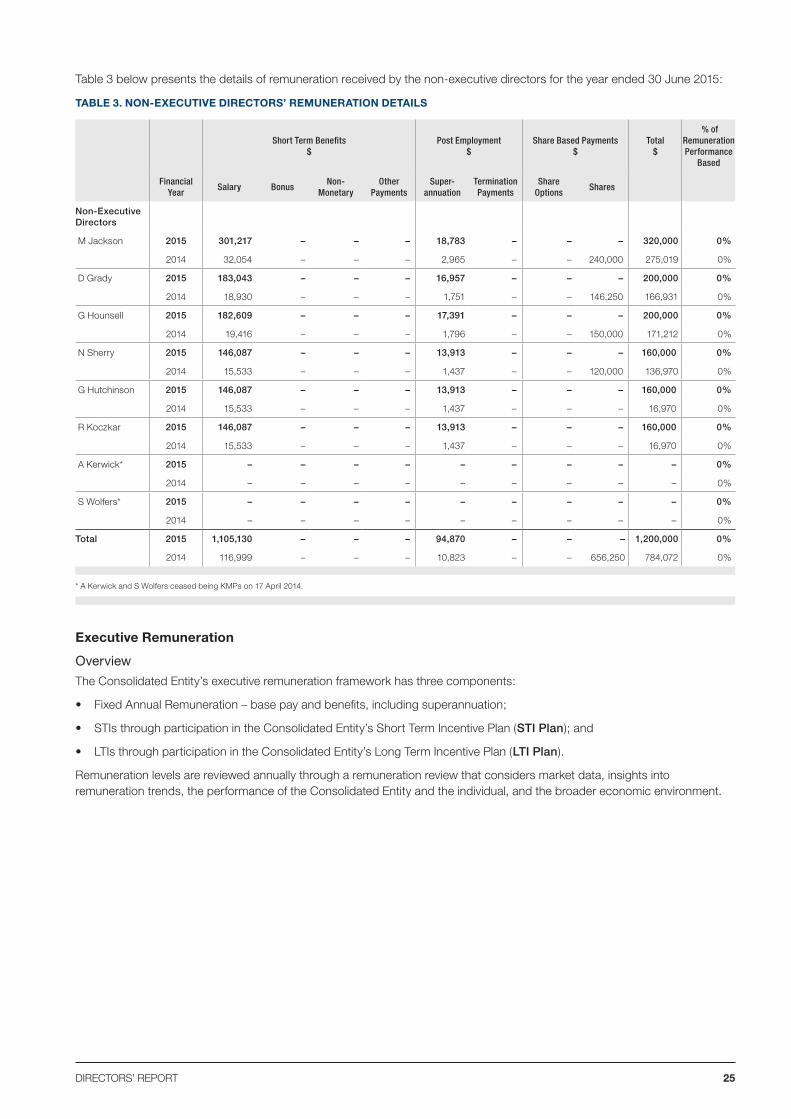
Table 3 below presents the details of remuneration received by the non-executive directors for the year ended 30 June 2015:
TABLE 3. NON-EXECUTIVE DIRECTORS’ REMUNERATION DETAILS
Short Term Benefits $
Post Employment $
Share Based Payments $
Total $
% of Remuneration Performance
Based
Financial Year
Salary Bonus Non-
MonetaryOther
PaymentsSuper-
annuation Termination Payments
Share Options
Shares
Non-Executive Directors
M Jackson 2015 301,217 – – – 18,783 – – – 320,000 0%
2014 32,054 – – – 2,965 – – 240,000 275,019 0%
D Grady 2015 183,043 – – – 16,957 – – – 200,000 0%
2014 18,930 – – – 1,751 – – 146,250 166,931 0%
G Hounsell 2015 182,609 – – – 17,391 – – – 200,000 0%
2014 19,416 – – – 1,796 – – 150,000 171,212 0%
N Sherry 2015 146,087 – – – 13,913 – – – 160,000 0%
2014 15,533 – – – 1,437 – – 120,000 136,970 0%
G Hutchinson 2015 146,087 – – – 13,913 – – – 160,000 0%
2014 15,533 – – – 1,437 – – – 16,970 0%
R Koczkar 2015 146,087 – – – 13,913 – – – 160,000 0%
2014 15,533 – – – 1,437 – – – 16,970 0%
A Kerwick* 2015 – – – – – – – – – 0%
2014 – – – – – – – – – 0%
S Wolfers* 2015 – – – – – – – – – 0%
2014 – – – – – – – – – 0%
Total 2015 1,105,130 – – – 94,870 – – – 1,200,000 0%
2014 116,999 – – – 10,823 – – 656,250 784,072 0%
* A Kerwick and S Wolfers ceased being KMPs on 17 April 2014.
Executive Remuneration
Overview
The Consolidated Entity’s executive remuneration framework has three components:
• Fixed Annual Remuneration – base pay and benefits, including superannuation;
• STIs through participation in the Consolidated Entity’s Short Term Incentive Plan (STI Plan); and
• LTIs through participation in the Consolidated Entity’s Long Term Incentive Plan (LTI Plan).
Remuneration levels are reviewed annually through a remuneration review that considers market data, insights into remuneration trends, the performance of the Consolidated Entity and the individual, and the broader economic environment.
DIRECTORS’ REPORT 25
Target remuneration mix
Table 4 below summarises the executive KMP’s remuneration mix, which reflects the Company’s remuneration position following consideration of relevant peer and market practices and advice from the Board’s remuneration consultant. The Board considers that this mix represents an appropriate mix of fixed and variable components so as to facilitate the achievement of the Company’s remuneration policy objectives for executive KMP.
TABLE 4. EXECUTIVE KMP REMUNERATION MIX – FY16
Position Fixed At Risk At Risk
Fixed Annual Remuneration
STI LTI
CEO 34.5% 31% (90% of FAR)
34.5% (100% of FAR)
CFO/COO 44.4% 33.4% (75% of FAR)
22.2% (50% of FAR)
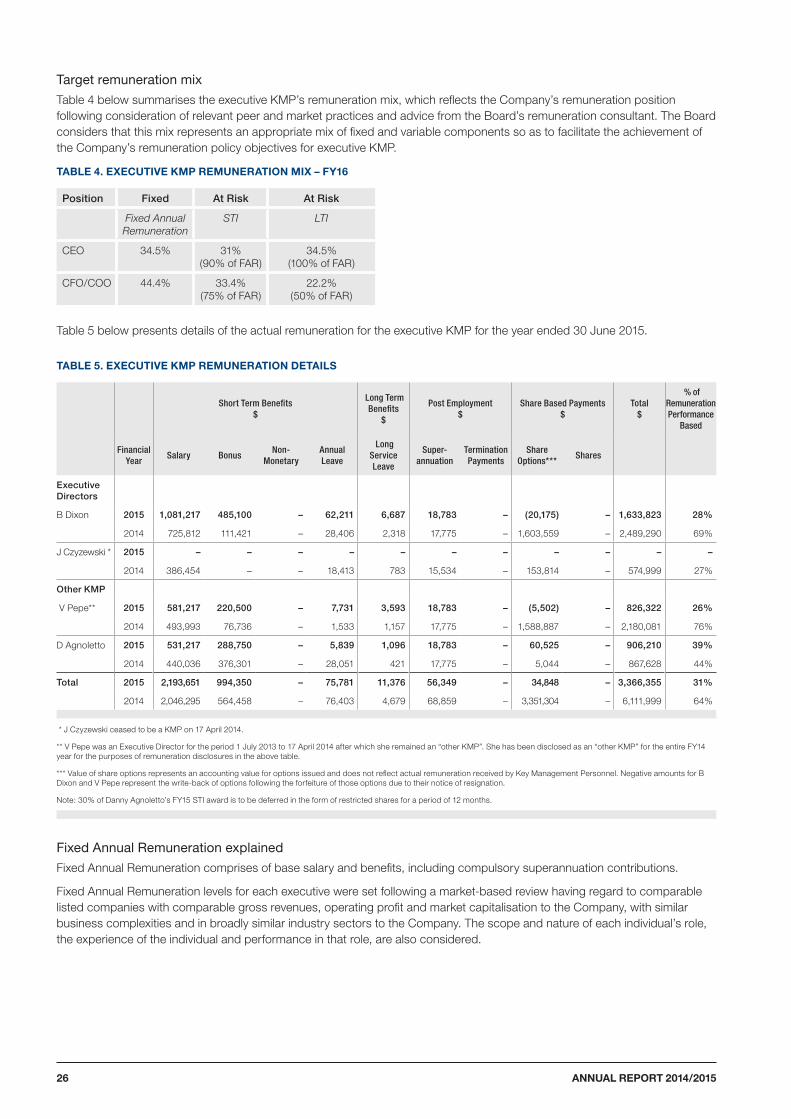
Table 5 below presents details of the actual remuneration for the executive KMP for the year ended 30 June 2015.
TABLE 5. EXECUTIVE KMP REMUNERATION DETAILS
Short Term Benefits $
Long Term Benefits
$
Post Employment $
Share Based Payments $
Total $
% of Remuneration Performance
Based
Financial Year
Salary Bonus Non-
MonetaryAnnual Leave
Long Service Leave
Super-annuation
Termination Payments
Share Options***
Shares
Executive Directors
B Dixon 2015 1,081,217 485,100 – 62,211 6,687 18,783 – (20,175) – 1,633,823 28%
2014 725,812 111,421 – 28,406 2,318 17,775 – 1,603,559 – 2,489,290 69%
J Czyzewski * 2015 – – – – – – – – – – –
2014 386,454 – – 18,413 783 15,534 – 153,814 – 574,999 27%
Other KMP
V Pepe** 2015 581,217 220,500 – 7,731 3,593 18,783 – (5,502) – 826,322 26%
2014 493,993 76,736 – 1,533 1,157 17,775 – 1,588,887 – 2,180,081 76%
D Agnoletto 2015 531,217 288,750 – 5,839 1,096 18,783 – 60,525 – 906,210 39%
2014 440,036 376,301 – 28,051 421 17,775 – 5,044 – 867,628 44%
Total 2015 2,193,651 994,350 – 75,781 11,376 56,349 – 34,848 – 3,366,355 31%
2014 2,046,295 564,458 – 76,403 4,679 68,859 – 3,351,304 – 6,111,999 64%
* J Czyzewski ceased to be a KMP on 17 April 2014.
** V Pepe was an Executive Director for the period 1 July 2013 to 17 April 2014 after which she remained an “other KMP”. She has been disclosed as an “other KMP” for the entire FY14 year for the purposes of remuneration disclosures in the above table.
*** Value of share options represents an accounting value for options issued and does not reflect actual remuneration received by Key Management Personnel. Negative amounts for B Dixon and V Pepe represent the write-back of options following the forfeiture of those options due to their notice of resignation.
Note: 30% of Danny Agnoletto’s FY15 STI award is to be deferred in the form of restricted shares for a period of 12 months.
Fixed Annual Remuneration explained
Fixed Annual Remuneration comprises of base salary and benefits, including compulsory superannuation contributions.
Fixed Annual Remuneration levels for each executive were set following a market-based review having regard to comparable listed companies with comparable gross revenues, operating profit and market capitalisation to the Company, with similar business complexities and in broadly similar industry sectors to the Company. The scope and nature of each individual’s role, the experience of the individual and performance in that role, are also considered.
ANNUAL REPORT 2014/201526
STI Plan explained
The CEO, other executive KMP and other selected employees of the Consolidated Entity are eligible to participate in the STI Plan.
Under the STI Plan, participants have an opportunity to receive an incentive payment calculated as a percentage of their Fixed Annual Remuneration each year, conditional upon achievement of company and individual, financial and non-financial key performance indicators (KPIs).
Performance measures for executive KMP are determined relative to operational and financial targets, set by the Board, to be achieved annually. These short-term targets are chosen to encourage outcomes and behaviours that support the safe operation and delivery of the base business while pursuing long-term growth in shareholder value, and are reviewed annually by the Board to ensure that they align with business strategy for the year. The performance measures against which each participant’s STI is assessed and their relative weightings are tailored to a participant’s role and are set by the Board each year.
Under the STI Plan at least 70% and up to 100% of the annual award outcome is dependent on financial and quantitative KPIs (for instance a weighting across the Consolidated Entity’s revenue, EBITDA and NPAT performance). Up to 30% of the annual award is assessed having regard to non-financial KPIs including both qualitative and quantitative measures such as specific business integration objectives, strategic and growth initiatives, and people and safety measures.
Actual STI payments awarded to each executive will depend on the extent to which specific targets set at the beginning of the financial year are met (subject to the exercise of Board discretion).
Under the STI Plan, it is intended that 30% of any incentive awarded to the CEO, CFO and COO and their respective direct reports are deferred for a period of 12 months in the form of restricted shares, subject to obtaining shareholder approval (if required). Vesting of the deferred component will be conditional on the participant remaining employed by the Consolidated Entity at the time of vesting, except in certain circumstances where employment is terminated without cause, in which case the deferred component will vest immediately. The remaining incentive award is paid in cash.
STI Plan for FY15
The STI outcomes for the KMP for the year ended 30 June 2015 are summarised as follows.
The STI assessment criteria was based on financial performance measures (Consolidated Entity’s revenue, EBITDA and NPAT performance) as well as specific non-financial performance measures (including safety).
In determining KPI outcomes the Board retained discretion to take account of relevant changes in circumstances over the measurement period.
For the financial year ended 30 June 2015, STI awards for the executive KMP were as follows:
• Bruce Dixon was awarded 49% of his maximum STI entitlement. This was calculated after deducting the deferred component (30%) of Mr Dixon’s prima facie entitlement, such deferred component being forfeited given Mr Dixon’s retirement from the Company which will take effect during the financial year ended 30 June 2016.
• Vita Pepe was awarded 49% of her maximum STI entitlement. This was calculated after deducting the deferred component (30%) of Ms Pepe’s prima facie entitlement, such deferred component being forfeited given Ms Pepe’s retirement from the Company which will take effect during the financial year ended 30 June 2016.
• Danny Agnoletto was awarded 70% of his maximum STI entitlement, 30% of such award being deferred for 12 months in the form of restricted shares on the terms summarised above.
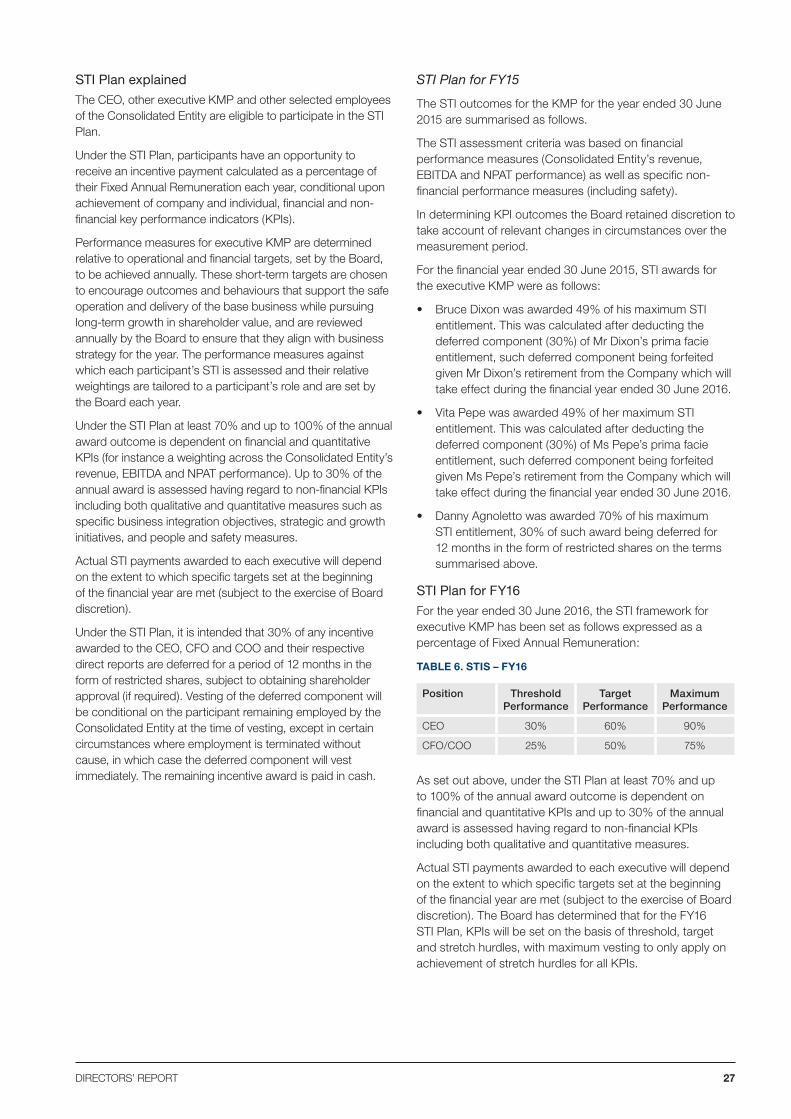
STI Plan for FY16
For the year ended 30 June 2016, the STI framework for executive KMP has been set as follows expressed as a percentage of Fixed Annual Remuneration:
TABLE 6. STIS – FY16
Position Threshold Performance
Target Performance
Maximum Performance
CEO 30% 60% 90%
CFO/COO 25% 50% 75%
As set out above, under the STI Plan at least 70% and up to 100% of the annual award outcome is dependent on financial and quantitative KPIs and up to 30% of the annual award is assessed having regard to non-financial KPIs including both qualitative and quantitative measures.
Actual STI payments awarded to each executive will depend on the extent to which specific targets set at the beginning of the financial year are met (subject to the exercise of Board discretion). The Board has determined that for the FY16 STI Plan, KPIs will be set on the basis of threshold, target and stretch hurdles, with maximum vesting to only apply on achievement of stretch hurdles for all KPIs.
DIRECTORS’ REPORT 27
STI Accounting treatment
The financial impact of the STIs is expensed in the relevant financial year and is reflected in the remuneration disclosures for executive KMP.
LTI Plan explained
The executive KMP and other selected employees of the Consolidated Entity are eligible to participate in the LTI Plan.
The purpose of the Consolidated Entity’s longer-term incentives is to focus executives’ efforts on the achievement of sustainable long-term growth and success of the Consolidated Entity and to align executive rewards with sustained shareholder returns through financial metrics based on absolute earnings per share (EPS) performance and relative Total Shareholder Return (TSR) performance.
The performance hurdles and conditions under the Consolidated Entity’s long-term incentive awards are designed to create and deliver sustained shareholder returns and to reward executives when shareholders benefit.
The Company’s TSR is assessed against the relative performance over the relevant vesting period as measured against a comparator group comprising the S&P/ASX 200, excluding the Financials and Resources sectors. This comparator group was deemed most appropriate by the Board so as to best ensure that the Company’s performance is measured against a representative cross section of comparable Australian industrial companies and that companies in sectors with greater volatility and in which the Company does not operate are excluded.
The EPS performance hurdle is determined by reference to the Company’s compound annual EPS growth during the relevant vesting period (adjusted to take into account one-off items, if necessary). The applicable TSR and EPS hurdles applicable to each grant of LTI awards are set by the Board each year following consideration of industry and market practices and advice from the Board’s remuneration consultant.
The Board retains discretion to adjust the EPS performance hurdles to reflect appropriate changes in circumstances (e.g. acquisitions or divestments).
LTIs in FY15
As part of the Consolidated Entity’s LTI Plan for the year ended 30 June 2014, the Company issued unlisted options over ordinary shares in the Company at an exercise price equal to the issue price of the Company’s shares at listing with the vesting of the options being conditional on achievement of the EPS and TSR performance hurdles and satisfaction of service conditions over a designated period.
No further options were issued during the year ended 30 June 2015.
ANNUAL REPORT 2014/201528
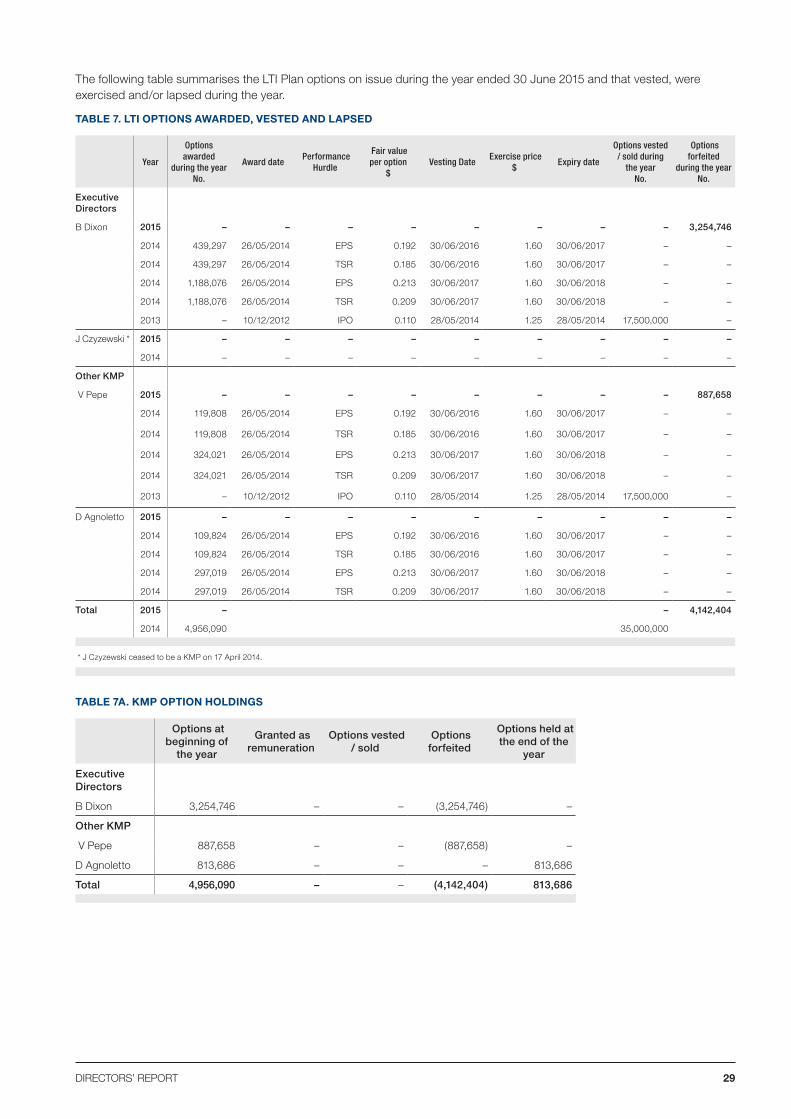
The following table summarises the LTI Plan options on issue during the year ended 30 June 2015 and that vested, were exercised and/or lapsed during the year.
TABLE 7. LTI OPTIONS AWARDED, VESTED AND LAPSED
Year
Options awarded
during the year No.
Award date Performance
Hurdle
Fair value per option
$ Vesting Date
Exercise price$
Expiry date
Options vested / sold during
the year No.
Options forfeited
during the year No.
Executive Directors
B Dixon 2015 – – – – – – – – 3,254,746
2014 439,297 26/05/2014 EPS 0.192 30/06/2016 1.60 30/06/2017 – –
2014 439,297 26/05/2014 TSR 0.185 30/06/2016 1.60 30/06/2017 – –
2014 1,188,076 26/05/2014 EPS 0.213 30/06/2017 1.60 30/06/2018 – –
2014 1,188,076 26/05/2014 TSR 0.209 30/06/2017 1.60 30/06/2018 – –
2013 – 10/12/2012 IPO 0.110 28/05/2014 1.25 28/05/2014 17,500,000 –
J Czyzewski * 2015 – – – – – – – – –
2014 – – – – – – – – –
Other KMP
V Pepe 2015 – – – – – – – – 887,658
2014 119,808 26/05/2014 EPS 0.192 30/06/2016 1.60 30/06/2017 – –
2014 119,808 26/05/2014 TSR 0.185 30/06/2016 1.60 30/06/2017 – –
2014 324,021 26/05/2014 EPS 0.213 30/06/2017 1.60 30/06/2018 – –
2014 324,021 26/05/2014 TSR 0.209 30/06/2017 1.60 30/06/2018 – –
2013 – 10/12/2012 IPO 0.110 28/05/2014 1.25 28/05/2014 17,500,000 –
D Agnoletto 2015 – – – – – – – – –
2014 109,824 26/05/2014 EPS 0.192 30/06/2016 1.60 30/06/2017 – –
2014 109,824 26/05/2014 TSR 0.185 30/06/2016 1.60 30/06/2017 – –
2014 297,019 26/05/2014 EPS 0.213 30/06/2017 1.60 30/06/2018 – –
2014 297,019 26/05/2014 TSR 0.209 30/06/2017 1.60 30/06/2018 – –
Total 2015 – – 4,142,404
2014 4,956,090 35,000,000
* J Czyzewski ceased to be a KMP on 17 April 2014.
TABLE 7A. KMP OPTION HOLDINGS
Options at beginning of
the year
Granted as remuneration
Options vested / sold
Options forfeited
Options held at the end of the
year
Executive Directors
B Dixon 3,254,746 – – (3,254,746) –
Other KMP
V Pepe 887,658 – – (887,658) –
D Agnoletto 813,686 – – – 813,686
Total 4,956,090 – – (4,142,404) 813,686
DIRECTORS’ REPORT 29
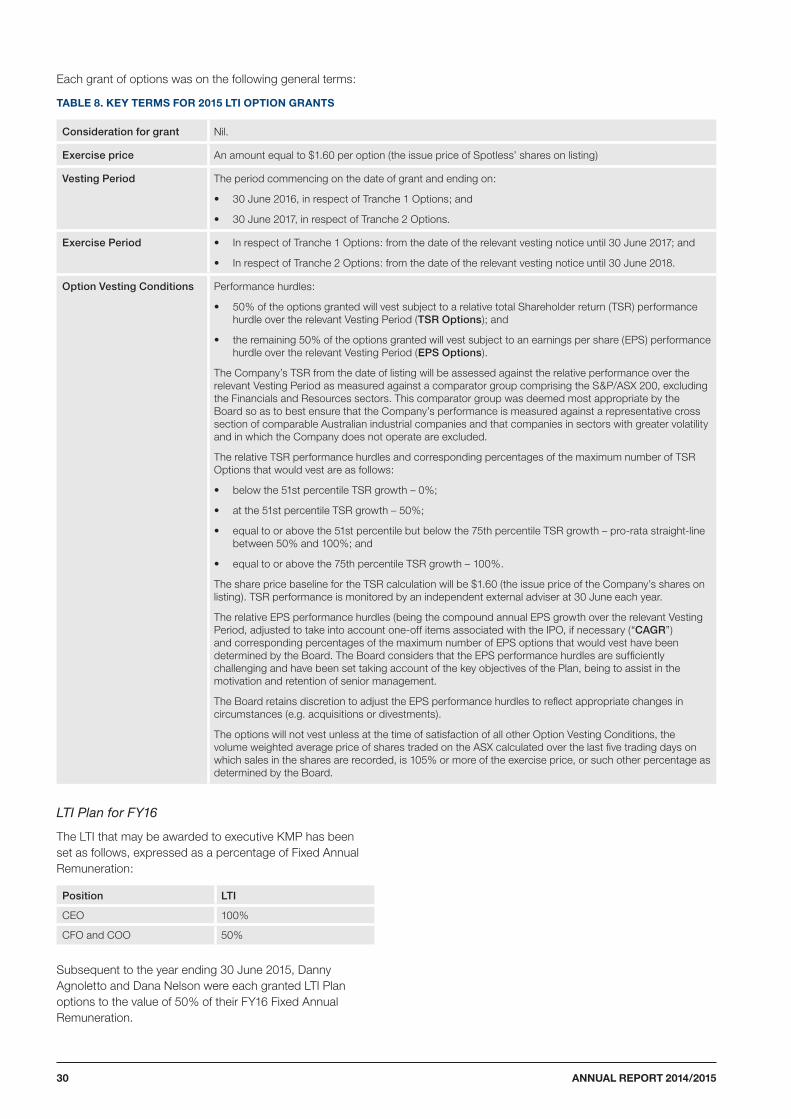
Each grant of options was on the following general terms:
TABLE 8. KEY TERMS FOR 2015 LTI OPTION GRANTS
Consideration for grant Nil.
Exercise price An amount equal to $1.60 per option (the issue price of Spotless’ shares on listing)
Vesting Period The period commencing on the date of grant and ending on:
• 30 June 2016, in respect of Tranche 1 Options; and
• 30 June 2017, in respect of Tranche 2 Options.
Exercise Period • In respect of Tranche 1 Options: from the date of the relevant vesting notice until 30 June 2017; and
• In respect of Tranche 2 Options: from the date of the relevant vesting notice until 30 June 2018.
Option Vesting Conditions Performance hurdles:
• 50% of the options granted will vest subject to a relative total Shareholder return (TSR) performance hurdle over the relevant Vesting Period (TSR Options); and
• the remaining 50% of the options granted will vest subject to an earnings per share (EPS) performance hurdle over the relevant Vesting Period (EPS Options).
The Company’s TSR from the date of listing will be assessed against the relative performance over the relevant Vesting Period as measured against a comparator group comprising the S&P/ASX 200, excluding the Financials and Resources sectors. This comparator group was deemed most appropriate by the Board so as to best ensure that the Company’s performance is measured against a representative cross section of comparable Australian industrial companies and that companies in sectors with greater volatility and in which the Company does not operate are excluded.
The relative TSR performance hurdles and corresponding percentages of the maximum number of TSR Options that would vest are as follows:
• below the 51st percentile TSR growth – 0%;
• at the 51st percentile TSR growth – 50%;
• equal to or above the 51st percentile but below the 75th percentile TSR growth – pro-rata straight-line between 50% and 100%; and
• equal to or above the 75th percentile TSR growth – 100%.
The share price baseline for the TSR calculation will be $1.60 (the issue price of the Company’s shares on listing). TSR performance is monitored by an independent external adviser at 30 June each year.
The relative EPS performance hurdles (being the compound annual EPS growth over the relevant Vesting Period, adjusted to take into account one-off items associated with the IPO, if necessary (“CAGR”) and corresponding percentages of the maximum number of EPS options that would vest have been determined by the Board. The Board considers that the EPS performance hurdles are sufficiently challenging and have been set taking account of the key objectives of the Plan, being to assist in the motivation and retention of senior management.
The Board retains discretion to adjust the EPS performance hurdles to reflect appropriate changes in circumstances (e.g. acquisitions or divestments).
The options will not vest unless at the time of satisfaction of all other Option Vesting Conditions, the volume weighted average price of shares traded on the ASX calculated over the last five trading days on which sales in the shares are recorded, is 105% or more of the exercise price, or such other percentage as determined by the Board.
LTI Plan for FY16
The LTI that may be awarded to executive KMP has been set as follows, expressed as a percentage of Fixed Annual Remuneration:
Position LTI
CEO 100%
CFO and COO 50%
Subsequent to the year ending 30 June 2015, Danny Agnoletto and Dana Nelson were each granted LTI Plan options to the value of 50% of their FY16 Fixed Annual Remuneration.
ANNUAL REPORT 2014/201530

The key terms for these options are as follows.
TABLE 9. KEY TERMS FOR FY16 LTI OPTION GRANTS
Consideration for grant Nil.
Exercise price An amount equal to $2.13 per option (being the VWAP of the Company’s shares measured over the last 5 trading days up to and including 30 June 2015).
Vesting Period The period commencing on the date of grant and ending on 30 June 2018.
Exercise Period From the date of the relevant vesting notice until 30 June 2019.
Option Vesting Conditions As set out in Table 8 above except that the 105% share performance gateway will not apply.
LTI accounting treatment
Options issued under the LTI are expensed on a straight line basis over the vesting period, commencing from the grant date. Under Accounting Standards, the Company is required to recognise an expense irrespective of whether the options ultimately vest to the relevant executive. A reversal of the expense is only recognised in the event the options lapse due to cessation of employment within the three year period or upon the non-achievement of EPS hurdles. The remuneration details in table 5 reflect the accounting expense recognised in the relevant financial year, not the total fair value of options allocated to the executive during the year, which is disclosed in table 7.
Executive Contracts
The remuneration and terms of the executive KMP are formalised in their employment agreements. Each of these employment agreements, which have no fixed terms provide for the payment of fixed and performance-based remuneration, superannuation and other benefits such as statutory leave entitlements.
The key terms of executive KMP contracts at 30 June 2015 were as follows:
Chief Executive Officer and Managing Director
The Consolidated Entity has entered into an employment agreement with Bruce Dixon to govern his employment with the Consolidated Entity as its Chief Executive Officer and Managing Director.
Bruce Dixon, upon listing on the ASX, became entitled to receive total Fixed Annual Remuneration (comprising base salary, superannuation and any other non-cash benefits) of $1,100,000 per annum. Bruce Dixon is also entitled to participate in the Consolidated Entity’s STI Plan. Commencing in the year ending 30 June 2015, the maximum annual incentive that may be awarded to Bruce Dixon under the STI Plan is 90% of his total Fixed Annual Remuneration depending on the achievement of certain performance criteria (see page 25 for further details). It is also proposed that from the year ending 30 June 2015, 30% of any annual incentive awarded to Bruce Dixon under the STI Plan will be deferred for a period of 12 months in the form of restricted shares, subject to obtaining shareholder approval (if required) and the award of shares being permitted under applicable law. Vesting of the deferred component will be conditional on Bruce Dixon remaining employed by the Consolidated Entity at the time of vesting, except in certain circumstances where
his employment is terminated without cause, in which case, the deferred component will vest immediately. The remaining incentive award will be paid in cash.
Bruce Dixon is also eligible to participate in the LTI Plan (see table 8 for further details). In the year ended 30 June 2014, the Consolidated Entity granted 3,254,746 options under the LTI Plan to Bruce Dixon upon listing on the ASX. Subject to the satisfaction of vesting conditions set by the Plan Committee, 878,594 options will vest on 30 June 2016 and 2,376,152 options will vest on 30 June 2017. The key terms and conditions (including the exercise price and vesting conditions) applicable to the options granted to Bruce Dixon under the LTI Plan are set out at in table 8. It is intended that future grants of shares, options or rights under the LTI Plan will be made annually and that these will vest three years from issue or grant, subject to the satisfaction of vesting conditions set by the Plan Committee.
Bruce Dixon’s employment agreement may be terminated by the Consolidated Entity or Bruce by giving at least six months’ notice in writing of such termination or, alternatively in the Consolidated Entity’s case, payment in lieu of notice. In the event of such termination, the Consolidated Entity may direct Bruce Dixon to take enforced leave (Gardening Leave) during any notice period of termination, during which time he will remain an employee and entitled to receive remuneration and all other contractual benefits.
The Consolidated Entity may terminate Bruce Dixon’s employment without notice or payment in lieu of notice for serious and willful misconduct. If there is a substantial diminution of Bruce Dixon’s responsibilities or authority or if he ceases to report to the Board (except with his consent or where the Consolidated Entity has terminated his employment) (Fundamental Change), Bruce Dixon may terminate his employment agreement by giving one month’s notice in writing within 30 days of the Fundamental Change, in which case he will be entitled to a payment equivalent to six months’ base salary and superannuation.
DIRECTORS’ REPORT 31
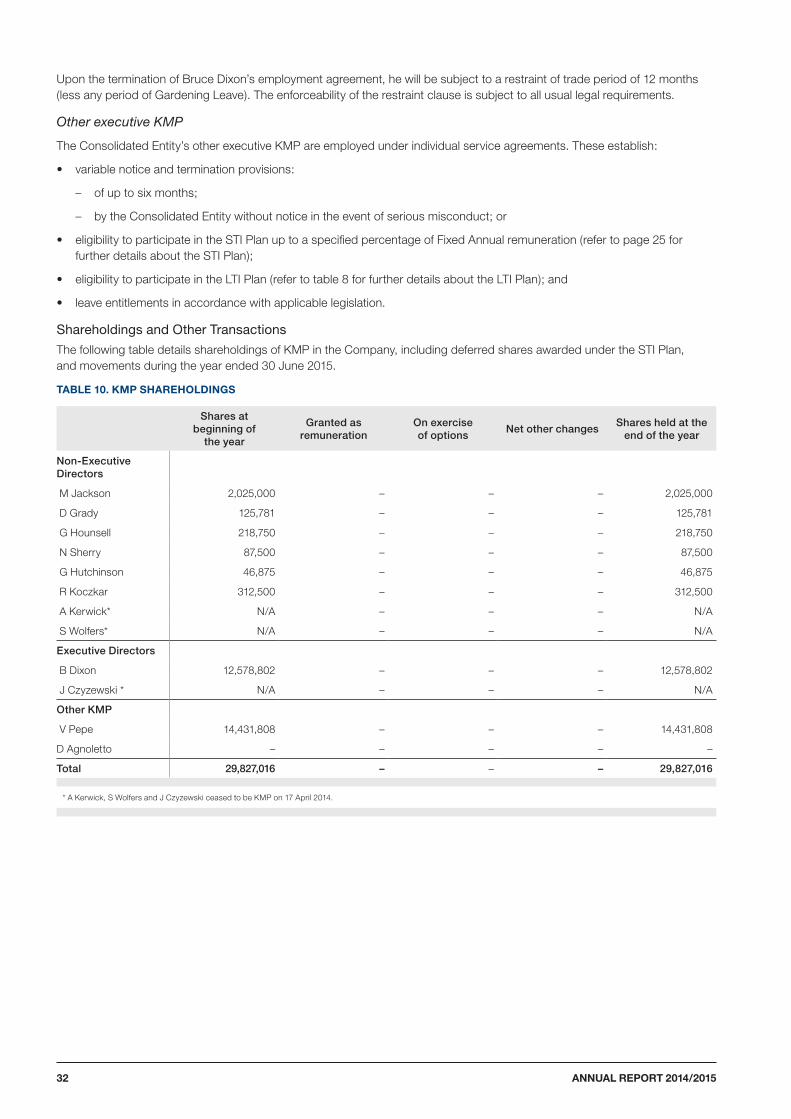
Upon the termination of Bruce Dixon’s employment agreement, he will be subject to a restraint of trade period of 12 months (less any period of Gardening Leave). The enforceability of the restraint clause is subject to all usual legal requirements.
Other executive KMP
The Consolidated Entity’s other executive KMP are employed under individual service agreements. These establish:
• variable notice and termination provisions:
– of up to six months;
– by the Consolidated Entity without notice in the event of serious misconduct; or
• eligibility to participate in the STI Plan up to a specified percentage of Fixed Annual remuneration (refer to page 25 for further details about the STI Plan);
• eligibility to participate in the LTI Plan (refer to table 8 for further details about the LTI Plan); and
• leave entitlements in accordance with applicable legislation.
Shareholdings and Other Transactions
The following table details shareholdings of KMP in the Company, including deferred shares awarded under the STI Plan, and movements during the year ended 30 June 2015.
TABLE 10. KMP SHAREHOLDINGS
Shares at beginning of
the year
Granted as remuneration
On exercise of options
Net other changes Shares held at the
end of the year
Non-Executive Directors
M Jackson 2,025,000 – – – 2,025,000
D Grady 125,781 – – – 125,781
G Hounsell 218,750 – – – 218,750
N Sherry 87,500 – – – 87,500
G Hutchinson 46,875 – – – 46,875
R Koczkar 312,500 – – – 312,500
A Kerwick* N/A – – – N/A
S Wolfers* N/A – – – N/A
Executive Directors
B Dixon 12,578,802 – – – 12,578,802
J Czyzewski * N/A – – – N/A
Other KMP
V Pepe 14,431,808 – – – 14,431,808
D Agnoletto – – – – –
Total 29,827,016 – – – 29,827,016
* A Kerwick, S Wolfers and J Czyzewski ceased to be KMP on 17 April 2014.
ANNUAL REPORT 2014/201532
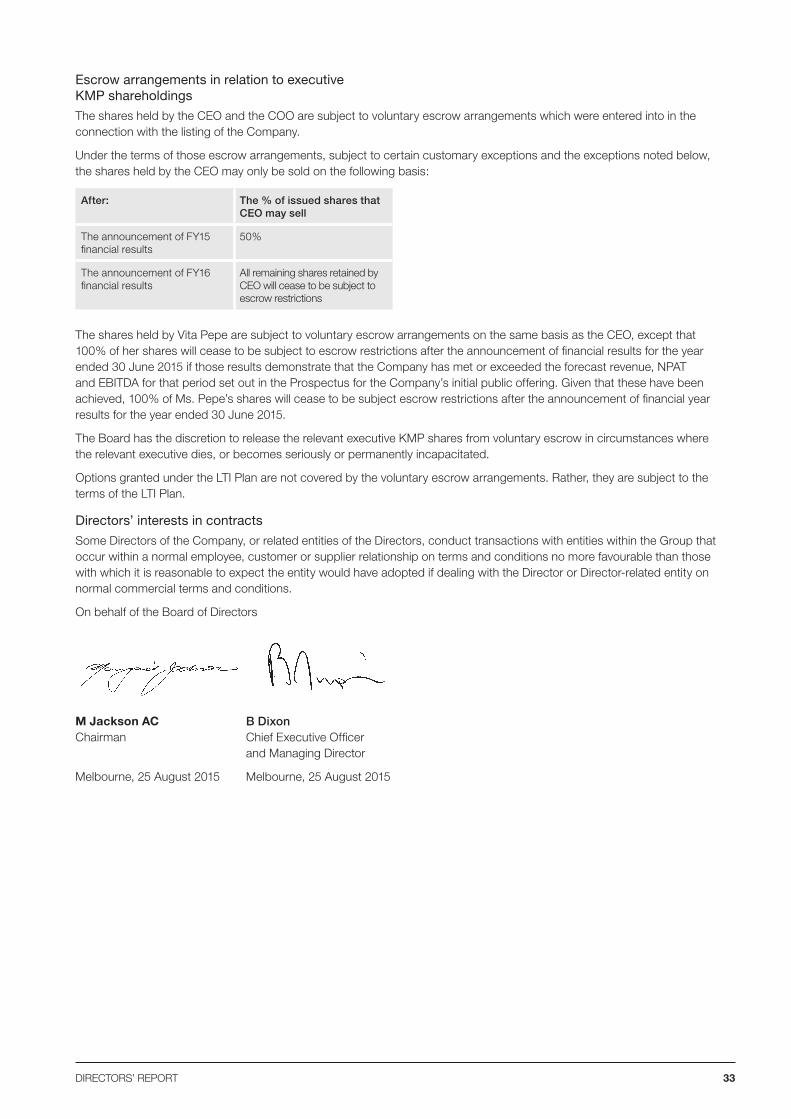
Escrow arrangements in relation to executive KMP shareholdings
The shares held by the CEO and the COO are subject to voluntary escrow arrangements which were entered into in the connection with the listing of the Company.
Under the terms of those escrow arrangements, subject to certain customary exceptions and the exceptions noted below, the shares held by the CEO may only be sold on the following basis:
After: The % of issued shares that CEO may sell
The announcement of FY15 financial results
50%
The announcement of FY16 financial results
All remaining shares retained by CEO will cease to be subject to escrow restrictions
The shares held by Vita Pepe are subject to voluntary escrow arrangements on the same basis as the CEO, except that 100% of her shares will cease to be subject to escrow restrictions after the announcement of financial results for the year ended 30 June 2015 if those results demonstrate that the Company has met or exceeded the forecast revenue, NPAT and EBITDA for that period set out in the Prospectus for the Company’s initial public offering. Given that these have been achieved, 100% of Ms. Pepe’s shares will cease to be subject escrow restrictions after the announcement of financial year results for the year ended 30 June 2015.
The Board has the discretion to release the relevant executive KMP shares from voluntary escrow in circumstances where the relevant executive dies, or becomes seriously or permanently incapacitated.
Options granted under the LTI Plan are not covered by the voluntary escrow arrangements. Rather, they are subject to the terms of the LTI Plan.
Directors’ interests in contracts
Some Directors of the Company, or related entities of the Directors, conduct transactions with entities within the Group that occur within a normal employee, customer or supplier relationship on terms and conditions no more favourable than those with which it is reasonable to expect the entity would have adopted if dealing with the Director or Director-related entity on normal commercial terms and conditions.
On behalf of the Board of Directors
M Jackson AC Chairman
Melbourne, 25 August 2015
B Dixon Chief Executive Officer and Managing Director
Melbourne, 25 August 2015
DIRECTORS’ REPORT 33
This statement explains how the Board of Spotless Group Holdings Limited (the Board) oversees the management of the Consolidated Entity’s business. The Board is responsible for the overall corporate governance of the Consolidated Entity. The Board monitors the operational and financial position and performance of the Consolidated Entity and oversees its business strategy including approving the strategic goals of the Consolidated Entity and considering and approving an annual budget.
Corporate Governance Statement
ANNUAL REPORT 2014/201534

35CORPORATE GOVERNANCE STATEMENT
The Board is committed to maximising performance, generating financial returns and shareholder value, and sustaining the growth and success of the Consolidated Entity. In conducting the Consolidated Entity’s business with these objectives, the Board seeks to ensure that the Consolidated Entity is properly managed to protect and enhance shareholder interests, and that the Consolidated Entity, its directors, officers and personnel operate in an appropriate environment of corporate governance. Accordingly, the Board has created a framework for managing the Consolidated Entity including adopting relevant internal controls, risk management processes and corporate governance policies and practices which it believes are appropriate for the Consolidated Entity’s business and which are designed to promote the responsible management and conduct of the Consolidated Entity.
The ASX Corporate Governance Council has developed and released its Corporate Governance Principles and Recommendations (ASX Recommendations) for listed companies in order to promote investor confidence and to assist companies in meeting stakeholder expectations. The recommendations are not prescriptions, but guidelines.
An overview of the Consolidated Entity’s main corporate governance practices are set out below. The information in this statement relating to the directors, Board committee memberships and other details is current as at the date of this report.
Details of the Consolidated Entity’s key policies and practices and the charters for the Board and each of its committees are available at www.spotless.com.
THE BOARDThe Board of is comprised of:
• Margaret Jackson AC (independent Chairman)
• Bruce Dixon (Chief Executive Officer and Managing Director)
• Diane Grady AM (independent non-executive director)
• Garry Hounsell (independent non-executive director)
• Geoff Hutchinson (non-executive director)
• Rob Koczkar (non-executive director)
• The Hon. Nick Sherry (independent non-executive director)
Details of the Directors’ skills, experience, expertise, qualifications, terms of office, relationships affecting independence, their independence status and membership of committees are set out within this statement and in the Directors’ Report.
Before the Board appoints a new director or puts forward a candidate for election, the Board ensures that appropriate background checks are undertaken. The Consolidated Entity provides shareholders with all material information in its possession that is relevant to their decision on whether or not to elect or re-elect a director through a number of channels, including via the Notice of Meeting, the Director profiles included in the Directors’ Report and other information contained in the Annual Report.
The Board’s objective is to have an appropriate mix of skills, expertise and experience on the Board relevant to the Company’s businesses and the Board’s responsibilities. The Board considers that the current mix of skills, expertise and experience, as set out in the matrix below, meets this objective.
Skills/Expertise Experience
• Change management
• Corporate advisory
• Corporate governance/compliance
• Ethical leadership
• Executive leadership and management
• Financial/accounting
• Health and safety
• Mergers and Acquisitions
• Operations
• Organisational design
• Remuneration and Nominations
• Risk management
• Strategy
• Sustainability
• Tendering
Extensive experience in Australia and overseas across a range of industries and markets, including:
• Agriculture
• Banking
• Education
• Finance
• Government
• Health
• Infrastructure
• Manufacturing
• Media
• Mining
• Telecommunication
• Transport
• Utilities
• Wine and Spirits
Upon appointment, each director (and senior executive) receives a letter of appointment which sets out the formal terms of their appointment, along with a deed of indemnity, insurance and access.
The Board considers an independent director to be a non-executive director who is not a member of the Consolidated Entity’s management and who is free of any business or other relationship that could materially interfere with or reasonably be perceived to interfere with the independent exercise of their judgment. The Board will consider the materiality of any given relationship on a case-by-case basis and has adopted guidelines to assist in this regard. The Board reviews the independence of each director in light of interests disclosed to the Board from time to time.
ANNUAL REPORT 2014/201536
The Consolidated Entity’s Board Charter sets out guidelines of materiality for the purpose of determining independence of directors in accordance with the ASX Recommendations and has adopted a definition of independence that is based on that set out in the ASX Recommendations.
The Board considers qualitative principles of materiality for the purpose of determining ‘independence’ on a case-by-case basis. The Board will consider whether there are any factors or considerations which may mean that the director’s interest, business or relationship could, or could be reasonably perceived to, materially interfere with the director’s ability to act in the best interests of the Consolidated Entity.
The Board considers that each of Margaret Jackson AC, Diane Grady AM, Garry Hounsell and The Hon. Nick Sherry is an independent director for the purpose of the ASX Recommendations.
Bruce Dixon, Rob Koczkar, and Geoff Hutchinson are not considered by the Board to be independent. Bruce is the CEO and Managing Director of the Consolidated Entity. Geoff Hutchinson is a director nominated on behalf of the PEP Shareholders and the Coinvestment Shareholders (other than Lentesco) which hold 18.93% of shares in the Company and similarly Rob Koczkar, until March 2015, acted as a director nominated on behalf of those shareholders.
On this basis, the Board consists of a majority of independent directors.
The Board considers that each of the directors brings an objective and independent judgment to the Board’s deliberations and that each of the directors makes a valuable contribution to the Consolidated Entity through the skills they bring to the Board and their understanding of the Consolidated Entity’s business.
Directors also attend formal induction sessions where they are briefed on the Company’s vision and values, strategy, financials, and governance and risk management frameworks.
The Company Secretary is accountable to the Board through the Chairman on all matters regarding the proper functioning of the Board. This includes assisting the Board and its Committees with meetings and directors’ duties, advising the Board on corporate governance matters, and acting as the interface between the Board and senior executives.
BOARD CHARTERThe Board has adopted a formal Charter that details the functions and responsibilities of the Board. The Board Charter also establishes the functions reserved to the Board and those powers delegated to management.
The Board Charter allows the Board to delegate powers and responsibilities to committees established by the Board. The Board retains ultimate accountability to shareholders in discharging its duties.
The Board Charter provides that with guidance from the Nomination Committee and, where necessary, external consultants, the Board shall identify candidates with appropriate skills, experience, expertise and diversity in order to discharge its mandate effectively and to maintain the necessary mix of expertise on the Board.
The Nomination Committee assesses nominations of new directors against a range of criteria including the candidate’s background, experience, gender, professional skills, personal qualities and whether their skills and experience will complement the existing Board.
The criteria to assess nominations of new directors is reviewed annually and the Nomination Committee regularly compares the skill base of existing directors with that required for the future strategy of the Consolidated Entity to enable identification of attributes required in new directors.
A copy of the Board Charter is publicly available in the Governance section of Spotless’ website at www.spotless.com.
BOARD COMMITTEESThe Board may from time to time establish appropriate committees to assist in the discharge of its responsibilities.
The Board has established an Audit, Business Risk and Compliance Committee, a Nomination Committee and a People and Remuneration Committee.
Other committees may be established by the Board as and when required.
Under the Board Charter, Board committee performance evaluations will occur at least once per year.
Audit, Business Risk and Compliance CommitteeThe role of the Audit, Business Risk and Compliance Committee is to assist the Board in fulfilling its responsibilities for corporate governance and overseeing the Consolidated Entity’s internal control structure and risk management systems. The Audit, Business Risk and Compliance Committee also confirms the quality and reliability of the financial information prepared by the Consolidated Entity, works with the external auditor on behalf of the Board and reviews non-audit services provided by the external auditor, to confirm they are consistent with maintaining external audit independence.
37CORPORATE GOVERNANCE STATEMENT
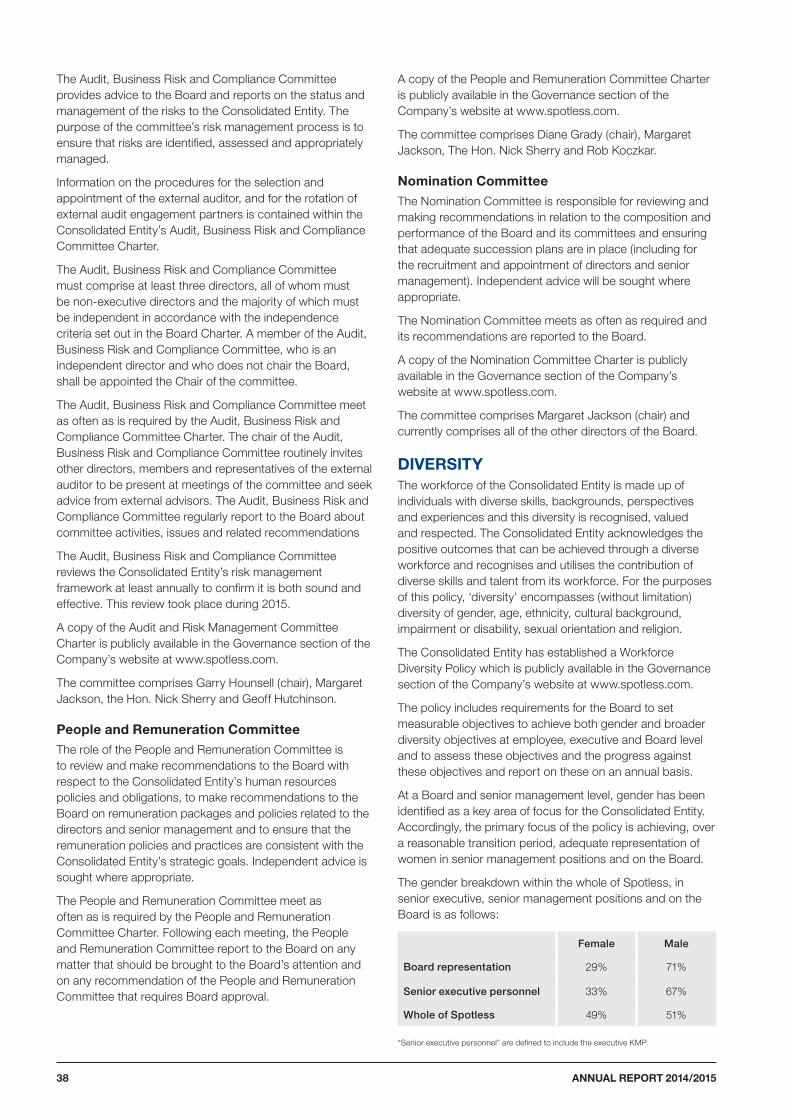
The Audit, Business Risk and Compliance Committee provides advice to the Board and reports on the status and management of the risks to the Consolidated Entity. The purpose of the committee’s risk management process is to ensure that risks are identified, assessed and appropriately managed.
Information on the procedures for the selection and appointment of the external auditor, and for the rotation of external audit engagement partners is contained within the Consolidated Entity’s Audit, Business Risk and Compliance Committee Charter.
The Audit, Business Risk and Compliance Committee must comprise at least three directors, all of whom must be non-executive directors and the majority of which must be independent in accordance with the independence criteria set out in the Board Charter. A member of the Audit, Business Risk and Compliance Committee, who is an independent director and who does not chair the Board, shall be appointed the Chair of the committee.
The Audit, Business Risk and Compliance Committee meet as often as is required by the Audit, Business Risk and Compliance Committee Charter. The chair of the Audit, Business Risk and Compliance Committee routinely invites other directors, members and representatives of the external auditor to be present at meetings of the committee and seek advice from external advisors. The Audit, Business Risk and Compliance Committee regularly report to the Board about committee activities, issues and related recommendations
The Audit, Business Risk and Compliance Committee reviews the Consolidated Entity’s risk management framework at least annually to confirm it is both sound and effective. This review took place during 2015.
A copy of the Audit and Risk Management Committee Charter is publicly available in the Governance section of the Company’s website at www.spotless.com.
The committee comprises Garry Hounsell (chair), Margaret Jackson, the Hon. Nick Sherry and Geoff Hutchinson.
People and Remuneration CommitteeThe role of the People and Remuneration Committee is to review and make recommendations to the Board with respect to the Consolidated Entity’s human resources policies and obligations, to make recommendations to the Board on remuneration packages and policies related to the directors and senior management and to ensure that the remuneration policies and practices are consistent with the Consolidated Entity’s strategic goals. Independent advice is sought where appropriate.
The People and Remuneration Committee meet as often as is required by the People and Remuneration Committee Charter. Following each meeting, the People and Remuneration Committee report to the Board on any matter that should be brought to the Board’s attention and on any recommendation of the People and Remuneration Committee that requires Board approval.
A copy of the People and Remuneration Committee Charter is publicly available in the Governance section of the Company’s website at www.spotless.com.
The committee comprises Diane Grady (chair), Margaret Jackson, The Hon. Nick Sherry and Rob Koczkar.
Nomination CommitteeThe Nomination Committee is responsible for reviewing and making recommendations in relation to the composition and performance of the Board and its committees and ensuring that adequate succession plans are in place (including for the recruitment and appointment of directors and senior management). Independent advice will be sought where appropriate.
The Nomination Committee meets as often as required and its recommendations are reported to the Board.
A copy of the Nomination Committee Charter is publicly available in the Governance section of the Company’s website at www.spotless.com.
The committee comprises Margaret Jackson (chair) and currently comprises all of the other directors of the Board.
DIVERSITYThe workforce of the Consolidated Entity is made up of individuals with diverse skills, backgrounds, perspectives and experiences and this diversity is recognised, valued and respected. The Consolidated Entity acknowledges the positive outcomes that can be achieved through a diverse workforce and recognises and utilises the contribution of diverse skills and talent from its workforce. For the purposes of this policy, ‘diversity’ encompasses (without limitation) diversity of gender, age, ethnicity, cultural background, impairment or disability, sexual orientation and religion.
The Consolidated Entity has established a Workforce Diversity Policy which is publicly available in the Governance section of the Company’s website at www.spotless.com.
The policy includes requirements for the Board to set measurable objectives to achieve both gender and broader diversity objectives at employee, executive and Board level and to assess these objectives and the progress against these objectives and report on these on an annual basis.
At a Board and senior management level, gender has been identified as a key area of focus for the Consolidated Entity. Accordingly, the primary focus of the policy is achieving, over a reasonable transition period, adequate representation of women in senior management positions and on the Board.
The gender breakdown within the whole of Spotless, in senior executive, senior management positions and on the Board is as follows:
Female Male
Board representation 29% 71%
Senior executive personnel 33% 67%
Whole of Spotless 49% 51%
“Senior executive personnel” are defined to include the executive KMP.
ANNUAL REPORT 2014/201538
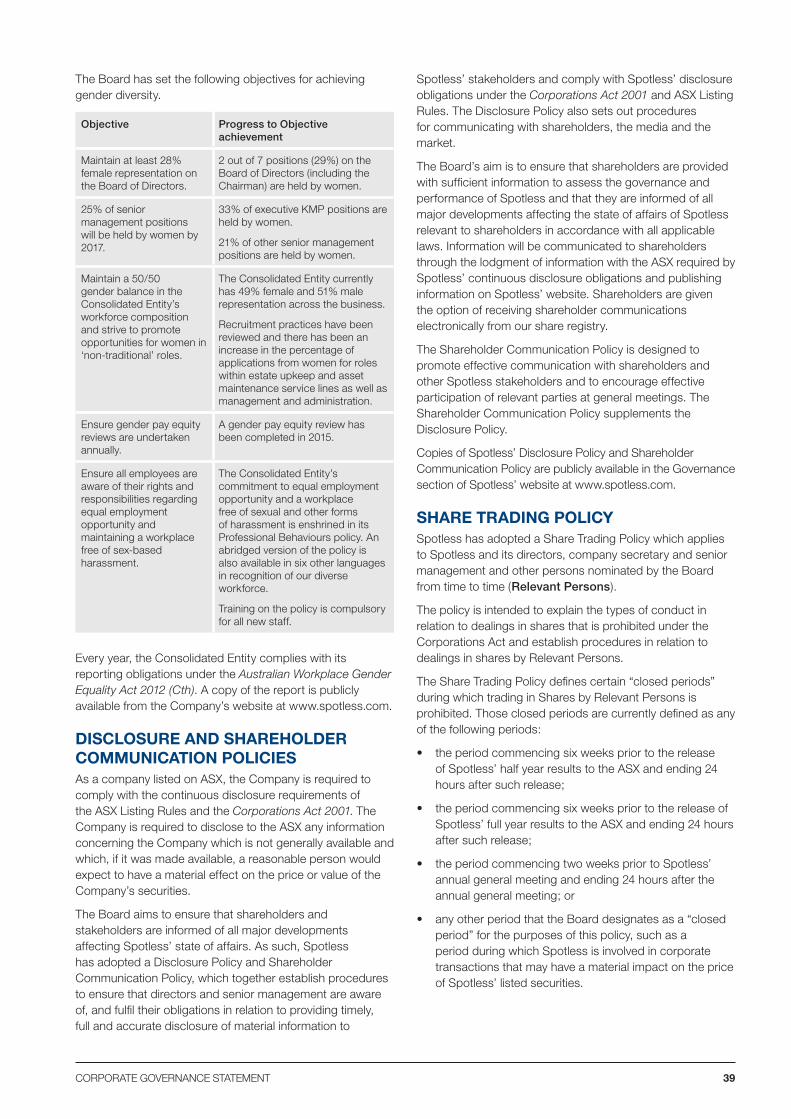
The Board has set the following objectives for achieving gender diversity.
Objective Progress to Objective achievement
Maintain at least 28% female representation on the Board of Directors.
2 out of 7 positions (29%) on the Board of Directors (including the Chairman) are held by women.
25% of senior management positions will be held by women by 2017.
33% of executive KMP positions are held by women.
21% of other senior management positions are held by women.
Maintain a 50/50 gender balance in the Consolidated Entity’s workforce composition and strive to promote opportunities for women in ‘non-traditional’ roles.
The Consolidated Entity currently has 49% female and 51% male representation across the business.
Recruitment practices have been reviewed and there has been an increase in the percentage of applications from women for roles within estate upkeep and asset maintenance service lines as well as management and administration.
Ensure gender pay equity reviews are undertaken annually.
A gender pay equity review has been completed in 2015.
Ensure all employees are aware of their rights and responsibilities regarding equal employment opportunity and maintaining a workplace free of sex-based harassment.
The Consolidated Entity’s commitment to equal employment opportunity and a workplace free of sexual and other forms of harassment is enshrined in its Professional Behaviours policy. An abridged version of the policy is also available in six other languages in recognition of our diverse workforce.
Training on the policy is compulsory for all new staff.
Every year, the Consolidated Entity complies with its reporting obligations under the Australian Workplace Gender Equality Act 2012 (Cth). A copy of the report is publicly available from the Company’s website at www.spotless.com.
DISCLOSURE AND SHAREHOLDER COMMUNICATION POLICIESAs a company listed on ASX, the Company is required to comply with the continuous disclosure requirements of the ASX Listing Rules and the Corporations Act 2001. The Company is required to disclose to the ASX any information concerning the Company which is not generally available and which, if it was made available, a reasonable person would expect to have a material effect on the price or value of the Company’s securities.
The Board aims to ensure that shareholders and stakeholders are informed of all major developments affecting Spotless’ state of affairs. As such, Spotless has adopted a Disclosure Policy and Shareholder Communication Policy, which together establish procedures to ensure that directors and senior management are aware of, and fulfil their obligations in relation to providing timely, full and accurate disclosure of material information to
Spotless’ stakeholders and comply with Spotless’ disclosure obligations under the Corporations Act 2001 and ASX Listing Rules. The Disclosure Policy also sets out procedures for communicating with shareholders, the media and the market.
The Board’s aim is to ensure that shareholders are provided with sufficient information to assess the governance and performance of Spotless and that they are informed of all major developments affecting the state of affairs of Spotless relevant to shareholders in accordance with all applicable laws. Information will be communicated to shareholders through the lodgment of information with the ASX required by Spotless’ continuous disclosure obligations and publishing information on Spotless’ website. Shareholders are given the option of receiving shareholder communications electronically from our share registry.
The Shareholder Communication Policy is designed to promote effective communication with shareholders and other Spotless stakeholders and to encourage effective participation of relevant parties at general meetings. The Shareholder Communication Policy supplements the Disclosure Policy.
Copies of Spotless’ Disclosure Policy and Shareholder Communication Policy are publicly available in the Governance section of Spotless’ website at www.spotless.com.
SHARE TRADING POLICYSpotless has adopted a Share Trading Policy which applies to Spotless and its directors, company secretary and senior management and other persons nominated by the Board from time to time (Relevant Persons).
The policy is intended to explain the types of conduct in relation to dealings in shares that is prohibited under the Corporations Act and establish procedures in relation to dealings in shares by Relevant Persons.
The Share Trading Policy defines certain “closed periods” during which trading in Shares by Relevant Persons is prohibited. Those closed periods are currently defined as any of the following periods:
• the period commencing six weeks prior to the release of Spotless’ half year results to the ASX and ending 24 hours after such release;
• the period commencing six weeks prior to the release of Spotless’ full year results to the ASX and ending 24 hours after such release;
• the period commencing two weeks prior to Spotless’ annual general meeting and ending 24 hours after the annual general meeting; or
• any other period that the Board designates as a “closed period” for the purposes of this policy, such as a period during which Spotless is involved in corporate transactions that may have a material impact on the price of Spotless’ listed securities.
39CORPORATE GOVERNANCE STATEMENT
Outside of these periods, Relevant Persons must receive clearance for any proposed dealing in securities.
In all instances, buying or selling securities is not permitted at any time by any person who possesses price-sensitive information.
CODE OF CONDUCTThe Board recognises the need to observe the highest standards of corporate practice and business conduct. Accordingly, the Board has adopted a Code of Conduct, which sets out the way the Company conducts business. The Company carries on business honestly and fairly, acting only in ways that reflect well on the Company in strict compliance with all laws and regulations.
The policy document outlines the Company’s employees’ obligations of compliance with the Code of Conduct, and explains how the Code of Conduct interacts with the Company’s other corporate governance policies.
Responsibilities include protection of the Company’s business, using the Company’s resources in an appropriate manner, protecting confidential information and avoiding conflicts of interest.
A copy of Spotless’ Code of Conduct is publicly available in the Governance section of the Company’s website at www.spotless.com.
BOARD AND COMMITTEE MEETING FREQUENCY AND ATTENDANCEThe number of Board and Board committee meetings held during the year along with the attendance by directors is set out in the Directors’ Report under Directors’ Meetings.
SENIOR EXECUTIVE PERFORMANCEThe Consolidated Entity’s Board Charter details a process for the review of the performance of the Chief Executive Officer.
The performance of the Consolidated Entity’s senior executives is reviewed annually through a formal performance review process to ensure that executives continue to perform effectively in their roles. Performance is measured against goals set at the beginning of each financial year.
PERFORMANCE OF THE BOARD, ITS COMMITTEES AND INDIVIDUAL DIRECTORSThe Consolidated Entity’s Board Charter details a process for the review of Board, committee and individual directors’ performance. A review was undertaken during the reporting period.
Directors are provided with appropriate professional development opportunities to enable them to develop and maintain their skills and knowledge needed to perform their role as directors effectively.
ACCESS TO INDEPENDENT PROFESSIONAL ADVICEDirectors may obtain independent professional advice at the Consolidated Entity’s expense on matters arising in the course of their Board and committee duties, after obtaining the Chairman’s approval.
PROCEDURE FOR THE SELECTION OF AND APPOINTMENT OF DIRECTORSA description of the procedure for the selection and appointment of new directors to the Board and the re-election of incumbent directors and the Board’s policy for the nomination and appointment of directors is contained within the Company’s Nomination Committee Charter and Board Charter.
REMUNERATION ARRANGEMENTS
Board and Non-Executive DirectorThe remuneration policy for the Board and the remuneration of each director is set out in the Remuneration Report which forms part of the Directors’ Report.
The Board has also adopted a policy prohibiting the directors and senior executives from entering into transactions or arrangements which limit the economic risk of participating in unvested remuneration entitlements.
Senior executivesInformation on the structure of remuneration for the Consolidated Entity’s Key Management Personnel can be found in the Remuneration Report, which forms part of the Directors’ Report.
EXTERNAL AUDITORThe Company’s external auditor, Ernst & Young was appointed in 2013.
Ernst & Young attends the Company’s AGM and a representative is available to answer questions from shareholders relevant to the audit at, or ahead of, the AGM. Ernst & Young’s independence declaration is contained in the Directors’ Report.
RISKThe Company’s Board, with the guidance of the Audit, Business Risk and Compliance Committee, is responsible for:
• approving policies on and overseeing the management of business and financial and non-financial risks;
• reviewing and monitoring processes and controls to maintain the integrity of accounting and financial records and reporting; and
• approving financial results and reports for release and dividends to be paid to shareholders.
ANNUAL REPORT 2014/201540
The Company’s Audit, Business Risk and Compliance Committee Charter also provides that the committee’s specific function with respect to risk management is to review and report to the Board that:
• the Consolidated Entity’s ongoing risk management program effectively identifies all areas of potential risk;
• adequate policies and procedures have been designed and implemented to manage identified risks;
• a regular program of audit is undertaken to test the adequacy of and compliance with prescribed policies; and
• proper remedial action is undertaken to redress areas of weakness.
Both the Company’s Board Charter and the Audit, Business Risk and Compliance Committee Charter are publicly available in the Governance section of the Company’s website at www.spotless.com.
The Company seeks to take and manage risk in ways that will generate and protect shareholder value and recognises that the management of risk is a continual process and an integral part of the management and corporate governance of the business.
The Company acknowledges that it has an obligation to all stakeholders, including shareholders, customers, employees, contractors and the wider community and that the efficient and effective management of risk is critical to the Company meeting these obligations and achieving its strategic objectives.
The Company’s key economic, environmental and social sustainability risks, together with our approach to managing those risks, is outlined in the Operating and Financial Review section in our Directors’ Report.
The Company’s Internal Audit function provides objective assurance on the adequacy and effectiveness of the group’s systems for risk management, internal control and governance, along with recommendations to improve the efficiency and effectiveness of these systems and processes. The Internal Audit function reports to the CFO.
Written AffirmationsPrior to the Board’s approval of the financial statements of the Consolidated Entity in respect of the year ended 30 June 2015, the CEO and CFO provided a declaration to the Board that, in their opinion, the financial records have been properly maintained and that the financial statements comply with the appropriate accounting standards and give a true and fair view of the financial position and performance of the Consolidated Entity, and their opinion has been formed on the basis of a sound system of risk management and internal control which is operating effectively. These assurances were given for both the half year results and full year results.
Approved by the Board 25 August 2015
41CORPORATE GOVERNANCE STATEMENT

ANNUAL REPORT 2014/201542

43FINANCIAL STATEMENTS
Financial Statements
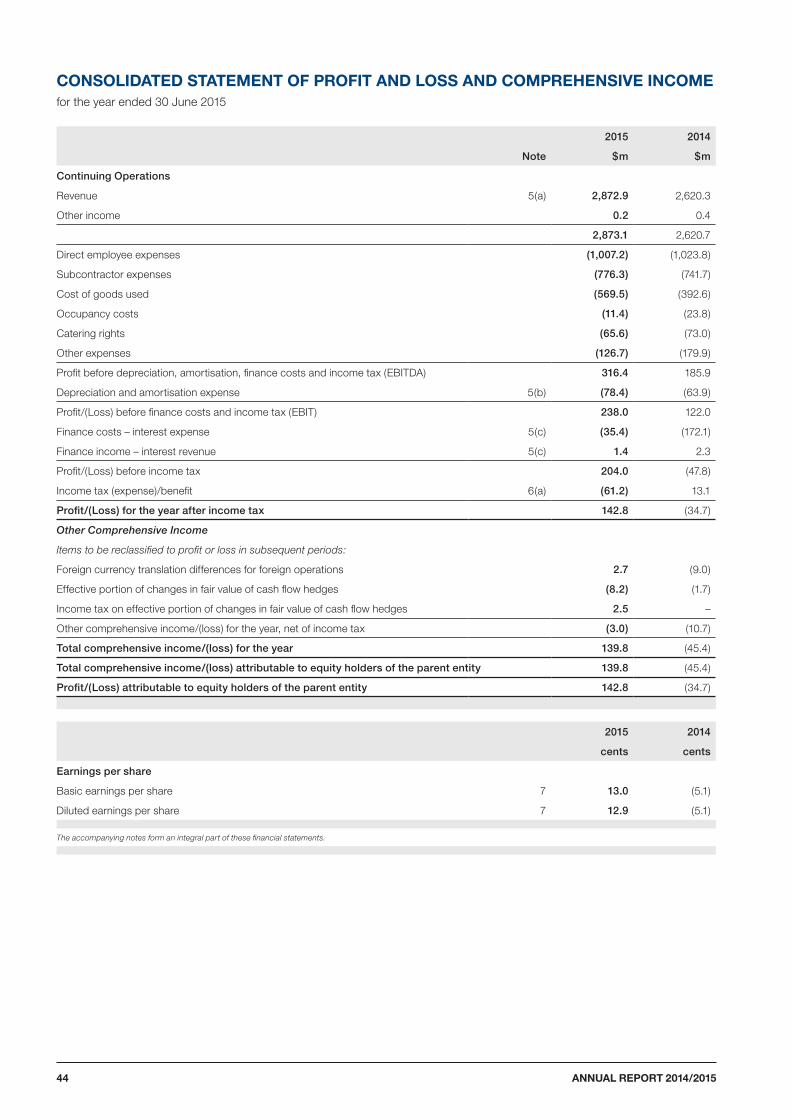
CONSOLIDATED STATEMENT OF PROFIT AND LOSS AND COMPREHENSIVE INCOMEfor the year ended 30 June 2015
2015 2014
Note $m $m
Continuing Operations
Revenue 5(a) 2,872.9 2,620.3
Other income 0.2 0.4
2,873.1 2,620.7
Direct employee expenses (1,007.2) (1,023.8)
Subcontractor expenses (776.3) (741.7)
Cost of goods used (569.5) (392.6)
Occupancy costs (11.4) (23.8)
Catering rights (65.6) (73.0)
Other expenses (126.7) (179.9)
Profit before depreciation, amortisation, finance costs and income tax (EBITDA) 316.4 185.9
Depreciation and amortisation expense 5(b) (78.4) (63.9)
Profit/(Loss) before finance costs and income tax (EBIT) 238.0 122.0
Finance costs – interest expense 5(c) (35.4) (172.1)
Finance income – interest revenue 5(c) 1.4 2.3
Profit/(Loss) before income tax 204.0 (47.8)
Income tax (expense)/benefit 6(a) (61.2) 13.1
Profit/(Loss) for the year after income tax 142.8 (34.7)
Other Comprehensive Income
Items to be reclassified to profit or loss in subsequent periods:
Foreign currency translation differences for foreign operations 2.7 (9.0)
Effective portion of changes in fair value of cash flow hedges (8.2) (1.7)
Income tax on effective portion of changes in fair value of cash flow hedges 2.5 –
Other comprehensive income/(loss) for the year, net of income tax (3.0) (10.7)
Total comprehensive income/(loss) for the year 139.8 (45.4)
Total comprehensive income/(loss) attributable to equity holders of the parent entity 139.8 (45.4)
Profit/(Loss) attributable to equity holders of the parent entity 142.8 (34.7)
2015 2014
cents cents
Earnings per share
Basic earnings per share 7 13.0 (5.1)
Diluted earnings per share 7 12.9 (5.1)
The accompanying notes form an integral part of these financial statements.
ANNUAL REPORT 2014/201544
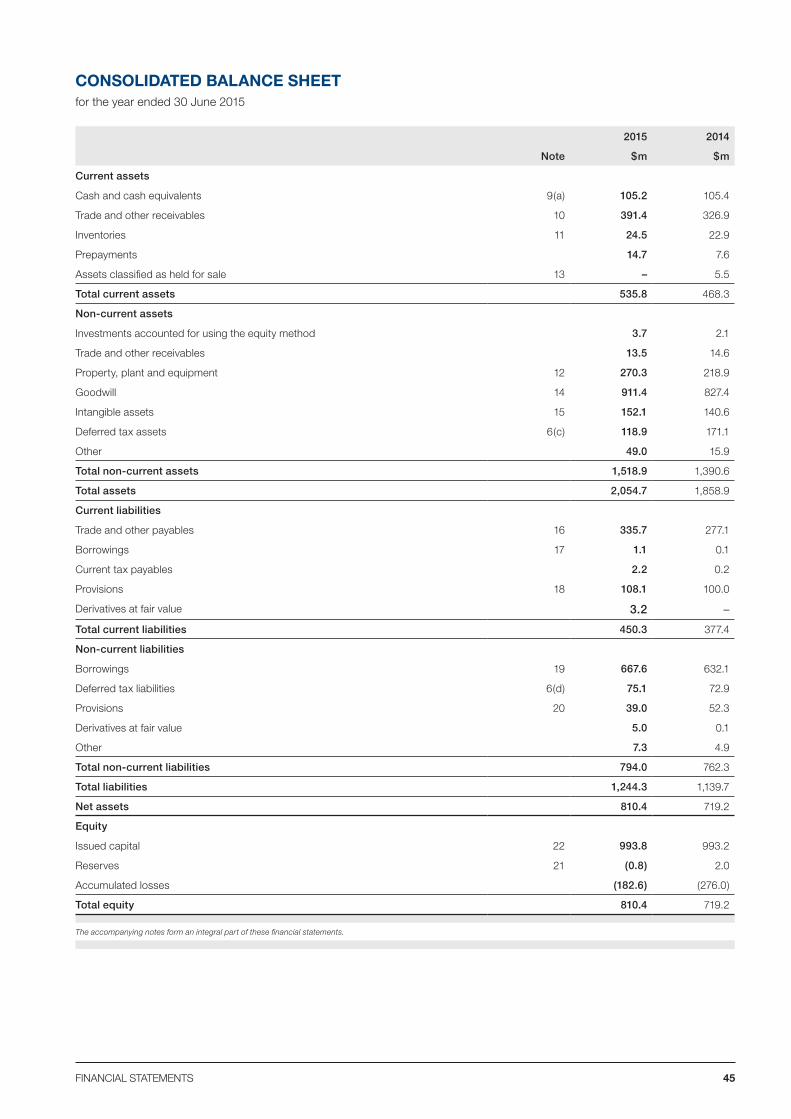
CONSOLIDATED BALANCE SHEETfor the year ended 30 June 2015
2015 2014
Note $m $m
Current assets
Cash and cash equivalents 9(a) 105.2 105.4
Trade and other receivables 10 391.4 326.9
Inventories 11 24.5 22.9
Prepayments 14.7 7.6
Assets classified as held for sale 13 – 5.5
Total current assets 535.8 468.3
Non-current assets
Investments accounted for using the equity method 3.7 2.1
Trade and other receivables 13.5 14.6
Property, plant and equipment 12 270.3 218.9
Goodwill 14 911.4 827.4
Intangible assets 15 152.1 140.6
Deferred tax assets 6(c) 118.9 171.1
Other 49.0 15.9
Total non-current assets 1,518.9 1,390.6
Total assets 2,054.7 1,858.9
Current liabilities
Trade and other payables 16 335.7 277.1
Borrowings 17 1.1 0.1
Current tax payables 2.2 0.2
Provisions 18 108.1 100.0
Derivatives at fair value 3.2 –
Total current liabilities 450.3 377.4
Non-current liabilities
Borrowings 19 667.6 632.1
Deferred tax liabilities 6(d) 75.1 72.9
Provisions 20 39.0 52.3
Derivatives at fair value 5.0 0.1
Other 7.3 4.9
Total non-current liabilities 794.0 762.3
Total liabilities 1,244.3 1,139.7
Net assets 810.4 719.2
Equity
Issued capital 22 993.8 993.2
Reserves 21 (0.8) 2.0
Accumulated losses (182.6) (276.0)
Total equity 810.4 719.2
The accompanying notes form an integral part of these financial statements.
45FINANCIAL STATEMENTS
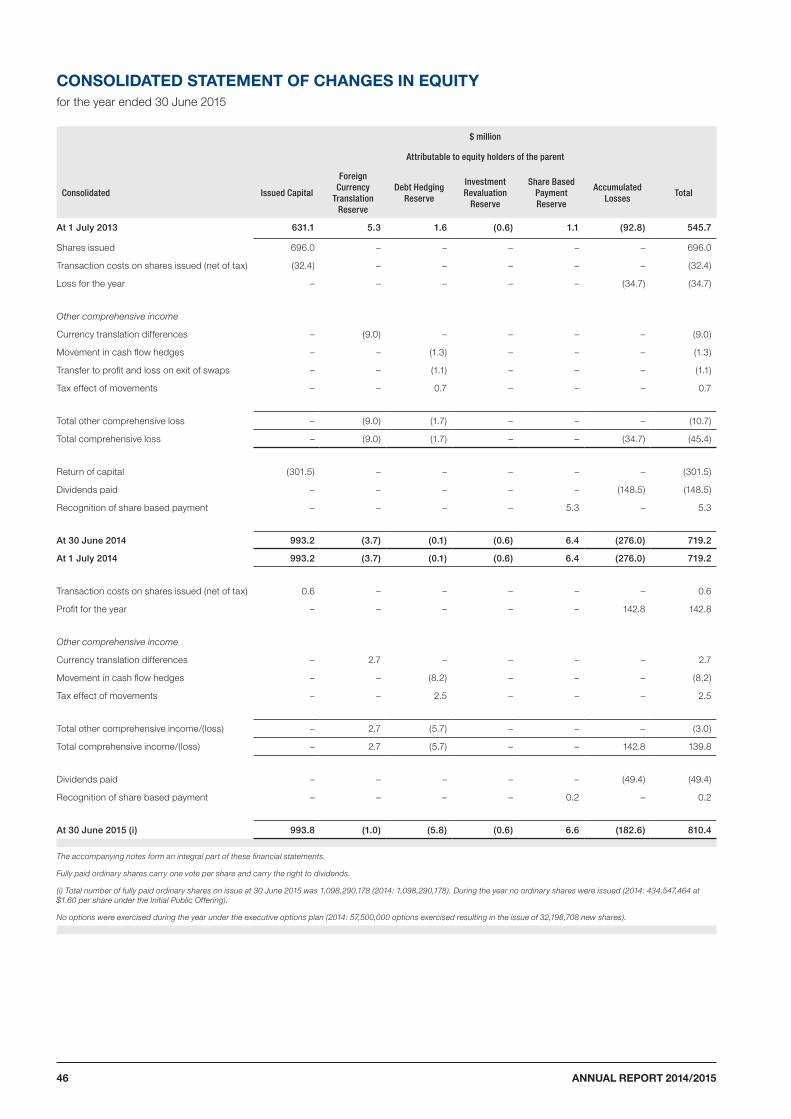
CONSOLIDATED STATEMENT OF CHANGES IN EQUITYfor the year ended 30 June 2015
$ million
Attributable to equity holders of the parent
Consolidated Issued Capital
Foreign Currency
Translation Reserve
Debt Hedging Reserve
Investment Revaluation
Reserve
Share Based Payment Reserve
Accumulated Losses
Total
At 1 July 2013 631.1 5.3 1.6 (0.6) 1.1 (92.8) 545.7
Shares issued 696.0 – – – – – 696.0
Transaction costs on shares issued (net of tax) (32.4) – – – – – (32.4)
Loss for the year – – – – – (34.7) (34.7)
Other comprehensive income
Currency translation differences – (9.0) – – – – (9.0)
Movement in cash flow hedges – – (1.3) – – – (1.3)
Transfer to profit and loss on exit of swaps – – (1.1) – – – (1.1)
Tax effect of movements – – 0.7 – – – 0.7
Total other comprehensive loss – (9.0) (1.7) – – – (10.7)
Total comprehensive loss – (9.0) (1.7) – – (34.7) (45.4)
Return of capital (301.5) – – – – – (301.5)
Dividends paid – – – – – (148.5) (148.5)
Recognition of share based payment – – – – 5.3 – 5.3
At 30 June 2014 993.2 (3.7) (0.1) (0.6) 6.4 (276.0) 719.2
At 1 July 2014 993.2 (3.7) (0.1) (0.6) 6.4 (276.0) 719.2
Transaction costs on shares issued (net of tax) 0.6 – – – – – 0.6
Profit for the year – – – – – 142.8 142.8
Other comprehensive income
Currency translation differences – 2.7 – – – – 2.7
Movement in cash flow hedges – – (8.2) – – – (8.2)
Tax effect of movements – – 2.5 – – – 2.5
Total other comprehensive income/(loss) – 2.7 (5.7) – – – (3.0)
Total comprehensive income/(loss) – 2.7 (5.7) – – 142.8 139.8
Dividends paid – – – – – (49.4) (49.4)
Recognition of share based payment – – – – 0.2 – 0.2
At 30 June 2015 (i) 993.8 (1.0) (5.8) (0.6) 6.6 (182.6) 810.4
The accompanying notes form an integral part of these financial statements.
Fully paid ordinary shares carry one vote per share and carry the right to dividends.
(i) Total number of fully paid ordinary shares on issue at 30 June 2015 was 1,098,290,178 (2014: 1,098,290,178). During the year no ordinary shares were issued (2014: 434,547,464 at $1.60 per share under the Initial Public Offering).
No options were exercised during the year under the executive options plan (2014: 57,500,000 options exercised resulting in the issue of 32,198,708 new shares).
ANNUAL REPORT 2014/201546
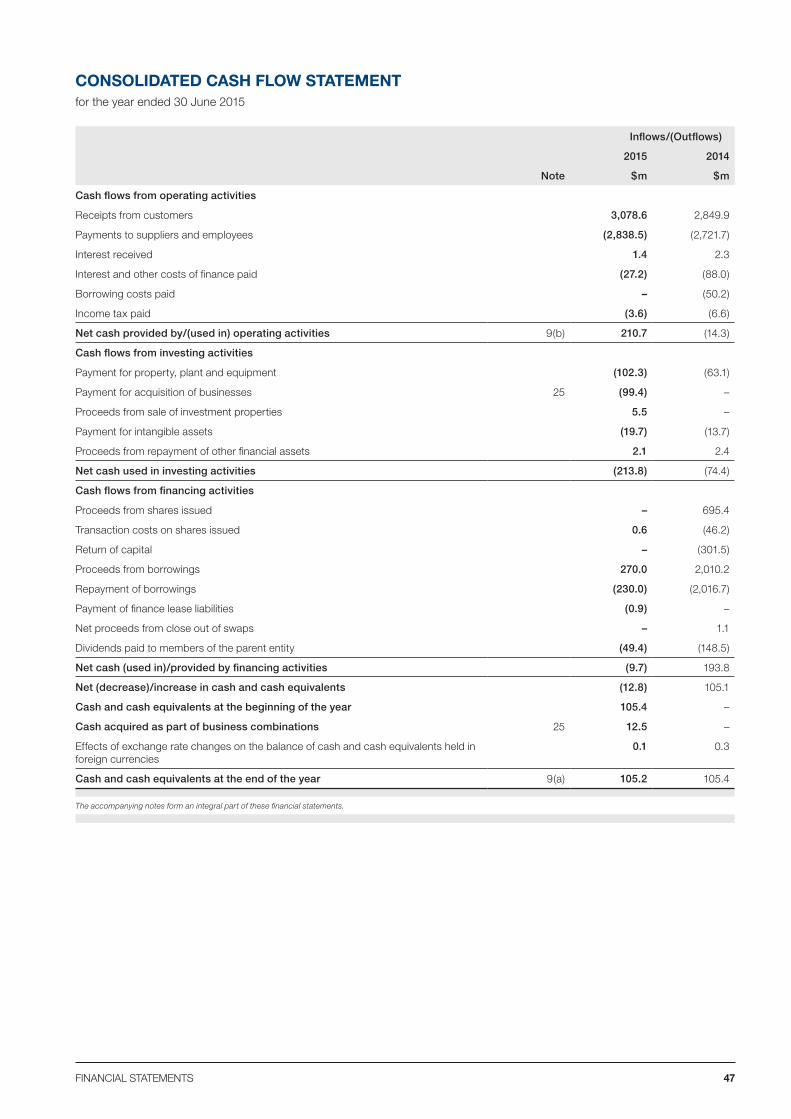
CONSOLIDATED CASH FLOW STATEMENTfor the year ended 30 June 2015
Inflows/(Outflows)
2015 2014
Note $m $m
Cash flows from operating activities
Receipts from customers 3,078.6 2,849.9
Payments to suppliers and employees (2,838.5) (2,721.7)
Interest received 1.4 2.3
Interest and other costs of finance paid (27.2) (88.0)
Borrowing costs paid – (50.2)
Income tax paid (3.6) (6.6)
Net cash provided by/(used in) operating activities 9(b) 210.7 (14.3)
Cash flows from investing activities
Payment for property, plant and equipment (102.3) (63.1)
Payment for acquisition of businesses 25 (99.4) –
Proceeds from sale of investment properties 5.5 –
Payment for intangible assets (19.7) (13.7)
Proceeds from repayment of other financial assets 2.1 2.4
Net cash used in investing activities (213.8) (74.4)
Cash flows from financing activities
Proceeds from shares issued – 695.4
Transaction costs on shares issued 0.6 (46.2)
Return of capital – (301.5)
Proceeds from borrowings 270.0 2,010.2
Repayment of borrowings (230.0) (2,016.7)
Payment of finance lease liabilities (0.9) –
Net proceeds from close out of swaps – 1.1
Dividends paid to members of the parent entity (49.4) (148.5)
Net cash (used in)/provided by financing activities (9.7) 193.8
Net (decrease)/increase in cash and cash equivalents (12.8) 105.1
Cash and cash equivalents at the beginning of the year 105.4 –
Cash acquired as part of business combinations 25 12.5 –
Effects of exchange rate changes on the balance of cash and cash equivalents held in foreign currencies
0.1 0.3
Cash and cash equivalents at the end of the year 9(a) 105.2 105.4
The accompanying notes form an integral part of these financial statements.
47FINANCIAL STATEMENTS

ANNUAL REPORT 2014/201548
Notes to the Consolidated Financial Statements
1. Basis of Preparation
2. Statement of Compliance
3. Summary of Significant Accounting Policies
4. Segment Information
5. Profit from Operations
6. Income Tax
7. Earnings per Share (EPS)
8. Dividends
9. Cash and Cash Equivalents
10. Current Trade and Other Receivables
11. Inventories
12. Property, Plant and Equipment
13 Assets classified as Held for Sale
14. Goodwill
15. Intangible Assets
16. Current Trade and Other Payables
17. Current Borrowings
18. Current Provisions
19. Non-Current Borrowings
20. Non-Current Provisions
21. Reserves
22. Issued Capital
23. Share-based Payment
24. Related Party Disclosures
25. Business Combinations
26. Commitments for Expenditure
27. Contingent Liabilities
28. Leases
29. Remuneration of Auditors
30 Controlled Entities
31. Financial Instruments
32. Events After the Reporting Period
33. Parent Entity Disclosures
49NOTES TO THE CONSOLIDATED FINANCIAL STATEMENTS
1. BASIS OF PREPARATIONThese financial statements are general purpose financial statements which have been prepared in accordance with Australian Accounting Standards (including the Australian Accounting Interpretations), Corporations Act 2001 and other authoritative pronouncements of the Australian Accounting Standards Board (AASB) and comply with other requirements of the law.
The financial statements have been prepared on an historical cost basis, except for the revaluation of certain financial instruments and various assets and liabilities acquired as part of business combinations. Cost is based on the fair values of the consideration given in exchange for assets. Certain comparative information in the financial statements has been reclassified to ensure consistency of presentation. All amounts are presented in Australian dollars, unless otherwise noted.
Spotless Group Holdings Limited is a company of the kind referred to in ASIC Class Order 98/0100, and in accordance with that Class Order amounts in the Directors’ Report and financial statements are rounded to the nearest hundred thousand dollars, unless otherwise indicated.
Spotless Group Holdings Limited is a company limited by shares which are traded on the Australian Securities Exchange. The Company is incorporated and domiciled in Australia. The registered office of the Company is at 549 St Kilda Rd, Melbourne VIC 3004.
The financial statements were authorised for issue by the Directors on 25 August 2015.
2. STATEMENT OF COMPLIANCEThe financial statements of the Consolidated Entity comply with International Financial Reporting Standards (“IFRS”) and Interpretations issued by the International Accounting Standards Board (“IASB”).
3. SUMMARY OF SIGNIFICANT ACCOUNTING POLICIESAdoption of new and revised Accounting Standards
The accounting policies adopted are consistent with those of the previous financial year, including the adoption of Standards and Interpretations that became effective from 1 January 2014 and 1 July 2014:
– AASB 2012-3 ‘Amendments to Australian Accounting Standards – Disclosures – Offsetting Financial Assets and Financial Liabilities’.
– AASB 2013-4 ‘Amendments to Australian Accounting Standards - Novation of Derivatives and Continuation of Hedge Accounting [AASB 139]’.
– AASB 1031 ‘Materiality’.
– AASB 2013-9 ‘Amendments to Australian Accounting Standards - Conceptual Framework, Materiality and Financial Instruments - Part A and B’.
– AASB 2014-1 Part A - ‘Annual Improvements 2011-2013 Cycle - Amendments to Australian Accounting Standards - Part A’.
– AASB 2014-2 Amendments to AASB 1053 - Transition to and between Tiers, and related Tier 2 Disclosure Requirements’.
Adoption of these Standards and Interpretations did not have a material effect for the financial position, performance or cash flows of the Consolidated Entity for the year ended 30 June 2015 and the comparative reporting year.
The Consolidated Entity has not early adopted any other standard, interpretation or amendment that has been issued but is not yet effective.
At the date of authorisation of the financial report, the relevant Standards and Interpretations listed below were on issue but not yet effective. The initial application of these standards and Interpretations is not expected to have a material impact on the financial report of the Consolidated Entity:
– AASB 2014-3 ‘Amendments to Australian Accounting Standards – Accounting for Acquisitions of Interests in Joint Operations [AASB 1 & AASB 11]’. Effective for annual reporting periods beginning on or after 1 January 2016.
– AASB 2014-4 ‘Clarification of Acceptable Methods of Depreciation and Amortisation (Amendments to AASB 116 and AASB 138)’. Effective for annual reporting periods beginning on or after 1 January 2016.
– AASB 2014-9 ‘Amendments to Australian Accounting Standards - Equity Method in Separate Financial Statements’. Effective for annual reporting periods beginning on or after 1 January 2016.
– AASB 2014-10 ‘Amendments to Australian Accounting Standards - Sale or Contribution of Assets between an Investor and its Associate or Joint Venture’. Effective annual reporting periods beginning on or after 1 January 2016.
– AASB 2015-1 ‘Amendments to Australian Accounting Standards - Annual Improvements to Australian Accounting Standards 2012-2014 Cycle’. Effective for annual reporting periods beginning on or after 1 January 2016.
– AASB 2015-2 ‘Amendments to Australian Accounting Standards - Disclosure Initiative: Amendments to AASB 101’. Effective for annual reporting periods beginning on or after 1 January 2016.
– AASB 2015-3 ‘Amendments to Australian Accounting Standards arising from the Withdrawal of AASB 1031 Materiality’. Effective for annual reporting periods beginning on or after 1 July 2015.
ANNUAL REPORT 2014/201550
The potential effect of the initial application of the following Standard has not yet been determined:
– AASB 9 ‘Financial Instruments’. Effective for annual reporting periods beginning on or after 1 January 2018.
– AASB 15 ‘Revenue from Contracts with Customers’. Effective for annual reporting periods beginning on or after 1 January 2018.
The following significant accounting policies have been adopted in the preparation and presentation of the financial statements:
(A) BASIS OF CONSOLIDATION
The consolidated financial statements incorporate the financial statements of the Company (the parent entity) and entities controlled by the Company (its subsidiaries), referred to as the ‘Consolidated Entity’ in these financial statements. Control is achieved where the Company has the power to govern the financial and operating policies of an entity so as to obtain benefits from its activities.
The results of subsidiaries acquired or disposed of during the year are included in the Consolidated Statement of Comprehensive Income from the effective date of acquisition or up to the effective date of disposal, as appropriate. Where necessary, adjustments are made to the financial statements of subsidiaries to bring their accounting policies into line with those used by other members of the Consolidated Entity. In preparing the consolidated financial statements, all intercompany balances and transactions including unrealised profits arising from intra-group transactions, are eliminated in full.
Minority interests not held by the Consolidated Entity are allocated their share of net profit after tax in the Consolidated Statement of Comprehensive Income and are presented within equity in the Consolidated Balance Sheet, separately from parent shareholder’s equity.
The Consolidated Entity accounts for all business combinations using the acquisition method. The cost of a business combination is measured as the aggregate of the fair values (at the date of exchange) of assets given, liabilities incurred or assumed, and equity instruments issued by the Consolidated Entity in exchange for control of the acquiree. Transaction costs directly attributable to the business combination are expensed as incurred. The acquiree’s identifiable assets, liabilities and contingent liabilities that meet the conditions under AASB 3 ‘Business Combinations’ are recognised at their fair values at the acquisition date, except non-current assets (or disposal groups) that are classified as held for sale (which are measured at the lower of their carrying amount and fair value less costs to sell).
(B) BUSINESS COMBINATIONS
Goodwill arising on acquisition is recognised as an asset and initially measured at cost, being the excess of the cost of the business combination over the Consolidated Entity’s interest in the net fair value of the identifiable assets, liabilities and contingent liabilities recognised. If, after reassessment, the Consolidated Entity’s interest in the net fair value of the acquiree’s identifiable assets, liabilities, and contingent liabilities or its value in use exceeds the cost of the business combination, the excess is immediately recognised in Statement of Comprehensive Income.
Contingent consideration is measured at fair value at the acquisition date. Subsequent adjustments to the consideration are recognised against goodwill only to the extent that they arise from better information about the fair value at the acquisition date and they occur within 12 months of the acquisition date. All other subsequent adjustments are recognised in the Statement of Comprehensive Income.
Accounting for acquisitions of non-controlling interestsAcquisitions of non-controlling interests are accounted for as transactions with equity holders in their capacity as equity holders and therefore no goodwill is recognised as a result of such transactions.
(C) FOREIGN CURRENCY
Both the functional currency and presentation currency of Spotless Group Holdings Limited and its Australian subsidiaries are Australian Dollars (AUD).
Transactions in foreign currencies are initially recorded in the functional currency by applying the exchange rates ruling at the date of the transaction. Monetary assets and liabilities denominated in foreign currencies are retranslated at the rate of exchange ruling at the balance sheet date with all differences taken to profit or loss. Non-monetary items that are measured in terms of historical cost in a foreign currency are translated using the exchange rate as at the date of the initial transaction.
Foreign subsidiaries have a functional currency other than Australian Dollars. As at the reporting date, the assets and liabilities of these foreign subsidiaries are translated into the presentation currency of the Consolidated Entity by applying the rate of exchange ruling at the balance sheet date and Statement of Comprehensive Income is translated at the weighted average exchange rate for the reporting period or at the exchange rate ruling at the date of the transaction. The exchange differences arising on the translation are taken to the foreign currency translation reserve.
On disposal of a foreign subsidiary with a functional currency other than Australian Dollars, the deferred cumulative amount recognised in the foreign currency translation reserve relating to that particular subsidiary is recognised in profit or loss.
51NOTES TO THE CONSOLIDATED FINANCIAL STATEMENTS
(D) REVENUE RECOGNITION
Rendering of servicesThe revenue from time and material contracts is recognised at the contractual rates as labour hours are delivered and direct expenses incurred. Life cycle maintenance revenue is based on stage of completion using costs incurred. Where a loss is expected to occur it is recognised immediately.
Revenue from certain long term contracts is recognised by reference to the stage of completion. Stage of completion is measured by reference to costs incurred to date as a percentage of total estimated costs for each contract. When the contract outcome cannot be measured reliably, revenue is recognised only to the extent that the expenses incurred are eligible to be recovered.
Construction contractsThe Consolidated Entity enters into fixed price contracts. If the outcome of such a contract can be reliably measured, revenue associated with the construction contract is recognised by reference to the stage of completion of the contract activity at year end (the percentage of completion method).
The outcome of a construction contract can be estimated reliably when: (i) the total contract revenue can be measured reliably; (ii) it is probable that the economic benefits associated with the contract will flow to the entity; (iii) the costs to complete the contract and the stage of completion can be measured reliably; and (iv) the contract costs attributable to the contract can be clearly identified and measured reliably so that actual contract costs incurred can be compared with prior estimates.
When the outcome of a construction cannot be estimated reliably (principally during early stages of a contract), contract revenue is recognised only to the extent of costs incurred that are expected to be recoverable.
In applying the percentage of completion method, revenue recognised corresponds to the total contract revenue (as defined below) multiplied by the actual completion rate based on the proportion of total contract costs (as defined below) incurred to date and the estimated costs to complete.
Contract revenue — Contract revenue corresponds to the initial amount of revenue agreed in the contract and any variations in contract work, claims and incentive payments to the extent that it is probable that they will result in revenue, and they can be reliably measured.
Contract costs — Contract costs include costs that relate directly to the specific contract and costs that are attributable to contract activity in general and can be allocated to the contract. Costs that relate directly to a specific contract comprise: labour costs; costs of materials used in construction; depreciation of equipment used on the contract; costs of design, and technical assistance that is directly related to the contract.
Pre contract costsPre contract costs are costs necessarily incurred in relation to securing new and existing contracts. Pre contract costs are only capitalised to the extent that it is probable the contract will be secured (or the costs recovered).
Pre contract costs are capitalised to other non-current assets on the balance sheet. They are amortised to the Consolidated Income Statement over the contract period within depreciation expense. Costs are immediately expensed in full to the profit and loss upon notification that the Consolidated Entity has been unsuccessful in securing the contract.
Sale of goodsRevenue from the sale of goods is recognised when the Consolidated Entity has passed the significant risks and rewards of ownership of the goods to the buyer.
Interest revenueInterest revenue is recognised on a time proportionate basis that takes into account the effective interest rate on the financial asset.
Dividend revenueDividend revenue is recognised when the Consolidated Entity’s right to receive payment has been established.
(E) MOBILISATION COSTS
Mobilisation costs are incurred during the set-up and initial establishment of new contracts.
Mobilisation costs are capitalised to other non-current assets on the balance sheet. They are amortised to the Consolidated Income Statement over the contract period within depreciation expense.
(F) INCOME TAX
Current taxCurrent tax is calculated by reference to the amount of income taxes payable or recoverable in respect of the taxable profit or tax loss for the period. It is calculated using tax rates and tax laws that have been enacted or substantively enacted by reporting date. Current tax for current and prior periods is recognised as a liability (or asset) to the extent that it is unpaid (or refundable).
Deferred taxDeferred tax is accounted for using the balance sheet liability method. Temporary differences are differences between the tax base of an asset or liability and its carrying amount in the balance sheet. The tax base of an asset or liability is the amount attributed to that asset or liability for tax purposes.
In principle, deferred tax liabilities are recognised for all taxable temporary differences. Deferred tax assets are recognised to the extent that it is probable that sufficient taxable amounts will be available against which deductible temporary differences or unused tax losses and tax offsets can be utilised. However, deferred tax assets and liabilities are not recognised if the temporary differences giving rise to them arise from the initial recognition of assets and liabilities (other than as a result of a business combination) which affects neither taxable income nor accounting profit.
ANNUAL REPORT 2014/201552
Furthermore, a deferred tax liability is not recognised in relation to taxable temporary differences arising from the initial recognition of goodwill.
Deferred tax liabilities are recognised for taxable temporary differences associated with investments in subsidiaries and associates and interests in joint ventures except where the Consolidated Entity is able to control the reversal of the temporary differences and it is probable that the temporary differences will not reverse in the foreseeable future. Deferred tax assets arising from deductible temporary differences associated with these investments and interests are only recognised to the extent that it is probable that there will be sufficient taxable profits against which to utilise the benefits of the temporary differences and they are expected to reverse in the foreseeable future.
Deferred tax assets and liabilities are measured at the tax rates that are expected to apply to the period(s) when the asset and liability giving rise to them are realised or settled, based on tax rates (and tax laws) that have been enacted or substantively enacted by reporting date. The measurement of deferred tax liabilities and assets reflects the tax consequences that would follow from the manner in which the Consolidated Entity expects, at the reporting date, to recover or settle the carrying amount of its assets and liabilities.
Deferred tax assets and liabilities are offset when they relate to income taxes levied by the same taxation authority and the Consolidated Entity intends to settle its current tax assets and liabilities on a net basis.
Current and deferred tax for the yearCurrent and deferred tax for the year is recognised as an expense or income in the Statement of Comprehensive Income, except when it relates to items credited or debited directly to equity, in which case the deferred tax is also recognised directly in equity, or where it arises from the initial accounting for a business combination, in which case it is taken into account in the determination of goodwill or the excess of net assets over the purchase price.
Tax consolidationThe Company and all its wholly-owned Australian resident entities are part of a tax consolidated group under Australian taxation law. Spotless Group Holdings Limited is the head entity in the tax consolidated group. Tax expense/income, deferred tax liabilities and deferred tax assets arising from temporary differences of the members of the tax consolidated group are recognised in the separate financial statements of the members of the tax consolidated group using the “separate taxpayer within group” approach by reference to the carrying amounts in the separate financial statements of each entity and the tax values applying under tax consolidation.
Current tax liabilities and assets and deferred tax assets arising from unused tax losses and relevant tax credits of the members of the tax consolidated group are recognised by the Company (as head entity in the tax consolidated group).
Due to the existence of a tax funding arrangement between the entities in the tax consolidated group, amounts are
recognised as payable to or receivable by the Company and each member of the group in relation to the tax contribution amounts paid or payable between the parent entity and the other members of the tax consolidated group in accordance with the arrangement. Further information about the tax funding arrangement is detailed in Note 6. Where the tax contribution amount recognised by each member of the tax consolidated group for a particular period is different to the aggregate of the current tax liability or asset and any deferred tax asset arising from unused tax losses and tax credits in respect of that period, the difference is recognised as a contribution from (or distribution to) equity participants.
(G) BORROWING COSTS
Borrowing costs are capitalised where they relate to qualifying assets and are expensed over the asset’s useful life.
(H) CASH AND CASH EQUIVALENTS
Cash and cash equivalents comprise cash on hand, cash in transit, cash in banks and investments in money market instruments. Bank overdrafts are shown within borrowings in current liabilities in the Consolidated Balance Sheet.
(I) FINANCIAL ASSETS
Financial assets at amortised cost and the effective interest rate methodA financial asset is measured at amortised cost if the following conditions are met:
– the objective of the Consolidated Entity’s business model in relation to those instruments is to hold the asset to collect the contractual cash flows;
– the contractual cash flows give rise, on specified dates, to cash flows that are solely payments of principal and interest on the principal outstanding; and
– the Consolidated Entity does not irrevocably elect at initial recognition to measure the instrument at fair value through profit or loss to minimise an accounting mismatch.
Amortised cost instruments are recognised initially at fair value plus any directly attributable transaction costs. Subsequent to initial recognition the carrying amount of amortised cost financial instruments is determined using the effective interest rate method, less any impairment losses.
Financial assets at fair value through other comprehensive incomeAt initial recognition the Consolidated Entity may make an irrevocable election (on an instrument-by-instruments basis) to recognise the change in fair value of investments in equity instruments in other comprehensive income. This election is only permitted for equity instruments that are not held for trading purposes.
These instruments are initially recognised at fair value plus transaction costs. Subsequent to initial recognition, they are measured at fair value and changes therein are recognised in other comprehensive income and presented within equity in the investment revaluation reserve. When an investment is derecognised, the cumulative gain or loss is transferred
53NOTES TO THE CONSOLIDATED FINANCIAL STATEMENTS
directly to retained earnings and is not recognised in profit or loss. Dividends or other distributions received from these investments are recognised in profit and loss when the entity’s right to receive payment or the dividend is established.
(J) INVENTORIES
Inventories are stated at the lower of cost or net realisable value. Costs, including an appropriate portion of fixed and variable overhead expenses, are assigned to inventories using the method most appropriate to each particular class of inventory, with the majority being valued on a first-in-first-out basis. Net realisable value represents the estimated selling price for inventories less all estimated costs of completion and costs necessary to make the sale.
(K) ACCOUNTS PAYABLE
Trade payables and other accounts payable are recognised when the Consolidated Entity becomes obliged to make future payments resulting from the purchase of goods and services.
(L) DERIVATIVE FINANCIAL INSTRUMENTS
The Consolidated Entity has entered into derivative financial instruments to manage its exposure to interest rate and foreign exchange rate risk, including cross currency swaps, interest rate swaps and forward exchange contracts.
Derivatives are initially recognised at fair value at the date a derivative contract is entered into and are subsequently remeasured to their fair value at each reporting date. The resulting gain or loss is recognised in profit or loss immediately unless the derivative is designated and effective as a hedging instrument, in which event, the timing of the recognition in profit or loss depends on the nature of the hedge relationship. The Consolidated Entity designates certain derivatives as either hedges of the fair value of recognised assets or liabilities or firm commitments (fair value hedges), hedges of highly probable forecast transactions.
The fair value of derivatives is presented as a non-current asset or a non-current liability if the remaining maturity of the instrument is more than 12 months and it is not expected to be realised or settled within 12 months.
Derivatives embedded in other financial instruments or other host contracts are treated as separate derivatives when their risks and characteristics are not closely related to those of host contracts and the host contracts are not measured at fair value with changes in the fair value recognised in profit or loss.
At the inception of the hedge relationship the entity documents the relationship between the hedging instrument and the hedged item, along with its risk management objectives and its strategy for undertaking various hedge transactions.
Note 31 contains details of the fair values of the derivative instruments used for debt hedging purposes. Movements in the debt hedging reserve in equity are also detailed in the Statement of Changes in Equity.
The Consolidated Entity has only entered into hedges of the type classified as cash flow hedges. The effective portion of changes in the fair value of derivatives that are designated and qualify as cash flow hedges are deferred in equity in the debt hedging reserve. The gain or loss relating to any ineffective portion is recognised immediately in profit or loss as part of other expenses or other income. Amounts deferred in equity are recycled in profit or loss in the periods when the hedged item is recognised in profit or loss in the same line of the Statement of Comprehensive Income as the recognised hedged item. When the forecast transaction that is hedged results in the recognition of a non-financial asset or non-financial liability, the gains and losses previously deferred in equity are transferred from equity and included in the initial measurement of the cost of the asset or liability.
Hedge accounting is discontinued when the Consolidated Entity revokes the hedging relationship, the hedging instrument expires or is sold, terminated, or exercised, or no longer qualifies for hedge accounting. Any cumulative gain or loss deferred in equity at that time remains in equity and is recognised when the forecast transaction is ultimately recognised in profit or loss. When a forecast transaction is no longer expected to occur, the cumulative gain or loss that was deferred in equity is recognised immediately in profit or loss.
(M) PROPERTY, PLANT AND EQUIPMENT
Property, plant and equipment is stated at cost less accumulated depreciation and any impairment in value. Cost includes expenditure that is directly attributable to the acquisition or construction of the item.
Depreciation is provided on property, plant and equipment, including freehold buildings but excluding land. Depreciation is calculated so as to write off the net cost of each asset over its expected useful life to its estimated residual value. Leasehold interest and leasehold improvements are depreciated over the period of the lease or estimated useful life, whichever is the shorter. The straight line method of depreciation is used for all assets.
The gain or loss arising on disposal or retirement of an item of property, plant and equipment is determined as the difference between the sales proceeds and the carrying amount of the asset and is recognised in the Statement of Comprehensive Income.
The following estimated useful lives are used in the calculation of depreciation:
– Buildings: 50 years
– Plant and equipment: 2–20 years
– Leasehold improvements: 2–25 years
– Laundries Rental Stock: 18 months–5 years
ANNUAL REPORT 2014/201554
Estimated useful lives are reassessed each reporting period. Following initial recognition at cost, land and buildings are carried at cost less any subsequent accumulated depreciation on buildings and accumulated impairment losses.
(N) IMPAIRMENT OF ASSETS
At each reporting date, the Consolidated Entity reviews the carrying amounts of its assets to determine whether there is any indication that those assets have suffered an impairment loss. If any such indication exists, the recoverable amount of the asset is estimated in order to determine the extent of the impairment loss (if any). Where the asset does not generate cash flows that are independent from other assets, the Consolidated Entity estimates the recoverable amount of the cash-generating unit to which the asset belongs.
The recoverable amount of an asset or cash generating unit is the higher of fair value less costs to sell and value in use. In assessing value in use, the estimated future cash flows are discounted to their present value using a pre-tax discount rate that reflects current market assessments of the time value of money and the risks specific to the asset. If the recoverable amount of an asset (or cash-generating unit) is estimated to be less than its carrying amount, the carrying amount of the asset (or cash-generating unit) is reduced to its recoverable amount. An impairment loss is recognised immediately in the profit or loss for the period in which it was incurred.
Where an impairment loss subsequently reverses, the carrying amount of the asset (or cash-generating unit) is increased to the revised estimate of its recoverable amount, but only to the extent that the increased carrying amount does not exceed the carrying amount that would have been determined had no impairment loss been recognised for the asset (or cash-generating unit) in prior years. A reversal of an impairment loss is recognised immediately in profit or loss.
(O) JOINT VENTURE ENTITIES
Interests in jointly controlled entities in which the Consolidated Entity is a venturer (and so has joint control) are accounted for under the equity method in the consolidated financial statements.
(P) LEASED ASSETS
Leases are classified as finance leases when the terms of the lease transfer substantially all the risks and rewards incidental to ownership of the leased asset to the lessee. All other leases are classified as operating leases.
Assets held under finance leases are initially recognised at their fair value or, if lower, at amounts equal to the present value of the minimum lease payments, each determined at the inception of the lease. The corresponding liability to the lessor is included in the Consolidated Balance Sheet as a finance lease obligation.
Finance lease payments are apportioned between finance charges and reduction of the lease obligation so as to achieve a constant rate of interest on the remaining balance of the liability. Finance charges are charged directly against profit or loss. Finance leased assets are amortised on a straight line basis over the estimated useful life of the asset.
Operating lease payments are recognised as an expense on a straight-line basis over the lease term. In the event that lease incentives are received to enter into operating leases, such incentives are recognised as a liability. The aggregate benefits of incentives are recognised as a reduction of rental expense on a straight-line basis.
(Q) NON CURRENT ASSETS HELD FOR SALE
Non-current assets (and disposal groups) classified as held for sale are measured at the lower of carrying amount and fair value less costs to sell.
Non-current assets and disposal groups are classified as held for sale if their carrying amount will be recovered principally through a sale transaction rather than through continuing use. This condition is regarded as met only when the sale is highly probable and the asset (or disposal group) is available for immediate sale in its present condition. Management must be committed to the sale, which should be expected to qualify for recognition as a completed sale within one year from the date of classification.
(R) UPFRONT CATERING RIGHTS
The Consolidated Entity incurs certain upfront contractual payments in order to secure exclusive catering right arrangements with customers. These payments are capitalised to other non-current assets on the Balance Sheet and recognised in the Consolidated Income Statement over the contract period within depreciation expense.
Annual volume related catering right fees are expensed to the profit and loss as catering rights expenses as incurred.
(S) GOODWILL
Goodwill, representing the excess of the cost of an acquisition over the fair value of the identifiable assets, liabilities and contingent liabilities acquired, is recognised as an asset net of impairment and not amortised. A Cash Generating Unit (“CGU”) to which goodwill has been allocated is tested for impairment annually and whenever there is an indication that the goodwill may be impaired. Any impairment is recognised immediately in profit and loss and cannot be subsequently reversed.
(T) INVESTMENTS
Investments in associates are accounted for under the equity method in the consolidated financial statements.
(U) INTANGIBLE ASSETS
Intangible assets acquired in a business combinationIntangible assets acquired in a business combination are identified and recognised separately from goodwill where they satisfy the definition of an intangible asset. Subsequent to initial recognition, intangible assets acquired in a business combination are reported at cost less accumulated amortisation and accumulated impairment losses. Intangible assets acquired in a business combination are assessed to have a finite live and are amortised on a straight-line basis over their estimated useful lives.
55NOTES TO THE CONSOLIDATED FINANCIAL STATEMENTS
Customer ContractsCustomer contracts acquired in business combinations are assessed to have finite lives and are amortised on a straight-line basis over the estimated useful lives of between 7 and 30 years.
Software development costsWhere no internally-generated intangible asset can be recognised, software development expenditure is recognised as an expense in the period as incurred. An intangible asset arising from development (or from the development phase of an internal project) is recognised if, and only if, all of the following have been demonstrated:
– the technical feasibility of completing the intangible asset so that it will be available for use or sale;
– the intention to complete the intangible asset and use or sell it;
– the ability to use or sell the intangible asset;
– how the intangible asset will generate probable future economic benefits;
– the availability of adequate technical, financial and other resources to complete the development and to use or sell the intangible asset; and
– the ability to measure reliably the expenditure attributable to the intangible asset during its development.
The amount initially recognised for software development is the sum of the expenditure incurred from the date when the intangible asset first meets the recognition criteria listed above. When completed, software development will be amortised on a straight-line basis over its estimated useful life. Internally-generated intangible assets are reported at cost less accumulated amortisation and accumulated impairment losses.
The amortisation expense on intangible assets with finite lives are recognised in the statement of comprehensive income as depreciation and amortisation expense.
(V) NON CURRENT OTHER ASSETS
Non current other assets include upfront catering rights, pre contract costs, contract mobilisation costs and other non current assets.
(W) EMPLOYEE BENEFITS
A liability is recognised for benefits accruing to employees in respect of wages and salaries, annual leave, long service leave, sick leave and directors retirement allowances when it is probable that settlement will be required and they are capable of being measured reliably.
Liabilities recognised in respect of short-term employee benefits (including directors retirement allowances) are measured at their nominal values using the remuneration rate expected to apply at the time of settlement.
Liabilities recognised in respect of long-term employee benefits are measured as the present value of the estimated future cash outflows to be made by the Consolidated Entity in respect of services provided by employees up to the reporting date.
Defined contribution plansContributions to defined contribution superannuation plans are expensed when employees have rendered service entitling them to the contributions.
(X) PROVISIONS
Provisions are recognised when the Consolidated Entity has a present obligation (legal or constructive) as a result of a past event, it is probable that the Consolidated Entity will be required to settle the obligation, and a reliable estimate can be made of the amount of the obligation.
The amount recognised as a provision is the best estimate of the consideration required to settle the present obligation at reporting date, taking into account the risks and uncertainties surrounding the obligation. Where a provision is measured using the cash flows estimated to settle the present obligation, its carrying amount is the present value of those cash flows.
When some or all of the economic benefits required to settle a provision are expected to be recovered from a third party, the receivable is recognised as an asset if it is virtually certain that reimbursement will be received and the amount of the receivable can be measured reliably.
Onerous contracts - Present obligations arising under onerous contracts are recognised and measured as a provision. An onerous contract is considered to exist where the Consolidated Entity has a contract under which the unavoidable costs of meeting the obligations under the contract exceed the economic benefits expected to be received under it.
Dividends - A provision is recognised for dividends when they have been declared, determined or publicly recommended by the Directors on or before the balance sheet date.
Public liability - A provision is recognised under the Consolidated Entity’s insurance for claims below the insured excess.
(Y) FINANCIAL INSTRUMENTS ISSUED BY THE CONSOLIDATED ENTITY
Debt and equity instrumentsDebt and equity instruments are classified as either liabilities or as equity in accordance with the substance of the contractual arrangement. An equity instrument is any contract that evidences a residual interest in the assets of an entity after deducting all of its liabilities.
Transaction costs on the issue of equity instrumentsTransaction costs arising on the issue of equity instruments are recognised directly in equity as a reduction of the proceeds of the equity instrument to which the costs relate. Transaction costs are the costs that are incurred directly in connection with the issue of those equity instruments and which would not have been incurred had those instruments not been issued.
ANNUAL REPORT 2014/201556
Financial guarantee contract liabilitiesFinancial guarantee contract liabilities are measured initially at their fair values and subsequently at the higher of: (i) the amount of the obligation under the contract, as determined under AASB 137 ‘Provisions, Contingent Liabilities and Contingent Assets’; and (ii) the amount initially recognised less, where appropriate, cumulative amortisation in accordance with revenue recognition policies described in Note 3(d).
Other LiabilitiesFinancial liabilities, including all loans and borrowings, are initially measured at fair value, net of transaction costs. Financial liabilities are subsequently measured at amortised cost using the effective interest rate method, with interest expense recognised on an effective interest rate method basis.
The effective interest rate method is a method of calculating the amortised cost of a financial liability and of allocating interest expense over the relevant period. The effective interest rate is the rate that exactly discounts the estimated future cash payments through the expected life of the financial liability, or, where appropriate, a shorter period.
(Z) GOODS AND SERVICES TAX
Revenues, expenses and assets are recognised net of the amount of goods and services tax (“GST”), except (i) for receivables and payables which are recognised inclusive of GST; and (ii) where the amount of GST incurred is not recoverable from the taxation authority, it is recognised as part of the cost of acquisition of an asset or as part of an item of expense. The net amount of GST recoverable from, or payable to, the taxation authority is included as part of receivables or payables.
Cash flows are included in the Cash Flow Statement on a gross basis. The GST component of cash flows arising from investing and financing activities which is recoverable from, or payable to, the taxation authority is classified within operating cash flows.
(AA) SHARE-BASED PAYMENT
Share-based payment made to employees and others, that grant rights over the shares of the ultimate parent entity, Spotless Group Holdings Limited, are accounted for as equity-settled share-based payment transactions.
Equity-settled share-based payments with employees and others providing similar services are measured at the fair value of the equity instrument at the grant date. Fair value is measured by use of a binomial model and/or Monte Carlo simulation model.
The fair value determined at the grant date of the equity-settled share-based payments is expensed on a straight-line basis over the vesting period, based on the Consolidated Entity’s estimate of shares that will eventually vest.
For cash-settled share-based payments, a liability equal to the portion of the goods or services received is recognised at the current fair value determined at each reporting date.
(AB) CRITICAL ACCOUNTING ESTIMATES
In the application of the Consolidated Entity’s accounting policies, management is required to make judgements, estimates and assumptions about carrying values of assets and liabilities that are not readily apparent from other sources. The estimates and associated assumptions are based on historical experience and other factors that are considered to be relevant. Actual results may differ from these estimates.
The estimates and underlying assumptions are reviewed on an ongoing basis. Revisions to accounting estimates are recognised in the period in which the estimate is revised if the revision affects only that period, or in the period of the revision and future periods if the revision affects both the current and future periods.
Judgements made by management in the application of the Accounting Standards that have significant effects on the financial statements and estimates with a significant risk of material adjustments in the next year are disclosed, where applicable, in the relevant notes to the financial statements.
Accounting policies are selected and applied in a manner that ensures that the resulting financial information satisfies the concepts of relevance and reliability, thereby ensuring that the substance of the underlying transactions or other events is reported. In accordance with this policy, changes were made to various accounting estimates during the year ended 30 June 2015. The individual impact of these changes is not considered material to net profit after tax.
The following are the key judgements concerning the future, and other key sources of estimation uncertainty at the balance sheet date, that have the most significant effect on the amounts recognised in the consolidated financial statements:
(i) TaxationThe Consolidated Entity has carried forward tax losses of $38.8 million carried on Balance Sheet as a deferred tax asset (Note 6(c)). These continue to be carried on Balance Sheet as the Directors believe it is probable that future taxable profits will be available against which the Consolidated Entity can utilise the benefits therefrom. These losses are also subject to satisfying the loss recoupment rules in the Income Tax Assessment Act 1997.
Uncertainties exist with respect to the interpretation of complex tax regulations, changes in tax laws, and the amount and timing of future taxable income. Given the nature and complexity of existing and terminated contractual agreements, differences arising between the actual results and the assumptions made, or future changes to such assumptions, could necessitate future adjustments to tax income and expense already recorded. The Consolidated Entity establishes provisions, based on reasonable estimates, for possible consequences of audits by the tax authorities of the respective counties in which it operates. The amount of such provisions is based on various factors, such as experience of previous tax audits and differing interpretations of tax regulations by the taxable entity and the responsible tax authority. Such differences in interpretation
57NOTES TO THE CONSOLIDATED FINANCIAL STATEMENTS
may arise for a wide variety of issues depending on the conditions prevailing in the respective domicile of the Consolidated Entity companies.
(ii) Useful lives of acquired customer contractsCustomer contracts are carried on Balance Sheet at their fair value at the acquisition date net of accumulated amortisation (Note 15). These intangibles are amortised on a straight line basis over the average contract term of the customer portfolio. The contract term and amortisation period has been based on historical experience and management expectations on the renewal profiles.
(iii) Long Service LeaveThe liability for long service leave is recognised and measured at the present value of the estimated future cash flows to be made in respect of all employees at balance date. In determining the present value of the liability, attrition rates and pay increases through promotion and inflation have been taken into account. During the year the G100 in conjunction with the major audit firms amended their views on allowing the use of corporate bond rates for discounting long service leave provisions. As a result the Consolidated Entity has updated its long service leave model to incorporate this change as well as updating other factors including probability and staff retention rates. These changes resulted in a net $1.5m reduction in the long service leave provision and a $1.0m increase to net profit after tax.
(iv) Environmental ProvisioningThe Consolidated Entity intends to restore and remediate certain Laundry properties. The provision for remediation is based on assessments by the Directors supported by external advisors. As remediation progresses, actual costs are being monitored against the estimated provisions made.
(v) Property Make-Good The Consolidated Entity has made assumptions in arriving at their best estimate of the likely costs to “make good” premises which are currently occupied under operating leases or at customers’ premises. Such estimates involve management forecasting the average restoration cost and are dependent on the nature of the premises occupied. During the year, the Consolidated Entity reduced its property make good provisions by $7.6m following a review of contractual make good obligations and actual make good expenditure incurred during the year, the renegotiation of existing leases and the exit of certain leases. This resulted in a $5.3m increase to net profit after tax.
(vi) Onerous contractsThe Consolidated Entity has recognised provisions for various contracts assessed as being onerous as at balance date. The provisions have been calculated based on management’s best estimate of discounted net cash outflows required to fulfil the contracts. The status of these contracts and the adequacy of provisions will be assessed at each reporting date.
(vii) Long-term contract revenue recognitionThe Consolidated Entity has a limited number of long-term maintenance contracts that are engaged in a suite of related services under the one contract. The Consolidated Entity distinguishes between these revenue streams with respect to revenue recognition. Planned maintenance services revenue is recognised based on services completed. Life cycle maintenance revenue is based on stage of completion based on costs incurred. In recognising the revenue the Consolidated Entity periodically re-forecasts the estimated total contract costs based on the different stage of completion of the contract.
(viii) Impairment of goodwill and intangibles (including software development costs)Determining whether goodwill and intangibles (including software development costs) is impaired requires an estimation of the higher of fair value less cost to sell or value in use of the CGUs to which goodwill has been allocated. The value in use calculation requires the Consolidated Entity to estimate the future cash flows expected to arise from the CGU and a suitable discount rate in order to calculate present value.
(ix) Estimation of useful lives and residual values of property, plant and equipmentThe estimation of the useful lives and residual of values of assets has been based on historical experience as well as manufacturers’ warranties (for plant and equipment), lease terms (for leased equipment) and turnover policies. In addition, the condition of the assets is assessed at least once per year and considered against the remaining useful life. Adjustments to useful lives and residual of values are made when considered necessary.
(x) Provisional Purchase Price AccountingPurchase Price Accounting for the acquisitions made during the year ended 30 June 2015 remains provisional at year end. Note 25 details the fair value of assets and liabilities acquired.
ANNUAL REPORT 2014/201558
4. SEGMENT INFORMATIONThe Consolidated Entity’s operating segments under AASB 8 are as follows and are determined based on the nature of services provided to customers:
Facility Services: provides multi-faceted facilities management, cleaning and catering services to a wide range of industries across Australia and New Zealand.
Laundry Services: provides linen and uniform laundry services to a broad range of customers.
The accounting policies of the operating segments are the same as the Consolidated Entity’s accounting policies.
The segment result represents the profit earned by each segment excluding unallocated corporate administration costs, depreciation and amortisation, transaction and restructuring costs (including share based payment expense), net finance costs and income tax benefit.
External Sales Segment Result
2015 2014 2015 2014
Operating segments $m $m $m $m
Facility Services 2,594.7 2,365.0 268.1 215.3
Laundries 278.2 255.3 87.2 77.2
Total Operating Segments 2,872.9 2,620.3 355.3 292.5
Unallocated corporate administration costs (36.6) (39.3)
Earnings before interest, tax, depreciation, amortisation (EBITDA) and transaction and restructuring costs 318.7 253.2
Depreciation and amortisation (78.4) (63.9)
Earnings before interest and tax (EBIT) and transaction and restructuring costs 240.3 189.3
Transaction and restructuring costs (2.3) (67.3)
Earnings before interest and tax (EBIT) 238.0 122.0
Net finance costs (34.0) (95.1)
Write off of borrowing costs – (74.7)
Profit/(Loss) before income tax benefit 204.0 (47.8)
Income tax (expense)/benefit (61.2) 13.1
Profit/(Loss) for the year 142.8 (34.7)
2015 2014
Geographic information $m $m
Revenue by geography
Australia 2,477.6 2,219.6
New Zealand 395.3 400.7
Total revenue 2,872.9 2,620.3
The revenue information above is based on the location of the customer.
Non-current assets
Australia 1,254.3 1,108.2
New Zealand 79.5 78.8
Total 1,333.8 1,187.0
Non-current assets for this purpose consist of property, plant and equipment, goodwill and intangible assets.
Revenue by customer sector
Health, Education and Government 1,134.1 945.4
Commercial and Leisure 863.8 742.4
Base and Township 596.8 677.2
Laundries 278.2 255.3
Total revenue 2,872.9 2,620.3
59NOTES TO THE CONSOLIDATED FINANCIAL STATEMENTS
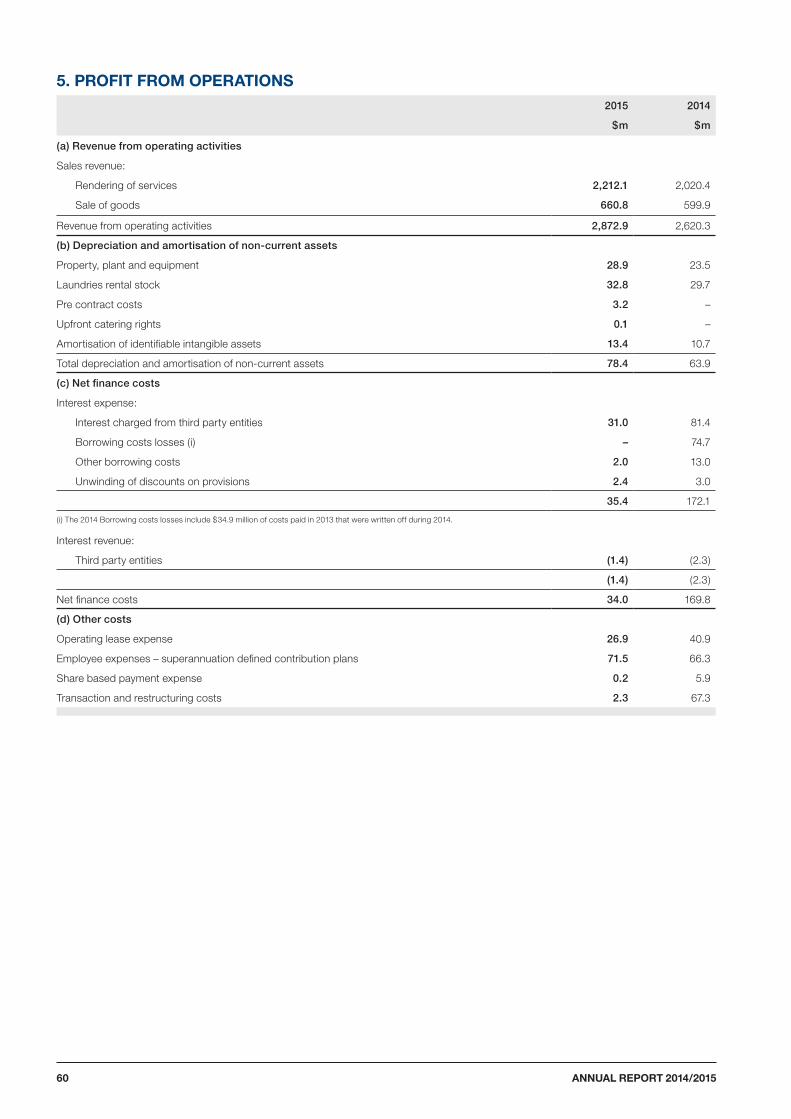
5. PROFIT FROM OPERATIONS 2015 2014
$m $m
(a) Revenue from operating activities
Sales revenue:
Rendering of services 2,212.1 2,020.4
Sale of goods 660.8 599.9
Revenue from operating activities 2,872.9 2,620.3
(b) Depreciation and amortisation of non-current assets
Property, plant and equipment 28.9 23.5
Laundries rental stock 32.8 29.7
Pre contract costs 3.2 –
Upfront catering rights 0.1 –
Amortisation of identifiable intangible assets 13.4 10.7
Total depreciation and amortisation of non-current assets 78.4 63.9
(c) Net finance costs
Interest expense:
Interest charged from third party entities 31.0 81.4
Borrowing costs losses (i) – 74.7
Other borrowing costs 2.0 13.0
Unwinding of discounts on provisions 2.4 3.0
35.4 172.1
(i) The 2014 Borrowing costs losses include $34.9 million of costs paid in 2013 that were written off during 2014.
Interest revenue:
Third party entities (1.4) (2.3)
(1.4) (2.3)
Net finance costs 34.0 169.8
(d) Other costs
Operating lease expense 26.9 40.9
Employee expenses – superannuation defined contribution plans 71.5 66.3
Share based payment expense 0.2 5.9
Transaction and restructuring costs 2.3 67.3
ANNUAL REPORT 2014/201560
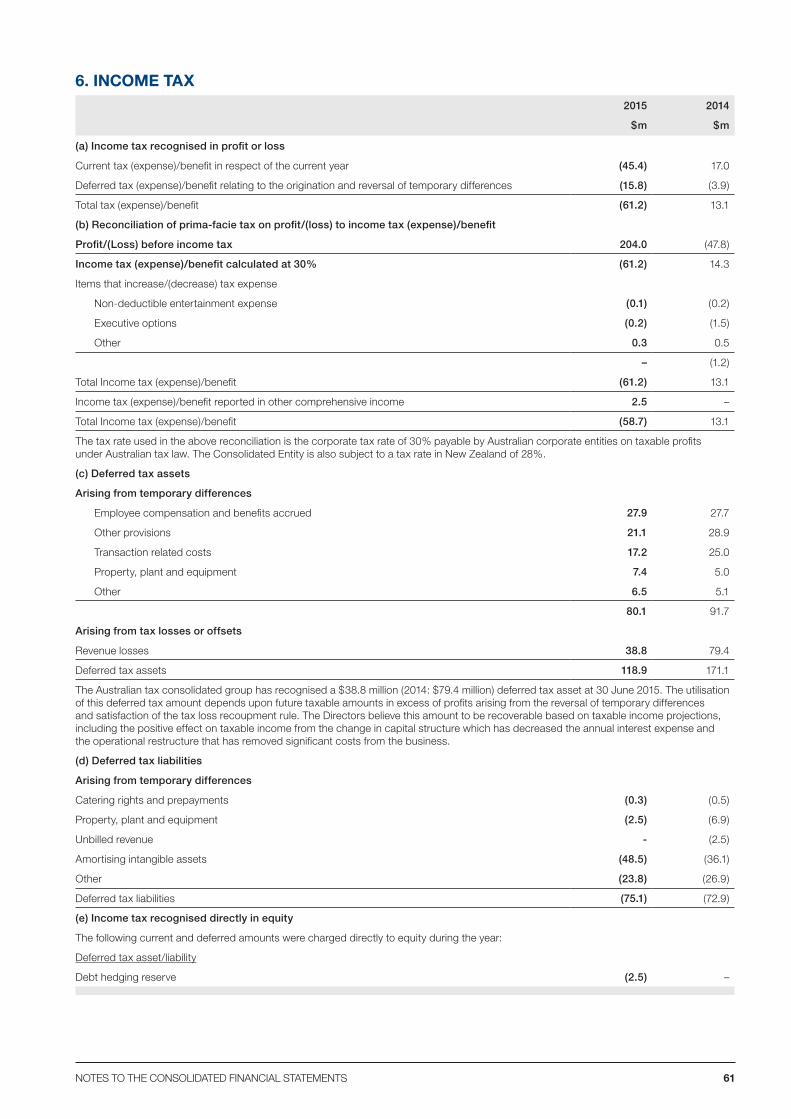
6. INCOME TAX 2015 2014
$m $m
(a) Income tax recognised in profit or loss
Current tax (expense)/benefit in respect of the current year (45.4) 17.0
Deferred tax (expense)/benefit relating to the origination and reversal of temporary differences (15.8) (3.9)
Total tax (expense)/benefit (61.2) 13.1
(b) Reconciliation of prima-facie tax on profit/(loss) to income tax (expense)/benefit
Profit/(Loss) before income tax 204.0 (47.8)
Income tax (expense)/benefit calculated at 30% (61.2) 14.3
Items that increase/(decrease) tax expense
Non-deductible entertainment expense (0.1) (0.2)
Executive options (0.2) (1.5)
Other 0.3 0.5
– (1.2)
Total Income tax (expense)/benefit (61.2) 13.1
Income tax (expense)/benefit reported in other comprehensive income 2.5 –
Total Income tax (expense)/benefit (58.7) 13.1
The tax rate used in the above reconciliation is the corporate tax rate of 30% payable by Australian corporate entities on taxable profits under Australian tax law. The Consolidated Entity is also subject to a tax rate in New Zealand of 28%.
(c) Deferred tax assets
Arising from temporary differences
Employee compensation and benefits accrued 27.9 27.7
Other provisions 21.1 28.9
Transaction related costs 17.2 25.0
Property, plant and equipment 7.4 5.0
Other 6.5 5.1
80.1 91.7
Arising from tax losses or offsets
Revenue losses 38.8 79.4
Deferred tax assets 118.9 171.1
The Australian tax consolidated group has recognised a $38.8 million (2014: $79.4 million) deferred tax asset at 30 June 2015. The utilisation of this deferred tax amount depends upon future taxable amounts in excess of profits arising from the reversal of temporary differences and satisfaction of the tax loss recoupment rule. The Directors believe this amount to be recoverable based on taxable income projections, including the positive effect on taxable income from the change in capital structure which has decreased the annual interest expense and the operational restructure that has removed significant costs from the business.
(d) Deferred tax liabilities
Arising from temporary differences
Catering rights and prepayments (0.3) (0.5)
Property, plant and equipment (2.5) (6.9)
Unbilled revenue - (2.5)
Amortising intangible assets (48.5) (36.1)
Other (23.8) (26.9)
Deferred tax liabilities (75.1) (72.9)
(e) Income tax recognised directly in equity
The following current and deferred amounts were charged directly to equity during the year:
Deferred tax asset/liability
Debt hedging reserve (2.5) –
61NOTES TO THE CONSOLIDATED FINANCIAL STATEMENTS
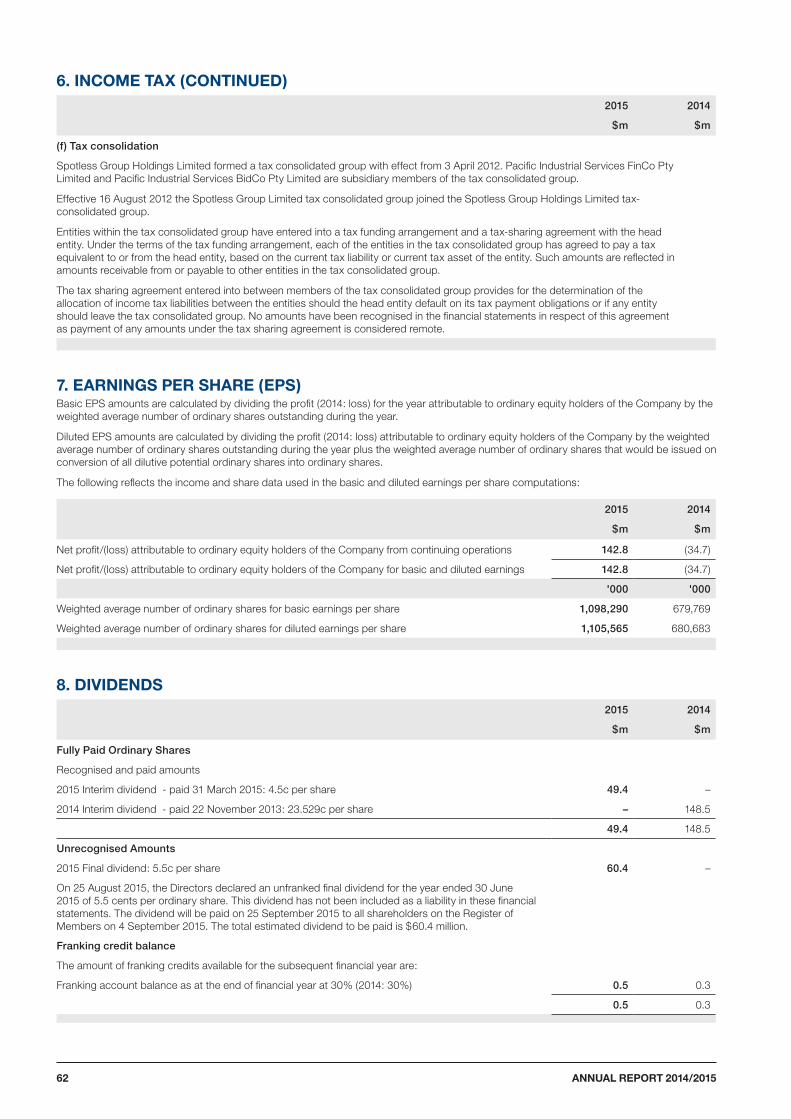
6. INCOME TAX (CONTINUED)2015 2014
$m $m
(f) Tax consolidation
Spotless Group Holdings Limited formed a tax consolidated group with effect from 3 April 2012. Pacific Industrial Services FinCo Pty Limited and Pacific Industrial Services BidCo Pty Limited are subsidiary members of the tax consolidated group.
Effective 16 August 2012 the Spotless Group Limited tax consolidated group joined the Spotless Group Holdings Limited tax-consolidated group.
Entities within the tax consolidated group have entered into a tax funding arrangement and a tax-sharing agreement with the head entity. Under the terms of the tax funding arrangement, each of the entities in the tax consolidated group has agreed to pay a tax equivalent to or from the head entity, based on the current tax liability or current tax asset of the entity. Such amounts are reflected in amounts receivable from or payable to other entities in the tax consolidated group.
The tax sharing agreement entered into between members of the tax consolidated group provides for the determination of the allocation of income tax liabilities between the entities should the head entity default on its tax payment obligations or if any entity should leave the tax consolidated group. No amounts have been recognised in the financial statements in respect of this agreement as payment of any amounts under the tax sharing agreement is considered remote.
7. EARNINGS PER SHARE (EPS)Basic EPS amounts are calculated by dividing the profit (2014: loss) for the year attributable to ordinary equity holders of the Company by the weighted average number of ordinary shares outstanding during the year.
Diluted EPS amounts are calculated by dividing the profit (2014: loss) attributable to ordinary equity holders of the Company by the weighted average number of ordinary shares outstanding during the year plus the weighted average number of ordinary shares that would be issued on conversion of all dilutive potential ordinary shares into ordinary shares.
The following reflects the income and share data used in the basic and diluted earnings per share computations:
2015 2014
$m $m
Net profit/(loss) attributable to ordinary equity holders of the Company from continuing operations 142.8 (34.7)
Net profit/(loss) attributable to ordinary equity holders of the Company for basic and diluted earnings 142.8 (34.7)
'000 '000
Weighted average number of ordinary shares for basic earnings per share 1,098,290 679,769
Weighted average number of ordinary shares for diluted earnings per share 1,105,565 680,683
8. DIVIDENDS2015 2014
$m $m
Fully Paid Ordinary Shares
Recognised and paid amounts
2015 Interim dividend - paid 31 March 2015: 4.5c per share 49.4 –
2014 Interim dividend - paid 22 November 2013: 23.529c per share – 148.5
49.4 148.5
Unrecognised Amounts
2015 Final dividend: 5.5c per share 60.4 –
On 25 August 2015, the Directors declared an unfranked final dividend for the year ended 30 June 2015 of 5.5 cents per ordinary share. This dividend has not been included as a liability in these financial statements. The dividend will be paid on 25 September 2015 to all shareholders on the Register of Members on 4 September 2015. The total estimated dividend to be paid is $60.4 million.
Franking credit balance
The amount of franking credits available for the subsequent financial year are:
Franking account balance as at the end of financial year at 30% (2014: 30%) 0.5 0.3
0.5 0.3
ANNUAL REPORT 2014/201562
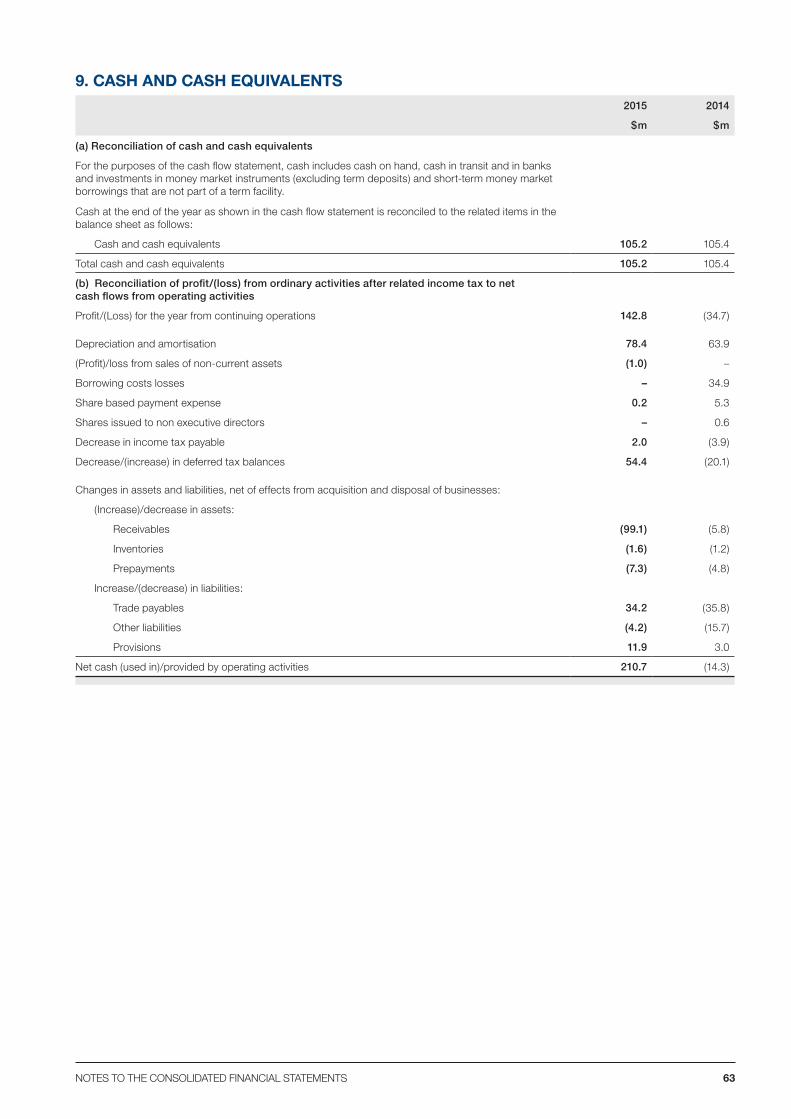
9. CASH AND CASH EQUIVALENTS2015 2014
$m $m
(a) Reconciliation of cash and cash equivalents
For the purposes of the cash flow statement, cash includes cash on hand, cash in transit and in banks and investments in money market instruments (excluding term deposits) and short-term money market borrowings that are not part of a term facility.
Cash at the end of the year as shown in the cash flow statement is reconciled to the related items in the balance sheet as follows:
Cash and cash equivalents 105.2 105.4
Total cash and cash equivalents 105.2 105.4
(b) Reconciliation of profit/(loss) from ordinary activities after related income tax to net cash flows from operating activities
Profit/(Loss) for the year from continuing operations 142.8 (34.7)
Depreciation and amortisation 78.4 63.9
(Profit)/loss from sales of non-current assets (1.0) –
Borrowing costs losses – 34.9
Share based payment expense 0.2 5.3
Shares issued to non executive directors – 0.6
Decrease in income tax payable 2.0 (3.9)
Decrease/(increase) in deferred tax balances 54.4 (20.1)
Changes in assets and liabilities, net of effects from acquisition and disposal of businesses:
(Increase)/decrease in assets:
Receivables (99.1) (5.8)
Inventories (1.6) (1.2)
Prepayments (7.3) (4.8)
Increase/(decrease) in liabilities:
Trade payables 34.2 (35.8)
Other liabilities (4.2) (15.7)
Provisions 11.9 3.0
Net cash (used in)/provided by operating activities 210.7 (14.3)
63NOTES TO THE CONSOLIDATED FINANCIAL STATEMENTS
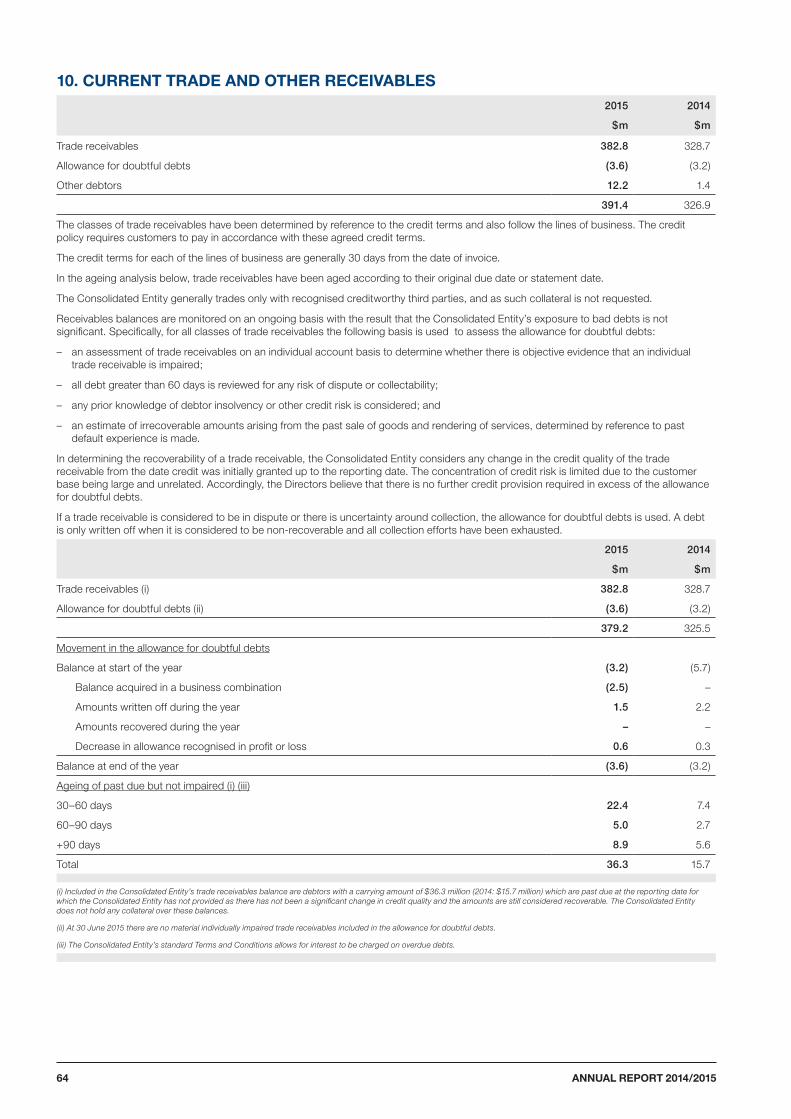
10. CURRENT TRADE AND OTHER RECEIVABLES2015 2014
$m $m
Trade receivables 382.8 328.7
Allowance for doubtful debts (3.6) (3.2)
Other debtors 12.2 1.4
391.4 326.9
The classes of trade receivables have been determined by reference to the credit terms and also follow the lines of business. The credit policy requires customers to pay in accordance with these agreed credit terms.
The credit terms for each of the lines of business are generally 30 days from the date of invoice.
In the ageing analysis below, trade receivables have been aged according to their original due date or statement date.
The Consolidated Entity generally trades only with recognised creditworthy third parties, and as such collateral is not requested.
Receivables balances are monitored on an ongoing basis with the result that the Consolidated Entity’s exposure to bad debts is not significant. Specifically, for all classes of trade receivables the following basis is used to assess the allowance for doubtful debts:
– an assessment of trade receivables on an individual account basis to determine whether there is objective evidence that an individual trade receivable is impaired;
– all debt greater than 60 days is reviewed for any risk of dispute or collectability;
– any prior knowledge of debtor insolvency or other credit risk is considered; and
– an estimate of irrecoverable amounts arising from the past sale of goods and rendering of services, determined by reference to past default experience is made.
In determining the recoverability of a trade receivable, the Consolidated Entity considers any change in the credit quality of the trade receivable from the date credit was initially granted up to the reporting date. The concentration of credit risk is limited due to the customer base being large and unrelated. Accordingly, the Directors believe that there is no further credit provision required in excess of the allowance for doubtful debts.
If a trade receivable is considered to be in dispute or there is uncertainty around collection, the allowance for doubtful debts is used. A debt is only written off when it is considered to be non-recoverable and all collection efforts have been exhausted.
2015 2014
$m $m
Trade receivables (i) 382.8 328.7
Allowance for doubtful debts (ii) (3.6) (3.2)
379.2 325.5
Movement in the allowance for doubtful debts
Balance at start of the year (3.2) (5.7)
Balance acquired in a business combination (2.5) –
Amounts written off during the year 1.5 2.2
Amounts recovered during the year – –
Decrease in allowance recognised in profit or loss 0.6 0.3
Balance at end of the year (3.6) (3.2)
Ageing of past due but not impaired (i) (iii)
30–60 days 22.4 7.4
60–90 days 5.0 2.7
+90 days 8.9 5.6
Total 36.3 15.7
(i) Included in the Consolidated Entity’s trade receivables balance are debtors with a carrying amount of $36.3 million (2014: $15.7 million) which are past due at the reporting date for which the Consolidated Entity has not provided as there has not been a significant change in credit quality and the amounts are still considered recoverable. The Consolidated Entity does not hold any collateral over these balances.
(ii) At 30 June 2015 there are no material individually impaired trade receivables included in the allowance for doubtful debts.
(iii) The Consolidated Entity’s standard Terms and Conditions allows for interest to be charged on overdue debts.
ANNUAL REPORT 2014/201564
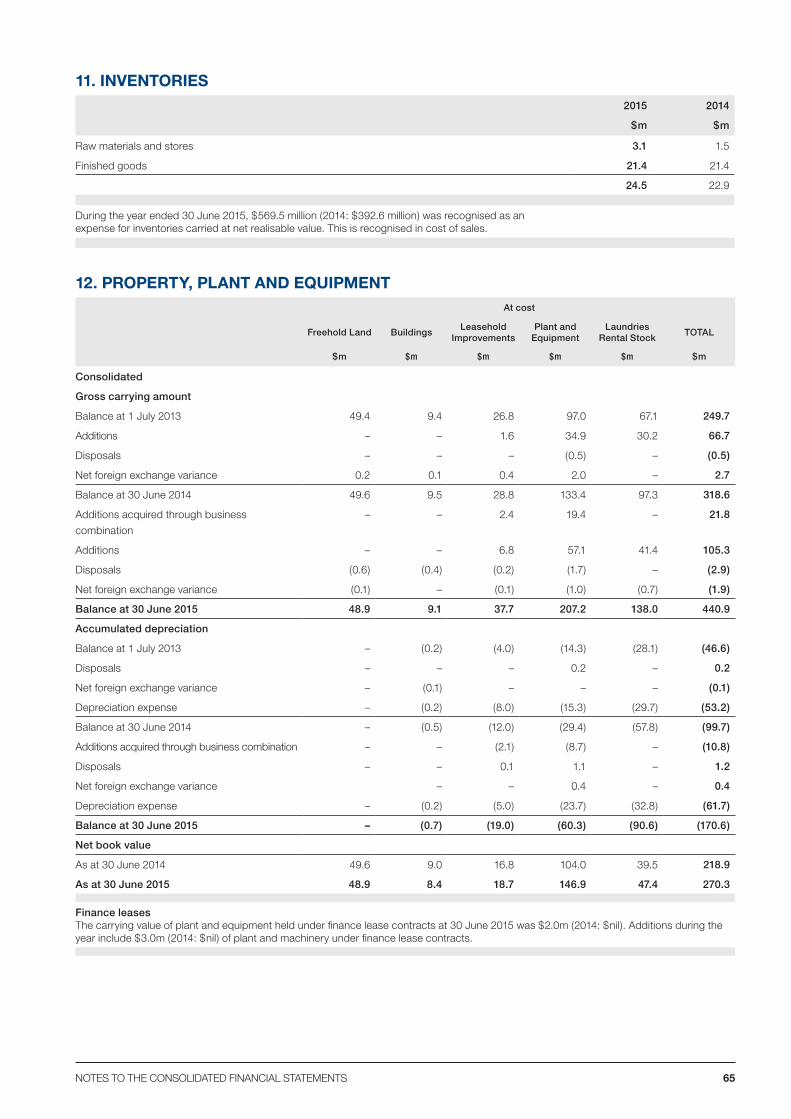
11. INVENTORIES2015 2014
$m $m
Raw materials and stores 3.1 1.5
Finished goods 21.4 21.4
24.5 22.9
During the year ended 30 June 2015, $569.5 million (2014: $392.6 million) was recognised as an expense for inventories carried at net realisable value. This is recognised in cost of sales.
12. PROPERTY, PLANT AND EQUIPMENTAt cost
Freehold Land BuildingsLeasehold
ImprovementsPlant and
EquipmentLaundries
Rental StockTOTAL
$m $m $m $m $m $m
Consolidated
Gross carrying amount
Balance at 1 July 2013 49.4 9.4 26.8 97.0 67.1 249.7
Additions – – 1.6 34.9 30.2 66.7
Disposals – – – (0.5) – (0.5)
Net foreign exchange variance 0.2 0.1 0.4 2.0 – 2.7
Balance at 30 June 2014 49.6 9.5 28.8 133.4 97.3 318.6
Additions acquired through business
combination
– – 2.4 19.4 – 21.8
Additions – – 6.8 57.1 41.4 105.3
Disposals (0.6) (0.4) (0.2) (1.7) – (2.9)
Net foreign exchange variance (0.1) – (0.1) (1.0) (0.7) (1.9)
Balance at 30 June 2015 48.9 9.1 37.7 207.2 138.0 440.9
Accumulated depreciation
Balance at 1 July 2013 – (0.2) (4.0) (14.3) (28.1) (46.6)
Disposals – – – 0.2 – 0.2
Net foreign exchange variance – (0.1) – – – (0.1)
Depreciation expense – (0.2) (8.0) (15.3) (29.7) (53.2)
Balance at 30 June 2014 – (0.5) (12.0) (29.4) (57.8) (99.7)
Additions acquired through business combination – – (2.1) (8.7) – (10.8)
Disposals – – 0.1 1.1 – 1.2
Net foreign exchange variance – – 0.4 – 0.4
Depreciation expense – (0.2) (5.0) (23.7) (32.8) (61.7)
Balance at 30 June 2015 – (0.7) (19.0) (60.3) (90.6) (170.6)
Net book value
As at 30 June 2014 49.6 9.0 16.8 104.0 39.5 218.9
As at 30 June 2015 48.9 8.4 18.7 146.9 47.4 270.3
Finance leasesThe carrying value of plant and equipment held under finance lease contracts at 30 June 2015 was $2.0m (2014: $nil). Additions during the year include $3.0m (2014: $nil) of plant and machinery under finance lease contracts.
65NOTES TO THE CONSOLIDATED FINANCIAL STATEMENTS
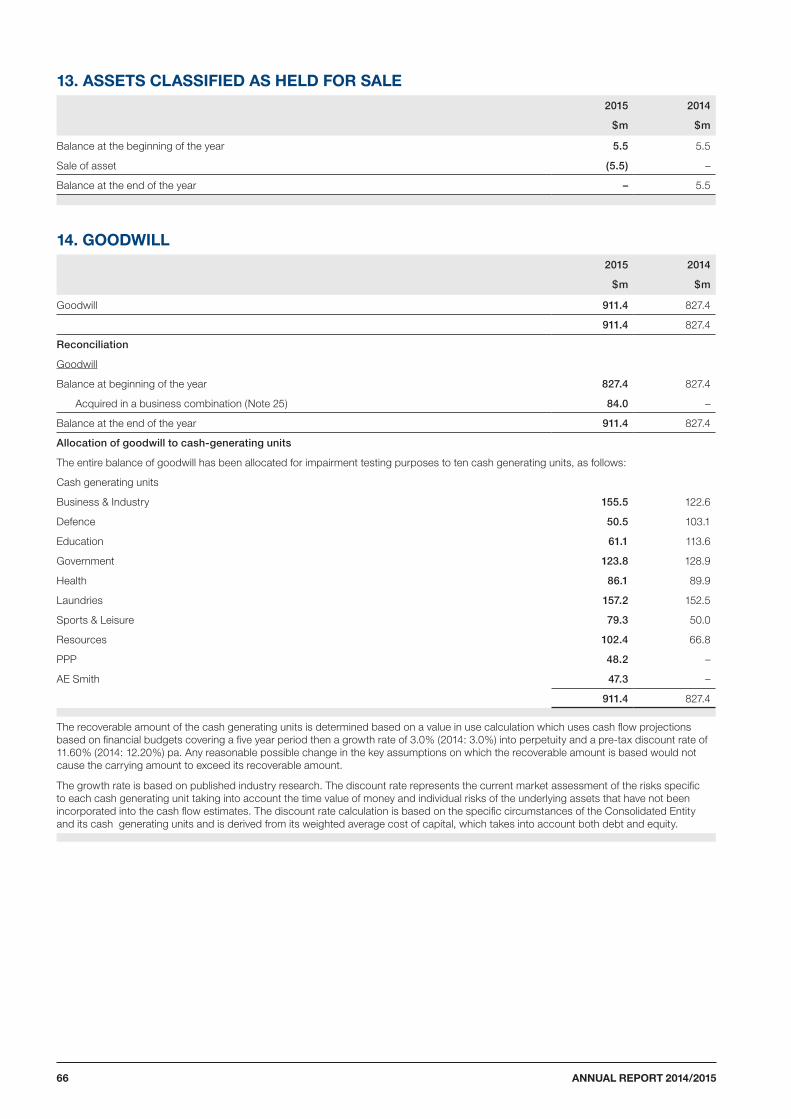
13. ASSETS CLASSIFIED AS HELD FOR SALE 2015 2014
$m $m
Balance at the beginning of the year 5.5 5.5
Sale of asset (5.5) –
Balance at the end of the year – 5.5
14. GOODWILL 2015 2014
$m $m
Goodwill 911.4 827.4
911.4 827.4
Reconciliation
Goodwill
Balance at beginning of the year 827.4 827.4
Acquired in a business combination (Note 25) 84.0 –
Balance at the end of the year 911.4 827.4
Allocation of goodwill to cash-generating units
The entire balance of goodwill has been allocated for impairment testing purposes to ten cash generating units, as follows:
Cash generating units
Business & Industry 155.5 122.6
Defence 50.5 103.1
Education 61.1 113.6
Government 123.8 128.9
Health 86.1 89.9
Laundries 157.2 152.5
Sports & Leisure 79.3 50.0
Resources 102.4 66.8
PPP 48.2 –
AE Smith 47.3 –
911.4 827.4
The recoverable amount of the cash generating units is determined based on a value in use calculation which uses cash flow projections based on financial budgets covering a five year period then a growth rate of 3.0% (2014: 3.0%) into perpetuity and a pre-tax discount rate of 11.60% (2014: 12.20%) pa. Any reasonable possible change in the key assumptions on which the recoverable amount is based would not cause the carrying amount to exceed its recoverable amount.
The growth rate is based on published industry research. The discount rate represents the current market assessment of the risks specific to each cash generating unit taking into account the time value of money and individual risks of the underlying assets that have not been incorporated into the cash flow estimates. The discount rate calculation is based on the specific circumstances of the Consolidated Entity and its cash generating units and is derived from its weighted average cost of capital, which takes into account both debt and equity.
ANNUAL REPORT 2014/201566
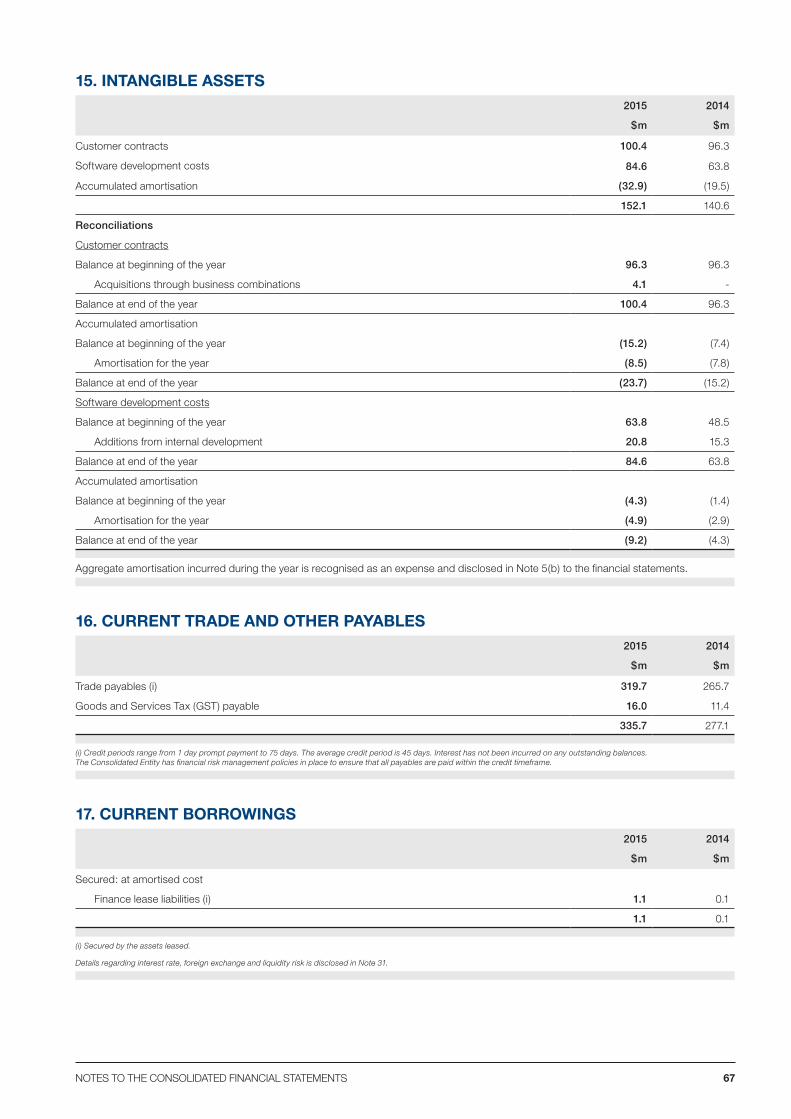
15. INTANGIBLE ASSETS 2015 2014
$m $m
Customer contracts 100.4 96.3
Software development costs 84.6 63.8
Accumulated amortisation (32.9) (19.5)
152.1 140.6
Reconciliations
Customer contracts
Balance at beginning of the year 96.3 96.3
Acquisitions through business combinations 4.1 -
Balance at end of the year 100.4 96.3
Accumulated amortisation
Balance at beginning of the year (15.2) (7.4)
Amortisation for the year (8.5) (7.8)
Balance at end of the year (23.7) (15.2)
Software development costs
Balance at beginning of the year 63.8 48.5
Additions from internal development 20.8 15.3
Balance at end of the year 84.6 63.8
Accumulated amortisation
Balance at beginning of the year (4.3) (1.4)
Amortisation for the year (4.9) (2.9)
Balance at end of the year (9.2) (4.3)
Aggregate amortisation incurred during the year is recognised as an expense and disclosed in Note 5(b) to the financial statements.
16. CURRENT TRADE AND OTHER PAYABLES 2015 2014
$m $m
Trade payables (i) 319.7 265.7
Goods and Services Tax (GST) payable 16.0 11.4
335.7 277.1
(i) Credit periods range from 1 day prompt payment to 75 days. The average credit period is 45 days. Interest has not been incurred on any outstanding balances. The Consolidated Entity has financial risk management policies in place to ensure that all payables are paid within the credit timeframe.
17. CURRENT BORROWINGS 2015 2014
$m $m
Secured: at amortised cost
Finance lease liabilities (i) 1.1 0.1
1.1 0.1
(i) Secured by the assets leased.
Details regarding interest rate, foreign exchange and liquidity risk is disclosed in Note 31.
67NOTES TO THE CONSOLIDATED FINANCIAL STATEMENTS
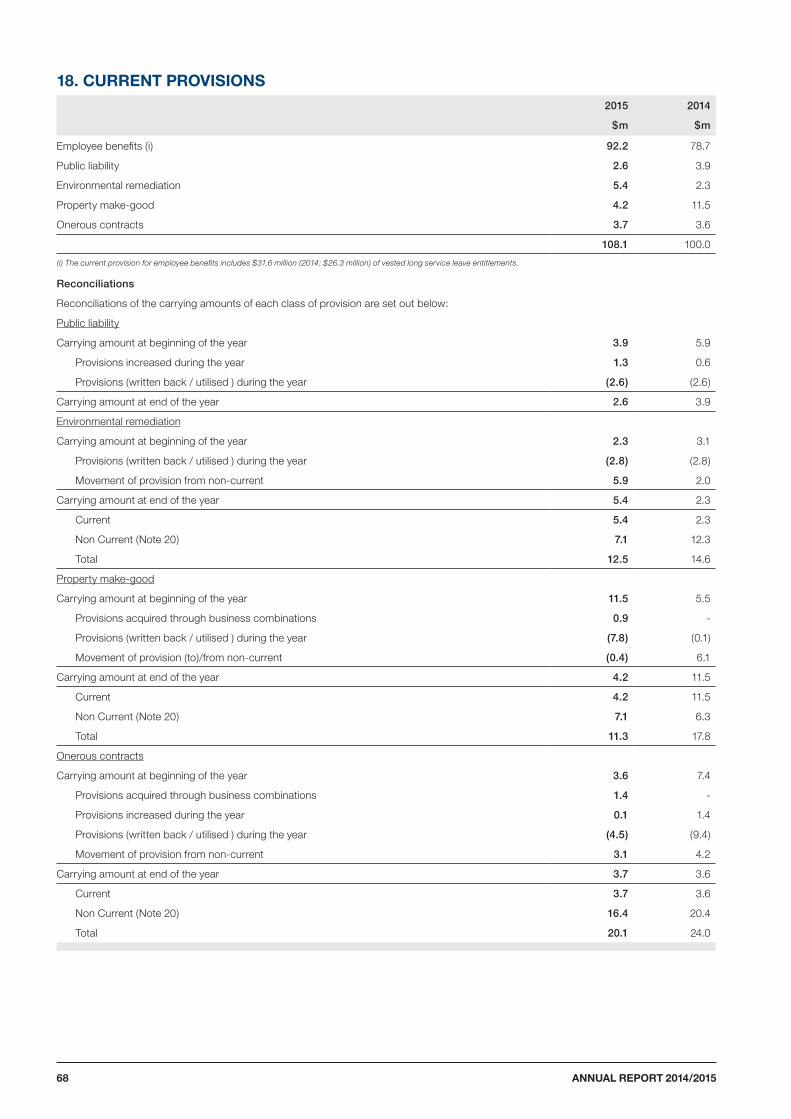
18. CURRENT PROVISIONS 2015 2014
$m $m
Employee benefits (i) 92.2 78.7
Public liability 2.6 3.9
Environmental remediation 5.4 2.3
Property make-good 4.2 11.5
Onerous contracts 3.7 3.6
108.1 100.0
(i) The current provision for employee benefits includes $31.6 million (2014: $26.3 million) of vested long service leave entitlements.
Reconciliations
Reconciliations of the carrying amounts of each class of provision are set out below:
Public liability
Carrying amount at beginning of the year 3.9 5.9
Provisions increased during the year 1.3 0.6
Provisions (written back / utilised ) during the year (2.6) (2.6)
Carrying amount at end of the year 2.6 3.9
Environmental remediation
Carrying amount at beginning of the year 2.3 3.1
Provisions (written back / utilised ) during the year (2.8) (2.8)
Movement of provision from non-current 5.9 2.0
Carrying amount at end of the year 5.4 2.3
Current 5.4 2.3
Non Current (Note 20) 7.1 12.3
Total 12.5 14.6
Property make-good
Carrying amount at beginning of the year 11.5 5.5
Provisions acquired through business combinations 0.9 -
Provisions (written back / utilised ) during the year (7.8) (0.1)
Movement of provision (to)/from non-current (0.4) 6.1
Carrying amount at end of the year 4.2 11.5
Current 4.2 11.5
Non Current (Note 20) 7.1 6.3
Total 11.3 17.8
Onerous contracts
Carrying amount at beginning of the year 3.6 7.4
Provisions acquired through business combinations 1.4 -
Provisions increased during the year 0.1 1.4
Provisions (written back / utilised ) during the year (4.5) (9.4)
Movement of provision from non-current 3.1 4.2
Carrying amount at end of the year 3.7 3.6
Current 3.7 3.6
Non Current (Note 20) 16.4 20.4
Total 20.1 24.0
ANNUAL REPORT 2014/201568
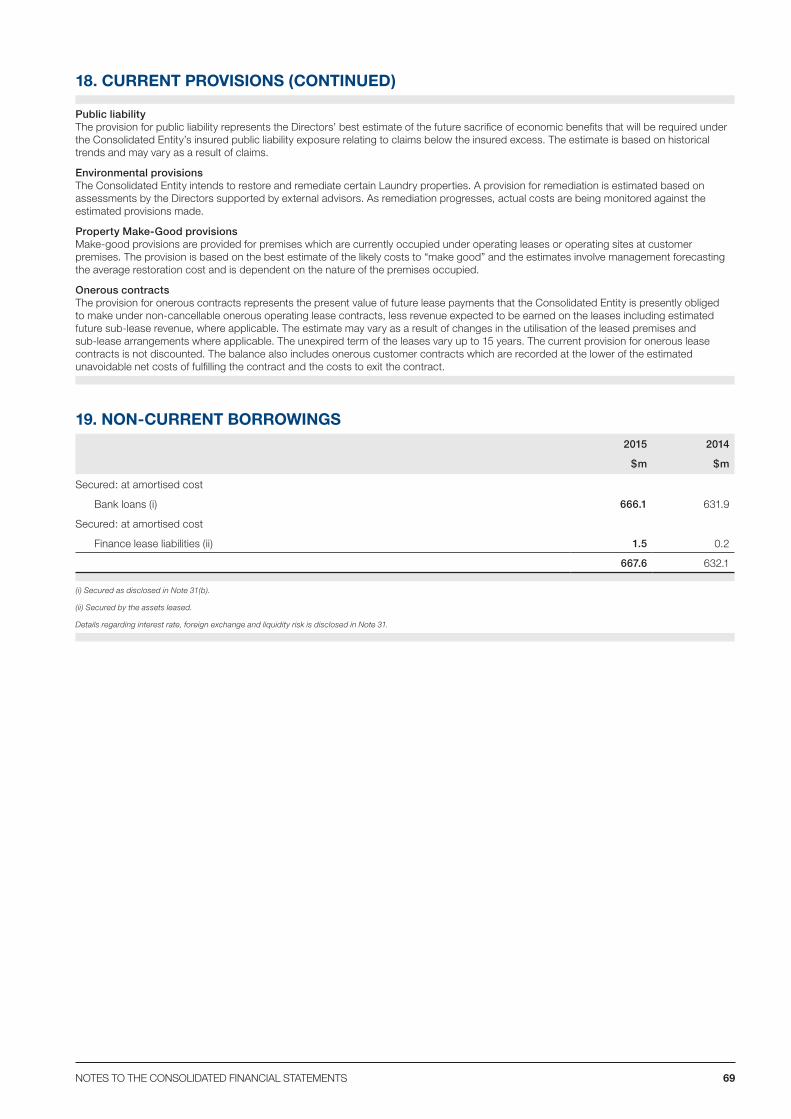
18. CURRENT PROVISIONS (CONTINUED)
Public liability The provision for public liability represents the Directors’ best estimate of the future sacrifice of economic benefits that will be required under the Consolidated Entity’s insured public liability exposure relating to claims below the insured excess. The estimate is based on historical trends and may vary as a result of claims.
Environmental provisions The Consolidated Entity intends to restore and remediate certain Laundry properties. A provision for remediation is estimated based on assessments by the Directors supported by external advisors. As remediation progresses, actual costs are being monitored against the estimated provisions made.
Property Make-Good provisions Make-good provisions are provided for premises which are currently occupied under operating leases or operating sites at customer premises. The provision is based on the best estimate of the likely costs to “make good” and the estimates involve management forecasting the average restoration cost and is dependent on the nature of the premises occupied.
Onerous contracts The provision for onerous contracts represents the present value of future lease payments that the Consolidated Entity is presently obliged to make under non-cancellable onerous operating lease contracts, less revenue expected to be earned on the leases including estimated future sub-lease revenue, where applicable. The estimate may vary as a result of changes in the utilisation of the leased premises and sub-lease arrangements where applicable. The unexpired term of the leases vary up to 15 years. The current provision for onerous lease contracts is not discounted. The balance also includes onerous customer contracts which are recorded at the lower of the estimated unavoidable net costs of fulfilling the contract and the costs to exit the contract.
19. NON-CURRENT BORROWINGS 2015 2014
$m $m
Secured: at amortised cost
Bank loans (i) 666.1 631.9
Secured: at amortised cost
Finance lease liabilities (ii) 1.5 0.2
667.6 632.1
(i) Secured as disclosed in Note 31(b).
(ii) Secured by the assets leased.
Details regarding interest rate, foreign exchange and liquidity risk is disclosed in Note 31.
69NOTES TO THE CONSOLIDATED FINANCIAL STATEMENTS
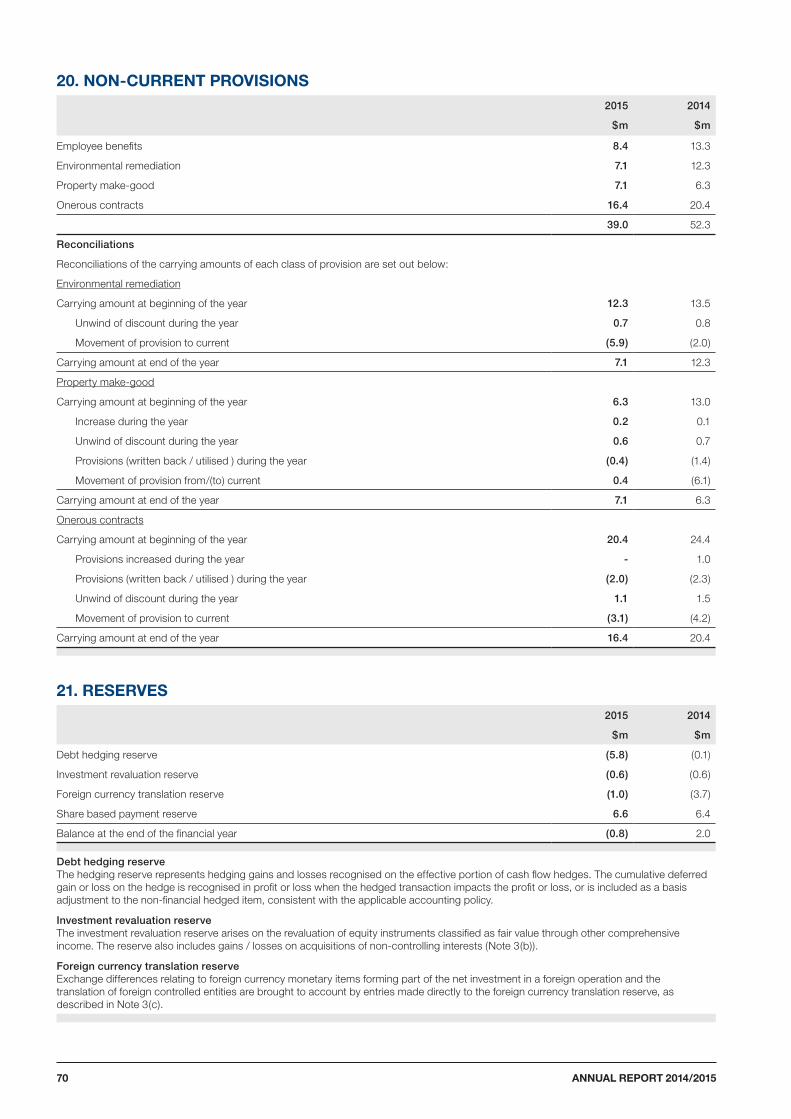
20. NON-CURRENT PROVISIONS 2015 2014
$m $m
Employee benefits 8.4 13.3
Environmental remediation 7.1 12.3
Property make-good 7.1 6.3
Onerous contracts 16.4 20.4
39.0 52.3
Reconciliations
Reconciliations of the carrying amounts of each class of provision are set out below:
Environmental remediation
Carrying amount at beginning of the year 12.3 13.5
Unwind of discount during the year 0.7 0.8
Movement of provision to current (5.9) (2.0)
Carrying amount at end of the year 7.1 12.3
Property make-good
Carrying amount at beginning of the year 6.3 13.0
Increase during the year 0.2 0.1
Unwind of discount during the year 0.6 0.7
Provisions (written back / utilised ) during the year (0.4) (1.4)
Movement of provision from/(to) current 0.4 (6.1)
Carrying amount at end of the year 7.1 6.3
Onerous contracts
Carrying amount at beginning of the year 20.4 24.4
Provisions increased during the year - 1.0
Provisions (written back / utilised ) during the year (2.0) (2.3)
Unwind of discount during the year 1.1 1.5
Movement of provision to current (3.1) (4.2)
Carrying amount at end of the year 16.4 20.4
21. RESERVES2015 2014
$m $m
Debt hedging reserve (5.8) (0.1)
Investment revaluation reserve (0.6) (0.6)
Foreign currency translation reserve (1.0) (3.7)
Share based payment reserve 6.6 6.4
Balance at the end of the financial year (0.8) 2.0
Debt hedging reserve The hedging reserve represents hedging gains and losses recognised on the effective portion of cash flow hedges. The cumulative deferred gain or loss on the hedge is recognised in profit or loss when the hedged transaction impacts the profit or loss, or is included as a basis adjustment to the non-financial hedged item, consistent with the applicable accounting policy.
Investment revaluation reserve The investment revaluation reserve arises on the revaluation of equity instruments classified as fair value through other comprehensive income. The reserve also includes gains / losses on acquisitions of non-controlling interests (Note 3(b)).
Foreign currency translation reserve Exchange differences relating to foreign currency monetary items forming part of the net investment in a foreign operation and the translation of foreign controlled entities are brought to account by entries made directly to the foreign currency translation reserve, as described in Note 3(c).
ANNUAL REPORT 2014/201570
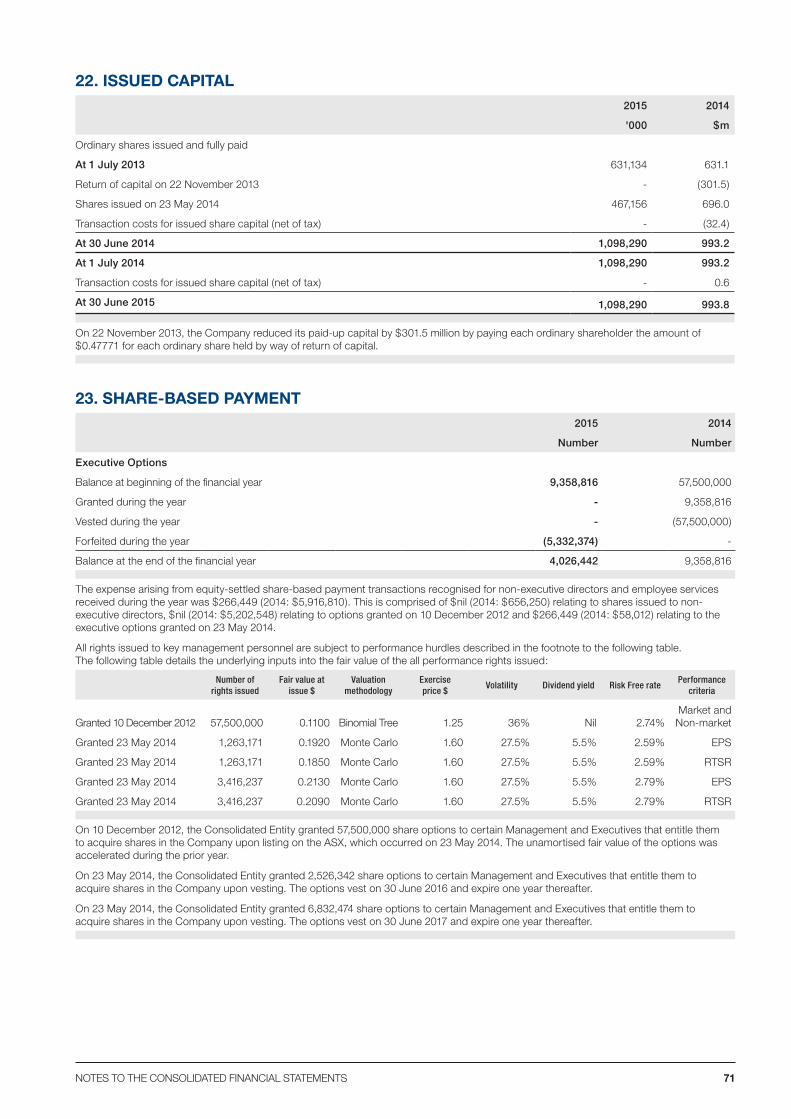
22. ISSUED CAPITAL2015 2014
'000 $m
Ordinary shares issued and fully paid
At 1 July 2013 631,134 631.1
Return of capital on 22 November 2013 - (301.5)
Shares issued on 23 May 2014 467,156 696.0
Transaction costs for issued share capital (net of tax) - (32.4)
At 30 June 2014 1,098,290 993.2
At 1 July 2014 1,098,290 993.2
Transaction costs for issued share capital (net of tax) - 0.6
At 30 June 2015 1,098,290 993.8
On 22 November 2013, the Company reduced its paid-up capital by $301.5 million by paying each ordinary shareholder the amount of $0.47771 for each ordinary share held by way of return of capital.
23. SHARE-BASED PAYMENT2015 2014
Number Number
Executive Options
Balance at beginning of the financial year 9,358,816 57,500,000
Granted during the year - 9,358,816
Vested during the year - (57,500,000)
Forfeited during the year (5,332,374) -
Balance at the end of the financial year 4,026,442 9,358,816
The expense arising from equity-settled share-based payment transactions recognised for non-executive directors and employee services received during the year was $266,449 (2014: $5,916,810). This is comprised of $nil (2014: $656,250) relating to shares issued to non-executive directors, $nil (2014: $5,202,548) relating to options granted on 10 December 2012 and $266,449 (2014: $58,012) relating to the executive options granted on 23 May 2014.
All rights issued to key management personnel are subject to performance hurdles described in the footnote to the following table. The following table details the underlying inputs into the fair value of the all performance rights issued:
Number of rights issued
Fair value at issue $
Valuation methodology
Exercise price $
Volatility Dividend yield Risk Free ratePerformance
criteria
Granted 10 December 2012 57,500,000 0.1100 Binomial Tree 1.25 36% Nil 2.74%Market and Non-market
Granted 23 May 2014 1,263,171 0.1920 Monte Carlo 1.60 27.5% 5.5% 2.59% EPS
Granted 23 May 2014 1,263,171 0.1850 Monte Carlo 1.60 27.5% 5.5% 2.59% RTSR
Granted 23 May 2014 3,416,237 0.2130 Monte Carlo 1.60 27.5% 5.5% 2.79% EPS
Granted 23 May 2014 3,416,237 0.2090 Monte Carlo 1.60 27.5% 5.5% 2.79% RTSR
On 10 December 2012, the Consolidated Entity granted 57,500,000 share options to certain Management and Executives that entitle them to acquire shares in the Company upon listing on the ASX, which occurred on 23 May 2014. The unamortised fair value of the options was accelerated during the prior year.
On 23 May 2014, the Consolidated Entity granted 2,526,342 share options to certain Management and Executives that entitle them to acquire shares in the Company upon vesting. The options vest on 30 June 2016 and expire one year thereafter.
On 23 May 2014, the Consolidated Entity granted 6,832,474 share options to certain Management and Executives that entitle them to acquire shares in the Company upon vesting. The options vest on 30 June 2017 and expire one year thereafter.
71NOTES TO THE CONSOLIDATED FINANCIAL STATEMENTS
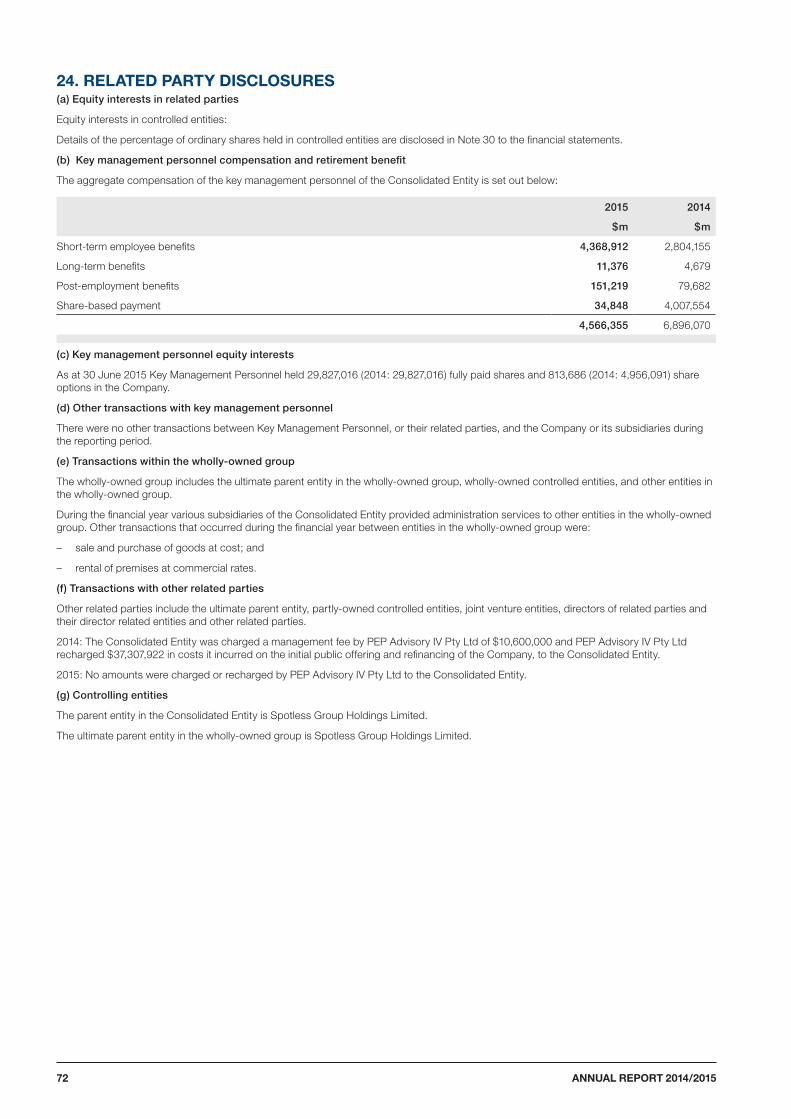
24. RELATED PARTY DISCLOSURES(a) Equity interests in related parties
Equity interests in controlled entities:
Details of the percentage of ordinary shares held in controlled entities are disclosed in Note 30 to the financial statements.
(b) Key management personnel compensation and retirement benefit
The aggregate compensation of the key management personnel of the Consolidated Entity is set out below:
2015 2014
$m $m
Short-term employee benefits 4,368,912 2,804,155
Long-term benefits 11,376 4,679
Post-employment benefits 151,219 79,682
Share-based payment 34,848 4,007,554
4,566,355 6,896,070
(c) Key management personnel equity interests
As at 30 June 2015 Key Management Personnel held 29,827,016 (2014: 29,827,016) fully paid shares and 813,686 (2014: 4,956,091) share options in the Company.
(d) Other transactions with key management personnel
There were no other transactions between Key Management Personnel, or their related parties, and the Company or its subsidiaries during the reporting period.
(e) Transactions within the wholly-owned group
The wholly-owned group includes the ultimate parent entity in the wholly-owned group, wholly-owned controlled entities, and other entities in the wholly-owned group.
During the financial year various subsidiaries of the Consolidated Entity provided administration services to other entities in the wholly-owned group. Other transactions that occurred during the financial year between entities in the wholly-owned group were:
– sale and purchase of goods at cost; and
– rental of premises at commercial rates.
(f) Transactions with other related parties
Other related parties include the ultimate parent entity, partly-owned controlled entities, joint venture entities, directors of related parties and their director related entities and other related parties.
2014: The Consolidated Entity was charged a management fee by PEP Advisory IV Pty Ltd of $10,600,000 and PEP Advisory IV Pty Ltd recharged $37,307,922 in costs it incurred on the initial public offering and refinancing of the Company, to the Consolidated Entity.
2015: No amounts were charged or recharged by PEP Advisory IV Pty Ltd to the Consolidated Entity.
(g) Controlling entities
The parent entity in the Consolidated Entity is Spotless Group Holdings Limited.
The ultimate parent entity in the wholly-owned group is Spotless Group Holdings Limited.
ANNUAL REPORT 2014/201572
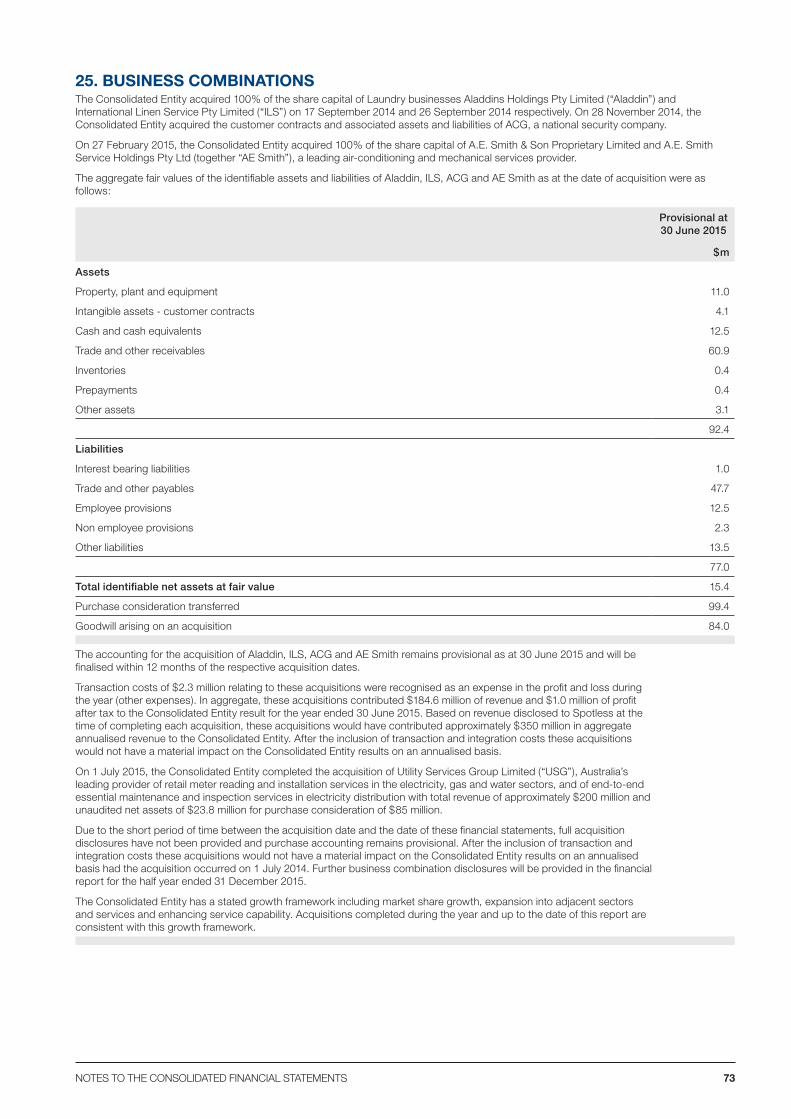
25. BUSINESS COMBINATIONSThe Consolidated Entity acquired 100% of the share capital of Laundry businesses Aladdins Holdings Pty Limited (“Aladdin”) and International Linen Service Pty Limited (“ILS”) on 17 September 2014 and 26 September 2014 respectively. On 28 November 2014, the Consolidated Entity acquired the customer contracts and associated assets and liabilities of ACG, a national security company.
On 27 February 2015, the Consolidated Entity acquired 100% of the share capital of A.E. Smith & Son Proprietary Limited and A.E. Smith Service Holdings Pty Ltd (together “AE Smith”), a leading air-conditioning and mechanical services provider.
The aggregate fair values of the identifiable assets and liabilities of Aladdin, ILS, ACG and AE Smith as at the date of acquisition were as follows:
Provisional at 30 June 2015
$m
Assets
Property, plant and equipment 11.0
Intangible assets - customer contracts 4.1
Cash and cash equivalents 12.5
Trade and other receivables 60.9
Inventories 0.4
Prepayments 0.4
Other assets 3.1
92.4
Liabilities
Interest bearing liabilities 1.0
Trade and other payables 47.7
Employee provisions 12.5
Non employee provisions 2.3
Other liabilities 13.5
77.0
Total identifiable net assets at fair value 15.4
Purchase consideration transferred 99.4
Goodwill arising on an acquisition 84.0
The accounting for the acquisition of Aladdin, ILS, ACG and AE Smith remains provisional as at 30 June 2015 and will be finalised within 12 months of the respective acquisition dates.
Transaction costs of $2.3 million relating to these acquisitions were recognised as an expense in the profit and loss during the year (other expenses). In aggregate, these acquisitions contributed $184.6 million of revenue and $1.0 million of profit after tax to the Consolidated Entity result for the year ended 30 June 2015. Based on revenue disclosed to Spotless at the time of completing each acquisition, these acquisitions would have contributed approximately $350 million in aggregate annualised revenue to the Consolidated Entity. After the inclusion of transaction and integration costs these acquisitions would not have a material impact on the Consolidated Entity results on an annualised basis.
On 1 July 2015, the Consolidated Entity completed the acquisition of Utility Services Group Limited (“USG”), Australia’s leading provider of retail meter reading and installation services in the electricity, gas and water sectors, and of end-to-end essential maintenance and inspection services in electricity distribution with total revenue of approximately $200 million and unaudited net assets of $23.8 million for purchase consideration of $85 million.
Due to the short period of time between the acquisition date and the date of these financial statements, full acquisition disclosures have not been provided and purchase accounting remains provisional. After the inclusion of transaction and integration costs these acquisitions would not have a material impact on the Consolidated Entity results on an annualised basis had the acquisition occurred on 1 July 2014. Further business combination disclosures will be provided in the financial report for the half year ended 31 December 2015.
The Consolidated Entity has a stated growth framework including market share growth, expansion into adjacent sectors and services and enhancing service capability. Acquisitions completed during the year and up to the date of this report are consistent with this growth framework.
73NOTES TO THE CONSOLIDATED FINANCIAL STATEMENTS
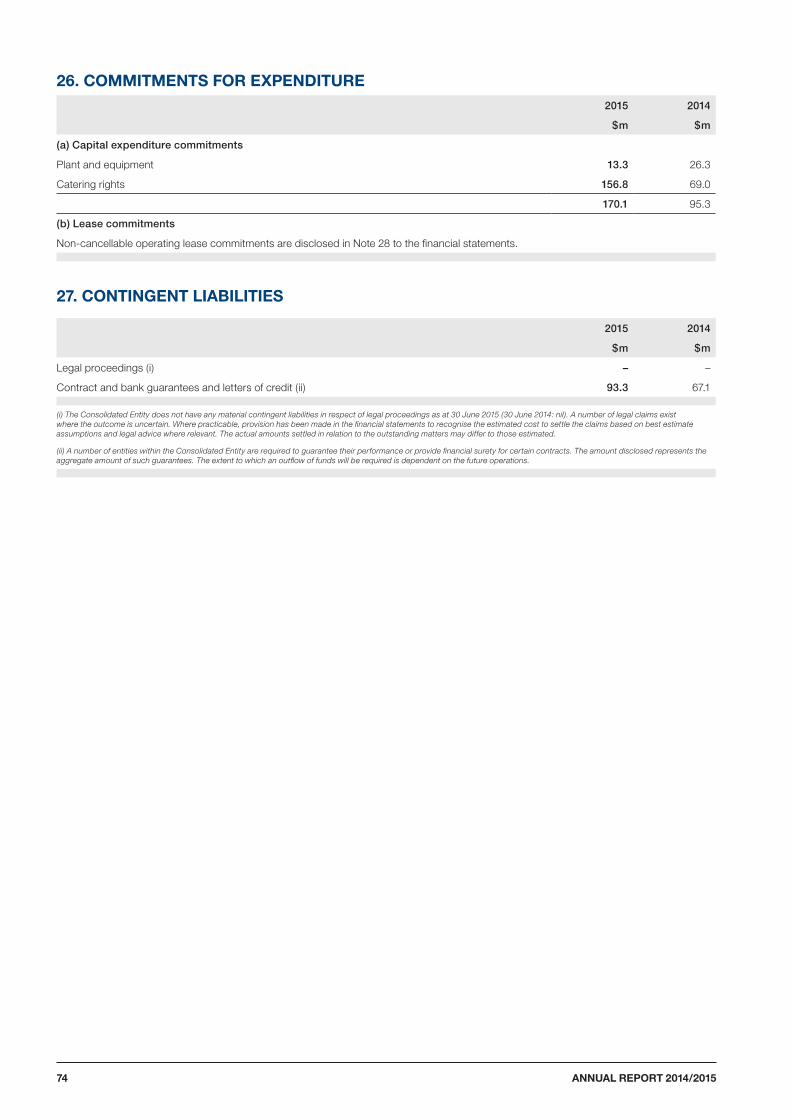
26. COMMITMENTS FOR EXPENDITURE2015 2014
$m $m
(a) Capital expenditure commitments
Plant and equipment 13.3 26.3
Catering rights 156.8 69.0
170.1 95.3
(b) Lease commitments
Non-cancellable operating lease commitments are disclosed in Note 28 to the financial statements.
27. CONTINGENT LIABILITIES
2015 2014
$m $m
Legal proceedings (i) – –
Contract and bank guarantees and letters of credit (ii) 93.3 67.1
(i) The Consolidated Entity does not have any material contingent liabilities in respect of legal proceedings as at 30 June 2015 (30 June 2014: nil). A number of legal claims exist where the outcome is uncertain. Where practicable, provision has been made in the financial statements to recognise the estimated cost to settle the claims based on best estimate assumptions and legal advice where relevant. The actual amounts settled in relation to the outstanding matters may differ to those estimated.
(ii) A number of entities within the Consolidated Entity are required to guarantee their performance or provide financial surety for certain contracts. The amount disclosed represents the aggregate amount of such guarantees. The extent to which an outflow of funds will be required is dependent on the future operations.
ANNUAL REPORT 2014/201574

28. LEASES2015 2014
$m $m
(a) Operating leases
Leasing arrangements
Operating leases relate to office facilities, motor vehicles and laundry plants with lease terms of 1 month to 15 years. All operating lease contracts contain market review clauses in the event that the Consolidated Entity exercises its option to renew. The Consolidated Entity does not have an option to purchase the leased assets at the expiry of the lease period.
Non-cancellable operating leases
Not longer than 1 year 25.9 33.0
Longer than 1 year and not longer than 5 years 61.8 71.1
Longer than 5 years 46.7 48.7
134.4 152.8
(b) Finance leases
The Consolidated Entity has finance leases for various items of plant and equipment and motor vehicles with lease terms ranging from 4 to 5 years. The Consolidated Entity has options to purchase the equipment at a market price at the conclusion of the lease agreements. Future minimum lease payments under finance leases together with the present value of the net minimum lease payments are as follows:
Minimum future lease payments
Not longer than 1 year 1.0 0.1
Longer than 1 year and not longer than 5 years 1.7 0.2
Longer than 5 years – –
Minimum Finance Lease Payments 2.7 0.3
Less future finance charges (0.1) –
Present value of minimum lease payments 2.6 0.3
Present value of minimum future lease payments
Not later than 1 year 1.1 0.1
Later than 1 year and not later than 5 years 1.5 0.2
Later than 5 years – –
Present value of minimum lease payments 2.6 0.3
Included in the financial statements as:
Current borrowings (Note 17) 1.1 0.1
Non-current borrowings (Note 19) 1.5 0.2
2.6 0.3
29. REMUNERATION OF AUDITORS2015 2014
$'000 $'000
Auditor of the parent entity (i)
Auditing the financial statements 629 468
Other services:
Initial Public Offering related reviews and assurance reports - 794
Initial Public Offering related tax due diligence services - 198
Due diligence services 250 938
Taxation services 228 635
Other non audit services 54 108
Other assurance services - 23
1,161 3,164
(i) The auditor of Spotless Group Holdings Limited is Ernst & Young.
Audit fees were paid on behalf of the Company by a subsidiary of the Consolidated Entity.
75NOTES TO THE CONSOLIDATED FINANCIAL STATEMENTS
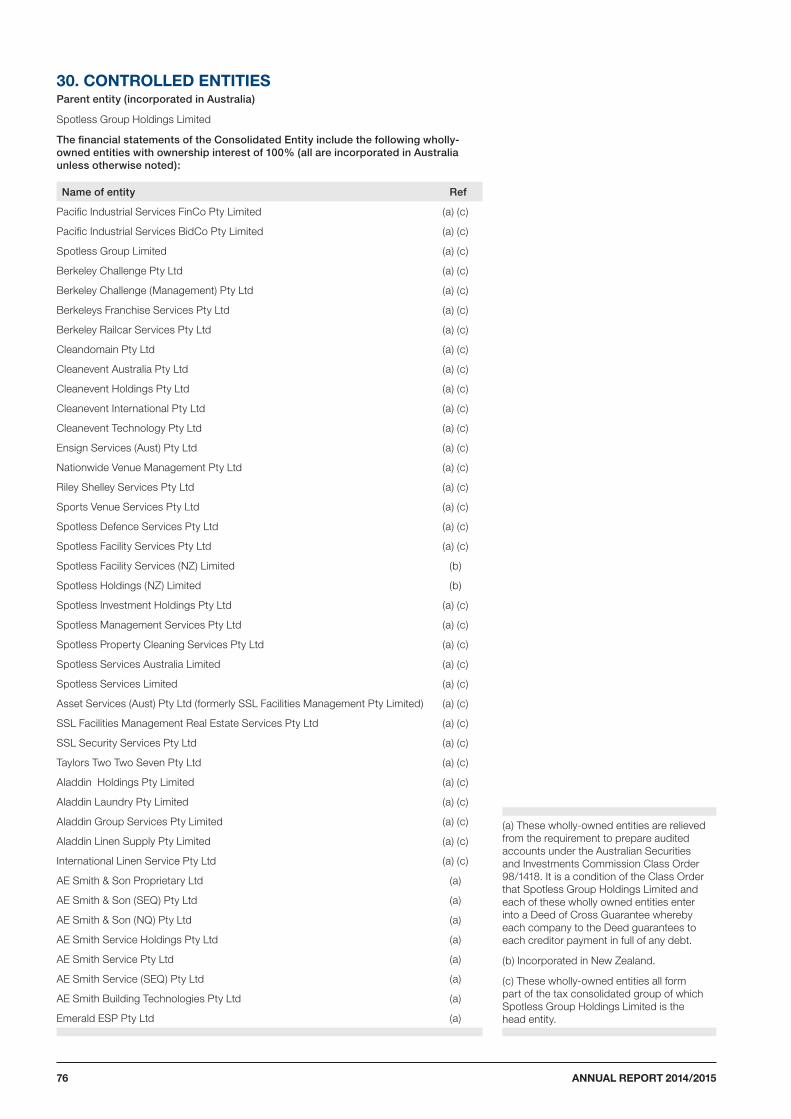
30. CONTROLLED ENTITIESParent entity (incorporated in Australia)
Spotless Group Holdings Limited
The financial statements of the Consolidated Entity include the following wholly-owned entities with ownership interest of 100% (all are incorporated in Australia unless otherwise noted):
Name of entity Ref
Pacific Industrial Services FinCo Pty Limited (a) (c)
Pacific Industrial Services BidCo Pty Limited (a) (c)
Spotless Group Limited (a) (c)
Berkeley Challenge Pty Ltd (a) (c)
Berkeley Challenge (Management) Pty Ltd (a) (c)
Berkeleys Franchise Services Pty Ltd (a) (c)
Berkeley Railcar Services Pty Ltd (a) (c)
Cleandomain Pty Ltd (a) (c)
Cleanevent Australia Pty Ltd (a) (c)
Cleanevent Holdings Pty Ltd (a) (c)
Cleanevent International Pty Ltd (a) (c)
Cleanevent Technology Pty Ltd (a) (c)
Ensign Services (Aust) Pty Ltd (a) (c)
Nationwide Venue Management Pty Ltd (a) (c)
Riley Shelley Services Pty Ltd (a) (c)
Sports Venue Services Pty Ltd (a) (c)
Spotless Defence Services Pty Ltd (a) (c)
Spotless Facility Services Pty Ltd (a) (c)
Spotless Facility Services (NZ) Limited (b)
Spotless Holdings (NZ) Limited (b)
Spotless Investment Holdings Pty Ltd (a) (c)
Spotless Management Services Pty Ltd (a) (c)
Spotless Property Cleaning Services Pty Ltd (a) (c)
Spotless Services Australia Limited (a) (c)
Spotless Services Limited (a) (c)
Asset Services (Aust) Pty Ltd (formerly SSL Facilities Management Pty Limited) (a) (c)
SSL Facilities Management Real Estate Services Pty Ltd (a) (c)
SSL Security Services Pty Ltd (a) (c)
Taylors Two Two Seven Pty Ltd (a) (c)
Aladdin Holdings Pty Limited (a) (c)
Aladdin Laundry Pty Limited (a) (c)
Aladdin Group Services Pty Limited (a) (c)
Aladdin Linen Supply Pty Limited (a) (c)
International Linen Service Pty Ltd (a) (c)
AE Smith & Son Proprietary Ltd (a)
AE Smith & Son (SEQ) Pty Ltd (a)
AE Smith & Son (NQ) Pty Ltd (a)
AE Smith Service Holdings Pty Ltd (a)
AE Smith Service Pty Ltd (a)
AE Smith Service (SEQ) Pty Ltd (a)
AE Smith Building Technologies Pty Ltd (a)
Emerald ESP Pty Ltd (a)
(a) These wholly-owned entities are relieved from the requirement to prepare audited accounts under the Australian Securities and Investments Commission Class Order 98/1418. It is a condition of the Class Order that Spotless Group Holdings Limited and each of these wholly owned entities enter into a Deed of Cross Guarantee whereby each company to the Deed guarantees to each creditor payment in full of any debt.
(b) Incorporated in New Zealand.
(c) These wholly-owned entities all form part of the tax consolidated group of which Spotless Group Holdings Limited is the head entity.
ANNUAL REPORT 2014/201576
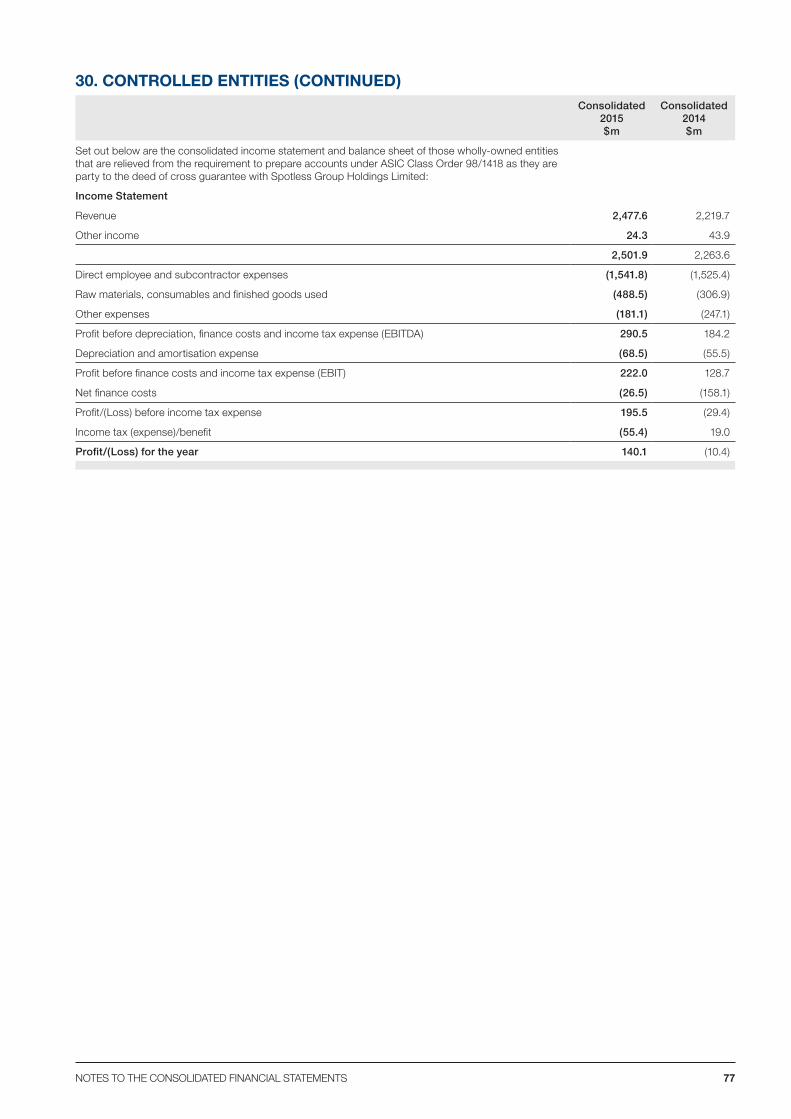
30. CONTROLLED ENTITIES (CONTINUED)Consolidated
2015 $m
Consolidated 2014 $m
Set out below are the consolidated income statement and balance sheet of those wholly-owned entities that are relieved from the requirement to prepare accounts under ASIC Class Order 98/1418 as they are party to the deed of cross guarantee with Spotless Group Holdings Limited:
Income Statement
Revenue 2,477.6 2,219.7
Other income 24.3 43.9
2,501.9 2,263.6
Direct employee and subcontractor expenses (1,541.8) (1,525.4)
Raw materials, consumables and finished goods used (488.5) (306.9)
Other expenses (181.1) (247.1)
Profit before depreciation, finance costs and income tax expense (EBITDA) 290.5 184.2
Depreciation and amortisation expense (68.5) (55.5)
Profit before finance costs and income tax expense (EBIT) 222.0 128.7
Net finance costs (26.5) (158.1)
Profit/(Loss) before income tax expense 195.5 (29.4)
Income tax (expense)/benefit (55.4) 19.0
Profit/(Loss) for the year 140.1 (10.4)
77NOTES TO THE CONSOLIDATED FINANCIAL STATEMENTS
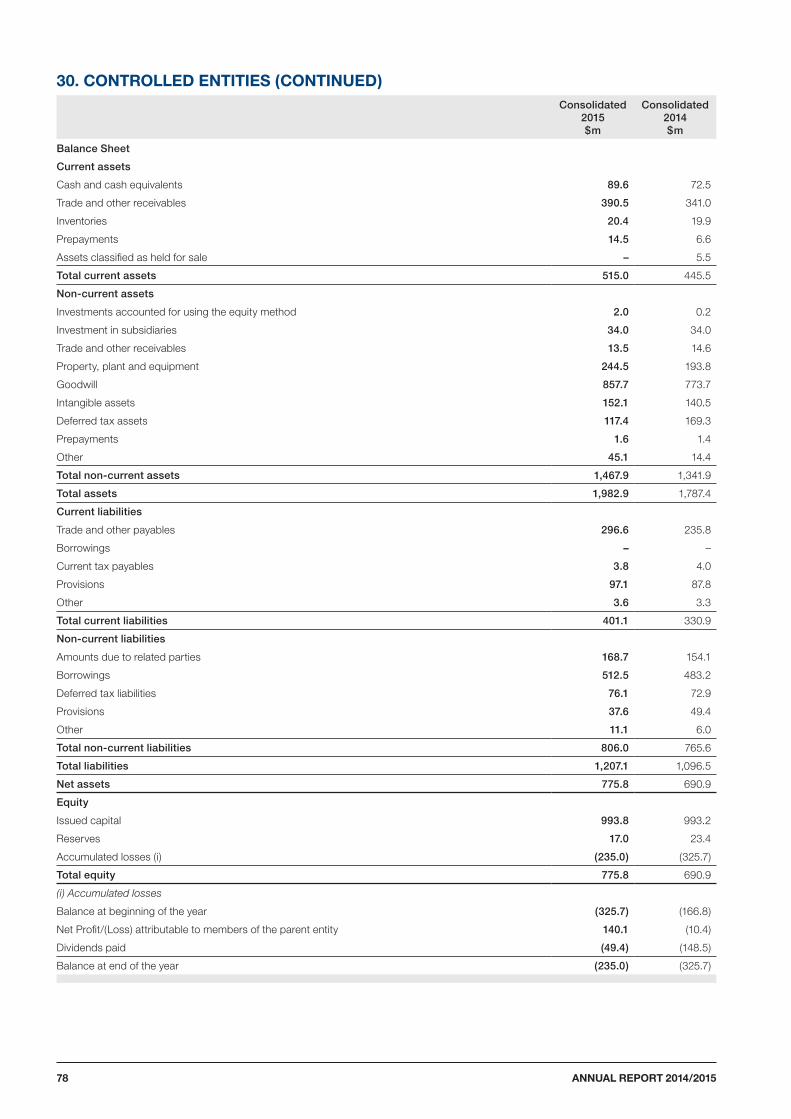
30. CONTROLLED ENTITIES (CONTINUED)Consolidated
2015 $m
Consolidated 2014 $m
Balance Sheet
Current assets
Cash and cash equivalents 89.6 72.5
Trade and other receivables 390.5 341.0
Inventories 20.4 19.9
Prepayments 14.5 6.6
Assets classified as held for sale – 5.5
Total current assets 515.0 445.5
Non-current assets
Investments accounted for using the equity method 2.0 0.2
Investment in subsidiaries 34.0 34.0
Trade and other receivables 13.5 14.6
Property, plant and equipment 244.5 193.8
Goodwill 857.7 773.7
Intangible assets 152.1 140.5
Deferred tax assets 117.4 169.3
Prepayments 1.6 1.4
Other 45.1 14.4
Total non-current assets 1,467.9 1,341.9
Total assets 1,982.9 1,787.4
Current liabilities
Trade and other payables 296.6 235.8
Borrowings – –
Current tax payables 3.8 4.0
Provisions 97.1 87.8
Other 3.6 3.3
Total current liabilities 401.1 330.9
Non-current liabilities
Amounts due to related parties 168.7 154.1
Borrowings 512.5 483.2
Deferred tax liabilities 76.1 72.9
Provisions 37.6 49.4
Other 11.1 6.0
Total non-current liabilities 806.0 765.6
Total liabilities 1,207.1 1,096.5
Net assets 775.8 690.9
Equity
Issued capital 993.8 993.2
Reserves 17.0 23.4
Accumulated losses (i) (235.0) (325.7)
Total equity 775.8 690.9
(i) Accumulated losses
Balance at beginning of the year (325.7) (166.8)
Net Profit/(Loss) attributable to members of the parent entity 140.1 (10.4)
Dividends paid (49.4) (148.5)
Balance at end of the year (235.0) (325.7)
ANNUAL REPORT 2014/201578
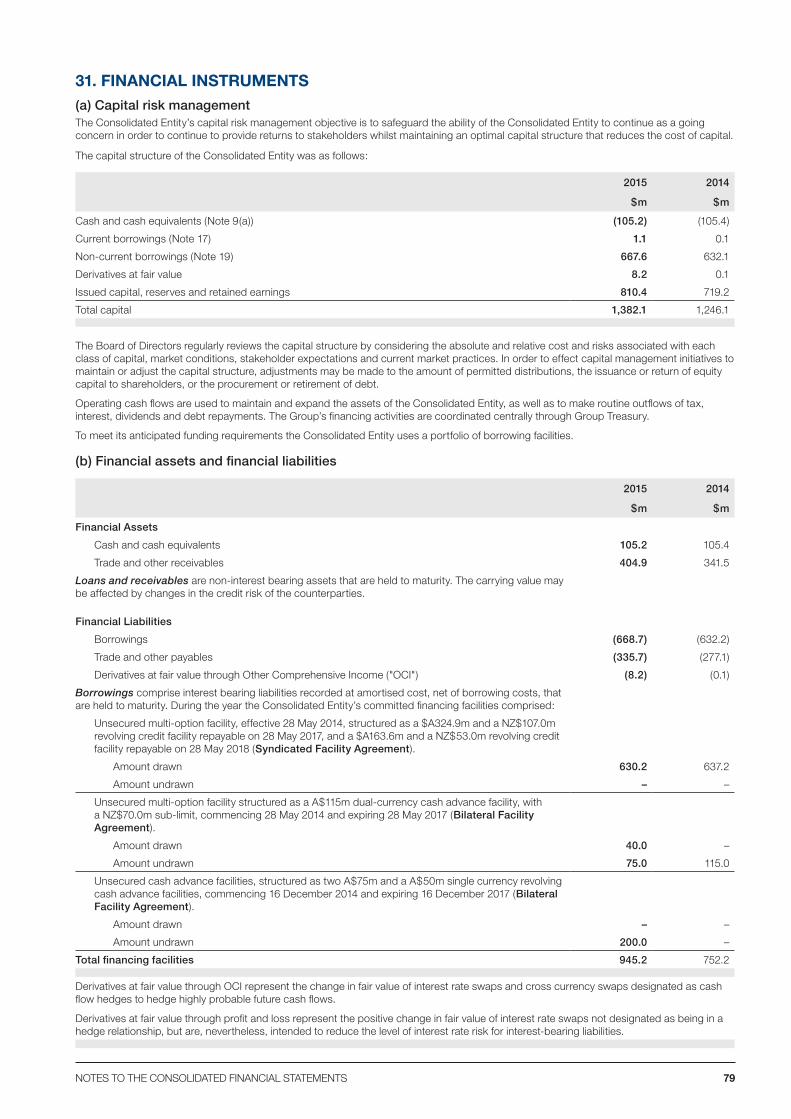
31. FINANCIAL INSTRUMENTS(a) Capital risk managementThe Consolidated Entity’s capital risk management objective is to safeguard the ability of the Consolidated Entity to continue as a going concern in order to continue to provide returns to stakeholders whilst maintaining an optimal capital structure that reduces the cost of capital.
The capital structure of the Consolidated Entity was as follows:
2015 2014
$m $m
Cash and cash equivalents (Note 9(a)) (105.2) (105.4)
Current borrowings (Note 17) 1.1 0.1
Non-current borrowings (Note 19) 667.6 632.1
Derivatives at fair value 8.2 0.1
Issued capital, reserves and retained earnings 810.4 719.2
Total capital 1,382.1 1,246.1
The Board of Directors regularly reviews the capital structure by considering the absolute and relative cost and risks associated with each class of capital, market conditions, stakeholder expectations and current market practices. In order to effect capital management initiatives to maintain or adjust the capital structure, adjustments may be made to the amount of permitted distributions, the issuance or return of equity capital to shareholders, or the procurement or retirement of debt.
Operating cash flows are used to maintain and expand the assets of the Consolidated Entity, as well as to make routine outflows of tax, interest, dividends and debt repayments. The Group’s financing activities are coordinated centrally through Group Treasury.
To meet its anticipated funding requirements the Consolidated Entity uses a portfolio of borrowing facilities.
(b) Financial assets and financial liabilities
2015 2014
$m $m
Financial Assets
Cash and cash equivalents 105.2 105.4
Trade and other receivables 404.9 341.5
Loans and receivables are non-interest bearing assets that are held to maturity. The carrying value may be affected by changes in the credit risk of the counterparties.
Financial Liabilities
Borrowings (668.7) (632.2)
Trade and other payables (335.7) (277.1)
Derivatives at fair value through Other Comprehensive Income ("OCI") (8.2) (0.1)
Borrowings comprise interest bearing liabilities recorded at amortised cost, net of borrowing costs, that are held to maturity. During the year the Consolidated Entity’s committed financing facilities comprised:
Unsecured multi-option facility, effective 28 May 2014, structured as a $A324.9m and a NZ$107.0m revolving credit facility repayable on 28 May 2017, and a $A163.6m and a NZ$53.0m revolving credit facility repayable on 28 May 2018 (Syndicated Facility Agreement).
Amount drawn 630.2 637.2
Amount undrawn – –
Unsecured multi-option facility structured as a A$115m dual-currency cash advance facility, with a NZ$70.0m sub-limit, commencing 28 May 2014 and expiring 28 May 2017 (Bilateral Facility Agreement).
Amount drawn 40.0 –
Amount undrawn 75.0 115.0
Unsecured cash advance facilities, structured as two A$75m and a A$50m single currency revolving cash advance facilities, commencing 16 December 2014 and expiring 16 December 2017 (Bilateral Facility Agreement).
Amount drawn – –
Amount undrawn 200.0 –
Total financing facilities 945.2 752.2
Derivatives at fair value through OCI represent the change in fair value of interest rate swaps and cross currency swaps designated as cash flow hedges to hedge highly probable future cash flows.
Derivatives at fair value through profit and loss represent the positive change in fair value of interest rate swaps not designated as being in a hedge relationship, but are, nevertheless, intended to reduce the level of interest rate risk for interest-bearing liabilities.
79NOTES TO THE CONSOLIDATED FINANCIAL STATEMENTS
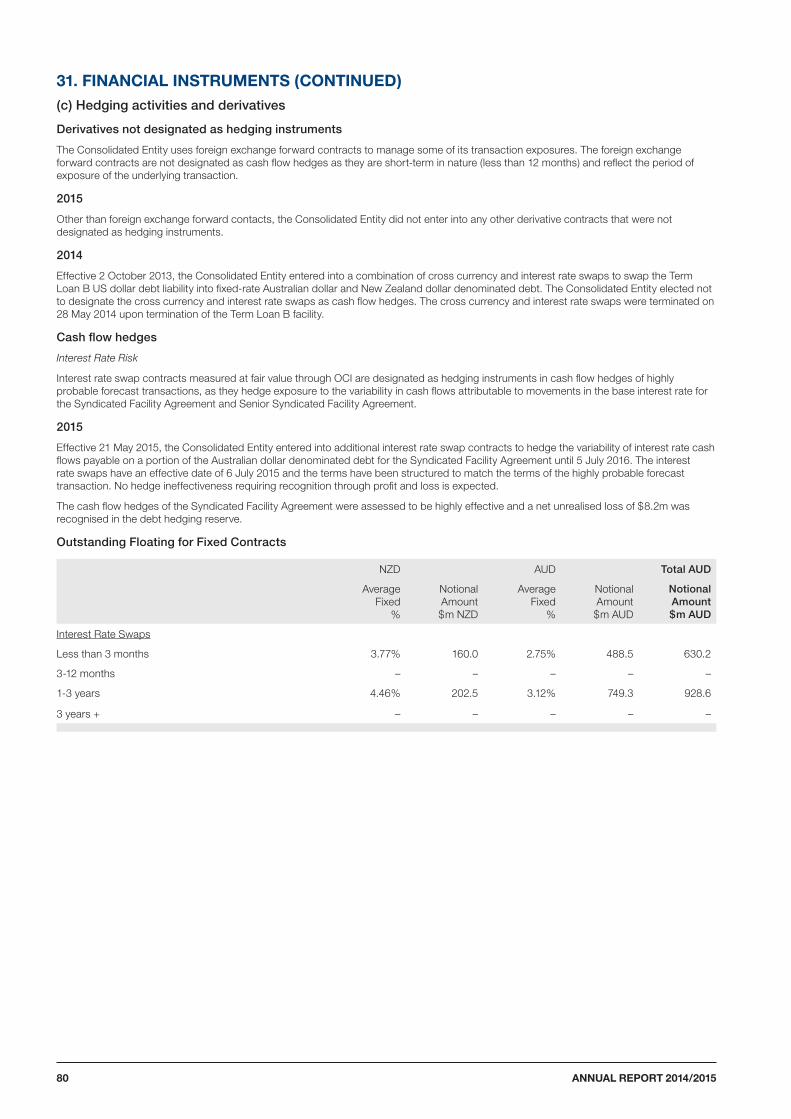
31. FINANCIAL INSTRUMENTS (CONTINUED)(c) Hedging activities and derivatives
Derivatives not designated as hedging instruments
The Consolidated Entity uses foreign exchange forward contracts to manage some of its transaction exposures. The foreign exchange forward contracts are not designated as cash flow hedges as they are short-term in nature (less than 12 months) and reflect the period of exposure of the underlying transaction.
2015
Other than foreign exchange forward contacts, the Consolidated Entity did not enter into any other derivative contracts that were not designated as hedging instruments.
2014
Effective 2 October 2013, the Consolidated Entity entered into a combination of cross currency and interest rate swaps to swap the Term Loan B US dollar debt liability into fixed-rate Australian dollar and New Zealand dollar denominated debt. The Consolidated Entity elected not to designate the cross currency and interest rate swaps as cash flow hedges. The cross currency and interest rate swaps were terminated on 28 May 2014 upon termination of the Term Loan B facility.
Cash flow hedges
Interest Rate Risk
Interest rate swap contracts measured at fair value through OCI are designated as hedging instruments in cash flow hedges of highly probable forecast transactions, as they hedge exposure to the variability in cash flows attributable to movements in the base interest rate for the Syndicated Facility Agreement and Senior Syndicated Facility Agreement.
2015
Effective 21 May 2015, the Consolidated Entity entered into additional interest rate swap contracts to hedge the variability of interest rate cash flows payable on a portion of the Australian dollar denominated debt for the Syndicated Facility Agreement until 5 July 2016. The interest rate swaps have an effective date of 6 July 2015 and the terms have been structured to match the terms of the highly probable forecast transaction. No hedge ineffectiveness requiring recognition through profit and loss is expected.
The cash flow hedges of the Syndicated Facility Agreement were assessed to be highly effective and a net unrealised loss of $8.2m was recognised in the debt hedging reserve.
Outstanding Floating for Fixed Contracts
NZD AUD Total AUD
Average Fixed
%
Notional Amount $m NZD
Average Fixed
%
Notional Amount $m AUD
Notional Amount $m AUD
Interest Rate Swaps
Less than 3 months 3.77% 160.0 2.75% 488.5 630.2
3-12 months – – – – –
1-3 years 4.46% 202.5 3.12% 749.3 928.6
3 years + – – – – –
ANNUAL REPORT 2014/201580
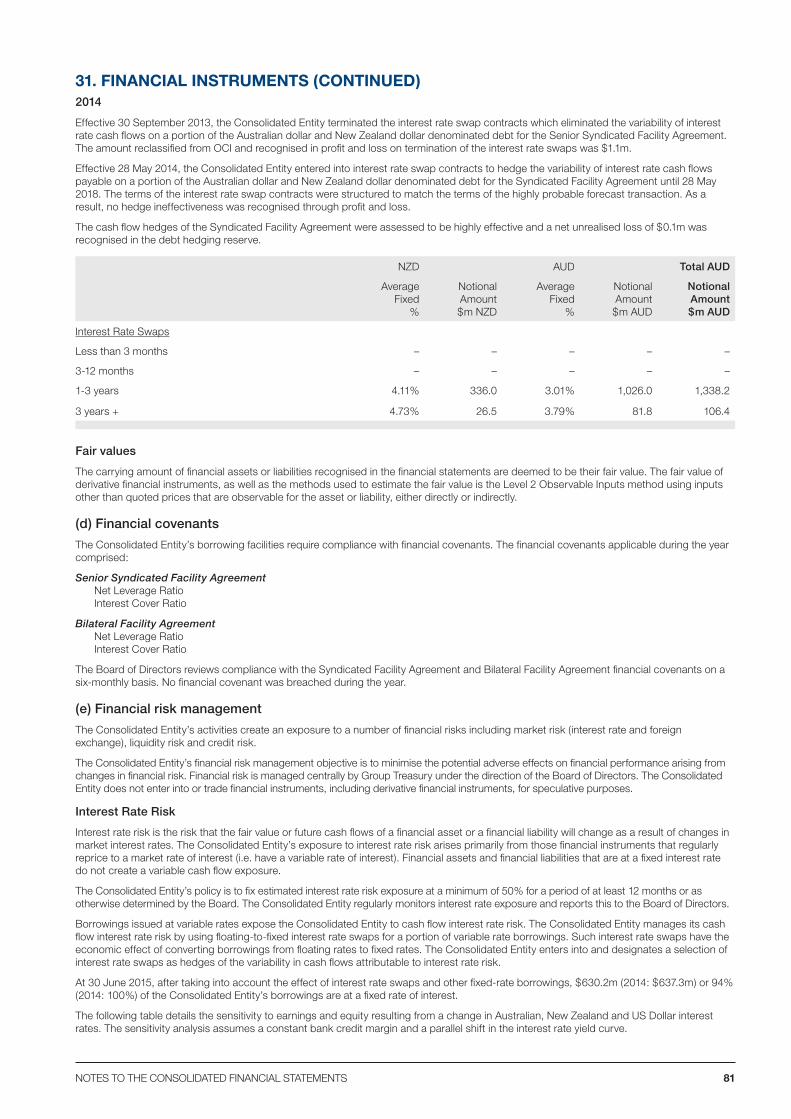
31. FINANCIAL INSTRUMENTS (CONTINUED)2014
Effective 30 September 2013, the Consolidated Entity terminated the interest rate swap contracts which eliminated the variability of interest rate cash flows on a portion of the Australian dollar and New Zealand dollar denominated debt for the Senior Syndicated Facility Agreement. The amount reclassified from OCI and recognised in profit and loss on termination of the interest rate swaps was $1.1m.
Effective 28 May 2014, the Consolidated Entity entered into interest rate swap contracts to hedge the variability of interest rate cash flows payable on a portion of the Australian dollar and New Zealand dollar denominated debt for the Syndicated Facility Agreement until 28 May 2018. The terms of the interest rate swap contracts were structured to match the terms of the highly probable forecast transaction. As a result, no hedge ineffectiveness was recognised through profit and loss.
The cash flow hedges of the Syndicated Facility Agreement were assessed to be highly effective and a net unrealised loss of $0.1m was recognised in the debt hedging reserve.
NZD AUD Total AUD
Average Fixed
%
Notional Amount $m NZD
Average Fixed
%
Notional Amount $m AUD
Notional Amount $m AUD
Interest Rate Swaps
Less than 3 months – – – – –
3-12 months – – – – –
1-3 years 4.11% 336.0 3.01% 1,026.0 1,338.2
3 years + 4.73% 26.5 3.79% 81.8 106.4
Fair values
The carrying amount of financial assets or liabilities recognised in the financial statements are deemed to be their fair value. The fair value of derivative financial instruments, as well as the methods used to estimate the fair value is the Level 2 Observable Inputs method using inputs other than quoted prices that are observable for the asset or liability, either directly or indirectly.
(d) Financial covenants
The Consolidated Entity’s borrowing facilities require compliance with financial covenants. The financial covenants applicable during the year comprised:
Senior Syndicated Facility AgreementNet Leverage Ratio Interest Cover Ratio
Bilateral Facility AgreementNet Leverage RatioInterest Cover Ratio
The Board of Directors reviews compliance with the Syndicated Facility Agreement and Bilateral Facility Agreement financial covenants on a six-monthly basis. No financial covenant was breached during the year.
(e) Financial risk management
The Consolidated Entity’s activities create an exposure to a number of financial risks including market risk (interest rate and foreign exchange), liquidity risk and credit risk.
The Consolidated Entity’s financial risk management objective is to minimise the potential adverse effects on financial performance arising from changes in financial risk. Financial risk is managed centrally by Group Treasury under the direction of the Board of Directors. The Consolidated Entity does not enter into or trade financial instruments, including derivative financial instruments, for speculative purposes.
Interest Rate Risk
Interest rate risk is the risk that the fair value or future cash flows of a financial asset or a financial liability will change as a result of changes in market interest rates. The Consolidated Entity’s exposure to interest rate risk arises primarily from those financial instruments that regularly reprice to a market rate of interest (i.e. have a variable rate of interest). Financial assets and financial liabilities that are at a fixed interest rate do not create a variable cash flow exposure.
The Consolidated Entity’s policy is to fix estimated interest rate risk exposure at a minimum of 50% for a period of at least 12 months or as otherwise determined by the Board. The Consolidated Entity regularly monitors interest rate exposure and reports this to the Board of Directors.
Borrowings issued at variable rates expose the Consolidated Entity to cash flow interest rate risk. The Consolidated Entity manages its cash flow interest rate risk by using floating-to-fixed interest rate swaps for a portion of variable rate borrowings. Such interest rate swaps have the economic effect of converting borrowings from floating rates to fixed rates. The Consolidated Entity enters into and designates a selection of interest rate swaps as hedges of the variability in cash flows attributable to interest rate risk.
At 30 June 2015, after taking into account the effect of interest rate swaps and other fixed-rate borrowings, $630.2m (2014: $637.3m) or 94% (2014: 100%) of the Consolidated Entity’s borrowings are at a fixed rate of interest.
The following table details the sensitivity to earnings and equity resulting from a change in Australian, New Zealand and US Dollar interest rates. The sensitivity analysis assumes a constant bank credit margin and a parallel shift in the interest rate yield curve.
81NOTES TO THE CONSOLIDATED FINANCIAL STATEMENTS
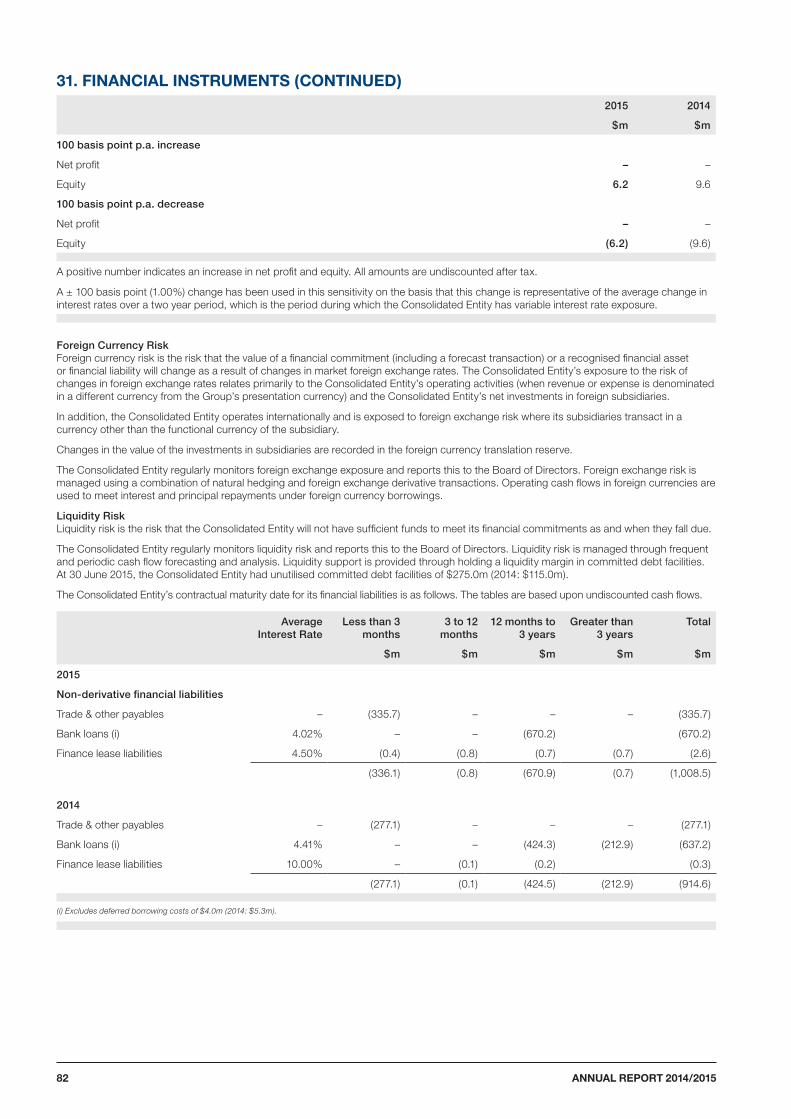
31. FINANCIAL INSTRUMENTS (CONTINUED)2015 2014
$m $m
100 basis point p.a. increase
Net profit – –
Equity 6.2 9.6
100 basis point p.a. decrease
Net profit – –
Equity (6.2) (9.6)
A positive number indicates an increase in net profit and equity. All amounts are undiscounted after tax.
A ± 100 basis point (1.00%) change has been used in this sensitivity on the basis that this change is representative of the average change in interest rates over a two year period, which is the period during which the Consolidated Entity has variable interest rate exposure.
Foreign Currency Risk Foreign currency risk is the risk that the value of a financial commitment (including a forecast transaction) or a recognised financial asset or financial liability will change as a result of changes in market foreign exchange rates. The Consolidated Entity’s exposure to the risk of changes in foreign exchange rates relates primarily to the Consolidated Entity’s operating activities (when revenue or expense is denominated in a different currency from the Group’s presentation currency) and the Consolidated Entity’s net investments in foreign subsidiaries.
In addition, the Consolidated Entity operates internationally and is exposed to foreign exchange risk where its subsidiaries transact in a currency other than the functional currency of the subsidiary.
Changes in the value of the investments in subsidiaries are recorded in the foreign currency translation reserve.
The Consolidated Entity regularly monitors foreign exchange exposure and reports this to the Board of Directors. Foreign exchange risk is managed using a combination of natural hedging and foreign exchange derivative transactions. Operating cash flows in foreign currencies are used to meet interest and principal repayments under foreign currency borrowings.
Liquidity Risk Liquidity risk is the risk that the Consolidated Entity will not have sufficient funds to meet its financial commitments as and when they fall due.
The Consolidated Entity regularly monitors liquidity risk and reports this to the Board of Directors. Liquidity risk is managed through frequent and periodic cash flow forecasting and analysis. Liquidity support is provided through holding a liquidity margin in committed debt facilities. At 30 June 2015, the Consolidated Entity had unutilised committed debt facilities of $275.0m (2014: $115.0m).
The Consolidated Entity’s contractual maturity date for its financial liabilities is as follows. The tables are based upon undiscounted cash flows.
Average Interest Rate
Less than 3 months
3 to 12 months
12 months to 3 years
Greater than 3 years
Total
$m $m $m $m $m
2015
Non-derivative financial liabilities
Trade & other payables – (335.7) – – – (335.7)
Bank loans (i) 4.02% – – (670.2) (670.2)
Finance lease liabilities 4.50% (0.4) (0.8) (0.7) (0.7) (2.6)
(336.1) (0.8) (670.9) (0.7) (1,008.5)
2014
Trade & other payables – (277.1) – – – (277.1)
Bank loans (i) 4.41% – – (424.3) (212.9) (637.2)
Finance lease liabilities 10.00% – (0.1) (0.2) (0.3)
(277.1) (0.1) (424.5) (212.9) (914.6)
(i) Excludes deferred borrowing costs of $4.0m (2014: $5.3m).
ANNUAL REPORT 2014/201582
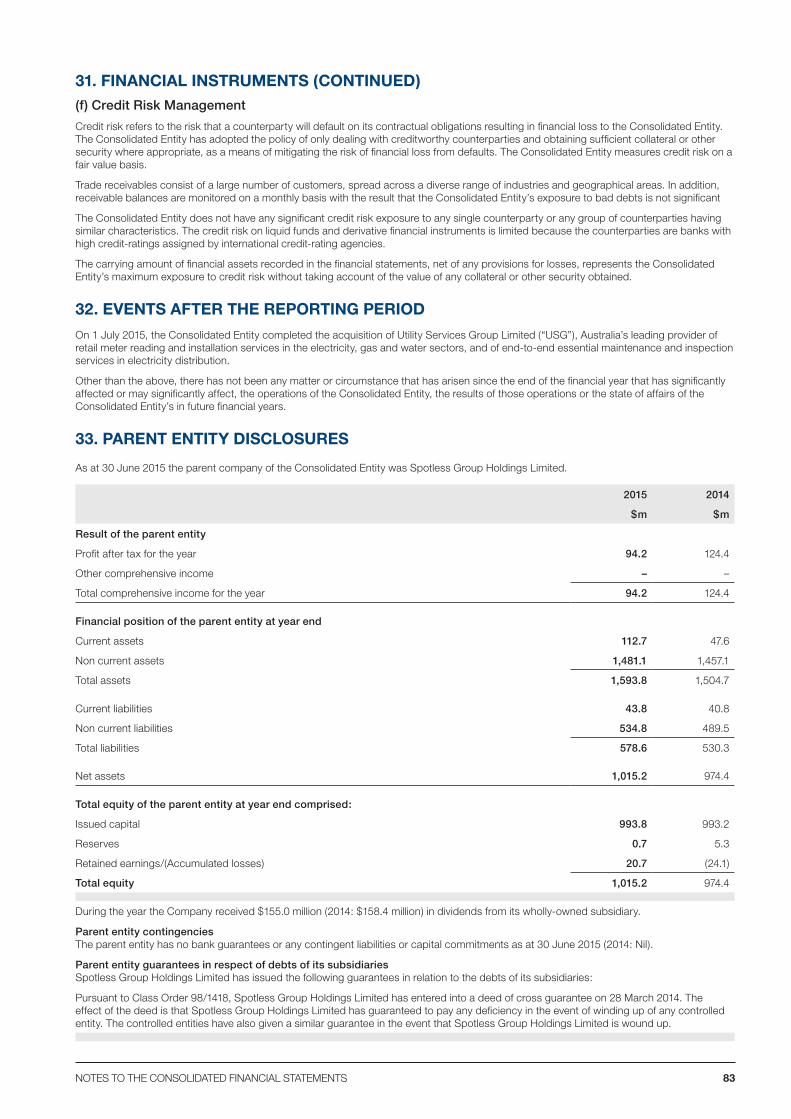
31. FINANCIAL INSTRUMENTS (CONTINUED)(f) Credit Risk Management
Credit risk refers to the risk that a counterparty will default on its contractual obligations resulting in financial loss to the Consolidated Entity. The Consolidated Entity has adopted the policy of only dealing with creditworthy counterparties and obtaining sufficient collateral or other security where appropriate, as a means of mitigating the risk of financial loss from defaults. The Consolidated Entity measures credit risk on a fair value basis.
Trade receivables consist of a large number of customers, spread across a diverse range of industries and geographical areas. In addition, receivable balances are monitored on a monthly basis with the result that the Consolidated Entity’s exposure to bad debts is not significant
The Consolidated Entity does not have any significant credit risk exposure to any single counterparty or any group of counterparties having similar characteristics. The credit risk on liquid funds and derivative financial instruments is limited because the counterparties are banks with high credit-ratings assigned by international credit-rating agencies.
The carrying amount of financial assets recorded in the financial statements, net of any provisions for losses, represents the Consolidated Entity’s maximum exposure to credit risk without taking account of the value of any collateral or other security obtained.
32. EVENTS AFTER THE REPORTING PERIOD
On 1 July 2015, the Consolidated Entity completed the acquisition of Utility Services Group Limited (“USG”), Australia’s leading provider of retail meter reading and installation services in the electricity, gas and water sectors, and of end-to-end essential maintenance and inspection services in electricity distribution.
Other than the above, there has not been any matter or circumstance that has arisen since the end of the financial year that has significantly affected or may significantly affect, the operations of the Consolidated Entity, the results of those operations or the state of affairs of the Consolidated Entity’s in future financial years.
33. PARENT ENTITY DISCLOSURES
As at 30 June 2015 the parent company of the Consolidated Entity was Spotless Group Holdings Limited.
2015 2014
$m $m
Result of the parent entity
Profit after tax for the year 94.2 124.4
Other comprehensive income – –
Total comprehensive income for the year 94.2 124.4
Financial position of the parent entity at year end
Current assets 112.7 47.6
Non current assets 1,481.1 1,457.1
Total assets 1,593.8 1,504.7
Current liabilities 43.8 40.8
Non current liabilities 534.8 489.5
Total liabilities 578.6 530.3
Net assets 1,015.2 974.4
Total equity of the parent entity at year end comprised:
Issued capital 993.8 993.2
Reserves 0.7 5.3
Retained earnings/(Accumulated losses) 20.7 (24.1)
Total equity 1,015.2 974.4
During the year the Company received $155.0 million (2014: $158.4 million) in dividends from its wholly-owned subsidiary.
Parent entity contingencies The parent entity has no bank guarantees or any contingent liabilities or capital commitments as at 30 June 2015 (2014: Nil).
Parent entity guarantees in respect of debts of its subsidiaries Spotless Group Holdings Limited has issued the following guarantees in relation to the debts of its subsidiaries:
Pursuant to Class Order 98/1418, Spotless Group Holdings Limited has entered into a deed of cross guarantee on 28 March 2014. The effect of the deed is that Spotless Group Holdings Limited has guaranteed to pay any deficiency in the event of winding up of any controlled entity. The controlled entities have also given a similar guarantee in the event that Spotless Group Holdings Limited is wound up.
83NOTES TO THE CONSOLIDATED FINANCIAL STATEMENTS
Auditor’s Independence Declaration
A member firm of Ernst & Young Global LimitedLiability limited by a scheme approved under Professional Standards Legislation
Ernst & Young8 Exhibition StreetMelbourne VIC 3000 AustraliaGPO Box 67 Melbourne VIC 3001
Tel: +61 3 9288 8000Fax: +61 3 8650 7777ey.com/au
Auditor’s Independence Declaration to the Directors of SpotlessGroup Holdings Limited
In relation to our audit of the financial report of Spotless Group Holdings Limited for the financial yearended 30 June 2015, to the best of our knowledge and belief, there have been no contraventions of theauditor independence requirements of the Corporations Act 2001 or any applicable code of professionalconduct.
Ernst & Young
Tim Wallace Michael CollinsPartner Partner
25 August 2015
ANNUAL REPORT 2014/201584
Directors’ Declaration
The Directors of Spotless Group Holdings Limited declare that in the opinion of the Directors:
(a) the financial statements and notes thereto are in accordance with the Corporations Act 2001 (“the Act”) including:
i. giving a true and fair view of the consolidated entity’s financial position as at 30 June 2015 and of its performance for the financial year ended on that date; and
ii. complying with Australian Accounting Standards and the Corporations Regulations 2001;
(b) the financial statements and notes also comply with International Financial Reporting Standards as disclosed in Note 2; and
(c) there are reasonable grounds to believe that the Company will be able to pay its debts as and when they become due and payable.
Signed in accordance with a resolution of the Directors.
On behalf of the Board of Directors
M Jackson AC Chairman
Melbourne, 25 August 2015
B Dixon Chief Executive Officer and Managing Director
Melbourne, 25 August 2015
85DIRECTORS’ DECLARATION
Auditor’s Report
A member firm of Ernst & Young Global LimitedLiability limited by a scheme approved under Professional Standards Legislation
Ernst & Young8 Exhibition StreetMelbourne VIC 3000 AustraliaGPO Box 67 Melbourne VIC 3001
Tel: +61 3 9288 8000Fax: +61 3 8650 7777ey.com/au
Independent auditor's report to the members of Spotless GroupHoldings Limited
Report on the financial report
We have audited the accompanying financial report of Spotless Group Holdings Limited, whichcomprises the consolidated statement of financial position as at 30 June 2015, the consolidatedstatement of comprehensive income, the consolidated statement of changes in equity and theconsolidated statement of cash flows for the year then ended, notes comprising a summary of significantaccounting policies and other explanatory information, and the directors' declaration of the consolidatedentity comprising the company and the entities it controlled at the year's end or from time to time duringthe financial year.
Directors' responsibility for the financial report
The directors of the company are responsible for the preparation of the financial report that gives a trueand fair view in accordance with Australian Accounting Standards and the Corporations Act 2001 and forsuch internal controls as the directors determine are necessary to enable the preparation of the financialreport that is free from material misstatement, whether due to fraud or error. In Note 2, the directors alsostate, in accordance with Accounting Standard AASB 101 Presentation of Financial Statements, that thefinancial statements comply with International Financial Reporting Standards.
Auditor's responsibility
Our responsibility is to express an opinion on the financial report based on our audit. We conducted ouraudit in accordance with Australian Auditing Standards. Those standards require that we comply withrelevant ethical requirements relating to audit engagements and plan and perform the audit to obtainreasonable assurance about whether the financial report is free from material misstatement.
An audit involves performing procedures to obtain audit evidence about the amounts and disclosures inthe financial report. The procedures selected depend on the auditor's judgment, including theassessment of the risks of material misstatement of the financial report, whether due to fraud or error. Inmaking those risk assessments, the auditor considers internal controls relevant to the entity'spreparation and fair presentation of the financial report in order to design audit procedures that areappropriate in the circumstances, but not for the purpose of expressing an opinion on the effectivenessof the entity's internal controls. An audit also includes evaluating the appropriateness of accountingpolicies used and the reasonableness of accounting estimates made by the directors, as well asevaluating the overall presentation of the financial report.
We believe that the audit evidence we have obtained is sufficient and appropriate to provide a basis forour audit opinion.
Independence
In conducting our audit we have complied with the independence requirements of the Corporations Act2001. We have given to the directors of the company a written Auditor’s Independence Declaration, acopy of which is included in the directors’ report.
ANNUAL REPORT 2014/201586
A member firm of Ernst & Young Global LimitedLiability limited by a scheme approved under Professional Standards Legislation
Page 2
Opinion
In our opinion:
a. the financial report of Spotless Group Holdings Limited is in accordance with the Corporations Act2001, including:
i. giving a true and fair view of the consolidated entity's financial position as at 30 June 2015 andof its performance for the year ended on that date; and
ii. complying with Australian Accounting Standards and the Corporations Regulations 2001; and
b. the financial report also complies with International Financial Reporting Standards as disclosed inNote 2.
Report on the remuneration report
We have audited the Remuneration Report included in the directors' report for the year ended30 June 2015. The directors of the company are responsible for the preparation and presentation of theRemuneration Report in accordance with section 300A of the Corporations Act 2001. Our responsibilityis to express an opinion on the Remuneration Report, based on our audit conducted in accordance withAustralian Auditing Standards.
Opinion
In our opinion, the Remuneration Report of Spotless Group Holdings Limited for the year 30 June 2015complies with section 300A of the Corporations Act 2001.
Ernst & Young
Tim Wallace Michael CollinsPartner Partner
Melbourne25 August 2015
87AUDITOR’S REPORT
Shareholder InformationAs at 1 September 2015
Spotless has one class of shares on issue, being ordinary shares. All of Spotless’ shares are listed on the Australian Securities Exchange.
DISTRIBUTION OF SHAREHOLDERSThe distribution of the number of holders of shares was as follows:
Size of holding Number of shareholders Number of shares held % of issued capital
1 – 1,000 325 142,412 0.01
1,001 – 5,000 628 1,905,771 0.17
5,001 – 10,000 642 4,977,612 0.45
10,001 – 100,000 1,366 37,214,417 3.39
100,001 – and over 135 1,054,049,966 95.97
Total 3,096 1,098,290,178 100.00
The number of shareholders holding less than a marketable parcel of shares was 121.
As at 1 September 2015 there were 4,262,606 unquoted options on issue held by executives pursuant to the Spotless executive Long Term Incentive Plan.
TWENTY LARGEST SHAREHOLDERSThe names of the 20 largest holders of shares are as follows:
Rank Name Number of shares held % of issued capital
1 HSBC CUSTODY NOMINEES (AUSTRALIA) LIMITED 347,514,567 31.64%
2 J P MORGAN NOMINEES AUSTRALIA LIMITED 240,260,846 21.88%
3 NATIONAL NOMINEES LIMITED 201,724,782 18.37%
4 CITICORP NOMINEES PTY LIMITED 50,675,079 4.61%
5 BNP PARIBAS NOMS PTY LTD <DRP> 32,651,827 2.97%
6 MORGAN STANLEY AUSTRALIA SECURITIES (NOMINEE) PTY LIMITED <NO 1 ACCOUNT>
20,362,403 1.85%
7 CS FOURTH NOMINEES PTY LTD 19,710,011 1.79%
8 BRISPOT NOMINEES PTY LTD <HOUSE HEAD NOMINEE NO 1 A/C> 17,216,284 1.57%
9 UBS NOMINEES PTY LTD 15,094,202 1.37%
10 MS VITA PEPE 9,799,293 0.89%
11 CITICORP NOMINEES PTY LIMITED <COLONIAL FIRST STATE INV A/C> 8,673,499 0.79%
12 MERRILL LYNCH (AUSTRALIA) NOMINEES PTY LIMITED 8,557,053 0.78%
13 MR BRUCE ROBERT DIXON 5,752,324 0.52%
14 NATIONAL NOMINEES LIMITED <DB A/C> 5,321,671 0.48%
15 HSBC CUSTODY NOMINEES (AUSTRALIA) LIMITED – A/C 3 5,118,182 0.47%
16 UBS WEALTH MANAGEMENT AUSTRALIA NOMINEES PTY LTD 5,091,694 0.46%
17 PEPE CORPORATION PTY LTD <VITA PEPE SUPER FUND A/C> 4,632,515 0.42%
18 HSBC CUSTODY NOMINEES (AUSTRALIA) LIMITED <NT-COMNWLTH SUPER CORP A/C>
4,584,233 0.42%
19 SANDHURST TRUSTEES LTD <DMP ASSET MANAGEMENT A/C> 3,442,599 0.31%
20 SHARE DIRECT NOMINEES PTY LTD <10026 A/C> 3,000,000 0.27%
ANNUAL REPORT 2014/201588
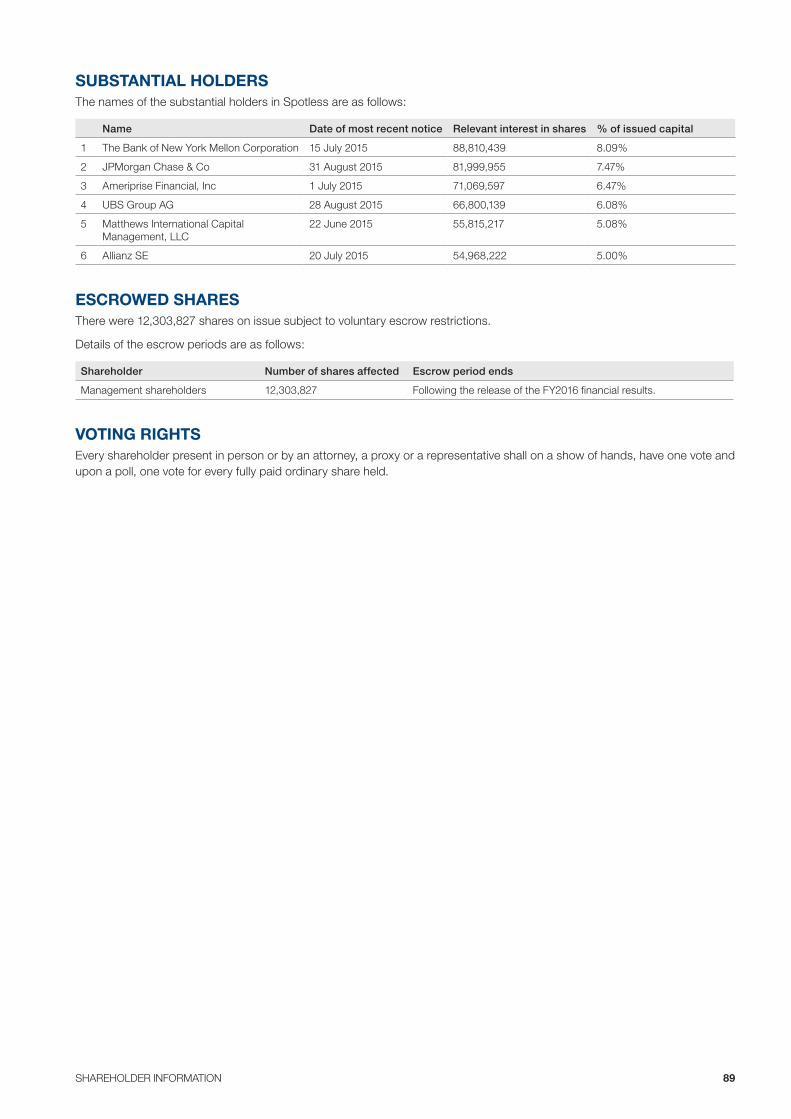
SUBSTANTIAL HOLDERSThe names of the substantial holders in Spotless are as follows:
Name Date of most recent notice Relevant interest in shares % of issued capital
1 The Bank of New York Mellon Corporation 15 July 2015 88,810,439 8.09%
2 JPMorgan Chase & Co 31 August 2015 81,999,955 7.47%
3 Ameriprise Financial, Inc 1 July 2015 71,069,597 6.47%
4 UBS Group AG 28 August 2015 66,800,139 6.08%
5 Matthews International Capital Management, LLC
22 June 2015 55,815,217 5.08%
6 Allianz SE 20 July 2015 54,968,222 5.00%
ESCROWED SHARESThere were 12,303,827 shares on issue subject to voluntary escrow restrictions.
Details of the escrow periods are as follows:
Shareholder Number of shares affected Escrow period ends
Management shareholders 12,303,827 Following the release of the FY2016 financial results.
VOTING RIGHTSEvery shareholder present in person or by an attorney, a proxy or a representative shall on a show of hands, have one vote and upon a poll, one vote for every fully paid ordinary share held.
SHAREHOLDER INFORMATION 89
Corporate Directory
SPOTLESS GROUP HOLDINGS LIMITED ABN 27 154 229 562
DIRECTORSMargaret Jackson AC (Chairman)Bruce Dixon (Chief Executive Officer and Managing Director)Diane Grady AMGarry HounsellThe Hon. Nick SherryRobert KoczkarGeoffrey Hutchinson
COMPANY SECRETARYPaul Morris
AUDITORErnst & Young8 Exhibition StreetMelbourne, VIC, 3000, Australia
LEGAL ADVISERGilbert & Tobin2 Park StreetSydney, NSW, 2000, Australia
SECURITY EXCHANGE LISTINGSpotless Group Holdings Limited (SPO)
– Australian Securities Exchange (ASX)
SHARE REGISTRYLink Market Services LimitedLevel 12, 680 George StreetSydney, NSW, 2000, Australia
Telephone: +61 1300 554 474Fax: +61 2 9287 0303
REGISTERED OFFICEAustralia Spotless Group Holdings Limited549 St Kilda Rd,Melbourne, VIC, 3004, Australia
Telephone: +61 3 9269 7600
CORPORATE WEBSITEhttp://www.spotless.com
ANNUAL REPORT 2014/201590