sppa-d3000 plant monitor technical description
TRANSCRIPT

1 © Siemens AG 2010. All Rights Reserved.
Instrumentation & Control,
Answers for energy.
SPPA-D3000 Plant MonitorTechnical Description
Model-based monitoring and early fault detection for components and processes June 2010
Instrumentation, Controls & Electrical

© Siemens AG 2010. All Rights Reserved. 2
Siemens Energy Sector Instrumentation, Controls & Electrical
Contents Contents .........................................................................................................................................................2
1 Introduction...............................................................................................................................................3 1.1 Applications ..................................................................................................................................3 1.2 System components .....................................................................................................................3 1.3 Interfaces and integration .............................................................................................................3
2 Model-based condition monitoring............................................................................................................5 2.1 Method of operation of Plant Monitor models ...............................................................................5
3 Generate model and learn normal behavior .............................................................................................7 3.1 Generating models .......................................................................................................................7 3.2 Training models ............................................................................................................................9 3.3 Preprocessing in Plant Monitor projects ...................................................................................13 3.4 Prediction of Plant Monitor warnings ........................................................................................13 3.5 Learning of residual thresholds .................................................................................................14 3.6 Calculation of soft sensors ........................................................................................................15 3.7 Validation of sensor signals.......................................................................................................16 3.8 Definition of rules .......................................................................................................................19 3.9 Changing models .......................................................................................................................20 3.10 Implementing complex monitoring structures with Plant Monitor projects...............................21 3.11 Extended analysis of results of models.....................................................................................21 3.12 Parameterization of models and functions................................................................................22 3.13 Networking of models ................................................................................................................23
4 Operation and analysis...........................................................................................................................24 4.1 Alarm annunciation and operation ..............................................................................................24 4.2 Analysis ......................................................................................................................................26
Technical data ..............................................................................................................................................28 4.3 SPPA-T3000 technology server ................................................................................................28 4.4 SPPA-D3000 Plant Monitor .......................................................................................................29
5 Abbreviations..........................................................................................................................................30

3 © Siemens AG 2010. All Rights Reserved.
Siemens Energy Sector Instrumentation, Controls & Electrical
1 Introduction 1.1 Applications SPPA-D3000 Plant Monitor is one of the solutions in the SPPA-D3000 Diagnostic Suite portfolio (SPPA Siemens Power Plant Automation). It permits continuous evaluation of the conditions of components and processes. Condition evaluation is performed with the help of a model-based description of the conditions of the components and processes to be monitored. The data-driven neural models which are employed here make it possible to dispense with costly engineering. The models are generated and completely engineered based exclusively on archived measured data, as all the relevant information about the physical interaction between components and processes, as well as the entire history, are already available in full. However the Plant Monitor models for condition monitoring are only part of a comprehensive range of functions designed either for preprocessing, i.e. as input for Plant Monitor models, or as model add-ons. This range of functions including the Plant Monitor models is referred to as a Plant Monitor project.
1.2 System components Only two components are required for the operation of SPPA-D3000 Plant Monitor: a Plant Monitor license and a technology server from the Siemens SPPA-T3000 I&C system. The Plant Monitor license comprises a range of functions which are available as an autonomous group of function blocks in T3000. Each function can be activated individually by means of a license. The functions can be booked in different denominations and make it possible for the user to create any number of models of different sizes and for a wide variety of applications and to vary these without any problems at any time. Model generation, data-driven engineering and other functions are performed on the SPPA-T3000 technology server, which fulfils all the requirements for operation, data management, training, analysis and reporting of models, and of detected condition changes.
1.3 Interfaces and integration Plant Monitor is basically used in two different ways:
As a fully integrated component in release R4.2 or higher of the SPPA-T3000 I&C system or
In stand-alone operation in the case of all older Siemens I&C systems or I&C systems from third-party suppliers
If Plant Monitor is used in conjunction with release R4.2 or higher of the SPPA-T3000 I&C system, it seamlessly integrates into the existing architecture and uses the same planning and engineering environment. Plant Monitor can therefore be operated from any thin client within the framework of SPPA-T3000 user rights. Furthermore all results and analyses from Plant Monitor can be immediately incorporated in existing plant displays. The full range of functions of SPPA-T3000 "Embedded Component Service" (ECSTM) is also provided.

© Siemens AG 2010. All Rights Reserved. 4
Siemens Energy Sector Instrumentation, Controls & Electrical
Even if Plant Monitor is not used with SPPA-T3000, engineering, operation and analysis are still retained in full thanks to the technology server platform. If, for example, measured data are exported via OPC from another I&C system or from a PI archive, the technology server then constitutes an autonomous SPPA-T3000 system. It features the same convenient features and advantages as the integrated variant, as the most important elements of ECSTM are also available with this variant. With the stand-alone variant, however, measured values supplied, for example, by SPPA-D3000 Machinery Protection via Profibus DP can also be used directly and without a link to the S7 automation server. In such cases and with other similar links, the bus signals are read in by means of a SIMATIC Microbox and made available via OPC.
Topology of network interface of Plant Monitor in the case of connection to older Siemens I&C systems or I&C systems from third-party suppliers
On the left: Topology of network interface of Plant Monitor on the technology server with SPPA-T3000 projects - Release 4.2 or higher On the right: Diagrammatic representation of Embedded Component ServicesTM architecture of SPPA-T3000
User interface
Servers
Process interfaces
Application Server
Plant Monitoron the
Technology Server
AutomationServer
User interface
Servers
Process interfaces
Application Server
Plant Monitoron the
Technology Server
AutomationServer
User interface
Servers
Process interfaces
Application Server
Plant Monitoron the
Technology Server
AutomationServer
Data sources Plant Monitor
Non-Siemens I&Corany other data sourcesvia OPC
Thin Client
Plant Monitoron the
SPPA-T3000 Technology Server
Process interfaces
User interface
OPC Server
Engin-eering
Data
System SW
Diag-nosticData
System SW
WebServer(Java)
Archive
Data
System SWSystem SW
Data
System SW
HMI
Data
System SW
Auto-mation
Engin-eering
Data
System SW
Diag-nosticData
System SW
WebServer(Java)
Archive
Data
System SWSystem SW
Data
System SW
HMI
Data
System SW
Auto-mation
5 © Siemens AG 2010. All Rights Reserved.
Siemens Energy Sector Instrumentation, Controls & Electrical
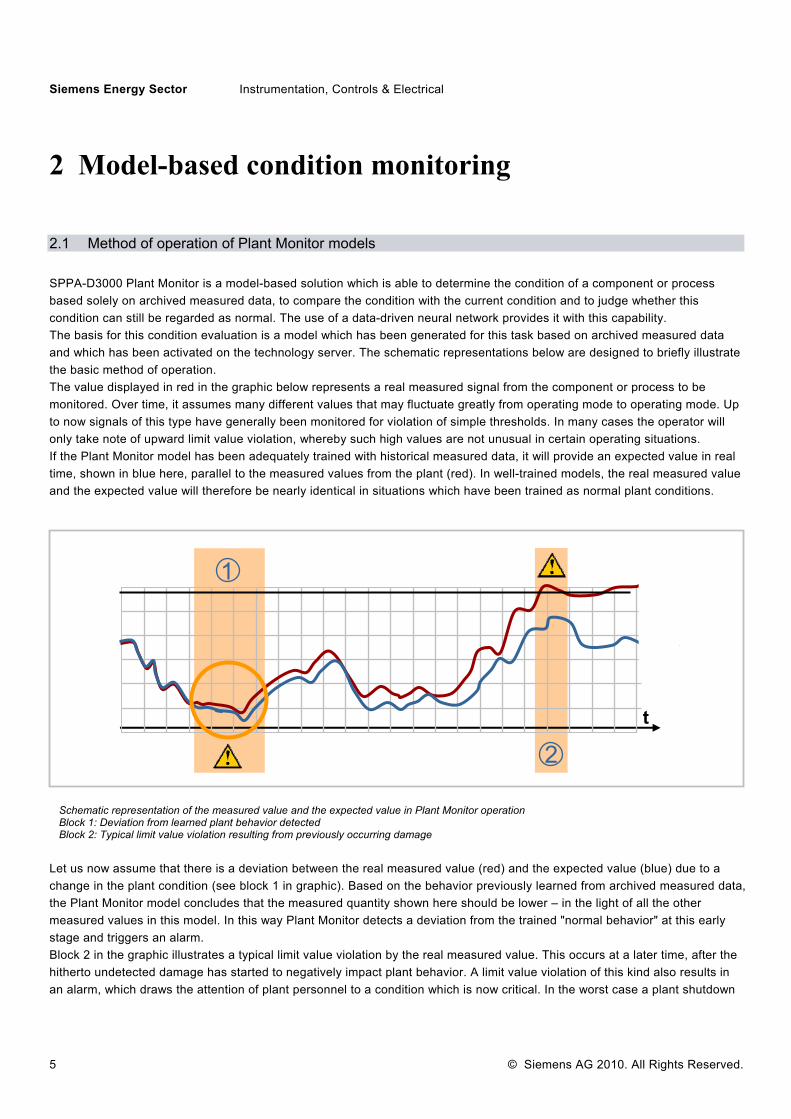
2 Model-based condition monitoring 2.1 Method of operation of Plant Monitor models SPPA-D3000 Plant Monitor is a model-based solution which is able to determine the condition of a component or process based solely on archived measured data, to compare the condition with the current condition and to judge whether this condition can still be regarded as normal. The use of a data-driven neural network provides it with this capability. The basis for this condition evaluation is a model which has been generated for this task based on archived measured data and which has been activated on the technology server. The schematic representations below are designed to briefly illustrate the basic method of operation. The value displayed in red in the graphic below represents a real measured signal from the component or process to be monitored. Over time, it assumes many different values that may fluctuate greatly from operating mode to operating mode. Up to now signals of this type have generally been monitored for violation of simple thresholds. In many cases the operator will only take note of upward limit value violation, whereby such high values are not unusual in certain operating situations. If the Plant Monitor model has been adequately trained with historical measured data, it will provide an expected value in real time, shown in blue here, parallel to the measured values from the plant (red). In well-trained models, the real measured value and the expected value will therefore be nearly identical in situations which have been trained as normal plant conditions.
Let us now assume that there is a deviation between the real measured value (red) and the expected value (blue) due to a change in the plant condition (see block 1 in graphic). Based on the behavior previously learned from archived measured data, the Plant Monitor model concludes that the measured quantity shown here should be lower – in the light of all the other measured values in this model. In this way Plant Monitor detects a deviation from the trained "normal behavior" at this early stage and triggers an alarm. Block 2 in the graphic illustrates a typical limit value violation by the real measured value. This occurs at a later time, after the hitherto undetected damage has started to negatively impact plant behavior. A limit value violation of this kind also results in an alarm, which draws the attention of plant personnel to a condition which is now critical. In the worst case a plant shutdown
t
1
2
Schematic representation of the measured value and the expected value in Plant Monitor operation Block 1: Deviation from learned plant behavior detected Block 2: Typical limit value violation resulting from previously occurring damage

© Siemens AG 2010. All Rights Reserved. 6
Siemens Energy Sector Instrumentation, Controls & Electrical
becomes necessary with significantly greater financial consequences than would have been required to promptly rectify the original damage. Plant Monitor can detect cases similar to that illustrated in block 1 long before a limit value violation has occurred. This is a huge advantage, especially in situations where the deviation from the trained normal behavior is detected in one of those measured variables of the condition model which will not result in any limit value violation in the immediate future. In this case Plant Monitor promptly offers the user a correct analysis based on a comparison with the learned behavior, thereby clearly demonstrating its superiority to traditional monitoring methods. The plant section in which the deviation is detected can be examined during the next inspection and overhaul, and parts subject to wear can be replaced at a fraction of the cost which would have been incurred by an unscheduled outage. Deviations from normal behavior, i.e. points where the real measured value and the expected value calculated by Plant Monitor do not match, are most easily recognized by monitoring the residual, i.e. the difference between the measured value and the expected value. The residual associated with this schematic example is shown in the diagram below.
As expected, the residual for the time up to t0 is still low, as the measured value and the expected value are almost identical. However the residual after t0 regularly exceeds the limit value defined for alarm triggering. Plant Monitor monitors the residual in real time and immediately issues an alarm for each major deviation. Plant Monitor would also output the deviation to the alarm sequence display at time t0 in this example. The user is thereby informed about the possible problem and can immediately navigate to the associated plant display or initiate a preliminary analysis without delay as he or she can jump directly to the abnormal measured value from the alarm sequence display. Because time t0 occurs long before time range 2 in the previous graphic where the critical limit value violation occurs, there is still enough time to decide on the best plan of action. It can therefore be seen that Plant Monitor detects deviations from normal behavior much earlier than simple limit value monitoring systems. This offers the operator the opportunity to react promptly to changes before there is any risk of damage or a production outage.
0t
t0
RES
Display of residual by Plant Monitor

7 © Siemens AG 2010. All Rights Reserved.
Siemens Energy Sector Instrumentation, Controls & Electrical
3 Generate model and learn normal behavior 3.1 Generating models Plat Monitor is capable of monitoring for the normal condition of all processes and components in the power plant. The conditions which are included in one or more Plant Monitor models and which are monitored as a consequence depend entirely on the measured values selected by the user. The source of these values in the power plant is of no significance. For example, all the blowers in a subsystem can be grouped together, as can individual machines or entire process or plant sections. The only important thing is that phenomena which affect operating behavior and which must therefore be detected are reflected in these measured variables or can be derived from them. Up to now it has proven meaningful for practical applications to take into consideration all the data tags of a machine for the purposes of modeling and monitoring. Also included are measured values from the plant which have an effect on the condition and the control of these machines. For example, when monitoring a gas turbine, in addition to the values measured on the gas turbine, values which have an effect on power output, condition or service life but which are not measured directly on the gas turbine should also be taken into account, e.g. ambient temperature and pressure. Unlike most classical systems, Plant Monitor actually generates the model fully automatically from the list of available tags with the help of Plant Monitor's neural network. If Plant Monitor is operated in an integrated application, i.e. in conjunction with SPPA-T3000, all the tags currently defined in the project container are displayed for selection. The user selects the tags which are of interest from this list. In all other applications, the archived tags are read out from data sources accessible by the technology server, e.g. via OPC DA/HDA, and are displayed for selection in a process similar to that for the integrated application. This selection creates the basic conditions required for modeling. Models can now be generated for monitoring by Plant Monitor. Selection of instrumentation channels used for modeling in the Plant Monitor input mask

© Siemens AG 2010. All Rights Reserved. 8
Siemens Energy Sector Instrumentation, Controls & Electrical
Each model is represented in the form of so-called blocks or automation functions. Each task is represented by a separate block in the SPPA-D3000 Plant Monitor function diagram. All of these blocks, in addition to a header block used for model administration and parameterization, are linked to form a model.
The user does not need to draw the function diagrams, as they are generated automatically by the Plant Monitor engineering tool. Several models can be created in a project and linked within SPPA-T3000. The results from state estimators and other monitoring functions in plant displays and alarm lists are transferred through application of the integrated engineering methods of SPPA-T3000 ECSTM.
Editing of signals used in the model in the SPPA-T3000 Workbench editor (function diagram of model)
5A00F901A_XQ01 TOTAL_AIR_FLOW_MEAS_1
5A12T010_XQ01 FD_FAN_A_MOT_WINDING_TEMP
5A11P010_XQ01 FD_FAN_A_OUTLET_AIR_PRESS

9 © Siemens AG 2010. All Rights Reserved.
Siemens Energy Sector Instrumentation, Controls & Electrical
3.2 Training models Once the tags relevant for monitoring a component or process have been selected, the model can be trained. In this context training means that a time range from the archive during which the relevant component or process was in a condition regarded as normal is made available to the model. Normal usually means "unimpaired", but not necessarily "optimal". For example, irregular operating behavior of a component can be regarded as normal if it has been identical for many years and has not become any worse. This time range is selected for training directly in Plant Monitor with minimum effort using the calendar function or a graphical display. The time resolution for training can be selected independently of the graphical display. This is especially useful if a time range is displayed with a low resolution when training periods are being selected although a higher resolution is required for training. In this case any resolution can be selected for training. Non-consecutive time ranges can be selected when defining a training period. Every plant behavior regarded as normal can therefore be included, even if long intervals occur between the individual time ranges.
Selection of training data and resolution in Plant Monitor view

© Siemens AG 2010. All Rights Reserved. 10
Siemens Energy Sector Instrumentation, Controls & Electrical
The selection of training times allows the model to familiarize itself with the normal behavior of the component or process in the initial training phase. The time required for this training phase is usually a few hours or days, provided no extremely changeable behavior spanning several months needs to be taken into account (a longer training period is required in such cases). Once a satisfactory result has been obtained and Plant Monitor only detects comparatively minor deviations between the measured value and the model value when new training data are introduced, the initial training phase can be concluded.
Selection of normal behavior for training a model (marked in blue) in the Plant Monitor operating window
Display of training results with overview of deviations in the upper window highlighted by red error bars
Deviation (residual)
Threshold for residual
Deviation too great
Estimated valueMeasured value
Deviation (residual)
Threshold for residual
Deviation too great
Estimated valueMeasured value
5O21M900S_XQ01_BFPT_A_SPEED_1V2
11 © Siemens AG 2010. All Rights Reserved.
Siemens Energy Sector Instrumentation, Controls & Electrical
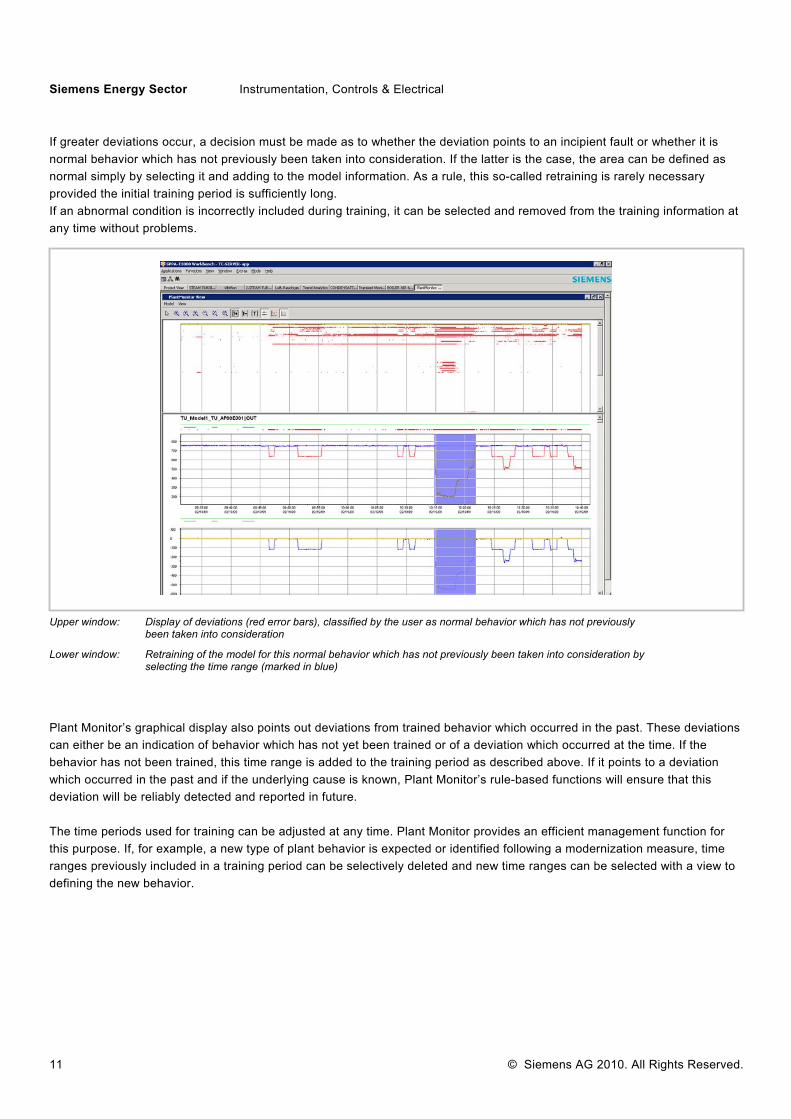
If greater deviations occur, a decision must be made as to whether the deviation points to an incipient fault or whether it is normal behavior which has not previously been taken into consideration. If the latter is the case, the area can be defined as normal simply by selecting it and adding to the model information. As a rule, this so-called retraining is rarely necessary provided the initial training period is sufficiently long. If an abnormal condition is incorrectly included during training, it can be selected and removed from the training information at any time without problems. Plant Monitor’s graphical display also points out deviations from trained behavior which occurred in the past. These deviations can either be an indication of behavior which has not yet been trained or of a deviation which occurred at the time. If the behavior has not been trained, this time range is added to the training period as described above. If it points to a deviation which occurred in the past and if the underlying cause is known, Plant Monitor’s rule-based functions will ensure that this deviation will be reliably detected and reported in future. The time periods used for training can be adjusted at any time. Plant Monitor provides an efficient management function for this purpose. If, for example, a new type of plant behavior is expected or identified following a modernization measure, time ranges previously included in a training period can be selectively deleted and new time ranges can be selected with a view to defining the new behavior.
Upper window: Display of deviations (red error bars), classified by the user as normal behavior which has not previously been taken into consideration
Lower window: Retraining of the model for this normal behavior which has not previously been taken into consideration by selecting the time range (marked in blue)

© Siemens AG 2010. All Rights Reserved. 12
Siemens Energy Sector Instrumentation, Controls & Electrical
A trained model is generally applied to the overall plant behavior, irrespective of the operating condition which was active during the selected training periods. However Plant Monitor also makes it possible to apply a model for a particular operating condition only. If the plant or process is not in this operating condition, no monitoring is performed. Monitoring of the selected operating condition features a high degree of accuracy, as Plant Monitor restricts itself to the learned behavior for the selected operating condition.
Management of selected training times in Plant Monitor view. Training times are used as jump labels.
Invalid data areas are hidden so as to make monitoring more sensitive and transparent.
No residual calculated
13 © Siemens AG 2010. All Rights Reserved.
Siemens Energy Sector Instrumentation, Controls & Electrical
3.3 Preprocessing in Plant Monitor projects The functionality of Plant Monitor V2.0 does not restrict itself to the calculation of expected values and to monitoring of the normal behavior of processes and plants. The models of the latest version and the condition monitoring generated from them are simply one part, albeit central, of an extensive Plant Monitor project. Plant Monitor projects now also include the following functions:
Alarm prediction Learning of (residual) thresholds Calculation of soft sensors Validation and testing of sensor signals and data quality Definition of rules
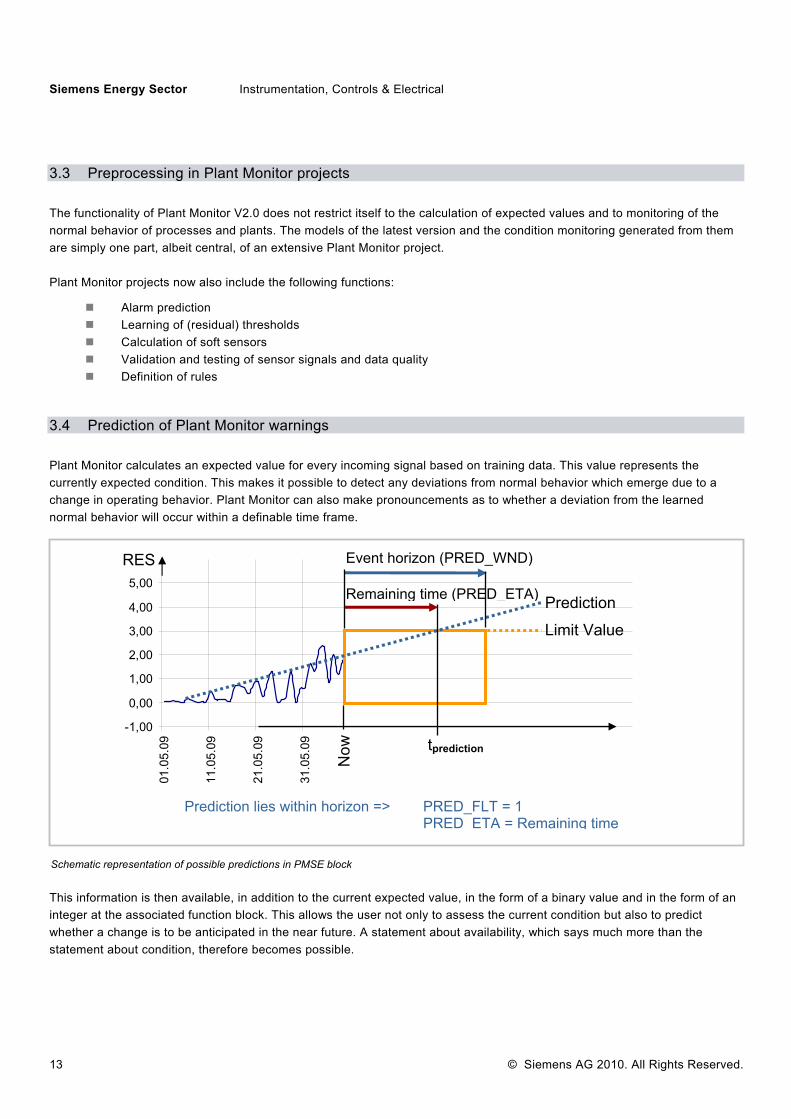
3.4 Prediction of Plant Monitor warnings Plant Monitor calculates an expected value for every incoming signal based on training data. This value represents the currently expected condition. This makes it possible to detect any deviations from normal behavior which emerge due to a change in operating behavior. Plant Monitor can also make pronouncements as to whether a deviation from the learned normal behavior will occur within a definable time frame. This information is then available, in addition to the current expected value, in the form of a binary value and in the form of an integer at the associated function block. This allows the user not only to assess the current condition but also to predict whether a change is to be anticipated in the near future. A statement about availability, which says much more than the statement about condition, therefore becomes possible.
Schematic representation of possible predictions in PMSE block
-1,00
0,00
1,00
2,00
3,00
4,00
5,00
01.0
5.09
11.0
5.09
21.0
5.09
31.0
5.09
Limit Value
Event horizon (PRED_WND)
Prediction Remaining time (PRED_ETA)
RES
tprediction
Prediction lies within horizon => PRED_FLT = 1 PRED ETA = Remaining time
Now
© Siemens AG 2010. All Rights Reserved. 14
Siemens Energy Sector Instrumentation, Controls & Electrical
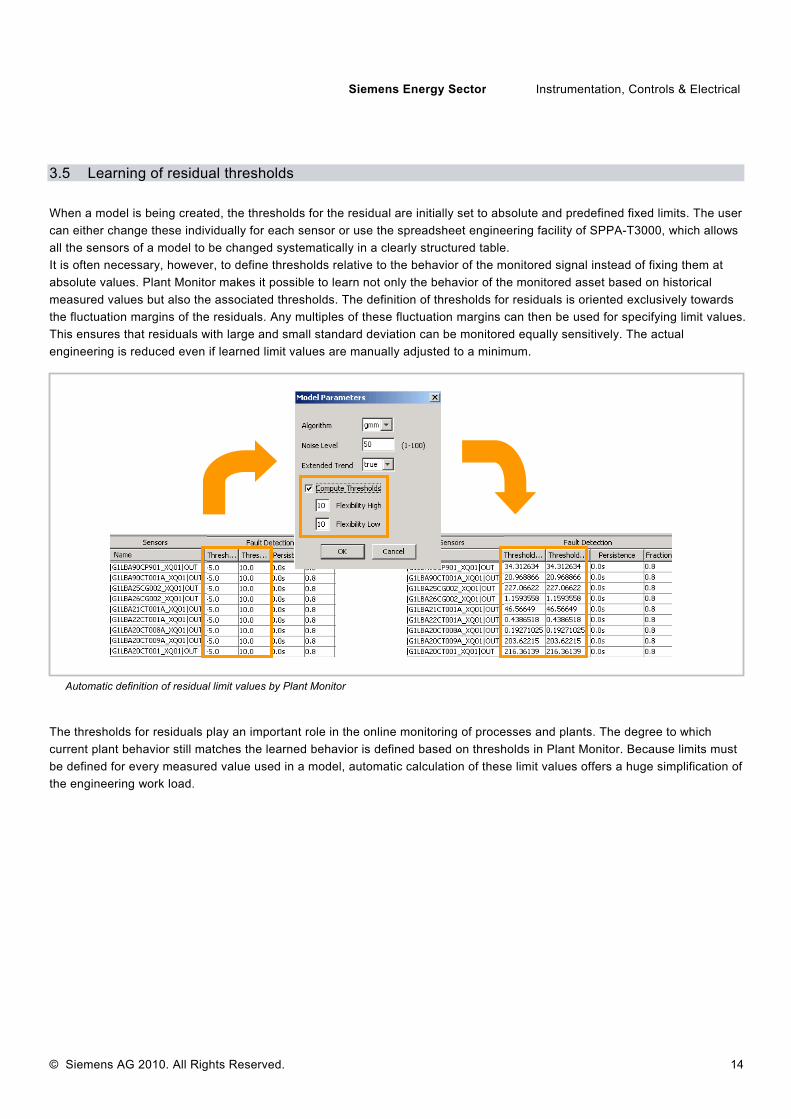
3.5 Learning of residual thresholds When a model is being created, the thresholds for the residual are initially set to absolute and predefined fixed limits. The user can either change these individually for each sensor or use the spreadsheet engineering facility of SPPA-T3000, which allows all the sensors of a model to be changed systematically in a clearly structured table. It is often necessary, however, to define thresholds relative to the behavior of the monitored signal instead of fixing them at absolute values. Plant Monitor makes it possible to learn not only the behavior of the monitored asset based on historical measured values but also the associated thresholds. The definition of thresholds for residuals is oriented exclusively towards the fluctuation margins of the residuals. Any multiples of these fluctuation margins can then be used for specifying limit values. This ensures that residuals with large and small standard deviation can be monitored equally sensitively. The actual engineering is reduced even if learned limit values are manually adjusted to a minimum. The thresholds for residuals play an important role in the online monitoring of processes and plants. The degree to which current plant behavior still matches the learned behavior is defined based on thresholds in Plant Monitor. Because limits must be defined for every measured value used in a model, automatic calculation of these limit values offers a huge simplification of the engineering work load.
Automatic definition of residual limit values by Plant Monitor

15 © Siemens AG 2010. All Rights Reserved.
Siemens Energy Sector Instrumentation, Controls & Electrical
3.6 Calculation of soft sensors It often happens in practice that a number of values are not measured because no instrumentation has been implemented for them or because measuring them is a physical impossibility. In such cases computed sensors, which calculate derived values based on existing sensors, can be defined in Plant Monitor. This makes it possible, for example, to convert the measured power output of a generator into money or to calculate an average temperature. These calculated values can in turn be used directly as new measured variables in the model for the detection of normal behavior and for the prediction of incipient deviations. They can also be used for defining rules and can contribute to the detection of recurring plant behavior, which would only be possible to a limited extent, if at all, on the basis of values measured by purely physical methods.
Creation of computed sensors or soft sensors for the calculation of unmeasured variables
Using the formula editor for the creation of simple rules in Plant Monitor projects
Formula editor Perform actions
List of sensors
List of operators
Formula field
Name for calculated
Delete or edit sequence
Finished formula

© Siemens AG 2010. All Rights Reserved. 16
Siemens Energy Sector Instrumentation, Controls & Electrical
3.7 Validation of sensor signals Plant Monitor can be used not only for predicting expected values and calculating the time which will elapse prior to an alarm, but also for testing (validating) sensor signals. The five tests listed below can be applied to every signal, thus preventing Plant Monitor from accessing measured data which cannot be regarded as valid. This greatly increases the quality of information offered by Plant Monitor, especially for the purposes of training and during normal operation. 1. Test for constant ("stuck") values: This test monitors the input signal to ensure that it has not violated a defined value
range within a specific period of time. If this condition is fulfilled, the signal can be regarded as being constant and actions can be derived from it where appropriate.
Creation of sensors which are tested by means of validation
Schematic representation of sensor validation for “stuck” sensors
47,0048,0049,0050,00
51,0052,0053,0054,00
55,00
09:0
5:01
09:0
5:11
09:0
5:21
09:0
5:31
09:0
6:10
09:0
6:20
09:0
6:30
09:0
7:10
09:0
7:20
09:0
7:30
„Stuck“ value

17 © Siemens AG 2010. All Rights Reserved.
Siemens Energy Sector Instrumentation, Controls & Electrical
2. Sensors and signals with disturbances, such as spikes, in the signal trend can be monitored to ensure that Plant Monitor accesses measured data which are considered normal rather than data from signals in which the level of noise is too high.
3. In addition to the tests listed above, Plant Monitor can also check whether the measured value violates an absolute upper
or lower limit value. This is a simple way of checking whether a value is in the physically correct range.
Schematic representation of sensor validation for limit violations in sensors
Schematic representation of sensor validation for "chattering" sensors
50,00
75,00
100,00
125,00
150,00
09:0
5:01
09:0
5:11
09:0
5:21
09:0
5:31
09:0
6:10
09:0
6:20
09:0
6:30
09:0
7:10
09:0
7:20
09:0
7:30
Deviation too high
75,00
100,00
125,00
150,00
09:0
5:01
09:0
5:11
09:0
5:21
09:0
5:31
09:0
6:10
09:0
6:20
09:0
6:30
09:0
7:10
09:0
7:20
09:0
7:30
Thresholds violated
© Siemens AG 2010. All Rights Reserved. 18
Siemens Energy Sector Instrumentation, Controls & Electrical
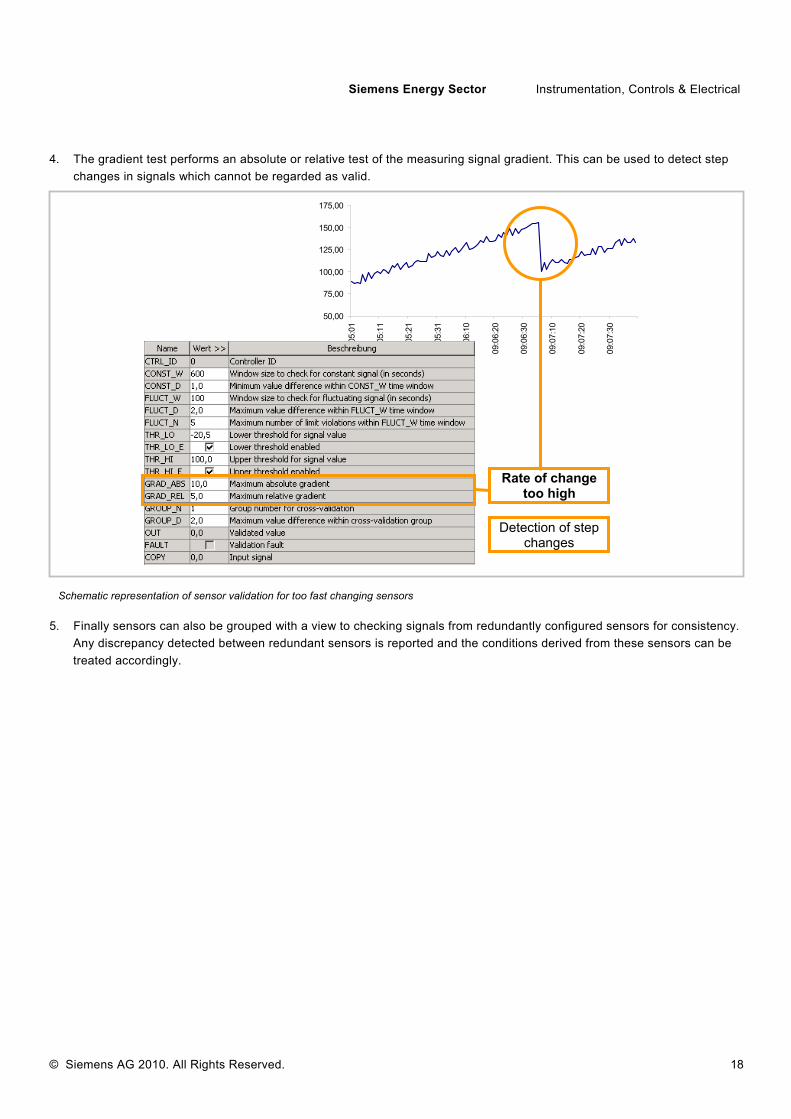
4. The gradient test performs an absolute or relative test of the measuring signal gradient. This can be used to detect step
changes in signals which cannot be regarded as valid. 5. Finally sensors can also be grouped with a view to checking signals from redundantly configured sensors for consistency.
Any discrepancy detected between redundant sensors is reported and the conditions derived from these sensors can be treated accordingly.
50,00
75,00
100,00
125,00
150,00
175,00
09:0
5:01
09:0
5:11
09:0
5:21
09:0
5:31
09:0
6:10
09:0
6:20
09:0
6:30
09:0
7:10
09:0
7:20
09:0
7:30
Rate of change too high
Detection of step changes
Schematic representation of sensor validation for too fast changing sensors

19 © Siemens AG 2010. All Rights Reserved.
Siemens Energy Sector Instrumentation, Controls & Electrical
3.8 Definition of rules Rules can also be defined in Plant Monitor projects in order to enable the automatic detection of recurring events and deviations, for example. Logical links can be configured between these rules with a view to representing complex logic operations. In some cases it is even possible to define damage patterns for automatic detection in this way. The defined rules can easily be visualized in Plant Monitor view, allowing the user to see in detail how the result of a particular rule behaves.
Examples of rules in Plant Monitor
Graphical representation of the defined rules. The validity of the rule is indicated by the red areas in the upper section of the window. The lower section shows the sensor values used for the rules.
© Siemens AG 2010. All Rights Reserved. 20
Siemens Energy Sector Instrumentation, Controls & Electrical
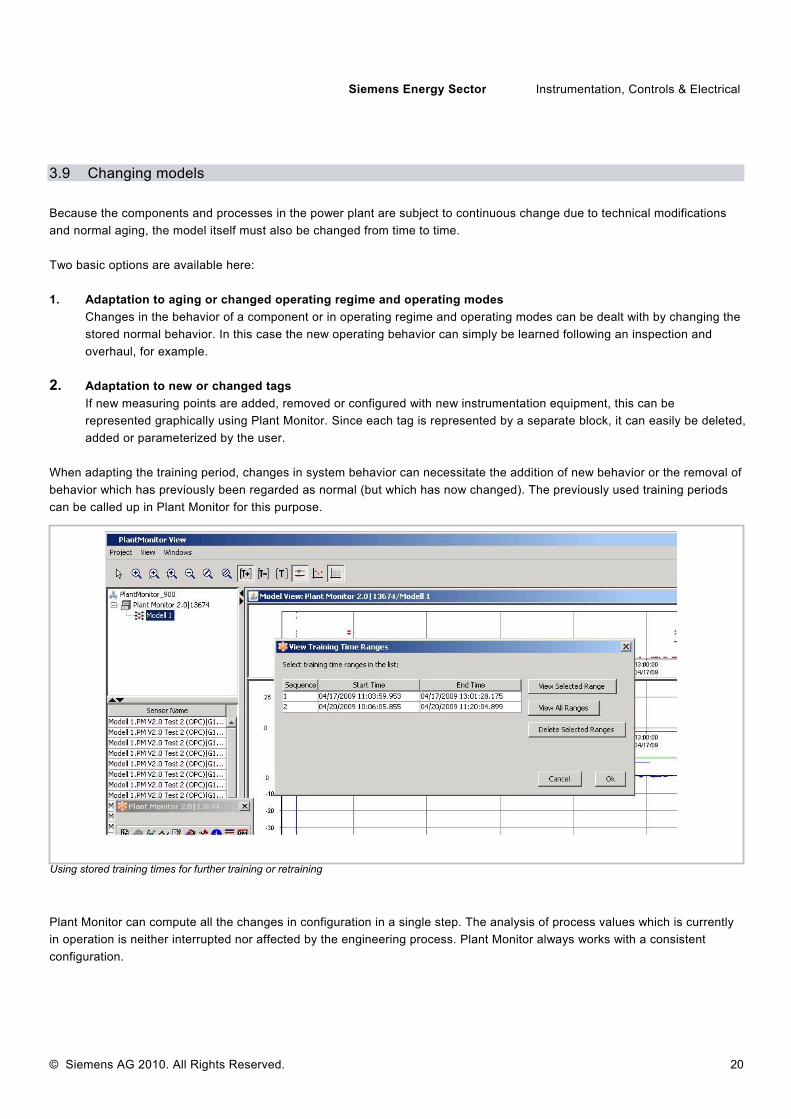
3.9 Changing models Because the components and processes in the power plant are subject to continuous change due to technical modifications and normal aging, the model itself must also be changed from time to time. Two basic options are available here: 1. Adaptation to aging or changed operating regime and operating modes
Changes in the behavior of a component or in operating regime and operating modes can be dealt with by changing the stored normal behavior. In this case the new operating behavior can simply be learned following an inspection and overhaul, for example.
2. Adaptation to new or changed tags
If new measuring points are added, removed or configured with new instrumentation equipment, this can be represented graphically using Plant Monitor. Since each tag is represented by a separate block, it can easily be deleted, added or parameterized by the user.
When adapting the training period, changes in system behavior can necessitate the addition of new behavior or the removal of behavior which has previously been regarded as normal (but which has now changed). The previously used training periods can be called up in Plant Monitor for this purpose. Plant Monitor can compute all the changes in configuration in a single step. The analysis of process values which is currently in operation is neither interrupted nor affected by the engineering process. Plant Monitor always works with a consistent configuration.
Using stored training times for further training or retraining
21 © Siemens AG 2010. All Rights Reserved.
Siemens Energy Sector Instrumentation, Controls & Electrical
It is not possible to make a general pronouncement as to whether instances of system behavior need to be removed or whether a new type of behavior "simply" has to be learned. We can work on the basic assumption that changes in the design of a process or machine and major changes in operating mode or operating regime will necessitate new a learning phase and updating of previously acquired information as a result. Plant Monitor will report deviations in these cases and these will have to be dealt it on a case-by-case basis.
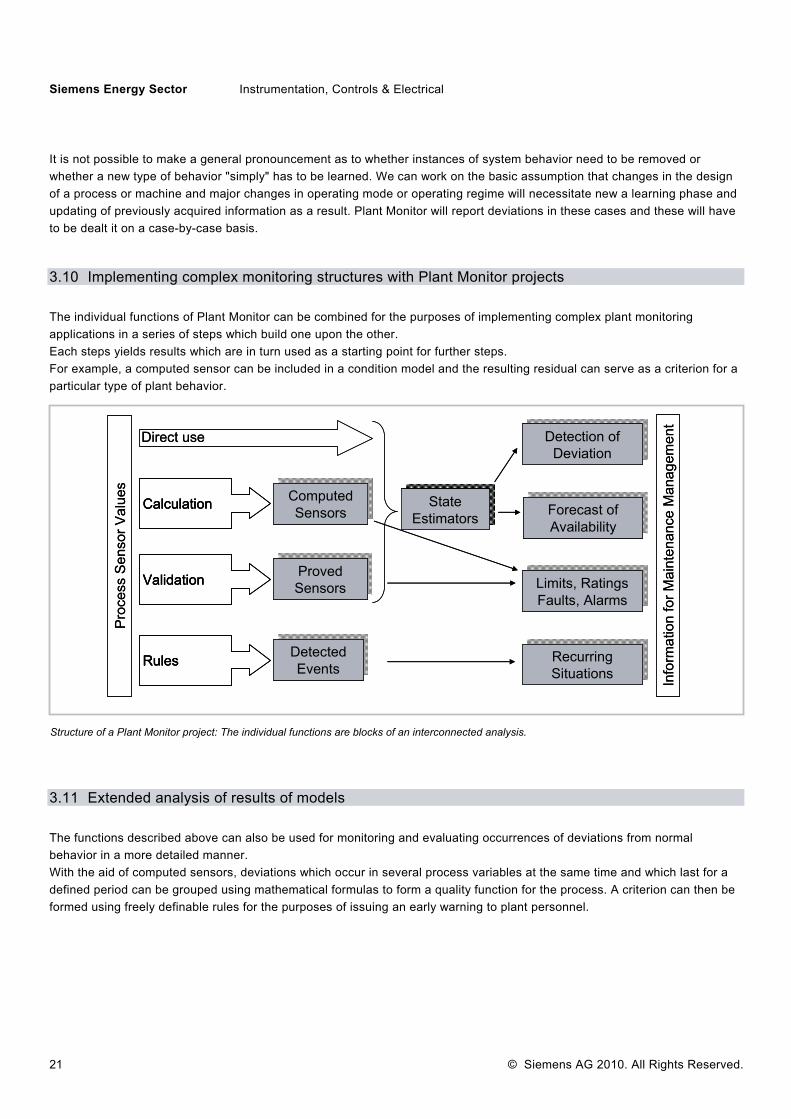
3.10 Implementing complex monitoring structures with Plant Monitor projects The individual functions of Plant Monitor can be combined for the purposes of implementing complex plant monitoring applications in a series of steps which build one upon the other. Each steps yields results which are in turn used as a starting point for further steps. For example, a computed sensor can be included in a condition model and the resulting residual can serve as a criterion for a particular type of plant behavior.
3.11 Extended analysis of results of models The functions described above can also be used for monitoring and evaluating occurrences of deviations from normal behavior in a more detailed manner. With the aid of computed sensors, deviations which occur in several process variables at the same time and which last for a defined period can be grouped using mathematical formulas to form a quality function for the process. A criterion can then be formed using freely definable rules for the purposes of issuing an early warning to plant personnel.
Structure of a Plant Monitor project: The individual functions are blocks of an interconnected analysis.
Pro
cess
Sen
sor V
alue
s Computed Sensors
Computed Sensors
DetectedEvents
DetectedEvents
ProvedSensorsProvedSensors
Calculation State Estimators
State Estimators
Info
rmat
ion
for M
aint
enan
ce M
anag
emen
t
Validation
Rules
Detection ofDeviation
Detection ofDeviation
Forecast ofAvailability
Forecast ofAvailability
Limits, RatingsFaults, Alarms
Limits, RatingsFaults, Alarms
RecurringSituations
RecurringSituations
Direct use
Pro
cess
Sen
sor V
alue
s Computed Sensors
Computed Sensors
DetectedEvents
DetectedEvents
ProvedSensorsProvedSensors
CalculationCalculation State Estimators
State Estimators
Info
rmat
ion
for M
aint
enan
ce M
anag
emen
t
ValidationValidation
RulesRules
Detection ofDeviation
Detection ofDeviation
Forecast ofAvailability
Forecast ofAvailability
Limits, RatingsFaults, Alarms
Limits, RatingsFaults, Alarms
RecurringSituations
RecurringSituations
Direct use
© Siemens AG 2010. All Rights Reserved. 22
Siemens Energy Sector Instrumentation, Controls & Electrical
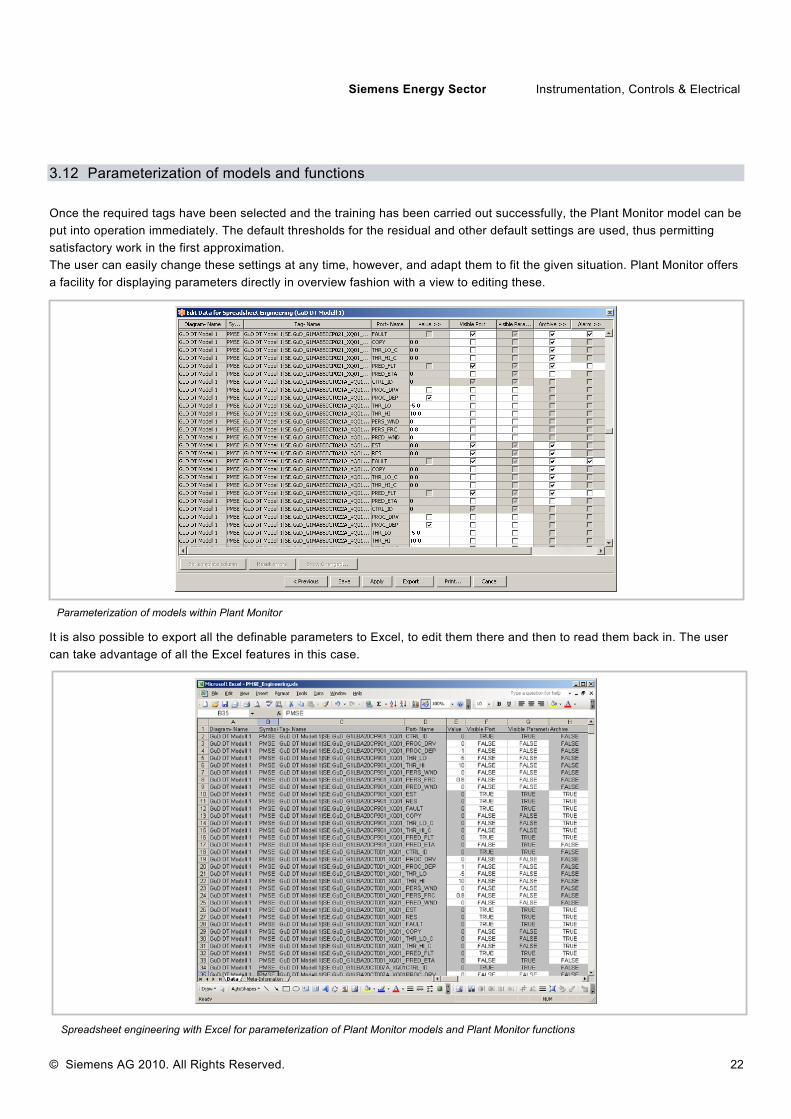
3.12 Parameterization of models and functions Once the required tags have been selected and the training has been carried out successfully, the Plant Monitor model can be put into operation immediately. The default thresholds for the residual and other default settings are used, thus permitting satisfactory work in the first approximation. The user can easily change these settings at any time, however, and adapt them to fit the given situation. Plant Monitor offers a facility for displaying parameters directly in overview fashion with a view to editing these.
It is also possible to export all the definable parameters to Excel, to edit them there and then to read them back in. The user can take advantage of all the Excel features in this case.
Parameterization of models within Plant Monitor
Spreadsheet engineering with Excel for parameterization of Plant Monitor models and Plant Monitor functions
23 © Siemens AG 2010. All Rights Reserved.
Siemens Energy Sector Instrumentation, Controls & Electrical
3.13 Networking of models Plat Monitor is capable of describing and monitoring any processes or components with the aid of models. The scope of these models can be defined freely and can also go beyond the boundaries of an equipment unit. However it must be noted that the greater the number of different components and processes that are grouped together which are independent with respect to information (i.e. which are not interdependent), the more the accuracy of the condition description suffers due to the nature of the group. This can always be remedied by representing different components and processes using separate models, e.g. one model each for boiler, gas turbine, NH3 conditioning, etc. Needless to say, important variables common to all models can also be used several times in different models. This makes it possible to achieve significantly higher accuracy for early fault detection and can also clearly channel responsibilities in alarm situations. Training models which monitor a component or process for a number of different applications should also be avoided. Although a model for a machine is capable of monitoring both steady-state operation and rundown, for example, the condition description will be significantly more accurate, as will the possible analyses derived from it, if an existing model is duplicated and trained on the one hand for steady-state behavior, e.g. for a fixed speed band, and on the other, for example, for the rundown procedure. Plant Monitor can then automatically activate the correct specialized model depending on the situation. Parallel operation of such models is also possible. In addition Plant Monitor makes it possible to operate models with different levels of detail in cascaded fashion. If, for example, a small manageable model for a process reports a deviation at a boiler, another previously prepared model which takes all the tags for that boiler into consideration can be activated. This reduces the possible flood of information for the operator while at the same time ensuring that no condition is left out of consideration.
© Siemens AG 2010. All Rights Reserved. 24
Siemens Energy Sector Instrumentation, Controls & Electrical
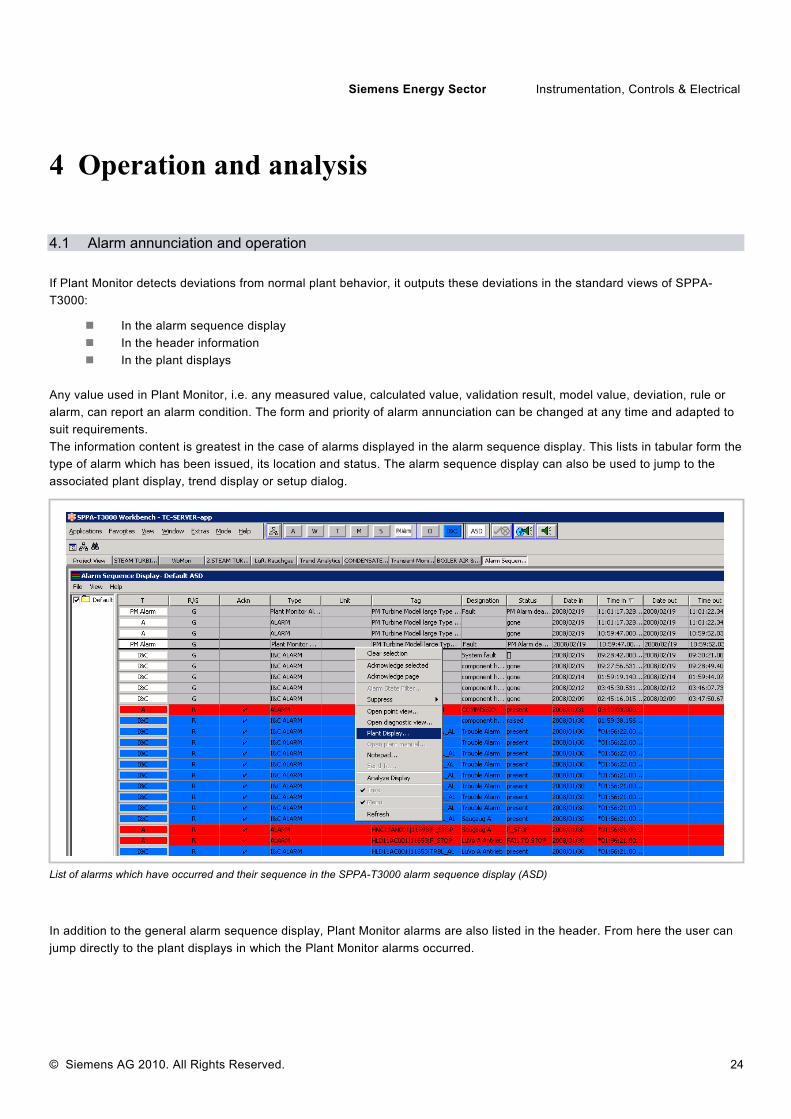
4 Operation and analysis 4.1 Alarm annunciation and operation If Plant Monitor detects deviations from normal plant behavior, it outputs these deviations in the standard views of SPPA-T3000:
In the alarm sequence display In the header information In the plant displays
Any value used in Plant Monitor, i.e. any measured value, calculated value, validation result, model value, deviation, rule or alarm, can report an alarm condition. The form and priority of alarm annunciation can be changed at any time and adapted to suit requirements. The information content is greatest in the case of alarms displayed in the alarm sequence display. This lists in tabular form the type of alarm which has been issued, its location and status. The alarm sequence display can also be used to jump to the associated plant display, trend display or setup dialog. In addition to the general alarm sequence display, Plant Monitor alarms are also listed in the header. From here the user can jump directly to the plant displays in which the Plant Monitor alarms occurred.
List of alarms which have occurred and their sequence in the SPPA-T3000 alarm sequence display (ASD)
25 © Siemens AG 2010. All Rights Reserved.
Siemens Energy Sector Instrumentation, Controls & Electrical
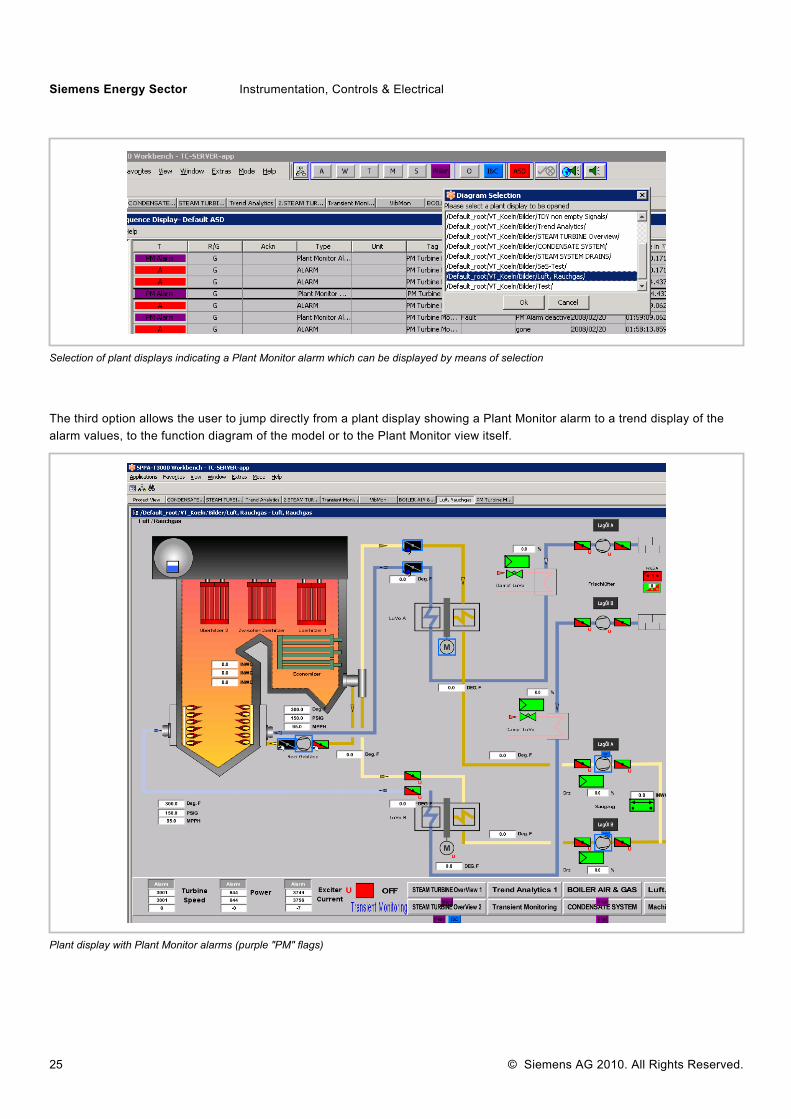
The third option allows the user to jump directly from a plant display showing a Plant Monitor alarm to a trend display of the alarm values, to the function diagram of the model or to the Plant Monitor view itself.
Selection of plant displays indicating a Plant Monitor alarm which can be displayed by means of selection
Plant display with Plant Monitor alarms (purple "PM" flags)

© Siemens AG 2010. All Rights Reserved. 26
Siemens Energy Sector Instrumentation, Controls & Electrical
4.2 Analysis An analysis generally begins with a message from Plant Monitor that a measuring point is exhibiting a deviation from normal behavior. This information is displayed in the alarm sequence display and simultaneously in the plant display itself. A range of information is therefore already available for the analysis of correlations and background reasons for this report and thus for an analysis of the possible problem:
The model in which the fault occurred and the associated component or process The measuring points which are exhibiting irregularities and those which are not The sequence in which the deviations occurred The severity of the deviations relative to the measured value
In addition to this accurate information, the user has two basic analysis options which can be combined as required: 1. Analysis in Plant Monitor view
All the tags associated with a model are displayed one below the other for the same time range in the Plant Monitor view. An overview with the exact times of all the deviations which have occurred is also displayed in the header in the form of red error bars. Simply select one of these error bars to switch the Plant Monitor display to the associated tag and residual. A large number of causes can be determined in this display alone. More importantly, a time range defined as exhibiting normal behavior can be added to or removed from the model in this view.
In the upper window: Display of current deviations by means of red error bars In the lower window: Associated measured values (red), expected values (blue) and below these the residuals

27 © Siemens AG 2010. All Rights Reserved.
Siemens Energy Sector Instrumentation, Controls & Electrical
2. Analysis in trend display view
Behind every display of values by Plant Monitor, i.e. measured value, model value and residual, lies a stored preconfigured trend display containing these values. Like any other trend display, this trend display can be used for the purposes of analysis in any plant display.
The advantage of this type of display is that, depending on the analysis, values can be dragged and dropped into any diagram from other displays using the mouse. This makes it very easy, for example, to analyze vibration values in the context of process variables. Combinations which have proven useful for analyses can also be stored as views, allowing them to be used again at any time.
The deviations from normal behavior and the causes of each deviation identified by Plant Monitor put the operating and maintenance personnel in a position to analyze correlations relative to a situation and to make decisions about changes in operating modes and planning of maintenance measures.
Trend display of all the information necessary for a detailed analysis directly in the plant displays

© Siemens AG 2010. All Rights Reserved. 28
Siemens Energy Sector Instrumentation, Controls & Electrical
Technical data 4.3 SPPA-T3000 technology server The SPPA-T3000 technology server is the hardware and software platform for SPPA-D3000 Plant Monitor, as well as for a large number of other applications devoted to the diagnostics and optimization of plants and processes. If we first look at the technology server independently of all other components and interfaces, it is an autonomous SPPA-T3000 component which is usually not redundantly configured (not fault-tolerant) but which can be configured as a redundant (fault-tolerant) server in the event of increased availability requirements. Unlike an I&C system used for power plant automation, the technology server does not feature automation interfaces and cannot therefore be used for automation applications. The technology server does, however, feature a component called the Technical Calculation Container, or TCC for short. Applications like Plant Monitor run in this TCC, which means that it is fully integrated in the Embedded Component Services ECS™ of SPPA-T3000. All the applications executed in the TCC can therefore benefit from the functions and advantages of SPPA-T3000. The most important of these include:
Shared user interface for HMI, analyses and engineering Integrated engineering Archive Log function and All blocks and display forms
All interfaces and operations are also implemented in SPPA-T3000 via the TCC. This means that outputs from the application are completely homogenous, with the result that externally visible outputs have the same appearance and the same operating philosophy as SPPA-T3000. Another advantage of implementing all applications as an SPPA-T3000 function in the TCC is that all applications use identical engineering and the same editor. Not only does this produce the same "look & feel", it also means that engineering data are only entered once (one-time, consistent data input) and complete integration of applications is achieved. Unlike classical platforms, the technology server does not represent a collection of applications which simply share the same operating system on a server, with each application implemented independently of all others. All the applications implemented on the technology server platform use all the services supplied by the technology server. There is only one editor, one user interface, one archive, and so on. The technology server thus makes real and complete integration of applications possible. In the stand-alone version, i.e. without the SPPA-T3000 I&C system, the technology server comes ready-equipped with licenses for engineering and operation. Only the licenses for Plant Monitor need to be added. If the technology server is used in conjunction with the SPPA-T3000 I&C system, however, the SPPA licenses are used as required. Needless to say, these licenses can be added to at any time within the framework of the I&C system.
29 © Siemens AG 2010. All Rights Reserved.
Siemens Energy Sector Instrumentation, Controls & Electrical
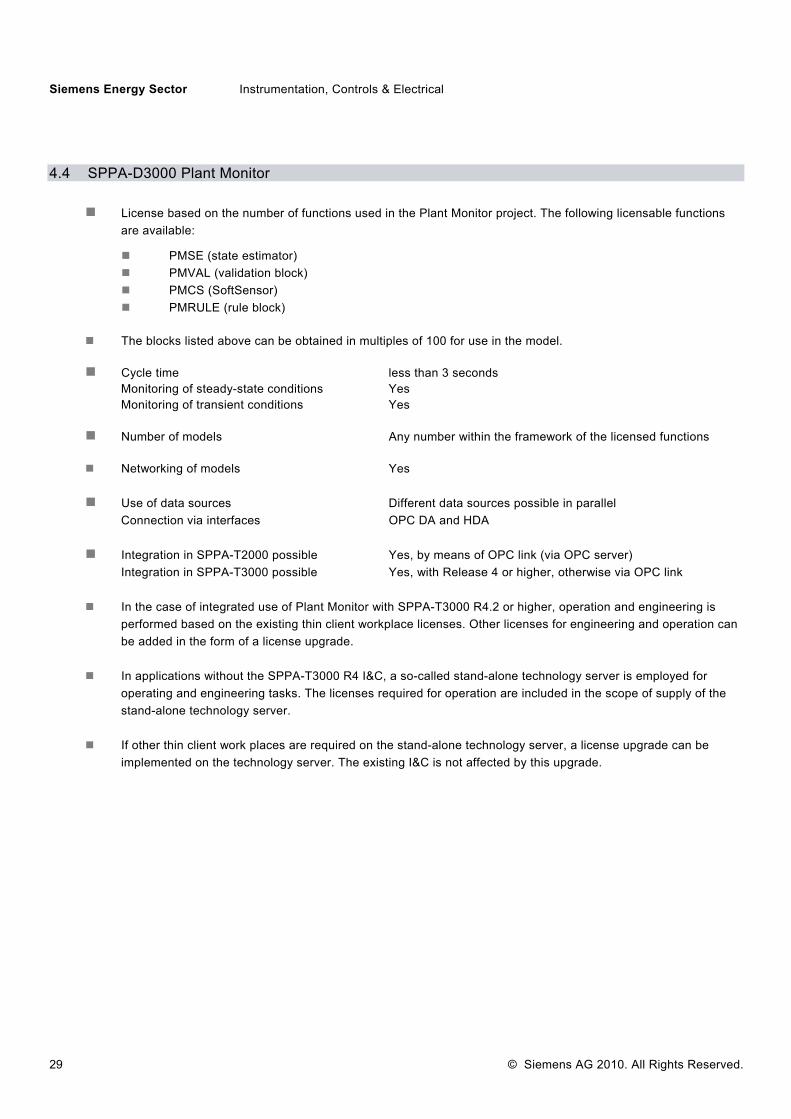
4.4 SPPA-D3000 Plant Monitor
License based on the number of functions used in the Plant Monitor project. The following licensable functions are available:
PMSE (state estimator) PMVAL (validation block) PMCS (SoftSensor) PMRULE (rule block)
The blocks listed above can be obtained in multiples of 100 for use in the model.
Cycle time less than 3 seconds
Monitoring of steady-state conditions Yes Monitoring of transient conditions Yes
Number of models Any number within the framework of the licensed functions
Networking of models Yes
Use of data sources Different data sources possible in parallel
Connection via interfaces OPC DA and HDA
Integration in SPPA-T2000 possible Yes, by means of OPC link (via OPC server) Integration in SPPA-T3000 possible Yes, with Release 4 or higher, otherwise via OPC link
In the case of integrated use of Plant Monitor with SPPA-T3000 R4.2 or higher, operation and engineering is
performed based on the existing thin client workplace licenses. Other licenses for engineering and operation can be added in the form of a license upgrade.
In applications without the SPPA-T3000 R4 I&C, a so-called stand-alone technology server is employed for
operating and engineering tasks. The licenses required for operation are included in the scope of supply of the stand-alone technology server.
If other thin client work places are required on the stand-alone technology server, a license upgrade can be
implemented on the technology server. The existing I&C is not affected by this upgrade.

© Siemens AG 2010. All Rights Reserved. 30
Siemens Energy Sector Instrumentation, Controls & Electrical
5 Abbreviations ECS™ Embedded Component Services
KKS Kraftwerks-Kennzeichnungs-System (power plant identification system)
OPC OLE for process control; standardized client/server communication
DA Data access (live data); access to live data via OPC
HDA Historical data access; access to past data via OPC
ASD Alarm sequence display in SPPA-T3000
PI Real-time database from OSI-Soft
PM SPPA-D3000 Plant Monitor
RES Residual; deviation from expected value
R4 SPPA-T3000 Release 4
SPPA Siemens Power Plant Automation
TAG German "KKS"; "signal" in Plant Monitor
TCC Technical Calculation Container
TS SPPA-T3000 technology server
Project General term for Plant Monitor functions, incl. Plant Monitor models

31 © Siemens AG 2010. All Rights Reserved.
Siemens Energy Sector Instrumentation, Controls & Electrical
www.siemens.com/energy
Published by and Copyright (2009): Siemens AG Energy Sector Freyeslebenstraße 1 D-91058 Erlangen Germany Siemens AG Energy Sector Fossil Power Generation Instrumentation, Controls & Electrical Siemensallee 84 D-76187 Karlsruhe Germany [email protected] www.siemens.com/sppa-d3000
D3PPM_DT1_TechDesc_d_V2-2 Printed on elementary chlorine-free paper. All Rights Reserved. The trademarks and brand names used in this document are the property of Siemens AG or their associated companies or the individual holder. jeweiligen Inhaber. Subject to change without prior notice. The information in this document represents general descriptions of technical options which are not implemented in every case. The required performance features must be agreed upon for each individual application upon formation of the contract.