sprawl because of you: the emergence of smart growth policy in
TRANSCRIPT
SPRAWL BECAUSE OF YOU:
THE EMERGENCE OF SMART GROWTH POLICY IN CALGARY, ALBERTA
By:
Chris Andrew
B.Mgt, University of Lethbridge, 2009
A Major Research Paper
presented to Ryerson University
in partial fulfillment of the requirements for the degree of
Master of Planning
In
Urban Development
Toronto, Ontario, Canada, 2015
© Chris Andrew 2015

ii
Author’s Declaration for Electronic Submission of a MRP
I hereby declare that I am the sole author of this MRP. This is a true copy of the MRP, including
any required final revisions. I authorize Ryerson University to lend this MRP to other
institutions or individuals for the purpose of scholarly research
I further authorize Ryerson University to reproduce this MRP by photocopying or by other
means, in total or in part, at the request of other institutions or individuals for the purpose of
scholarly research.
I understand that my MRP may be made electronically available to the public.

iii
SPRAWL BECAUSE OF YOU:
THE EMERGENCE OF SMART GROWTH POLICY IN CALGARY, ALBERTA
© Chris Andrew 2015
Master of Planning
In
Urban Development
Ryerson University
ABSTRACT
This paper analyzes whether Smart Growth policies, embedded within the City of Calgary’s
Municipal Development Plan, have been successful in battling sprawl and progressing towards
the overarching goals of Smart Growth. A review of the literature and a historical review of
urban sprawl in Calgary establishes a set of indicators demonstrating that the city is struggling
to progress towards the goals of Smart Growth. While there are encouraging findings, the paper
recommends the potential implementation of policy changes to ensure that The City is well-
positioned to combat sprawl going forward.
Key Words: City of Calgary, Smart Growth, Urban Policy, Urban Sprawl, Density

iv
Acknowledgements
I would like to acknowledge my supervisor, Dr. Jaclene Begley for her guidance and assistance
on this paper. In addition, I would like to thank my second reader, Mary Axworthy from the
University of Calgary, for her subject matter expertise and comprehensive input.
The last two years would be nothing without the perspectives, personalities, and ideas
contributed by my peers. I have enjoyed working with you all and thank you for letting me
speak endlessly about, well, you all know what city.
Thank you to all my family and friends who have supported me throughout these exciting and
turbulent times. I went “all in” on this journey and I appreciate those individuals who
understand how important these last two years have been for me.
A round of applause to you all. Thank you.

v
Table of Contents
Author’s Declaration for Electronic Submission of a MRP .................................................................. ii
Acknowledgements .................................................................................................................................. iv
Table of Contents ....................................................................................................................................... v
List of Figures ............................................................................................................................................ vi
List of Tables .............................................................................................................................................. vi
1. Introduction ........................................................................................................................................ 1
Purpose .................................................................................................................................................... 2
The City of Calgary ................................................................................................................................ 4
2. Research Methodology ...................................................................................................................... 6
3. Current and Historical Literature .................................................................................................... 8
The Sprawl Problem .............................................................................................................................. 8
The Smart Growth Remedy ................................................................................................................ 14
How did we get here? A historical review of urban sprawl in Calgary ...................................... 23
4. Analysis and Discussion ................................................................................................................. 37
Promoting Compact Development .................................................................................................... 37
Providing and Promoting a Variety of Transportation Options ................................................... 48
Supply of Affordable Housing ........................................................................................................... 53
5. Final Discussion and Recommendations ...................................................................................... 60
Overarching Issue – Regional Planning ............................................................................................ 61
Promoting Compact Development .................................................................................................... 63
Providing a Variety of Transportation Options ............................................................................... 64
Supply Affordable Housing ............................................................................................................... 65
6. Conclusion ........................................................................................................................................ 67
7. References ......................................................................................................................................... 68

vi
List of Figures
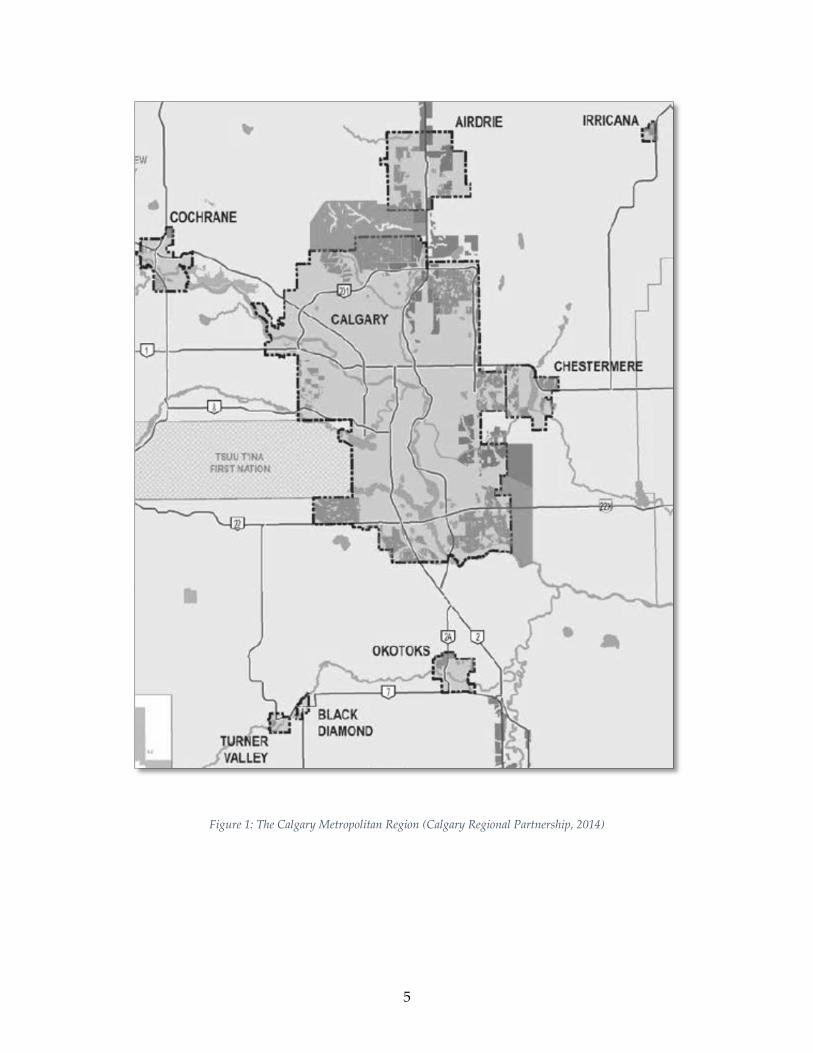
Figure 1: The Calgary Metropolitan Region (Calgary Regional Partnership, 2014) ......................... 5
Figure 2: Calgary's Spatial Growth from 1951-2012 (The City of Calgary: Geodemographics,
2014) ........................................................................................................................................................... 25
Figure 3: Urban Structure - Calgary MDP ............................................................................................ 36
Figure 4: Calgary Population Change by Community (City of Calgary, 2013)............................... 40
Figure 5: Historical City-wide Population Density ............................................................................. 43
Figure 6: Developed and Developing Areas Share of Population Growth from 1991-2014 (The
City of Calgary: Geodemographics, 2014) ............................................................................................ 46
Figure 7: Geographical Distribution of Jobs (City of Calgary, 2011) ................................................ 46
Figure 8: Investment in Transit Infrastructure since 2001 (Pembina Institute, 2014) ..................... 49
Figure 9: Calgary (Bus+LRT) Transit Ridership from 1996-2013 (American Public Transportation
Association, 2014) ..................................................................................................................................... 51
Figure 10: Mode Share in Calgary, 2005 and 2011 (City of Calgary, 2014) ...................................... 52
Figure 11: Cost Burdened Households from 1991-2011 (Statistics Canada, 2014) .......................... 57
Figure 12: Housing Mix from 1993 to 2013 ........................................................................................... 59
List of Tables
Table 1: Calgary Share of the Metropolitan Region (Statistics Canada, 2014) ................................. 33
Table 2: Large Scale Intensification Projects in Calgary ..................................................................... 41
Table 3: Historical Population Density from 1951-2011 (Statistics Canada) .................................... 43
Table 4: Density 2011-2014 (The City of Calgary: Geodemographics, 2014) ................................... 44
Table 5: Population vs. Transit Ridership Growth (2009-2013) ......................................................... 51
Table 6: Median Value of Dwelling Relative to Income Growth (1991-2011) ................................. 55
Table 7: Summary of Key Findings ....................................................................................................... 62

1
1. Introduction
Rapid urbanization in the form of sprawl has, and continues to be, a major problem facing
municipalities. A dramatic shift occurred over the last 100 years as the population moved
towards urban centres. At the turn of the 20th century cities accommodated approximately 15%
of the global population. Presently, the number of city dwellers has drastically increased to
account for about half of the global population (Neuman, 2005). The urban movement,
specifically in North America, is characterized by a transition from more densely populated
urban centres to sprawling suburban cities which rely, in some cases almost entirely, on the
automobile.
The suburbanization of cities throughout this period has not occurred without problems such as
traffic congestion and gridlock, increased pollution, loss of open space and agricultural land,
increasing economic inequality and segregation, and health issues stemming from an altered
suburban lifestyle. The underlying financial complications resulting from such problems are
posing significant challenges, not just for municipal officials, but citizens. It appears that
Canadian municipalities, specifically the City of Calgary, are at an important fork in the road.
Does the city accept the status quo – growing in the same manner as it has for the last sixty
years – or does the city adjust policy to reflect a more sustainable choice for growth?
Canada is a highly urbanized country. “Although it is estimated that approximately 80% of the
Canadian population lives in an urban setting, the category includes downtown, inner-city,
suburban, and exurban development. Initial estimates indicate perhaps that two-thirds of the
Canadian population live in neighborhoods that most observers would consider suburban (i.e.,

2
cars and many postwar single-family homes)” (Gordon & Janzen, 2013). As a poster child for
suburban growth, Calgary has garnered a reputation based on a form of growth associated with
urban sprawl; essentially, accommodating population growth at the city fringe through
controlled low-density annexations. As the urban shift continues, growth in the suburbs is
expected to remain. Opposition to urban sprawl has been mounting for several decades through
formalized policies, plans and frameworks labeled as Smart Growth. These plans have only
been recently introduced in Calgary and it is important that all stakeholders understand the
implications to the City.
Purpose
The City of Calgary ratified a new Municipal Development Plan (MDP) in 2009 intending to
guide and direct growth in the city over the next 60 years. In short, the plan is attempt to reign
in Calgary’s sprawling past utilizing Smart Growth, a term known to encompass the following
principles (United States Environmental Protection Agency, 2015):
1. Mix land uses
2. Take advantage of compact building
design
3. Create a range of housing
opportunities and choices
4. Create walkable neighborhoods
5. Foster distinctive, attractive
communities with a strong sense of
place
6. Preserve open space, farmland,
natural beauty, and critical
environmental areas
7. Strengthen and direct development
towards existing communities
8. Provide a variety of transportation
choices
9. Make development decisions
predictable, fair, and cost effective
10. Encourage community and
stakeholder collaboration in
development decisions

3
Of the ten Smart Growth principles, Nelson (as cited in Blais, 2010), confirmed by Cervero
(2001), highlight the two primary Smart Growth goals as: (1) building where infrastructure and
development already exist by increasing density and (2) connecting land uses with
transportation alternatives to the car. To narrow the scope of this paper, I will focus on the
primary goals of Smart Growth as identified by Cervero and Nelson. In addition, the analysis
will include a section on housing affordability because it is highly topical issue in Calgary at the
moment.
The purpose of this study is to answer the question: Have select Smart Growth policies,
embedded within the City of Calgary’s MDP, been successful in battling sprawl and
progressing towards the goals of Smart Growth?

4
The City of Calgary
The City of Calgary is the largest municipality in the Province of Alberta, located in the
Foothills of the Rocky Mountains at the intersection of the Bow and Elbow rivers. Calgary is
surrounded by the City of Airdrie to the north, The City of Chestermere to the east, The Town
of Okotoks to the south, and the Town of Cochrane to the west. In the last ten years, the
combined populations of these municipalities have been increasing their relative share of the
region. A map of Calgary and each of the surrounding municipalities is highlighted in Figure 1.
One of the most rapidly growing municipalities in Canada, Statistics Canada (2015) identifies
Calgary as the third largest municipality and the fifth largest metropolitan region in Canada by
population. Totalling 1,195,194 people, Calgary is the dominant municipality in the region,
containing 84% of the metropolitan population. From 1991-2011 the city grew by approximately
54% and has been experiencing significant population growth over the last five years, averaging
about 3% growth per year (The City of Calgary: Geodemographics, 2014). The city’s economy is
largely driven by the oil and gas sector which provides the majority of jobs, and one reason for
above average incomes and relatively young population. The city is estimated to have the 11th
highest GDP per capita in the world, totalling $69,826 (Brookings Institute, 2014), with a median
age of 36, significantly lower than the national median age of 41 (Statistics Canada, 2015).
5
Figure 1: The Calgary Metropolitan Region (Calgary Regional Partnership, 2014)

6
2. Research Methodology
The paper follows an applied case-study approach utilizing an evaluative model to discover if
Calgary is meeting or progressing towards the primary goals of Smart Growth. The analysis
considers how select goals of Smart Growth are considered in the city’s statutory planning
documents; primarily the Municipal Development Plan. The study encompasses three main
components. First, a literature review on urban sprawl and Smart Growth is conducted to
understand the urban sprawl, why it occurs, and to highlight problems pertaining to
metropolitan regions experiencing this form of growth. This is a necessary step in order to
understand arguments for and against sprawl and the social, economic, and environmental
costs. Further, the literature on the history and application of Smart Growth in North America is
reviewed to understand how policies have been incorporated into city planning documents and
the overall result. This step is important to understand the goals of Smart Growth and the
overall effect the goals and initiatives have on the practice of planning in general. The review is
also used to identify some of the implementation barriers. The overall intent of the literature
review is to extract key goals, indicators, and options to inform the analysis of Calgary.
Second, a historical review is utilized to understand the context of urban sprawl in Calgary in
the post war period. Neuman (2006) argues that historical reviews can be a useful tool to show
how a concept or issue evolved over time. Calgary experienced much of its population and
economic growth during this period and it will be useful to understand the decisions made, the
stakeholders involved, and some of the reasons which produced a sprawling urban form.

7
Informed by the literature review, the final phase applies a set of indicators used in related
studies to understand if the key goals of Smart Growth are being achieved in the Calgary
context. In this section the key themes begin to develop which help inform a set of
recommendations.
8
3. Current and Historical Literature
The Sprawl Problem
The definition of sprawl itself is subjective and often debated as Blais (2010) notes it “could be
viewed as an aesthetic judgement, as the cause of an externality (e.g. auto dependance), as the
consequence of an action or condition (e.g. exclusionary zoning), as a pattern of development,
or a process of development.” One simple definiton is offered by Brueckner (2000) who
identifies sprawl as the excessive spatial growth of cities over a specified geographical area. The
word excessive is associated with commute times, agricultural land conversion, centre city
decay, and public infrastructure costs.
The roots of sprawl are attributed to the post-war period of the early 1950s. The literature
identifies the invention of the automobile and the federal housing programs as major
contributors to the suburban era (Burchell et al, 2005; Blais, 2010). Subsidization of highway
infrastructure and home ownership, fragmented governance, engineering standards, and
consumer preference (real or perceived) are identified as major contributors which enhance
sprawl (Blais, 2010). In general, research conducted by Ingram et al. (2009), found that income
and population growth are significant drivers of urban sprawl and reduce overall development
densities. This has been confirmed by Glaeser, Kahn, and Rappaport (2008) who found that
when personal income doubles, lot size expands by about 25 to 50 percent. There are many
drivers of sprawl, however, it may be best summed up by Bullard (2007, p. 1) who states
“suburban sprawl is fueled by the ‘iron triangle’ of finance, land use planning, and
transportation service delivery.”
9
Characteristics
Characteristics of urban sprawl include low density development, rigorously separated land
uses (e.g. long distances between residential and commercial), leapfrog development,
undeveloped gaps between land, and high dependency on the automobile. The most common
theme of sprawling cities is development on agricultural land (Galster, 2001; Downs, 2005,
Thompson, 2013). Perhaps one definition that best identifies the opposite end of the Smart
Growth spectrum is “a pattern of land use that exhibits low levels of some combination of eight
distinct dimensions: density, continuity, concentration, clustering, centrality, nuclearity, mixed
uses, and proximity” (Galster, 2001). Canadian examples of sprawl exist in almost every city in
varying forms. The largest cities have experienced significant population growth, however, the
amount of new land that each acquired for growth has varied (Gordon & Janzen, 2013).
Costs of Sprawl
Sprawl is associated with high economic, social, and environmental costs that counteract the
goals of sustainability. There is no doubt that sprawl is devastating to the environment. Among
the most serious problems is resource depletion due to urban land accumulation which occurs
through a disproportionate consumption of agricultural and fragile environmental lands
(Burchell, 2002). Lands located to the east of Calgary are stated to be prime agricultural lands.
The agricultural productivity of these lands will be challenged if sprawl continues. Supplying
residents with water, specifically in Calgary, is becoming ever more challenging as the city and
its surrounding municipalities continue to urbanize. It is estimated that the amount of
imperviousness created by converting agriculatural land or open space to low-density
development amounts to billions of litres of water not being infililtrated every year (Blais, 2010).

10
A major environmental cost associated with urban sprawl is increased automobile usage and
travel trip distance. This leads to a greater consumption of fossil fuels, increased air pollution,
water pollution, and soil erosion (Burchell, 2002; Frumkin, 2002; Blais, 2010). It is crucial to
understand environmental factors because, as Campbell (1996) argues, they are prerequisites
to achieving goals of social and economic sustainability.
Given our market-driven economy, issues are often legitimized when there is a realization that
public and private financial costs are becoming excessive. The most complete studies on urban
sprawl highlight that its costs are greater than those in Smart Growth scenarios (Burchell, 2000;
Neuman, 2005; Blais, 2010). Scenario analysis has become an important aspect illustrating the
problems with urban sprawl, specifically related to the financial costs of infrastructure and the
annexation of agricultural land (Burchell, 2000). Multiple studies in both the American and
Canadian context quantify the economic costs of sprawl. Burchell’s (2002) research in particular,
compiled data from multiple American states in an attempt to identify costs of compact versus
a sprawling growth scenarios. The study found that the financial cost savings associated with
compact development are approximately 420 billion dollars, with the majority stemming from
reduced housing and development costs.
Overall, Burchell’s research discovered that compact development typically results in cost
savings of 25% on roads, 5% on schools and 20% on utilities (as cited in Blais, 2010). In the
Canadian context and of particular interest to this paper, the City of Calgary found that by
adopting a plan focused on densification that used 25% less land, it could save approximately
11 billion dollars in capital costs and an additional 130 million dollars in operating costs
11
throughout the life of the plan (IBI Group, 2009; Taylor et al., 2014). These costs are primarily
focused on capital infrastructure projects related to water, sewers and road facilities.
Additional services, spread over a wider geographic area include schools, libraries, recreational
facilities, garbage pick-up and mail delivery, can also increase financial costs. Maintenance and
operational costs are also covered by the municipality indefinitely, which can lead to significant
revenue shortfalls. “The City of Edmonton estimated that this shortfall will exceed $4 billion
dollars over the next 60 years” (Thompson, 2013). Further, Toronto found that savings on
capital and operating costs for transportation and utilities range between 18 to 29 percent
depending on the density of growth (Blais, 2010). The financial inefficiencies related to
sprawling development create major problems for municipalities and are best summed up by
Burchell et al. (2005, p. 74) who posits:
“[Municipal] attempts to collect enough revenue to provide services to residents,
businesses, and workers fall short as they struggle to maintain aging infrastructure while
also providing new roads, water, and sewer lines, and other forms of developmental
infrastructure. The increased costs end up being passed along to businesses and residents
through higher taxes and fees, and sometimes through fewer public services. Sprawl’s
fiscal impact may be a major reason local governments have become so interested in
more efficient forms of development.”
Much of the research focuses on the economic and environmental costs of sprawl, however,
there are noted social impacts associated with sprawl such as decreased accessibility, social
segregation, housing segregation, unequal property-tax funding of public schools, jobs-housing
12
imbalance, the spatial imbalance of economic opportunity, and unequal access to open space
and recreation (Neuman, 2005; Burchell et al. 2005; Blais, 2010). In addition, it is argued that a
reliance on the automobile is creating a society that segregates more often than integrates,
excluding invididuals from activities due to difficulty of access. This tends to affect individuals
who are young, old, poorer, newly immigrated or disabled (Blais, 2010). More recent studies are
linking sprawl to health issues such as mental health problems, increasing automobile deaths,
obesity and diabetes (Frumkin, 2002; Thompson, 2013).
Why sprawl?
While researchers have identified many problems associated with sprawl, it has been one of the
most dominant forms of urban growth over the last sixty years with some advocates identifying
that sprawl has its benefits. One of the most commonly stated benefits is that it provides
individuals and families with an ability to own a home that meets their desires. An American
survey conducted in 1999 by Fannie Mae (a Government Sponsored Agency) found that, given
the same cost, 83% would rather live in a large house in the suburbs rather than a compact one
in the inner city (Burchell et all, 2002). This however, appears to be changing as Flint (2007)
notes the demand for alternative options to conventional suburban built form are increasing.
This trend has been confirmed by a study in Los Angeles conducted by Lewis and Baldassare
(2010), indicating that support for compact development alternatives is significant and in some
cases exceeds support for traditional, decentralized suburban patterns. Affordable housing
options have long been the appeal of urban sprawl because individuals and families have
followed the “drive until you qualify” motto (Flint, 2007). Yet, housing affordability associated
with urban sprawl is becoming more scrutinized when costs such as travel are factored in (Flint,

13
2007; Blais, 2010; Pembina Institute, 2015). Further, the relationship between housing
affordability and urban sprawl is considered far too simplistic as numerous factors contribute to
housing prices. An American study by Nelson et al. (2002) found that market demand, not land
use constraints, is the primary determinant of housing prices and that housing prices can
increase under a sprawling or compact scenario. These results have been confirmed by Tomalty
& Haider (2008) in the Canadian context. There continues to be much debate regarding the
benefits and costs, however, Blais (2010, p. 40) highlights a notable aspect stating “whereas the
benefits of sprawl tend to be private in nature (e.g. larger lots and houses, freedom of
automobile travel), the costs tend to be public (e.g. loss of farmland, higher infrastructure costs,
greenhouse gas emissions, etc.)”
Where do we go from here?
A review of the literature suggests the problems associated with urban sprawl appear to
outweigh the benefits. Urban sprawl is negatively affecting peoples lives and although the
economic, social and environmental costs of sprawl are being realized, it is an assumption that
Canadian cities will still continue to expand geographically. Gordon’s (2013) research indicates
that although the large Canadian metropolitan areas are seeing growth in city centres, the
majority of growth is continuing in the suburbs (transit suburbs and automobile suburbs). A
response to sprawl is occurring through policy, planning and design. The Smart Growth
approach seeks to remedy the costs of sprawl, while accomodating increases in population
expected by large Canadian municipalities in the coming years, particularly the City of Calgary.
14
The Smart Growth Remedy
The formalized origin of Smart Growth is traced back to the mid-1990s and is currently
understood as the antithesis to urban sprawl (Burchell et al., 2000, Burchell, 2002; Downs, 2005;
Dierwechter, 2008; Blais 2010). In its very basic form, it is a growth management planning
response to the negative aspects of urban sprawl. The movement idealizes the economic,
environmental, and social elements of sustainability to enable an alternative form of urban
growth to that of conventional urban sprawl. Like sprawl itself, there are many definitions and
interpretations of Smart Growth, yet, they generally comprise two primary elements. As
mentioned in Section 1, Nelson (as cited in Blais, 2010) identifies these as: (1) building where
infrastructure and development already exist, as opposed to greenfields, and (2) connecting
land uses with transportation alternatives to the car. Distilling the definition into the primary
elements makes the topic easy to digest and highlights that the key aspects of the Smart Growth
initiative are to link transportation and land use planning while increasing density to support a
more compact urban form. These primary features in addition to impacts on housing
affordability will be the subject of analysis in this paper.
The Origins of Smart Growth
A major difference between Smart Growth and its growth management predecessors, including
urban containment, is that its principles are built on more of a pro-growth base rather than the
pro-conservation efforts of previous decades (Burchell, Listoken, & Galley, 2000). This is one of
the reasons that Smart Growth is more widely accepted by a variety of stakeholders including
planners, developers, farmers, politicians, environmentalists and citizens. Burchell et al. (2000)

15
states that Smart Growth is an initiative of the American Planning Association, The United
States Department of Housing and Development (HUD), Henry M. Jackson Foundation,
Natural Resources Defense Council (NRDC) and the Surface Transportation Policy Project
(STPP). In Canada, Smart Growth first saw an organizational movement in 1999, through
“Smart Growth BC,” a non-profit started at the University of Victoria (Tomalty & Curran, 2003).
The Smart Growth initiative calls for new plans and policy tools that enable a new form of
development to compete with urban sprawl in the “policy forums and the marketplace”
(Burchell et al., 2000, p. 825). The literature identifies the origins of Smart Growth as the third of
four waves1 found within the evolution of growth management policy beginning in the 1950s
(Degrove, 2005; Ingram et al., 2009; Chapin, 2012). The first being the era of growth controls
focusing on limiting growth through boundaries and growth caps in order to advance
environmental protections. This approach viewed growth as an impediment and seeked to
control it through strict regulation. The second, titled the era of comprehensive planning,
occurred from the 1970s to the 1990s and highlighted development as a problem which needed
to be managed. This was done by preparing comprehensive, long term, planning documents
which provided a vision, goals, indicators and rigourous analysis. Some of the best plans linked
planning to economic development and the budgeting process. The comprehensive planning
era transitioned to the Smart Growth era because, as Chapin (2012, p. 10) theorizes:
1 The movement is originally conceptualized using the three-wave model developed by John Degrove.
Timothy Chapin who argues the emergence of a fourth wave has recently expanded upon the model
developed by Degrove.
16
“Comprehensive plans sometimes simply reinforced the status quo, leading to
inefficient or simply poor development patterns or the continued marginalization of
traditionally ostracized groups. Comprehensive planning processes and the plans
themselves became overly technical, bureaucratic documents that inhibited proactive,
innovative planning. Development interests complained that these complex documents,
with their often arcane rules and policies, lengthened already onerous development
review times, drove up costs, and yielded few improvements in the built form or urban
pattern.”
The limitations of comprehensive planning introduced a third wave which Degrove (2005) calls
the shift to Smart Growth. In this wave, development is viewed as a positive opportunity that
needs to be embraced while attempting to control sprawl. Smart Growth is generating a greater
degree of support than its predecessors because it identifies a need to consider market
influences such as economic development, consumer demands and private interests. It is a
collaborative approach that is enhanced through the use of incentives, disincentives and public-
private partnerships rather than control. These elements are echoed by Goetz (2013) who
observes that Smart Growth studies have identified tangible benefits associated with the
adoption of Smart Growth plans and policies. Such claims are that, in battling sprawl, Smart
Growth has developed a more consensus-based, collaborative approach which considers the
growing “market demand for alternative urban activity centres and neighbourhoods different
from the typical low-density suburban development model” (Goetz, 2013, p. 2191).

17
Smart Growth in Practice
As American and Canadian municipalities began incorporating Smart Growth principles into
plans at varying levels of governement (i.e. state, province, city-wide), the literature started
highlighting its benefits. A firm argument that Smart Growth is a favourable policy tool in
promoting an alternative urban form started to develop. These benefits, however, demonstrate
various results depending on how they are implemented. Current literature exists in two forms:
(1) qualitative case studies evaluating Smart Growth policy and offering recommendations and,
more recently; (2) quantitative analyses of a large number of cases.
Studies on Smart Growth policy implementation are producing a variety of results, however, a
trend is that the compact form associated with it, is not just a cheaper option in terms of
financing infrastructure but also contributes to increased economic performance (Nelson and
Peterman, 2000; Cervero, 2001). Cervero (2001) found that, all else being equal, cities that are
compact and accessible by efficient transport infrastructure are among the most productive
settlements. This is attributed to the basic theory that densely populated cities act as incubators
and, when clustered together, supply firms with access to employment pools. Matched with
efficient transportation networks, productivity increases by allowing individuals to spend less
time commuting. Further, a study conducted by Nelson and Peterman, measuring economic
performance of 192 municipalties with the presence or absence of growth management
frameworks found that growth management policies focused on increased density are
postitively associated with economic performance (Nelson & Peterman, 2000). In the United
States, a Smart Growth policy review conducted by Ingram et al. (2009) which compared four

18
states with Smart Growth development approaches with four that did not, found those states
with Smart Growth policy and plans experienced positive outcomes such as decreased loss of
open space, lower levels of congestion, densification within the built-up area and increased
transit use.
Goetz’s study of Denver, Colorado (2013), a city comparable to that of Calgary, presents an
example where Smart Growth policy has been embraced, while conventional urban
development remains as the dominant form of urban growth. Similarly, Denver experienced
rapid population growth in the 1990s. Urban sprawl was the dominant form of growth,
resulting in the common problems of increased pollution, vehicle miles driven, and
infrastructure funding issues. Due to this, the municipality embarked on a planning process
resulting in a Metro Vision plan based on Smart Growth principles. Specific elements “included
a voluntary urban growth boundary that was initially set not to exceed 700 square miles, a focus
on higher-density development in designated urban centres, designation of four freestanding
communities, improving air quality in the region and, most significantly, a rail transit system
that would serve as the backbone of the regional transport system” (Goetz, 2013). Mayors of the
Denver Metropolitan Region also formed a voluntary Metro Mayors Caucus (MMC), similar to
the Calgary Regional Partnership (CRP), using a collaborative and consensus-based approach to
assist in the development of a consistent and cohesive vision for the region. Goetz’s study
highlights that Smart Growth has been more successful at implementing a paradigm shift to
conventional development. Challenges still exist, but Denver is noted to be changing its growth
19
trajectory by increasing job and population densities, developing mixed-use nodes and
increasing transit use.
Addressing the Challenges
Implementing Smart Growth principles does not come without challenges. As Downs states
(2007, p. 369), “few regions have put into practice the most problematic principles. And almost
no areas (not even Portland, Oregon) have implemented all of Smart Growth’s principles.”
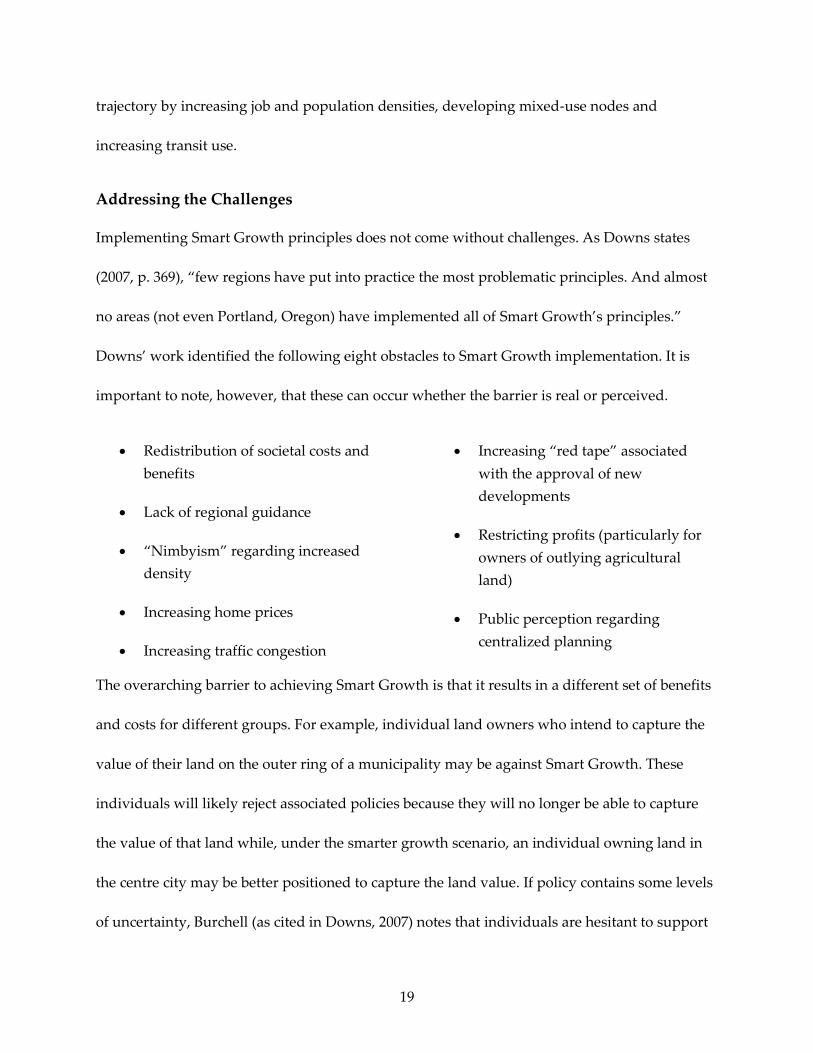
Downs’ work identified the following eight obstacles to Smart Growth implementation. It is
important to note, however, that these can occur whether the barrier is real or perceived.
Redistribution of societal costs and
benefits
Lack of regional guidance
“Nimbyism” regarding increased
density
Increasing home prices
Increasing traffic congestion
Increasing “red tape” associated
with the approval of new
developments
Restricting profits (particularly for
owners of outlying agricultural
land)
Public perception regarding
centralized planning
The overarching barrier to achieving Smart Growth is that it results in a different set of benefits
and costs for different groups. For example, individual land owners who intend to capture the
value of their land on the outer ring of a municipality may be against Smart Growth. These
individuals will likely reject associated policies because they will no longer be able to capture
the value of that land while, under the smarter growth scenario, an individual owning land in
the centre city may be better positioned to capture the land value. If policy contains some levels
of uncertainty, Burchell (as cited in Downs, 2007) notes that individuals are hesitant to support

20
it. The redistribution of said costs and benefits, and a level of uncertainty, produce a new set of
advocates and opponents. Downs (2007, p. 369) illustrates this example simply by stating that
“this is a serious difficulty associated with changing any fundamental arrangements in a
complex society.” This is probably the largest barrier to implement Smart Growth policy. If
redistribution is to occur as a result of Smart Growth implementation, a regionalist strategy
shifting power from municipalities to a higher level of decision making, may be essential
(Downs, 2007). From this point, there are two options: Smart Growth principles can (1) be
mandated (legislatively) or; (2) Jointly agreed upon through consensus.
Evidence of both cases exists in the Canadian context. In Ontario, the Growth Plan for the
Greater Golden Horseshoe, legislated through the Places to Grow Act, illustrates a case where
the Provincial Government mandates Smart Growth policy upon its “creature” municipalities in
Southern Ontario (Ontario Ministry of Municipal Affairs and Housing, 2006). The policy
requires that municipal level plans (i.e. Official Plans) conform to the provincial legislation. The
overarching plan orders such planning principles as to where density should occur and which
areas will be dedicated as employment (i.e. industrial) land. Provincial willingness to set
planning goals, imposes them on municipalities, and monitor compliance provides a level of
planning that is not currently occurring in Alberta. Nevertheless, Ontario provides an example
of implementing Smart Growth policy through regulation.
Metropolitan Vancouver offers an example based on consensus. The municipality incrementally
developed a collaborative system of regional planning over the past century. This is a long time
horizon; however, research conducted by Taylor et al. (2014, p. 40) found that “a shared belief in

21
urban containment and intensification is now deeply embedded in local political discourse and
in the practices of planning professionals and the development-builder industry.” One thing to
note is that in the two examples of Toronto and Vancouver, an urban containment boundary is
utilized (The Agricultural Land Reserve in Vancouver and the Greenbelt in Toronto). The
geographical differences of each region need to be considered when analyzing the relative
approaches to urban growth.
Calgary’s use of the Framework for Growth and Change signifies, to some degree, a move to
redirect population between developed and developing communities. It is also an attempt to
phase the timing and location of growth and identify how it will be financed. Although not
formalized through a geographical urban growth boundary (UGB) the framework attempts to
focus growth in planned areas. Geographically imposed boundaries would make intensification
easier, however, doing so in Calgary would be politically challenging. The challenge has been
identified by Nelson and Dawkins (2004, p. 16) who identify that “containment requires a
regional perspective in which some meaningful effort is made to direct development to specific
areas and away from others where development would proceed in the absence of intervention.”
The Future of Smart Growth
Although this paper is focused on Smart Growth, particularly at a local level, Chapin (2012)
does explore interesting evidence suggests that growth management planning is entering a
fourth era which he titles the sustainability era. He argues that planning will begin considering
macro level issues such as energy diversification, climate change, economic development,
employment and affordable housing. The distinctive characteristic of this era is that local and
22
regional plans will be linked to national plans and policies. Further growth management, he
argues, will ascend the regional levels (i.e. provincial plans).
Similar arguments are made by Ingram et al. (2009), based on their comprehensive study
suggest that new rationales for Smart Growth are being realized because:
“States are expected to turn to land use planning to help achieve emission reduction
goals; a new regulatory regime will benefit development proposals that adhere to Smart
Growth framework; and market forces may also encourage more compact mixed-use
development as households attempt to limit their travel costs and achieve other energy
savings.”
There is some evidence of this occurring in Canada. The most notable example is the
aforementioned Growth Plan for the Greater Golden Horseshoe. There is also some evidence
that this is occurring in Alberta. The recently introduced Alberta Land Use Framework and the
associated South Saskatchewan Regional Plan, including Calgary, signal an increased presence
in regional planning from the Alberta government.
The literature presents hopeful signs that Smart Growth principles are successfully encouraging
an alternative to sprawl. While this section provides a broad synopsis of the Smart Growth
literature, the analysis section will incorporate additional research relating specifically to the
element being discussed.

23
How did we get here? A historical review of urban sprawl in Calgary
“The past invariably shapes the present and partly determines the contours of the future, for societies
cannot – and do not – break from the past so much as work with it to create a ‘usable future.’” (Brooks as
cited in Dierwechter, 2008, p. 16)
Motivations for Sprawl
We cannot look at the rise of Smart Growth policy in Calgary without understanding how the
City arrived at this point. The usefulness of a historical review is best summarized by Burchell
et al. (2000, p. 838) who states: “the luxury of looking back 50 years is that we know how things
turned out.” As mentioned, Smart Growth policy emerged from the economic, social, and
environmental costs related to urban sprawl, many of which Calgary is only recently beginning
to understand. One of the key reasons urban sprawl is the dominant form of growth in Calgary
is because much of the rapid population increases it experienced occurred during the rise of the
automobile in North America. This enabled individuals to live further from their jobs and social
activities. Calgary is not considered to be bound by its geography in ways similar to Vancouver
or Toronto. Even today, Calgary’s sprawling form, based on aggressive outward expansion still
accounts for only 10% of the CMA while 90% is farmland (Tomalty & Alexander, 2005).
Therefore, Calgary’s ability to grow outwards, through land annexations, was a popular motive
of developers during the post-war period as they “established a notion that outward growth
was cheaper and therefore better than operating within the existing boundaries” (Foran, 2009, p.
42).
One of the unique features highlighted in the literature is that The City subscribed to a to a
“UniCity” model that enabled one level of public authority to govern the population (Tomalty

24
& Alexander, 2005; Ghitter, 2008; Foran, 2009; Taylor et al., 2014). The model is noted to have
been adopted as early as 1955 and primarily focused on annexing fringe cities and villages with
a regional justification based on financial efficiency and planning control. The model was
formalized, as Taylor highlights, in 1956 when the McNally commission confirmed and enabled
an official policy, later known as the UniCity principle (Taylor et al., 2014). The model is still
prevalent today; however, it is showing signs of being challenged. The satellite municipalities of
Airdrie, Chestermere, Okotoks, and Cochrane have established large enough populations to
enhance their level of independence in the region. Figure 2 depicts Calgary’s UniCity expansion
from 1951 to 2012 in relation to the city’s current municipal boundary.

25
Figure 2: Calgary's Spatial Growth from 1951-2012 (The City of Calgary: Geodemographics, 2014)

26
Early Days: 1945-1962
The foundations of urban sprawl, Foran (2009) argues, were laid during the period of 1945-1962
in which trends formed patterns of development that were replicated over multiple decades. By
1955 these values were firmly entrenched in the mindset of city officials, developers and citizens
alike. During the period of 1956 to 1961, Calgary annexed large quantities of land, growing its
boundaries from 40 to 151 square miles. Street car lines were removed to make way for
highways and private developers were given the opportunity to build and finance their own
subdivisions. The City also exited land development entirely in 1958 with its sale of 182 acres of
land to private interests. In this period, Calgary began its momentous shift to a suburban form,
identified as “the age of the developer” (Foran, 2009, p. 23).
The majority of new developments were low density, automobile-oriented communities which
reinforced modernist city planning principles apparent during this time period. Zoning
practices also reinforced low density built form (e.g. single family homes), while city officials
declined to increase densities; a move that was supported by developers who preferred single
family home construction. This form of housing became the norm while developers and city
staff “generally assumed that all buyers wanted it” (Foran, 2009, p. 73). Out of the 43,000
housing units built during this period, approximately 37,000 were single family homes.
Condominium construction was so miniscule that is was not even reflected in building statistics
until 1975 (Foran, 2009). The lack of diverse housing options provided during this era can be
identified as catalyst that accelerated urban sprawl because it reduced choice and created a
standard expectation. For example, when the community of Thorncliffe Heights was being
construction, the developer was able to secure a caveat that the entire area would maintain R1

27
zoning (i.e. single family homes) for 15 years (Foran, 2009). The result is that neighbourhoods
such as this currently experience some of lowest densities in the city and, although relatively
close to the city centre, are only recently showing signs of intensifying.
The 1970s: Hints of Smart Growth
Developer stance against growth control measures in the 1970s was based on the same
underlying argument today – that rising house prices are linked to the shortage of available
land (Foran, 2009). Under the UniCity model, Calgary continued to grow through annexations
with the aim to control growth in fringe communities located outside the city limits and enable
orderly expansion of planned development. In 1977 the City of Calgary introduced the Balanced
Growth Policy which was a long term strategy for accommodating the large expected
population increases. The plan evolved out of eight alternate growth approaches for the City, of
which only three proposed an increase in density. Of the eight, two would be considered
“Smart Growth” strategies in the present time period and are summarized below:
Strategy A: The Compact City - Annexation was discouraged and densities are increased.
The City would accommodate half of the population increase within the built up area
and the other half through suburban expansion (the exact same goal is contained within
the present day MDP). The use of the car was discouraged and the majority of the plan
was based around public transit.
Strategy D: Maximum Efficiency of Investment and Resources – This plan attempted to
increase densities within areas where infrastructure was present, primarily on
28
transportation routes. Six nodes were established with about half of the population
increases contained within the central area.
These two options present particularly interesting pieces of information because they detail an
understanding of Smart Growth policy almost 30 years before the major policy shift occurred in
Calgary. Strategy A includes the same principle for accommodating population growth as the
current MDP. The 50/50 split for accommodating population increases is the current goal for
2076.
Although these strategies were favoured by city officials and the corresponding business units,
they were rejected by Council. Foran suggests that The City likely bowed to the pressure from
developers and approved a strategy favouring outward, low density growth. He goes on to
state: “It was in many ways a historic policy decision, and was likely the City’s last opportunity
to curtail a 25 year trend and marked a victory for the land developers” (Foran, 2009, p. 121).
This presents a discouraging reality that illustrates the barriers to intensification and the
grueling long-term process to increase density.
Even pragmatic approaches, justified on market principles, were rejected during this period. For
example, Foran (2009) notes that, one developer proposed to build a high density, affordable
apartment in the city centre. The project aligned with the City’s General Plan at the time to
accommodate density increases within transportation corridors. A required zoning amendment,
however, was rejected multiple times on the grounds that “the need for cheaper
accommodation cannot be used as a criterion for rezoning and that any rezoning at this time
would be a breach of faith with those developers who have constructed duplexes” (Foran, 2009,

29
p. 190). Further, another apartment development in Sunalta was rejected on the grounds that
high density development should not be mixed with single family and low density
developments (Foran, 2009). One of the large city developers attempted to experiment with
mixed-use, higher densities and a town centre concept as early as the 1960s (early New
Urbanism). The town centre concept was not welcome and The City staff demonstrated very
little support for it because they worried about traffic increases and according to Foran, it was
(2009, p. 167 ) rejected on obscure grounds such as that “people would drive rather than walk to
the shopping centre because their purchases would be too heavy to carry.” Developer amenities
also became popular during this period in the form of lakes, golf courses significantly
enhancing the geographic size of communities.
Transportation planning also contributed to urban sprawl as streets were designed to “move
traffic rather and emphatically not to accommodate business” (Foran, 2009, p. 177). This directly
contrasts with how streets are viewed today, particularly within centralized neighbourhoods
such as the Beltline, Mission, and Kensington. From this point, planning catalyzed the move to
large shopping complexes, controlling entrance and egress, and the provision of off-street
surface parking lots. I can empathize as to why these decisions were made; specifically to
accommodate a major trend of increased car usage, however, looking back these decisions
negatively impacted the city. I agree with Foran, that as a result of these decisions, the
sprawling form was exacerbated. Examples such as these strongly contribute to the perception
of Calgary as one focused on the automobile, single family homes and single use zoning.
30
Most of the historical plans focus on outward growth as the norm rather than intensification,
the preservation of affordable housing options and efficient use of existing infrastructure
(Taylor, Burchfield, & Kramer, 2014). There have been anecdotal mentions of mixed-use,
increased density, transit oriented developments, and efficient forms of growth, yet they were
typically rejected by the masses. As early as 1970, municipal planners identified a growing need
to incorporate mixed uses and increase densities city-wide, however, Foran (2009) indicates that
developers dominated planning and development in Calgary. Regarding the environment,
Foran (2009) notes that Calgary sprawled across the open land, built on chernozemic black soil,
which he states is some of the best in the world, however, at the time no one understood the
implications or seemed to care. These insights were largely ignored as Calgary continued its
outward growth pattern, relatively unchanged until the turn of the century.
Historical Stakeholders
Foran notes five influences contributing to sprawl in Calgary. They are (not in order of rank): (1)
The City of Calgary, (2) Land Developers, (3) Home Buyers, (4) The Provincial Government,
and (5) Canada Mortgage and Housing Corporation (CMHC) (Foran, 2009). City officials and
developers were considered to be the main actors while demand for single family homes, made
possible by the CMHC, perpetuated sprawl. During this period CMHC was actively involved
and its “ubiquitous presence at planning stages meant that negotiations affecting housing were
not exclusive to the City [of Calgary] and the developers” (Foran, 2009, p. 14). As we will see,
these forces still heavily influence development in Calgary today and will likely be the same in
the foreseeable future. The parallels to the current developer mindset in the city today are
astounding. During this time, increases in density were generally refused on the grounds of
31
“property devaluation,” “breaches of faith,” and “regressive neighbourhood character,” while
parking requirements were introduced that further utilized vacant land (Foran, 2009).
Recent History: Sprawl as a Regional Issue
An important occurrence, seen as hindrance to reign in urban sprawl, arose in the 1995 when
the Provincial Government replaced formalized Regional Planning Commissions (RPCs), with a
voluntary mechanism for inter-municipal cooperation. Traditionally, RPCs gave Calgary
indirect control over the pattern of urban development beyond its boundaries, however, the
movement to voluntary regional planning, as Taylor et al. (2014) argues, is not as effective. The
voluntary system is still in place today and is becoming a prevalent and controversial issue as
the Calgary Metropolitan Region continues to become increasingly fragmented. Tomalty and
Alexander (2005) also highlight the weak substantive wording of the MGA, stating that 44 of the
49 policies use “municipalities are encouraged.” The lack of Provincial direction regarding
regional issues has been voiced by municipalities including Calgary. For these reasons, the
MGA is currently being reviewed and, while in the consultation process, stakeholders highlight
that “municipalities cannot be mandated to collaborate; collaboration needs to be voluntary.
However, the Province should encourage, facilitate, and incentivize regional collaboration”
(Alberta Government, 2015).
In a continuing effort to control suburban growth, Calgary has refused to extend water trunk
pipes to surrounding municipalities that do not meet minimum density targets, resulting in
rural communities (e.g. Rocky View County) boycotting the CRP and its associated plan (Taylor
et al., 2014). Nonetheless, surrounding municipalities with water capacity are continuing to

32
grow rapidly. As a result, Calgary is beginning to reflect more of a metropolitan city form,
ubiquitous in other large Canadian cities as its share of the regional population has been slowly
declining since 1951 while “the regional population outside the City of Calgary has almost
tripled since 1991, from 67,000 to 180,000” (Taylor et al., 2014, p. 9). More recent data indicates
that the satellite communities are growing at a faster rate (as a percentage) than Calgary,
decreasing the city’s share of the regional total. The implication to planning highlighted in Table
1 is that, for the first time in history, satellite municipalities are growing more rapidly than the
City of Calgary. Tomalty and Alexander (2005, p. 77) argue that:
“Given the high level of growth in the region, the continued provincial spending on
highway upgrades, and the lack of regional governance institutions, exurban
development outside the City of Calgary’s boundaries is likely to become a more salient
issue in the future. This development also undermines Smart Growth objectives within
Calgary as it is frequently argued by those advocating a more laissez-faire approach to
planning that managing growth with strong regulatory instruments will only push
residents in search of low-density, segregated and homogenous communities into the
exurban regions, an outcome worse than sprawling development within the city limits.”
Recent population increases within exurban areas, as illustrated in Table 1: Calgary Share of the
Metropolitan Region (Statistics Canada, 2014) support Tomalty and Alexander’s viewpoint.
Only recently has the provincial government become more involved in planning through the
Alberta Land Stewardship Act passed in 2009. The South Saskatchewan Regional Plan,
approved in 2014, impacts Calgary, requiring municipal plans to be consistent with the

33
provincial document (Alberta Government, 2014). Regional planning as currently structured is
still a problem because, as Taylor et al. argue (2014), the Act provides no mechanism for the
province to assess, let alone enforce, municipal compliance, so the degree to which the policies
influence local planning is not known. The MGA is currently under review, in the consultation
phase, and the Province expects to finalize a new Act in 2016. A report detailing current
consultations highlights that municipalities have encouraged the Province to become more
involved in growth management and that the largest cities should have autonomy to decide
various legislative and financial decisions and mechanisms (Alberta Government, 2015).
At present, Smart Growth buy-in remains as a significant challenge for Calgary and the CMA.
As summarized by Taylor et al. (2014, p. 40):
“Strident opposition by a powerful and well organized development industry that has
no incentive to depart from a highly profitable suburban model is coupled with weakly
institutionalized regional coordination and inconsistent political support on city council
for the new planning direction. If this condition persists, Calgary may find it difficult to
reorient its urban development policy regime from one premised on expansion and
efficiency objectives to one oriented around intensification and sustainability
objectives.”
2011 2012 2013 2014
Population
(City of Calgary) 1,096,833 1,120,225 1,156,686 1,195,194
Population (Calgary Metropolitan Area) 1,264,500 1,307,600 1,357,600 1,406,700
Calgary Population (% Share of Regional Population) 87% 86% 85% 84%
Table 1: Calgary Share of the Metropolitan Region (Statistics Canada, 2014)
34
A Shifting Paradigm – The Municipal Development Plan
At the turn of the century Calgary began to plan for increased densities and intensification.
When Calgary is compared to other major centres in North America, the city could be
considered a Smart Growth laggard, although, processes that eventually crafted the MDP began
in the early 2000s (Burchell, 2000; Taylor, Burchfield, & Kramer, 2014). The development of
Calgary’s MDP, although led by city hall, included a significant portion of engagement with
citizens. Downs highlights three groups that tend to be strong advocates for Smart Growth.
They are: (1) nongovernment environmentalists; (2) urban planners and other local public
officials and (3) innovative real estate developers. He goes on to argue that the commonality
between these groups, in their promotion of Smart Growth principles, is that they do not
include everyday citizens. In Calgary’s case, the main group advocating for smarter urban
growth options in Calgary are the local planners and public officials. The citizens in Calgary’s
case, however, proved to be identifying a need for growth patterns to change when they were
consulted through a comprehensive engagement process to establish the city’s 100-year vision,
titled imagineCALGARY in 2005. At the time, imagineCALGARY was considered to be the
largest visioning exercise of its kind, engaging over 18,000 citizens (City of Calgary, 2007). This
initiated the Plan It Calgary process which eventually led to the Municipal Development Plan
and Calgary Transportation Plan in 2009. This is a contrast to Downs’s argument because,
although mostly suburban, citizens advocated for a need to reassess the City’s urban growth
trajectory.

35
The basis of Calgary’s Municipal Development Plan is rooted in the Sustainability Principles for
Land Use and Mobility adopted by Council in January 2007. These principles are heavily
influenced by Smart Growth principles derived from both Canadian and American Smart
Growth networks (City of Calgary, 2007).
The MDP divides Calgary’s urban structure into six distinct geographic areas. These include
Centre City, Activity Centres, Corridors, Developed Area Residential, Developing Area
Residential and Industrial. These are highlighted in Figure 3: Urban Structure - Calgary MDP.
The MDP includes 6 broad areas which include policies focused on:
1) A Prosperous Economy;
2) Shaping a More Compact Urban
Form;
3) Creating Great Communities;
4) Urban Design;
5) Connecting the City and;
6) Greening the City.
Key takeaways from the historical review:
Long history of sprawl engrained within the cultural mindset of Calgary’s citizens,
developers, and Council members
Lack of regional guidance stemming from 1995 abolishment of formalized RPCs
Excessive growth in suburban communities such as Airdrie, Cochrane, and Chestermere
have the potential to undermine Smart Growth initiatives in Calgary
Lack of regional planning authority to encourage and direct Smart Growth in the
Calgary Metropolitan Region

36
Figure 3: Urban Structure - Calgary MDP

37
4. Analysis and Discussion
The structure of the analysis is based on the two primary goals of smart growth as identified in
the literature (Cervero, 2001; Nelson as cited in Blais, 2010). As mentioned, this paper will
additionally analyse the impacts of Smart Growth policy on housing affordability. Although not
a primary goal of Smart Growth, it is one that is highly topical in Calgary, garnering significant
public attention and often used as an argument against smart growth. These components,
outlined below, will be used to organize the analysis in order to determine if MDP policies are
progressing towards the overall goals of Smart Growth.
1) Promoting Compact Development - Building where infrastructure and development
already exist by increasing density.
2) Providing and Promoting a Variety of Transportation Options - connecting land uses
with transportation alternatives to the car.
3) Supply Affordable Housing – enhancing affordability and increasing options.
Key themes and takeaways will be presented at the end of each section and expanded upon in
section 5 of this report.
Promoting Compact Development
This section examines growth and density trends in Calgary using Statistics Canada census data
as well as that supplied in City of Calgary planning documents and reports. Section 2.2 of the
Calgary MDP (2009), “Shaping a More Compact Urban Form,” identifies a need to direct
growth in a way that efficiently uses current and future infrastructure. One of the policy options
is to encourage increases in density, which Pamela Blais defines as “the single most important
determinant of the efficiency of the use of land and infrastructure” (2010, p. 60). This is an

38
important aspect because, as she explains, density plays such an important role in achieving the
additional goals of Smart Growth and is a prerequisite that enables infrastructure such as
higher order transit. One thing to highlight is the strong policy wording within the MDP
regarding density. For example one policy reads “ASPs for new communities in Future
Greenfield Areas will achieve a minimum intensity threshold of 60 people and jobs per gross
developable hectare. This community intensity level includes NACs, CACs, Urban Corridors
and Neighbourhood Corridors, as identified in the ASP. ASPs must also demonstrate how a
target density of 70 people and jobs per gross developable hectare can be achieved over the life
of the plan” (The City of Calgary, 2009).
Density and intensity are some of the more referenced terms in the MDP and are utilized in
multiple measures including:
Achieve a balance of growth between developed and developing communities by
accommodating 50% of the population in each area by 2076.
Achieve a city-wide density of 27 people per hectare and 18 jobs per hectare by 2076
with high density accommodated in the city centre, urban corridors, and major activity
centres.
Achieve an intensity of 60 (demonstrate potential for 70) people and jobs per gross
developable hectare in developing neighbourhoods and a minimum density of 20 units
per gross developable hectare.
The following analyses seek to understand if Calgary has been densifying and whether or not
the city is progressing towards a more compact model for urban growth.
39
Urban Form - Where is growth occurring?
Before we examine density, it is important to understand the urban form of Calgary and how
population growth is being accommodated. The majority of growth has occurred at the fringe,
indicating that the city is having trouble accommodating population increases in the built-up
area. Growth figures in the city centre (e.g. the Beltline neighbourhood) are promising;
however, the outer suburbs are still the focal point of population growth. A map of population
growth by community from 2001 to 2011 is highlighted in Figure 4; depicting high growth areas
in yellow. Blue and grey show areas experiencing negative and stagnant growth respectively.
The results demonstrate that the population is increasing mainly on the outer edge of the city,
while the inner suburbs are seeing zero or negative growth. An inference from this is that
policies supporting intensification have had a minimal effect on the inner suburbs, such as
infilling or brownfield redevelopment. As of 2012, 96% of the population increases have been
accommodated through greenfield expansion. While the centre city, central city, activity centres,
and corridors typologies are showing signs of densifying, the established areas are declining in
population. Another explanation, based on analysis conducted by Taylor et al. (2014) highlights
that neighbourhood intensification in the developed areas area has not resulted in population
increases because of declining occupancy rates.
Although the majority of the population increases are being accommodated in suburban
neighbourhoods Taylor et al.’s (2014) analysis demonstrates encouraging signs that new
suburban developments are consuming less land. Their research notes that suburban
consumption was 2 hectares per 100 new residents in 2001–2011 versus 6.5 h in 1991–2001.

40
Figure 4: Calgary Population Change by Community (City of Calgary, 2013)

41
Given the minimal impact intensification has had on increasing the population in the built up
area, there are currently a number of large scale projects that have the potential to accommodate
significant population within the built-up area. Two of these projects, East Village and Currie
Barracks, are currently under construction. The final portion of the Currie Barracks plan is in
the process of being amended to increase density (including the commercial hub) and is slated
for approval in 2015. Each project is highlighted in Table 2: Large Scale Intensification Projects
in Calgary, demonstrating high density and a potential to support large population increases.
Project Land Use Typology Population Forecast (Total individuals based on
minimum and maximum scenarios)
Density Forecast (units per gross developable
hectare [upgdh} based on
minimum and maximum
scenarios)
Currie Barracks Inner City 11,100 to 21,300 22 – 62
(proposed)
East Village City Centre 11,500 494
Table 2: Large Scale Intensification Projects in Calgary
Population Density
Statistics Canada measures population density by the number of individuals per square
kilometre using the municipal boundary. Measuring density using this approach can be
deceiving because it includes large portions of undeveloped land. The MDP measures density
on a per hectare basis using the built up area as the boundary. The built up area more
accurately represents where individuals live and is more useful than calculating density based
on the municipal boundary because it precludes greenfield land that is yet to be developed but
exists within the municipal boundary. Density per kilometre and density per hectare based on
built up areas are included in Table 3.
42
As mentioned, the MDP focuses on increasing densities and promoting a compact urban form.
Table 3 demonstrates Calgary’s decreasing population density from 1951-2011. While the city
experienced significant population and geographical growth over the 60 year period,
population density decreased by 28%. An inference is that any initiatives or incentives to
increase population through intensification, specifically from 1951 to 2001, have been essentially
non-existent. As described in the historical review, low-density policy was firmly rooted in the
politics and culture of the city until the turn of the century. The observations noted by Foran are
supported by the data presented in Table 3. Another explanation for decreased density this is
the long term decline of average household size due to factors such as “including longer
lifespans, delayed family formation, divorce, and family planning” (Taylor et al., 2014). An
implication of this is that more housing is required to accommodate the same population and
more housing requires more space. The only period in which density increased is the years
between 2001 and 2011, growing by 6%. The increase is consistent with the ideology shift to
smart growth ultimately formalized by the MDP in 2009.

43
Table 3: Historical Population Density from 1951-2011 (Statistics Canada)
Another way to look at population density is by attributing the amount of developed land to
one individual or; developed land per capita. It is essentially the inverse of population density
yet offers a personalized indicator of how much land is devoted to each person. In 1951, one
person consumed about 3% of one hectare, or about 300m² of developed land. By 2011, about
430m² of land is developed for every individual; an increase of 38%.
Figure 5: Historical City-wide Population Density
More recent data from Calgary Geodemographics (2014) indicate that population density is
continuing to rise and growing at a rate almost equivalent to that of the population growth rate.
Table 4: Density 2011-2014 demonstrates an increase in density of 7 percent from 2011 to 2014.
3,227
2,400 2,474 2,271 2,249 2,197 2,339
1951 1961 1971 1981 1991 2001 2011
Historical City-wide Population Density
Density
1951 1961 1971 1981 1991 2001 2011 Growth (%) (1951-2011)
Built-up Area (km ²)
40 104 163 261 316 400 469 1073%
Built-up Area (Ha)
4000 10,400 16,300 26,100 31,600 40,000 45,900 1073%
Population 129,060 249,641 403,319 592,743 710,795 878,866 1,096,833 750%
Density (individual/km ²)
3,227 2,400 2,474 2,271 2,249 2,197 2,339 -28%
Density (individual/ha)
32 24 25 23 22 22 23 -28%
Developed land per capita (hectares)
0.031 0.042 0.040 0.044 0.044 0.046 0.043 38%
44
2011 2012 2013 2014 Growth (%)
2011-2014
Built-up Area (km ²)
469 477 477 477 2%
Built-up Area (Ha)
46,900 47,700 47,700 47,700 2%
Population 1,096,833 1,120,225 1,156,686 1,195,194 9%
Density (individual/km ²)
2,339 2,348 2,425 2,596 7%
Density (individual/Ha)
23 23 24 25 7%
Developed land per capita (hectares)
0.043 0.043 0.041 0.040 -7%
Table 4: Density 2011-2014 (The City of Calgary: Geodemographics, 2014)
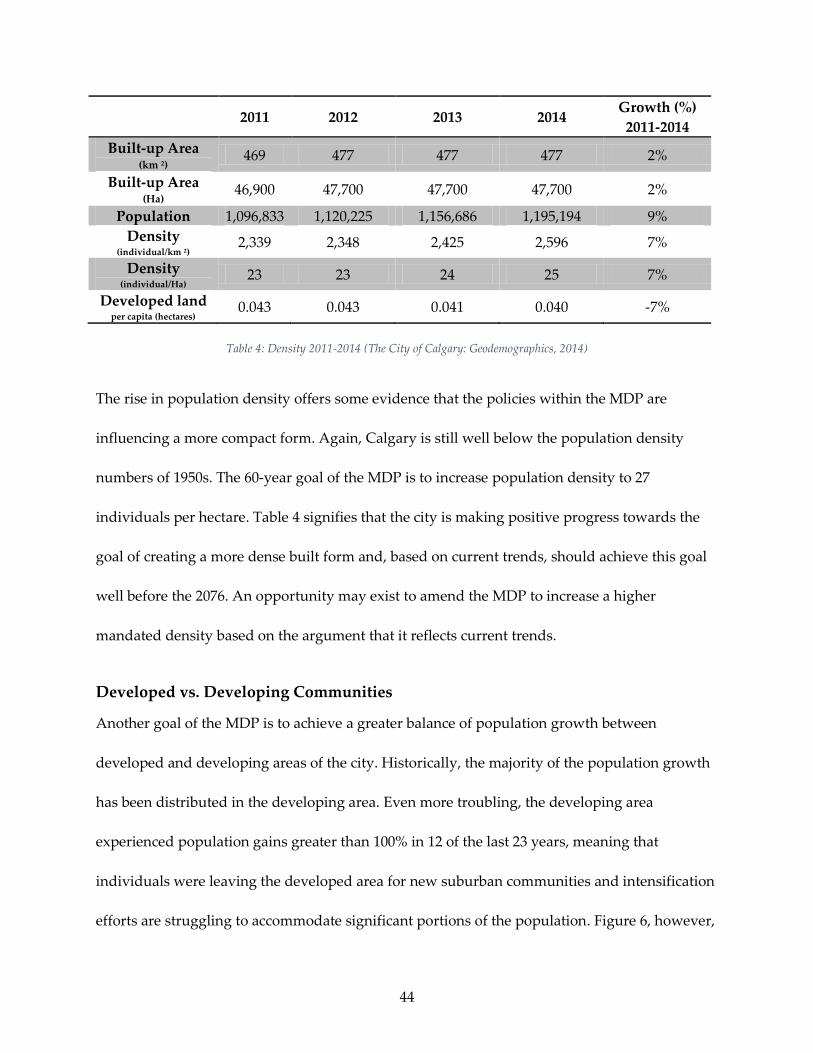
The rise in population density offers some evidence that the policies within the MDP are
influencing a more compact form. Again, Calgary is still well below the population density
numbers of 1950s. The 60-year goal of the MDP is to increase population density to 27
individuals per hectare. Table 4 signifies that the city is making positive progress towards the
goal of creating a more dense built form and, based on current trends, should achieve this goal
well before the 2076. An opportunity may exist to amend the MDP to increase a higher
mandated density based on the argument that it reflects current trends.
Developed vs. Developing Communities
Another goal of the MDP is to achieve a greater balance of population growth between
developed and developing areas of the city. Historically, the majority of the population growth
has been distributed in the developing area. Even more troubling, the developing area
experienced population gains greater than 100% in 12 of the last 23 years, meaning that
individuals were leaving the developed area for new suburban communities and intensification
efforts are struggling to accommodate significant portions of the population. Figure 6, however,
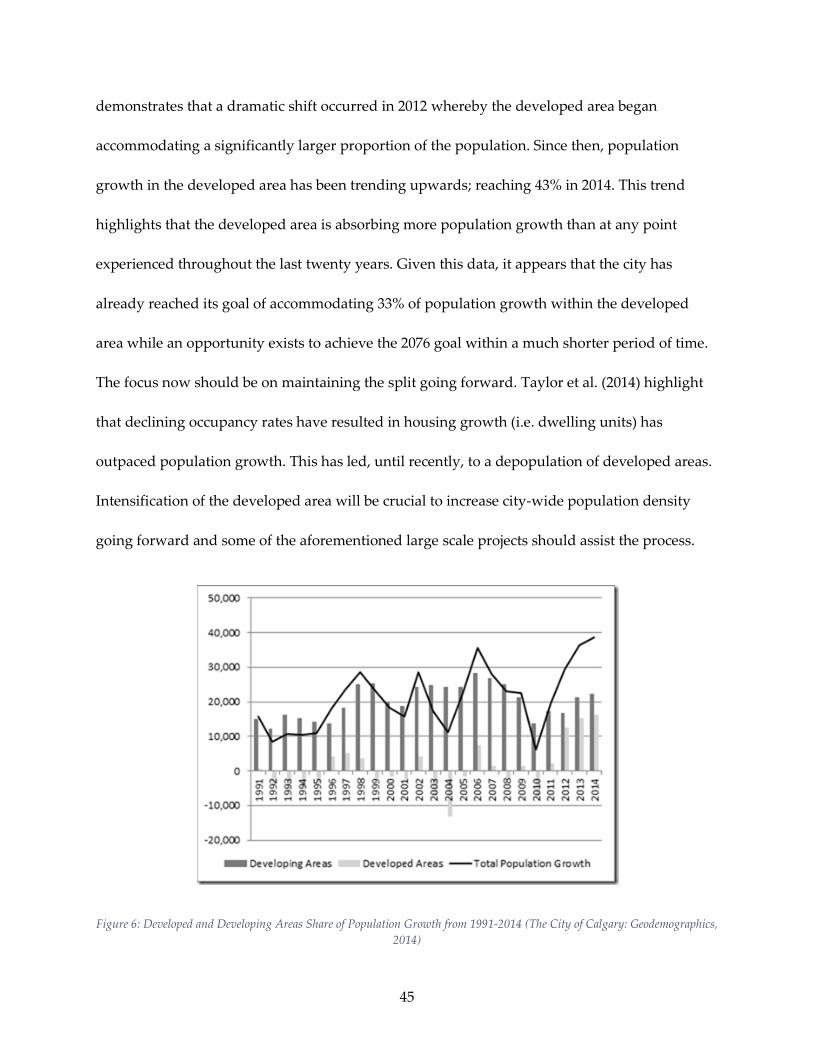
45
demonstrates that a dramatic shift occurred in 2012 whereby the developed area began
accommodating a significantly larger proportion of the population. Since then, population
growth in the developed area has been trending upwards; reaching 43% in 2014. This trend
highlights that the developed area is absorbing more population growth than at any point
experienced throughout the last twenty years. Given this data, it appears that the city has
already reached its goal of accommodating 33% of population growth within the developed
area while an opportunity exists to achieve the 2076 goal within a much shorter period of time.
The focus now should be on maintaining the split going forward. Taylor et al. (2014) highlight
that declining occupancy rates have resulted in housing growth (i.e. dwelling units) has
outpaced population growth. This has led, until recently, to a depopulation of developed areas.
Intensification of the developed area will be crucial to increase city-wide population density
going forward and some of the aforementioned large scale projects should assist the process.
Figure 6: Developed and Developing Areas Share of Population Growth from 1991-2014 (The City of Calgary: Geodemographics,
2014)

46
Job Density
Job density is also an important factor to achieve a more compact urban form. In Calgary, a
highly centralized urban core accommodates approximately one quarter of the city’s total jobs.
In the central area, densities approach 1,000
jobs per hectare (jph) while greenfield areas
experience job densities as low as 5 jph (The
City of Calgary: Geodemographics, 2014).
Figure 7 visually depicts Calgary’s highly
centralized job density. The central city
accommodates the majority of jobs,
specifically related to office (blue) while retail (red) is scattered throughout the city, particularly
along corridors. Much of the industrial (grey) activity is provided on the eastern edge of the city
(The City of Calgary: Geodemographics, 2014). Overall, the city aims to reach an average job
density of 18 jobs per hectare by 2076. Currently, density sits at about 13 jobs per hectare.
Tomalty and Haider (2012) found that new communities built after 1981 contain very few
employment opportunities. Job density in communities built before 1981 is approximately six
times greater the density employment density of communities built after 1981. The
development of the MAC typology is a strategy contained with the MDP signaling a movement
away from the dependence on the downtown while offering a greater mix of land uses to
discourage dependence on the automobile. The MAC typology applies to development within
and outside the built-up area.
Figure 7: Geographical Distribution of Jobs (City of Calgary, 2011)

47
Key Takeaways
Calgary is densifying. Trends indicate that population density is increasing city-wide,
specifically in new suburban areas where a mandatory minimum density of 20 uph in
greenfield exists
City-wide population density levels are well below 1950 numbers
New projects such as Currie Barracks and the East Village demonstrate encouraging
signs that the city could accommodate significant population increase within the built
up area
Since 2012, a greater share of the overall population increase has been distributed within
the developed area.
Job density is highly concentrated in the core – need to leverage this by continuing to
increase the supply of housing near the core and along transit lines
Housing growth has outpaced population growth which challenges increasing overall
population density
The ability to meet goals regarding a more compact urban form could be a result of
strong policy wording in the MDP
An opportunity may exist to amend the MDP to increase a higher mandated density
based on the argument that it reflects current trends
Providing and Promoting a Variety of Transportation Options
This section examines transportation trends in Calgary using data from Statistics Canada, the
American Public Transportation Association and that supplied in City of Calgary reports.
Section 2.5 of the Calgary MDP, “Connecting the City” (2009), identifies a need to develop an
integrated, multi-modal transit system that provides alternative transportation options to the
automobile.

48
Calgary’s transit system is separated into both primary and secondary networks. Primary
networks provide connected, high frequency service that aims to support the activity centre and
corridor typologies specifically. These systems include three Light Rail Transit (LRT) routes
covering 56km and a BRT system totaling 25km. Continuous investments in the LRT have
occurred as the city expands geographically. In addition, The City continues to plan for
networks with the aim of supplying 26 km of LRT transit to the north-central and southeast
populations (City of Calgary, 2013). Figure 8: Investment in Transit Infrastructure since 2001
depicts transit upgrades since 2001, illustrating major primary network upgrades in the last 14
years. A base transit system supplements the primary network with a number of feeder routes.
Other alternative transportation networks include a regional pathway systems and, as of 2015, a
separated cycle track network in the city centre.
Figure 8: Investment in Transit Infrastructure since 2001 (Pembina Institute, 2014)

49
The literature highlights transportation, along with density, as being the cornerstone policy
areas of Smart Growth and that transportation investments heavily influence development
patterns (Cervero, 2001; Ingram et al., 2009). Ingram et al. (2009) conclude that the
transportation land-use connection is important to the Smart Growth movement in two ways.
Firstly, advocates often oversimplify the connection, assuming that greater densities, the mixing
of uses and multimodal options will produce gains in non-automobile travel. Second, even the
most successful Smart Growth initiatives are likely to have limited impacts on transportation
outcomes. Studies have shown that preferences influence travel more than land-use plans and
urban design interventions. Cervero (2001) argues that land-use plans are a “second best”
solution to address congestion and transportation problems. The overall implications of these
findings are that Smart Growth goals related to transportation must be part of a broader
strategy that addresses the market and consumer preferences. The City formally integrates
transportation and land use planning together, however, the following analyses seeks to
understand if Calgary has been able to provide and promote a variety of different transit
options in the city.
Commuters by Transit from 1996-2013
Calgary Transit ridership is steadily trending upwards and, in 2013, the city experienced the
highest ridership to date. In 2013, 167 million transit trips were completed through a
combination of bus and LRT use. Figure 9: Calgary (Bus+LRT) Transit Ridership from 1996-2013
reflects total bus and LRT transit trips from 1996-2013 while the trend line reflects total trips.
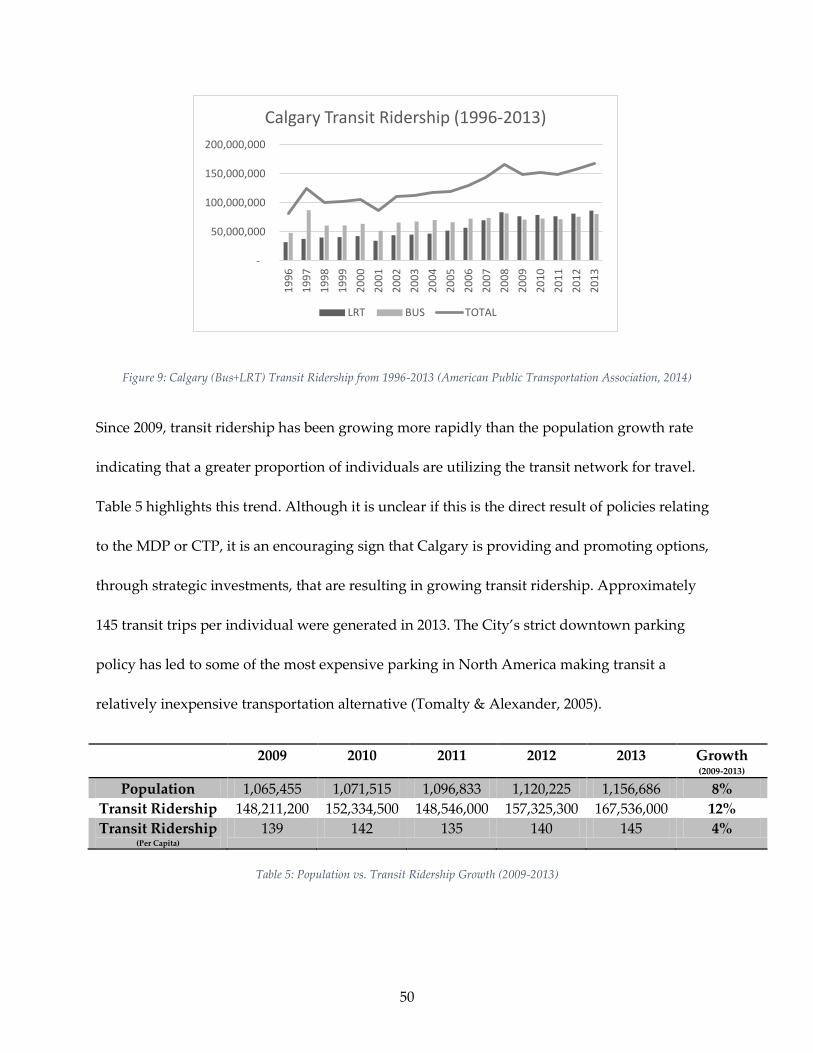
50
Figure 9: Calgary (Bus+LRT) Transit Ridership from 1996-2013 (American Public Transportation Association, 2014)
Since 2009, transit ridership has been growing more rapidly than the population growth rate
indicating that a greater proportion of individuals are utilizing the transit network for travel.
Table 5 highlights this trend. Although it is unclear if this is the direct result of policies relating
to the MDP or CTP, it is an encouraging sign that Calgary is providing and promoting options,
through strategic investments, that are resulting in growing transit ridership. Approximately
145 transit trips per individual were generated in 2013. The City’s strict downtown parking
policy has led to some of the most expensive parking in North America making transit a
relatively inexpensive transportation alternative (Tomalty & Alexander, 2005).
2009 2010 2011 2012 2013 Growth (2009-2013)
Population 1,065,455 1,071,515 1,096,833 1,120,225 1,156,686 8%
Transit Ridership 148,211,200 152,334,500 148,546,000 157,325,300 167,536,000 12%
Transit Ridership (Per Capita)
139 142 135 140 145 4%
Table 5: Population vs. Transit Ridership Growth (2009-2013)
-
50,000,000
100,000,000
150,000,000
200,000,000
19
96
19
97
19
98
19
99
20
00
20
01
20
02
20
03
20
04
20
05
20
06
20
07
20
08
20
09
20
10
20
11
20
12
20
13
Calgary Transit Ridership (1996-2013)
LRT BUS TOTAL

51
Mode share
One of the overarching goals of Smart Growth is to decrease the reliance on
the automobile and encourage more sustainable forms of transportation
such as walking, cycling, and transit. While the road network is a vital piece
of infrastructure within an integrated transportation network, the MDP
moves to lessen the city’s dependence on the private automobile. As
demonstrated in the last discussion, transit-use is increasing in the city;
however, as shown in Figure 10, roads are still the dominant transportation
network using private automobiles as the mode. In fact, car-dependency
grew in relation to other modes of transportation in Calgary from 2005-2011.
Mode share based on surveys conducted by the City of Calgary highlight
the increase while data retrieved from Statistics Canada confirm the city’s
findings. The numbers are based on all purpose city wide trips and reflect a
troubling realization that Calgary has been unable to move away from the city’s dependence on
the automobile. The data highlights the challenge faced by the city in order to achieve the goal
of the MDP which intends to reduce auto trips as a share of all transportation trips to 60% by
2076. One promising statistic is that auto trips significantly decrease when density increases.
This is reflected by reduced auto trips in the City Centre, Activity Centre, and Inner City
typologies. In the City Centre, active transportation and transit make up 65% of all trips (The
City of Calgary: Geodemographics, 2014). Overall, city-wide mode share is an indicator that
signifies a hesitance from Calgarians to move away from auto dependency.
Figure 10: Mode Share in
Calgary, 2005 and 2011 (City of
Calgary, 2014)

52
Key Takeaways
Significantly high transit ridership per capita that is increasing faster than the
population growth rate
The automobile is the dominant mode of transportation, slightly increasing its relative
share from 2006-2011
Areas of higher density are experiencing less automobile reliance (e.g. City Centre and
Beltline neighbourhoods)
Jobs in the industrial employment areas lack access to primary transit networks.
Supply of Affordable Housing
This section examines affordable housing trends in Calgary leveraging Statistics Canada census
data and secondary research conducted by Tomalty, Alexander and Haider (Tomalty &
Alexander, 2005; Tomalty & Haider, 2008). Section 2.3 of the Calgary MDP, “Creating Great
Communities” (2009), identifies a need to provide a variety of housing option in a manner that
creates an opportunity for more affordable options. The City, while not directly responsible for
the majority of housing provided in the city, has an opportunity to shape delivery through the
application of good planning policy and zoning that complements the market. Tomalty and
Alexander state that “local government has an important role to play through its influence over
urban form, planning and engineering standards, parking requirements, municipal charges and
taxes, the liquidation of public lands, property taxes, the project approval process, and handling
citizen opposition to affordable housing through public consultation” (2005, p. 213).
Smart Growth policy, like any other municipal policy affecting land use, has the ability to
influence affordable housing. For many years, as Tomalty and Haider (2008) state, a “key

53
method used in Calgary to ensure housing price stability has been the periodic annexation of
lands from surrounding jurisdictions (the UniCity concept) and the orderly expansion of
suburban areas. The resulting development patterns, however, have also begun to raise
concerns.” As mentioned in section 2, the sprawling development pattern is beginning to
escalate both municipal capital and operating costs. A key argument regarding the benefits of
sprawl is that it provides affordable housing options and a common argument against smart
growth is that by limiting the supply of greenfield land, through growth management policy,
the housing supply is reduced, therefore housing prices increase. Nelson (2002) found that this
view is far too simplistic and that many factors contribute to housing prices, specifically market
demand which is a function of population growth. The results are echoed in Calgary, based on
Tomalty and Haider’s (2008) analysis on the connection between Smart Growth and housing
affordability in Calgary, who found that supply side variables are limited determinants of
house prices. Their research, informed by the literature, indicates that municipal policy has a
minimal effect on housing affordability in which they argue:
“Cities that attempt to moderate outward growth may put a gentle upward pressure on
the market value of land and homes, but it is the increased desirability (the so called
“amenity value”) of cities with effective growth management processes that is pre-
eminent in influencing prices. The most promising approach to affordability and growth
management issues is to integrate housing affordability policies into a Smart Growth
framework and promote intensification of established areas, less expensive housing
forms and development control regulations and processes that reduce development

54
costs and encourage a greater supply of moderately priced housing units” (Tomalty &
Haider, 2008, p. 49).
Another important piece to consider when analysing affordable housing is the federal
government’s reduced role in the provision of affordable housing since 1993 and that the
majority of individuals secure housing through the private market (Hulchanski, 2007). Tomalty
and Alexander (2005, p. 65) note that “there has been little addition to the subsidized housing
stock since 1993, when the Provincial and Federal governments substantially reduced the
capital funding of affordable housing.” The following analysis considers this while presenting
indicators to illustrate housing trends in Calgary.
Housing Cost and Income Trends
Housing values in Calgary have increased significantly in the period between 1991 and 2011.
Table 6: Median Value of Dwelling Relative to Income Growth (1991-2011) displays that the
median value of a dwelling in the city has increased by 177% from $144,477 in 1991 to $400,697
in 2011. During the same period, median income for individuals and households increased by
75% and 95% respectively. Housing values have risen faster than income levels in the city
indicating that housing may have become less affordable over the stated period of time.
1991 2011 Change (%)
Median Value of Dwelling ($) $144,477 $400,697 177%
Median Individual Income ($) $ 21,582.00 $ 37,697.00 75%
Median Household Income $ 50,249.00 $ 97,790.00 95%
Table 6: Median Value of Dwelling Relative to Income Growth (1991-2011)
55
Cost Burdened Households
Cost burdened, also known as those in core housing need, is defined as those households that
contribute more than 30% of their income to shelter (CMHC, 2014). Using this indicator, it is
clear that housing affordability for both renters and owners is declining. Figure 11 highlights
that the percentage of cost burdened households have increased over the period from 1991 to
2011. Although still increasing significantly, the percentage of cost burdened home owners
shifted upwards at a steadier pace. The affordability issue is strikingly different for renters. The
percentage of cost burdened renters from 1991 to 2011 increased by 177%. This happened twice
in a 20 year period, notably when the Calgary economy was doing well and large population
increases occurred. Tomalty and Alexander offer an explanation for the rental affordability
problem after finding similar results in 2005. They state that the rental affordability problem is
“due largely to the failure of the private market to deliver new rental stock, the demolition of
existing rental stock or conversion to condos, a buoyant economy that has bolstered in-
migration causing a higher demand for rental housing, and Alberta’s low minimum wage and
social assistance rates” (2008, p. 65). Although the minimum wage has increased since then,
similar affordability problems remain.

56
1991 1996 2001 2006 2011 Change 1991-2011
Cost Burdened Renters (%) 13.9% 38.0% 36.5% 12.4% 38.0% 93%
Cost Burdened Owners (%) 10.5% 16.9% 17.2% 16.3% 20.3% 177%
Figure 11: Cost Burdened Households from 1991-2011 (Statistics Canada, 2014)
These indicators point to housing affordability as a pressing issue in Calgary. The proliferation
of cost burdened households is troubling because the data suggests that a greater proportion of
households are spending more than 30% of their income on housing than ever before. It is
important to highlight that this may be a national trend. In 2011, about 25% of all households in
Canada spent more than 30% on housing (Statistics Canada, 2011) highlight a macro level
problem; nonetheless, civic policy should not intensify the issue.
13.9%
38.0% 36.5%
12.4%
38.0%
10.5%
16.9% 17.2% 16.3%
20.3%
0.0%
5.0%
10.0%
15.0%
20.0%
25.0%
30.0%
35.0%
40.0%
1991 1996 2001 2006 2011
Pe
rce
nta
ge o
f C
ost
Bu
rde
ne
d H
om
es
Year
Cost Burdened Renters (%)
Cost Burdened Owners (%)
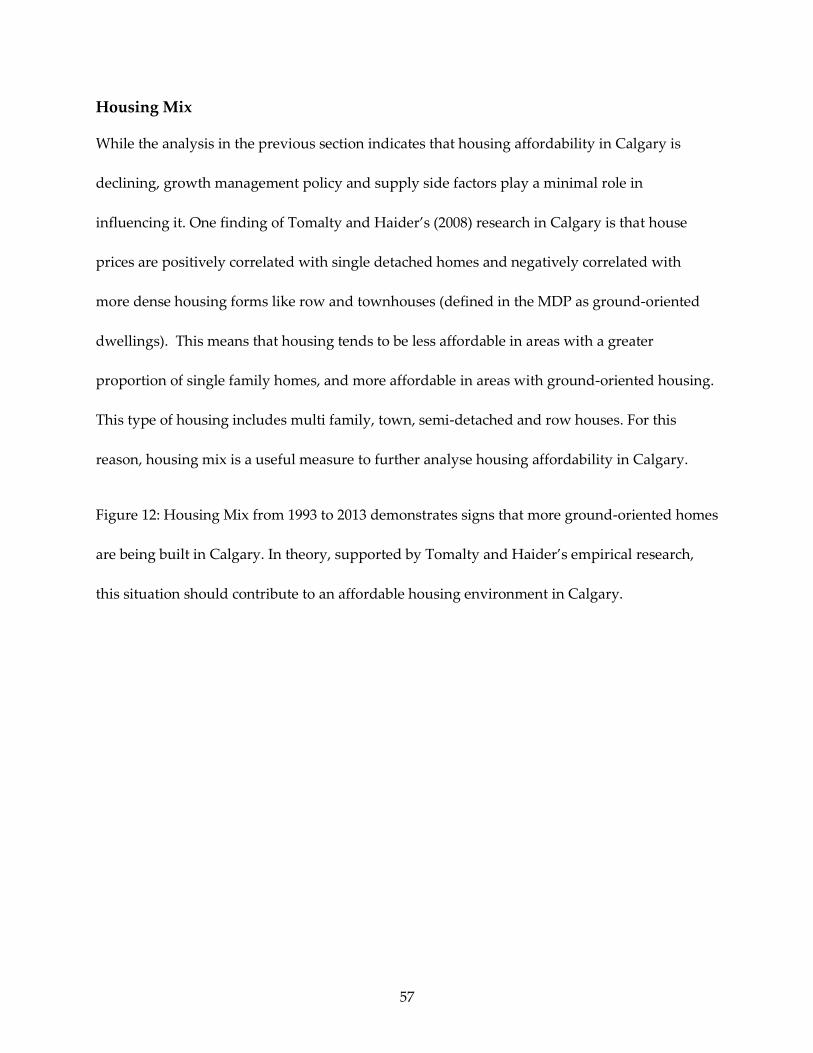
57
Housing Mix
While the analysis in the previous section indicates that housing affordability in Calgary is
declining, growth management policy and supply side factors play a minimal role in
influencing it. One finding of Tomalty and Haider’s (2008) research in Calgary is that house
prices are positively correlated with single detached homes and negatively correlated with
more dense housing forms like row and townhouses (defined in the MDP as ground-oriented
dwellings). This means that housing tends to be less affordable in areas with a greater
proportion of single family homes, and more affordable in areas with ground-oriented housing.
This type of housing includes multi family, town, semi-detached and row houses. For this
reason, housing mix is a useful measure to further analyse housing affordability in Calgary.
Figure 12: Housing Mix from 1993 to 2013 demonstrates signs that more ground-oriented homes
are being built in Calgary. In theory, supported by Tomalty and Haider’s empirical research,
this situation should contribute to an affordable housing environment in Calgary.
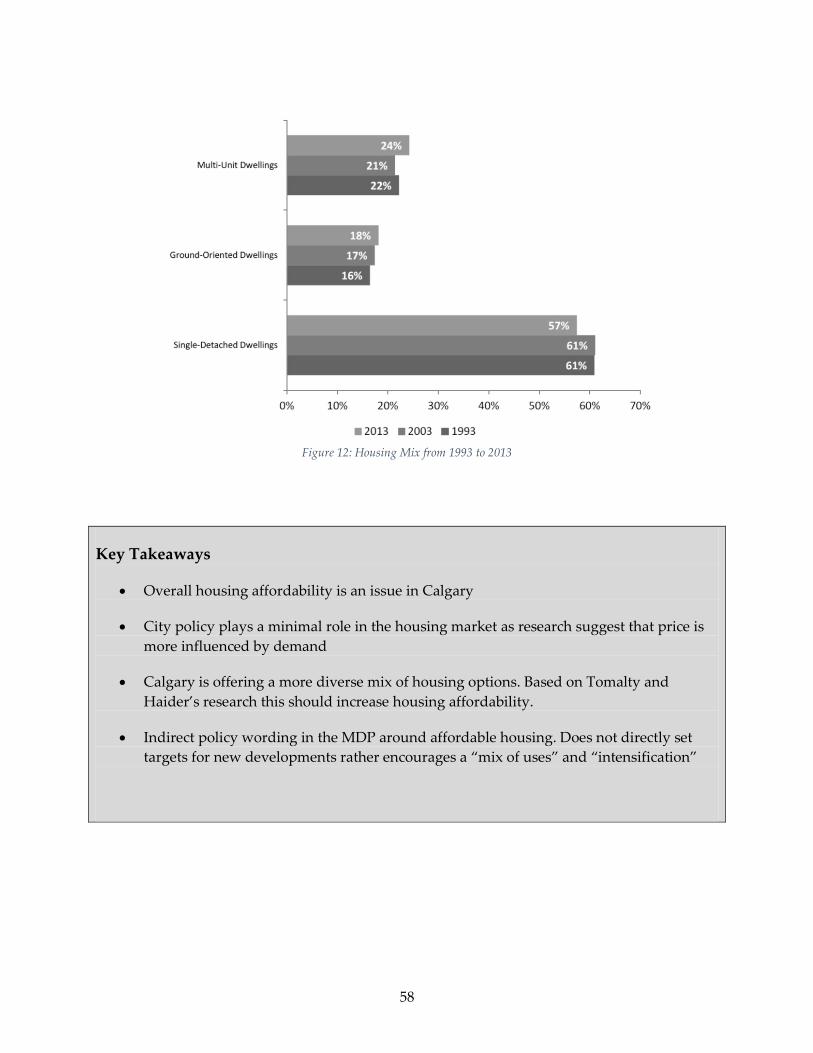
58
Figure 12: Housing Mix from 1993 to 2013
Key Takeaways
Overall housing affordability is an issue in Calgary
City policy plays a minimal role in the housing market as research suggest that price is
more influenced by demand
Calgary is offering a more diverse mix of housing options. Based on Tomalty and
Haider’s research this should increase housing affordability.
Indirect policy wording in the MDP around affordable housing. Does not directly set
targets for new developments rather encourages a “mix of uses” and “intensification”

59
5. Final Discussion and Recommendations
Overall, the literature reviews and Smart Growth analysis indicate that Calgary is struggling to
meet second two of the following three goals of Smart Growth analyzed in this study:
1) Promoting Compact Development - Building where infrastructure and development
already exist by increasing density.
2) Providing and Promoting a Variety of Transportation Options - connecting land uses
with transportation alternatives to the car.
3) Supply Affordable Housing – enhancing affordability and increasing options.
A fourth overarching challenge relating to the effectiveness of regional governance structures
became increasingly apparent in the research. The challenges highlighted in this study are
typical, given research conducted by Downs (2005) on the barriers to implementing Smart
Growth. His work will be used to frame parts of the following discussion.
Table 7 summarizes the key findings from the literature reviews and analysis. Trends have been
categorized based on the corresponding element of Smart Growth and branded as being either
positive or negative. Overarching trends emerged throughout the study, specifically the
literature reviews, and could not be categorized into one of the key elements analyzed.
Recommendations are provided following a discussion of each section.
60
Overarching Issue – Regional Planning
Issues around regional planning became apparent in the study. A lack of support from the
Provincial Government became evident and the decline of Calgary’s regional proportion of the
population are concerning. Regarding these challenges, one hypothesis is that Calgary and the
satellite municipalities are struggling to collaborate on regional planning issues. Further
research is required to substantiate this claim; however, I suspect that MDPs are not aligned
while each municipality focuses on its corresponding goals in a silo. This is a key issue that
needs to be understood because it has the overarching potential to undermine Calgary’s Smart
Growth goals.
Downs highlights this as a major challenge for municipalities striving to implement Smart
Growth policy. He argues that “several key Smart Growth principles require government action
at a regional level, not at the local level where most powers over land use planning now reside”
(Downs, 2007, p. 369).
Therefore, I recommend that the City of Calgary, while continuing to collaborate with satellite
communities in an effort to align goals, lobby the Provincial Government to ensure that a
regional planning strategy is in place for the Calgary Metropolitan Region by 2019. The strategy
can be developed through the use of legislation or incentives but should meet this timeframe in
order to inform the City of Calgary’s MDP review.

61
Element of Smart Growth Positive Negative Overarching Some indications that the Province is
moving to become more involved in
regional planning
Long history of sprawl engrained within
the cultural mindset of Calgary’s
citizens, developers, and Council
members
Lack of regional guidance stemming
from 1995 abolishment of formalized
RPCs
Excessive growth in suburban
communities such as Airdrie, Cochrane,
and Chestermere have the potential to
undermine Smart Growth initiatives in
Calgary
Lack of regional planning authority to
encourage and direct Smart Growth in
the Calgary Metropolitan Region
Promoting Compact Development
Calgary is densifying. Trends indicate
that density is increasing city-wide,
specifically in new suburban areas
The ability to meet goals regarding a
more compact urban form could be a
result of strong policy wording in the
MDP
New projects such as Currie Barracks
and the East Village demonstrate
encouraging signs that the city could
accommodate significant population
increase within the built up area
Since 2012, a greater share of the overall
population increase has been distributed
within the developed area.
City-wide population density levels well
below 1950 numbers
Job density is highly concentrated in the
core – need to leverage this by
continuing to increase the supply of
housing near the core.
Providing a Variety of
Transportation Options
Significantly high transit ridership per
capita that is increasing faster than the
population growth rate
Areas of higher density are experiencing
less automobile reliance (e.g. City Centre
and Beltline neighbourhoods)
The automobile is the dominant mode of
transportation, slightly increasing its
relative share from 2006-2011
Jobs in the industrial employment areas
lack access to primary transit networks.
Supply Affordable Housing Calgary is offering a more diverse mix of
housing options which, supported by
research, could enhance affordability
Overall housing affordability is an issue
in Calgary
Indirect policy wording in the MDP
around affordable housing. Does not
directly set targets for new
developments rather encourages a “mix
of uses” and “intensification”
City policy plays a minimal role in the
housing market
Table 7: Summary of Key Findings

62
Promoting Compact Development
The analysis indicates that Calgary is progressing towards the goal of promoting a more
compact form of development. Population and employment density appear to be increasing in
Calgary. As one of the primary goals of Smart Growth, this is a very good sign. A reason for
this, I would argue, is that the MDP policies containing density goals have strong wording such
as “must” and “will.” These policies mandate Local Area Plans to demonstrate an ability to
meet higher density standards. Recent data in the analysis suggests that the City could
potentially reach its targeted residential density within the next few years and is also well
positioned to meet employment density targets within a shorter time period. The City needs to
focus on accommodating population increases within the built up area in order to meet the
targeted 50/50 split by 2076. Larger intensification projects highlight the potential for this to
occur although established communities, not currently serviced by major transit routes, will
face intensification challenges.
Down’s (2007) argues that municipalities need to understand the Smart Growth – urban sprawl
paradox. He states that citizens will oppose urban sprawl in the abstract but oppose density
increases that are planned near their homes. Because of this, increasing residential population
density is seen as a critical problem for carrying out the goals of Smart Growth. While Calgary
has recently performed well in increasing density, specifically in greenfield areas, a continuing
effort is needed. Therefore I recommend amending the MDP in two ways:
a. Adjust the target under Core Indicator #2 to reflect a higher density for people
and jobs per hectare.

63
b. Adjust Section 2.2 of the “New Community Planning Guidebook” to reflect
higher densities in Greenfield areas.
Pending approval, these policy amendments will further signify to the public and industry that
increasing density is important to the City of Calgary. The majority of Calgary’s growth is
expected to occur in the suburbs; therefore, establishing high densities in greenfield
developments can mitigate Downs’ Smart Growth-urban sprawl paradox by reducing the need
for intensification in the future. Establishing a stable balance of growth between the developing
and developed areas can also reduce unnecessary outward expansion. Increasing intensification
within the city will give Calgary an opportunity to provide higher order transit.
Providing a Variety of Transportation Options
The analysis indicates that Calgary is struggling towards meeting its goal of providing more
transportation options for citizens. Calgary is essentially an automobile city which creates
significant challenges for progressing towards Smart Growth goals as whole because it is
identified as one of the primary goals. Transit ridership is strong given the city’s centralized
core which contains a significant number of employment opportunities. This is enhanced by
The City’s stringent stance on parking provision within the core (Tomalty & Alexander, 2005).
Further research is required in order to understand how the city can move away from the
automobile. Based on the analysis contained within this report, I would argue that mode share
is a function of density and that increases will enhance the shift towards alternative
transportation modes. One such policy would be increasing density in transit station planning
areas. Currently, these areas are planned to reflect a minimum density of 100 people and jobs
per hectare reflecting a balance medium density threshold. This could be adjusted to
64
accommodate a high density threshold of 200 people and jobs per hectare, therefore I
recommend amending Section 2.9.3a of the New Community Planning Guidebook within the
MDP to read “Developments in each TPSA shall achieve a minimum intensity of 200 people and
jobs per gross developable hectare.” Overcoming automobile dependency will be challenging
and a more comprehensive strategy will need to be developed that integrates both the regional
and local levels.
Supply Affordable Housing
The analysis indicates that Calgary is struggling towards the goal of providing an affordable
supply of housing. Calgary does appear to be encouraging an appropriate level of mix to
improve housing affordability, however; the literature identifies housing affordability as being
a macro level issue which includes a variety of price determinants that are not directly related to
local policy. Nonetheless, local policies should support affordable options. Relating to housing,
loose policy language in the MDP highlights some room for improvement. The MDP is full of
terms such as “encourage,” “recognize” and “promote,” in seeking new and innovative housing
types. An innovative option is to approve strategies such as density bonuses, laneway housing
and secondary suites. Such approaches create the potential for intensification in established
neighbourhoods. While demonstrating support from some Members of Council, including the
Mayor, secondary suites have failed to be approved in any significant form indicating that the
entire city is not willing to support the option. Based on the analysis contained within this
paper, there is room to improve planning policy related to affordable housing. Therefore I

65
recommend that The City explore the potential for adopting policy that mandates a certain
percentage of new developments to contain affordable housing units.

66
6. Conclusion
Urbanization will continue, suburban growth will occur, and the automobile will linger as a
major form of transportation in the foreseeable future. The literature demonstrates that urban
sprawl is costly problem; one that has shaped Calgary’s urban form since the post-war period.
Thus far Calgary cannot be considered a Smart Growth success story as many challenges
remain. The city, however, will be an interesting case study going forward. The Smart Growth
movement and its associated principles are playing a role in shifting Calgary’s urban growth
trajectory. Portions of the analysis in this report present encouraging signs that the next 50 years
of growth may in fact be different. The city is becoming denser, transit ridership is increasing,
and a greater mix of housing is being offered. I have recommended policy changes for Calgary’s
Municipal Development Plan; however, as the overall region continues to grow, a provincial
role may become increasingly vital. Given the costs of sprawl, Smart Growth options will likely
be pursued by an increasing number of municipalities. What remains unclear is exactly how
long it will take and which stakeholders will lead the charge.
67
7. References
Alberta Government. (2014). South Saskatchewan Regional Plan. Edmonton: Alberta Government:
Environment and Sustainable Resource Development.
Alberta Government. (2015). Municipal Government Act Review: Emerging Themes: A Summary of
Municipal Partner and Stakeholder Considerations. Edmonton: Alberta Government.
American Public Transportation Association. (2014). Ridership Report Archives 1996-2014.
Washington: American Public Transportation Association.
Blais, P. (2010). Perverse Cities. Vancouver: UBC Press.
Brookings Institute. (2014). Global Metro Monitor. Retrieved from Brookings:
http://www.brookings.edu/research/reports2/2015/01/22-global-metro-monitor
Brueckner, J. (2000). Urban Sprawl: Diagnosis and Remedies. Urbana–Champaign: International
Regional Science Review.
Bullard, R. (2007). Growing Smarter: Achieving Livable Communities, Environmental Justice, and
Regional Equity. Cambridge: MIT Press.
Burchell, R. (2002). Costs of Sprawl. Washington: National Academy Press.
Burchell, R. W., Downs, A., McCann, B., & Mukherji, S. (2005). Sprawl Costs: Economic Impacts of
Unchecked Development. Washington: Island Press.
Burchell, R., Listoken, D., & Galley, C. (2000). Smart Growth: More Than a Ghost of Urban
Policy Past, Less Than a Bold New Horizon. Housing Policy Debate, 821-879.
Calgary Regional Partnership. (2014). Calgary Metropolitan Plan. Calgary: Calgary Regional
Partnership .
Campbell, S. (1996). Green Cities, Growing Cities, Just Cities? Journal of the American Planning
Association, 296-309.
Cervero, R. (2001). Efficient Urbanisation: Economic Performance and the Shape of the
Metropolis. Urban Studies, 1651-1671.
Chapin, T. (2012). From Growth Controls, to Comprehensive Planning, to Smart Growth:
Planning’s Emerging Fourth Wave. Journal of the American Planning Association, 5-15.
City of Calgary. (2007). imagineCALGARY Plan: For Long Range Urban Sustainabilty. Calgary: City
of Calgary.
City of Calgary. (2009). Municipal Development Plan. Calgary: City of Calgary .

68
City of Calgary. (2013). Route Ahead: A Strategic Plan for Transit in Calgary. Calgary: The City of
Calgary.
City of Calgary: Geodemographics. (2014). Developed Areas Growth and Change 2014. Calgary:
The City of Calgary.
CMHC. (2014). Housing in Canada: Definition of Variables. Retrieved from Canada Mortgage and
Housing Corporation:
http://cmhc.beyond2020.com/HiCODefinitions_EN.html#_Core_Housing_Need_Status
Cox, W. (2007). The Argument Against Smart Growth. Planetizen Contemporary Debates on Urban
Planning, pp. 10-17.
Degrove, J. (2005). Planning Policy and Politics: Smart Growth and the States. Washington: Lincoln
Institute of Land Policy.
Dierwechter, Y. (2008). Growth Management and its Discontents: Promises, Practices, and Geopolitics
in U.S. City-Regions. New York: Palgrave Macmillan.
Downs, A. (2007). Smart Growth: Why We Discuss It More than We Do It. Journal of the
American Planning Association, 367-378.
Flint, A. (2007). A Tipping Point - But Now the Hard Part. Planetizen Contemporary Debates on
Urban Planning, pp. 6-9.
Foran, M. (2009). Expansive Discourses: Urban Sprawl in Calgary, 1945-1978. Calgary: Athabasca
University Press.
Frumkin, H. (2002). Urban Sprawl and Public Health. Public Health Reports, 202-217.
Galster, G. (2001). Wrestling Sprawl to the Ground: Defining and Measuring an Elusive
Concept. Housing Policy Debate, 681-717.
Ghitter, G. (2008). Mad Cows, Regional Governance, and Urban Sprawl. Urban Affairs Review, 1-
28.
Goetz, A. (2013). Suburban Sprawl or Urban Centres: Tensions and Contradictions of Smart
Growth Approaches in Denver, Colorado. Urban Studies, 2178-2195.
Gordon, D., & Janzen, M. (2013). Suburban Nation? Estimating the Size of Canada's Suburban
Population. Journal of Architectural and Planning Research, 197-219.
Gordon, D., & Vandyk, C. (2006). Suburban National Capital: A Pilot Study of Canada's Post 1945
Suburbs in Ottawa-Hull. Kingston: Queens University .
Hulchanski, D. (2007). What Factors Shape Canadian Housing Policy? The Intergovernmental Role in
Canada's Housing System. Montreal: McGill-Queen's University Press.

69
Ingram, G. K., Carbonell, A., Hong, Y.-H., & Flint, A. (2009). Smart Growth Policies. Cambridge,
MA: Lincoln Institute of Land Policy.
Lewis, P. G., & Baldassare, M. (2010). The Complexity of Public Attitudes Towards Compact
Development . Journal of the American Planning Association, 219-237.
Nelson, A. C., & Dawkins, J. C. (2004). Urban Containment in the United States: History, Models,
and Techniques for Regional and Metropolitan Growth Management. Washington: American
Planning Association.
Nelson, A. C., & Peterman, D. R. (2000). Does Growth Management Matter? The Effect of
Growth Management on Economic Performance. Journal of Planning Education and
Research, 277-285.
Nelson, A. C., Pendall, R., Dawkins, C. J., & Knaap, G. J. (2002). The Link Between Growth
Management and Housing Affordability: The Academic Evidence. Washington: The Brookings
Institute.
Neuman, L. (2006). Social Research Methods: Qualitative and Quantitative Approaches. Boston:
Pearson Education Inc.
Neuman, M. (2005). The Compact City Fallacy. Journal of Planning Education and Research, 11-26.
Ontario Ministry of Municipal Affairs and Housing. (2006). Growth Plan for the Greater Golden
Horseshoe. Toronto: Government of Ontario.
Pembina Institute. (2014). Fast Cities: A comparison of rapid transit in major Canadian cities. Ottawa:
Pembina Institute.
Pembina Institute. (2015). Location Matters: Factoring location costs into homebuying decisions.
Toronto: Pembina Institute and RBC.
Statistics Canada. (1961). CHASS: Canadian Census Analyser. Retrieved from Canadian 1961
Census Profile (Census Tract level):
http://dc1.chass.utoronto.ca.ezproxy.lib.ryerson.ca/census/1971_ct.html
Statistics Canada. (1971). CHASS: Canadian Census Analyser. Retrieved from Canadian 1971
Census Profile (Census Tract level):
http://dc1.chass.utoronto.ca.ezproxy.lib.ryerson.ca/census/1971_ct.html
Statistics Canada. (1981). CHASS: Canadian Census Analyser. Retrieved from Census Subdivision:
Calgary: http://dc1.chass.utoronto.ca.ezproxy.lib.ryerson.ca/cgi-
bin/census/1981/displayCensusCSD.cgi
Statistics Canada. (1991). CHASS: Canadian Census Analyser. Retrieved from Census Subdivision:
Calgary: http://dc1.chass.utoronto.ca.ezproxy.lib.ryerson.ca/cgi-
bin/census/1991/displayCensusCSD.cgi

70
Statistics Canada. (1996). CHASS: Canadian Census Analyser. Retrieved from Census
Subdivisions: Calgary: http://dc1.chass.utoronto.ca.ezproxy.lib.ryerson.ca/cgi-
bin/census/1996/displayCensusCSD.cgi
Statistics Canada. (2001). CHASS: Canadian Census Analyser. Retrieved from Census Subdivision:
Calgary: http://dc1.chass.utoronto.ca.ezproxy.lib.ryerson.ca/cgi-
bin/census/2001/displayCensusCSD.cgi
Statistics Canada. (2006). CHASS: Canadian Census Analyser . Retrieved from Census
Subdivision: Calgary: http://dc1.chass.utoronto.ca.ezproxy.lib.ryerson.ca/cgi-
bin/census/2006/displayCensusCSD.cgi
Statistics Canada. (2011). CHASS: 2011 National Household Survey (NHS). Retrieved from Census
Subdivision: Calgary: http://dc1.chass.utoronto.ca.ezproxy.lib.ryerson.ca/cgi-
bin/census/2011nhs/displayCensus.cgi?year=2011&geo=csd
Statistics Canada. (2011). CHASS: Canadian Census Analyser. Retrieved from Census Subdivision:
Calgary: http://dc1.chass.utoronto.ca.ezproxy.lib.ryerson.ca/cgi-
bin/census/2011/displayCensus.cgi?year=2011&geo=csd
Statistics Canada. (2011). Homeownership and Shelter Costs in Canada: National Household Survey,
2011. Ottawa: Statistics Canada.
Statistics Canada. (2015, 01 12). Population and Dwelling Counts. Retrieved from Statistics
Canada: http://www12.statcan.gc.ca/census-recensement/2011/dp-pd/hlt-fst/pd-pl/Table-
Tableau.cfm?T=301&S=3&O=D
Taylor, Z., Burchfield, M., & Kramer, A. (2014). Alberta Cities At the Crossroads: Urban
Development Challenges and Opportunities in Historical and Comparative Perspective.
Calgary: University of Calgary - School of Public Policy.
The City of Calgary. (2009). Municipal Development Plan . Calgary: The City of Calgary.
The City of Calgary: Geodemographics. (2014). Calgary Snapshots 2014. Calgary: City of Calgary.
Thompson, D. (2013). Suburban Sprawl: Exposing Hidden Costs, Identifying Innovations. Ottawa:
Sustainable Prosperity .
Tomalty, R., & Alexander, D. (2005). Smart Growth in Canada: Implementation of a Planning
Concept. Ottawa: CMHC.
Tomalty, R., & Curran, D. (2003). Living it up: the wide range of support for smart growth in
Canada promises more livable towns and cities. Alternatives Journal, 10-18.
Tomalty, R., & Haider, M. (2008). Housing Affordability and Smart Growth in Calgary. Calgary: The
City of Calgary.

71
Tomalty, R., & Haider, M. (2012). The 2012 Smart Growth Report: Progress Towards Smart Growth
in Canada. Ottawa: CMHC.
United Nations. (1987). Report of the World Commission on Environment and Development: "Our
Common Future.". United Nations.
United States Environmental Protection Agency. (2015). Smart Growth Principles. Retrieved from
Smart Growth: http://www.epa.gov/smartgrowth/about_sg.htm