spreadsheet conditional formatting: an untapped resource for
TRANSCRIPT

Spreadsheets in Education (eJSiE)
Volume 1 | Issue 2 Article 3
10-5-2005
Spreadsheet Conditional Formatting: AnUntapped Resource for Mathematics EducationSergei AbramovichState University of New York at Potsdam
Stephen SugdenBond University
This Regular Article is brought to you by the Faculty of Business at ePublications@bond. It has been accepted for inclusion in Spreadsheets inEducation (eJSiE) by an authorized administrator of ePublications@bond. For more information, please contact Bond University's RepositoryCoordinator.
Recommended CitationAbramovich, Sergei and Sugden, Stephen (2004) "Spreadsheet Conditional Formatting: An Untapped Resource for MathematicsEducation," Spreadsheets in Education (eJSiE): Vol. 1: Iss. 2, Article 3.Available at: http://epublications.bond.edu.au/ejsie/vol1/iss2/3

Spreadsheet Conditional Formatting: An Untapped Resource forMathematics Education
AbstractElectronic spreadsheets have been with us for almost 25 years. In that period, innovative educators have foundmany ways in which this ubiquitous class of software may be leveraged in support of learning, especially inmathematics and the physical sciences. Conditional formatting is a relatively recent feature of the moderngraphical spreadsheet, and may be viewed as a generalization of the accounting procedure of indicating debitsby red ink and other amounts in black. The paper discusses advances in technology-enabled pedagogy madepossible by this seemingly trivial feature of the modern spreadsheet program.
Keywordsspreadsheet, conditional formatting, mathematics education
This regular article is available in Spreadsheets in Education (eJSiE): http://epublications.bond.edu.au/ejsie/vol1/iss2/3

Spreadsheet Conditional Formatting: An UntappedResource for Mathematics Education
Sergei AbramovichState University of New York at Potsdam, USA
Stephen J SugdenSchool of Information Technology, Bond University
October 5, 2005
Abstract
Electronic spreadsheets have been with us for almost 25 years. In that period,innovative educators have found many ways in which this ubiquitous class of soft-ware may be leveraged in support of learning, especially in mathematics and thephysical sciences. Conditional formatting is a relatively recent feature of the mod-ern graphical spreadsheet, and may be viewed as a generalization of the accountingprocedure of indicating debits by red ink and other amounts in black. The paperdiscusses advances in technology-enabled pedagogy made possible by this seeminglytrivial feature of the modern spreadsheet program.
Communicated by J. Baker.Submitted October 2003; revised January 2004; accepted January 2004.
Keywords: spreadsheet, conditional formatting, mathematics education.
1 Introduction
The modern spreadsheet program, as exemplified by Microsoft Excel XP, has a vastarray of features which may be used to illustrate mathematical principles, facilitatethe discovery of patterns, encourage conjecturing, and, in some cases, generate newknowledge. In this paper, we discuss the conditional formatting feature of MicrosoftExcel. This is a relatively modern spreadsheet capability, first appearing in MicrosoftExcel 97. Conditional formatting may be viewed as a generalization of the commonaccounting practice of rendering negative amounts (payments, debts) in red, while otherquantities are shown in conventional black. In everyday colloquial English, we hear theexpressions “in the red” and “in the black”, which describe the state of being in debtand not in debt respectively. Excel 97 and its successors allow automatic formatting
eJSiE 1(2):104-124 c°2003 Bond University. All rights reserved.http://www.sie.bond.edu.au
1
Abramovich and Sugden: Spreadsheet Conditional Formatting
Produced by The Berkeley Electronic Press, 2004
S Abramovich and S J Sugden
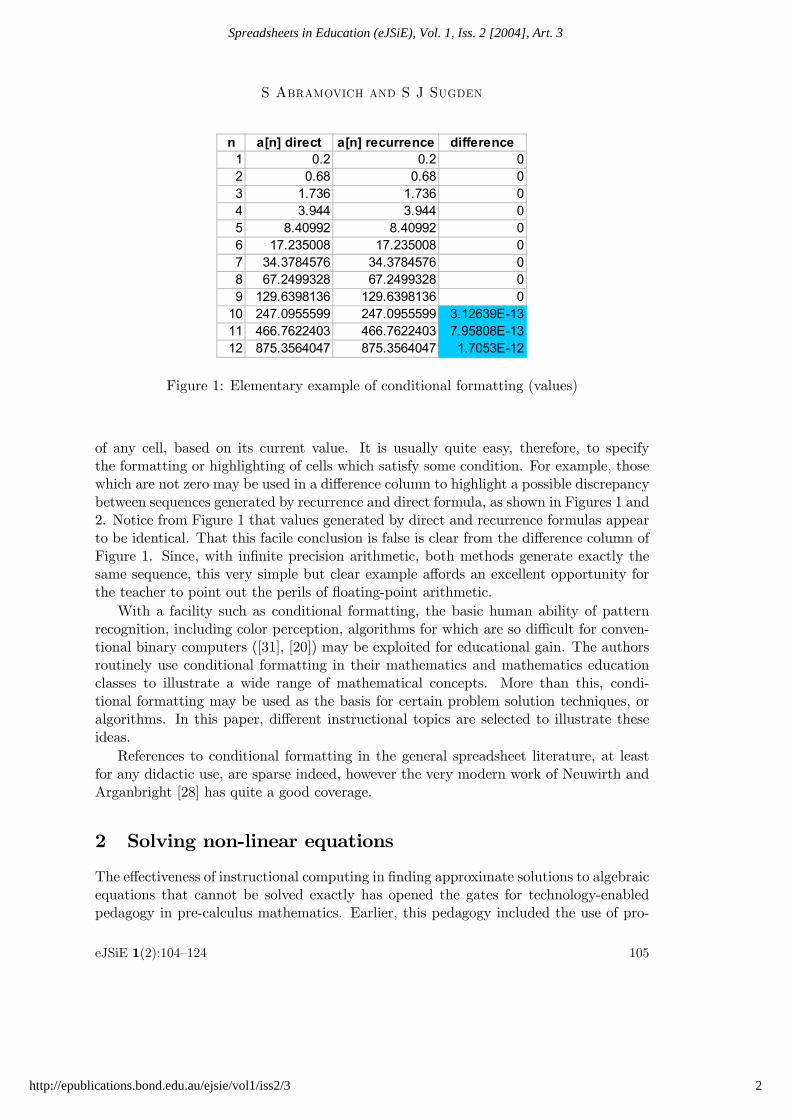
n a[n] direct a[n] recurrence difference1 0.2 0.2 02 0.68 0.68 03 1.736 1.736 04 3.944 3.944 05 8.40992 8.40992 06 17.235008 17.235008 07 34.3784576 34.3784576 08 67.2499328 67.2499328 09 129.6398136 129.6398136 0
10 247.0955599 247.0955599 3.12639E-1311 466.7622403 466.7622403 7.95808E-1312 875.3564047 875.3564047 1.7053E-12
Figure 1: Elementary example of conditional formatting (values)
of any cell, based on its current value. It is usually quite easy, therefore, to specifythe formatting or highlighting of cells which satisfy some condition. For example, thosewhich are not zero may be used in a difference column to highlight a possible discrepancybetween sequences generated by recurrence and direct formula, as shown in Figures 1 and2. Notice from Figure 1 that values generated by direct and recurrence formulas appearto be identical. That this facile conclusion is false is clear from the difference column ofFigure 1. Since, with infinite precision arithmetic, both methods generate exactly thesame sequence, this very simple but clear example affords an excellent opportunity forthe teacher to point out the perils of floating-point arithmetic.
With a facility such as conditional formatting, the basic human ability of patternrecognition, including color perception, algorithms for which are so difficult for conven-tional binary computers ([31], [20]) may be exploited for educational gain. The authorsroutinely use conditional formatting in their mathematics and mathematics educationclasses to illustrate a wide range of mathematical concepts. More than this, condi-tional formatting may be used as the basis for certain problem solution techniques, oralgorithms. In this paper, different instructional topics are selected to illustrate theseideas.
References to conditional formatting in the general spreadsheet literature, at leastfor any didactic use, are sparse indeed, however the very modern work of Neuwirth andArganbright [28] has quite a good coverage.
2 Solving non-linear equations
The effectiveness of instructional computing in finding approximate solutions to algebraicequations that cannot be solved exactly has opened the gates for technology-enabledpedagogy in pre-calculus mathematics. Earlier, this pedagogy included the use of pro-
eJSiE 1(2):104—124 105
2
Spreadsheets in Education (eJSiE), Vol. 1, Iss. 2 [2004], Art. 3
http://epublications.bond.edu.au/ejsie/vol1/iss2/3

Spreadsheet Conditional Formatting
n a[n] direct a[n] recurrence difference1 =1.8 n̂ - 1.6 n̂ =B2 =B2-C22 =1.8 n̂ - 1.6 n̂ =B3 =B3-C33 =1.8 n̂ - 1.6 n̂ =3.4*C3 - 2.88*C2 =B4-C44 =1.8 n̂ - 1.6 n̂ =3.4*C4 - 2.88*C3 =B5-C55 =1.8 n̂ - 1.6 n̂ =3.4*C5 - 2.88*C4 =B6-C66 =1.8 n̂ - 1.6 n̂ =3.4*C6 - 2.88*C5 =B7-C77 =1.8 n̂ - 1.6 n̂ =3.4*C7 - 2.88*C6 =B8-C88 =1.8 n̂ - 1.6 n̂ =3.4*C8 - 2.88*C7 =B9-C99 =1.8 n̂ - 1.6 n̂ =3.4*C9 - 2.88*C8 =B10-C1010 =1.8 n̂ - 1.6 n̂ =3.4*C10 - 2.88*C9 =B11-C1111 =1.8 n̂ - 1.6 n̂ =3.4*C11 - 2.88*C10 =B12-C1212 =1.8 n̂ - 1.6 n̂ =3.4*C12 - 2.88*C11 =B13-C13
Figure 2: Elementary example of conditional formatting (formulas)
gramming languages such as BASIC [12]; later the use of computer applications such asspreadsheets [25], [27], [24], [26] has come to prominence. In particular, Murphy [27], ad-vocating the use of the method of iteration, has singled out “the spreadsheet approach”suggested by Levin & Abramovich [25] as an effective way of solving non-linear equationsin one unknown through the method of iteration.
Another well-known method of solving the equation f(x) = 0 is by inspection ofthe graph of y = f(x). The use of spreadsheet conditional formatting enhances thisapproach to solving non-linear equations in one unknown in a very simple way. As anexample, consider equation 1.
2x − x2 = 0 (1)
One obvious solution of equation 1 is x = 2; another (slightly less obvious) solution isx = 4. Yet there exists a non-trivial solution x ' −0.766 (with an approximation tothree decimal digits) of this equation. With the chart wizard facility in Excel, one mayeasily plot the function f(x) = 2x − x2 over a suitable interval, say −2 ≤ x ≤ 5. Fromthis graph, it becomes clear that there exist at least three solutions; two of them arethe above-mentioned integers 2 and 4. In order to obtain the solution between −1 and0, one can use a graphical zoom-in process. By ensuring that the model in question isconstructed in such a way as to easily change the plot interval, it is a very simple matterto zoom-in by changing a to −1 and b to 0.
Here, conditional formatting enters the picture. One can format the y column sothat negatives, zero, and positive values of y have different colors. Consequently, one caneasily identify a change of sign of the function y = f(x), and then to choose appropriatenew values for a and b, to effect another zoom-in operation. If one uses, say, 100 pointsto plot the function, it only takes a few zoom operations to obtain the solution (whichmay be taken as the mid-point of the current plot interval) to about six decimal digits.
An assignment was set by the second author for students of an elementary course
106 eJSiE 1(2):104—124
3
Abramovich and Sugden: Spreadsheet Conditional Formatting
Produced by The Berkeley Electronic Press, 2004

S Abramovich and S J Sugden
in Visual Basic for Applications (VBA) to improve the model by writing VBA code toimplement zoom-in and zoom-out buttons. This is shown in Figure 3. The idea in thismodel is just to select a range of x values (interval) over which y changes sign (color),then click on the button Zoom In. Clicking on Zoom Out just doubles the plot intervalwidth, while maintaining the center of the interval. Figure 4 shows the state of the
x y a b n h-2.0000000 -3.7500000 -2 5 100 0.07-1.9300000 -3.4624708-1.8600000 -3.1841237-1.7900000 -2.9149280-1.7200000 -2.6548513 solution-1.6500000 -2.4038598 estimate 1.5-1.5800000 -2.1619181-1.5100000 -1.9289888-1.4400000 -1.7050327-1.3700000 -1.4900088-1.3000000 -1.2838738-1.2300000 -1.0865826-1.1600000 -0.8980875-1.0900000 -0.7183386-1.0200000 -0.5472836-0.9500000 -0.3848675-0.8800000 -0.2310326-0.8100000 -0.0857181-0.7400000 0.0511394-0.6700000 0.1796067-0.6000000 0.2997540
Zoom In Zoom Out
-6.0
-4.0
-2.0
0.0
2.0
4.0
6.0
8.0
-4.0 -2.0 0.0 2.0 4.0 6.0
For Zoom In, please select a range of x-values (column A) over which y changes sign, then click Zoom In button
Figure 3: Solving 2x − x2 = 0 : before Zoom In
model after one click on the Zoom In button, and assumes that the user has selecteda minimal range of x values (i.e., adjacent values) over which the function has changedsign. Further, from Figure 5, it can be easily seen that with just two zoom-in operationsone can get a solution correct to several decimal places. This requires no keyboardingof values, but just two mouse clicks. Thus, there is minimal effort on the part of thestudent, but it is not a totally black box solution where the student sees nothing abouthow the problem is solved. We believe that this constitutes a good blend of theory andpractice.
A useful extension of the activity described in this section is to explore whether or notthe graph of any monotonic increasing exponential function would intersect the parabolay = x2 at three distinct points. To this end, the spreadsheet can be modified enablingone to extend solving equations in one variable to those depending on a parameter. Asan example, consider the equation
cx − x2 = 0 (2)
eJSiE 1(2):104—124 107
4
Spreadsheets in Education (eJSiE), Vol. 1, Iss. 2 [2004], Art. 3
http://epublications.bond.edu.au/ejsie/vol1/iss2/3

Spreadsheet Conditional Formatting
x y a b n h-0.8100000 -0.0857181 -0.81 -0.74 100 0.0007-0.8093000 -0.0843078-0.8086000 -0.0828983-0.8079000 -0.0814897-0.8072000 -0.0800819 solution-0.8065000 -0.0786750 estimate -0.775-0.8058000 -0.0772689-0.8051000 -0.0758636-0.8044000 -0.0744592-0.8037000 -0.0730556-0.8030000 -0.0716529-0.8023000 -0.0702510-0.8016000 -0.0688500-0.8009000 -0.0674498-0.8002000 -0.0660505-0.7995000 -0.0646520-0.7988000 -0.0632543-0.7981000 -0.0618575-0.7974000 -0.0604616-0.7967000 -0.0590665-0.7960000 -0.0576722
Zoom In Zoom Out
-0.1
-0.1
-0.1
0.0
0.0
0.0
0.0
0.0
0.1
-0.8 -0.8 -0.8 -0.8 -0.7 -0.7
For Zoom In, please select a range of x-values (column A) over which y changes sign, then click Zoom In button
Figure 4: Solving 2x − x2 = 0 : after first Zoom In
with parameter c > 1. Figure 6 shows how equation 2 can be modeled on the spreadsheetboth numerically and graphically with parameter c set as a slider-controlled discretevariable with any given increment. In particular, one can discover through visualization(Figure 6) that c = 2.0813 appears to be close to the maximum value that provides threesolutions to equation 2.
3 Conditional formatting in teaching fundamentals of cal-culus
Among topics studied in elementary differential calculus, the topic dealing with infi-nite processes is of fundamental importance. The most basic concept that underpinssuch processes is that of limit. Mathematics education research spanning over the lasttwenty-five years indicates that the notion of limit, including its “epsilon-delta” nota-tion, traditionally presents much conceptual difficulty for a great many students [32],[36], [11], [17]). It comes as no surprise that the “epsilon-delta” definition of limit is notonly a real source of student misconceptions, but is, in many cases at least, glossed-overcompletely by the teacher.
The effectiveness of the use of computers in helping learners to overcome variousmisconceptions in calculus through visualization is well documented [37]. This includesthe use of task-oriented computer programs, as well as the application of generic tools
108 eJSiE 1(2):104—124
5
Abramovich and Sugden: Spreadsheet Conditional Formatting
Produced by The Berkeley Electronic Press, 2004
S Abramovich and S J Sugden
x y a b n h-0.7673000 -0.0012333 -0.7673 -0.7666 100 7E-06-0.7672930 -0.0012197-0.7672860 -0.0012061-0.7672790 -0.0011925-0.7672720 -0.0011789 solution-0.7672650 -0.0011653 estimate -0.76695-0.7672580 -0.0011518-0.7672510 -0.0011382-0.7672440 -0.0011246-0.7672370 -0.0011110-0.7672300 -0.0010974-0.7672230 -0.0010838-0.7672160 -0.0010702-0.7672090 -0.0010566-0.7672020 -0.0010430-0.7671950 -0.0010294-0.7671880 -0.0010158-0.7671810 -0.0010022-0.7671740 -0.0009887-0.7671670 -0.0009751-0.7671600 -0.0009615
Zoom In Zoom Out
0.0
0.0
0.0
0.0
0.0
0.0
0.0
0.0
0.0
-0.8 -0.8 -0.8 -0.8 -0.8 -0.8
For Zoom In, please select a range of x-values (column A) over which y changes sign, then click Zoom In button
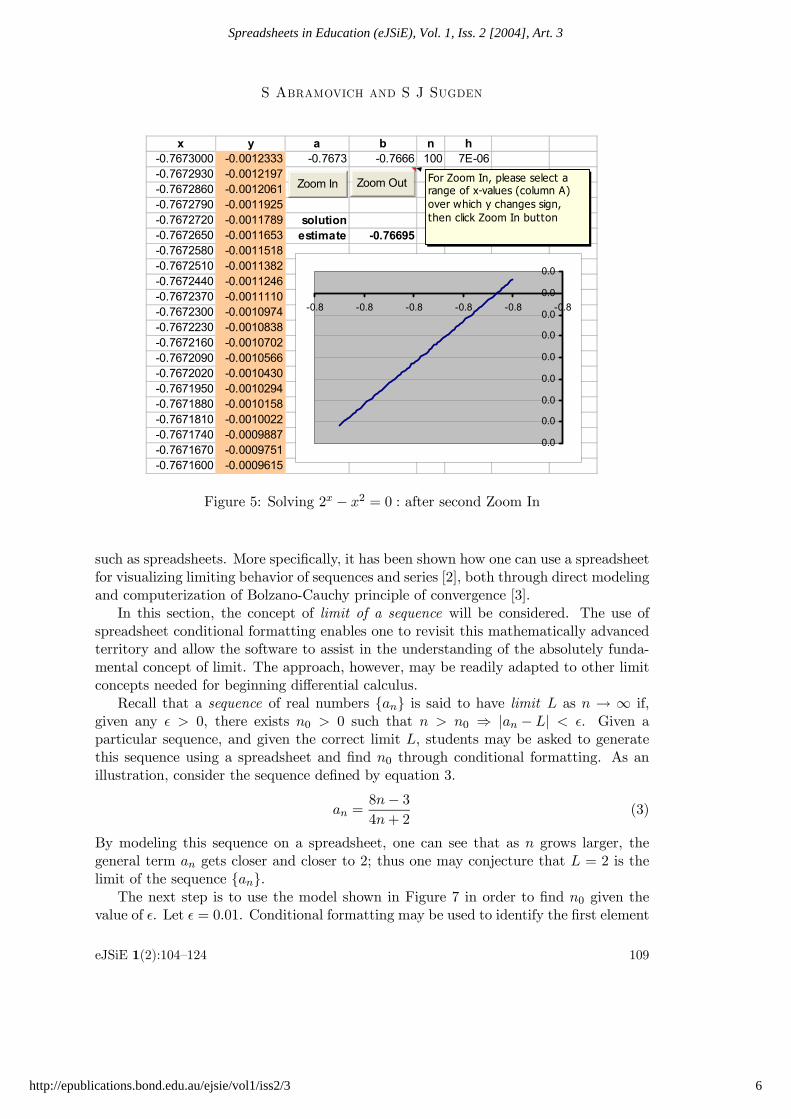
Figure 5: Solving 2x − x2 = 0 : after second Zoom In
such as spreadsheets. More specifically, it has been shown how one can use a spreadsheetfor visualizing limiting behavior of sequences and series [2], both through direct modelingand computerization of Bolzano-Cauchy principle of convergence [3].
In this section, the concept of limit of a sequence will be considered. The use ofspreadsheet conditional formatting enables one to revisit this mathematically advancedterritory and allow the software to assist in the understanding of the absolutely funda-mental concept of limit. The approach, however, may be readily adapted to other limitconcepts needed for beginning differential calculus.
Recall that a sequence of real numbers {an} is said to have limit L as n → ∞ if,given any > 0, there exists n0 > 0 such that n > n0 ⇒ |an − L| < . Given aparticular sequence, and given the correct limit L, students may be asked to generatethis sequence using a spreadsheet and find n0 through conditional formatting. As anillustration, consider the sequence defined by equation 3.
an =8n− 34n+ 2
(3)
By modeling this sequence on a spreadsheet, one can see that as n grows larger, thegeneral term an gets closer and closer to 2; thus one may conjecture that L = 2 is thelimit of the sequence {an}.
The next step is to use the model shown in Figure 7 in order to find n0 given thevalue of . Let = 0.01. Conditional formatting may be used to identify the first element
eJSiE 1(2):104—124 109
6
Spreadsheets in Education (eJSiE), Vol. 1, Iss. 2 [2004], Art. 3
http://epublications.bond.edu.au/ejsie/vol1/iss2/3

Spreadsheet Conditional Formatting
Figure 6: Enhanced f(x) = 0 model with slider-controlled parameter
of the sequence satisfying |an − 2| < . Because
¯̄̄̄8n− 34n+ 2
− 2¯̄̄̄=
¯̄̄̄8n− 3− 2(4n+ 2)
4n+ 2
¯̄̄̄=
7
4n+ 2(4)
the inequality 7/(4n + 2) < 0.01 holds true for n > 174.5; thus the least n0 would be175.
Spreadsheets can also be used to illustrate graphically the limit of a sequence bythe usual horizontal bands of width 2 and centered on the limit L. By relating theconditional-format-identified n0 to the definition of limit and to the graph, the teacherhas a wealth of materials with which to support and motivate the algebraic approachof determining n0, given , an outline of which is given by the sentence which embedsequation 4. A pedagogically sound extension of this activity is to show that a givenvalue for a claimed limit is incorrect. That is, to show that there exists at least one> 0 for which it is not possible to find n0 with the property required by the above
definition of limit. Consider the sequence of equation 3. In order to demonstrate thatL = 1 is not its limit, one only has to produce a single value of for which the inequality|(8n−3)/(4n+2)−1| < does not hold true for infinitely many values of n. Observing theresults of modeling of the (monotonically increasing) sequence 3 within the spreadsheetshown in Figure 7 enables one to recognize that its terms always differ from the claimedlimit, L = 1, by at least 1/6. This is almost the entire proof that L = 1 is not the limitof sequence 3. The challenge, of course, is to make students sufficiently aware that thiscounterexample (i.e., setting = 1/6) is enough to complete the proof.
110 eJSiE 1(2):104—124
7
Abramovich and Sugden: Spreadsheet Conditional Formatting
Produced by The Berkeley Electronic Press, 2004

S Abramovich and S J Sugden
n a[n] abs(a[n] - limit) limit epsilon1 0.833333333 1.166666667 2 0.12 1.3 0.73 1.5 0.54 1.611111111 0.3888888895 1.681818182 0.3181818186 1.730769231 0.2692307697 1.766666667 0.2333333338 1.794117647 0.2058823539 1.815789474 0.184210526
10 1.833333333 0.16666666711 1.847826087 0.15217391312 1.86 0.1413 1.87037037 0.1296296314 1.879310345 0.12068965515 1.887096774 0.11290322616 1.893939394 0.10606060617 1.9 0.118 1.905405405 0.09459459519 1.91025641 0.08974359
Figure 7: Limit of a sequence in Excel
4 Modular arithmetic
In an invited lecture to ICME-7, van Lint [38], addressing the question “What is discretemathematics and how should we teach it?” mentioned elementary number theory as oneof the most important topics in the study of discrete structures at the tertiary level.Indeed, as teaching experience at Bond University of the second author indicates, fordiscrete mathematics classes at that level it is becoming increasingly important to includeat least some coverage of the elementary theory of numbers. Many IT applicationsexist; perhaps most notable are the applications to mathematical cryptography, and inparticular to Rivest-Shamir-Adleman (RSA; see, for example, [19]) and similar publickey systems. The mathematics behind this system is simple enough to be presented in afirst-year tertiary discrete mathematics class. In order to support the RSA investigations,one or two lectures are conducted, with supporting workshop and tutorial, on modulararithmetic and simultaneous linear congruences. This has been done with success [35],and students have made unsolicited comments on the practical utility of the material.
The solution of a set of simultaneous linear congruences may be regarded as theintersection of several arithmetic sequences. This concept can be modeled very neatlyby making use of spreadsheet conditional formatting. It is worth noting that whilespreadsheet-based modeling techniques are used for illustrative purposes, the studentsare also required to demonstrate mastery of an algebraic approach to solving simul-
eJSiE 1(2):104—124 111
8
Spreadsheets in Education (eJSiE), Vol. 1, Iss. 2 [2004], Art. 3
http://epublications.bond.edu.au/ejsie/vol1/iss2/3

Spreadsheet Conditional Formatting
Figure 8: Simultaneous linear congruences
taneous linear congruences. The following example illustrates the point. Solve thesimultaneous linear congruences 5—7.
x ≡ 3 (mod 5) (5)
x ≡ 6 (mod 7) (6)
x ≡ 2 (mod 11) (7)
The problem is to find non-negative integers satisfying all three congruences. Note thateach such congruence defines an arithmetic sequence with common difference being themodulus. This enables one to generate numerical solutions to each of the congruenceswithin a spreadsheet pictured in Figure 8 either through recursive or closed-form defi-nition of an arithmetic sequence (columns E, F, G with corresponding modulo numbersdefined in cells E1, F1, G1). The next step is to arrange so generated terms of the threesequences in increasing order (column B) and find the smallest number that is listedthere three times. The MODE function applied to sufficiently large range beginning fromcell B3 displays the number 13 as the first solution in cell B2. The use of the LOOKUPfunction (defined in cell B1) enables the spreadsheet to generate positional rank (definedin column C, beginning cell C3) of the third 13 in column B. By changing the seed valuein cell C3 to 5 (positional rank of the third 13 plus one) allows one to eliminate fromcolumn B all numbers less or equal to 13, thus interactively display the next (in termsof numerical order) solution of the three simultaneous congruences. This process con-tinues allowing one to generate solutions of the congruences one by one made visiblethrough spreadsheet conditional formatting. A fundamental tool for working in modulararithmetic are the addition and multiplication tables. Such tables are easily constructedin a spreadsheet, and conditional formatting may be used to identify various patternsin the tables. As the slider is moved, interesting color patterns appear, disappear, andsometimes reappear. Students can be asked to explain this behavior. For example,
1. Why there is no zero product for prime modulus?
112 eJSiE 1(2):104—124
9
Abramovich and Sugden: Spreadsheet Conditional Formatting
Produced by The Berkeley Electronic Press, 2004

S Abramovich and S J Sugden
10
1 2 3 4 5 6 7 8 91 1 2 3 4 5 6 7 8 92 2 4 6 8 0 2 4 6 83 3 6 9 2 5 8 1 4 74 4 8 2 6 0 4 8 2 65 5 0 5 0 5 0 5 0 56 6 2 8 4 0 6 2 8 47 7 4 1 8 5 2 9 6 38 8 6 4 2 0 8 6 4 29 9 8 7 6 5 4 3 2 1
Figure 9: Modulo 10 multiplication table
2. Why there are highly regular patterns created by the highlight of zero productsotherwise, and interesting ones for those being doubles of primes?
3. Why does each element in a prime modulus system have a multiplicative inverse?
4. Does the latter property hold true for other modulus systems? Why or why not?
A suitable Excel model, with conditional formatting set to identify zeroes and ones,plus a slider control to alter the multiplication is shown in Figures 9 and 10.
5 Ramanujan’s taxicab numbers
Srinivasa Ramanujan was an Indian mathematician who collaborated with G. H. Hardyin the early part of the twentieth century [22]. Ramanujan was visited in hospital byHardy, who had traveled in taxi number 1729, and remarked that 1729 was a ratherboring number. According to the story, Ramanujan immediately countered that 1729was in fact a very interesting number, being the smallest positive integer which is thesum of two perfect cubes in two different ways [21]. Indeed, 1729 = 103+93 = 123+13.Using a spreadsheet, one can find all such “taxicab numbers” within a specified range;for example those numbers less than 5000 that are expressible as the sum of two cubesin two different ways.
To this end, one constructs a 20 by 20 table (Figure 11), so as to generate orderedpairs (p, q) where 1 ≤ p ≤ 20 and 1 ≤ q ≤ 20, defines the names p and q, and then fillseach cell in the table with the expression p3+ q3. After defining the name table to referto the block of cells in which the formula =p*p*p + q*q*q has been replicated, a celloutside the table is used to house the formula =MODE(table). Upon selecting the table,one uses conditional formatting to highlight cells matching the mode. It can be seen that1729 is highlighted four times. Because of the symmetry of the problem, it is recognized
eJSiE 1(2):104—124 113
10
Spreadsheets in Education (eJSiE), Vol. 1, Iss. 2 [2004], Art. 3
http://epublications.bond.edu.au/ejsie/vol1/iss2/3

Spreadsheet Conditional Formatting
11
1 2 3 4 5 6 7 8 9 101 1 2 3 4 5 6 7 8 9 102 2 4 6 8 10 1 3 5 7 93 3 6 9 1 4 7 10 2 5 84 4 8 1 5 9 2 6 10 3 75 5 10 4 9 3 8 2 7 1 66 6 1 7 2 8 3 9 4 10 57 7 3 10 6 2 9 5 1 8 48 8 5 2 10 7 4 1 9 6 39 9 7 5 3 1 10 8 6 4 2
10 10 9 8 7 6 5 4 3 2 1
Figure 10: Modulo 11 multiplication table
p\q 1 2 3 4 5 6 7 8 9 10 11 12 13 14 15 161 2 9 28 65 126 217 344 513 730 1001 1332 1729 2198 2745 3376 40972 9 16 35 72 133 224 351 520 737 1008 1339 1736 2205 2752 3383 41043 28 35 54 91 152 243 370 539 756 1027 1358 1755 2224 2771 3402 41234 65 72 91 128 189 280 407 576 793 1064 1395 1792 2261 2808 3439 41605 126 133 152 189 250 341 468 637 854 1125 1456 1853 2322 2869 3500 42216 217 224 243 280 341 432 559 728 945 1216 1547 1944 2413 2960 3591 43127 344 351 370 407 468 559 686 855 1072 1343 1674 2071 2540 3087 3718 44398 513 520 539 576 637 728 855 1024 1241 1512 1843 2240 2709 3256 3887 46089 730 737 756 793 854 945 1072 1241 1458 1729 2060 2457 2926 3473 4104 4825
10 1001 1008 1027 1064 1125 1216 1343 1512 1729 2000 2331 2728 3197 3744 4375 509611 1332 1339 1358 1395 1456 1547 1674 1843 2060 2331 2662 3059 3528 4075 4706 542712 1729 1736 1755 1792 1853 1944 2071 2240 2457 2728 3059 3456 3925 4472 5103 582413 2198 2205 2224 2261 2322 2413 2540 2709 2926 3197 3528 3925 4394 4941 5572 629314 2745 2752 2771 2808 2869 2960 3087 3256 3473 3744 4075 4472 4941 5488 6119 684015 3376 3383 3402 3439 3500 3591 3718 3887 4104 4375 4706 5103 5572 6119 6750 747116 4097 4104 4123 4160 4221 4312 4439 4608 4825 5096 5427 5824 6293 6840 7471 8192
Figure 11: Ramanujan taxicab numbers showing the first solution, 1729
114 eJSiE 1(2):104—124
11
Abramovich and Sugden: Spreadsheet Conditional Formatting
Produced by The Berkeley Electronic Press, 2004

S Abramovich and S J Sugden
p\q 1 2 3 4 5 6 7 8 9 10 11 12 13 14 15 161 2 9 28 65 126 217 344 513 730 1001 1332 1729 2198 2745 3376 40972 9 16 35 72 133 224 351 520 737 1008 1339 1736 2205 2752 3383 41043 28 35 54 91 152 243 370 539 756 1027 1358 1755 2224 2771 3402 41234 65 72 91 128 189 280 407 576 793 1064 1395 1792 2261 2808 3439 41605 126 133 152 189 250 341 468 637 854 1125 1456 1853 2322 2869 3500 42216 217 224 243 280 341 432 559 728 945 1216 1547 1944 2413 2960 3591 43127 344 351 370 407 468 559 686 855 1072 1343 1674 2071 2540 3087 3718 44398 513 520 539 576 637 728 855 1024 1241 1512 1843 2240 2709 3256 3887 46089 730 737 756 793 854 945 1072 1241 1458 1729 2060 2457 2926 3473 4104 4825
10 1001 1008 1027 1064 1125 1216 1343 1512 1729 2000 2331 2728 3197 3744 4375 509611 1332 1339 1358 1395 1456 1547 1674 1843 2060 2331 2662 3059 3528 4075 4706 542712 1736 1755 1792 1853 1944 2071 2240 2457 2728 3059 3456 3925 4472 5103 582413 2198 2205 2224 2261 2322 2413 2540 2709 2926 3197 3528 3925 4394 4941 5572 629314 2745 2752 2771 2808 2869 2960 3087 3256 3473 3744 4075 4472 4941 5488 6119 684015 3376 3383 3402 3439 3500 3591 3718 3887 4104 4375 4706 5103 5572 6119 6750 747116 4097 4104 4123 4160 4221 4312 4439 4608 4825 5096 5427 5824 6293 6840 7471 8192
Figure 12: Ramanujan taxicab numbers showing the second solution, 4104
that the table has some redundancy, however it is easier to construct a square tablethan a triangular one. To find other numbers satisfying the “taxicab” condition, justdelete the contents of one of the cells with 1729; in Figure 12, this has been done in thecolumn in which q = 1. The next solution, 4104, will automatically be highlighted by theconditional formatting condition (Figure 12). It seems that if a dataset is multimodal,Excel will find the smallest mode, although this is not stated in Microsoft’s online helpfor Excel XP. Additional detail may be found elsewhere [34]. Similar techniques can beapplied to enhance learning environments dealing with Pythagorean triples and partitionof numbers into two squares [4].
6 Designing environments for younger learners
So far, the use of conditional formatting has been discussed in connection with the useof spreadsheets in undergraduate mathematics courses. The material of the next threesections stems from the first author’s experience in using a spreadsheet in preparingteachers, in particular those learning to teach mathematics at the elementary level.The use of spreadsheets with younger children was advocated by the National Councilof Teachers of Mathematics [29] and success of such use was reported in a number ofpublications over the past decade [16], [8], [9], [14], [15], [7], [5]. This section will showhow conditional formatting allows for the simultaneous use of two pedagogically soundfeatures of a spreadsheet—the use of macros and worksheet protection.
To this end, note that by protecting a worksheet one prevents accidental changes tocells filled with formulas structuring the worksheet. A macro is a series of commandsand functions that can be run whenever one needs to perform a task repeatedly. Anexample of task based on the use of macros in connection with using a spreadsheetas a manipulative-computational environment was described elsewhere [6]. It showshow the use of an action-oriented macro turns a spreadsheet into a scaffolding device
eJSiE 1(2):104—124 115
12
Spreadsheets in Education (eJSiE), Vol. 1, Iss. 2 [2004], Art. 3
http://epublications.bond.edu.au/ejsie/vol1/iss2/3

Spreadsheet Conditional Formatting
Figure 13: A seven-day map
[39] that supports one’s thinking in trial and error form in a problem-solving setting.Both features are extremely beneficial when younger children are spreadsheet users;yet macros cannot be run directly on a protected worksheet. A way around such anincompatibility of the two features is to apply conditional formatting to cells whichotherwise contain formulas, thus providing support of trial and error thinking throughan appropriate semiotic feedback. Such formulas can be hidden within the conditionalformatting dialogue box; thus allowing one to use this feature in place of worksheetprotection.
As an example, consider the following “real-life” situation used as context for one ofthe assignments for the course “Using Spreadsheets in Teaching School Mathematics”designed for prospective teachers of mathematics and taught by the first author at theState University of New York [1].
Once upon a time Hilton built an 8-story hotel in New York. The hotelturned out to be a very special one: every night a monster visited one floorthere. The monster started with the 1st (ground) floor, on the next night heskipped one floor and visited the 3rd floor, then he skipped two floors andvisited the 6th floor, then he emerged on the 2nd floor (by skipping floors 7, 8,and 1), then he skipped four floors to visit the 7th floor. Then he continuedgoing up and down by skipping five, six, seven and so on number of floors.Figure 13 shows the map of the monster’s behavior during the first sevendays.
Whereas the task for students in the course is to construct a manipulative-computationalenvironment for the creation of such a map, the task for younger children is to extendthis map to another two (or more) weeks by shading through macros appropriate cells in8-cell towers prepared in advance by a teacher. A hidden didactic idea behind this taskis to make young learners intuitively realize that skipping, say, 14 floors in an 8-storytower is equivalent to skipping MOD(14,8)=6 floors and in doing so to build foundation
116 eJSiE 1(2):104—124
13
Abramovich and Sugden: Spreadsheet Conditional Formatting
Produced by The Berkeley Electronic Press, 2004

S Abramovich and S J Sugden
for future learning of modular systems. Through this process, the children can makemistakes in developing the map of the monster’s behavior. In order to provide an inter-active feedback on their actions with the goal to help correcting possible mistakes (andthus learn from mistakes) one can create manipulative-computational environment thatcontrols student’s mathematical action. More specifically, if a student applies a macroto a wrong floor, the spreadsheet interactively fills with red color a cell immediatelybeneath the corresponding tower.
One strategy of establishing a hot-link between iconic and numeric notations of aspreadsheet is the use of binary code. For example, the far-left tower (a set of eightcells) in Figure 13 can be associated with an 8-vector (0, 0, 0, 0, 0, 0, 0, 1), each element ofwhich is a result of applying the Excel function =COUNT to a corresponding cell from thearray. In turn, each such vector can first be viewed as a binary form (with one and onlyone non-zero face value) and then translated into decimal form (which, apparently, is apower of two) by using floor’s number diminished by one as an exponent for base two.In such a way, the map pictured in Figure 13 can be associated with the seven powersof two: 20 = 1, 22 = 4, 25 = 32, 21 = 2, 26 = 64, 24 = 16, and 23 = 8. Note that the floornumbers in Figure 13 are congruent to the first seven triangular numbers modulo eight.This pattern continues for all triangular numbers but multiples of eight that correspondto the top (eighth) floor.
This makes it possible to generate a correct numerical map and interactively controlthe development of an iconic map by a student so that any incorrect shading resultsin the appearance of a red color underneath a corresponding grid through conditionalformatting. In such a way, even if one accidentally hits a cell in which a warning of errormay appear, the mechanism responsible for such a warning would not be deleted.
Note that the above context can be extended to include k-types of monsters, eachof which starts from the first floor and skips kn floors on the n-th night. While thecase k = 1 (i.e., the one mentioned above) corresponds to what may be referred to astriangular monster, the cases k = 2, 3, 4 correspond, respectively, to square, pentagonal,and hexagonal monsters. Through this activity, polygonal numbers can be introducedin a whimsical content, oriented to younger learners. The unity of the context andspreadsheet conditional formatting becomes a useful educational resource in building afoundation for learning significant mathematical ideas.
7 Developing meta-context through conditional formatting
An important component of mathematics teacher education program is providing prospec-tive teachers with experience in formulating and discovering a solution to one’s ownproblem. This experience, when used appropriately, has great potential to influencemathematics taught in schools [18]. It has been argued continuously that problem posingis an informed extension of problem solving [23], [13], [33] and thus the two intellectualactivities are closely related. Whereas the role of technology in problem solving is wellunderstood, the role of technology in problem posing is a less explored domain.
This section shows how spreadsheet conditional formatting can enhance a unified
eJSiE 1(2):104—124 117
14
Spreadsheets in Education (eJSiE), Vol. 1, Iss. 2 [2004], Art. 3
http://epublications.bond.edu.au/ejsie/vol1/iss2/3

Spreadsheet Conditional Formatting
Figure 14: A blueprint of Jeremy’s towers
pedagogy of problem posing and solving through creating meta-context [6] that supportsthe variation of syntactic and conceptual structures of a problem situation [23]. To begin,consider the following hands-on assignment designed for elementary pre-teachers enrolledin a problem-solving course.
Jeremy is making towers from blocks according to the pattern of Figure14. How many blocks does he need in order to build: (i) the 5th tower in thispattern;(ii) the 10th tower in this pattern; (iii) the n-th tower in this pattern.
While the answers to the above questions can be obtained by using a simple drawing(Figure 14) and are, respectively, 65, 505, and n(n2 + 1)/2, one can see that Jeremy’sproblem may be extended to allow for each tower’s width to be two, three, four, etc.blocks greater than the previous one (Figure 15). In other words, in such extendedsituations, the widths of the towers in each set are arithmetic sequences with differencesequal, respectively, to two, three, four, etc. Each new problem situation requires aseparate blueprint as its meta-context. This brings about the need for the developmentof a computational environment capable of producing blueprints for any value of thedifference of an arithmetic sequence involved. Once such an environment is developed,spreadsheet conditional formatting can come into play allowing one to generate suchblueprints by changing just one parameter, namely, the difference, at the click of amouse. Note that in a decontextualized form, Jeremy’s problem is equivalent to that ofarranging counting numbers in the groups
(1), (2, 3), (4, 5, 6), (7, 8, 9, 10), (11, 12, 13, 14, 15), . . . ,
118 eJSiE 1(2):104—124
15
Abramovich and Sugden: Spreadsheet Conditional Formatting
Produced by The Berkeley Electronic Press, 2004

S Abramovich and S J Sugden
1 1 1 1 1 1 1 55 1 1 1 1 45 54 1 1 1 1 1 36 44 53 1 1 1 1 1 1 28 35 43 52 1 1 1 1 1 1 1 21 27 34 42 51 1 1 1 1 1 1 1 1 15 20 26 33 41 50 1 1 1 1 1 1 1 1 1 10 14 19 25 32 40 49 1 1 1 1 1 1 1 1 1 1 6 9 13 18 24 31 39 48 1 1 1 1 1 1 1 1 1 1 1 3 5 8 12 17 23 30 38 47 1 1 1 1 1 1 1 1 1 1 1 11 2 4 7 11 16 22 29 37 46 1 1 1 1 1 1 1 1 1 1 1 1 1
Figure 15: Extended blueprints
and then finding the sums of numbers in the 5th, 10th, and n-th group. Furthermore,the extended situations can be decontextualized in a similar way. Classroom observa-tions over a number of years of teaching mathematical problem solving to elementarypre-teachers provided strong evidence that while the teachers are capable of recogniz-ing a connection between contextualized and decontextualized versions of the problem,they fail to comprehend the latter when it is taught in a pure numeric context. There-fore, the worth of content-bounded mathematics didactics implies the importance ofcreating environments that support visual enhancement of such a didactics. Further-more, Polya’s famous heuristic advice [30] of using a simpler problem as a vicariousthinking tool points to the importance of developing context-bounded skills in problemformulating (or, better, re-formulating) among pre-teachers of mathematics. Such skillscan be technologically enhanced through computerizing the production of meta-contextinvolved.
The spreadsheet pictured in Figure 16 represents such a computer-generated meta-context. It shows consecutive natural numbers defined in row 1 beginning from cell D1which are used as mediators in generating other sequences. In the particular case ofunit difference, the subsequence 2, 5, 9, 14, . . . can be associated with the gaps betweenthe towers. Because each term of the latter sequence is greater than the correspondingtriangular number by its positional rank, an integer N belongs to this sequence providedthat the equation n(n + 3)/2 = N has an integer solution. For that, the combination¡√9 + 8N − 3¢ /2 should be an integer. This criterion can be generalized to include
any difference between the widths of consecutive towers and then computerized using aspreadsheet.
Spreadsheet conditional formatting comes into play when one highlights the rectan-gular enclosure in which towers are located, opens the conditional formatting dialoguebox, enters a formula that identifies cells in the enclosure filled with positive integers,and chooses an appropriate font color and the outline option so as, respectively, not to
eJSiE 1(2):104—124 119
16
Spreadsheets in Education (eJSiE), Vol. 1, Iss. 2 [2004], Art. 3
http://epublications.bond.edu.au/ejsie/vol1/iss2/3

Spreadsheet Conditional Formatting
display numerals and to outline cells that belong to a tower.
Roof Type (m) MEDIATORS30 1 1 2 3 4 5 6 7 8 9 10 11 12 13 14 15 16 17 18 19 20
25 24 23 22 21 20 19 18 17 16 15 120 14 105 119 13 91 104 118 12 78 90 103 117 11 66 77 89 102 116 10 55 65 76 88 101 115 9 45 54 64 75 87 100 114 8 36 44 53 63 74 86 99 113 7 28 35 43 52 62 73 85 98 112 6 21 27 34 42 51 61 72 84 97 111 5 15 20 26 33 41 50 60 71 83 96 110 4 10 14 19 25 32 40 49 59 70 82 95 109 3 6 9 13 18 24 31 39 48 58 69 81 94 108 2 3 5 8 12 17 23 30 38 47 57 68 80 93 107 1 1 2 4 7 11 16 22 29 37 46 56 67 79 92 106
1 2 3 4 5 6 7 8 9 10 11 12 13 14 15
HEIGHT
Figure 16: Jeremy’s towers generated through conditional formatting
To conclude this section, note that other problems can stem from Jeremy’s problemto allow for new mathematical concepts to be used in instruction. For example, byformatting the spreadsheet pictured in Figure 16 so as to display numbers hidden inthe cells of the towers and in those beneath the towers, one can come across differentpolygonal numbers and see their distribution among the natural number sequence. Insuch an environment one can formulate and solve problems including, for example, thesummation of numbers that belong to the same floor in a set of towers. In particular,the importance of triangular numbers as building blocks in exploring various numericand geometric patterns can be highlighted.
Another type of problem may deal with the concept of geometric probability: Ifone of Jeremy’s towers is put into the circumscribed rectangular enclosure and a dart isthrown into it, what is the probability that the tower would not be hit? Apparently, thisinquiry is equivalent to Jeremy’s problem. Conditional formatting has great potential toenhance the presentation and formulating of problems having such a geometric nature.
120 eJSiE 1(2):104—124
17
Abramovich and Sugden: Spreadsheet Conditional Formatting
Produced by The Berkeley Electronic Press, 2004

S Abramovich and S J Sugden
Start Difference1 6713 Length19 525
Start Difference14 284270 Length98 6126154
Start Difference6 15
2136 Length51 66681
Start Difference1 6713 Length19 525
Start Difference14 284270 Length98 6126154
Start Difference6 15
2136 Length51 66681
Figure 17: Three arithmetic sequences with a common property
8 Conditional formatting as a window on unsolved prob-lems
Conditional formatting not only enhances problem solving, but also it can create anenvironment from which, quite unexpectedly, challenging problems can emerge. So, inintroducing to pre-teachers of mathematics basic techniques associated with the use ofspreadsheets, several computational environments were created, among them a generatorof an integer arithmetic sequence of a variable size. Then conditional formatting wasintroduced as a tool allowing a spreadsheet to identify those terms that are multiples ofits length. For example, a five-term arithmetic sequence 1, 7, 13, 19, 25 has one multiple offive, a six-term arithmetic sequence 14, 42, . . . , 154 has two multiples of six, and six-termarithmetic sequence 6, 21, . . . , 81 has three multiples of six (Figure 17).
Proceeding from the three examples, one may conjecture that any n-term integerarithmetic sequence contains at least one multiple of n. Yet, the following three-termsequence 5, 8, 11 defies this conjecture. Apparently, many sufficient (but not necessary)conditions can be formulated in terms of parameters of an arithmetic sequence thatguarantee the above-mentioned phenomenon. The authors wonder: Is it possible toformulate such conditions that are both sufficient and necessary?
9 Conclusion
The authors have identified just a few examples in this paper, but the possibilities foreducational applications of conditional formatting would seem to be very great indeed.It is hoped that the ideas expressed in this paper will serve at a catalyst for furtherresearch and investigation into the use of conditional formatting for mathematics educa-tion. Conditional formatting certainly appears to be a very much under-used feature ofExcel; certainly for educational purposes. In a recent survey of the use of spreadsheetsin education [10], it was found that almost no published examples of this potentiallyvery powerful and useful facility exist.
eJSiE 1(2):104—124 121
18
Spreadsheets in Education (eJSiE), Vol. 1, Iss. 2 [2004], Art. 3
http://epublications.bond.edu.au/ejsie/vol1/iss2/3

Spreadsheet Conditional Formatting
References
[1] Abramovich, S. (2003). GRED 504 Using Spread-sheets in Teaching School Mathematics (web site). URL:http://www2.potsdam.edu/educ/abramovs/gred595site.htm.
[2] Abramovich, S., and Levin, I. (1994). Spreadsheets in teaching and learning top-ics in calculus. International Journal of Mathematical Education in Science andTechnology, 25(2): 263—275.
[3] Abramovich, S. (1995). Technology for deciding the convergence of series. Interna-tional Journal of Mathematical Education in Science and Technology, 26(3): 247—366.
[4] Abramovich, S., and Brantlinger, A. (1999). Spreadsheet-based tool kit for modelingconcepts in elementary number theory. In H. Skala (Ed.), Proceedings of the ThirdBiennial Symposium on Mathematical Modeling in the Undergraduate Curriculum:28—38. University of Wisconsin, La Crosse.
[5] Abramovich, S. (2003). Cognitive heterogeneity in computer-mediated mathemat-ical action as a vehicle for concept development. Journal of Computers in Mathe-matics and Science Teaching, 22(1): 29—51.
[6] Abramovich, S. (2003). Spreadsheet-enhanced problem solving in context as mod-eling. Spreadsheets in Education, 1(1): 1—17.
[7] Abramovich, S., Stanton, M., and Baer, E. (2002). What are Billy’s chances? Com-puter spreadsheet as a learning tool for younger children and their teachers alike.Journal of Computers in Mathematics and Science Teaching, 21(2): 127—145.
[8] Ainley, J. (1995). Re-viewing graphing: Traditional and intuitive approaches. Forthe Learning of Mathematics, 15(2): 10—16.
[9] Ainley, J., Nardi, E., and Pratt, D. (2000). The construction of meanings for trendin active graphing. International Journal of Computers for Mathematical Learning,5: 85—114.
[10] Baker, J. E., and Sugden, S.J. (2003). Spreadsheets in Education: The First 25Years. Spreadsheets in Education 1(1): 18—43.
[11] Bezuidenhout, J. (2001). Limits and continuity: some conceptions of first-year stu-dents. International Journal of Mathematical Education in Science and Technology,32(4): 487—500.
[12] Bruce, J.W., Giblin, P.J., and Rippon, P.J. (1990). Microcomputers and Mathemat-ics. Cambridge: Cambridge University Press.
122 eJSiE 1(2):104—124
19
Abramovich and Sugden: Spreadsheet Conditional Formatting
Produced by The Berkeley Electronic Press, 2004

S Abramovich and S J Sugden
[13] Brown, S. I., and Walter, M.I. (1990). The Art of Problem Posing. Hillsdale, NJ:Lawrence Erlbaum.
[14] Drier, H.S. (1999). Do vampires exist? Using spreadsheets to investigate a commonfolktale. Learning and Leading with Technology, 27(1): 22—25.
[15] Drier, H.S. (2001). Teaching and learning mathematics with interactive spread-sheets. School Science and Mathematics, 101(4): 170—179.
[16] Dugdale, S. (1994). K-12 teacher’s use of a spreadsheet for mathematical modelingand problem solving. Journal of Computers in Mathematics and Science Teaching,13(1): 43—68.
[17] Eade, F. (2003). Secondary trainee teacher’s understanding of convergence and con-tinuity. International Journal of Mathematical Education in Science and Technology,34(3): 371—384.
[18] Ellerton, N.F., and Clarkson, P.C. (1996). Language factors in mathematics teachingand learning. In A.J. Bishop et al. (eds), International Handbook of MathematicsEducation: 987—1033. Dordrecht: Kluwer Academic Publishers.
[19] Ferguson, N., and Schneier, B. (2003). Practical Cryptography. Indianapolis: Wiley.
[20] Gonzalez, R.C., and Woods, R.E. (1993). Digital Image Processing. Reading, MA:Addison-Wesley.
[21] Hardy, G.H. (1940). Ramanujan. London: Cambridge University Press.
[22] Kanigel, R. (1991). The Man Who Knew Infinity: A Life of the Genius Ramanujan.New York: Washington Square Press.
[23] Kilpatrick, J. (1987). Problem formulating: Where do good problems come from?In A.H. Schoenfeld (Ed.), Cognitive Science and Mathematics Education, 123—147.Hillsdale, NJ: Lawrence Erlbaum.
[24] Kreith, K., and Chakerian, D. (1999). Iterative Algebra and Dynamic Modeling.New York: Springer-Verlag.
[25] Levin, I., and Abramovich, S. (1992). Solving equations within spreadsheet. Journalof Computers in Mathematics and Science Teaching, 11(3/4): 337—345.
[26] Masalski, W.J. (1999). How to Use the Spreadsheet as a Tool in the SecondaryMathematics Classroom. Reston, VA: National Council of Teachers of Mathematics.
[27] Murphy, R.D. (1994). Iterative Solution of Nonlinear Equations. Journal of Com-puters in Mathematics and Science Teaching, 13(2): 163—169.
[28] Neuwirth, E., and Arganbright, D. (2004). The Active Modeler: Mathematical Mod-eling With Microsoft Excel. Belmont, California: Brooks Cole Publishing Company.
eJSiE 1(2):104—124 123
20
Spreadsheets in Education (eJSiE), Vol. 1, Iss. 2 [2004], Art. 3
http://epublications.bond.edu.au/ejsie/vol1/iss2/3

Spreadsheet Conditional Formatting
[29] National Council of Teacher of Mathematics. (2000). Principles and Standards forSchool Mathematics. Reston, VA: The Author.
[30] Polya, G. (1973). How to Solve It? Princeton, NJ: Princeton University Press.
[31] Reid, S.K. (1982). Cognition. Monterey, CA: Brooks/Cole.
[32] Schwarzenberger, R.L.E, and Tall, D.O. (1978). Conflicts in the learning of realnumbers and limits. Mathematics Teaching, 82: 44—49.
[33] Silver, E.A., Kilpatrick, J., and Schlesinger, B. (1990). Thinking Through Math-ematics: Fostering Inquiry and Communication in Mathematics Classrooms. NewYork: College Entrance Examination Board.
[34] Sugden, S. J. (2002). Illustrating Mathematical Fundamentals with Microsoft Excel.CATE 2002, The 5th IASTED International Multi-Conference in Computers andAdvanced Technology in Education. Cancun: Mexico: ACTA Press.
[35] Sugden, S. J. (2003). Elementary Number Theory in a Discrete Mathematics Class:The RSA Cryptosystem. Paper presented at Delta 03, The Fourth Southern Hemi-sphere Symposium on Undergraduate Mathematics Teaching, Queenstown, NewZealand, 23—27 November 2003.
[36] Tall, D. (1992). The transition to advanced mathematical thinking: functions, lim-its, infinity, and proof. In Handbook of Research on Mathematics Teaching andLearning, edited by D.A. Grouws (New York: Macmillan), 495—511.
[37] Tall, D. (1996). Functions and calculus. In International Handbook of MathematicsEducation, edited by A. Bishop, K. Clements, C. Keitel, J. Kilpatrick, C. Laborde(Dordrecht: Kluwer Academic Publishers), part 1, 289—325.
[38] Van Lint, J.H. (1994). What is discrete mathematics and how should we teach it? InSelected Lectures from the 7 th International Congress in Mathematical Education,edited by D.F. Robitaille, D.H. Wheeler, and C. Kieran (Les Presses de l’UniversiteLaval), 263—270.
[39] Wood, D., Bruner, J.S., and Ross, G. (1976). The role of tutoring in problem solving.Journal of Child Psychology and Psychiatry, 17: 89—100.
124 eJSiE 1(2):104—124
21
Abramovich and Sugden: Spreadsheet Conditional Formatting
Produced by The Berkeley Electronic Press, 2004