spring 2012 astronomy course mississippi valley night sky conservation the sky around us
DESCRIPTION
Spring 2012 Astronomy Course Mississippi Valley Night Sky Conservation The Sky Around Us. Program developed by Mississippi Valley Conservation Authority Royal Astronomical Society of Canada Ottawa Astronomy Friends Instructors: Pat Browne Stephen Collie Rick Scholes Course Assistant - PowerPoint PPT PresentationTRANSCRIPT

Spring 2012 Astronomy CourseMississippi Valley Night Sky ConservationThe Sky Around Us
Program developed byMississippi Valley Conservation AuthorityRoyal Astronomical Society of CanadaOttawa Astronomy Friends
Instructors:Pat BrowneStephen CollieRick ScholesCourse AssistantAmy Booth
Earth Centered Universe software for illustrations – courtesy David Lane

WHERE Locating Star Clusters Where are they within or around the galactic
planeWhich clusters live where?
WHEN When did they form? (Stellar Evolution)Are they visible?
WHAT Types of star clustersClobular ClustersOpen Clusters
WHOSupernova SN1987a discovererIan Shelton – Cdn astronomerPioneers in star cluster analysisHelen Sawyer Hogg(Canadian Astronomer)Henrietta Leavitt
III Star Clusters in and around our Galaxy
M3
M44 BeeHive

Stellar Properties
-5
0
+5
+10
OB
AF
KM5
Lecture 2 presented some of the physical properties that can be gleaned from visual observing of individual or binary star systems– notably colour and magnitude. Using starlight spectrum analysis, stars can be classified according to their peak wavelength intensity (colour temperatures) and the absorption lines superposed over the continuum of the spectra.The classification of stellar spectra fits into roughly groups OBAFGKM. We can classify specific stars according to their Spectral Class and therefore their Effective Temperatures.On the left, the scale of Absolute Magnitude reflects the true luminousity of the star. In order to determine Absolute Magnitude, we must have a measure of the stellar distance (by other means).
Absolute magnitude, M, expresses the brightness of a star as it would be if it were placed 10 parsecs away. Since all stars would be placed at the same distance, absolute magnitudes show differences in actual luminosities. It is a measure based on stellar analysis and distance determinations.(The sun is absolute Magnitude 4.3 roughly. Sirius is 1.4 (much brighter!)) Luminosities are measured with respect to solar luminosity.For Main Sequence Stars within our galaxy Note: Apparent magnitude is what we use in our observations, a visual scale that ranges from roughly -2 to 6. The scale is also logarithmic – so that a 2nd magnitude star is 2.5 x brighter than a 3rd magnitude star. A difference of 5 magnitudes is 100. (2.5 ^ 10). You can show apparent (visual) magnitudes in ECU.


Stellar Evolution – Red Giants, White Dwarfs and Supernova Remnants
Evolutionary pathways are shown here for stars 1, 5,10Solar Masses. As a newly formed star stabilizes, it drops down on the H-R diagram and takes up a place on the main sequence. Just where it settles depends on its initial mass.
On the main sequence, a star fuses hydrogen to helium in its core. A star spends most of its lifetime on the main sequence.
When Stars move off the Main Sequence, they become Red Giants, White Dwarfs or Supernova Remnants.
Solar Mass Stars:
Once the core has exhausted its supply of hydrogen, it contracts and heats up. The star brightens and its outer layers expand, and it moves up and off the main sequence to become a giant. Larger radius, cooler temperature.
High Mass stars: complex nuclear fusion transformations that can lead to core collapse when Iron core requires energy rather than releases it in nuclear fusion
We can explore the evolutionary tracks http://rainman.astro.illinois.edu/ddr/stellar/intermediate.html
http://outreach.atnf.csiro.au/education/senior/astrophysics/
stellarevolution_postmain.html#postmainevotrack

Case 1 Stars = 1 Solar Mass -> Red Giant -> White dwarfStars such as our Sun move off the main sequence and enter the red giant branch (RGB), when the core hydrogen is exhausted. With no thermonuclear fusion in the core, the star contracts . An outer shell of hydrogen continues to burn and the radius expands, but the temperature decreases – Red giant – lower temperature, higher luminosity.
Horizontal BranchHydrogen fusion in the shell produces more helium. This gets dumped onto the core, adding to its mass, causing it to heat up even more. When the core temperature reaches 350 million K, the helium nuclei now have sufficient kinetic energy to overcome the strong coulombic repulsion and fuse together, forming carbon-12 in a two-stage process
Evolutionary Path – Solar Mass Stars off the Main Sequence

In an AGB star, if the helium fuel in the He-burning shell runs low, the outward radiation pressure drops off. As this was previously holding out the shell of hydrogen gas this shell now contracts, heats up and ignites, converting hydrogen to helium. This helium "ash" in turn falls onto the helium shell, heating it up till it is hot enough to re-ignite in a helium-shell flash, producing a thermal pulse. Increased radiation pressure now causes the hydrogen shell to expand and cool, shutting down H-shell burning. Once shell temperature is sufficient, helium shell burning starts and the star moves up into the asymptotic giant branch (AGB). This is accompanied by a core of degenerate matter where a higher temperature does not correspond to an increase in pressure. So the core is tiny and remains so.
Mass Loss: Over time the outer layers of the AGB star are almost totally ejected and may initially appear as a circumstellar shell. With the ejection of the outer layers of the star, its hot, dense core is left exposed. It is initially so hot that the intense ultraviolet radiation it emits ionises the expanding, ejected shell. This results in the cloud glowing, similar to an emission nebula. Such objects are called planetary nebulae after their initial description by Herschel in the 18th century.
As the balance of the reaction shifts, the star executes a series of ‘blue loops’ that take it zig-zagging up the diagram. > 5 Solar Masses are believed to produce iron-rich cores that eventually collapse, triggering a supernova explosion. This is because the fusion of elements < Fe (Iron) give off energy whereas it takes energy to fuse iron. Hence at this point the gravitational contraction overcomes the radiation energy of fusion and the star oscillates until explosion in a supernova event
White Dwarf Evolution Planetary Nebula
Instant Expert

Summary – Post Main Sequence Stellar Evolution for Sun-like Stars
Courtesy Zelik and Smith
Introductory Astronomy and Astrophysics
For AGB enthusiasts here is an excellent reference:
https://www.e-education.psu.edu/astro801/content/l6_p3.html

.
Massive stars evolve and produce iron-rich cores that eventually collapse, triggering a supernova explosion This is because the fusion of elements < Fe (Iron) give off energy whereas it takes energy to fuse iron.
Hence at this point the gravitational contraction overcomes the diminishing energy of fusion and the star oscillates until explosion in a supernova event.
As the balance of the reaction shifts, the star executes a series of ‘blue loops’ that take it zig-zagging up the diagram.
Nucleo-synthesis of elements above helium is less efficient so that each successive reaction produces less energy per unit mass of fuel. Statistically they are very low in numbers as they are less likely to form than lower-mass stars and their lifetimes are so short anyway. Dr. Ian Shelton of U of T discovered SN 1987A in the LMC!
Massive Stars > 10 Solar Masses
SN1987A discoverer Dr. Ian Shelton, U of T
Supernova
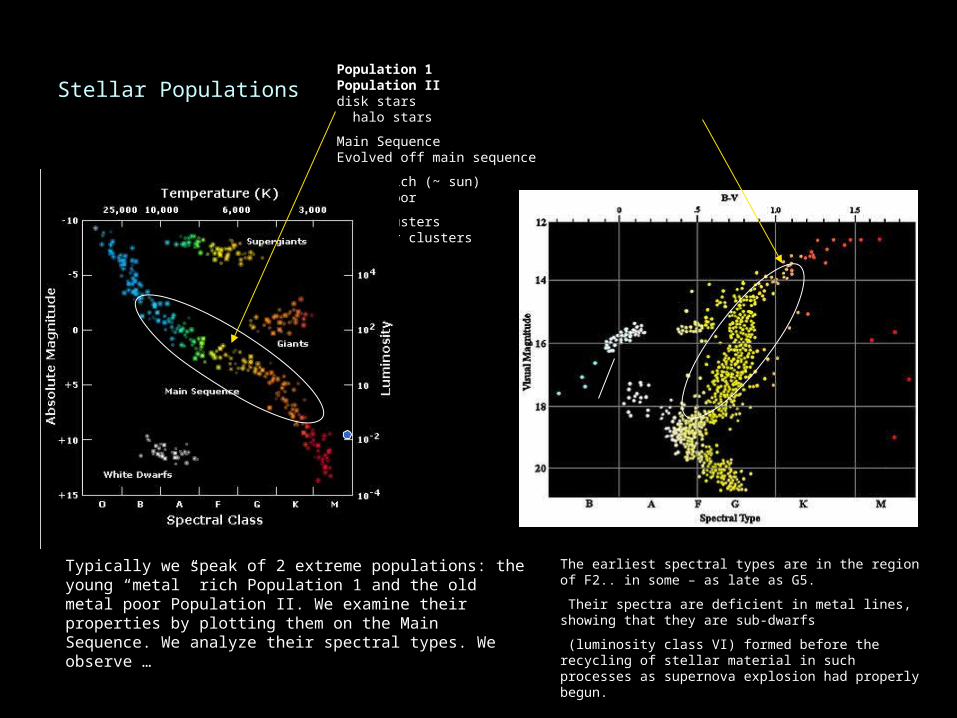
Stellar Populations
Typically we speak of 2 extreme populations: the young “metal” rich Population 1 and the old metal poor Population II. We examine their properties by plotting them on the Main Sequence. We analyze their spectral types. We observe …
Population 1 Population IIdisk stars halo stars
Main Sequence Evolved off main sequence
metal rich (~ sun) metal poor
open clusters globular clusters
The earliest spectral types are in the region of F2.. in some – as late as G5.
Their spectra are deficient in metal lines, showing that they are sub-dwarfs
(luminosity class VI) formed before the recycling of stellar material in such processes as supernova explosion had properly begun.

Open clusters are groupings of 20-50 star sin a region 10-60 light years across. Most OCs are found close to the plane of the galaxy. It is possible to find the age of the cluster by identifying the spectral type of the earliest Main Sequence member.
Example: Beehive Cluster M44 – young 730 million years, close, 577 light years, sparse < 1000 members
fraction by mass
solar value
hydrogen content
X 0.70
helium content
Y 0.28
everything else
(C, O, Mg, Si, Fe, etc:
"metals")
Z 0.02
Observations:Globular clusters are generally metal-poorOpen clusters are generally more metal-richThere is some correlation between age and metallicity in the Galaxy: Older things tend to be more metal-poor, but this is not a rule.Clusters with Z > .001 are metal poor .
http://burro.astr.cwru.edu/Academics/Astr222/Galaxy/Structure/metals.html
Where : Observing Open Clusters in our Galaxy and around our Galaxy
Globular clusters VERY dense… 50,000 to 1M stars in a region < 150 light years diameter. They appear to be orbiting the galactic center in a spherical halo at a typical distance of 60000 lys.
Example: M3 – further away than the center of our Milky Way 34,000 ly, Absolute Mag = -8 luminousity of 300,000 suns, 8Billion years old

Redder
3000
Because stellar colours and spectral types are roughly correlated , and for Main Sequence stars, we know the Absolute Magnitudes of nearby stars with a degree of precision, we can compute the distances to unknown stars or star clusters using the relationship between apparent visual magnitude m and Absolute Magnitude M.
From a stars spectrum (on the main sequence), we determine its spectral type. This fixes a position on the H-R diagram, from which we can read off its Absolute Magnitude M. From the observed visual magnitude m we compute a distance modulus:
m – M = f(distance in pc) based on
m/M ~2.5 Log (d /(10^2))
We can use a fitting technique for clusters of stars shifting the test cluster up and down along the calibrated sequence .
Here the best fit m – M = 5.5
m – M = 5 log d – 5
Example: 5.5 + 5 = log d
d = antilog (10.5/5) = 10 ^2.1 = 126 pc.
Cluster distances well into the region of globular clusters were made possible by the calibration of variable stars called Cepheid Variables.
Courtesy Introductory Astronomy & Astrophyisics p. 207, 241
Stellar and Cluster Distances – How do we know the distance?
M m
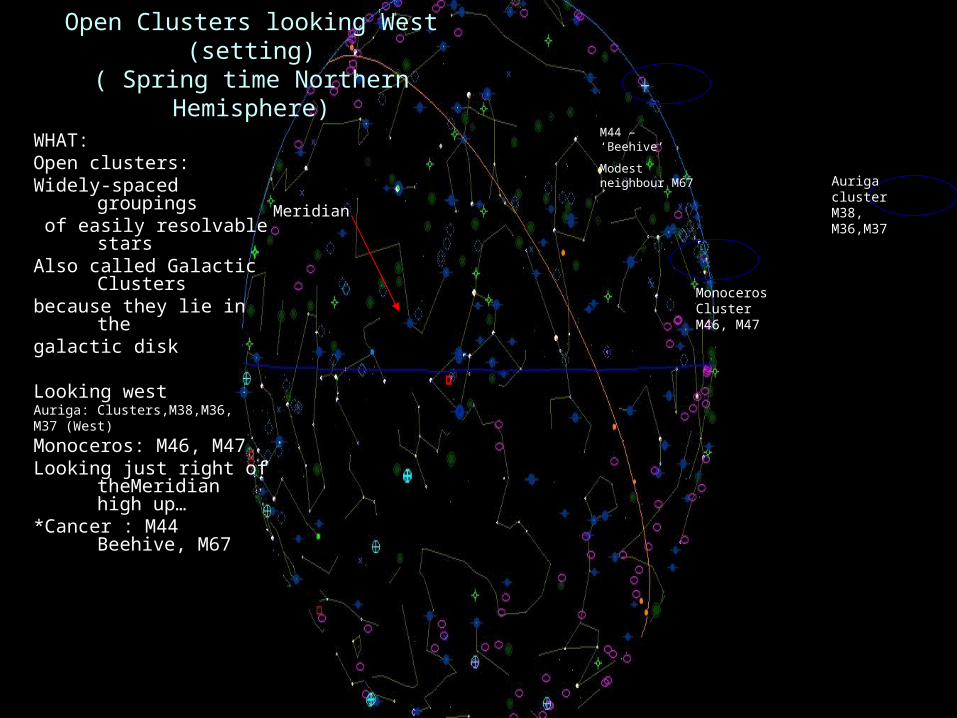
WHAT:Open clusters:Widely-spaced groupings of easily resolvable
starsAlso called Galactic
Clusters because they lie in the galactic disk
Looking westAuriga: Clusters,M38,M36,M37 (West)
Monoceros: M46, M47Looking just right of
theMeridian high up…
*Cancer : M44 Beehive, M67
Meridian
Open Clusters looking West (setting)( Spring time Northern Hemisphere)
Auriga cluster M38, M36,M37
Monoceros Cluster M46, M47
M44 – ‘Beehive’
Modest neighbour M67

Winter (west) Milky Way
From a true, dark sky, nothing can compare to
a naked eye view of the
Milky Way. During the winter months in the Northern Hemisphere, we face
away from the furiously busy
core of our home galaxy and
lookoutward, through its
more tenuous periphery. Despite being more
delicate, this slice of the Milky
Way is still rich with structure. http://www.perezmedia.net/beltofvenus/archives/001397.html
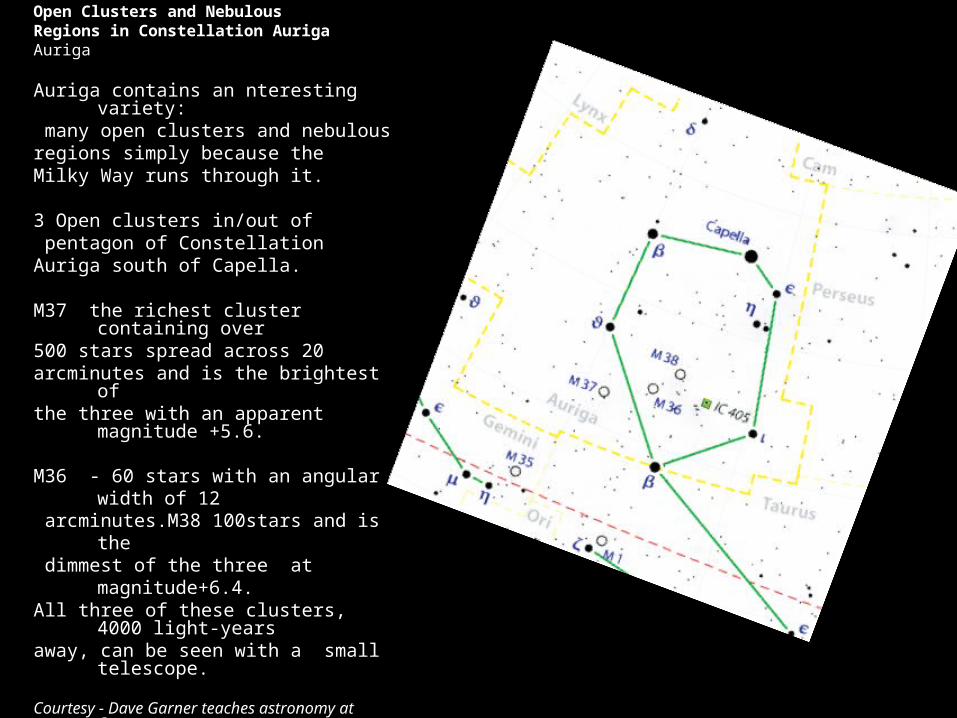
Open Clusters and NebulousRegions in Constellation AurigaAuriga
Auriga contains an nteresting variety: many open clusters and nebulous regions simply because the Milky Way runs through it.
3 Open clusters in/out of pentagon of ConstellationAuriga south of Capella.
M37 the richest cluster containing over
500 stars spread across 20 arcminutes and is the brightest ofthe three with an apparent magnitude
+5.6.
M36 - 60 stars with an angular width of 12
arcminutes.M38 100stars and is the dimmest of the three at
magnitude+6.4.All three of these clusters, 4000 light-
yearsaway, can be seen with a small
telescope.
Courtesy - Dave Garner teaches astronomy at Conestoga
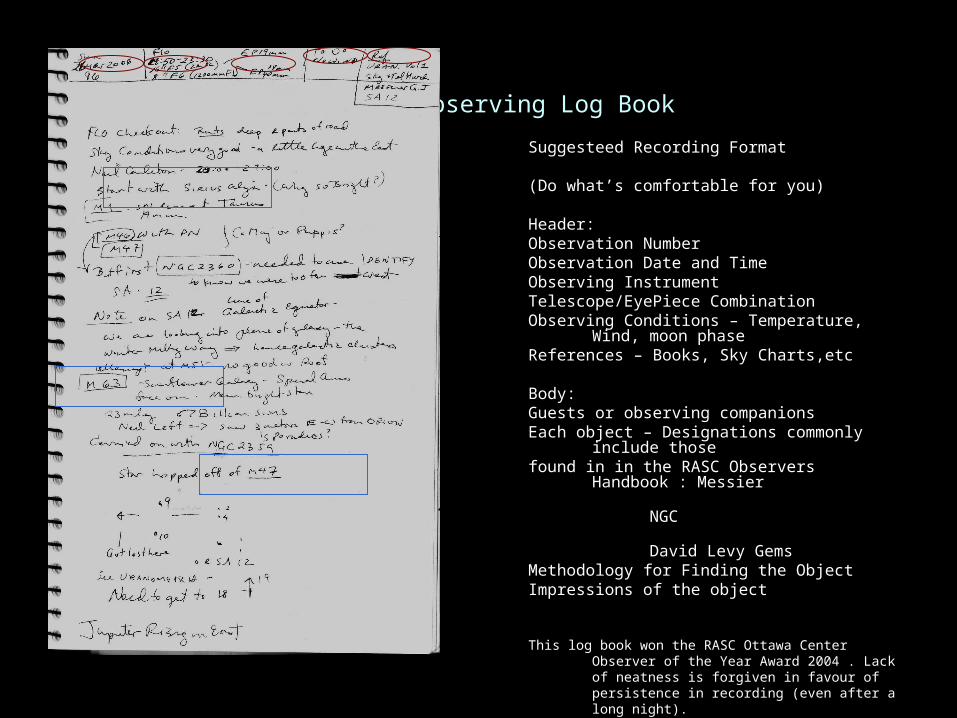
Observing Log Book
Suggesteed Recording Format
(Do what’s comfortable for you)
Header:Observation NumberObservation Date and TimeObserving InstrumentTelescope/EyePiece CombinationObserving Conditions – Temperature, Wind,
moon phaseReferences – Books, Sky Charts,etc
Body:Guests or observing companionsEach object – Designations commonly include
thosefound in in the RASC Observers Handbook :
Messier NGC David Levy GemsMethodology for Finding the ObjectImpressions of the object
This log book won the RASC Ottawa Center Observer of the Year Award 2004 . Lack of neatness is forgiven in favour of persistence in recording (even after a long night).

Introduction to Star Cluster Observing
What’s up ? Is the Moon up? Where’s our meridian?What can we see when the Moon is up…
For clusters of stars, or specialnebulous stellar bodies, or galaxies, the moon , like light pollution obscures the photons emitted from these objects.
Where’s our meridian?Galaxies galore coming up
close to our local meridian…Open Clusters setting in the
West…Globular Clusters in the East

First Quarter Moon in the West – Waxing Crescent – sets after midnight!
This makes it difficult to see Deep Sky Objects because they are awash in moonlight. However, we can now turn our attention to the Moon at First Quarter… one of the best times to make observations as Stephen Collie will explain…
When the Moon is UP!
Now go do the Lunar Observing Exercise!

Conserving NightSky Environment -> Solutions
This is a canadian video describing what to do to stop light ing up the night. You can download
this:http://millstone.typepad.com/files/dark-sky-campus.mp4
Milky way only visible wth moderately dark skiesFaint objects like clusters of stars, and even galaxies can be naked eye objects with very dark skies not even visible in a telescope from moderately dark skies.
When we are in the phase of the moon from First Quarter to Full moon, we can see how much light (even natural light) can obscure the fainter celestial objects
Good Neighbour Lighting
Shielded lighting directs light towards buildings and ground, on the surface not in the sky. No glare. Like using a lampshade outdoors as well as indoors.
Light goes where it is needed reducing electricity by 30% for the same results
Flat glass fixtures also good because the bulb is recessedMississippi Mills By-law for Outdoor IlluminationLight pollution abatement Conservation of the night sky

GOOD NEIGHBOUR LIGHTING = SHIELDED LIGHTS
Simple solution – no up-lighting, sky is protected, ground surface visible
Flat Glass Cobra Street light
Shielded lights – like lampshades – no bulb exposed

Observing Brightness and Size of objects:Given a dark location reasonably free of unshielded lighting (referred to as "light pollution"), this scale describes what is shown when you query ECU about visual magnitudes:
http://www.mpas.asn.au/MembersInfo/viewing/smohr/ApparentMag/ApparentMag.htm

Magnitudes on a Sky Chart
and in the sky…
So that when we see Mars is at magnitude -0.2 with anangular width of 10.7” we know, it’s bright, and can be seen in binoculars , but better yet in a telescope.Image courtesy Rolf Meier - RASC
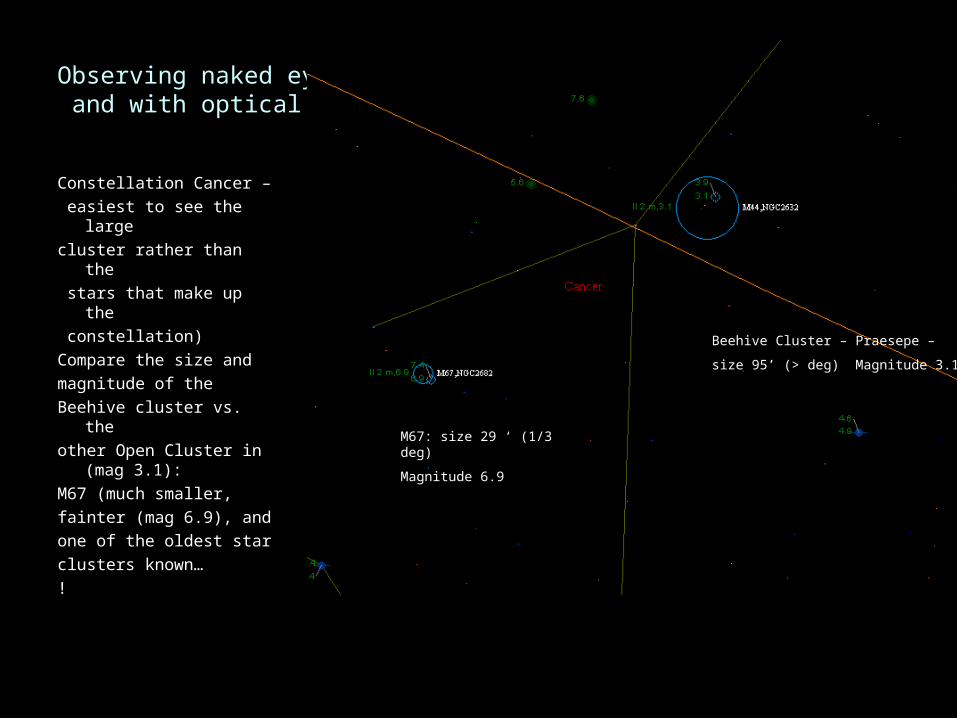
Observing naked eye and with optical aids…
Constellation Cancer – easiest to see the
largecluster rather than the stars that make up the constellation)Compare the size and magnitude of the Beehive cluster vs. the other Open Cluster in
(mag 3.1):M67 (much smaller,fainter (mag 6.9), and one of the oldest starclusters known…!
Beehive Cluster – Praesepe –
size 95’ (> deg) Magnitude 3.1
M67: size 29 ‘ (1/3 deg)
Magnitude 6.9

Observing Tips
Binoculars and Telescopes:
Know your field of view in the binoculars corresponding to the arc-distance in the sky
Know the size (arc-units) and brightness (visual magnitude) of the object you are looking for
Telescopes:
Use a finder or low power eyepiece to find the object relative to its surroundings
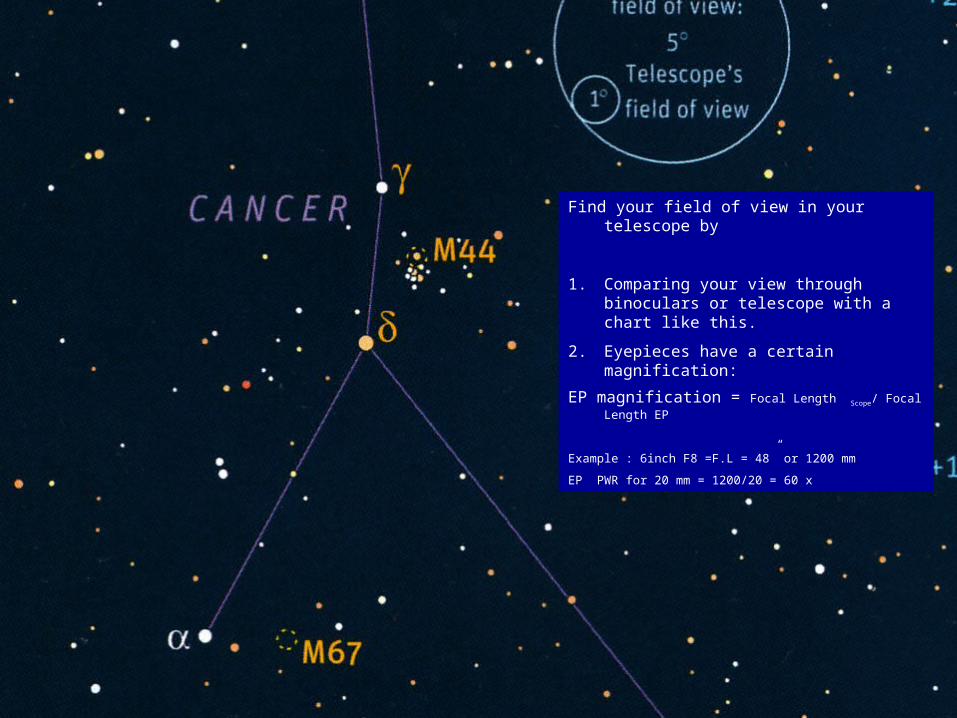
Binocular/Finder vs Telescope Field of View
Find your field of view in your telescope by
1. Comparing your view through binoculars or telescope with a chart like this.
2. Eyepieces have a certain magnification:
EP magnification = Focal Length Scope/ Focal Length EP
Example : 6inch F8 =F.L = 48” or 1200 mm
EP PWR for 20 mm = 1200/20 = 60 x

Distances in the sky are Arc measures
• Use your hand as a scale• Finger: between 1 and 2
degrees– Fist: about 10degrees
– Spread fingers: about 20degrees
– Works for any hand since the bigger the hand, the longer the arm, and the angles are about the same
1-2°
10°
20°The Moon around ½ degThe Pleiades 2-3 deg

Binocular/Finder vs Telescope Field of View
Find your field of view in your telescope by
1. Comparing your view through binoculars or telescope with a chart like this.
2. Eyepieces have a certain magnification:
EP magnification = Focal Length Scope/ Focal Length EP
Example : 6inch F8 =F.L = 48” or 1200 mm
EP mag for 20 mm = 1200/20 = 60 mm
Now go do the OpenCluster exercise
Star Chart Courtesy Sue French:
Celestial Sampler