sprint mechanics evaluation using inertial sensor‐based
TRANSCRIPT

Acc
epte
d A
rtic
le
Article type : Original Article
SPRINT MECHANICS EVALUATION USING INERTIAL SENSOR-BASED TECHNOLO-
GY: A LABORATORY VALIDATION STUDY
Igor Setuain1, 2
, Pablo Lecumberri3, Juha P. Ahtiainen
4, Antti A. Mero
4, Keijo Häkkinen
4, Mikel
Izquierdo1
1.Public University of Navarra. Department of Health Sciences, Tudela, Spain.
2.TDN. Orthopaedic Surgery and Advanced Rehabilitation, Pamplona, Spain.
3.Movalsys Movement analysis solutions, Pamplona, Spain.
4.Neuromuscular Research Center, Biology of Physical Activity, Faculty of Sport and
Health Sciences, University of Jyväskylä, Jyväskylä, Finland
Correspondence Address:
Mikel Izquierdo, PhD.
Department of Health Sciences. Public University of Navarra Av. de Tarazona s/n.
31500 Tudela (Navarra) SP Tel + 34 948 417876 Email:[email protected]
This is the peer reviewed version of the following article: Setuain, I., Lecumberri, P., Ahtiainen, J., Mero, A., Häkkinen, K., & Izquierdo, M. (2018). Sprint mechanics evaluation using inertial sensor-based technology : A laboratory validation study. Scandinavian Journal of Medicine and Science in Sports, 28 (2), 463-472. doi:10.1111/sms.12946, which has been published in final form at https://doi.org/10.1111/sms.12946. This article may be used for non-commercial purposes in accordance with Wiley Terms and Conditions for Use of Self-Archived Versions.

Acc
epte
d A
rtic
le
0,
ABSTRACT
Advances in micro-electromechanical systems have turned magnetic inertial measurement units
(MIMUs) into a suitable tool for vertical jumping biomechanical evaluation. Thus, the presented study
aimed to determine if appropriate reliability and agreement reports could also be obtained when ana-
lysing 20m sprint mechanics. Four bouts of 20 m sprints were evaluated to determine if the data pro-
vided by a MIMU placed at the lumbar spine could reliably assess sprint mechanics and to examine
the validity of the MIMU sensor compared to force plate recordings. Maximal power (P0), force (F0)
and velocity (V0), as well as other mechanical determinants of sprint performance associated with the
Force – Velocity, Power – Velocity and Ratio of Forces – Velocity, such as applied horizontal force
loss (Sfv) and decrease in ratio of forces (Drf), were calculated and compared between instrumenta-
tions. Extremely large to very large correlation levels between MIMU sensor based sprint mechanics
variables and force plate recordings were obtained (mean ± standard deviation, force plate vs. MIMU;
V 8.61±0.85 vs. 8.42 ± 0.69 ; F0, 383 ± 110 vs. 391 ± 103; P0, 873 ± 246 vs. 799 ± 241; Sfv, -44.6 ±
12.7 vs. -46.2 ± 10.7 ), ranging from 0.88 to 0.94, except for Drf, which showed weak to moderate cor-
relation level (r=0.45; -6.32 ± 1.08 vs. -5.76 ± 0.68). Step-averaged force values measured with both
systems were highly correlated (r = 0.88; ), with a regression slope close to the identity (1.01). Bland
& Altman graphical representation showed a not random distribution of measured force values. Final-
ly, very large to extremely large retest correlation coefficients were found for the inter-trial reliability
of MIMU measurements of sprint performance variables (r value ranging from 0.72 to 0.96). There-
fore, MIMUs showed appropriate validity and reliability values for 20-m sprint performance varia-
bles.
Keywords: Sprint Mechanics, Inertial Unit, Validation, Biomechanics

Acc
epte
d A
rtic
le
INTRODUCTION
Sprinting performance is a key component of many training routines in numerous sport disci-
plines and conditioning programs (1). Moreover, in the last 30 years, many high speed athletic tasks
have been implemented by athletic coaches to maximize performance in explosive activities (2). In
the field of sports science, sprint mechanics have been widely studied, focusing on putting some light
into several concerns related to the adaptations of the human body to exercise and to describe basic
movement patterns (3). To this end, direct mechanics-based procedures have been traditionally em-
ployed to estimate the center of mass displacement and to detail the biomechanics during sprinting
and jumping tasks (3;4). In this context, the force-velocity (F – v) and power-velocity (P – v) relation-
ships have been used during the last decades to describe the runner’s capability to produce horizontal
external force during the sprint (3;5;6). In the case of sprint running and other multijoint lower limb
movements, these relationships have been found to be linear and parabolic, respectively. Therefore,
they can be characterized by a small number of parameters such as: The theoretical maximal horizon-
tal force the runner can apply at zero velocity ( ), velocity for zero horizontal force ( ), maximum
power developed by the runner ( ), rate of loss of horizontal force ( ) and rate of decrease of ratio
of forces ( ). In practice, these parameters are determined from the linear or parabolic fit of meas-
ured data and in turn can help coaches and physiotherapists to decide on the most appropriate training
action.
Several technological procedures and methodological approaches have historically been used
for sprint mechanics description in humans; including 6- to 10-m force plates indoors (5;6), electro-
myography (7), instrumented treadmills (8;9) and the more recently developed radar systems (9). All
but the last approaches require a considerable financial investment and highly trained staff familiar-
ized with such laboratory-derived procedures. Consequently, radar systems constitute a relevant and
valuable contribution to the field since they provided the means to describe for the first time an ath-
lete’s velocity-by-time curve when sprinting in real training conditions. This innovation has enabled
more researchers and clinicians to measure certain biomechanical variables without resorting to time

Acc
epte
d A
rtic
leconsuming and expensive equipment-based sprint mechanics analysis. However, although radar sys-
tems have shown very high correlation levels with respect to ground reaction horizontal forces record-
ings from force plate systems, they calculate such forces from time by distance derived variables. It is
also likely that inter-step variability is not detectable by the current technologies and proposed meth-
ods as the models gives the average tendency of change in ground reaction forces components with
time of both limbs.
The most recent advances in micro-electromechanical systems have made magnetic inertial
measurement units (MIMUs) a robust and reliable tool for sports motion analysis in the fields of per-
formance evaluation (10) and injury rehabilitation and prevention (11). A possible major advantage of
MIMUs compared to force plate-based procedures is that MIMUs enable non-conditioned foot land-
ing and outdoor testing, thereby allowing functional and unplanned movement analyses both in a la-
boratory and field conditions.
In this context, the purposes of the present study were (1) to examine the validity of MIMUs
compared to force plate platform recordings when evaluating force – velocity relationship of the
sprint mechanics and (2) to determine whether the data provided by a MIMU placed at the lumbar
spine could reliably assess this sprint mechanics related variables such as V0, F0, P0, Sdf and Drf. The
study hypothesis was that the proposed method would provide robust agreement between MIMUs and
force plate recordings as well as acceptable reliability when evaluating sprint mechanics based on
direct mechanics procedures. Due to the involvement of sprint performance in training and condition-
ing, the population of interest range from recreational runners to elite sprinters. Therefore, MIMUs
should exhibit high reliability and agreement for a wide range of performance variables values.

Acc
epte
d A
rtic
le
The terms “reliability” and “agreement” have been given different meanings in the literature,
and often used interchangeably. In this work we adhere to what is customary in sports measurements
analysis and take “reliability” as repeatability (12) or intrarater agreement (16) and “agreement" as
reproducibility (12) or interrater agreement (16).
Materials and methods
Participants:
A validation study design was adopted. Several approaches can be used to estimate the optimal sam-
ple size. We adopted the methodology suggested in (12) based on the anticipated intraclass correlation
coefficient (ICC) value and 95% confidence interval (CI) width. For a target, ICC of 0.9 with a 95%
CI of 0.2, the minimum number of subjects is 15. Sixteen recreational runners volunteered to partici-
pate in this study: eight men (mean ± standard deviation; age: 31.5 ± 6.3 years; body mass 78.3 ± 13.0
kg; height 1.77 ± 0.07 m) and eight women (age: 26.1 ± 4.4 years; weight: 59.8 ± 8.0 kg; height:
166.3 ± 7.4 cm). The mean running experience and training frequency of the participants were 7.9 ±
5.0 years and 3.7 ± 1.7 days weekly, respectively.
The previous and current injury records of the participants at the time of testing is summa-
rized in Table1.
The experiment was carried out in a biomechanics laboratory. The participants performed a sprint test
battery of 20-m maximal sprint runs. All measurements were acquired by the same team (IG, PL and
MI).

Acc
epte
d A
rtic
leInstrumentation:
Participants were equipped with a micro-electromechanical system (MIMU) (MTx, 3DOF
Human Orientation Tracker, Xsens Technologies B.V. Enschede, Netherlands). The MIMU was at-
tached over the L4- L5 region of the subject’s lumbar spine, where the human´s centre of mass is con-
sidered to be located in (13). A technical explanation of the MIMU-derived analysed variables has
been previously provided (14). The trials were simultaneously recorded by the MIMU and by a 10-m-
long force platform system (custom build, force transducers manufactured by Raute Precision, Lahti,
Finland). Ground reaction forces were recorded by Signal 4.04 software (Cambridge Electronic De-
sign, UK). Furthermore, three photocells gates (Newtest, Oulu, Finland) were positioned along the
force plate length at 0.5, 5.5 and 10.5 m from its edge. Synchronization of all systems was achieved
by means of two pulse signals present at different channels of the force platform A/D converter (Pow-
er1401, Cambridge Electronic Design, UK) with a sampling frequency of 1000 Hz. A manual trigger
produced a rising-edge pulse which started the MIMU measurement and the first photocell triggered
another pulse when light was obstructed. These signals were processed to obtain the split times for
each cell position. In order to reduce errors related to the integration process, the highest sampling
rate for data recording was selected for both instruments: 1000 Hz for the force platform and 120 Hz
for the MIMU. Before each trial, the participants were asked to assume a vertical posture during the
calibration process for both instrumentations.
Procedures:
The testing procedure comprised the execution of several maximal sprint bouts. The partici-
pants were asked to execute four 20-m sprint trials; two starting at the edge of the 10-m force plate
hall, and two additional trials starting 10 m away from the force plate. In that manner, the recordings

Acc
epte
d A
rtic
lecontained complete 20-m sprint data and thus, the entire accelerative phase of the sprinting task could
be analyzed. The participants performed a standardized 20-min warm up that included lower leg range
of motion exercises, progressive resistance exercises and running technique maneuvers, before start-
ing the testing protocol. The resting period was 90 seconds between every consecutive running trial.
The validity and reliability of the proposed methods were evaluated using the
performance variables associated with the Force ‒ Velocity ( ), Power ‒ Velocity
( ), and Ratio of Forces ‒ Velocity ( ) relationships previously described by
Samozino et al (9). These performance variables are horizontal force at zero velocity ( ),
velocity for zero horizontal force ( ), maximum power ( ), rate of loss of horizontal force
( ) and rate of decrease of ratio of forces ( ). The procedure for their computation
required the average values of horizontal force ( ), vertical force ( ), resultant force ( )
and velocity for all steps.
Direct mechanics-based procedures were used to estimate the center of mass
displacement and to detail the biomechanics of the sprinting action. Direct mechanics
procedure are based on the description of the subject as a mechanical system and the
estimation of movement and acting forces through the center of mass displacement (4) The
following subsections show the procedures followed to obtain these data from force platform
and MIMU measurements.
The experimental protocol was approved by the ethics committee of the Public University of
Navarra according to the ethical principles of the Declaration of Helsinki. All participants gave their
consent to participate in the experiment after being informed of the aims and risks of the testing pro-
cedures.

Acc
epte
d A
rtic
leForce platform data processing
The force platform signals were low-pass filtered (200-Hz cut-off frequency, third-
order zero-phase Butterworth). The horizontal and vertical components of the ground reaction
force (GRF) in the sagittal plane were provided by the force platform. The resultant force
samples were computed as
. (1)
Initial contact times
To compute the average values in each step, the time of contact must first be determined. A
20-N threshold on the signal was used for this task, except in the case of the initial two of
steps when participants started the sprint on the platform. In this case, as participants were
stepping on the platform, the measured vertical force was equal to their bodyweight before
the actual start of the run. The beginning of the sprint and the second support were estimated
using the acceleration signals provided by the MIMU (see details below).
Velocity computation
The instantaneous horizontal velocity was computed by time-integrating the
horizontal acceleration , where stands for the participant’s mass:
(2)
is the contact time of the first stance on the force platform and is the initial velocity
at that time point. Note that as time-discrete data was being analysed, trapezoidal
approximation was used for the numerical computation of this and subsequent integrals. For

Acc
epte
d A
rtic
lethose sprint bouts starting from the edge of the force platform time and velocity were set as,
and . When the participant’s starting position was located 10 m
away from the edge of the platform, the initial velocity was estimated using an
exponential model fitted to the time data provided by the photoelectric cells (9). Briefly, an
exponential model is assumed for the participant’s velocity,
, (3)
which yields the following expression for displacement:
(4)
The photoelectric cells gave the times it so that ii dtd )( , where id is the distance
from the starting point to the i-th photoelectric cell. This allowed to estimate the parameters
, from equation (4) using least squares minimization. Once these parameters have been
obtained, the initial velocity is computed using equation 3.
MIMU data processing
The MIMU comprises three-axis accelerometers, gyroscopes and magnetometers. The
accelerometers provide acceleration data in a sensor-based reference frame. Its X, Y and Z
axes, aligned with the unit housing, lie along the vertical, medial-lateral and anterior-posterior
directions, respectively, when the participant is at rest in upright position. Note that this
reference frame rotates along with the participant’s torso. The output from the MIMU sensors
is processed on-chip to provide orientation data (i.e., the time-dependent rotation of the
sensor-based reference frame around an Earth-fixed reference frame). The latter has a
positive Z direction that points upwards on the vertical, and the X and Y axes lie on the
horizontal plane with the positive X direction pointing towards the magnetic north pole. Note

Acc
epte
d A
rtic
le
acc
that neither reference frame is aligned with the direction of the sprint; this direction must be
estimated from measurement data, as explained below.
The orientation data provided by the MIMU allows the computation of the
instantaneous angle between the sensor´s Z axis (anterior-posterior direction) and the Earth-
fixed reference frame X axis on the horizontal plane. This effectively indicates the heading of
the participant within a fixed reference frame at each time instant. The signals from the
MIMU and the force platform were time-synchronized, so the initial contact times found
from the vertical GRF could be readily translated to the acceleration and orientation signals.
The direction of the sprint was estimated as the participants’ average heading during his or
her last four steps on the force platform. Figure 1 shows the range of the heading of a
participant’s torso, that is, the directions the MIMU’s Z axis is pointing to, during these last
four steps, as well as its mean. Once this direction was found, a track-fixed reference frame
was defined with its positive Y axis aligned with the running direction and its Z axis pointing
upwards on the vertical direction. Henceforth all acceleration signals are expressed in this
reference frame.
Initial contact times
For the validity study, only the steps performed on the force platform were
considered. Therefore, the initial contact times were accurately estimated from the vertical
GRF signal as explained above, with the exception of the first pair of steps at the beginning
of the sprint. In this case, and for all steps in the reliability study, the initial contact times
were derived from the acceleration signals as follows: The first time the horizontal forward
eleration exceeded 3 m/s2 marked the beginning of the sprint. The joint plots of vertical

Acc
epte
d A
rtic
leGRF and accelerations (Figure 2) show that the vertical acceleration of the centre of mass
(CM) rises above the gravity acceleration value well after the initial contact time. Around this
time, a noticeable drop in forward acceleration occurs, corresponding to the breaking forces
produced at the beginning of the stance phase of the sprint action. The peak in forward
acceleration preceding this drop was used to determine the initial contact time for subsequent
supports (Figure 2).
Velocity computation
The horizontal velocity signal was found by integrating the acceleration component in
the direction of the sprint.
(5)
Note that unlike velocity computed from GRF, the lower limit of the integral is always
0 s, since the acceleration of the CM was recorded from the beginning of the sprint. Similarly,
the distance covered by the participant was found by integrating the velocity signal:
(6)
Small bias and integration errors accumulate and cause a noticeable drift in velocity
and distance that render their values useless after a few seconds. The split times provided by
the photoelectric cells at 0.5, 5 and 10 m for the first measurement protocol (starting at the
edge of the force platform) and at 10, 15 and 20 m for the second measurement protocol were
used to correct the drift effect. A least squares fit was used to estimate the bias in the
acceleration for the position signals in order to reach those distances at the designated times.
Velocity was then computed again based on the corrected acceleration (5). The split times at
0.5, 5, and 10 m for the sprints starting at the edge of the force platform were 0.35 ± 0.10,

Acc
epte
d A
rtic
le
1.67 ± 0.10 and 2.48 ± 0.13 s, respectively. When the participants began their sprint 10 m
from the force platform, the split times at 10, 15 and 20 m were 2.46 ± 0.18, 3.18 ± 0.22, 3.87
± 0.25 s, respectively. These distances and split times were used to adjust the bias of the
measured acceleration as described above. The r coefficient for the distance computed from
the corrected acceleration and position of the photoelectric cells exceeded 0.99 in all trials.
The instantaneous horizontal and vertical GRF force components were taken as the
product of the instantaneous CM acceleration of each component and the participant’s mass:
,
Common procedures
Once instantaneous forces and velocity signals were obtained, the variables used for
the validity and repeatability assessment could be computed. This section describes the
procedures used for both force platform and MIMU data. First, the instantaneous power
output is obtained as the product of and .
(7)
The average values of , , , , produced in each step are required to
estimate the F – v, P – v, and RF – v relationships:
, (8)
where denotes the average value of variable for the i-th step. The number of steps
considered is and is the initial contact time of the i-th step.
The ratio of force application at each step was computed as the quotient of the average
horizontal force and the average resultant force:
(9)

Acc
epte
d A
rtic
leA linear model for the relation between step-averaged horizontal force and
velocity values was obtained using least squares fitting. From this model, the theoretical ,
(force at zero velocity), and , (velocity at zero force), values were computed. The rate of
the applied force loss with increasing velocity was given by the slope of the model .
(10)
Least squares fitting was used to find out a linear model for the relationship.
The slope of the linear model, , was used to quantify the decrease in force ratio at
increasing velocity. All the detailed calculations were previously published by Samozino et al
(9) in relation to sprint mechanics analysis.
A second-order polynomial curve passing through the origin was fitted to the ( , )
data to estimate the parameters of the relationship. is taken as the maximum value
of the curve. This fitting procedures have also been wide reported in sprint mechanics
analysis previously(9).
Statistical analysis
Validity study
The proposed method was compared to the force platform by comparing the force
(average value of , , in each step) and performance variables ( , , , , )
measured with both instrumentations. First, the correlation between both measures for each
variable was assessed by using a linear regression model. Note that Pearson’s correlation
coefficient is not suitable for assessing agreement between measurements. Lin’s concordance
correlation coefficient, on the other hand, takes into account how close is the best linear fit to
the identity line and so it can be used as a measure of agreement. The following regression
parameters are reported: mean value of the variable (± standard deviation), slope (95%

Acc
epte
d A
rtic
le
confidence interval), typical estimation error, Pearson’s correlation coefficient (95%
confidence interval) and Lin’s concordance correlation coefficient (95% confidence interval).
The agreement levels between the variables obtained with both methods were
assessed using the change in the mean, typical measurement error and agreement limits.
Bland and Altman plots were created to check the dependency of the differences with respect
to the average of both measures. A regression analysis was performed to report the statistical
significance of linear relationships and check for systematic bias of the analysed values from
both instrumentations. The slope of the linear model (95% confidence interval) is reported.
Finally, the relative error for each performance variable was computed:
, (11)
where and denote the values of the variable obtained from MIMU and force
platform data, respectively. The mean relative error across subjects (± SD) is reported.
Correlation coefficients are interpreted in accordance with the scale of magnitude
proposed by Hopkins (15): r ≤ 0.1, trivial; r (0.1, 0.3], small; r (0.3, 0.5], moderate; r
(0.5, 0.7], large; r (0.7, 0.9], very large; r > 0.9, extremely large.
Reliability study
To assess the repeatability of the proposed method, the performance variables
obtained for each participant in two sprint trials were compared. The change in the mean (±
standard deviation) and standard error of measurement (95% confidence interval) were
computed for each variable, along with their limits of agreement. Using the standard error of
measurement (SEM) and the between-subject standard deviation (SDinter), the smallest
worthwhile changes (SWC) can be computed, both intra-individual (SWCintra) and inter-
individual (SWCinter):
(12)

Acc
epte
d A
rtic
le
(13)
Finally, the retest correlation, computed as the intraclass correlation coefficient (95%
confidence interval) is also reported. All data processing and statistical analysis were
performed with a scientific computation software (MatlabR2015a, The Mathworks Inc.,
Natick, MA, 2015).
Results
Validity study
The values of the step-averaged horizontal force, and vertical force, , computed
from the MIMU data matched those measured with the force platform. Their mean values
(standard deviation) for both systems are given in Table 2. The standard errors between
systems were 49.83 ± 19.18 N and 70.05 ± 31.71 N, respectively. The force values measured
with both systems were highly correlated (r = 0.88), with the regression slope close to the
identity (1.01). Consequently, Lin’s concordance is also very large (rc = 0.87). Figure 3
shows the scatter plot for along with the identity line, the estimated regression line and the
estimation ± estimation error curves.
Correlation between the measured points ( , ) and best linear model for each
subject was extremely large in the case of the force platform data (median , range
from to ) and large for the MIMU data (median , range from to ).
In the case of the step-averaged ( , ) points, the correlation between the measurements
and the second-order polynomial model was extremely large (median , range from
to ) and moderate (median , range from to ) for the force
platform and MIMU measurements, respectively. For the relationship, the correlation

Acc
epte
d A
rtic
leattained were extremely large for force platform measurements (median , range from
to ) and large for MIMU measurements (median , range from to
). The performance variables , , , and were derived from the models of the
, and relationships. The parameters of the correlation between the
variables obtained with the force platform and the MIMU are presented in Table 2.
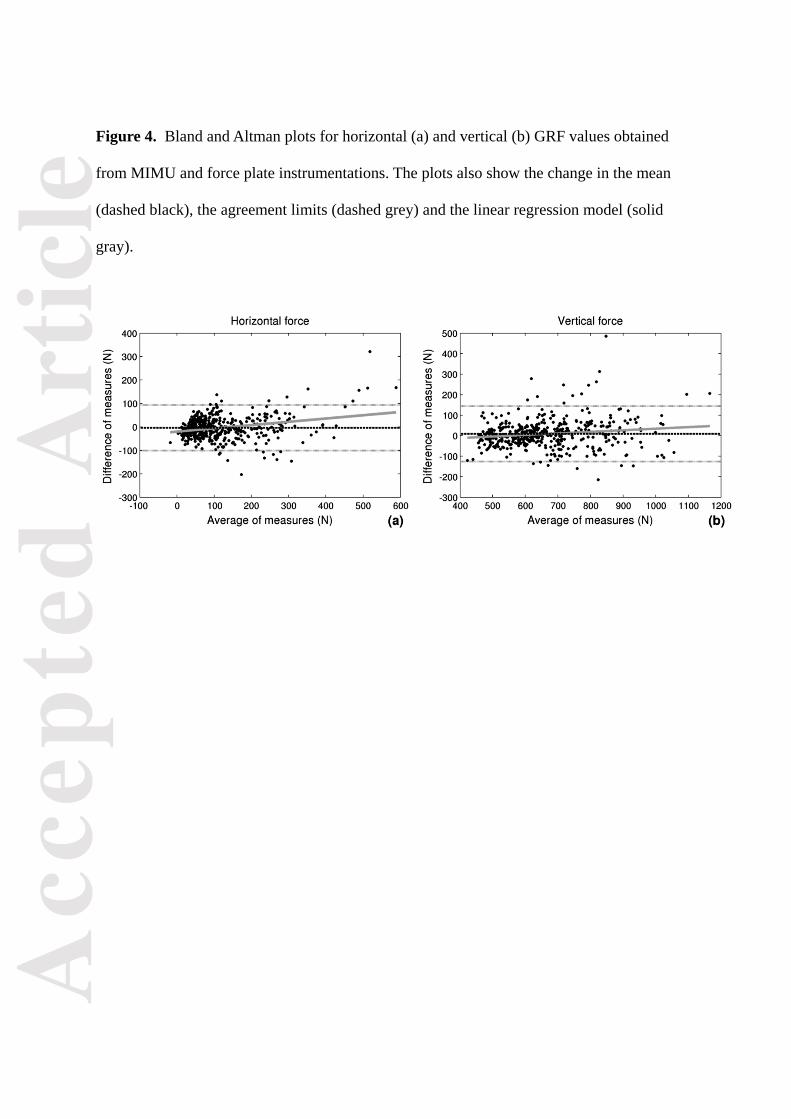
The agreement between both measurement systems is depicted in Table 3. A slope
value different from zero reveals a discrepancy between systems that depends on the
measured value. The only variables showing those discrepancies were ( ) and
( ) values. Their Bland and Altman plots are shown in Figure 4.
Reliability study
Table 4 presents the inter-trial reliability of the performance variables measured with the
MIMU. It includes the change in the mean, the slope of the linear dependency between the
difference in measures and their average value, the typical error of measurement, SWCintra
and SWCinter and the retest correlation coefficient, which was large or extremely large for all
variables.
Discussion
The present study aimed (1) to determine whether the data provided by an inertial sensor unit
placed at the lumbar spine could reliably assess sprint mechanics and (2) to examine the validity of
the magnetic inertial measurement units (MIMU) compared with force plate platform recordings. The
primary findings of this study supported the study hypothesis. A robust level of agreement was found
between the force curve patterns calculated from the MIMU recordings and those provided by a force

Acc
epte
d A
rtic
le
plate during the sprint biomechanical evaluation. Accordingly, the force values measured with both
systems were highly correlated (r = 0.88), with a regression slope close to the identity (1.01). Fur-
thermore, extremely large to very large retest correlation coefficients were found with respect to the
inter-trial reliability of the performance variables measured with the MIMU for the analysed varia-
bles V0, F0, P0, Sfv and Drf.
Several investigations in the last century have focused on sprint mechanics and how the hu-
man body can run faster over time (1;3;18). The inverse relationship between force and velocity dur-
ing sprinting was reported 45 years ago by Cavagna et al. (19). Mero et al. (6) later elucidated the
relationship between the electromyographic activity of the biceps femoris and gastrocnemius muscles
and the resultant GRF during the propulsive phase of the stance phase of sprinting. These investiga-
tions were later corroborated by Weyand et al. (2), who reported that the resultant GRF is more
strongly related to the maximal velocity during a sprint than to the segmental leg movement speed.
More recently, Morin et al. (8) established significant relationships between the eccentric knee flexor
isokinetic peak torque and the horizontal component of the GRF exerted during the propulsive phase
of the stance during the sprint on an instrumented treadmill.
The ratio of forces (RF) has been studied to quantify the runner’s horizontal force application
capacity at increasing velocities (9;20) However, the methods for computing this variable differ
slightly among studies. In the mentioned study of Morin et al. (16), the instantaneous RF was com-
puted at each time instant as the ratio of Fh to the Fres in the sagittal plane. The RF for a step was
thus calculated as the average of the instantaneous ratio during the contact period. In contrast, in a
latter research (9) the RF was computed for a step as the ratio of the average Fh to the average Fres
for the whole step (contact plus aerial phase).

Acc
epte
d A
rtic
leOne of the main difficulties in comparing data from a MIMU placed at the centre of mass
with force platform recordings lies in the registration of the medial-lateral and anterior-posterior
forces acting at this level. These forces include torsion and leaning movements that contribute to the
runner’s dynamic stabilization. This precludes the use of the RF computation method presented in
Morin et al. (20), since the presence of these dissenting forces distorts the instantaneous acting
forces recordings that until recently could only be recorded with force plate devices. Moreover, alt-
hough these forces tend to cancel out during a step period, their contribution to the instantaneous
resultant force does not. Therefore, the method described by Samozino et al. (9) would not have
allowed for a direct comparison between MIMU and force platform RF measurements. To overcome
these difficulties, we computed Fres from the average value of Fh and Fv during the step period.
Moreover, the confluence of forces at the CM level results in greater variability in the Drf ob-
tained from MIMU data. This explains the moderate correlation between the MIMU and force plat-
form measurements of Drf (0.45, p<0.05). Note that the aforementioned forces depend on the run-
ner’s technique and/or ability to apply horizontal GRF during the sprinting action at increasing veloc-
ities. Therefore, the error in Drf may be considerable for some subjects. In fact, the correlation coef-
ficient increased to 0.85 when an outlier was removed from the data pool. Lastly, the higher variabil-
ity of force measurements at the CM level also affects other variables, such as Fh. The number of
steps with low Fh exceeds the number of steps with high Fh, which are performed at the beginning of
the acceleration phase. Hence the high value obtained for the relative error of Fh. Despite these
shortcomings, the relative error of the sprint performance variables remains low. These results, to-
gether with the high retest correlation, suggest that MIMUs can be used reliably to evaluate sprint
performance.
Notably however, force tracking at the CM level in humans during sprinting is a novel contri-
bution of the present research. In this context, the traditionally accepted assumption that the vertical
and horizontal translational motions occurring at the human´s CM level represent the total body mo-

Acc
epte
d A
rtic
letion during running or jumping biomechanics using a force platform could be controversial (4;13;19.
This potential controversy is justified by the assumptions that all body segments execute rotational
and translational motions relative to the CM and that the CM itself also executes non-vertical motions
in the sagittal and lateral directions. These assumptions imply that an additional amount of force at the
trunk level may be underestimated during traditional analyses of sprint mechanics using a direct me-
chanics method based on force plate recordings. In the authors´ opinion, the placement of the MIMU
at the L3-L4 lumbar spine level, where the centre of mass in humans is considered to be located (13),
could allow more comprehensive and between-limb discriminative monitoring of the mechanical be-
haviour of the human body as a whole during sprinting.
Finally, several limitations of the present research should be highlighted. The relatively wide
confidence intervals for some of the variables such as (%/m/s) could have hindered or contami-
nated some of the reported results in some manner. Whether this high reported variability was related
to the measurement device or the variability associated with tracking GRF at the CM level when per-
forming sprinting evaluations should be properly clarified in the future. Furthermore, the overall con-
tribution of the medial-lateral forces to the efficiency of sprint mechanics should be the main focus of
an appropriately designed investigation in the future.
The error in the force measurements increases with force value. This can be observed in the
correlation plot for Fh (Figure 1) and the Bland and Altman plots (Figure 4). In fact, the data points in
the Bland and Altman plot show a trend towards greater differences with increasing force values. This
could imply that this methodology is best suited for athletes with low acceleration values. Another
hypothesis is that the CM is moved abruptly during the first steps until a convenient running pose is
adopted. This movement is the results of forces that are reflected in the measured CM acceleration but
not on the GRF. This explains the higher values of forces measured with the MIMU during the first
steps, which are the steps with the highest horizontal force values. Further analysis is required to test
this hypothesis.

Acc
epte
d A
rtic
le
Pe
The participants were recreational runners with different training frequencies. This sample
does not adequately represent the whole population of interest, which include professional athletes
and elite sprinters. Moreover, it remains unclear how a better running technique could affect inter-
limb distinction, which is facilitated by the measured torso rotation.This study focuses in the valida-
tion of MIMUs as a tool for assessing sprint performance. The placement of the unit on the center of
mass is fast and convenient, but also favours the recording of concomitant forces which increase the
variance of single step variables. Therefore, if a step by step analysis is required, alternative locations
from the MIMU where dissenting forces are minimized, such as ankle or instep, should be considered.
In summary, the novel method proposed for evaluating sprint mechanics using the MIMU
system could help to improve the functional assessments routinely conducted on the field by both
medical staff and performance coaches by providing a tool that is less expensive and more widely
applicable than conventional high-cost, laboratory-based technologies. In the current research, the
price of a single MIMU approaches the amount of 1,500 Euros, whereas the entire 10m force plate
hall setting measurement composed by 10 force plate units is calculated to be around ten times
more.
From the practical point of view, the MIMU-based sprint mechanics analysis performed on
the training field was shown to be a sensitive tool for evaluating several biomechanical variables re-
lated to force-by-velocity profiles in recreational runners.
rspectives
The results of this study provide a new methodology based on MIMU system that would
measure not only force-velocity profiles, but also trunk orientation information as well as average
tendency of change in ground reaction forces components with time of both limbs (i.e. inter-step vari-
ability). This approach could be of great interest for coaches when tracking the sprint mechanics pro-
file in order to improve performance of the athletes in the training court itself. Contact interval detec-
Acc
epte
d A
rtic
le
tion form acceleration signals is performed by visual inspection in this study. Once automated, the
procedures described could be readily implemented into a usable coaching system.
As far as the authors know, until nowadays, it has not been published any article focusing on
the mechanical description of the sprinting action through the use of a MIMU systems. However,
other technologies have been employed in relation to this issue. For example, regarding hamstring
strain injuries in football Brughelli et al. (21) and Mendiguchia et al. (22) performed indirect estima-
tions of the center of mass´ behavior during sprinting. Brughelli et al (21) used a non-motorized force
treadmill, whereas Mendiguchia et al (22 measured mechanical properties during sprinting with a
radar device. Furthermore, the former employed a direct mechanics approach for CM identification
but registered the ground reaction force at the ground level, whereas the latter estimated acceleration
and thus, the acting horizontal forces via linear horizontal velocity recordings.
In the present research, an IU situated on the presumed human body center of mass was em-
ployed. Thus, the three different instrumentations with different measuring validity and reliability
indexes, might have contributed to the existence of the reported differences. Notably however, in the
author’s opinion, force tracking at the CM level in humans during sprinting is a novel contribution of
the present research.
Further research is warranted to clarify whether the proposed methodology could result in a
sensitive tool for monitoring horizontal GRH during sprinting over the course of the hamstring strain
injury rehabilitation process.
Conflict of interest statement
The authors have no conflicts of interest to declare concerning the contents of this manuscript.

Acc
epte
d A
rtic
le
Acknowledgments
The authors would like to thank Eder Bikandi and Saioa Etxaeku for their contribution on appropriate
editing of this manuscript.
Reference List
(1) Korhonen MT, Mero AA, Alen M, Sipila S, Hakkinen K, Liikavainio T, et al.
Biomechanical and skeletal muscle determinants of maximum running speed with
aging. Med Sci Sports Exerc 2009 Apr;41(4):844-56.
(2) Weyand PG, Sternlight DB, Bellizzi MJ, Wright S. Faster top running speeds are
achieved with greater ground forces not more rapid leg movements. J Appl Physiol
(1985 ) 2000 Nov;89(5):1991-9.
(3) Rabita G, Dorel S, Slawinski J, Saez-de-Villarreal E, Couturier A, Samozino P, et al.
Sprint mechanics in world-class athletes: a new insight into the limits of human
locomotion. Scand J Med Sci Sports 2015 Oct;25(5):583-94.
(4) Hatze H. Validity and Reliability of Methods for Testing Vertical Jumping Performance.
Journal of Applied Biomechanics 1998;14:127-40.
(5) Bezodis IN, Kerwin DG, Salo AI. Lower-limb mechanics during the support phase of
maximum-velocity sprint running. Med Sci Sports Exerc 2008 Apr;40(4):707-15.
(6) Mero A, Komi PV. Electromyographic activity in sprinting at speeds ranging from sub-
maximal to supra-maximal. Med Sci Sports Exerc 1987 Jun;19(3):266-74.
(7) Heiderscheit BC, Hoerth DM, Chumanov ES, Swanson SC, Thelen BJ, Thelen DG.
Identifying the time of occurrence of a hamstring strain injury during treadmill
running: a case study. Clin Biomech (Bristol , Avon ) 2005 Dec;20(10):1072-8.
(8) Morin JB, Gimenez P, Edouard P, Arnal P, Jimenez-Reyes P, Samozino P, et al. Sprint
Acceleration Mechanics: The Major Role of Hamstrings in Horizontal Force
Production. Front Physiol 2015;6:404.
(9) Samozino P, Rabita G, Dorel S, Slawinski J, Peyrot N, Saez d, V, et al. A simple method
for measuring power, force, velocity properties, and mechanical effectiveness in sprint
running. Scand J Med Sci Sports 2016 Jun;26(6):648-58.
(10) Setuain I, Martinikorena J, Gonzalez-Izal M, Martinez-Ramirez A, Gomez M, Alfaro-
Adrian J, et al. Vertical jumping biomechanical evaluation through the use of an
inertial sensor-based technology. J Sports Sci 2016;34(9):843-51.

Acc
epte
d A
rtic
le(11) Setuain I, Millor N, Gonzalez-Izal M, Gorostiaga EM, Gomez M, Alfaro-Adrian J, et al.
Biomechanical jumping differences among elite female handball players with and
without previous anterior cruciate ligament reconstruction: a novel inertial sensor unit
study. Sports Biomech 2015 Sep;14(3):323-39.
(12) Watson PF, Petrie A. Method agreement analysis: a review of correct methodology.
Theriogenology. 2010 Jun;73(9):1167-79. doi: 10.1016/j.theriogenology.2010.01.003.
Review.
(13) Linthorne NP. Analysis of standing vertical jumps using a force platform. American
Journal
of Physics 2001;69(11):1198-204.
(14) Millor N, Lecumberri P, Gomez M, Martinez-Ramirez A, Izquierdo M. An evaluation of
the
30-s chair stand test in older adults: frailty detection based on kinematic parameters
from a
single inertial unit. J Neuroeng Rehabil 2013;10:86.
(15) Hopkins, W.G., Marshall, S.W., Batterham, A.M., and Hanin, J. (2009). Progressive
statistics
for studies in sports medicine and exercise science. Medicine and science in sports and
exercise 41(1), 3-13. doi: 10.1249/mss.0b013e31818cb278.
(16) Kottner J, Audigé L, Brorson S, Donner A, Gajewski BJ, Hróbjartsson A, Roberts C,
Shoukri
M, Streiner DL. Guidelines for Reporting Reliability and Agreement Studies (GRRAS)
were
proposed. J Clin Epidemiol. 2011 Jan;64(1):96-106. doi:
10.1016/j.jclinepi.2010.03.002.
Epub 2010 Jun 17.
(17) Mokkink LB, Terwee CB, Gibbons E, Stratford PW, Alonso J, Patrick DL, Knol DL,
Bouter
LM, de Vet HC. Inter-rater agreement and reliability of the COSMIN (COnsensus-based
Standards for the selection of health status Measurement Instruments) checklist. BMC
Med
Res Methodol. 2010 Sep 22;10:82. doi: 10.1186/1471-2288-10-82.

Acc
epte
d A
rtic
le
(18) Thelen DG, Chumanov ES, Hoerth DM, Best TM, Swanson SC, Li L, et al. Hamstring
muscle kinematics during treadmill sprinting. Med Sci Sports Exerc 2005
Jan;37(1):108-14.
(19) Cavagna GA, Komarek L, Mazzoleni S. The mechanics of sprint running. J Physiol 1971
Sep;217(3):709-21.
(20) Morin JB, Edouard P, Samozino P. Technical ability of force application as a determinant
factor of sprint performance. Med Sci Sports Exerc 2011 Sep;43(9):1680-8.
(21) Brughelli, M; Cronin, J; Mendiguchia, J; Kinsella, D; Nosaka, K.( 2010). Contralateral
leg
deficits in kinetic and kinematic variables during running in Australian rules football
players
with previous hamstring injuries. J Strength Cond Res; 24, 2539-2544.
(22) Mendiguchia, J; Edouard, P; Samozino, P; Brughelli, M; Cross, M; Ross, A; Gill, N;
Morin
J.Bl.(2016). Field monitoring of sprinting power-force-velocity profile before, during and
after
hamstring injury: two case reports. J Sports Sci; 34, 535-541.

Acc
epte
d A
rtic
leTable1. Previous injury reports among participants
subject previous injury record current injury
2 3 ACL recontructions (last 2009)
4 1 ACL reconstruction
5 1 ankle sprain
7 2 ACL reconstructions (billateral) 2007,2009
9 1 anke fracture (2003)
11 1 ankle tendinopathy
12 Achilles tendinopathy
14 Medial tibial stress sindrome

Acc
epte
dA
rtic
le
Table 2. Correlation values between the variables obtained with the force platform
and the MIMU. Units for the typical estimation error and mean values are given after the
name of the variable,
Variable Force plate
measurement
MIMU
measurement
Slope (95%
confidence
interval)
Typical
estimation
error
Pcarson’s
correlation
coefficient (95%
confidence
interval)
Lin’s
concordance
correlation
coefficient
(95 %
confidence
interval)
(N) 119 ± 92 116 ± 105 1.01
(0.95, 1.05) 49.56
0.88
(0.86, 0.90)
0.87
(0.87, 0.87)
(N) 661 ± 135 670 ± 145 0.94
(0.90, 0.99) 68.82
0.88
(0.86, 0.90)
0.88
(0.88, 0.88)
(N) 383 ± 110 391 ± 103 0.91
(0.78, 1.04) 25.44
0.97
(0.92, 0.99)
0.97
(0.96, 0.98)
(m/s) 8.61 ± 0.85 8.42 ± 0.69 0.65
(0.37, 0.94) 0.44
0.81
(0.5, 0.93)
0.76
(0.71, 0.81)
(W) 873 ± 246 799 ± 241 0.93
(0.73, 1.11) 85.16
0.94
(0.84, 0.98)
0.90
(0.88, 0.91)
(N/m/s) -44.6 ± 12.7 -46.2 ± 10.70.81
(0.65, 0.96) 3.53
0.95
(0.86, 0.98)
0.93
(0.91, 0.94)
(%/m/s) -6.32 ± 1.08 -5.76 ± 0.680.28
(-0.06, 0.62) 0.66
0.45
(-0.09, 0.78)
0.33
(0.26, 0.41)

Acc
epte
d A
rtic
leTable 3. Agreement levels between MIMU and force plates for the sprint mechanics
analyzed variables
Variable
Change in
the mean
Slope (95%
confidence interval)
Typical
measurement
error
Agreement limits
Relative error
(%)
(N) -3.93 0.14 (0.09, 0.19) 34.96 -100.84 – 92.98 45.29 ± 54.98
(N)
8.90 0.08 (0.03, 0.12) 48.82 -126.45 – 144.24 7.27 ± 7.97
(N) 7.60 -0.07 (-0.21, 0.07) 25.44 -42.68 – 57.89 5.24 ± 3.24
(m/s) -0.19 -0.23 (-0.62, 0.16) 0.36 -1.28 – 0.80 3.35 ± 4.07
(W) -75.12 0.02 (-0.22, 0.18) 57.40 -234.22 – 83.98 10.46 ± 7.46
(N/m/s) -1.63 0.17 (-0.36, 0.02) 2.89 -9.64 – 6.39 7.24 ± 7.10
(%/m/s) 0.56 -0.61 (-1.30, 0.08) 0.70 -1.38 – 2.50 11.53 ± 11.02

Acc
epte
d A
rtic
le
Table 4. Reliability results for MIMU measurements.
Variable
Change
in the
mean
Slope (95%
confidence
interval)
Typical
measurement
error
Agreement
limits SWCintra SWCinter
Intraclass
correlation
coefficient
(95%
confidence
interval)
(N) -17.80-0.21
(-0.40 -0.01) 28.74
-97.46 –
61.848.62 23.14
0.93
(0.79, 0.98)
(m/s) -0.030.31
(0.03, 0.60) 0.20
-0.58 –
0.510.06 0.11
0.88
(0.65, 0.96)
(W) -35.05
-0.20
(-0.35, -
0.05)
50.54 -175.15 –
105.0415.16 47.32
0.95
(0.83, 0.98)
(N/m/s)
1.83 -0.26
(-0.52, 0.01) 4.03
-9.34 –
13.011.21 2.50
0.89
(0.70, 0.97)
(%/m/s)
0.16 0.32
(-0.25, 0.89) 0.79
-2.03 –
2.360.24 0.27
0.66
(0.20, 0.88)

Acc
epte
d A
rtic
leFigure 1. Range of torso heading (grey area) with respect to the Earth-fixed reference
frame during the last four steps for one participant. Direction of sprint (dark grey arrow) is
estimated as the mean heading.

Acc
epte
d A
rtic
leFigure 2. Vertical GRF (grey), CM vertical acceleration (dashed black) and CM
horizontal acceleration (solid black) during three consecutive steps.

Acc
epte
d A
rtic
le
Figure 3. Scatter plot for along with the identity line (grey), the estimated
regression line (solid black) and the estimation ± estimation error curves (dashed black).
Acc
epte
d A
rtic
leFigure 4. Bland and Altman plots for horizontal (a) and vertical (b) GRF values obtained
from MIMU and force plate instrumentations. The plots also show the change in the mean
(dashed black), the agreement limits (dashed grey) and the linear regression model (solid
gray).