sprite discharges on venus and jupiter-like planets: a
TRANSCRIPT

Sprite discharges on Venus and Jupiter-like planets:a laboratory investigation
D. Dubrovin1, S. Nijdam2, E.M. van Veldhuizen2,U. Ebert2,3, Y. Yair4, C. Price1
1 Tel-Aviv University, Tel-Aviv 69978, Israel,2 Department of Physics, Eindhoven University of Technology,
P.O.Box 513, 5600MB Eindhoven, The Netherlands,3 Centrum Wiskunde & Informatica (CWI), P.O.Box 94079,
1090GB Amsterdam, The Netherlands,4 The Open University of Israel, Ra’anana 43107, Israel.
Accepted for publication inJournal of Geophysical Research - Space Physics,
Special Section related to the Chapman Conference on theEffects of Thunderstorms and Lightning in the Upper Atmosphere
30 December 2009
arX
iv:1
003.
0207
v1 [
phys
ics.
ao-p
h] 2
8 Fe
b 20
10

Abstract
Large sprite discharges at high atmospheric altitudes have been foundto be physically similar to small streamer discharges in air at sea leveldensity. Based on this understanding, we investigate possible sprite dis-charges on Venus or Jupiter-like planets through laboratory experimentson streamers in appropriate CO2–N2 and H2–He mixtures. First, thescaling laws are experimentally confirmed by varying the density of theplanetary gasses. Then streamer diameters, velocities and overall mor-phology are investigated for sprites on Venus and Jupiter; they are quitesimilar to those on earth, but light emissions in the visible range are fainterby two orders of magnitude. The discharge spectra are measured; theyare dominated by the minority species N2 on Venus, while signatures ofboth species are found on Jupiter-like planets. The spectrum of a fullydeveloped spark on Venus is measured. We show that this spectrum issignificantly different from the expected sprite spectrum.
1 Introduction
1.1 Sprite discharges on earthLightning on earth is often accompanied by electric discharges in the upperatmosphere, known as TLE’s (transient luminous events). The various TLE’sobserved in the terrestrial atmosphere consist of several distinct phenomena,which are known as sprites, ELVES, blue jets, as well as several other sub-species. Red sprites are an impressive display of light above the thundercloudswhich span a vertical range of 50 to 90 km above the surface and take manyforms. They are red in color, although their lowermost, tendril-like part can beblue, e.g. see Sentman et al. [1995].
The mechanism of sprite production on earth is now being understood withincreasing precision (Pasko et al. [1997], Raizer et al. [1998], Hu et al. [2002],Hu et al. [2007], Pasko [2007], Stenbaek-Nielsen and McHarg [2008], Luque andEbert [2009]). It is based on the quasi-electrostatic approximation. The chargeseparation within the thundercloud is slow enough that the conductivity in themesosphere and the ionosphere can screen the emerging electric fields. How-ever, a lightning stroke changes the charge content of the cloud and the surfaceso rapidly, that the newly generated electric fields are not screened immedi-ately and appear up to the ionosphere. As the breakdown electric field Ek
depends on atmospheric density, it decreases strongly with altitude, and there-fore the lightning generated electric field can exceed the breakdown field ata sufficiently high altitude (Wilson [1925]). This is a necessary condition forthe emergence of a sprite a few to several tens of milliseconds after the parentlightning (Sao Sabbas et al. [2003], Cummer et al. [2006], Hu et al. [2007]), butsprites do not always appear in the mesosphere even if the quasi-electrostaticfield is there (Luque and Ebert [2009]). According to recent triangulations byStenbaek-Nielsen et al. [2009], sprites emerge at altitudes of 66 to 89 km. High-speed imaging showed that sprites start with downward moving streamer heads(Cummer et al. [2006], Stenbaek-Nielsen et al. [2007], McHarg et al. [2007]), andtelescopic imaging shows that single channels have diameters of tens to hundredsof meters (Gerken et al. [2000]). A review of sprite properties on earth can befound in Stenbaek-Nielsen and McHarg [2008].
1

1.2 Lightning and sprites on other planetsLightning discharges are the energetic manifestation of the microphysical andthermodynamical processes occurring within clouds that reside in a planetaryatmosphere. In the solar system, lightning had been detected by spacecraft viadirect optical imaging on Earth and Jupiter, and by electromagnetic remotesensing on Earth, Venus, Jupiter, Saturn, Neptune and Uranus. Recently, Rufet al. [2009] reported ground-based detection of non-thermal emission from aMartian dust storm, which they attributed to electrical discharges. No signa-ture of lightning activity had been discovered on Titan, Pluto and Mercury.We refer the reader to the recent comprehensive reviews on planetary light-ning by Desch et al. [2002] and Yair et al. [2008]. We will elaborate here onthe findings that concern lightning on Venus and on Jupiter. On Venus, light-ning activity had been deduced based on the VLF emission detected by theSoviet landers Venera 11 and 12 (Ksanfomality [1980]). However, the data fromtop-side observations by various spacecraft have not shown un-equivocal opticalor electromagnetic signatures, especially after the fly-byes of the Galileo andCassini spacecraft (Gurnett et al. [1991, 2001]). Krasnopolsky [2006] reportedearth-based measurements of high-resolution spectra of Venus in the NO bandat 5.3 µm and found an NO content of 5.5 ± 1.5 ppb below 60 km altitude.Such a concentration cannot be explained by cosmic-ray induced chemistry andthe suggested mechanism is production by lightning. Russell et al. [2007] hadanalyzed the Venus Express magnetometer data and inferred a global flash rateon Venus which is comparable to that on Earth, ∼ 50s−1. It is hard to explainhow such a high flash rate can occur in the stratiform clouds on Venus. Basedon conventional charge-separation processes which occur in terrestrial thunder-clouds, Levin et al. [1983] had shown that the charging rate of the clouds onVenus should be considerably slower than on Earth, and the resulting flash rateshould be of the order of few per hour. This does not rule out the possibil-ity that other, unknown charging mechanisms do operate within the clouds,leading to rapid electrification and frequent lightning. On Jupiter, the Voy-ager, Galileo, Cassini and New-Horizons missions found clear indications thatlightning discharges are prevalent (Borucki and Magalhaes [1992], Baines et al.[2007]). They are thought to occur in the deep H2O clouds that exist in thejovian atmosphere and are estimated to be roughly 100 times more energeticthan on Earth (Yair et al. [1995]).
Since lightning has been found in planetary atmospheres, it seems reasonableto assume that some form of TLE, like sprites, occur there as well. Yair et al.[2009] estimated the altitude in which breakdown can occur above the cloud deckin various planetary atmospheres, using the quasi-electrostatic approximationfirst proposed by Wilson [1925]. Yair et al. [2009] predict that for sufficientlylarge charge moments, sprites can form in the atmospheres of Venus and Jupiter.
The Japanese Climate Orbiter, Planet-C, planned to be launched in 2010,will search for lightning on Venus (see Nakamura et al. [2007], Takahashi et al.[2008]). However, the venusian thick cloud layers might inhibit optical observa-tions. Yair et al. [2009] expect that, if lightning exists, sprites may form abovethe upper most cloud deck, and thus could be easily observed by an orbitingspacecraft, both on Venus and on Jupiter. The altitude, diameter, shape andlight emission of the observed sprites could yield valuable information aboutthe charge configuration in the clouds below, as well as about the gas compo-
2
sition of the upper atmosphere of the planet. In this work we investigate theexpected spectrum of sprites and their morphology via laboratory experiments.This information can be useful in finding and identifying sprites in upcomingobservations.
1.3 Laboratory experiments on sprites1.3.1 Streamers and Scaling Laws
It is by now well understood that the large sprite discharges at low air densityare essentially up-scaled versions of small streamer discharges at high air densitythat dominate the initial breakdown of large gas volumes in a sufficiently strongelectric field. As discussed by Ebert et al. [2006], Pasko [2007], Briels et al.[2008a], Ebert et al. [2009] and supported by observations by Gerken and Inan[2003], Marshall and Inan [2006], McHarg et al. [2007] and by simulations byLiu and Pasko [2004], Pasko [2006], Luque et al. [2007, 2008], Luque and Ebert[2009], streamers and sprites are essentially related through similarity or scalinglaws. Similarity laws for discharges in gasses of the same composition, but ofdifferent density were probably first formulated by Townsend for the so-calledTownsend discharge at the beginning of the 20th century; they are discussedin many textbooks of gas discharge physics. While there are also many devi-ations from similarity in other discharges, similarity in the propagating headsof streamer discharges holds particularly well because these fast processes aredominated by collisions of single electrons with neutral molecules, while two-step processes and three-particle processes that would be density dependent, arenegligible on these short time scales. This implies that the basic length scaleof the streamer discharge is the mean free path of the electron `mfp which isinversely proportional to the density n of the medium, `mfp ∝ 1/n. Similarityat varying density n implies that the streamer velocity, as well as velocity andenergy distributions of individual electrons are the same at similar places, whilelength scales as ` ∝ 1/n, electric fields as E ∝ n etc. The similarity of theoverall morphology including diameters and velocities of streamers and spritesin terrestrial air of varying density were recently confirmed experimentally byBriels et al. [2008a] (see also discussion by Ebert et al. [2009]).
The basic arguments for the similarity laws between streamers at differentgas densities do not depend on the gas composition, and indeed the similar-ity laws were recently confirmed experimentally by Nijdam et al. [2010] forwidely varying mixing ratios of N2 and O2 and for argon. This opens a possi-bility to simulate planetary sprites through laboratory experiments on the cor-responding gas mixtures. To the best of our knowledge such simulations werenever performed in gas mixtures specifically chosen to simulate planetary at-mospheres other than earth. We here investigate sprites on Venus and Jupiterby means of creating streamer discharges in gas mixtures that correspond tothe planetary atmospheres of Venus and Jupiter respectively, CO2-N2 (96.5%-3.5%) and H2-He (89.8%-10.2%), respectively. The mixtures’ compositions arebased on the NNSDC (compiled by Williams, http://nssdc.gsfc.nasa.gov/planetary/planetfact.html).
It is well known that a minimal voltage is required to start streamer dis-charges from a needle electrode. This voltage is called the inception voltage;it depends on electrode shape and material as well as on gas composition and
3

density and (up to now) has no direct interpretation in terms of microscopic dis-charge properties. The streamers that are formed at the inception voltage havea minimal diameter, but if the voltage rises rapidly to a voltage higher than theinception voltage, considerably thicker and faster streamers can emerge, whicheventually break up into more and thinner streamers until the thinnest streamersagain have the minimal diameter (Briels et al. [2006, 2008b]). Therefore spritetendrils should also attain a minimal diameter, even though a sprite does not, ofcourse, emerge from a needle electrode (Luque and Ebert [2009]). The minimaldiameter at each pressure is a convenient quantity to test the similarity lawsas the product of minimal diameter and density (reduced minimal diameter)should not depend on density (Briels et al. [2008a]). In section 3, we confirmthe similarity laws for positive streamers in gas mixtures that correspond to theatmospheres of Venus and Jupiter.
1.3.2 Sprite spectrum
In looking for planetary sprites, the expected spectrum of their optical emis-sions is of major importance. Such knowledge allows identifying sprites andconstructing observation devices. Laboratory settings are convenient for per-forming such measurements. Terrestrial sprites’ spectrum was successfully sim-ulated by Williams et al. [2006], who have created a “sprite in the bottle” ina glow discharge tube. This experiment was repeated by Goto et al. [2007].The spectrum measured by this method agrees with the spectrum of terrestrialsprites, measured by Mende et al. [1995] and Hampton et al. [1996]. To ourknowledge, the simulation of planetary sprites’ spectra was not attempted yet.
Sprites are transient discharges, believed to be equivalent to streamers athigher pressures, therefore a laboratory streamer discharge should simulate asprite much better than a glow discharge. Both streamer and glow are so-calledlow temperature discharges (i.e., the temperature of the neutral gas moleculesdoes not increase much within the plasma). A streamer is a very transient pro-cess, where an ionization front moves rapidly within a locally enhanced electricfield that well exceeds the breakdown value. At the same time the electric fieldoutside the streamer head can be significantly weaker than the breakdown field.While creating an ionized trail behind it, only the moving streamer head emitslight. The glow discharge, on the other hand, is stationary; therefore excitationlevels, chemical reactants and ions that can be generated in several steps, arepresent. The entire glow column is ionized and emits light, and the electric fieldwithin it is well below the breakdown field.
In our experiments, the discharges are created by voltage pulses of µs dura-tion. The streamers emit more light at lower pressures, where they also easilytransit into stationary glow, that is even brighter. These are the conditionswhere the spectrum can be measured in a reasonable time span. Thus thespectrum we report in section 4 is in fact the spectrum of a discharge thatstarts as a streamer and quickly transforms into a glow column. Recent ex-periments with a new electric circuit able to generate much shorter voltagepulses that create streamers that do not turn into glow, have shown that thespectra of streamer discharges and of short pulsed glow discharges are quitesimilar in pure nitrogen at pressures between 25 and 200 mbar (Nijdam et al.,http://arxiv.org/abs/0912.0894v1, version 1). To suppress multi-step pro-cesses that do not occur in a streamer head, we use a low frequency repetitive
4

discharge, with a frequency of 1 or 10 Hz, rather than a stationary or highfrequency discharge. In a low frequency repetitive discharge, such as the onedescribed here, there is enough time for the gas to return to its original neutralstate, or for the reaction products to be flushed away by the gas flow, if present.
We remark that several research groups have measured spectra of hot plas-mas to simulate lightning in planetary atmospheres. Borucki et al. [1996] cre-ated hot plasma using a laser pulse and measured the emission spectrum. Theconditions in that experiment resemble those in the hot plasma lightning chan-nel, where many chemical processes take place due to high temperature ratherthan due to a high electric field. Goto and Ohba (unpublished report, 2008),simulated the lightning spectrum in pure CO2 using spark discharges. In sec-tion 4.4 we report our measurements of the spectrum of sparks in the mixturethat represents Venus’ atmosphere. The spectrum of the cold plasma streamerand glow discharge is significantly different from that of the hot plasma sparkdischarge in this mixture, and the same is probably true in other gas mixtures.Unfortunately we have not been able to produce a spark in the jovian mixturewith our set-up. We observed that the glow discharge became stronger, butdid not transform into a spark discharge. Due to time limitations, we did notinvestigate the reason for this.
1.4 OutlineIn the following we review our experiments on two planetary gas mixtures,CO2-N2 representing Venus and H2-He representing Jupiter. In section 2.1we give a description of the experimental setup, and in section 2.2 we give aqualitative description of the discharges observed. We discuss the qualitativesimilarities and differences between the two planetary gasses and dry air. Dryair was examined in previous experiments by Briels et al. [2008a] and Nijdamet al. [2010]. Section 3 deals with scaling laws in the two planetary gasses. Wemeasure the reduced minimal diameter of streamers and their velocity. We areable to confirm that scaling laws apply to our gasses, based on the reduceddiameter measurements. In section 4 we present the spectra we measured instreamer and glow discharges in the two gasses at a pressure of 25 mbar, andthe spark spectrum in the Venus mixture, that was measured at a pressure of200 mbar.
2 Experimental set-up and overview of the dis-charges
2.1 Set-upPositive streamers are created in a large cylindrical stainless steel vacuum vesselwith an internal diameter of 50 cm and an internal height of 30 cm. The vacuumvessel contains a sharp tungsten tip, placed 16 cm above a grounded plate.The whole vessel is placed inside a Faraday cage. A large quartz window ispositioned on the vacuum vessel. The Faraday cage contains a window, coveredby a conducting layer of Indium-Tin-Oxide (ITO), through which the dischargescan be photographed by a camera outside the Faraday cage. This window istransparent to visible light, but not to UV radiation of wavelengths below 300
5

Figure 1: Overview of the high purity vacuum vessel with the ICCD camera.The wall of the vessel has been rendered transparent in the figure so that theanode tip and cathode plane are clearly visible.
nm. The streamer discharge is imaged by a Stanford Computer Optics 4QuickEICCD camera through a Nikkor UV 105 mm f/4.5 lens. The imaging set-upis sensitive to wavelengths from 300 to 800 nm. A schematic drawing of thevacuum vessel with the camera is given in Figure 1.
We have used a set-up that is specifically designed to ensure the purityof the gasses inside. For this reason, the set-up can be baked to reduce out-gassing, it contains no plastic parts, except for the o-ring seals and it staysclosed all the time. When not in use, the set-up is pumped down to a pressureof about 2 · 10−7 mbar.
During the experiments, we have used constant pressures between 25 and1000 mbar. The gas inside the set-up is flushed constantly. The absolute flowrate is controlled by a mass-flow controller and depends on pressure. The flowrate is chosen so that all the gas is replaced every 25 minutes. This ensures thatthe contamination caused by out-gassing or leaks is significantly below 1 ppmfor all pressures used. We use two different gas mixtures that are pre-mixed bythe supplier: a mixture (Venus) that consists of 96.5% CO2 and 3.5% N2 anda mixture (Jupiter) that consists of 89.8% H2 and 10.2% He. According to thespecifications, the contamination level is below 1 ppm for both mixtures. As anextra safety measure, we never fill the vessel with more than 800 mbar of theflammable H2-He mixture.
During a measurement, a voltage pulse is applied to the anode tip. A 1 nFcapacitor is charged by a high voltage negative DC source. Now a trigger circuittriggers a spark gap, which acts as a fast switch. The capacitor is dischargedand applies a positive voltage pulse on the anode tip. Positive streamers areinitiated near the anode tip and propagate in the direction of the plate. Thispulse has a rise-time of about 15 ns and a fall time of about 10 µs, dependingon the choices for the resistors and the streamer discharge itself. See Figure 2for a simplified drawing of the circuit. In most cases, a repetition rate of 1 Hzis used.
6

Figure 2: Schematic depiction of the electrical circuit. The HV switch is a sparkgap. The figure is taken from Briels et al. [2006].
In the images presented in this work, the original brightness is indicated bythe multiplication factor MF as in Nijdam et al. [2010]. This value is a measureof the gain of the complete system, it includes lens aperture, ICCD gain voltageand maximum pixel count used in the false-colour images. An image with ahigh MF value, is in reality much dimmer than an image with similar colouring,but with a lower MF value. We have normalized the MF values in such a waythat the brightest image presented here has an MF value of 1.
More information about the circuit, discharge vessel, experiment timing,imaging system and measurement techniques can be found in Briels et al.[2008b,a], Nijdam et al. [2009].
2.2 Overall structure of the dischargeWe were able to observe streamers in both gas mixtures. We show examples ofthe streamers we observed in Figure 3. The voltages in this figure are well abovethe inception voltage, the minimal applied voltage that is required to create astreamer. Examples of streamers close to the inception voltages are shown inFigures 4 and 5. The images clearly illustrate the fact that a higher voltageis required to create a discharge when the pressure is increased. Increasingvoltage, or decreasing pressure causes the discharge to be brighter and less fila-mentary. When planetary mixtures are compared, we notice that the initiationof streamers in both our gasses requires higher voltages than in dry air at thesame pressure. In the venusian mixture streamers are particularly difficult tocreate. For example, at 800 mbar a minimal voltage of approximately 20 kV isrequired to initiate a streamer discharge. At this voltage the streamer dies outbefore it bridges the gap. At the same pressure, streamers in the jovian mixtureare created at lower voltages below∼15 kV. These streamers do not cross thegap either. Likewise, streamers at 1 bar in dry air can form when the appliedvoltage is as low as ∼10 kV, as was shown by Briels et al. [2008b] in a similarset-up.
Only the streamer’s head produces light. Therefore an image taken with along exposure shows the trace left by the streamer head as it passes. With ashorter exposure just a section of the streamer’s path is seen (see Figure 5).
7

Figure 3: Comparison of discharges in air, and in the two gas mixtures. Thepressures are the same in each column. The applied voltage is indicated in eachfigure. The color scheme of the raw images is modified to enhance the filamen-tary structure of the streamers. This is indicated by the multiplication factor(MF). These images were taken with long exposure times, such that the full de-velopment of the discharge was recorded, including late streamers and glow. Inthe similarity measurements we focus on the primary streamers, and use muchshorter exposure times. Images in air were taken by F. M. G. H. van de Wetering(unpublished report 2008).
8

Figure 4: Streamers at inception voltage and a pressure of 800 mbar. Theapplied voltage and the multiplication factor are indicated in each image. Theexposure time is longer than the time required for the full development of thestreamer. The full development of the streamer is recorded in both images.The indicated applied voltages are a few kV higher than the inception voltage.The light emitted by the streamer is very weak, which required the use of themaximum gain voltage (950V) in our camera. This accounts for the many specsin the images, which are most likely due to noise in the ICCD camera.
At lower pressures, or higher voltages, the streamers develop into glow afterreaching the plate electrode, resulting in a more or less uniform light that isemitted from the entire channel. This is seen in the right column of Figure 3.The glow phase lasts longer than the streamer phase, and emits significantlymore light. Both in dry-air and in the jovian mixture, H2-He, a single widechannel is formed when the pressure is below 50 mbar. In the venusian mixture,CO2-N2, the filamentary streamer structure persists at the lowest pressures.Several channels conduct most of the current in the glow phase, as indicated bytheir strong intensity in the images. The light emission is usually too weak tobe observed by the naked eye, except at the lowest pressures, below 100 mbar.In the venusian mixture the streamers tend to be bluish-green in color, and inthe jovian mixture they seem to be pink.
The images in Figure 3 are long exposure images taken at voltages that arerelatively high when compared to the minimal inception voltages at the corre-sponding pressures. Under such conditions the streamers bridge the gap andconduct enough current to create the glow phase. When voltage is set as closeas possible to the inception voltage value, the glow phase does not appear. Anexample is shown in Figure 5, where the top row is a full exposure image, thatshows the streamer channels, and no indication of a glow phase. Note the differ-ent applied voltages, indicated at the bottom of each image, in the venusian theinception voltage is higher than in the jovian mixture. This difference persistsin other pressures as well. We note that the jovian streamers have much lessbranches than the venusian streamers, under very similar conditions. Togetherwith the high inception voltages required, this may be an indication of lowerionization rates in the venusian gas mixture. Apparently, streamer heads areless stable in this mixture, which causes them to branch more often. In the topright image of Figure 5 we observe many branches that stop in the middle of the
9

Figure 5: Streamer images at minimal inception voltage and a pressure of 50mbar. The applied voltage, the exposure time and the multiplication factorare indicated in each image. The top row shows the entire streamer develop-ment. Under the specified conditions very little current flows through the ionizedchannels. The bright dots at the bottom of the picture are the points wherethe streamers reach the plate electrode. Most of the streamers propagate in thedirection of the plate, but some of them propagate to the vessel’s walls. Thebright area at the top of the images is the needle electrode and the glow aroundit. The bottom row shows snapshots of the streamer development, taken with adelay of a few hundred nano-seconds after the initiation of the streamer. Notethe shorter exposure times, relative to the top row. Such images are used in thecalculation of the minimal diameter and the velocity, as described in section 3.
10

gap, never reaching the other side. There are much less such branches in air andin the H2-He mixture. Looking closely at the streamer channels one sees thatin the venusian mixture they are much more jagged than in the other gasses,and are almost never straight. More images of streamers in air are available ine.g Briels et al. [2008b] and Nijdam et al. [2010].
The morphological differences between the streamers in the two mixturesare probably due to two properties of the gasses, (i) their atomic or molecularstructure, and (ii) the photoionization mechanism. We here recall the basicmechanisms, that will have to be elaborated further in future work. (i) A noblegas like He or Ar consists of single atoms, N2 and H2 are molecular gasses con-sisting of two atoms, and CO2 consists of three atoms. The molecular gasses,and in particular CO2, have many rotational and vibrational states at low en-ergies that can absorb the energy of colliding electrons; therefore the electronsexperience more friction than in noble gasses. Furthermore, He and H2 haveonly two electrons each which results in only few electronic excitation states.For this reason, streamer propagation is much easier in jovian than in venusianor terrestrial atmospheres. (ii) Positive streamers as investigated here move ap-proximately with the electron drift velocity, but against the direction of electrondrift; therefore they depend on a source of free electrons ahead of the ionizationfront. These free electrons can be supplied either by a nonlocal photoioniza-tion effect or by background ionization. Researchers currently generally agreethat photoionization is the dominant effect in nitrogen-oxygen mixtures liketerrestrial air (see Zheleznyak et al. [1982], Liu and Pasko [2004], Pancheshnyi[2005], Ebert et al. [2006] and references therein), though Pancheshnyi [2005] ar-gues that high repetition frequencies can shift the balance towards backgroundionization as well. However, in any other gas the propagation mechanism ofpositive streamers is not really understood. In pure oxygen or nitrogen or ar-gon, it is presently under investigation experimentally by Nijdam et al. [2010]and theoretically by Wormeester (manuscript in preparation). These investiga-tions suggest that photoionization is able to stabilize wide streamer heads whilepositive streamers propagating due to background ionization are less straightand branch easier. These considerations may influence both the streamer headvelocity and diameter, as well as other factors, as shown by the results describedin section 3. Our preliminary investigations on the photoionization mechanismin venusian or jovian atmospheres below support this scenario.
Teich [1967] and later Zheleznyak et al. [1982] attribute the photoionizationprocess in nitrogen-oxygen mixtures to several nitrogen emission lines in thewavelength range 98-102.5 nm. These photons are energetic enough to ionizeoxygen molecules at ∼12 eV. This photoionization takes place after some traveldistance that depends on the oxygen concentration; thus it is a nonlocal pro-cess. On Venus, CO2 requires a higher ionization energy of ∼13 eV, however thenitrogen molecule does not have emission lines that are energetic enough to ion-ize this molecule in a one-step process. Therefore other, less effective processesmust account for the streamer propagation in the venusian mixture. With thelow photoionization efficiency in the streamer head, it becomes less stable andmore likely to branch. The picture in the jovian H2-He mixture is completelydifferent. There is a large gap between the ionization energies of the hydrogenmolecule and helium. A photon with a wavelength below 77.5 nm is energeticenough to ionize the hydrogen molecule at ∼16 eV. The helium atomic spectrumhas a group of lines in the range 50.7-58.4 nm that can produce photons with
11

enough energy to ionize the hydrogen molecule in a one step process. Assumingthat the photoionization process is effective in the H2-He mixture, one is notsurprised to find that the streamer heads are as stable as they are. Ionizationand atomic spectral data in this paragraph are taken from the NIST database(Ralchenko et al. [2008] and Linstrom and Mallard [2009]).
The optical brightness of the streamers in both gasses is considerably weakerthan in the gasses used in previous experiments (ambient air, nitrogen–oxygenmixtures and argon). Our setup is not calibrated to estimate absolute opticalbrightness, however a rough estimation of the relative intensity of planetarystreamers to streamers in air is possible. The pixel gray level in an image isproportional to the light intensity and depends on the camera settings We canestimate the ratios between average intensities per area in different gasses, withthe following method: we record short exposure images using the same equip-ment and under the same pressure and voltage conditions. We evaluate theaveraged gray level per area of the streamer sections in these images. Our esti-mation shows that the optical brightness of both Jovian and Venusian streamersappears to be about a 100 times weaker than of streamers in air at similar pres-sures. A similar method is used to estimate the brightness of terrestrial spritesYaniv et al. [2009] Averaged intensity per area depends on pressure, at lowerpressures streamer images are brighter in all mixtures. These findings dependon equipment choice, since they are measured with the specific wavelength sen-sitivity curve of our equipment. So a very bright line at the edges or outside ofthis curve is not observed, but could be observed when other equipment is used.
3 Measuring Diameter And Velocity
3.1 MethodWe test the similarity laws discussed in section 1.3 by determining the diameterand the velocity of the minimal streamers in planetary mixtures. In search forthe minimal streamer diameter and velocity, we use images taken as close aspossible to the inception voltage, the minimal voltage that is required to createa discharge (see Briels et al. [2006] for details). We determine this minimalvoltage by gradually sweeping up the applied voltage, until streamers begin toappear in the discharge gap. At first streamers appear sporadically once everyfew pulses. These discharges are very difficult to image. For this reason weoften apply a voltage that is slightly higher than the minimal inception voltage,where the discharge appears quite regularly. We note that The discharges arenot absolutely independent. If a pulse triggers a discharge, the chances that thenext pulse will trigger a discharge as well are increased. This suggests that someresidue ionization is left in the gas for at least one second after the discharge.The discharge itself lasts several hundreds nano-seconds.
The streamer diameter is determined from the recorded images with themethod described by Briels et al. [2008b]: One to five of the thinnest streamersare chosen in each image. In choosing the streamer sections we keep in mindthat not all the streamers in a given image are in focus. Those streamers thatare not, will appear to be wider than those that are in focus, and will notbe selected for diameter determination. Several perpendicular cross sections ofeach of the chosen streamers are taken. These cross sections are averaged so that
12

they form one single cross section per streamer. The diameter of the streamer isdetermined as the full width at half maximum (FWHM) of the averaged crosssection. The diameters of all the chosen streamers are then averaged. We remarkthat the streamer images in the planetary gasses have a relatively low signal tonoise ratio. This makes the determination of FWHM of a single cross sectionalmost impossible. Averaging over many cross sections, and the extraction ofthe FWHM of the averaged line, gives quite good results.
We use the following method to measure velocity, as described by Brielset al. [2008b] :We take short exposure images of streamers while they propagatein the middle of the gap, far away from both electrodes, where the effect ofthe electrodes on the field is minimal. The image shows the path that thestreamer heads have crossed within the exposure time, hence their velocity canbe determined by dividing the length of the streamer by the exposure time.We choose the longest straight streamer sections in each image, which do notbranch. These streamers are most likely to have propagated more or less in theimage plane, with approximately constant velocity.
3.2 ResultsFigure 6 shows the reduced minimal diameter, p · dmin, as function of pressurein the two gas mixtures. Here p is the pressure and dmin is the measuredminimal diameter. We can use pressure instead of density because the gastemperature is the same in all experiments, namely room temperature. Asexpected, the reduced minimal diameter depends very weakly on pressure. Inthe jovian mixture p · dmin ≈ 0.26 ± 0.03 mm·bar and in the venusian mixturep · dmin ≈ 0.09 ± 0.03 mm·bar. These values are of the same scale as valuesmeasured by Briels et al. [2008a] in air and nitrogen and by Nijdam et al. [2010]in argon and in oxygen–nitrogen mixtures of varying concentration. The averagereduced diameter reported by Nijdam et al. in dry air is ∼ 0.12 mm·bar. Someof the values reported in that work are shown in Figure 6.
We can summarize that the values of p · dmin of the streamer head in theCO2-N2 mixture, in air and in pure nitrogen are quite similar. In the H2-Hemixture the value of p · dmin is twice as large. In section 2.2 we discuss somepossible reasons for such a difference. It is likely that the jovian mixture isionized more easily than the mixtures that represent Venus and Earth, as wellas pure nitrogen, creating wider and possibly faster streamers.
We made preliminary measurements to estimate the minimal streamer veloc-ity. We recall that theoretically the streamer velocities do not depend on densitywhen similarity laws apply, as discussed by Briels et al. [2008a]. In all the pres-sures, in both mixtures, the measured minimal velocity is of order of 105 m/s.Our best estimation in the venusian mixture is ∼ 0.80 ± 0.04 × 10⁵ m/sec in800 mbar, and in the jovian mixture it is 1.00 ± 0.05 × 10⁵ m/sec in 50 mbar.Briels et al. [2008a] and Nijdam et al. [2010] report similar values in other gasmixtures, such as air. Velocities of 105 to 107 m/sec were measured in spritetendrils by means of high temporal resolution observations of terrestrial sprites(Moudry et al. [2002], McHarg et al. [2007], Stenbaek-Nielsen et al. [2007]).
Measurements by Briels et al. [2008b] in air demonstrated that the velocitydepends more strongly on the applied voltage, than the diameter and above theinception voltage the velocity has a quite large statistical error. We were notable to measure the minimal velocity in all the pressures, however the lowest
13

Figure 6: Reduced minimal streamer diameter, p ·dmin, as function of pressure,at room temperature. Red circles: experimental results in jovian atmosphere,the H2-He mixture. Black squares: experimental results in venusian atmosphere,the CO2-N2 mixture. The errors are determined as the maximum betweenthe image resolution and the standard error. Higher pressure measurementsare dominated by the resolution error, while lower pressure measurements aredominated by the standard error. The pure nitrogen and air data (blue andgreen triangles respectively) are taken with permission from Nijdam et al. [2010].
14

values we measured had the narrowest distribution. This is a clear indicationthat the applied voltage was above the inception voltage.
According to Yair et al. [2009], sprites are expected on Venus at altitudesbetween 80 and 90 km above the surface, and on Jupiter at ∼300 km abovethe 1 bar level. At these altitudes the pressure is 5 to 0.4 mbar on Venus, andof the order of 10−3 mbar on Jupiter. The streamer minimal diameter at suchpressures according to our measurements are expected to be 0.2-0.02 m, and300 m respectively. The sprite tendrils may in fact be quite wider, as they donot need to be minimal. For example, based on the value of p·dmin measured byBriels et al. [2008a] in air, minimal sprite tendrils on Earth should be roughly20 m wide. However observations report tendrils as wide as ∼150 m (Gerkenand Inan [2003]).
4 Spectral Measurements
4.1 MethodWe used two small spectrometers to determine the spectra emitted by the vari-ous discharges under investigation. These spectrometers are sensitive in differ-ent wavelength regions: an Ocean Optics HR2000 is sensitive between 177 and622 nm and an Ocean Optics HR2000+ is sensitive between 420 and 820 nm.In the following, we refer to the spectra of these devices as UV-Vis and Visrespectively. The corresponding sensitivity curves are shown in Figure 7. Anoptical fibre is used to get the light into the spectrometer. The acceptance angleof this fibre is enough to capture light from the entire discharge region, whenplaced behind the large quartz window (See Figure 1). This includes the elec-trodes. We believe that their radiation contribution to the spectrum is minor.In these discharges the electrodes hardly heat up, and therefore do not emitplanck radiation. The discharge around the electrodes should not be that muchdifferent from the bulk. In most cases, the end of the optical fibre was placedperpendicular to the large quartz window, in full view of the discharge region,but outside the ITO window of the Faraday cage. However, in some cases, itwas placed within the Faraday cage, parallel to the large quartz window. Inthese latter cases, a mirror was used to direct the light from the discharge tothe fibre. This is needed to measure at wavelengths below 300 nm, which areabsorbed by the ITO window. The construction with the mirror was neces-sary because of the small space between the ITO and the quartz windows. Inorder to get enough radiation from the discharge to produce a spectrum withan acceptable signal to noise ratio, we needed to use long measurement times,up to 100 minutes, and a high discharge repetition rate of 10 Hz. When thehigher repetition rate of 10 Hz is used, we do not use the equipment responsiblefor constantly renewing the gas in the vessel, due to technical difficulties. It ispossible that meta-stable molecules form in the gas and influence the measuredspectrum. The measurements shown here are averaged curves of 10 intervals of60 sec integration time each.
Because of the very low intensity of the streamers in the two gasses, wehad to use low pressures and high voltages. The discharges we investigate looklike those shown in the right column of Figure 3. Most of the light emissionin these discharges comes from the glow phase, which is longer in duration
15

Figure 7: Normalized sensitivity curves of the two spectrometers. The spectrom-eter sensitivity curves have been acquired by means of calibrated deuterium andhalogen lamps.
and more intense. Nijdam et al. (http://arxiv.org/abs/0912.0894v1, version1) show that the spectra of streamers and of pulsed glow in pure nitrogen arepractically indistinguishable. We assume it is true for the planetary gassesas well. Nonetheless, one should remember that the spectra discussed in thissection are basically those of a pulsed glow discharge that lasts a few micro-seconds.
Two spectra, using both spectrometers, were measured in each gas mix-ture. The spectra presented in this paper are corrected for the sensitivity ofthe spectrometers. The intensity scale is equal between the different spectraand spectrometers. Therefore, intensities can be compared between differentspectra and wavelengths. However, we have no absolute intensity calibration.We normalise the spectra with the strongest lines in the venusian spectra, andwith the Balmer α line in the jovian spectrum. In the measured spectra wehave excluded some pixels that showed excessive noise levels in the calibrationmeasurements. When more than two neighbouring pixels are excluded, this sec-tion of the spectrum is removed from the spectrum. In other cases the excludedpixels are represented by the average of their neighbours. In total about 75points per spectrometer have been excluded.
In this section we report our observations on the streamer and glow dischargespectra in the two planetary gasses, and the spark spectrum in the mixture thatcorresponds to Venus. For spectral identification we use the tables of molecularspectra by Pearse and Gaydon [1976], and the NIST database for atomic spectral
16

Figure 8: Spectrum of streamer and glow discharge in a gas mixture that sim-ulates the jovian atmosphere, H2-He - 89.8%:10.2%. The strong continuum isdominant in the UV-Vis range (shown in the inset).
lines (Ralchenko et al. [2008]).
4.2 Spectrum for sprites on JupiterFigure 8 shows the spectrum obtained in the mixture that simulates Jupiter’satmosphere, at a pressure of 50 mbar and a voltage peak of ∼25 kV. Thesemeasurements were taken with the optic fiber placed between the dischargevessel window and the ITO glass, so radiation below 300 nm was recorded.
The dominant feature of this spectrum is the continuum in the UV-Vis range,with a higher intensity at the lower wavelengths. It is similar in form to theUV continuum emission in H2 reported by Lavrov et al. [1999], and referencestherein. Continuum in H2-containing mixtures is created in transition fromelectronically-excited state a3Σ+
g of H2 to the unstable state b3Σ+u , which auto-
dissociates instantaneously with a photon emission, i.e. a3Σ+g → b3Σ+
u → H+ H + photon (Sergey Pancheshnyi in personal communication). In additionto this continuum, there are many spectral lines. We focus here on the mostdistinctive features of the spectrum. The strong and narrow line at 656 nm,is the Hα line. The second line of the Balmer series, much less intense, ispresent as well. There are two regions of particularly strong and dense lines,one at the wavelength range of 575-625 nm and another at 700-800 nm. The575-625 nm band probably belongs to the He2 molecular spectrum. The He2spectrum has two other such regions at wavelengths below 500 nm (marked inthe Figure). These bands are not apparent in our spectrum. The 700-800 nm
17

Figure 9: Spectrum of streamer and glow discharge in a gas mixture that sim-ulates Venus’s atmosphere, CO2-N2 – 96.5%:3.5%. The main figure shows theentire spectrum to scale. The lines of N2-SPS are shown in the top inset, in theUV-Vis range. The lines of the CO-Ångstrom system and N2-FPS are shown inthe bottom inset, scaled up. Wavelengths of most significant lines are indicatedin the text.
band, we are currently unable to identify. A possible candidate is the hydrogenmolecule, which has a very complex and dense spectrum in the visible range.However while many of the peaks of the H2 spectrum lines coincide with peaksin Figure 8, many others seem to be absent or otherwise they are too weak anddifficult to identify, particularly in the 500-550nm range. A higher resolutionmeasurement is required to allow for un-ambiguous identification.
4.3 Spectrum for sprites on VenusFigure (9) shows the spectrum obtained in the mixture that simulates the venu-sian atmosphere, at a pressure of 50 mbar and applied voltage of ∼43 kV. Theoptic fiber is placed behind the ITO window, so no spectral lines can be observedbelow the wavelength of 300 nm.
The most dominant feature of this spectrum is the N2 second positive bandof triple heads in the range 300 to 450 nm (N2-SPS). The strongest lines ofthis system are found at 316, 337, 354, 358, 376 and 381 nm. All the lineshave widths of ∼2 nm. The CO Ångstrom system is clearly visible in the Visspectrum, with lines at 451 nm, 483 nm, 519 nm, 561 nm, 607 nm and 662 nm,all degraded to the violet. This system is considerably weaker that the N2-SPSband. The line at 567 nm is possibly one of the triplets of the CO triplet system.
18

Other triplets of this system might be present as well, but many of them are veryclose to CO Ångstrom lines, making it difficult to identify them (such as thewide line at 600-607 nm), others are too weak to be un-equivocally identified.Several very weak heads of the N2 first positive band (N2-FPS), are found atthe upper edge of the spectrum, at the wavelength range 725-790 nm.
It is somewhat surprising that we observe primarily nitrogen lines in thisspectrum. Previous work by Goto and Ohba (unpublished report 2008) in hotplasma, found a significant CO2 signature in the spectrum, while Borucki et al.[1996] found mainly atomic oxygen and carbon lines. However, according tothe literature (Pearse and Gaydon [1976]) even a very small amount of nitrogenmixed into a gas can produces strong N2 lines in some circumstances, and thesenitrogen lines can be considerably stronger than any other feature of the spec-trum. This seems to be the case with the streamer spectrum in the venusianatmosphere examined here. This is an indication that pure CO2 may not thebest choice when one wishes to simulate such discharges in the venusian atmo-sphere, and nitrogen must be taken into account. The hot plasma spectrum isdiscussed in more detail in the following section.
4.4 Spectrum for lightning on VenusBy a simple modification, the system described in section 2.1 can create sparksin the discharge gap. The resistor R3 in Figure 2, through which most of thecurrent during a voltage pulse, is replaced by a resistor with a higher resistance(a 1 kΩ resistor is replaced by a 6 MΩ resistor). The original resistor is chosenin such away that most of the current flows through the R3 branch of thecircuit, rather than through the discharge gap, therefore the high voltage onthe discharge gap falls very rapidly, within several micro-seconds. With thestronger resistor in place, the high voltage on the electrodes persists for a timelong enough for a spark discharge to occur, if the gas in the vessel is denseenough. The spark discharge is akin to lightning on a small scale.
We used this setting to create sparks in the mixture that represents Venus’satmosphere, CO2-N2, and recorded its spectrum using the equipment and meth-ods described above. The optic fiber was placed between the vessel quartz win-dow and the ITO window, so wavelengths shorter than 300 nm were observed.The pressure in the vessel was 200 mbar, and a voltage of ∼50 kV was used.The sparks created in this way are significantly brighter than the cold plasmadischarges discussed above. As a result we could measure the spectrum withconsiderable shorter exposure times; 10 seconds for the UV-Vis range, and 30seconds for the Vis range were used. The curves shown in Figure 10, are theaveraged result of 10 measurements.
When one compares the spectra in figures 9 and 10, the difference is ap-parent. The strongest lines of the cold plasma spectrum are concentrated inthe wavelength range 300-400 nm, and these are nitrogen lines. There are noCO2 lines, and the CO lines are very weak. The spark spectrum, on the otherhand, has a concentration of lines between 400 and 500 nm, and several strongand narrow lines; the atomic oxygen line at ∼777 nm, and two lines in the UV,∼230 nm and ∼250 nm, that probably belong to the CO+ first negative system.Many of the other lines in this spectrum correspond with the carbon monoxideflame bands (1B2−X1Σ+), which are in fact CO2 emissions, and also with theFox-Duffendack and Barker’s system (A2Π−X2Π), which are CO+
2 emissions.
19
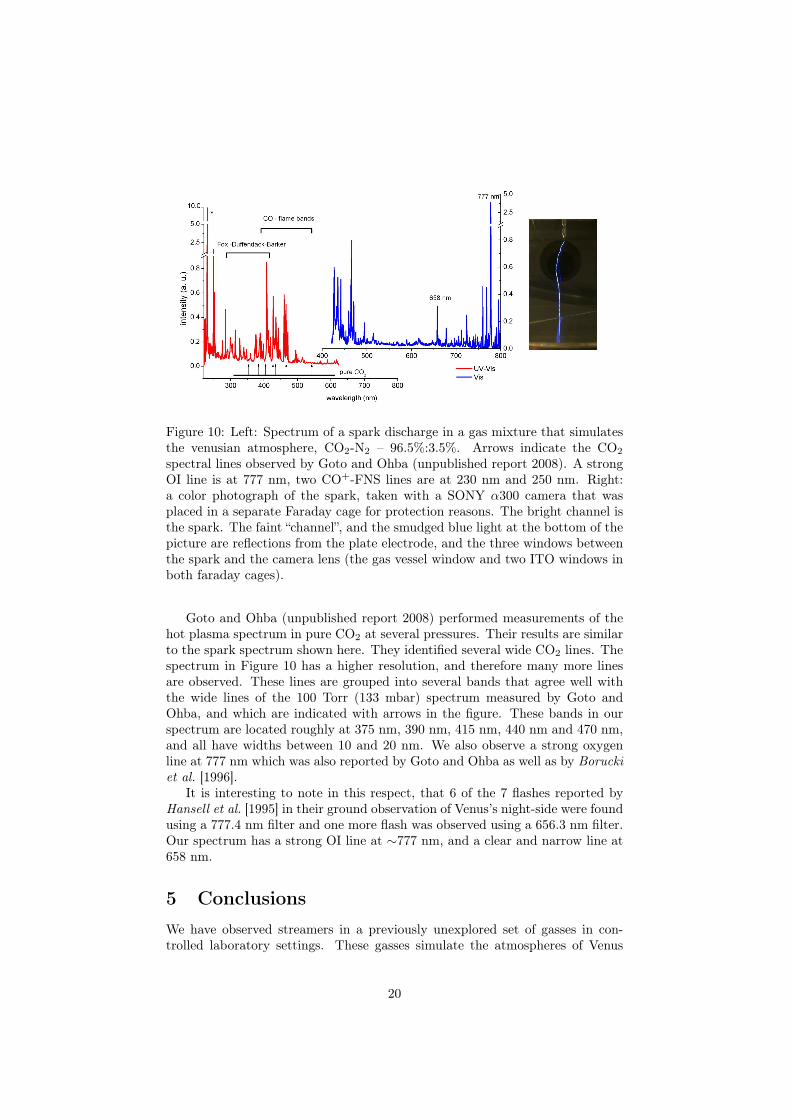
Figure 10: Left: Spectrum of a spark discharge in a gas mixture that simulatesthe venusian atmosphere, CO2-N2 – 96.5%:3.5%. Arrows indicate the CO2
spectral lines observed by Goto and Ohba (unpublished report 2008). A strongOI line is at 777 nm, two CO+-FNS lines are at 230 nm and 250 nm. Right:a color photograph of the spark, taken with a SONY α300 camera that wasplaced in a separate Faraday cage for protection reasons. The bright channel isthe spark. The faint “channel”, and the smudged blue light at the bottom of thepicture are reflections from the plate electrode, and the three windows betweenthe spark and the camera lens (the gas vessel window and two ITO windows inboth faraday cages).
Goto and Ohba (unpublished report 2008) performed measurements of thehot plasma spectrum in pure CO2 at several pressures. Their results are similarto the spark spectrum shown here. They identified several wide CO2 lines. Thespectrum in Figure 10 has a higher resolution, and therefore many more linesare observed. These lines are grouped into several bands that agree well withthe wide lines of the 100 Torr (133 mbar) spectrum measured by Goto andOhba, and which are indicated with arrows in the figure. These bands in ourspectrum are located roughly at 375 nm, 390 nm, 415 nm, 440 nm and 470 nm,and all have widths between 10 and 20 nm. We also observe a strong oxygenline at 777 nm which was also reported by Goto and Ohba as well as by Boruckiet al. [1996].
It is interesting to note in this respect, that 6 of the 7 flashes reported byHansell et al. [1995] in their ground observation of Venus’s night-side were foundusing a 777.4 nm filter and one more flash was observed using a 656.3 nm filter.Our spectrum has a strong OI line at ∼777 nm, and a clear and narrow line at658 nm.
5 ConclusionsWe have observed streamers in a previously unexplored set of gasses in con-trolled laboratory settings. These gasses simulate the atmospheres of Venus
20

and Jupiter-like planets. We have demonstrated that streamer discharges arepossible in these gasses, which gives firmer ground to our hope of observingsprites on these planets. We have explored some features of these discharges,such as the inception voltages, the minimal diameter and velocity of the streamerheads and their intensity as compared to the optical brightness. of streamersin air. We find that the streamers in these new gasses follow scaling laws asexpected. We demonstrate that the reduced minimal diameter, p × dmin doesnot depend on pressure. We also find that the streamers in the different gassesare rather similar in their appearance, albeit differences in branching, intensityand the propagation path (straight in air and the jovian mixture but a littlejagged in the venusian mixture). The reduced diameter in all the gasses is ofthe same order of magnitude. In the venusian mixture it is very close to thereduced diameter in air that was reported by Briels et al. [2008a] and by Nijdamet al. [2010], but it is twice as wide in Jupiter. Hence, the diameter is influencedby the composition of the gas. Some considerations on the physical origin ofthese differences, like electron friction and photoionization versus backgroundionization, are discussed in section 2.2. Based on our reduced minimal diame-ter measurements, and the sprite altitudes estimated by Yair et al. [2009], wepredict that sprite tendrils on Jupiter will be at least 300 m wide, and of theorder of a meter wide on Venus.
Most important in terms of the search for planetary sprites, is the fact thatthe streamers in both mixtures emit much less light than in air, and that theyrequire higher inception voltages, particularly in the venusian mixture. There-fore, planetary sprites can be expected to have similar morphology to terrestrialsprites, but they might be significantly weaker in optical brightness and requirea larger charge moment of the parent lightning. These considerations should betaken into account if a more detailed scheme for predicting sprite altitudes thanthe one proposed by Yair et al. [2009], is to be employed.
To maximize the chances of discovering planetary sprites by optical observa-tions, one should focus on the specific spectral lines expected in these discharges.We have examined the optical spectra of streamers and glow in the two atmo-spheres, in the visual and the near UV range. In the venusian atmospherewe find strong N2 lines from the second positive band, as well as considerablyweaker CO lines. We find that this spectrum is significantly different from thehot plasma spectrum found by Borucki et al. [1996] in a similar gas mixture,being populated by many more spectral lines. It is also significantly differentfrom the spectrum measured by Goto and Ohba (unpublished report 2008) inpure CO2, and from our own measurements of the spark spectrum in the N2-CO2 mixture. We find that in the case of a cold plasma discharge the presenceof nitrogen in the atmospheric gas is important and should not be neglected.In case of a hot plasma discharge, a spark, CO2 and CO lines are dominant.Among the strongest lines in our spark spectrum, it is worth mentioning thelines at 777 nm and 658 nm. These lines are close to the wavelengths proposedby Hansell et al. [1995] for lightning observations on Venus. We observe also twovery strong lines at 230 nm and 250 nm, which may be useful as well. However,these two lines are at the edge of our spectrum, where the apparatus sensitivityis low. It is worthwhile to look more closely at this wavelength.
In Jupiter’s atmosphere the spectrum is more complex, consisting both ofcontinuum radiation and very dense spectral lines. The Balmer alpha line, isa common feature of spectra of gasses that contain hydrogen, and can not be
21

considered a characteristic of the cold plasma process spectrum. For example,Borucki et al. [1996] find this line as the strongest feature of the hot plasmaspectrum in a similar gas mixture. On the other hand, we see a dominantcontinuum spectrum, which is not found in Borucki’s work. Moreover, thereare several regions of dense band structure, which are characteristic both ofHelium molecular and atomic spectra, and of the hydrogen molecular spectrum.Calibrated measurements of the jovian spectrum, may yield information on theelectron density and energies in these discharges. Further investigation of thejovian and dry-air spectra is under investigation and some of the results areabout to be published by Nijdam et al. (http://arxiv.org/abs/0912.0894v1,version 1).
This research is supported by the Israeli Science Foundation grant 117/09.Support for experiments conducted by the first author was received from COSTAction P-18, “Physics of Lightning Flash and its Effects” as part of a ShortTerm Scientific Mission (STSM). SN acknowledges support by STW-project06501, part of the Netherlands’ Organization for Scientific Research NWO.
ReferencesBaines, K. H., A. A. Simon-Miller, G. S. Orton, et al. (2007) et al., Polarlightning and decadal-scale cloud variability on Jupiter, Science, 318 (5848),226, doi:10.1126/science.1147912.
Borucki, W. J., and J. A. Magalhaes (1992), Analysis of Voyager 2 images ofjovian lightning, Icarus, 96 (1), 1, doi:10.1016/0019-1035(92)90002-O.
Borucki, W. J., C. P. McKay, D. Jebens, H. S. Lakkaraju, and C. T. Vanajakshi(1996), Spectral irradiance measurements of simulated lightning in planetaryatmospheres, Icarus, 123 (2), 336, doi:10.1006/icar.1996.0162.
Briels, T. M. P. (2007), Exploring streamer variability in experiments, Ph.D.thesis, Technische Universiteit Eindhoven, Eindhoven, Netherlands.
Briels, T. M. P., J. Kos, E. M. van Veldhuizen, and U. Ebert (2006), Circuitdependence of the diameter of pulsed positive streamers in air, Journal ofPhysics D: Applied Physics, 39, 5201, doi:10.1088/0022-3727/39/24/016.
Briels, T. M. P., E. M. van Veldhuizen, and U. Ebert (2008a), Positive stream-ers in air and nitrogen of varying density: experiments on similarity laws,Journal of Physics D: Applied Physics, 41, 234008, doi: 10.1088/0022-3727/41/23/234008.
Briels, T. M. P., J. Kos, G. J. J. Winands, E. M. van Veldhuizen, and U. Ebert(2008b), Positive and negative streamers in ambient air: measuring diameter,velocity and dissipated energy, Journal of Physics D: Applied Physics, 41,234004, doi: 10.1088/0022-3727/41/23/234004
Cummer, S. A., N. Jaugey, J. Li, W. A. Lyons, T. E. Nelson, and E. A. Gerken(2006), Submillisecond imaging of sprite development and structure., Geo-phys. Res. Lett., 33, 4104.
22

Desch, S. J., W. J. Borucki, C. T. Russell, and A. Bar-Nun (2002), Progress inplanetary lightning, Rep. Prog. Phys., 65, 955.
Ebert, U., C. Montijn, T. Briels, W. Hundsdorfer, B. Meulenbroek, A. Rocco,and E. M. van Veldhuizen (2006), The multiscale nature of streamers, PlasmaSources Science and Technology, 15, S118–S129.
Ebert, U. et al. (2009), Recent results on streamer discharges and their relevancefor sprites, J. Geophys. Res., submitted to the same special issue as the presentmanuscript.
Gerken, E., and U. Inan (2003), Observations of decameter-scale morphologiesin sprites, Journal of Atmospheric and Solar-Terrestrial Physics, 65, 567.
Gerken, E., U. Inan, and C. P. Barrington-Leigh (2000), Telescopic imaging ofsprites, Geophys. Res. Lett., 27, 2637.
Goto, Y., Y. Ohba, and K. Narita (2007), Optical and spectral characteristicsof low pressure air discharges as sprite models., J. Atmos. Elec., 27, 105–112.
Gurnett, D. A., W. S. Kurth, A. Roux, R. Gendrin, C. F. Kennel, and J. F.Bolton (1991), Lightning and plasma wave observations from the Galileo flybyof Venus., Science, 253, 1522–1525.
Gurnett, D. A., P. Zarka, R. Manning, W. S. Kurth, G. B. Hospodarsky, T. F.Averkamp, M. L. Kaiser, and W. M. Farrell (2001), Non-detection at Venusof high-frequency radio signals characteristic of terrestrial lightning, Nature,409, 313.
Hampton, D. L.,M. J. Heavner, E. M. Wescott, D. D. Sentman (1996), Opticalspectral characteristics of sprites, Geophys. Res. Lett., 23, 89.
Hansell, S. A., W. K. Wells, and D. M. Hunten (1996), Optical detection oflightning on Venus, Geophys. Res. Lett., 23, 89.
Hu, W., S. A. Cummer, W. A. Lyons, and T. E. Nelson (2002), Lightning chargemoment changes for the initiation of sprites., Geophys. Res. Lett., 29, 1279.
Hu, W., S. A. Cummer, and W. A. Lyons (2007), Testing sprite initiation theoryusing lightning measurements and modeled electromagnetic fields., J. Geo-phys. Res., 112, 13115.
Krasnopolsky, V. A. (2006), A sensitive search for nitric oxide in the loweratmospheres of Venus and Mars: detection on Venus and upper limit forMars., Icarus, 182, 80.
Ksanfomality, L. V. (1980), Venera 9 and 10: thermal radiometry., Icarus, 41,36.
Lavrov, Z. P., A. S. Melnikov, M. Kaening, and J. Roepke (1999), UV conntin-uum emission and diagnostics of hydrogen-containing nonequilibrium plas-mas., Phys. Rev. E, 59, 3526.
Levin, Z., W. B. Borucki, and O. B. Toon (1983), Lightning generation inplanetary atmospheres., Icarus, 56, 80.
23

Linstrom, P.J. and W.G. Mallard (2009), Chemistry WebBook, NIST StandardReference Database Number 69, National Institute of Standards and Tech-nology, Gaithersburg MD, 20899, http://webbook.nist.gov, (retrieved Au-gust, 2009).
Liu, N., and V. P. Pasko (2004), Effects of photoionization on propagation andbranching of positive and negative streamers in sprites, Journal of Geophys.Res., 109, A04301.
Luque, A., and U. Ebert (2009), Emergence of sprite streamers from relaxation-ionization waves in the lower ionosphere, Nature Geosciences, 2, 757.
Luque, A., U. Ebert, C. Montijn, andW. Hundsdorfer (2007), Photoionization innegative streamers: Fast computations and two propagation modes, AppliedPhysics Letters, 90 (8), 081501, doi:10.1063/1.2435934.
Luque, A., U. Ebert, and W. Hundsdorfer (2008), Interaction of streamers inair and other oxygen-nitrogen mixtures, Phys. Rev. Lett., 101, 075005.
Marshall, R., and U. Inana (2006), High-speed measurements of small-scalefeatures in sprites: Sizes and lifetimes, Radio Sci., 41, RS6S43, doi:10.1029/2005RS003353.
McHarg, M. G., H. C. Stenbaek-Nielsen, and T. Kammae (2007), Observationsof streamer formation in sprites, Geophys. Res. Lett., 34, L06804.
Mende, S. B., R. L. Rairden, G. R. Swenson, and W. A. Lyons (1995), Spritespectra: N2 1 PG band identification, Geophys. Res. Lett., 22, 2633.
Moudry, D. R., H. C. Stenbaek-Nielsen, D. D. Sentman, and E. M. Wescott(2002), Velocities of sprite tendrils, Geophys. Res. Lett., 29, 1992.
Nakamura, M., et al. (2007), Planet-C: Venus climate orbiter mission of Japan,Planetary and Space Science, 55 (12), the Planet Venus and the Venus ExpressMission, Part 2, Pages 1831-1842, doi:10.1016/j.pss.2007.01.009.
Nijdam, S., C. G. C. Geurts, E. M. van Veldhuizen, and U. Ebert (2009), Re-connection and merging of positive streamers in air, Journal of Physics D:Applied Physics, 42 (4), 045201.
Nijdam, S., F. M. J. H van de Wetering, R. Blanc, E. M. van Veldhuizen, andU. Ebert (2010), Probing photo-ionization: Experiments on positive streamersin pure gasses and mixtures, accepted for publication in J. Phys. D: AppliedPhysics. http://arxiv.org/abs/0912.0894
Pancheshnyi, S. (2005), Role of electronegative gas admixtures in streamer start,propagation and branching phenomena, Plasma Sources Sci. Technol., 14,645.
Pasko, V. P., U. S. Inan, and Y. N. Taranenko (1997), Sprites produced byquasi-electrostatic heating and ionization in the lower ionosphere., Journal ofGeophys. Res., 102, 4529.
24

Pasko, V. (2006), Sprites, Elves and Intense Lightning Discharges, NATO Sci-ence Series II: Mathematics, Physics and Chemistry, vol. 225, chap. Theoret-ical modeling of sprites and jets, pp. 253, Springer Netherlands.
Pasko, V. P. (2007), Red sprite discharges in the atmosphere at high altitude:the molecular physics and the similarity with laboratory discharges, PlasmaSources Sci. Technol., 16, S13.
Pearse, R. W. B., and A. G. Gaydon (1976), The identification of molecularspectra, 4-th ed., Chapman & Hall Ltd, London.
Raizer, Y. P., G. M. Milikh, M. N. Shneider, and S. V. Novakovski (1998),Long streamers in the upper atmosphere above thundercloud., J. Phys. D.,31, 3255.
Ralchenko, Y., A. E. Kramida, J. Reader, and NIST ASD Team (2008), NISTatomic spectra database, Online version 3.1.5, National Institute of Stan-dards and Technology, Gaithersburg, MD, http://physics.nist.gov/asd3(retrieved August, 2009).
Ruf, C., N. O. Renno, J. F. Kok, E. Bandelier, M. J. Sander, S. Gross, L. Skjerve,and B. Cantor (2009), Emission of non-thermal microwave radiation by a Mar-tian dust storm, Geophys. Res. Lett., 36, L13202, doi:10.1029/2009GL038715.
Russell, C. T., T. L. Zhang, M. Delva, W. Magnes, R. J. Stangeway, and H. Y.Wei (2007), Lightning on Venus inferred from whistler-mode waves in theionosphere., Nature, 450, 661.
Sao Sabbas, F. T., D. D. Sentman, E. M. Wescott, O. Pinto, O. Mendes, Jr., andM. J. Taylor (2003), Statistical analysis of space-time relationships betweensprites and lightning, Journal of Atmospheric and Solar-Terrestrial Physics,65, 525.
Sentman, D. D., E. M. Wescott, D. L. Osborne, D. L. Hampton, andM. J. Heavner (1995), Preliminary results from the Sprites94 aircraft cam-paign: 1. Red sprites, Geophys. Res. Lett., 22, 1205.
Stenbaek-Nielsen, H., R. Haaland, M. G. McHarg, B. A. Hensley, and T. Kan-mae (2009), Sprite initiation altitude measured by triangulation, J. Geophys.Res. manuscript submitted to the same special issue of J. Geophys. Res. asthe present manuscript.
Stenbaek-Nielsen, H. C., and M. G. McHarg (2008), High time-resolution spriteimaging: observations and implications, J. Phys. D: Appl. Phys., 41, 234009.
Stenbaek-Nielsen, H. C., M. G. McHarg, T. Kanmae, and D. D. Sentman (2007),Observed emission rates in sprite streamer heads, Geophys. Res. Lett., 34,L11105, doi:10.1029/2007GL029881.
Takahashi Y., J. Yoshida, Y. Yair, T. Imamura and M. Nakamura (2008), Plan-etary Atmospheric Electricity, chap. Lightning Detection by LAC Onboardthe Japanese Venus Climate Orbiter, Planet-C, p. 317, Springer New York.
25

Teich, T. H. (1967), Emission gasionisierender Strahlung aus ElektronenlawinenII. Messungen in O2-He-Gemischen, Dämpfen, CO2 und Luft; Datenzusam-menstellung, Zeitschrift für Physik, 199 (4), 395.
Williams, E., M. Valente, E. Gerken, and R. Golka (2006), Sprites, Elves andIntense Lightning Discharges, NATO Science Series II: Mathematics, Physicsand Chemistry, vol. 225, chap. Calibrated radiance measurements with anair-filled glow discharge tube: application to sprites in the mesosphere., pp.237–247, Springer Netherlands.
Wilson, C. T. R. (1925), The electric field of a thundercloud and some of itseffects., Proc. Phys. Soc. London, 37, 32D.
Yair, Y., Z. Levin, and S. Tzivion (1995), Lightning generation in a jovianthundercloud: Results from an axisymmetric numerical cloud model, Icarus,115 (2), 421, doi:10.1006/icar.1995.1108.
Yair, Y., G. Fischer, F. Simoes, N. Renno, and P. Zarka (2008), Updated reviewof planetary atmospheric electricity, Space Sci. Rev., 137, 29.
Yair, Y., Y. Takahashi, R. Yaniv, and Y. Ebert, U. end Goto (2009), A studyof the possibility of sprites in the atmospheres of other planets, J. Geophys.Res. 114, E09002.
Yaniv, R., A. D. Devir, Y. Yair, C. Price, B. Ziv and N. Reicher (2009), Cali-bration of CCD cameras for measurements of sprites and elves, Amer. Inst.of Phys. Conf. Proc., Vol. 1118, 92.
Zheleznyak, M. B., A. K. Mnatsakanyan, and S. V. Sizykh (1982), Photoioniza-tion of nitrogen and oxygen mixtures by radiation from a gas discharge, HighTemp., 20, 357.
26