spt-lpt correlation with consideration of grain size...
TRANSCRIPT
SPT-LPT Correlation with Consideration of Grain
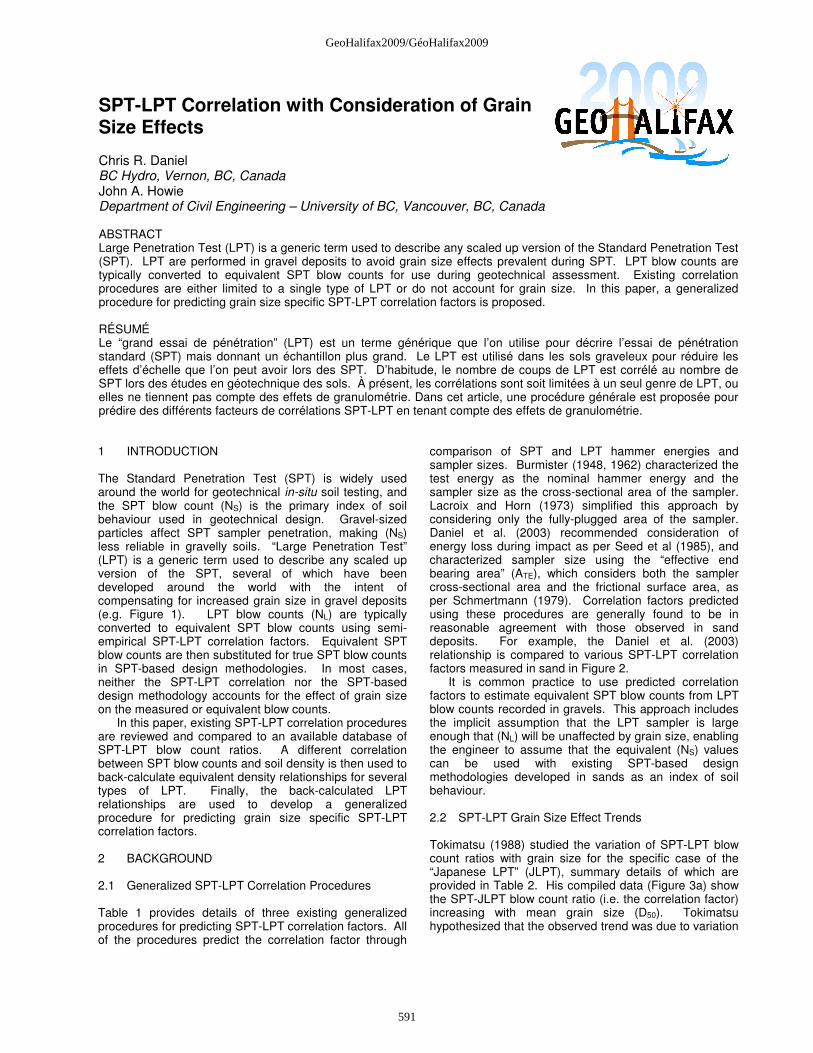
Size Effects Chris R. Daniel BC Hydro, Vernon, BC, Canada John A. Howie Department of Civil Engineering – University of BC, Vancouver, BC, Canada ABSTRACT Large Penetration Test (LPT) is a generic term used to describe any scaled up version of the Standard Penetration Test (SPT). LPT are performed in gravel deposits to avoid grain size effects prevalent during SPT. LPT blow counts are typically converted to equivalent SPT blow counts for use during geotechnical assessment. Existing correlation procedures are either limited to a single type of LPT or do not account for grain size. In this paper, a generalized procedure for predicting grain size specific SPT-LPT correlation factors is proposed. RÉSUMÉ Le “grand essai de pénétration” (LPT) est un terme générique que l’on utilise pour décrire l’essai de pénétration standard (SPT) mais donnant un échantillon plus grand. Le LPT est utilisé dans les sols graveleux pour réduire les effets d’échelle que l’on peut avoir lors des SPT. D’habitude, le nombre de coups de LPT est corrélé au nombre de SPT lors des études en géotechnique des sols. À présent, les corrélations sont soit limitées à un seul genre de LPT, ou elles ne tiennent pas compte des effets de granulométrie. Dans cet article, une procédure générale est proposée pour prédire des différents facteurs de corrélations SPT-LPT en tenant compte des effets de granulométrie. 1 INTRODUCTION The Standard Penetration Test (SPT) is widely used around the world for geotechnical in-situ soil testing, and the SPT blow count (NS) is the primary index of soil behaviour used in geotechnical design. Gravel-sized particles affect SPT sampler penetration, making (NS) less reliable in gravelly soils. “Large Penetration Test” (LPT) is a generic term used to describe any scaled up version of the SPT, several of which have been developed around the world with the intent of compensating for increased grain size in gravel deposits (e.g. Figure 1). LPT blow counts (NL) are typically converted to equivalent SPT blow counts using semi-empirical SPT-LPT correlation factors. Equivalent SPT blow counts are then substituted for true SPT blow counts in SPT-based design methodologies. In most cases, neither the SPT-LPT correlation nor the SPT-based design methodology accounts for the effect of grain size on the measured or equivalent blow counts.
In this paper, existing SPT-LPT correlation procedures are reviewed and compared to an available database of SPT-LPT blow count ratios. A different correlation between SPT blow counts and soil density is then used to back-calculate equivalent density relationships for several types of LPT. Finally, the back-calculated LPT relationships are used to develop a generalized procedure for predicting grain size specific SPT-LPT correlation factors. 2 BACKGROUND 2.1 Generalized SPT-LPT Correlation Procedures Table 1 provides details of three existing generalized procedures for predicting SPT-LPT correlation factors. All of the procedures predict the correlation factor through
comparison of SPT and LPT hammer energies and sampler sizes. Burmister (1948, 1962) characterized the test energy as the nominal hammer energy and the sampler size as the cross-sectional area of the sampler. Lacroix and Horn (1973) simplified this approach by considering only the fully-plugged area of the sampler. Daniel et al. (2003) recommended consideration of energy loss during impact as per Seed et al (1985), and characterized sampler size using the “effective end bearing area” (ATE), which considers both the sampler cross-sectional area and the frictional surface area, as per Schmertmann (1979). Correlation factors predicted using these procedures are generally found to be in reasonable agreement with those observed in sand deposits. For example, the Daniel et al. (2003) relationship is compared to various SPT-LPT correlation factors measured in sand in Figure 2.
It is common practice to use predicted correlation factors to estimate equivalent SPT blow counts from LPT blow counts recorded in gravels. This approach includes the implicit assumption that the LPT sampler is large enough that (NL) will be unaffected by grain size, enabling the engineer to assume that the equivalent (NS) values can be used with existing SPT-based design methodologies developed in sands as an index of soil behaviour.
2.2 SPT-LPT Grain Size Effect Trends Tokimatsu (1988) studied the variation of SPT-LPT blow count ratios with grain size for the specific case of the “Japanese LPT” (JLPT), summary details of which are provided in Table 2. His compiled data (Figure 3a) show the SPT-JLPT blow count ratio (i.e. the correlation factor) increasing with mean grain size (D50). Tokimatsu hypothesized that the observed trend was due to variation
591
GeoHalifax2009/GéoHalifax2009
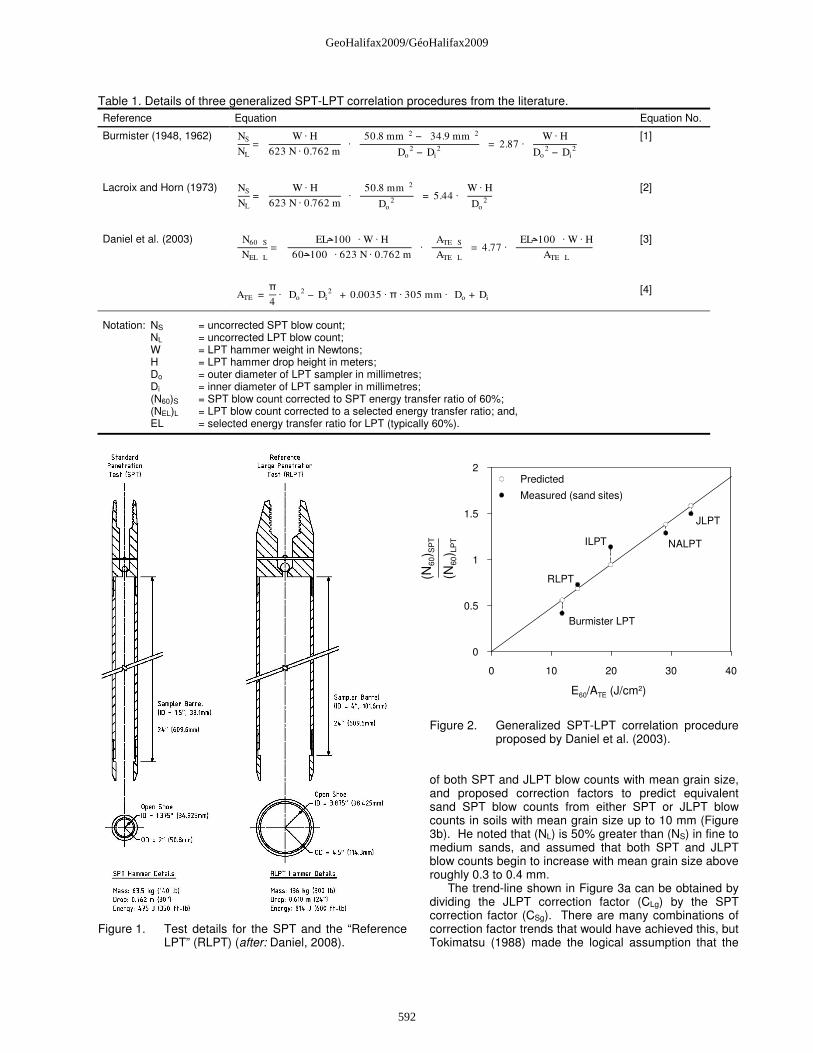
Table 1. Details of three generalized SPT-LPT correlation procedures from the literature. Reference Equation Equation No.
Burmister (1948, 1962) NS
NL
= �W · H
623 N · 0.762 m�· �
�50.8 mm�2 − �34.9 mm�2
Do2 − Di
2�= 2.87 · �
W · H
Do2 − Di
2�
[1]
Lacroix and Horn (1973) NS
NL
= �W · H
623 N · 0.762 m�· �
�50.8 mm�2
Do2
�= 5.44 · �W · H
Do2�
[2]
Daniel et al. (2003) �N60�S
�NEL�L
= ��EL 100� �· W · H
�60 100� �· 623 N · 0.762 m�· �
�ATE�S
�ATE�L
�= 4.77 · ��EL 100� �· W · H
�ATE�L
�
[3]
ATE =
π
4· �Do
2 − Di2�+ 0.0035 · π · 305 mm · �Do + Di�
[4]
Notation: NS = uncorrected SPT blow count; NL = uncorrected LPT blow count; W = LPT hammer weight in Newtons; H = LPT hammer drop height in meters; Do = outer diameter of LPT sampler in millimetres; Di = inner diameter of LPT sampler in millimetres; (N60)S = SPT blow count corrected to SPT energy transfer ratio of 60%; (NEL)L = LPT blow count corrected to a selected energy transfer ratio; and, EL = selected energy transfer ratio for LPT (typically 60%).
Figure 1. Test details for the SPT and the “Reference
LPT” (RLPT) (after: Daniel, 2008).
Figure 2. Generalized SPT-LPT correlation procedure
proposed by Daniel et al. (2003). of both SPT and JLPT blow counts with mean grain size, and proposed correction factors to predict equivalent sand SPT blow counts from either SPT or JLPT blow counts in soils with mean grain size up to 10 mm (Figure 3b). He noted that (NL) is 50% greater than (NS) in fine to medium sands, and assumed that both SPT and JLPT blow counts begin to increase with mean grain size above roughly 0.3 to 0.4 mm.
The trend-line shown in Figure 3a can be obtained by dividing the JLPT correction factor (CLg) by the SPT correction factor (CSg). There are many combinations of correction factor trends that would have achieved this, but Tokimatsu (1988) made the logical assumption that the
RLPT
JLPT
NALPT
Burmister LPT
ILPT
0 10 20 30 40
E60/ATE (J/cm2)
0
0.5
1
1.5
2
(N60
) SP
T
(N60
) LP
T
Predicted
Measured (sand sites)
592
GeoHalifax2009/GéoHalifax2009
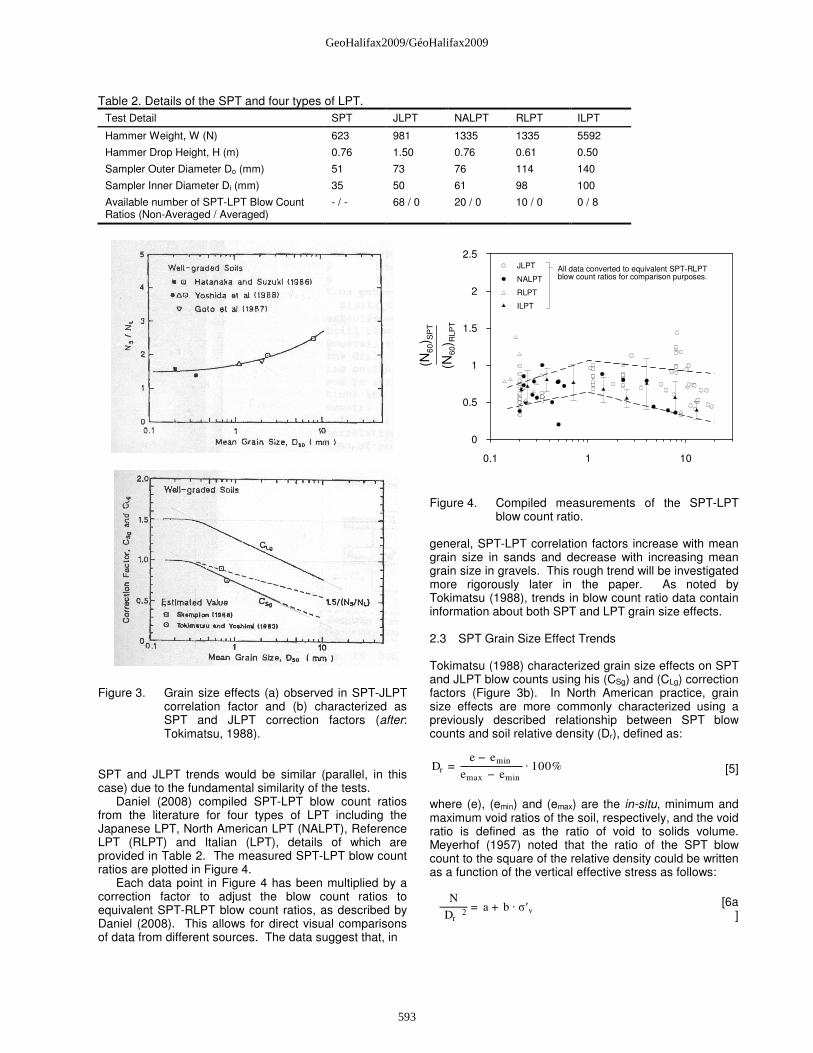
Table 2. Details of the SPT and four types of LPT. Test Detail SPT JLPT NALPT RLPT ILPT
Hammer Weight, W (N) 623 981 1335 1335 5592
Hammer Drop Height, H (m) 0.76 1.50 0.76 0.61 0.50
Sampler Outer Diameter Do (mm) 51 73 76 114 140
Sampler Inner Diameter Di (mm) 35 50 61 98 100
Available number of SPT-LPT Blow Count Ratios (Non-Averaged / Averaged)
- / - 68 / 0 20 / 0 10 / 0 0 / 8
Figure 3. Grain size effects (a) observed in SPT-JLPT
correlation factor and (b) characterized as SPT and JLPT correction factors (after: Tokimatsu, 1988).
SPT and JLPT trends would be similar (parallel, in this case) due to the fundamental similarity of the tests.
Daniel (2008) compiled SPT-LPT blow count ratios from the literature for four types of LPT including the Japanese LPT, North American LPT (NALPT), Reference LPT (RLPT) and Italian (LPT), details of which are provided in Table 2. The measured SPT-LPT blow count ratios are plotted in Figure 4.
Each data point in Figure 4 has been multiplied by a correction factor to adjust the blow count ratios to equivalent SPT-RLPT blow count ratios, as described by Daniel (2008). This allows for direct visual comparisons of data from different sources. The data suggest that, in
Figure 4. Compiled measurements of the SPT-LPT
blow count ratio.
general, SPT-LPT correlation factors increase with mean grain size in sands and decrease with increasing mean grain size in gravels. This rough trend will be investigated more rigorously later in the paper. As noted by Tokimatsu (1988), trends in blow count ratio data contain information about both SPT and LPT grain size effects.
2.3 SPT Grain Size Effect Trends
Tokimatsu (1988) characterized grain size effects on SPT and JLPT blow counts using his (CSg) and (CLg) correction factors (Figure 3b). In North American practice, grain size effects are more commonly characterized using a previously described relationship between SPT blow counts and soil relative density (Dr), defined as:
Dr =e − emin
emax − emin
· 100%
[5]
where (e), (emin) and (emax) are the in-situ, minimum and maximum void ratios of the soil, respectively, and the void ratio is defined as the ratio of void to solids volume. Meyerhof (1957) noted that the ratio of the SPT blow count to the square of the relative density could be written as a function of the vertical effective stress as follows:
N
�Dr�2
= a + b · σ′v
[6a]
(a)
(b)
Mean Grain Size (mm)
0.1 1 10
Mean Grain Size (mm)
0
0.5
1
1.5
2
2.5
(N60
) SP
T
(N60
) RLP
T
JLPT
NALPT
RLPT
ILPT
All data converted to equivalent SPT-RLPTblow count ratios for comparison purposes.
593
GeoHalifax2009/GéoHalifax2009
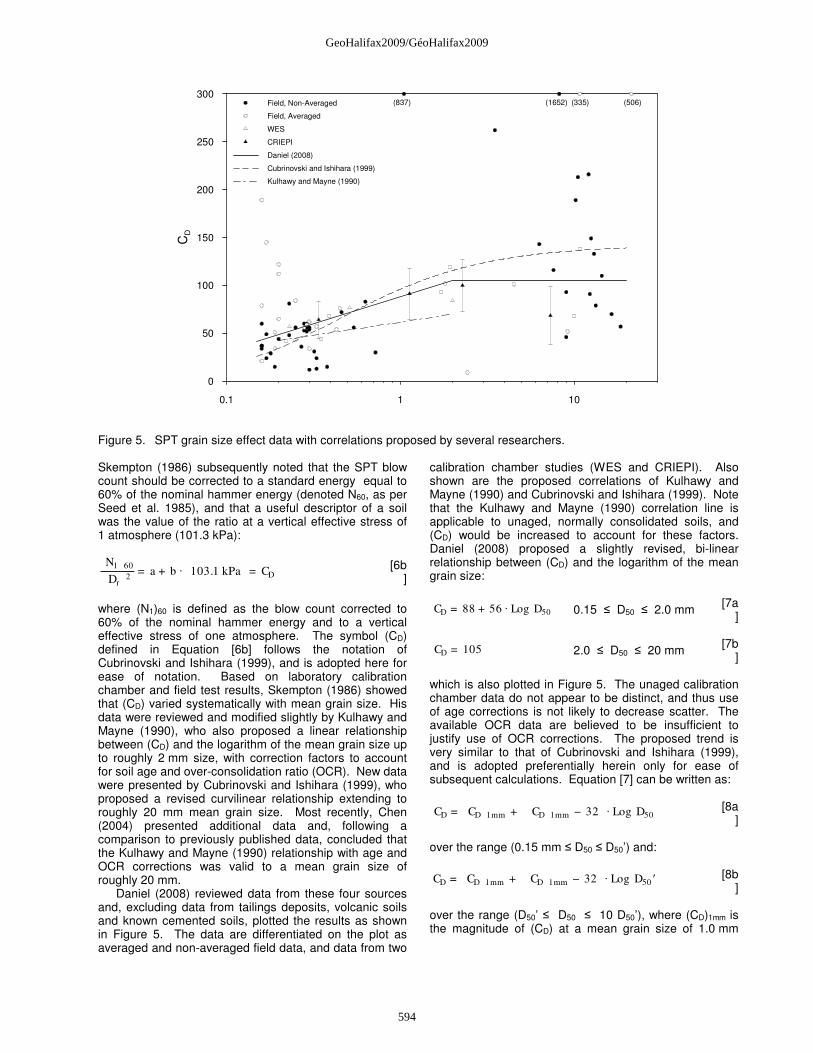
Figure 5. SPT grain size effect data with correlations proposed by several researchers. Skempton (1986) subsequently noted that the SPT blow count should be corrected to a standard energy equal to 60% of the nominal hammer energy (denoted N60, as per Seed et al. 1985), and that a useful descriptor of a soil was the value of the ratio at a vertical effective stress of 1 atmosphere (101.3 kPa): �N1�60
�Dr�2
= a + b · �103.1 kPa�= CD
[6b]
where (N1)60 is defined as the blow count corrected to 60% of the nominal hammer energy and to a vertical effective stress of one atmosphere. The symbol (CD) defined in Equation [6b] follows the notation of Cubrinovski and Ishihara (1999), and is adopted here for ease of notation. Based on laboratory calibration chamber and field test results, Skempton (1986) showed that (CD) varied systematically with mean grain size. His data were reviewed and modified slightly by Kulhawy and Mayne (1990), who also proposed a linear relationship between (CD) and the logarithm of the mean grain size up to roughly 2 mm size, with correction factors to account for soil age and over-consolidation ratio (OCR). New data were presented by Cubrinovski and Ishihara (1999), who proposed a revised curvilinear relationship extending to roughly 20 mm mean grain size. Most recently, Chen (2004) presented additional data and, following a comparison to previously published data, concluded that the Kulhawy and Mayne (1990) relationship with age and OCR corrections was valid to a mean grain size of roughly 20 mm.
Daniel (2008) reviewed data from these four sources and, excluding data from tailings deposits, volcanic soils and known cemented soils, plotted the results as shown in Figure 5. The data are differentiated on the plot as averaged and non-averaged field data, and data from two
calibration chamber studies (WES and CRIEPI). Also shown are the proposed correlations of Kulhawy and Mayne (1990) and Cubrinovski and Ishihara (1999). Note that the Kulhawy and Mayne (1990) correlation line is applicable to unaged, normally consolidated soils, and (CD) would be increased to account for these factors. Daniel (2008) proposed a slightly revised, bi-linear relationship between (CD) and the logarithm of the mean grain size:
CD = 88 + 56 · Log�D50� 0.15 ≤ D50 ≤ 2.0 mm [7a]
CD = 105 2.0 ≤ D50 ≤ 20 mm [7b]
which is also plotted in Figure 5. The unaged calibration chamber data do not appear to be distinct, and thus use of age corrections is not likely to decrease scatter. The available OCR data are believed to be insufficient to justify use of OCR corrections. The proposed trend is very similar to that of Cubrinovski and Ishihara (1999), and is adopted preferentially herein only for ease of subsequent calculations. Equation [7] can be written as:
CD = �CD�1mm + ��CD�1mm − 32�· Log�D50� [8a
] over the range (0.15 mm ≤ D50 ≤ D50’) and:
CD = �CD�1mm + ��CD�1mm − 32�· Log�D50 ′� [8b
] over the range (D50’ ≤ D50 ≤ 10 D50’), where (CD)1mm is the magnitude of (CD) at a mean grain size of 1.0 mm
Mean Grain Size (mm)
0.1 1 10
Mean Grain Size (mm)
0
50
100
150
200
250
300
CD
Field, Non-Averaged
Field, Averaged
WES
CRIEPI
Daniel (2008)
Cubrinovski and Ishihara (1999)
Kulhawy and Mayne (1990)
(837) (1652) (335) (506)
594
GeoHalifax2009/GéoHalifax2009
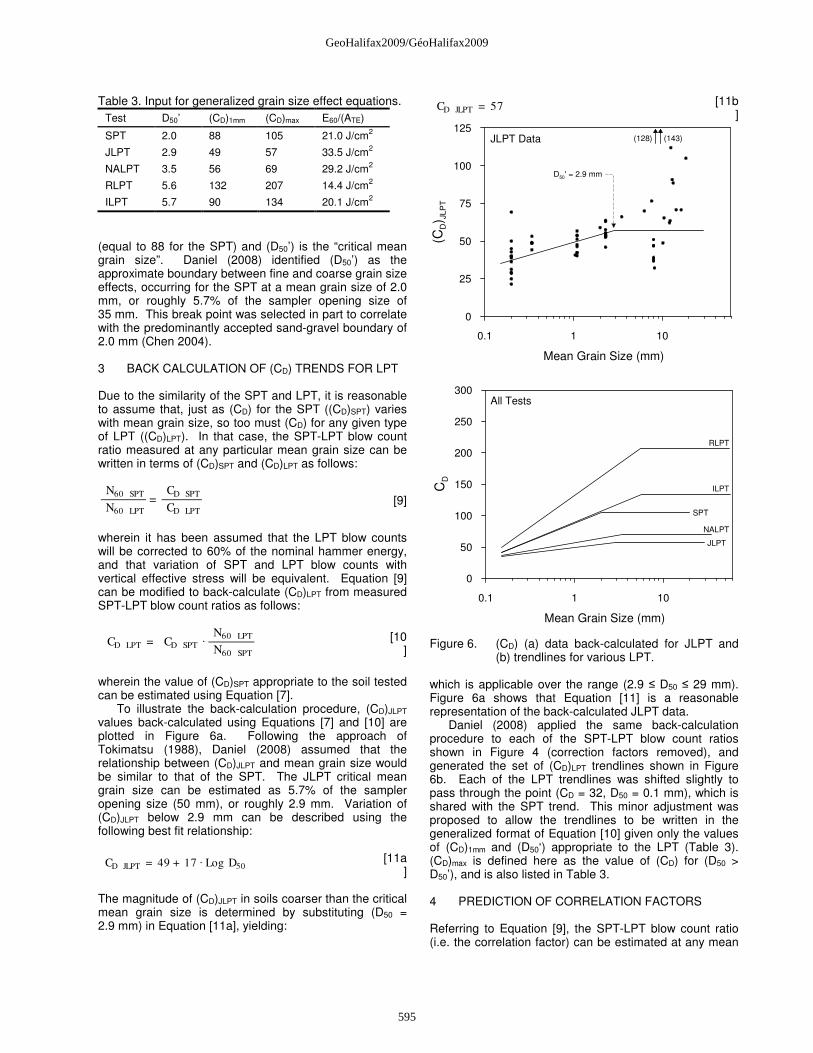
Table 3. Input for generalized grain size effect equations. Test D50’ (CD)1mm (CD)max E60/(ATE)
SPT 2.0 88 105 21.0 J/cm2
JLPT 2.9 49 57 33.5 J/cm2
NALPT 3.5 56 69 29.2 J/cm2
RLPT 5.6 132 207 14.4 J/cm2
ILPT 5.7 90 134 20.1 J/cm2
(equal to 88 for the SPT) and (D50’) is the “critical mean grain size”. Daniel (2008) identified (D50’) as the approximate boundary between fine and coarse grain size effects, occurring for the SPT at a mean grain size of 2.0 mm, or roughly 5.7% of the sampler opening size of 35 mm. This break point was selected in part to correlate with the predominantly accepted sand-gravel boundary of 2.0 mm (Chen 2004).
3 BACK CALCULATION OF (CD) TRENDS FOR LPT Due to the similarity of the SPT and LPT, it is reasonable to assume that, just as (CD) for the SPT ((CD)SPT) varies with mean grain size, so too must (CD) for any given type of LPT ((CD)LPT). In that case, the SPT-LPT blow count ratio measured at any particular mean grain size can be written in terms of (CD)SPT and (CD)LPT as follows: �N60�SPT
�N60�LPT
=�CD�SPT
�CD�LPT
[9]
wherein it has been assumed that the LPT blow counts will be corrected to 60% of the nominal hammer energy, and that variation of SPT and LPT blow counts with vertical effective stress will be equivalent. Equation [9] can be modified to back-calculate (CD)LPT from measured SPT-LPT blow count ratios as follows:
�CD�LPT = �CD�SPT ·�N60�LPT
�N60�SPT
[10]
wherein the value of (CD)SPT appropriate to the soil tested can be estimated using Equation [7].
To illustrate the back-calculation procedure, (CD)JLPT values back-calculated using Equations [7] and [10] are plotted in Figure 6a. Following the approach of Tokimatsu (1988), Daniel (2008) assumed that the relationship between (CD)JLPT and mean grain size would be similar to that of the SPT. The JLPT critical mean grain size can be estimated as 5.7% of the sampler opening size (50 mm), or roughly 2.9 mm. Variation of (CD)JLPT below 2.9 mm can be described using the following best fit relationship:
�CD�JLPT = 49 + 17 · Log�D50� [11a]
The magnitude of (CD)JLPT in soils coarser than the critical mean grain size is determined by substituting (D50 = 2.9 mm) in Equation [11a], yielding:
�CD�JLPT = 57 [11b]
Figure 6. (CD) (a) data back-calculated for JLPT and
(b) trendlines for various LPT. which is applicable over the range (2.9 ≤ D50 ≤ 29 mm). Figure 6a shows that Equation [11] is a reasonable representation of the back-calculated JLPT data.
Daniel (2008) applied the same back-calculation procedure to each of the SPT-LPT blow count ratios shown in Figure 4 (correction factors removed), and generated the set of (CD)LPT trendlines shown in Figure 6b. Each of the LPT trendlines was shifted slightly to pass through the point (CD = 32, D50 = 0.1 mm), which is shared with the SPT trend. This minor adjustment was proposed to allow the trendlines to be written in the generalized format of Equation [10] given only the values of (CD)1mm and (D50‘) appropriate to the LPT (Table 3). (CD)max is defined here as the value of (CD) for (D50 > D50’), and is also listed in Table 3. 4 PREDICTION OF CORRELATION FACTORS Referring to Equation [9], the SPT-LPT blow count ratio (i.e. the correlation factor) can be estimated at any mean
0.1 1 10
Mean Grain Size (mm)
0
25
50
75
100
125
(CD) J
LPT
(128) (143)
D50' = 2.9 mm
0.1 1 10
Mean Grain Size (mm)
0
50
100
150
200
250
300
CD
RLPT
ILPT
SPT
JLPT
NALPT
JLPT Data
All Tests
595
GeoHalifax2009/GéoHalifax2009

grain size given the values of (CD)SPT and (CD)LPT. The generalized formula given in Equation [8] can thus be used with the input listed in Table 3 to calculate SPT-JLPT, SPT-NALPT, SPT-RLPT and SPT-ILPT correlation factors applicable over the range (0.15 < D50 < 20 mm). The top end of this range can be extended to (D50’) of the LPT if it is assumed that (CD)SPT stays constant.
Existing generalized correlation procedures such as the one shown in Figure 2 have successfully related sand correlation factors to LPT hammer energy and sampler size. The magnitude of (CD)1mm for any LPT is closely related to the SPT-LPT correlation factor in sand, and thus it is postulated that (CD)1mm can be predicted from the ratio of LPT hammer energy to sampler size. Based on this and following the approach of Daniel et al. (2003), (CD)1mm is plotted as a function of (E60)/ATE in Figure 7. The available data are seen to be very well represented by the equation:
�CD�1mm = 3350 · �E60 ATE� �− 1.2 [12
] where (E60) and (ATE) are in units of (J) and (cm2), respectively. As for Equation [9], Equation [12] pre-supposes that LPT blow counts will be corrected to 60% of the maximum potential energy of the LPT hammer. Equivalent relationships could readily be written for any selected standard energy.
Equations [7], [8], [9] can be combined to yield the following generalized set of equations for predicting SPT-LPT correlation factors: �N60�SPT
�N60�LPT
=80 + 56 · Log(D50 )
�CD�1mm + ��CD�1mm − 32�· Log�D50�
[13a]
for (0.15 ≤ D50 ≤ 2.0 mm), followed by: �N60�SPT
�N60�LPT
=105
�CD�1mm + ��CD�1mm − 32�· Log�D50�
[13b]
for (2.0 mm ≤ D50 ≤ (D50’)LPT) and, finally: �N60�SPT
�N60�LPT
=105
��CD�max�LPT
[13c]
for ((D50’)LPT ≤ D50). (CD)1mm in Equation [13] is that of the LPT, and can be estimated using Equation [12]. Equation [13] can thus be used to plot the correlation factor versus mean grain size relationship given the magnitude of (E60/ATE) for the LPT and the critical mean grain size of the LPT sampler (equal to 5.7% of the inner diameter). 5 DISCUSSION Equation [13] is plotted against (E60/ATE) in Figure 8 for several values of mean grain size. For comparison, the correlation proposed by Daniel et al. (2003) is also plotted in Figure 8. The latter is seen to be a reasonable representation that would be suitable for initial screening assessments (i.e. the variation of correlation factor with grain size is likely insignificant for many applications).
Figure 7. Method for predicting (CD)1mm.
For more rigorous assessments, the Equation [13] curves can be used to predict grain size variations of the correlation factor by sketching a vertical line at the appropriate value of (E60/ATE) on Figure 8, noting where it intercepts each of the curves, and plotting these values against mean grain size. The correlation factor becomes constant for grain sizes coarser than (D50’) of the LPT. Figure 8 demonstrates that grain size effects on the SPT-LPT correlation factor can be minimized by selecting LPT equipment such that (E60/ATE) is roughly equal to that of the SPT. To achieve an SPT-LPT correlation factor of unity, (E60/ATE) should be around 21 in sands, whereas a value of about 25 would be required in soils with a mean grain size of 8.0 mm.
The procedure described in this paper can be used to estimate an SPT-LPT correlation factor that is appropriate for the LPT used and the mean grain size of the soil being tested. The equivalent SPT blow counts calculated using the correlation factor will be a best estimate of the SPT blow count that would have been recorded in the soil.
The equivalent SPT blow count may need to be adjusted for use with some empirical correlations. For example, if equivalent SPT blow counts determined for a soil with a mean grain size of 10 mm are to be used with an empirical correlation that was developed for soils with a typical mean grain size of 0.5 mm, it may be appropriate to “correct” the equivalent SPT blow count to what would have been measured in a soil with a mean grain size of 0.5 mm using a correction factor equal to the ratio of the (CD)SPT factor at the two mean grain sizes (for this example: 71 / 105 = 0.68). This correction procedure will produce a different blow count than would be obtained by applying a correlation factor measured in sand. The need for, and appropriateness of, such a correction needs to be evaluated on a case-by-case basis.
6 SUMMARY AND CONCLUSIONS A generalized SPT-LPT correlation procedure that considers grain size effects has been proposed. Input required for the procedure includes the LPT hammer
5 10 15 20 25 30 35 40 45
E60/ATE (J/cm2)
0
40
80
120
160
(CD) 1
mm
RLPT
JLPTNALPT
SPTILPT
596
GeoHalifax2009/GéoHalifax2009
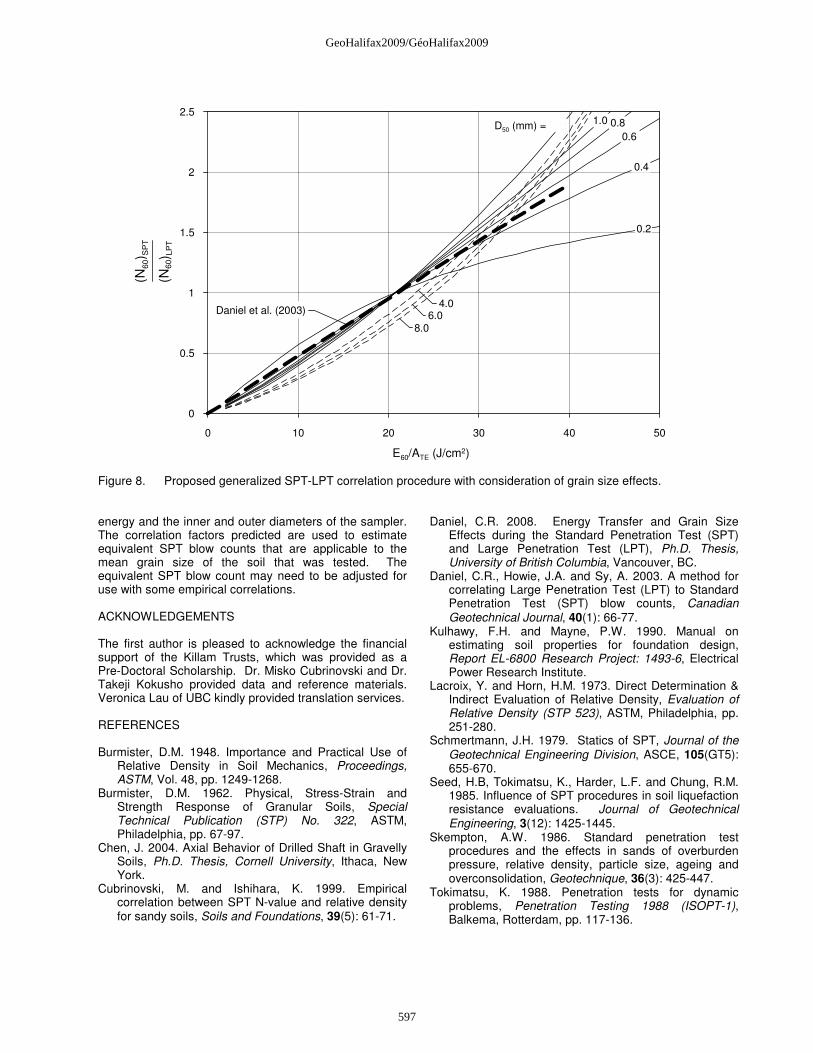
Figure 8. Proposed generalized SPT-LPT correlation procedure with consideration of grain size effects.
energy and the inner and outer diameters of the sampler. The correlation factors predicted are used to estimate equivalent SPT blow counts that are applicable to the mean grain size of the soil that was tested. The equivalent SPT blow count may need to be adjusted for use with some empirical correlations. ACKNOWLEDGEMENTS The first author is pleased to acknowledge the financial support of the Killam Trusts, which was provided as a Pre-Doctoral Scholarship. Dr. Misko Cubrinovski and Dr. Takeji Kokusho provided data and reference materials. Veronica Lau of UBC kindly provided translation services. REFERENCES Burmister, D.M. 1948. Importance and Practical Use of
Relative Density in Soil Mechanics, Proceedings, ASTM, Vol. 48, pp. 1249-1268.
Burmister, D.M. 1962. Physical, Stress-Strain and Strength Response of Granular Soils, Special Technical Publication (STP) No. 322, ASTM, Philadelphia, pp. 67-97.
Chen, J. 2004. Axial Behavior of Drilled Shaft in Gravelly Soils, Ph.D. Thesis, Cornell University, Ithaca, New York.
Cubrinovski, M. and Ishihara, K. 1999. Empirical correlation between SPT N-value and relative density for sandy soils, Soils and Foundations, 39(5): 61-71.
Daniel, C.R. 2008. Energy Transfer and Grain Size Effects during the Standard Penetration Test (SPT) and Large Penetration Test (LPT), Ph.D. Thesis, University of British Columbia, Vancouver, BC.
Daniel, C.R., Howie, J.A. and Sy, A. 2003. A method for correlating Large Penetration Test (LPT) to Standard Penetration Test (SPT) blow counts, Canadian Geotechnical Journal, 40(1): 66-77.
Kulhawy, F.H. and Mayne, P.W. 1990. Manual on estimating soil properties for foundation design, Report EL-6800 Research Project: 1493-6, Electrical Power Research Institute.
Lacroix, Y. and Horn, H.M. 1973. Direct Determination & Indirect Evaluation of Relative Density, Evaluation of Relative Density (STP 523), ASTM, Philadelphia, pp. 251-280.
Schmertmann, J.H. 1979. Statics of SPT, Journal of the Geotechnical Engineering Division, ASCE, 105(GT5): 655-670.
Seed, H.B, Tokimatsu, K., Harder, L.F. and Chung, R.M. 1985. Influence of SPT procedures in soil liquefaction resistance evaluations. Journal of Geotechnical Engineering, 3(12): 1425-1445.
Skempton, A.W. 1986. Standard penetration test procedures and the effects in sands of overburden pressure, relative density, particle size, ageing and overconsolidation, Geotechnique, 36(3): 425-447.
Tokimatsu, K. 1988. Penetration tests for dynamic problems, Penetration Testing 1988 (ISOPT-1), Balkema, Rotterdam, pp. 117-136.
2.0
0 10 20 30 40 50
E60/ATE (J/cm2)
0
0.5
1
1.5
2
2.5
(N60
) SP
T
(N60
) LP
T
D50 (mm) =
0.2
0.4
0.60.81.00.2
8.0
4.06.0Daniel et al. (2003)
597
GeoHalifax2009/GéoHalifax2009