spunky bottoms - ideals
TRANSCRIPT

1
University of Illinois Institute of Natural Resource Sustainability William Shilts, Executive Director ILLINOIS NATURAL HISTORY SURVEY Brian D. Anderson, Director 1816 South Oak Street Champaign, IL 61820 217-333-6830
Changes in the Fish Community at The Nature Conservancy’s Merwin Preserve at
Spunky Bottoms
Levi E. Solomon, Richard M. Pendleton, and Andrew F. Casper
Illinois River Biological Station
Illinois Natural History Survey
Prairie Research Institute
University of Illinois
Nathan T. Grider and Rob B. Hilsabeck
Illinois Department of Natural Resources
INHS Technical Report 2014 (31)
Prepared for Illinois Department of Natural Resources, Division of Fisheries
The Nature Conservancy
Illinois Natural History Survey
Issue Date: 09/24/2014
Unrestricted; for immediate online release.
May 2003 October 1998

2

3
Executive Summary
The fish community at the Merwin Preserve has undergone several changes over the 15 years of this
study, several coinciding with low water levels observed in 2005 and drought events in 2007, 2012, and
2013. The fish community quickly progressed into a sport fish dominated system with abundant native
fishes, however all fish populations declined in the mid to late 2000’s, coinciding with low water of 2005
and drought of 2007. As fish communities began to recover, the community shifted to a Common Carp
and Bigmouth Buffalo dominated system with drastically reduced sport fish populations in 2012 and
2013. These shifts coincided with additional drought events during those two years. Presently, after the
breaching of the levee by 2013 record flooding throughout the Illinois River, the Merwin Preserve is a
semi-connected backwater of the Illinois River dominated by Common Carp and Bigmouth Buffalo.
Photos on cover courtesy of K. Douglas Blodgett, The Nature Conservancy
4
Chapter 1:
Long term monitoring of the fish community of the Merwin Preserve at Spunky
Bottoms
Preface:
Chapter 1 of this report is based on an unfunded data collection effort spanning a 15 year period by
many different staff members at the Illinois River Biological Station and The Nature Conservancy. The
authors want to express our thanks to all those who implemented this project and have assisted over
the years. In particular, we thank K. Douglas Blodgett, Tharran Hobson, and Denim Perry of The Nature
Conservancy and Thad Cook, Kevin Irons, and Matt O’Hara of the Illinois River Biological Station for their
roles in the implementation of this project and subsequent years of dedicated data collection.
Introduction:
The Nature Conservancy (TNC) began restoration of the Merwin Preserve at Spunky Bottoms in the late
1990’s. Located in Brown County, IL, near Meredosia, the Merwin Preserve contains approximately 480
hectares of aquatic and wetland habitat home to abundant aquatic vegetation and fish species (Figure
1). The Illinois River Biological Station (IRBS) has sampled TNC’s Merwin Preserve on an annual basis in
order to document changes in fish communities over time. Monitoring began in 1999 and has
continued despite several years of drought-driven low water levels which, at times, limited sampling
efforts. The results show several shifts in the fish community corresponding to a progression of natural
restoration and extreme drought events. Monitoring has also continued despite a breach in the south
levee in the flood of 2013 connecting the Merwin Preserve to Camp Creek. Subsequently, TNC created a
notch in the previously unbroken levee to allow water to continue to drain out of the area, creating a
semi-permanent connection to the main channel of the Illinois River.
Methods:
Fish communities were sampled annually with boat mounted pulsed DC electrofishing adopting Long
Term Resource Monitoring Program (LTRMP) methods found in Gutreuter et al. (1995) from 2000-2013.
AC electrofishing was used in 1999 only, and these data were not used in any analysis as caution must
be taken when comparing AC and DC electrofishing (McClelland et al. 2013). LTRMP methods were
modified by electrofishing two fixed sites with 30-45 minute runs, rather than using a random sampling
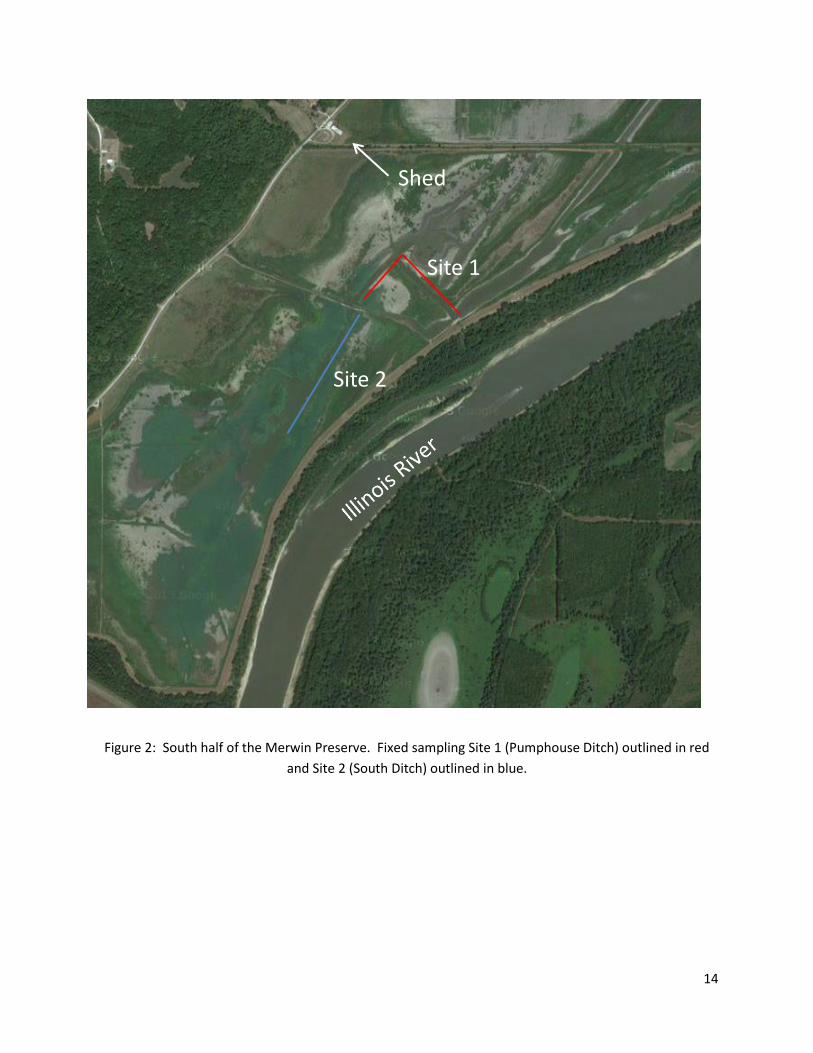
design with 15 minute runs. Fixed sites included the Pumphouse Ditch (Site 1) and South Ditch (Site 2)
and all sampling occurred during the fall (Figure 2). Both sites were sampled every year with the
exception of 2000 (site 2 only), 2007 (site 1 only), and 2013 (site 1 only). No data exists from 2010. All
fish sampled were identified to species, measured (mm), weighed (g) and released. Weights of fish
were not taken consistently in all years. Data was collected during the summer of 2006, but not used in
any analysis.
5
Total fish collected, species richness, and community composition including ratio of natives to non-
natives and ratio of sport fish to non-sport fish was assessed. Total fish collected was the only analysis
to include AC electrofishing data collected in 1999. Catch per unit effort (CPUE) was calculated for
abundant species in collections and estimated as individuals collected per hour of electrofishing.
Body condition as reflected by relative weight (Wr) analyses followed the methods outlined by Nuemann
et al. (2012) were performed on Largemouth Bass and Common Carp in all years where weight data
existed. An average Wr score is 100, and scores too low (<80) or too high (>120) could indicate unhealthy
fishes. Wr values for fishes collected within the Merwin Preserve were then compared to Largemouth
Bass and Common Carp sampled by LTRMP electrofishing conducted in connected backwater lakes of
the La Grange Reach of the Illinois River (RM 80.0-RM 158). Analysis of variance (ANOVA) was used to
compare Wr among years at the Merwin Preserve to test for effect of low water years on fish condition
and between fish sampled at the Merwin Preserve and fish sampled in connected backwaters of the La
Grange Reach. ANOVA of Wr was limited to Common Carp and Largemouth Bass due to insufficient
weight data (n<20/year) for other species.
Results:
Water levels
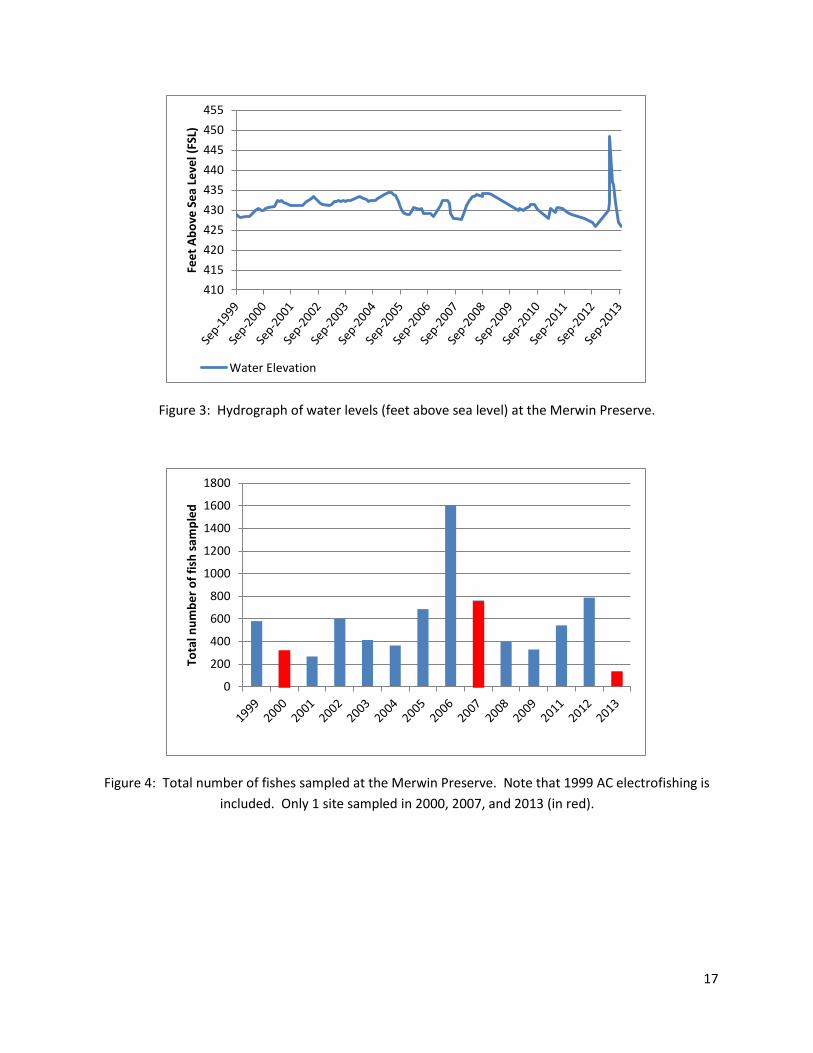
Extreme water level fluctuations were observed at the Merwin Preserve in 2005, 2007, 2012, and 2013
(Figure 3). Low water was observed in 2005 and drought conditions in 2007 resulted in the inundation
of the ditches only (TNC, unpublished data). Water levels recovered from 2008-2011, however the
drought of 2012 dried out the wetland and left only the ditches inundated.
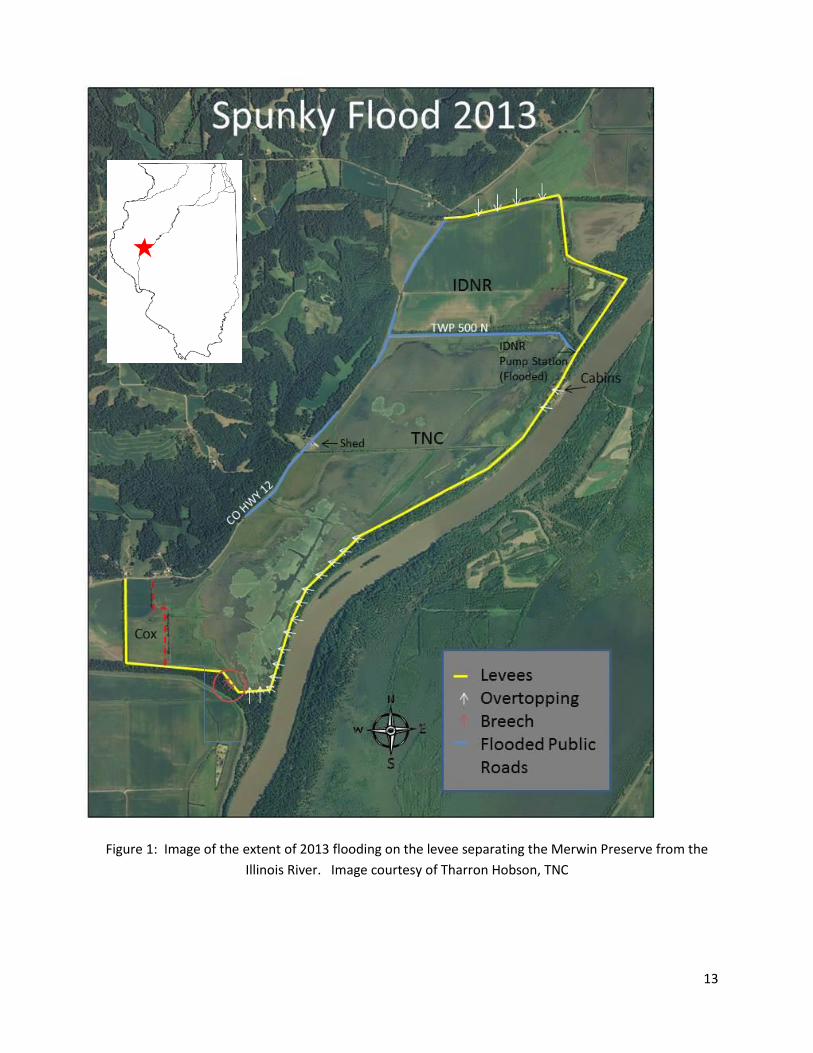
The flood of 2013 breached the levee on the south side while also overtopping the levee in the
southeast corner, the east side near the pumphouse, and the north side (Figure 1) (Tharran Hobson,
TNC, pers. comm). Following the breach, the Merwin Preserve and most of the surrounding lowland
areas were inundated. A notch in the unbroken levee made by TNC to drain the area has created a
semi-permanent connection to the main channel of the Illinois River, connecting when the river stage
rises above ~6’ at the USGS Meredosia gauge (USGS Gage # 05585500, Illinois River at Meredosia, IL).
High water levels in the spring were followed by drought conditions throughout the rest of 2013, leading
to inundation of only the ditches by the fall of 2013.
Fish Community Structure
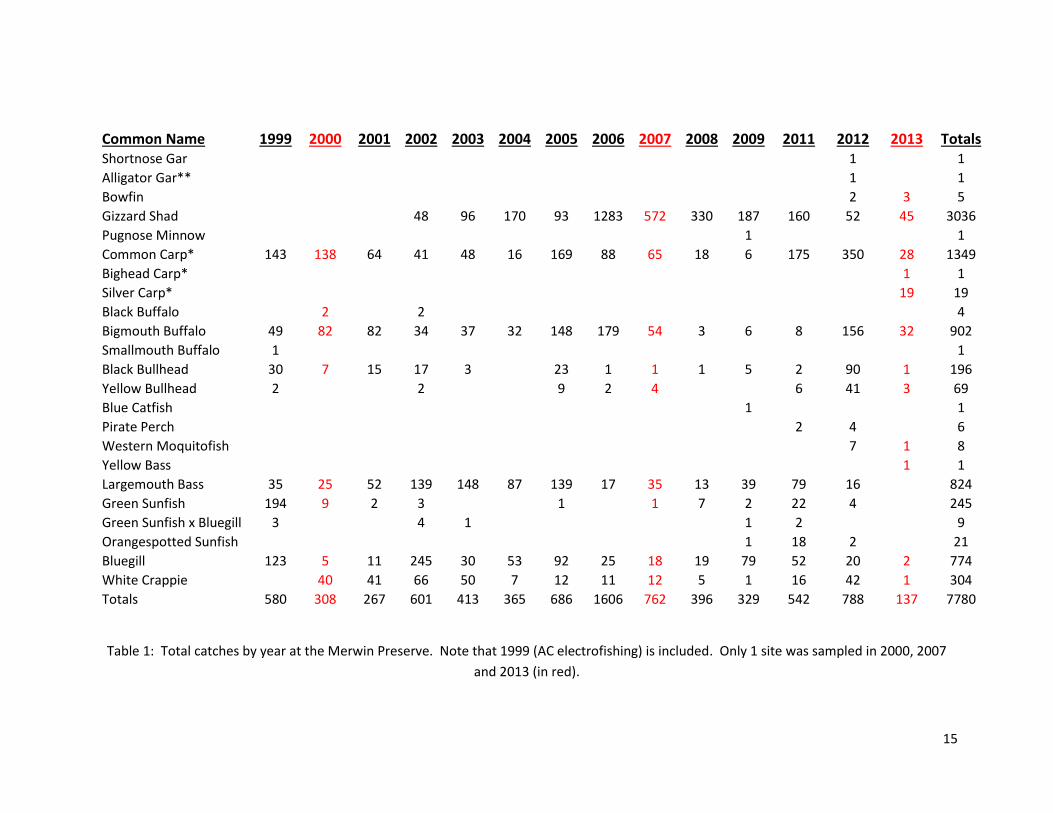
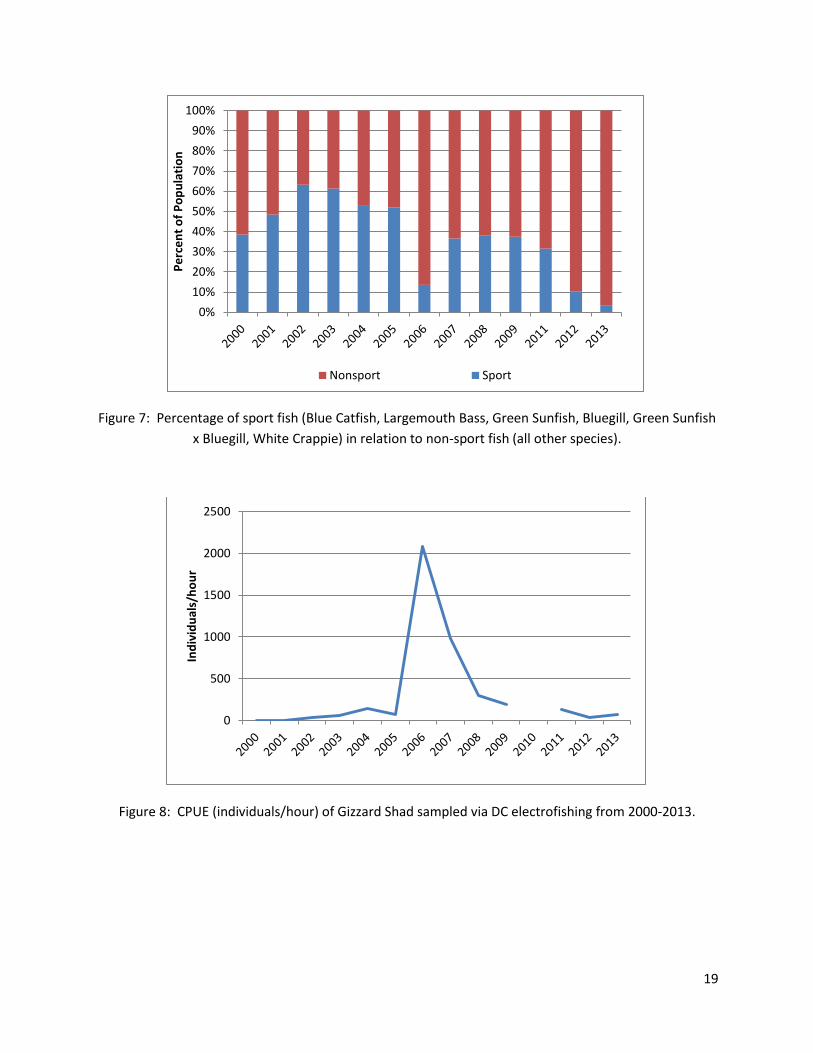
7780 individual fishes were collected during annual fall sampling from 1999-2013, and total catches by
year and species are reported in Table 1 and Figure 4. 23 species from 10 families have been collected:
18 native species, three non-native (Bighead Carp Hypophthalmichthys nobilis, Silver Carp H. molitrix
and Common Carp Cyprinus carpio), one hybrid species (Green Sunfish x Bluegill Lepomis cyanellus x L.
macrochirus), and one re-introduced species (Alligator Gar Atractosteus spatula) (Table 2). Total catche
was dominated by Gizzard Shad Dorosoma cepedianum, Common Carp, Bigmouth Buffalo Ictiobus
cyprinellus, Largemouth Bass Micropterus salmoides, and Bluegill L. macrochirus.

6
Species richness increased from 8 species in 2000 to a peak of 15 species collected in 2012 (Figure 5).
Beginning in 2009, richness steadily increased with three new species detected in 2009 (Blue Catfish
Ictalurus furcatus, Orangespotted Sunfish Lepomis humilis, and Pugnose Minnow Opsopoedus emiliae),
one new species in 2011 (Pirate Perch Apredoderus sayanus), four new species in 2012 (Bowfin Amia
calva, Western Mosquitofish Gambusia affinis, Shortnose Gar Lepisosteus platostomus and the re-
introduced Alligator Gar), and three new species in 2013 (Bighead Carp, Silver Carp and Yellow Bass
Morone mississippiensis). Blue Catfish and Pugnose Minnow were only collected in 2009.
Abundance of native fish in relation to non-natives ranged from 56%-98% (mean 75.7% ± SD 12.6%, used
throughout). Abundance of non-native fish in relation to natives ranged from 2%-44% (24.3% ± 12.6%)
(Figure 6). Following low water observed in 2005, native fish catch began a steady, consistent decline
(study low of 56% in relation to non-natives in 2012) while non-native catches increased (study high of
44% in relation to natives in 2012). 2009 was the only major exception, with 98% of catch being native
species. Overall, native fish have comprised >50% of the fish community in all years of this study.
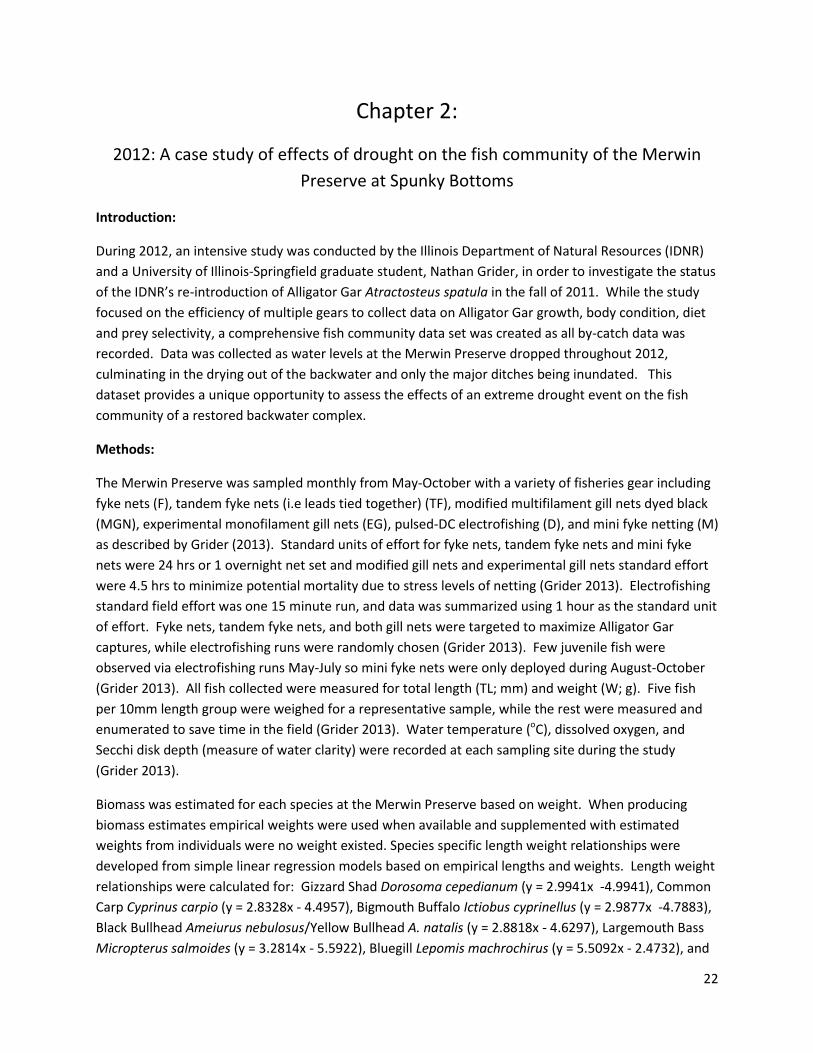
Abundance of sport fish (Blue Catfish, Largemouth Bass, Green Sunfish Lepomis cyanellus, Bluegill,
Green Sunfish x Bluegill, and White Crappie Pomoxis annularis) in relation to non-sport fish (all other
species) ranged from 3%-63% (37.8% ± 18.2%) while abundance of non-sport fish in relation to sport fish
ranged from 37%-97% (62.1% ± 18.2%) (Figure 7). Similar to natives in relation to non-natives, sport fish
in relation to non-sport fish increased from 2000-2002 and remained >50% of catch through 2005.
Following the low water of 2005, sport fish catches decreased consistently while non-sport fish
increased. Sport fish were only 3% of total catches in 2013, down from a high of 63% of the total catch
in 2002.
Catch per unit effort
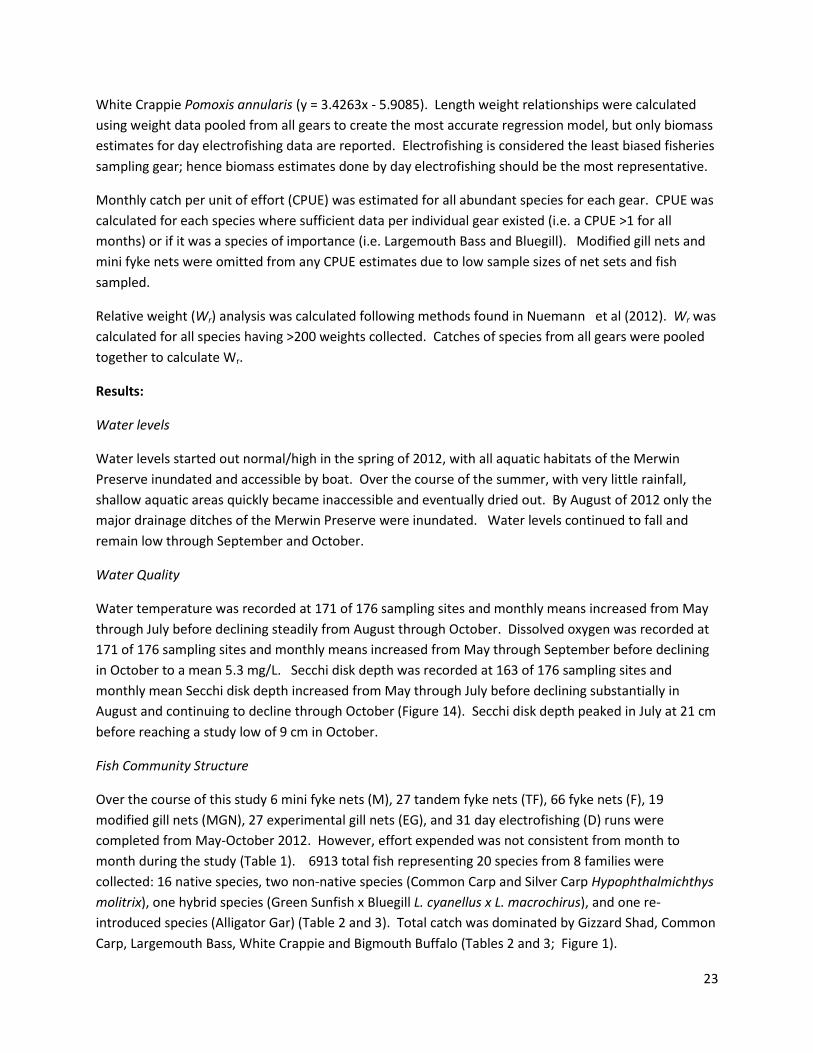
CPUE (individuals/hour) was calculated for all species with sufficient data available; Gizzard Shad (Figure
8), Common Carp, Bigmouth Buffalo, Largemouth Bass, Bluegill, and White Crappie (Figure 9). Gizzard
Shad were first observed in 2002, and CPUE increased dramatically in 2005. CPUE dropped significantly
between 2005 and 2009, yet remained the highest of any species in those years. Common Carp and
Bigmouth Buffalo CPUE was highly variable over the 13 years: estimates declined from 2000 to 2004,
increased during 2005-2007, fell again in 2008 and 2009, and recovered between 2011 and 2013. CPUE
of Largemouth Bass and Bluegill were highest during 2001-2005 prior to a decline from 2005 to 2008,
increased again in 2009 and 2011 before collapsing in 2012 and 2013. White Crappie CPUE started high
during 2000 to 2003, but unlike the other species declined in 2004 and remained low throughout the
rest of the study, never returning to levels seen during the initial years of sampling.
Relative weight (Wr)
Largemouth bass Wr ranged from 91.6- 136.2 (104.8 ± 10.9) at the Merwin Preserve, peaking in 2008
and dropping to a study low of 91.7 in 2012. However, this range of values is considered healthy for
Largemouth Bass. Data from La Grange Reach backwaters were similar to the Merwin Preserve (Figure
10). Common Carp Wr from the Merwin Preserve ranged from 69.9 to 103.6 (88.5 ± 10.9), with a study
low of 69.9 in 2006 before peaking in 2008. Data from La Grange Reach backwaters indicated healthier
7
populations of Common Carp in nearly every year of the study, and those collected at the Merwin
Preserve exhibited Wr scores <80 in 2006, 2007, and 2012 (Figure 11). Insufficient Largemouth Bass and
Common Carp data exists for reliable and representative comparison among years at the Merwin
Preserve or between La Grange Reach backwaters and the Merwin Preserve fish using statistical
analysis.
Discussion:
Fish Community Structure
The fish community at the Merwin Preserve has undergone several changes over the 15 years of this
study, several coinciding with low water levels observed in 2005 and drought events in 2007, 2012, and
2013. The fish community quickly shifted a sport fish dominated system with abundant native fishes,
however all fish populations declined in the mid to late 2000’s, coinciding with low water of 2005 and
drought of 2007. As fish communities began to recover, the community shifted to a Common Carp and
Bigmouth Buffalo dominated system with drastically reduced sport fish populations in 2012 and 2013.
These shifts coincided with additional drought events during those two years. Presently, after the
breaching of the levee in 2013 by record flooding throughout the Illinois River system and subsequent
notch created by TNC to drain the area, the Merwin Preserve is a semi-connected backwater of the
Illinois River (when the river stage height at Meredosia is above 6 ft) dominated by Common Carp and
Bigmouth Buffalo.
Species richness in collections has increased over time, showing a greater increase after 2009. 2009 was
a flood year on the Illinois River, with heights reaching >26’ on the Meredosia gauge (flood stage=17’),
and being the 9th highest crest on Record (National Weather Service). Based on the collection of river
species that were previously absent, we conclude that some level of connectivity to the river likely
occurred in 2009. The newly arrived river species were Blue Catfish, Orangespotted Sunfish, Pugnose
Minnow, Pirate Perch, Western Mosquitofish, Bowfin, Shortnose Gar, Silver Carp, Bighead Carp and
Yellow Bass. Leaping Silver Carp were also observed in 2012, however none were collected until 2013.
Subsequent connections to the river could have allowed fish immigration into Merwin Preserve after
2009 and prior to the overtopping and breaching of 2013. Fish could have also entered the Merwin
Preserve through back-siphoning during pumping to maintain water levels in 2002, 2008, or 2009
(Grider 2013).
Species richness was also likely influenced by a stocking program from 2006-2009 by the cooperative
efforts of the Illinois Natural History Survey, Illinois Department of Natural Resources, The Nature
Conservancy, and The Wetlands Initiative (Retzer et al. 2009). This project stocked Orangespotted
Sunfish (n=347), Pirate Perch (n=214), Bowfin (1), and Shortnose Gar (n=26) along with 13 other species
not detected in this study. It is reasonable to assume that Orangespotted Sunfish and Pirate Perch
sampled in this study were potentially stocked by this project; however no Blue Catfish or Pugnose
Minnow (each first collected in 2009) were stocked. This supports some form of connection to the
Illinois River potentially occuring during high water in 2009. Retzer et al. (2009) also report a single,

8
large Silver Carp was observed in 2009 (prior to initial observation in 2012 by this study), further
supporting the idea that some degree of connection occurred.
Community structure has also varied substantially over the 15 years of this study, often coinciding with
fluctuating water levels. For example, native fish and sport fish catches (in relation to total catch)
increased from 2000-2004, while non-natives and non-sport fish decreased. Following low water of
2005 and drought conditions of 2007, the fish community shifted: non-native and non-sport fish
increased as native and sport fish decreased. Note that decreasing water levels should increase catch
efficiency due to fishes being confined to a smaller area; however a decrease in catch of native/sport
fish was observed indicating that low water and drought events likely led to a die off that affected them
more than non-native/non-sport fish. Following consecutive droughts during 2012 and 2013 (and the
breaching/notching of the levee), the fish community is presently dominated by Common Carp and
Bigmouth Buffalo with abundant Silver Carp and Gizzard Shad. While only 19 Silver Carp were sampled,
more were observed jumping from the water during annual fall sampling (TD VanMiddlesworth pers.
Comm.)
Catch per unit effort
CPUE results, similar to community composition analyses, show a progression of the Merwin Preserve
into a sport fish dominated community in the early 2000’s with abundant Largemouth Bass, Bluegill and
White Crappie and low CPUE of non-native/non-sport fishes. However, Common Carp and Bigmouth
Buffalo could have been abundant in the shallow water habitats throughout the Merwin Preserve from
2001-2004, but potentially not adequately sampled due to the fixed site sampling strategy implemented
in the major drainage ditches. Therefore, the sport fish community may have persisted in conjunction
with the presence of Common Carp and Bigmouth Buffalo. If this were true, it would mean that the
sport fish community came to dominate the Merwin Preserve despite of high numbers of Common Carp
present in the system.
The initial progression of the Merwin Preserve was followed by a decline in popular sport fish
Largemouth Bass and Bluegill and increase in CPUE of Common Carp, Bigmouth Buffalo, and Gizzard
Shad between 2005 and 2007. The low water of 2005 and the drought of 2007 could have
concentrated fish populations in the deeper ditch habitats, allowing fish to be sampled more efficiently
than in higher water years. As mentioned previously, this would suggest that Common Carp and
Bigmouth Buffalo were indeed present in the shallow water habitats in the early 2000’s as the sport fish
community flourished. This also suggests that Largemouth Bass and Bluegill were likely more severely
impacted by low water and drought events when compared to Common Carp, Bigmouth Buffalo and
Gizzard Shad. In 2008, following the major drought event in 2007, massive declines in CPUE were
observed for all species. These declines may be attributed to the condensing of all fishes from the
Merwin Preserve into just the major drainage ditches. These drainage ditches were likely unable to
provide adequate food and habitat resources to support high fish densities; this likely lead to a die off
during the winter of 2007 with subsequent declines in CPUE observed in the fall of 2008.
9
Largemouth Bass and Bluegill were the only species in which CPUE increased in 2009 after the drought:
Gizzard Shad, Common Carp, Bigmouth Buffalo, and White Crappie CPUE continued to decline in 2009.
Unfortunately, no data exists from 2010, leading to a break in all CPUE graphs. Therefore, it difficult to
determine if the fish community was progressing back to a sport fish dominated community (similar to
the early 2000’s) or moving to a Common Carp and Bigmouth Buffalo dominated community, which
developed after consecutive droughts in 2012 and 2013.
Data collection resumed in 2011. From 2011-2013, during a period of successive years of extreme
environmental conditions, CPUE of Bluegill and Largemouth Bass declined substantially. No
Largemouth Bass were collected in 2013 for the first time in this study, despite fishes being confined to
only the major drainage ditches. Conversely 2012 Common Carp CPUE was the highest observed over
the course of the study before a decline in 2013. Bigmouth Buffalo and White Crappie CPUE exhibited a
similar pattern, peaking in 2012 and then declining in 2013. However, visual observations suggest that
CPUE of Common Carp and Bigmouth Buffalo were likely underestimated in 2012 and 2013. Anecdotal
observations from sampling biologists indicated incredibly dense concentrations of these two species in
the east end on Site 1 (Pumphouse Ditch), just beyond the fixed sampling area during both years.
Green sunfish catches showed a unique trend. There were 194 green sunfish collected in 1999 using AC
electrofishing while subsequent years of DC electrofishing collected only nine, two, three, and zero
(Table 1). Although gears changed between 1999 and 2000, it is likely Green Sunfish declined due to
changes in the system and not biases associated with sampling gear. Interestingly, Green Sunfish CPUE
followed similar declines of Common Carp and Bigmouth Buffalo CPUE that also occurred in the early
2000’s and did not follow increases in CPUE of other Centrarchid species (i.e. Largemouth Bass, Bluegill
and White Crappie). Moreover, Green Sunfish CPUE never recovered, and remain a minor component
of the fish community to date. Green Sunfish are considered a very tolerant and hardy fish (Pflieger
1997), and their decline compared to the increases in the less tolerant Centrarchids in this environment
is odd.
Observations of Yellow and Black Bullhead , which are both considered hardy fish and tolerant of a
variety of conditions like Green Sunfish (Pflieger 1997) and Common Carp, also reflect changes in the
Merwin Preserve observed over time. Yellow and Black Bullhead catches declined from 2000-2004,
increased coinciding with the low water levels in 2005, only to decline as water levels stabilized from
2008-2011. During the drought of 2012 CPUE of both bullhead species peaked at 30% of all fish sampled
in Site 2 (Yellow Bullhead 11%; Black Bullhead 19%, respectively) and 17% of all fish sampled in 2012.
Yellow and Black Bullhead numbers declined sharply again in 2013, potentially because low water levels
made Site 2 inaccessible. But, looking at data from 2012, it is likely both bullhead species persisted
despite the extreme water level fluctuations.
Relative weight (Wr)
Wr analysis of Common Carp indicated variable body condition, ranging from 69.9-103.6. An average Wr
score is 100, and scores too low (<80) or too high (>120) could indicate unhealthy fishes. Low Wr was
observed in 2006 (69.9), 2007 (80.3), and 2012 (77.3). These low Wr scores correspond to drought years
10
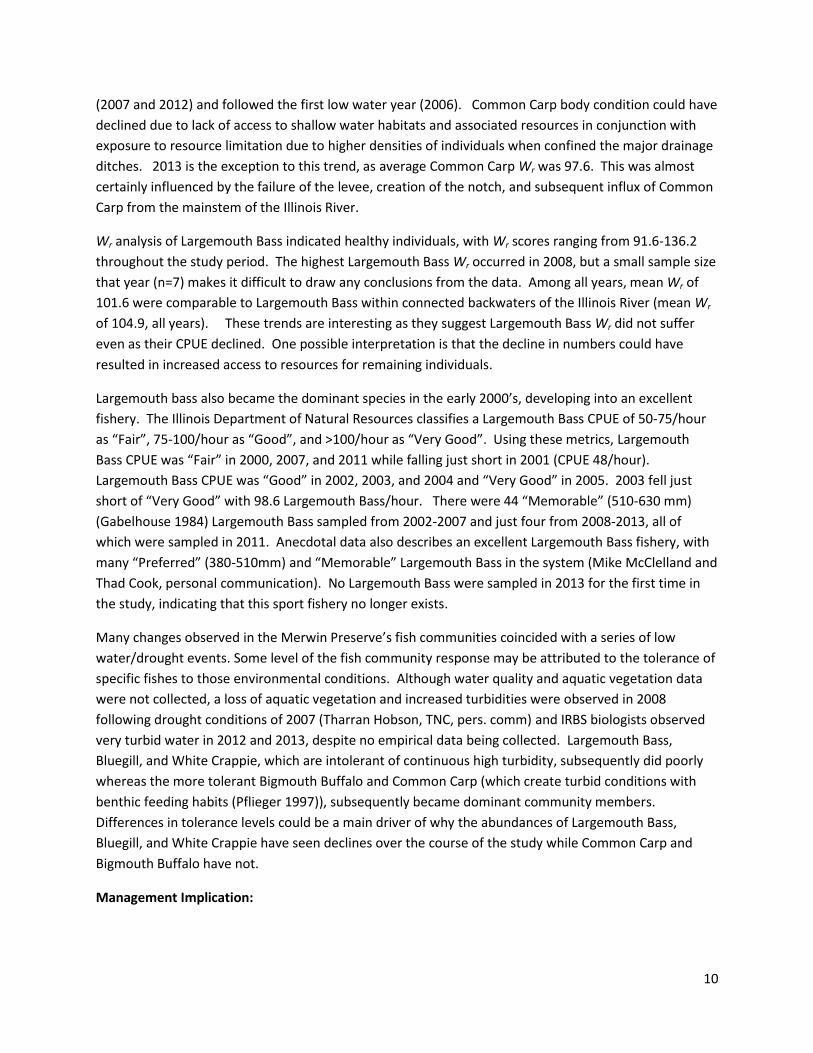
(2007 and 2012) and followed the first low water year (2006). Common Carp body condition could have
declined due to lack of access to shallow water habitats and associated resources in conjunction with
exposure to resource limitation due to higher densities of individuals when confined the major drainage
ditches. 2013 is the exception to this trend, as average Common Carp Wr was 97.6. This was almost
certainly influenced by the failure of the levee, creation of the notch, and subsequent influx of Common
Carp from the mainstem of the Illinois River.
Wr analysis of Largemouth Bass indicated healthy individuals, with Wr scores ranging from 91.6-136.2
throughout the study period. The highest Largemouth Bass Wr occurred in 2008, but a small sample size
that year (n=7) makes it difficult to draw any conclusions from the data. Among all years, mean Wr of
101.6 were comparable to Largemouth Bass within connected backwaters of the Illinois River (mean Wr
of 104.9, all years). These trends are interesting as they suggest Largemouth Bass Wr did not suffer
even as their CPUE declined. One possible interpretation is that the decline in numbers could have
resulted in increased access to resources for remaining individuals.
Largemouth bass also became the dominant species in the early 2000’s, developing into an excellent
fishery. The Illinois Department of Natural Resources classifies a Largemouth Bass CPUE of 50-75/hour
as “Fair”, 75-100/hour as “Good”, and >100/hour as “Very Good”. Using these metrics, Largemouth
Bass CPUE was “Fair” in 2000, 2007, and 2011 while falling just short in 2001 (CPUE 48/hour).
Largemouth Bass CPUE was “Good” in 2002, 2003, and 2004 and “Very Good” in 2005. 2003 fell just
short of “Very Good” with 98.6 Largemouth Bass/hour. There were 44 “Memorable” (510-630 mm)
(Gabelhouse 1984) Largemouth Bass sampled from 2002-2007 and just four from 2008-2013, all of
which were sampled in 2011. Anecdotal data also describes an excellent Largemouth Bass fishery, with
many “Preferred” (380-510mm) and “Memorable” Largemouth Bass in the system (Mike McClelland and
Thad Cook, personal communication). No Largemouth Bass were sampled in 2013 for the first time in
the study, indicating that this sport fishery no longer exists.
Many changes observed in the Merwin Preserve’s fish communities coincided with a series of low
water/drought events. Some level of the fish community response may be attributed to the tolerance of
specific fishes to those environmental conditions. Although water quality and aquatic vegetation data
were not collected, a loss of aquatic vegetation and increased turbidities were observed in 2008
following drought conditions of 2007 (Tharran Hobson, TNC, pers. comm) and IRBS biologists observed
very turbid water in 2012 and 2013, despite no empirical data being collected. Largemouth Bass,
Bluegill, and White Crappie, which are intolerant of continuous high turbidity, subsequently did poorly
whereas the more tolerant Bigmouth Buffalo and Common Carp (which create turbid conditions with
benthic feeding habits (Pflieger 1997)), subsequently became dominant community members.
Differences in tolerance levels could be a main driver of why the abundances of Largemouth Bass,
Bluegill, and White Crappie have seen declines over the course of the study while Common Carp and
Bigmouth Buffalo have not.
Management Implication:

11
Results of this study indicate that the fish community of the Merwin Preserve has shifted significantly
twice in the 15 years of this study: first shifting to a sport fish dominated system with abundant native
fish including the very desirable Largemouth Bass, then subsequently shifting to a Common Carp and
Bigmouth Buffalo dominated system with drastically reduced sport fish populations. While it can’t be
proven that drought/low water events caused the decline of native/sport fish and Largemouth Bass
populations, changes observed coincide directly with extreme fluctuations in water levels. The data
presented here suggest that a succession of low water events were a major driver of changes that
occurred in the fish community. As such, ability to control water levels and prevent multiple extreme
low water events should be a priority to future management of the Merwin Preserve and similar
backwater floodplain restoration of the Illinois River. The authors hope the information summarized
here aids the management of the Merwin Preserve as efforts are made to address the breach and notch
in the levee. The authors also recommend continued monitoring of the Merwin Preserve to follow
future progression of the fish community following connection to the Illinois River. Additionally,
continued monitoring before and after any action taken to address the breach will allow researchers and
managers to observe and document its effects.

12
Literature cited:
Gabelhouse, D. W., 1984. A Length Categorization System to Assess Fish Stocks. North American
Journal of Fisheries Management. 4:273-285
Grider, Nathan T. 2013. Growth, condition, and diet of alligator gar (Atractosteus spatula) released in
Merwin Preserve. Master’s Thesis, University of Illinois-Springfield. Springfield , IL.
Gutreuter, S. A., R. Burkhardt, and K. Lubinski. 1995. Long Term Resource Monitoring Program
Procedures: Fish Monitoring. National Biological Service, Environmental Management Technical Center,
Onalaska, Wisconsin, July 1995. LTRMP 95-p002-1.
McClelland, M. A., K. S. Irons, G. G. Sass, T. M. O’Hara and T. R. Cook. 2013. A comparison of two
electrofishing programmes used to monitor fish on the Illinois River, Illinois, USA. River Research and
Applications. 29:125-133. DOI: 10.1002/rra/1590
Nuemann, R. M., C. S. Guy, and D. W. Willis. 2012. Length, Weight, and Associated Indices. Pages 637-
676 in A. V. Zale, D. L. Parrish, and T. M. Sutton, editors. Fisheries techniques, 3rd edition. American
Fisheries Society, Bethesda Maryland.
Pflieger, W. L. 1997. The Fishes of Missouri. Missouri Department of Conservation, Jefferson City Missouri Retzer, M. E., T. Bland, and M. Wilson. 2009. Establishment of historic fish communities to restored Illinois River floodplain lakes. Illinois Natural History Survey Technical Report, Grant/Project Number: T-31-D
13
Figure 1: Image of the extent of 2013 flooding on the levee separating the Merwin Preserve from the
Illinois River. Image courtesy of Tharron Hobson, TNC
14
Figure 2: South half of the Merwin Preserve. Fixed sampling Site 1 (Pumphouse Ditch) outlined in red
and Site 2 (South Ditch) outlined in blue.
Shed
Site 2
Site 1
15
Common Name 1999 2000 2001 2002 2003 2004 2005 2006 2007 2008 2009 2011 2012 2013 Totals Shortnose Gar
1
1
Alligator Gar**
1
1
Bowfin
2 3 5
Gizzard Shad
48 96 170 93 1283 572 330 187 160 52 45 3036
Pugnose Minnow
1
1
Common Carp* 143 138 64 41 48 16 169 88 65 18 6 175 350 28 1349
Bighead Carp* 1 1
Silver Carp* 19 19
Black Buffalo
2
2
4
Bigmouth Buffalo 49 82 82 34 37 32 148 179 54 3 6 8 156 32 902
Smallmouth Buffalo 1
1
Black Bullhead 30 7 15 17 3
23 1 1 1 5 2 90 1 196
Yellow Bullhead 2
2
9 2 4
6 41 3 69
Blue Catfish
1
1
Pirate Perch
2 4
6
Western Moquitofish
7 1 8
Yellow Bass
1 1
Largemouth Bass 35 25 52 139 148 87 139 17 35 13 39 79 16
824
Green Sunfish 194 9 2 3
1
1 7 2 22 4
245
Green Sunfish x Bluegill 3
4 1
1 2
9
Orangespotted Sunfish
1 18 2
21
Bluegill 123 5 11 245 30 53 92 25 18 19 79 52 20 2 774
White Crappie
40 41 66 50 7 12 11 12 5 1 16 42 1 304
Totals 580 308 267 601 413 365 686 1606 762 396 329 542 788 137 7780
Table 1: Total catches by year at the Merwin Preserve. Note that 1999 (AC electrofishing) is included. Only 1 site was sampled in 2000, 2007
and 2013 (in red).

16
Common Name Scientific Name Family Name Shortnose Gar Lepisosteus platostomus Lepisosteidae
Alligator Gar** Atractosteus spatula Lepisosteidae
Bowfin Amia calva Amiidae
Gizzard Shad Dorosoma cepedianum Clupeidae
Pugnose Minnow Opsopoedus emiliae Cyprinidae
Common Carp* Cyprinus carpio Cyprinidae
Bighead Carp* Hypophthalmichthys nobilis Cyprinidae
Silver Carp* Hypophthalmichthys molitrix Cyprinidae
Black Buffalo Ictiobus niger Catostomidae
Bigmouth Buffalo Ictiobus cyprinellus Catostomidae
Smallmouth Buffalo Ictiobus bubalus Catostomidae
Black Bullhead Ameiurus nebulosus Ictaluridae
Yellow Bullhead Ameiurus natalis Ictaluridae
Blue Catfish Ictalurus furcatus Ictaluridae
Pirate Perch Apredoderus sayanus Aphredoderidae
Western Mosquitofish Gambusia affinis Poecilliidae
Yellow Bass Morone mississippiensis Percichthyidae
Largemouth Bass Micropterus salmoides Centrarchidae
Green Sunfish Lepomis cyanellus Centrarchidae
Green Sunfish Bluegill Hybrid
Centrarchidae
Orangespotted Sunfish Lepomis humilis Centrarchidae
Bluegill Lepomis machrochirus Centrarchidae
White Crappie Pomoxis annularis Centrarchidae
Table 2: List of fish species collected at the Merwin Preserve. * indicates non-native species. **
indicates re-introduced species.
17
Figure 3: Hydrograph of water levels (feet above sea level) at the Merwin Preserve.
Figure 4: Total number of fishes sampled at the Merwin Preserve. Note that 1999 AC electrofishing is
included. Only 1 site sampled in 2000, 2007, and 2013 (in red).
410
415
420
425
430
435
440
445
450
455
Fee
t A
bo
ve S
ea
Leve
l (FS
L)
Water Elevation
0
200
400
600
800
1000
1200
1400
1600
1800
Tota
l nu
mb
er
of
fish
sam
ple
d

18
Figure 5: Number of species collected by year.
Figure 6: Percentage of native fish in relation to non-native fish.
0
2
4
6
8
10
12
14
16
Nu
mb
er
of
Spe
cie
s
0%
10%
20%
30%
40%
50%
60%
70%
80%
90%
100%
Pe
rce
nt
of
Po
pu
lati
on
Non-Native Native
19
Figure 7: Percentage of sport fish (Blue Catfish, Largemouth Bass, Green Sunfish, Bluegill, Green Sunfish
x Bluegill, White Crappie) in relation to non-sport fish (all other species).
Figure 8: CPUE (individuals/hour) of Gizzard Shad sampled via DC electrofishing from 2000-2013.
0%
10%
20%
30%
40%
50%
60%
70%
80%
90%
100%
Pe
rce
nt
of
Po
pu
lati
on
Nonsport Sport
0
500
1000
1500
2000
2500
Ind
ivid
ual
s/h
ou
r

20
Figure 9: CPUE (individuals/hour) of Common Carp, Bigmouth Buffalo, Bluegill, Largemouth Bass and
White Crappie sampled via DC electrofishing from 2000-2013.
Figure 10: Wr values for Largemouth Bass collected at the Merwin Preserve and connected backwater
lakes on the La Grange Reach of the Illinois River. Error bars represent standard deviation of Wr scores
and the number of individuals in the annual sample is noted on each bar.
0
50
100
150
200
250
300
Ind
ivid
ual
s/h
r
Common Carp Bigmouth Buffalo Bluegill
Largemouth Bass White Crappie
0
20
40
60
80
100
120
140
160
2002 2003 2004 2005 2006 2007 2008 2009 2010 2011 2012
Wr
50 56 48 9 31 13 12 89 17 7 65 33 28 7 31 32 88 24 17 3 16
Illinois River Merwin Preserve

21
Figure 11: Wr values for Common Carp collected at the Merwin Preserve and connected backwater
lakes on the La Grange Reach of the Illinois River. Error bars represent standard deviation of Wr scores
and the number of individuals in the annual sample is noted on each bar
0
20
40
60
80
100
120
140
2002 2006 2007 2008 2009 2011 2012 2013
Wr
Illinois River Merwin Preserve
84 30
18 187 22 168 15 6 6 103 173 28 111 79 46 32
22
Chapter 2:
2012: A case study of effects of drought on the fish community of the Merwin
Preserve at Spunky Bottoms
Introduction:
During 2012, an intensive study was conducted by the Illinois Department of Natural Resources (IDNR)
and a University of Illinois-Springfield graduate student, Nathan Grider, in order to investigate the status
of the IDNR’s re-introduction of Alligator Gar Atractosteus spatula in the fall of 2011. While the study
focused on the efficiency of multiple gears to collect data on Alligator Gar growth, body condition, diet
and prey selectivity, a comprehensive fish community data set was created as all by-catch data was
recorded. Data was collected as water levels at the Merwin Preserve dropped throughout 2012,
culminating in the drying out of the backwater and only the major ditches being inundated. This
dataset provides a unique opportunity to assess the effects of an extreme drought event on the fish
community of a restored backwater complex.
Methods:
The Merwin Preserve was sampled monthly from May-October with a variety of fisheries gear including
fyke nets (F), tandem fyke nets (i.e leads tied together) (TF), modified multifilament gill nets dyed black
(MGN), experimental monofilament gill nets (EG), pulsed-DC electrofishing (D), and mini fyke netting (M)
as described by Grider (2013). Standard units of effort for fyke nets, tandem fyke nets and mini fyke
nets were 24 hrs or 1 overnight net set and modified gill nets and experimental gill nets standard effort
were 4.5 hrs to minimize potential mortality due to stress levels of netting (Grider 2013). Electrofishing
standard field effort was one 15 minute run, and data was summarized using 1 hour as the standard unit
of effort. Fyke nets, tandem fyke nets, and both gill nets were targeted to maximize Alligator Gar
captures, while electrofishing runs were randomly chosen (Grider 2013). Few juvenile fish were
observed via electrofishing runs May-July so mini fyke nets were only deployed during August-October
(Grider 2013). All fish collected were measured for total length (TL; mm) and weight (W; g). Five fish
per 10mm length group were weighed for a representative sample, while the rest were measured and
enumerated to save time in the field (Grider 2013). Water temperature (oC), dissolved oxygen, and
Secchi disk depth (measure of water clarity) were recorded at each sampling site during the study
(Grider 2013).
Biomass was estimated for each species at the Merwin Preserve based on weight. When producing
biomass estimates empirical weights were used when available and supplemented with estimated
weights from individuals were no weight existed. Species specific length weight relationships were
developed from simple linear regression models based on empirical lengths and weights. Length weight
relationships were calculated for: Gizzard Shad Dorosoma cepedianum (y = 2.9941x -4.9941), Common
Carp Cyprinus carpio (y = 2.8328x - 4.4957), Bigmouth Buffalo Ictiobus cyprinellus (y = 2.9877x -4.7883),
Black Bullhead Ameiurus nebulosus/Yellow Bullhead A. natalis (y = 2.8818x - 4.6297), Largemouth Bass
Micropterus salmoides (y = 3.2814x - 5.5922), Bluegill Lepomis machrochirus (y = 5.5092x - 2.4732), and
23
White Crappie Pomoxis annularis (y = 3.4263x - 5.9085). Length weight relationships were calculated
using weight data pooled from all gears to create the most accurate regression model, but only biomass
estimates for day electrofishing data are reported. Electrofishing is considered the least biased fisheries
sampling gear; hence biomass estimates done by day electrofishing should be the most representative.
Monthly catch per unit of effort (CPUE) was estimated for all abundant species for each gear. CPUE was
calculated for each species where sufficient data per individual gear existed (i.e. a CPUE >1 for all
months) or if it was a species of importance (i.e. Largemouth Bass and Bluegill). Modified gill nets and
mini fyke nets were omitted from any CPUE estimates due to low sample sizes of net sets and fish
sampled.
Relative weight (Wr) analysis was calculated following methods found in Nuemann et al (2012). Wr was
calculated for all species having >200 weights collected. Catches of species from all gears were pooled
together to calculate Wr.
Results:
Water levels
Water levels started out normal/high in the spring of 2012, with all aquatic habitats of the Merwin
Preserve inundated and accessible by boat. Over the course of the summer, with very little rainfall,
shallow aquatic areas quickly became inaccessible and eventually dried out. By August of 2012 only the
major drainage ditches of the Merwin Preserve were inundated. Water levels continued to fall and
remain low through September and October.
Water Quality
Water temperature was recorded at 171 of 176 sampling sites and monthly means increased from May
through July before declining steadily from August through October. Dissolved oxygen was recorded at
171 of 176 sampling sites and monthly means increased from May through September before declining
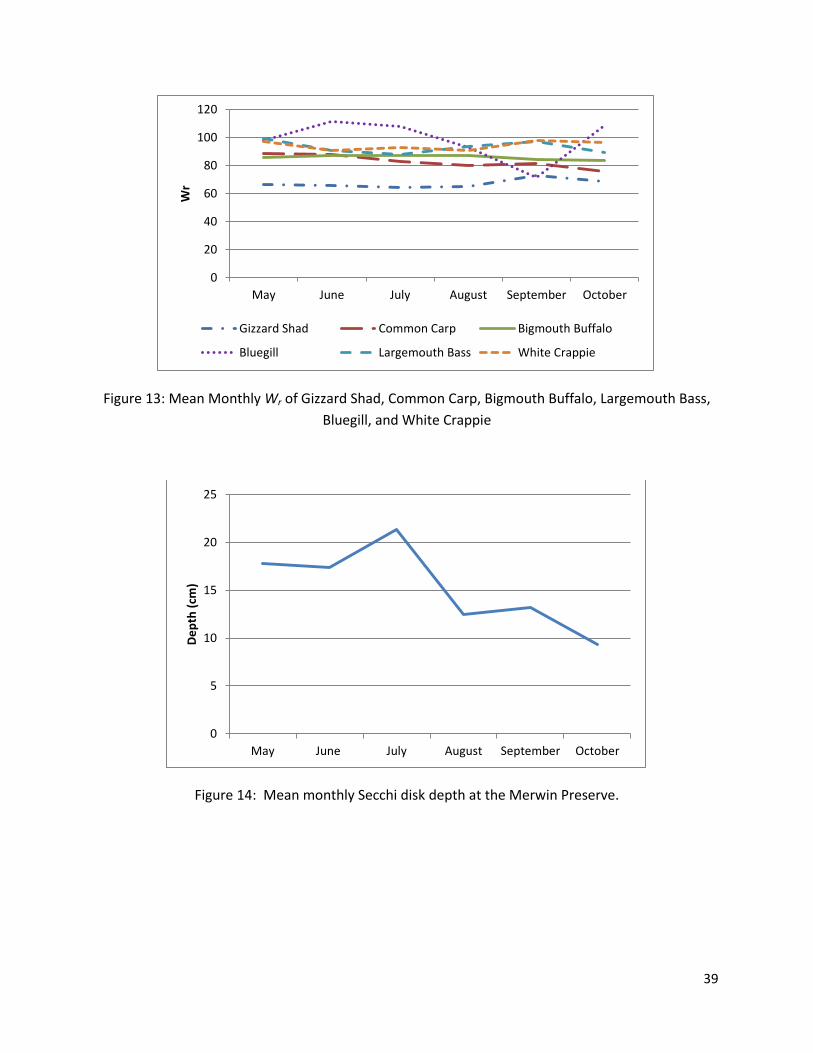
in October to a mean 5.3 mg/L. Secchi disk depth was recorded at 163 of 176 sampling sites and
monthly mean Secchi disk depth increased from May through July before declining substantially in
August and continuing to decline through October (Figure 14). Secchi disk depth peaked in July at 21 cm
before reaching a study low of 9 cm in October.
Fish Community Structure
Over the course of this study 6 mini fyke nets (M), 27 tandem fyke nets (TF), 66 fyke nets (F), 19
modified gill nets (MGN), 27 experimental gill nets (EG), and 31 day electrofishing (D) runs were
completed from May-October 2012. However, effort expended was not consistent from month to
month during the study (Table 1). 6913 total fish representing 20 species from 8 families were
collected: 16 native species, two non-native species (Common Carp and Silver Carp Hypophthalmichthys
molitrix), one hybrid species (Green Sunfish x Bluegill L. cyanellus x L. macrochirus), and one re-
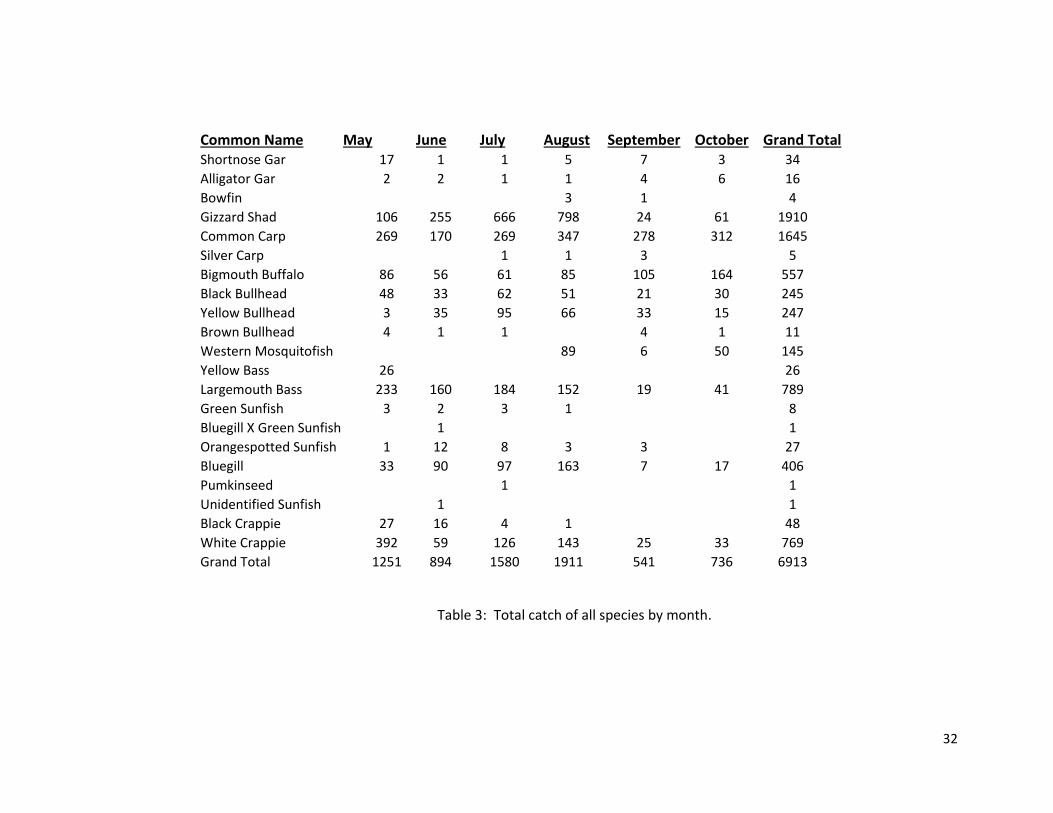
introduced species (Alligator Gar) (Table 2 and 3). Total catch was dominated by Gizzard Shad, Common
Carp, Largemouth Bass, White Crappie and Bigmouth Buffalo (Tables 2 and 3; Figure 1).
24
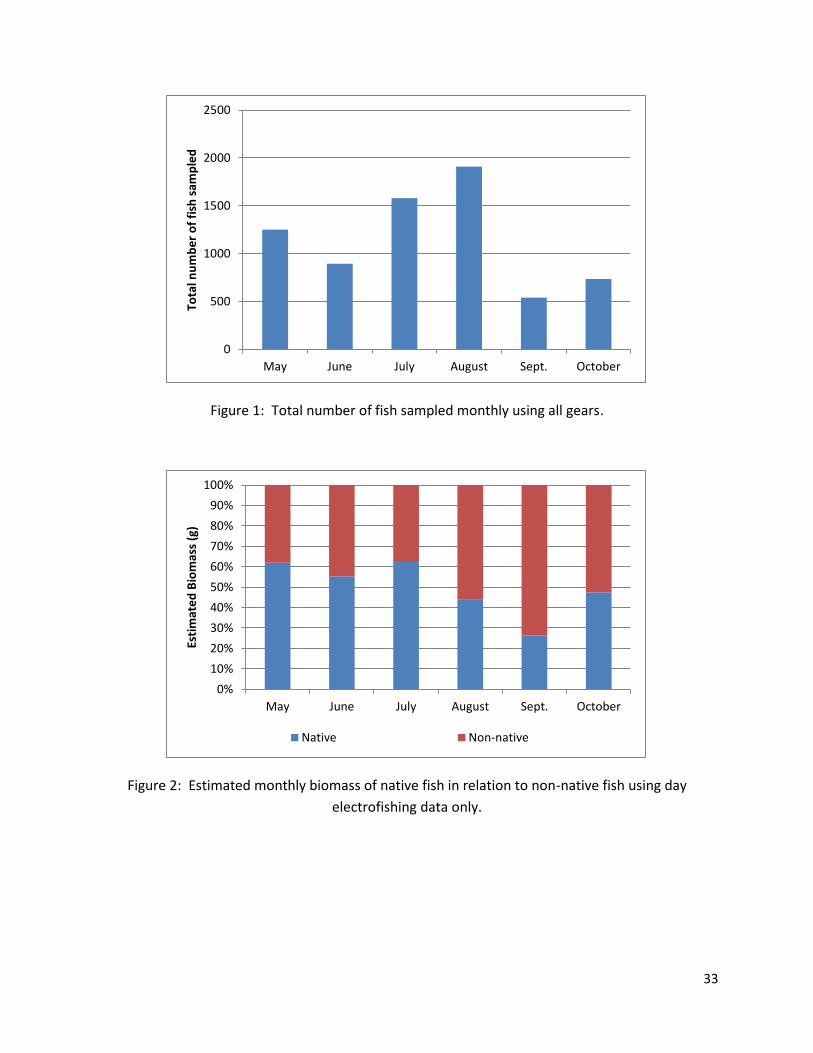
Estimated biomass (via day electrofishing) of native fishes sampled ranged from 26.3%-62.8% (49.6% ±
13.7%) of the total estimated biomass and declined over the course of the study while estimated
biomass of non-native fishes ranges from 37.2%–73.7% (55.5% ± 13.7%) of the total estimated biomass
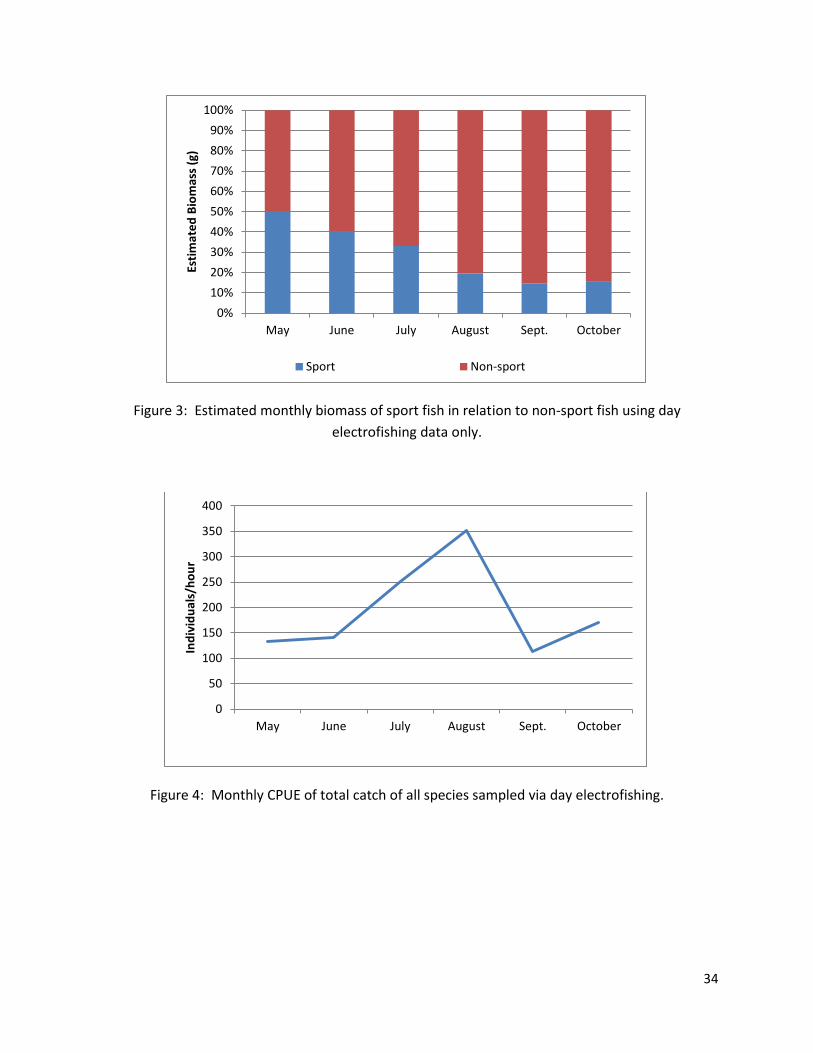
and increased throughout the study (Figure 2). Estimated biomass (via day electrofishing) of sport
fishes ranged from 14.5%-50.3% (28.9% ± 14.6%) of the total estimated biomass and declined
throughout the study while estimated biomass of non-sport fishes ranged from 49.7%-85.5% (67.6 ±
14.6%) of total estimated biomass and increased throughout the study (Figure 3).
Catch per unit effort (CPUE)
Electrofishing CPUE was calculated for total catch of all species (Figure 4) and individually for Gizzard
Shad, Common Carp, Bigmouth Buffalo, Black Bullhead, Yellow Bullhead, Largemouth Bass, White
Crappie, and Bluegill (Figure 5). CPUE of all species increased sharply from June to August before
declining sharply in September. CPUE of all species increased slightly in October. Gizzard Shad and
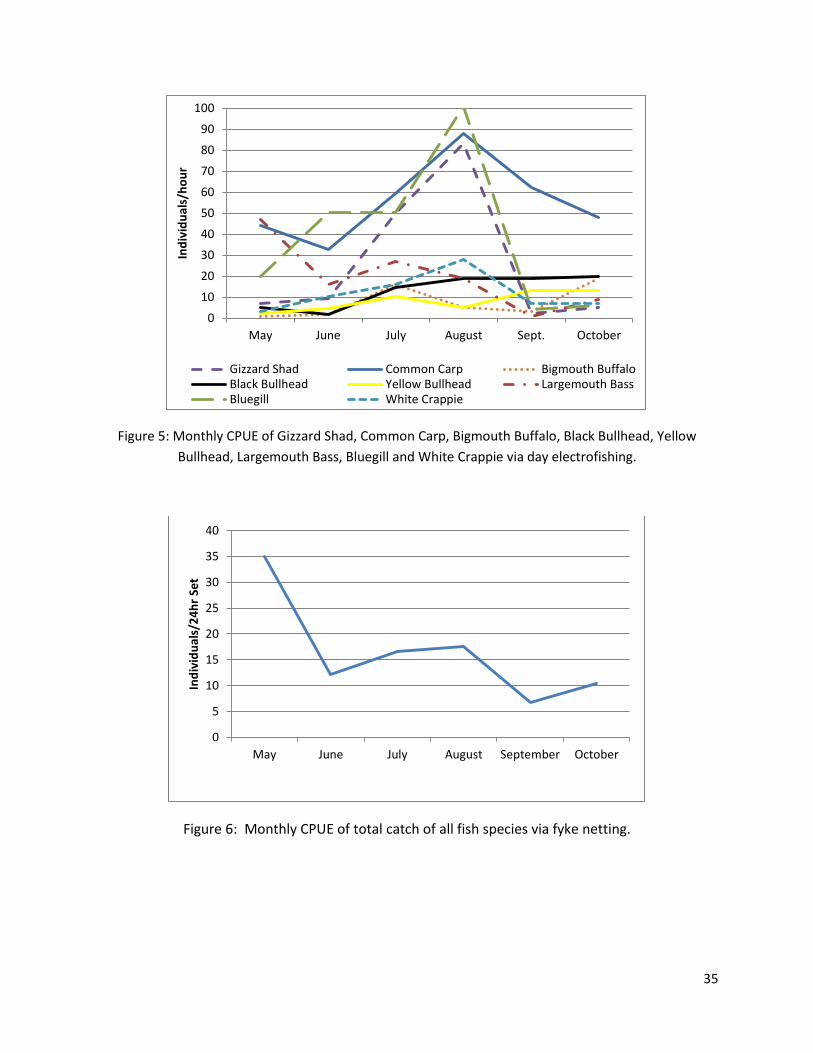
Common Carp exhibited very similar trends from May through August with catches peaking in August
(83 and 88 individuals/hour, respectively). Both species CPUE declined in September and October,
although declines in Gizzard Shad were much more dramatic. Bigmouth Buffalo had inconsistent CPUE
numbers, with peaks in July (16 individuals/hour) and October (19 individuals/hour). Black Bullhead
CPUE increased from June (1.8 individuals/hour) through August (19 individuals/hour) and CPUE
remained high in September and October (19 and 20 individuals/hour, respectively). Yellow Bullhead
CPUE increased throughout the study with 13 individuals/hour sampled in October. Largemouth Bass
CPUE declined from July through October with only 1 individual/hour sampled in September. White
Crappie and Bluegill CPUE increased from May through August followed by a sharp decline from August
to September and October; however, White Crappie catches were much lower than Bluegill catches.
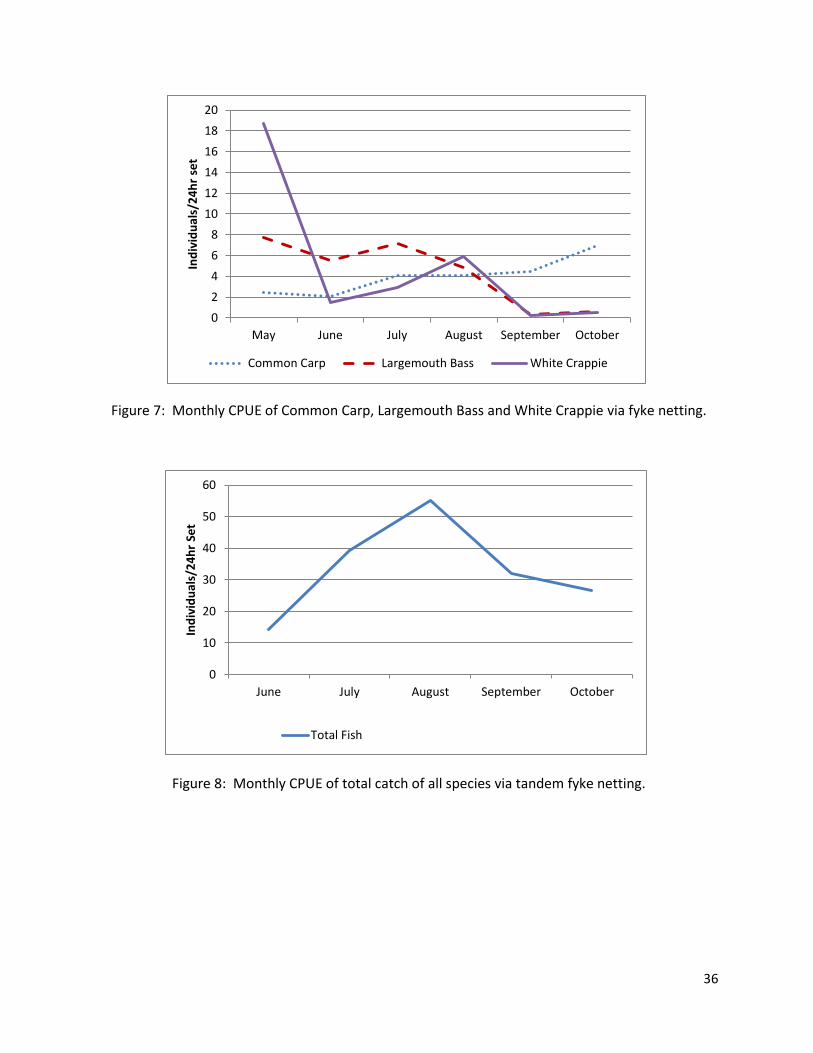
Fyke netting CPUE was calculated for total catch of all species (Figure 6), and individually for Common
Carp, Largemouth Bass, and White Crappie (Figure 7). CPUE of all species peaked in May and, unlike
other gears, did not peak in August as water levels drop and condensed fish to the major drainage
ditches. Similar to other gears, CPUE of all species declined sharply in September. Common Carp CPUE
increased from June-October while Largemouth Bass CPUE decreased from July-October. White Crappie
CPUE was very high (18.75 individuals/net night) beginning in May but declined steadily throughout the
study. White Crappie CPUE increased slightly in August before dropping to <1 individual/net night in
September and October.
Tandem fyke netting CPUE was calculated for total catch of all species (Figure 8) and individually for
Common Carp, Bigmouth Buffalo, Largemouth Bass, and White Crappie (Figure 9). Total catch of all
species increased sharply during June through August, peaking in August before declining drastically in
September and October. Common Carp CPUE increased in August (18 individuals/net night), and CPUE
remained high in September (20.2 individuals/net night) and October (20 individuals/net night).
Bigmouth Buffalo CPUE remained low (<5 individuals/net night) but consistent throughout the study.
Largemouth Bass and White Crappie CPUE increased from June to August followed by a sharp decline
from August to September and low October CPUE.
25
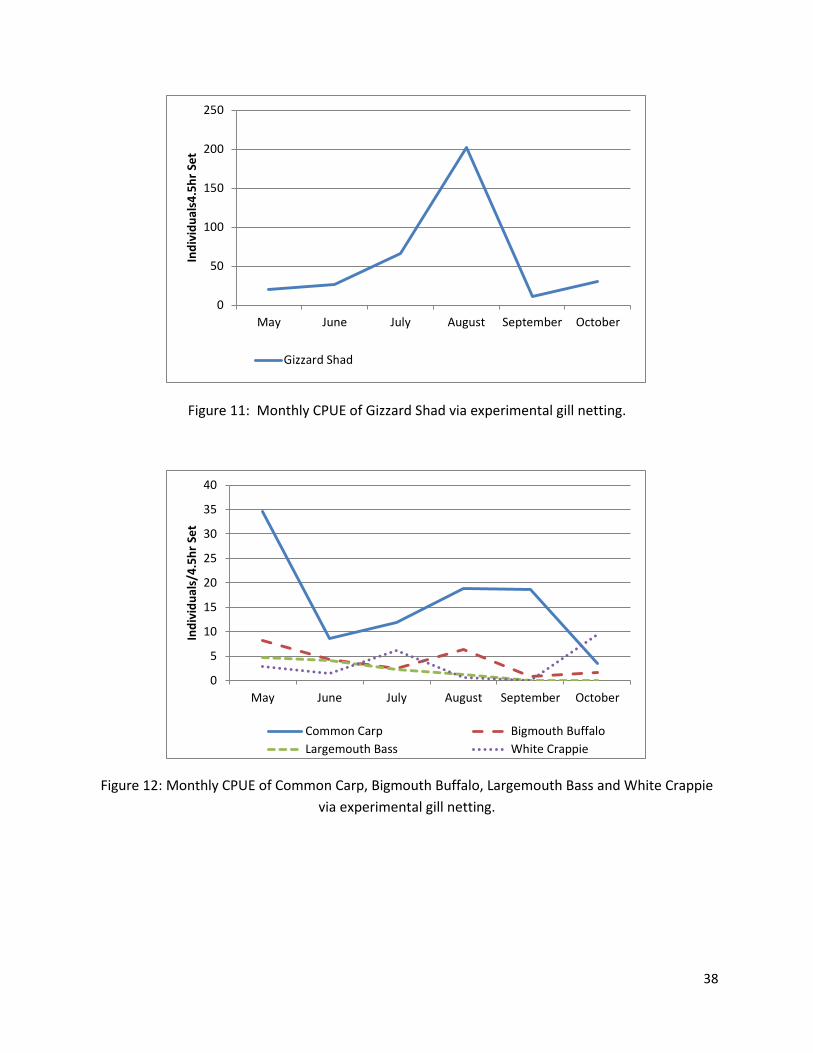
Experimental gill net CPUE was calculated for total catch of all species (Figure 10) and individually for
Gizzard Shad (Figure 11), Common Carp, Bigmouth Buffalo, Largemouth Bass, and White Crappie (Figure
12). CPUE of all species increased sharply from July through August and then declined sharply from
August through September. Gizzard Shad CPUE increased from May (19.3/net night) through August
(202 individuals/net night) followed by a sharp decline (11.7 individuals/net night) in September.
Common Carp CPUE was high in May (34.6 individuals/net night) and followed by consistent catches
from June through September (8.5-18.9 individuals/net night) and a declined in October (3.4
individuals/net night). Bigmouth Buffalo showed a slight decline throughout the study. Largemouth
Bass CPUE declined from May through August with 0 Largemouth Bass sampled in September and
October. White Crappie CPUE was variable peaking (6.0 individuals/net night) in July, (0 individuals/net
night) in September followed by higher abundances (9.4individuals/net night) in October.
Relative Weight (Wr )
Wr was calculated for all species whose total catch was over 200. Total catch was pooled from all gears
and species included Gizzard Shad, Common Carp, Bigmouth Buffalo, Largemouth Bass, Bluegill, and
White Crappie (Figure 13). Gizzard Shad exhibited poor body condition (<72) while Common Carp body
condition declined throughout the study (89 in May declining to 76 in October). Bigmouth Buffalo,
Largemouth Bass, and White Crappie exhibited healthy body condition (80-100) over the course of the
study. Bluegill showed healthy body condition from May through July then decline from July through
September before recovering in October. However, only four Bluegill in September and 14 in October
were used for Wr analysis, so data could be biased from a low sample size.
Discussion:
The fish community underwent substantial change over the course of this study, with many trends and
changes corresponding to water level fluctuations. This study took place during the drought of 2012,
when the water levels of the Merwin Preserve fell throughout the year and, beginning in August, only
the major drainage ditches were still inundated. At the start of the sampling season, when water levels
were at their highest levels, the fish community was dominated by both native fish (Gizzard Shad,
Largemouth Bass and White Crappie) and non-native fish (Common Carp). Native fish biomass declined
in relation to non-native biomass (day electrofishing data only) and sport fish biomass declined in
relation to non-sport fish biomass throughout the study (day electrofishing data only). CPUE of all
species peaked in August as fishes became concentrated in the major drainage ditches as a result of
falling water levels, then declined sharply from August to September and remained low in October,
presumably from some combination of predation and mortality. CPUE of several species (including
Largemouth Bass, Bluegill and White Crappie) for several gears peaked in August and declined in
September and October while other species (including Common Carp and Bigmouth Buffalo) maintained
high CPUE. These data indicates that native/sport fish fared less well following August than non-
native/non-sport fish; leaving the Merwin Preserve a Common Carp/Bigmouth Buffalo dominated
system.
26
Efforts expended were not consistent between months or between gears. Due to this, CPUE was used
to analyze fish catches over the course of the study as it does not assume consistent effort. Additionally,
only day electrofishing was performed with a random sample design as all netting was non-random to
target capture of Alligator Gar. However, the authors feel that data was collected in a consistent fashion
and were representative of the fish community at the Merwin Preserve in 2012.
Fish Community Structure
Over the course of the study, non-native fishes (Common Carp and, to a much lesser extent, Silver Carp)
and non-sport fishes (bullheads, Bigmouth Buffalo, Common Carp) become more abundant in relation to
native fishes and sport fishes (Largemouth Bass, Bluegill, crappies). Native fish and sport fish made up a
smaller percentage of the total estimated biomass (via electrofishing) following the drop of water levels
witnessed in August. This would indicate that the native and sport fishes were impacted to a greater
degree when compared to non-natives and non-sport fishes following the drying of shallow wetland
habitats.
Catch per unit effort (CPUE)
CPUE of all species using day electrofishing, tandem fyke nets, and experimental gill nets peaked in
August due to falling water levels that left only the major drainage ditches inundated. All fishes that had
occupied the expanses of previously shallow water habitat were condensed to the drainage ditches,
making them more susceptible to sample efforts and increasing the August CPUE for most fishes using
most gears. Catch rates declined for all gears in September and October even though fishes were still
confined to ditch habitats.
CPUE of individual species followed similar patterns. Native sport fishes (Largemouth Bass, White
Crappie, and Bluegill) showed a steep decline from August (when the fish were first condensed to
ditches) to September and continued to decline in October. Sport fishes for several gears also exhibited
a huge peak in August, but this was not a consistent trend among all sport fish among all gears. Native
Gizzard Shad were similar to sport fishes with peak CPUE in August followed by steep decline in
September and low catches in October. Contrarily, CPUE of Bigmouth Buffalo was low but consistent
throughout the study (i.e. not declining or increasing sharply at any time). These trends in CPUE likely
indicate a die-off of a large number of fishes during September and October coinciding with declining
water levels and confinement to the major drainage ditches.
Non-native Common Carp generally showed increasing CPUE over the course of the study with the
exception of experimental gill net catches, which show a general decline. Day electrofishing, fyke
netting, and tandem fyke netting showed increasing catches of Common Carp, indicating that they fared
well during the low water months of August through October. Native Yellow and Black Bullheads
exhibited a different trend as day electrofishing CPUE of both species increased over the course with
peak CPUE during the low water months of August, September, and October. However, data from other
gears did not support these trends.

27
It is important to note that all gears could have potentially underestimated the abundance of Bigmouth
Buffalo and Common Carp remaining in the Merwin Preserve during low water months of August,
September, and October (Nathan Grider, pers. comm). This could be a result of their high densities in
deep water refuge areas (such as the east end of the Pumphouse Ditch) and gear limitations (Nathan
Grider, pers. comm.).
Relative Weight (Wr )
Gizzard Shad Wr values were consistently low (<72) throughout the study. This could be due to many
factors, however, this indicates that declining water levels were likely not the primary mechanism.
Common Carp were the only fish to show a decreasing Wr over the course of the study, with the lowest
observed Wr (78) in October, two months after being restricted to the major drainage ditches. This data
indicates that Common Carp body condition suffered slightly in response to the drought, despite CPUE
generally remaining high. This may be a result of Common Carp no longer having access to the
multitude of resources in the shallow water habitats throughout the Merwin Preserve or due to the
dense population of Common Carp present at the east end of the Pumphouse Ditch after the drop in
water levels.
Bluegill Wr was inconsistent throughout the study, possibly due to a lack of consistent weight data for
several months. As mentioned above, only 4 and 14 Bluegill were weighed and used for Wr analysis in
September and October, respectively. Therefore, these small sample sizes may have contributed to the
low observed Wr in September and higher Wr values observed in October, despite water levels still being
low. Bigmouth Buffalo, Largemouth Bass and White Crappie showed consistently healthy Wr
throughout the study, although all were less than 100.
Overall, changes observed within the fish community at the Merwin Preserve could be driven by
tolerance of certain fishes to environmental conditions. Secchi disk data indicated water clarity
decreased (suggesting increased turbidity) as the water levels dropped over the course of the study.
Largemouth Bass, Bluegill, White Crappie are intolerant of continuous high turbidities while Bigmouth
Buffalo and Common Carp are more tolerant (Pflieger 1997). In addition, Common Carp create turbid
conditions with their benthic feeding habits and, along with bullhead species, are considered a tolerant
and adaptable fish. These life history traits support trends observed throughout this study: native/sport
fishes fare less well than non-native/non-sport fishes as water levels dropped and Secchi depth
decreased.
Temperature fluctuated as expected during this study with mean monthly temperature peaking in July
and falling through October. However, measured mean monthly temperature values never exceeded
levels stressful or lethal to fishes during the sampling events. Similarly, the lowest mean monthly
dissolved oxygen levels were recorded in October (5.3 mg/L) and never reached lethal or stressful levels,
however, a few sites sampled had dissolved oxygen readings less than 2 mg/L. While this suggests that
water temperature and dissolved oxygen were not major drivers of changes observed within the fish
community, dissolved oxygen levels may have been lethal or stressful during the pre-dawn hours, and
these short-term events could have been difficult to detect with the sampling plan used in this study.
28
Data collected and summarized here indicate that the Merwin Preserve fisheries community underwent
a change that coincided with drought-driven low water during 2012, moving from a diverse community
with abundant sport fishes to a community dominated by non-native Common Carp and native
Bigmouth Buffalo, Gizzard Shad, Black Bullhead and Yellow Bullhead. Despite their declines, sport fishes
such as Largemouth Bass, Bluegill, and White Crappie were still present at the end of the study. A die-off
of fishes is a plausible explanation for the decrease in CPUE of some species (Largemouth Bass, White
Crappie, Bluegill, Gizzard Shad) despite increased density of fishes in the major drainage ditches due to
low water, and IDNR staff saw deceased Silver Carp and Largemouth Bass in an advanced state of decay
(Nathan Grider and Rob Hilsabeck, pers. comm). This fish kill could have been caused by a low oxygen
event and, due to the monthly sampling protocol, complete extent of the die-off could have been
missed by the sampling biologists. While the dropping of water levels and increased density of fish
suggest a low oxygen event is the reason of the die-off, being isolated from food and habitat resources
necessary to maintain population levels could have also been a factor.
Management Implications:
Over the course of the sampling season of 2012, the fish community of the Merwin Preserve underwent
a drastic change. Drought conditions meant the Merwin Preserve progressed from a fully inundated
wetland complex with shallow water habitats in the spring to a largely dry wetland with only the major
ditch habitats holding water and fish. Over this same period native/sport fish declined sharply while
non-native/non-sport fish did not. This would indicate that native and sport fishes fared less well than
non-native/non-sport fish due to the drought event and subsequent decline in water levels. While the
drought event cannot be said unequivocally to be the direct cause of the decline in native/sport fish
populations, data collected does suggest that it was a major contributor to the changes seen in the fish
community. As such, ability to control water levels and prevent multiple extreme low water events
should be a priority to future management of the Merwin Preserve and similar backwater floodplain
restoration of the Illinois River. The authors hope the information summarized here aids the
management of the Merwin Preserve and also recommend continued monitoring to follow future
progression of the fish community.

29
Literature Cited:
Grider, Nathan T. 2013. Growth, condition, and diet of alligator gar (Atractosteus spatula) released in
Merwin Preserve. Master’s Thesis, University of Illinois-Springfield. Springfield , IL.
Nuemann, R. M., C. S. Guy, and D. W. Willis. 2012. Length, Weight, and Associated Indices. Pages 637-
676 in A. V. Zale, D. L. Parrish, and T. M. Sutton, editors. Fisheries technizues, 3rd edition. American
Fisheries Society, Bethesda Maryland.
Pflieger, W. L. 1997. The Fishes of Missouri. Missouri Department of Conservation, Jefferson City Missouri

30
Gear May June July August September October Grand Total
Day EF 4 6 6 5 5 5 31
F 20 14 10 8 8 6 66
EG 4 8 9 4 1 1 27
TF
3 5 6 6 7 27
MGN 6
6 4 3 19
M
2 2 2 6
Totals 34 31 30 31 26 24 176
Table 1: Effort expended for each gear by month at the Merwin Preserve. Day EF; day
electrofishing, F; fyke net, EG; experimental gill net, TF; tandem fyke net, MGN; modified gill net, M;
mini fyke net.

31
Common Name EG D F TF MGN M Totals Shortnose Gar 16 1 7 9
1 34
Alligator Gar 2
4 4 6
16
Bowfin
3 1
4
Gizzard Shad 1637 237 20 15
1 1910
Common Carp 437 555 230 394 26 3 1645
Silver Carp
4 1
5
Bigmouth Buffalo 123 60 48 85 241
557
Black Bullhead 54 93 54 39 1 5 245
Yellow Bullhead 65 53 15 111
3 247
Brown Bullhead 2 1 2 4 2
11
Western Mosquitofish
145 145
Yellow Bass 20
6
25
Largemouth Bass 85 173 351 165 14 1 789
Green Sunfish 9
8
Bluegill x Green Sunfish 1
1
Bluegill 13 334 28 19
12 406
Orange Spotted Sunfish 27
27
Pumkinseed 1
1
Unidentified Sunfish 1
1
White Crappie 95 101 477 96 1 8 769
Black Crappie 1 43 4
48
Grand Total 2550 1647 1290 950 296 127 6913
Table 2: Total catch of all species by gear. D; day electrofishing, F; fyke net, EG; experimental gill net, TF; tandem fyke net, MGN; modified
gill net, M; mini fyke net.
32
Common Name May June July August September October Grand Total Shortnose Gar 17 1 1 5 7 3 34
Alligator Gar 2 2 1 1 4 6 16
Bowfin
3 1
4
Gizzard Shad 106 255 666 798 24 61 1910
Common Carp 269 170 269 347 278 312 1645
Silver Carp
1 1 3
5
Bigmouth Buffalo 86 56 61 85 105 164 557
Black Bullhead 48 33 62 51 21 30 245
Yellow Bullhead 3 35 95 66 33 15 247
Brown Bullhead 4 1 1
4 1 11
Western Mosquitofish
89 6 50 145
Yellow Bass 26
26
Largemouth Bass 233 160 184 152 19 41 789
Green Sunfish 3 2 3 1
8
Bluegill X Green Sunfish
1
1
Orangespotted Sunfish 1 12 8 3 3
27
Bluegill 33 90 97 163 7 17 406
Pumkinseed
1
1
Unidentified Sunfish
1
1
Black Crappie 27 16 4 1
48
White Crappie 392 59 126 143 25 33 769
Grand Total 1251 894 1580 1911 541 736 6913
Table 3: Total catch of all species by month.
33
Figure 1: Total number of fish sampled monthly using all gears.
Figure 2: Estimated monthly biomass of native fish in relation to non-native fish using day
electrofishing data only.
0
500
1000
1500
2000
2500
May June July August Sept. October
Tota
l nu
mb
er
of
fish
sam
ple
d
0%
10%
20%
30%
40%
50%
60%
70%
80%
90%
100%
May June July August Sept. October
Esti
mat
ed
Bio
mas
s (g
)
Native Non-native
34
Figure 3: Estimated monthly biomass of sport fish in relation to non-sport fish using day
electrofishing data only.
Figure 4: Monthly CPUE of total catch of all species sampled via day electrofishing.
0%
10%
20%
30%
40%
50%
60%
70%
80%
90%
100%
May June July August Sept. October
Esti
mat
ed
Bio
mas
s (g
)
Sport Non-sport
0
50
100
150
200
250
300
350
400
May June July August Sept. October
Ind
ivid
ual
s/h
ou
r
35
Figure 5: Monthly CPUE of Gizzard Shad, Common Carp, Bigmouth Buffalo, Black Bullhead, Yellow
Bullhead, Largemouth Bass, Bluegill and White Crappie via day electrofishing.
Figure 6: Monthly CPUE of total catch of all fish species via fyke netting.
0
10
20
30
40
50
60
70
80
90
100
May June July August Sept. October
Ind
ivid
ual
s/h
ou
r
Gizzard Shad Common Carp Bigmouth BuffaloBlack Bullhead Yellow Bullhead Largemouth BassBluegill White Crappie
0
5
10
15
20
25
30
35
40
May June July August September October
Ind
ivid
ual
s/2
4h
r Se
t
36
Figure 7: Monthly CPUE of Common Carp, Largemouth Bass and White Crappie via fyke netting.
Figure 8: Monthly CPUE of total catch of all species via tandem fyke netting.
0
2
4
6
8
10
12
14
16
18
20
May June July August September October
Ind
ivid
ual
s/2
4h
r se
t
Common Carp Largemouth Bass White Crappie
0
10
20
30
40
50
60
June July August September October
Ind
ivid
ual
s/2
4h
r Se
t
Total Fish

37
Figure 9: Monthly CPUE of Common Carp, Bigmouth Buffalo, Largemouth Bass and White Crappie
via tandem fyke netting.
Figure 10: Monthly CPUE of total catch of all fish species fish via experimental gill netting.
0
5
10
15
20
25
June July August September October
Ind
ivid
ual
s/2
4h
r Se
t
Common Carp Bigmouth Buffalo
Largemouth Bass White Crappie
0
50
100
150
200
250
May June July August September October
Ind
ivid
ual
s/4
.5h
r Se
t
38
Figure 11: Monthly CPUE of Gizzard Shad via experimental gill netting.
Figure 12: Monthly CPUE of Common Carp, Bigmouth Buffalo, Largemouth Bass and White Crappie
via experimental gill netting.
0
50
100
150
200
250
May June July August September October
Ind
ivid
ual
s4.5
hr
Set
Gizzard Shad
0
5
10
15
20
25
30
35
40
May June July August September October
Ind
ivid
ual
s/4
.5h
r Se
t
Common Carp Bigmouth Buffalo
Largemouth Bass White Crappie
39
Figure 13: Mean Monthly Wr of Gizzard Shad, Common Carp, Bigmouth Buffalo, Largemouth Bass,
Bluegill, and White Crappie
Figure 14: Mean monthly Secchi disk depth at the Merwin Preserve.
0
20
40
60
80
100
120
May June July August September October
Wr
Gizzard Shad Common Carp Bigmouth Buffalo
Bluegill Largemouth Bass White Crappie
0
5
10
15
20
25
May June July August September October
De
pth
(cm
)