spur gear crack propagation path analysis using finite ... · pdf filefailure modes...
TRANSCRIPT
Abstract— An effective gear design balances strength,
durability, reliability, size, weight and cost. However
unexpected gear failure may occur even with adequate gear
tooth design. Failure of the engineering structures is caused by
crack, which depends on the design and operating conditions
and can be avoided by analyzing and understanding the
manner it originates. To develop design guidelines to prevent
failure modes considering gear tooth fracture, by studying the
crack propagation path in a spur gear. Crack propagation
paths are predicted for a variety of gear tooth geometry at
various crack initiation location. The effects of gear tooth
thickness, pitch radius, and tooth pressure angle are
considered. Analysis is being carried out using FEM with the
principles of linear elastic fracture mechanics and mixed mode
fracture criteria. The stress intensity factors are the key
parameters to estimate the characteristics of a crack. Design
charts & Design guidelines or fracture mechanics will be
formed considering the effects or gear geometry, applied load,
crack size and material property.
Keywords—Spur gear, Crack propagation path, LEFM, SIF
FEM
I. INTRODUCTION
AILURE of the engineering structures is caused by cracks,
which is depending on the design and operating
conditions that extend beyond a safe size. Cracks present to
some extent in all structures, either as a result of
manufacturing defects or localized damage in service. The
crack growth leads to a decrease in the structural strength.
Thus, when the service loading to the failure of the structure.
Fracture, the final catastrophic event takes place very rapidly
and is preceded by crack growth, which develops slowly
during normal service conditions.
Damage Tolerance (DT) assessment is a procedure that
defines whether a crack can be sustained safely during the
projected service life of the structure. DT assessment is
therefore required as a basis for any fracture control plan,
generating the following information upon which fracture
control decision can be made: the effect of cracks on the
structural residual strength, leading to the evaluation of their
maximum permissible size, and the crack growth as a
Ananda Kumar Eriki, Senior Lecturer, School of Engineering Science
and Technology, Nilai University College, Nilai, Negri Sembilan, 71800,
Malaysia; fax: 606-8502339, (e-mail: [email protected]).
Ravichandra. R, Senior Lecturer, School of Engineering Science and
Technology, Nilai University College, Nilai, Negri Sembilan, 71800,
Malaysia; Tel: 606-8502338, (e-mail: [email protected]).
Mohd. Edilan Mustaffa, Head of Automotive Technology, University
Kuala Lumpur Malaysia France Institute, Bangi, Selangor, 43650,
Malaysia; Tel: 063-89262022 (e-mail: [email protected]).
function of time, leading to the evaluation of the life of the
crack to reach their maximum permissible size from safe
operational life of the structure is defined.
Fracture mechanics has developed into a useful discipline
for predicting strength and life of cracked structures. Linear
elastic fracture mechanics can be used in damage tolerance
analysis to describe the behavior of crack. The fundamental
assumption of linear elastic fracture mechanics is that the
crack behavior is determined solely by the values of the
stress intensity factors which area function of the applied
load and the geometry of the cracked structure. The stress
intensity factors thus play a fundamental role in linear elastic
fracture mechanics applications. Fracture mechanics deals
with the study of how a crack in a structure propagates under
applied loads. It involves correlating analytical predictions
of crack propagation and failure with experimental results.
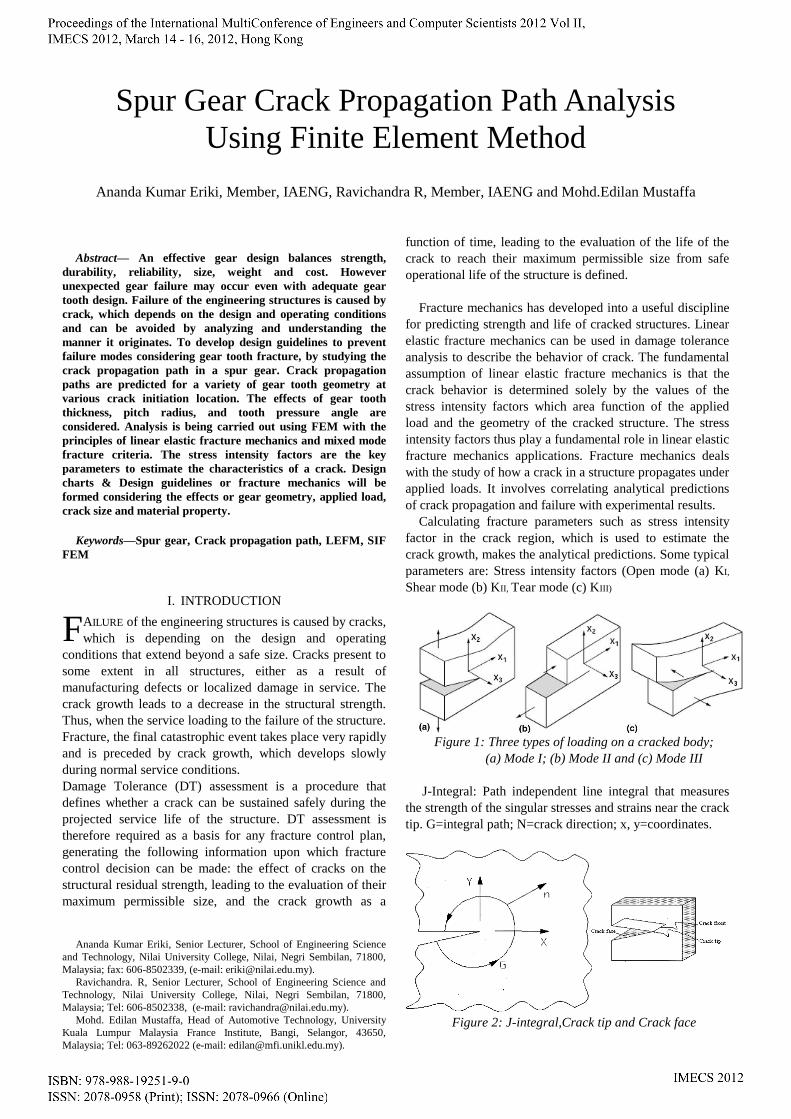
Calculating fracture parameters such as stress intensity
factor in the crack region, which is used to estimate the
crack growth, makes the analytical predictions. Some typical
parameters are: Stress intensity factors (Open mode (a) KI,
Shear mode (b) KII, Tear mode (c) KIII)
Figure 1: Three types of loading on a cracked body;
(a) Mode I; (b) Mode II and (c) Mode III
J-Integral: Path independent line integral that measures
the strength of the singular stresses and strains near the crack
tip. G=integral path; N=crack direction; x, y=coordinates.
Figure 2: J-integral,Crack tip and Crack face
Spur Gear Crack Propagation Path Analysis
Using Finite Element Method
Ananda Kumar Eriki, Member, IAENG, Ravichandra R, Member, IAENG and Mohd.Edilan Mustaffa
F
Energy release rate is the amount of work associated with
a crack opening or closure. The evaluation of the stress field
around the crack tip to show that, for pure opening mode and
in the limit of linear elastic fracture mechanics, the vanishing
small fields fracture zone is surrounded by a linear elastic
material with stress and strain fields uniquely determined,
for any type of loading, geometry or structure size, by the
stress intensity factor KI,. It flows that a critical value KIC
must exist so that when the actual KI, is lower, no crack
growth can take place. This reasoning may be extended to
other fracture mode to obtain fracture criteria. Hence, for
pure shear mode and tear mode, critical stress intensity
factors KIIC, KIIIC may be defined such that the crack growth
may occur when the critical value are reached. But these
parameters give only information for pure mode loadings,
and do not allow following the cracking process, which in
general involve change from pure to mixed modes. For
mixed modes, the straight approaches consist that fracture
may initiate the value of KI, KII, KIII a critical condition.
II. MODELED IN SOLIDWORKS
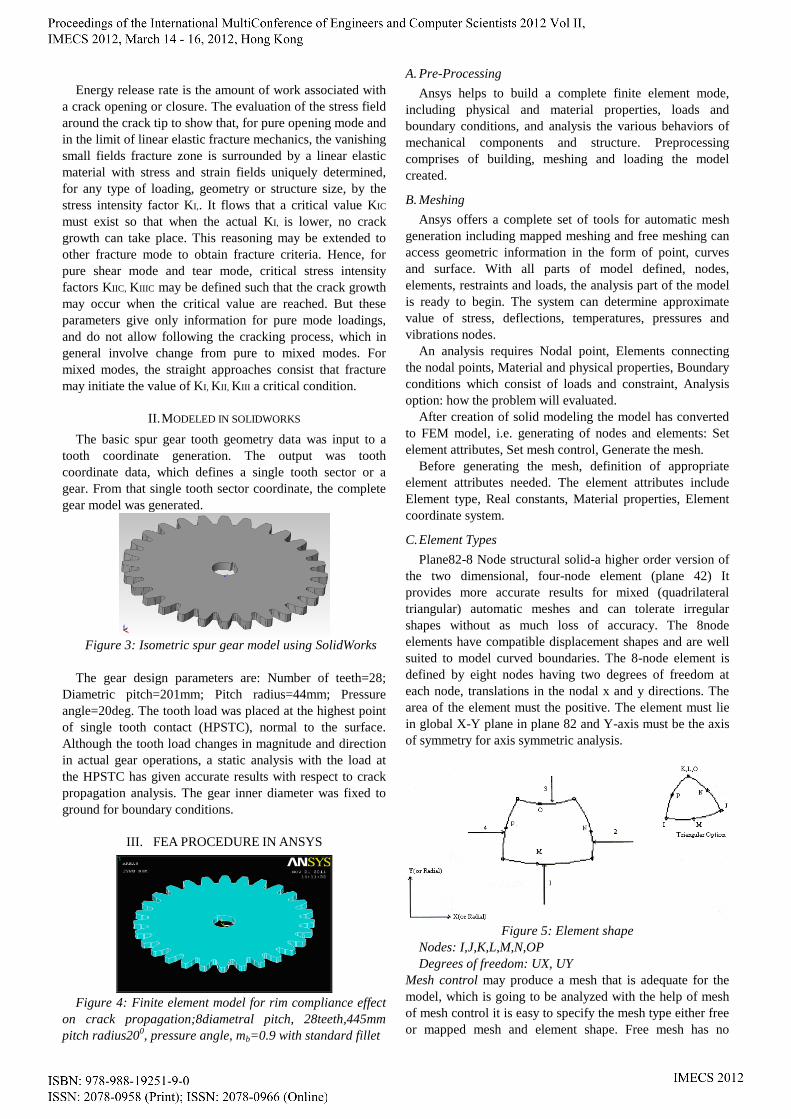
The basic spur gear tooth geometry data was input to a
tooth coordinate generation. The output was tooth
coordinate data, which defines a single tooth sector or a
gear. From that single tooth sector coordinate, the complete
gear model was generated.
Figure 3: Isometric spur gear model using SolidWorks
The gear design parameters are: Number of teeth=28;
Diametric pitch=201mm; Pitch radius=44mm; Pressure
angle=20deg. The tooth load was placed at the highest point
of single tooth contact (HPSTC), normal to the surface.
Although the tooth load changes in magnitude and direction
in actual gear operations, a static analysis with the load at
the HPSTC has given accurate results with respect to crack
propagation analysis. The gear inner diameter was fixed to
ground for boundary conditions.
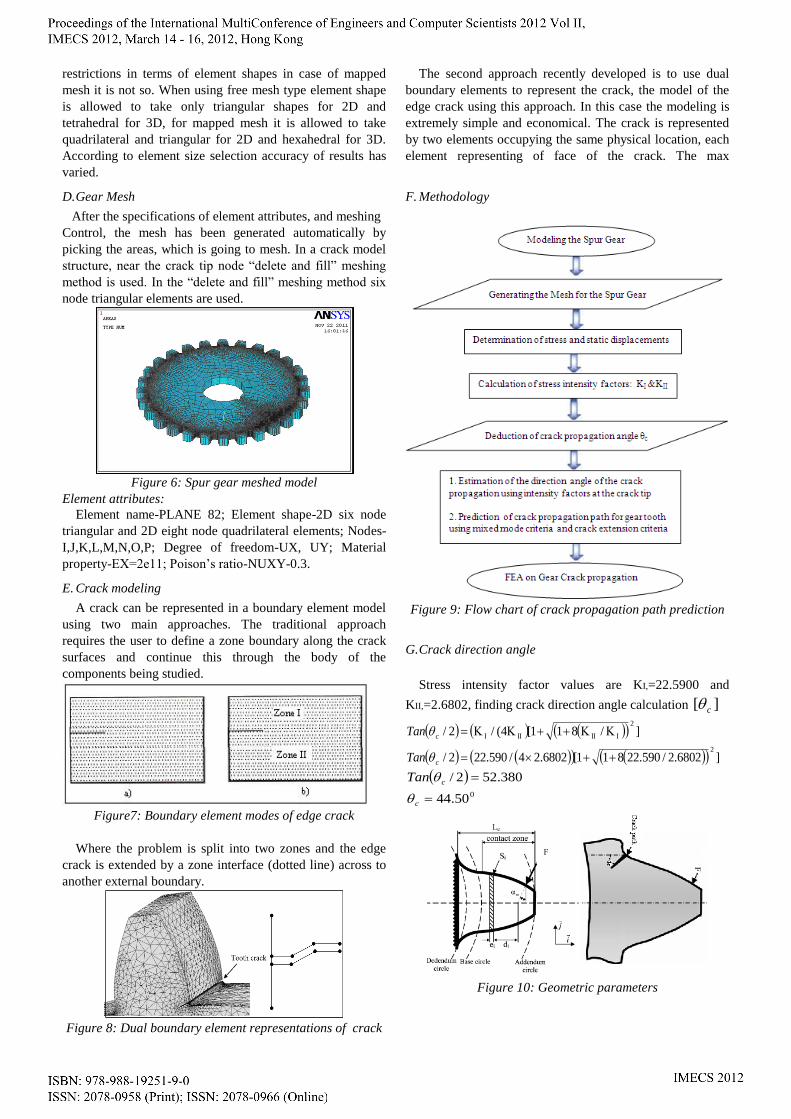
III. FEA PROCEDURE IN ANSYS
Figure 4: Finite element model for rim compliance effect
on crack propagation;8diametral pitch, 28teeth,445mm
pitch radius200, pressure angle, mb=0.9 with standard fillet
A. Pre-Processing
Ansys helps to build a complete finite element mode,
including physical and material properties, loads and
boundary conditions, and analysis the various behaviors of
mechanical components and structure. Preprocessing
comprises of building, meshing and loading the model
created.
B. Meshing
Ansys offers a complete set of tools for automatic mesh
generation including mapped meshing and free meshing can
access geometric information in the form of point, curves
and surface. With all parts of model defined, nodes,
elements, restraints and loads, the analysis part of the model
is ready to begin. The system can determine approximate
value of stress, deflections, temperatures, pressures and
vibrations nodes.
An analysis requires Nodal point, Elements connecting
the nodal points, Material and physical properties, Boundary
conditions which consist of loads and constraint, Analysis
option: how the problem will evaluated.
After creation of solid modeling the model has converted
to FEM model, i.e. generating of nodes and elements: Set
element attributes, Set mesh control, Generate the mesh.
Before generating the mesh, definition of appropriate
element attributes needed. The element attributes include
Element type, Real constants, Material properties, Element
coordinate system.
C. Element Types
Plane82-8 Node structural solid-a higher order version of
the two dimensional, four-node element (plane 42) It
provides more accurate results for mixed (quadrilateral
triangular) automatic meshes and can tolerate irregular
shapes without as much loss of accuracy. The 8node
elements have compatible displacement shapes and are well
suited to model curved boundaries. The 8-node element is
defined by eight nodes having two degrees of freedom at
each node, translations in the nodal x and y directions. The
area of the element must the positive. The element must lie
in global X-Y plane in plane 82 and Y-axis must be the axis
of symmetry for axis symmetric analysis.
Figure 5: Element shape
Nodes: I,J,K,L,M,N,OP
Degrees of freedom: UX, UY
Mesh control may produce a mesh that is adequate for the
model, which is going to be analyzed with the help of mesh
of mesh control it is easy to specify the mesh type either free
or mapped mesh and element shape. Free mesh has no
restrictions in terms of element shapes in case of mapped
mesh it is not so. When using free mesh type element shape
is allowed to take only triangular shapes for 2D and
tetrahedral for 3D, for mapped mesh it is allowed to take
quadrilateral and triangular for 2D and hexahedral for 3D.
According to element size selection accuracy of results has
varied.
D. Gear Mesh
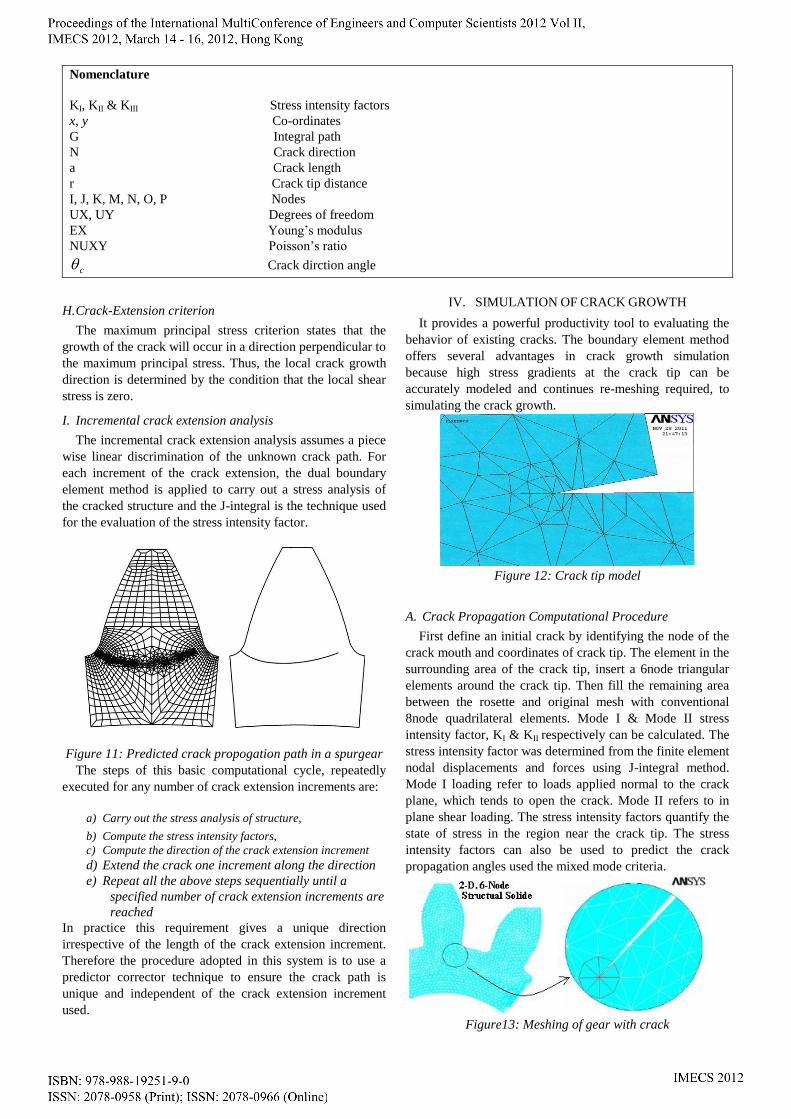
After the specifications of element attributes, and meshing
Control, the mesh has been generated automatically by
picking the areas, which is going to mesh. In a crack model
structure, near the crack tip node “delete and fill” meshing
method is used. In the “delete and fill” meshing method six
node triangular elements are used.
Figure 6: Spur gear meshed model
Element attributes:
Element name-PLANE 82; Element shape-2D six node
triangular and 2D eight node quadrilateral elements; Nodes-
I,J,K,L,M,N,O,P; Degree of freedom-UX, UY; Material
property-EX=2e11; Poison’s ratio-NUXY-0.3.
E. Crack modeling
A crack can be represented in a boundary element model
using two main approaches. The traditional approach
requires the user to define a zone boundary along the crack
surfaces and continue this through the body of the
components being studied.
Figure7: Boundary element modes of edge crack
Where the problem is split into two zones and the edge
crack is extended by a zone interface (dotted line) across to
another external boundary.
Figure 8: Dual boundary element representations of crack
The second approach recently developed is to use dual
boundary elements to represent the crack, the model of the
edge crack using this approach. In this case the modeling is
extremely simple and economical. The crack is represented
by two elements occupying the same physical location, each
element representing of face of the crack. The max
F. Methodology
Figure 9: Flow chart of crack propagation path prediction
G. Crack direction angle
Stress intensity factor values are KI,=22.5900 and
KII,=2.6802, finding crack direction angle calculation ][ c
]6802.2/590.22811[6802.24/590.222/
]/811[4(/2/
2
2
c
c
Tan
Tan
050.44
380.522/
c
cTan
Figure 10: Geometric parameters
Nomenclature
KI, KII & KIII Stress intensity factors
x, y Co-ordinates
G Integral path
N Crack direction
a Crack length
r Crack tip distance
I, J, K, M, N, O, P Nodes
UX, UY Degrees of freedom
EX Young’s modulus
NUXY Poisson’s ratio
c Crack dirction angle
H. Crack-Extension criterion
The maximum principal stress criterion states that the
growth of the crack will occur in a direction perpendicular to
the maximum principal stress. Thus, the local crack growth
direction is determined by the condition that the local shear
stress is zero.
I. Incremental crack extension analysis
The incremental crack extension analysis assumes a piece
wise linear discrimination of the unknown crack path. For
each increment of the crack extension, the dual boundary
element method is applied to carry out a stress analysis of
the cracked structure and the J-integral is the technique used
for the evaluation of the stress intensity factor.
Figure 11: Predicted crack propogation path in a spurgear
The steps of this basic computational cycle, repeatedly
executed for any number of crack extension increments are:
a) Carry out the stress analysis of structure,
b) Compute the stress intensity factors,
c) Compute the direction of the crack extension increment
d) Extend the crack one increment along the direction
e) Repeat all the above steps sequentially until a
specified number of crack extension increments are
reached
In practice this requirement gives a unique direction
irrespective of the length of the crack extension increment.
Therefore the procedure adopted in this system is to use a
predictor corrector technique to ensure the crack path is
unique and independent of the crack extension increment
used.
IV. SIMULATION OF CRACK GROWTH
It provides a powerful productivity tool to evaluating the
behavior of existing cracks. The boundary element method
offers several advantages in crack growth simulation
because high stress gradients at the crack tip can be
accurately modeled and continues re-meshing required, to
simulating the crack growth.
Figure 12: Crack tip model
A. Crack Propagation Computational Procedure
First define an initial crack by identifying the node of the
crack mouth and coordinates of crack tip. The element in the
surrounding area of the crack tip, insert a 6node triangular
elements around the crack tip. Then fill the remaining area
between the rosette and original mesh with conventional
8node quadrilateral elements. Mode I & Mode II stress
intensity factor, KI & KII respectively can be calculated. The
stress intensity factor was determined from the finite element
nodal displacements and forces using J-integral method.
Mode I loading refer to loads applied normal to the crack
plane, which tends to open the crack. Mode II refers to in
plane shear loading. The stress intensity factors quantify the
state of stress in the region near the crack tip. The stress
intensity factors can also be used to predict the crack
propagation angles used the mixed mode criteria.
Figure13: Meshing of gear with crack
After the initial crack is inserted in a mesh, the
incremental crack extension analysis is used to simulate the
crack propagation and calculate stress intensity factors,
crack propagation angle. Then the places of new crack tip at
the calculated angle and define crack incremental length.
The model is re-meshed using the delete and fill. The
procedure is repeated a number of times.
Figure 14: Vonmesis stress
In order to mixed mode crack growth an incremental type
analysis is used where knowledge of both the direction and
size of the crack increment extension is necessary. The crack
growth algorithm incorporated in the calculation of direction
angle for the crack extension. For each increment of crack
extension, a stress analysis is performed using boundary
element method and stress intensity factors are evaluated.
The main objective of this paper is to predict the gear
service life in fatigue, in the presence of an intial crack in the
tooth foot. The FEM has been used to simulate the crack
propagation based LEFM, and in the correlation
displacement method to determine the relation between
intensity factor and length of the crack.
Figure 15: Displacement Distribution
The incremental direction along the crack front for next
extension is determined by calculated stress intensity factors.
The crack front is re-meshed and the next stress analysis is
carried out.
Figure 16: Failure Displacement with Crack
B. Computational cycle used to simulate crack growth
The tasks for the analysis:
a) Compute crack initiation location,
b) Compute the boundary element method of cracked
structure,
c) Perform stress analysis of model
d) Compute stress intensity factors and crack growth
direction
e) Compute the direction or angle or crack extension
f) Construct incremental crack surface
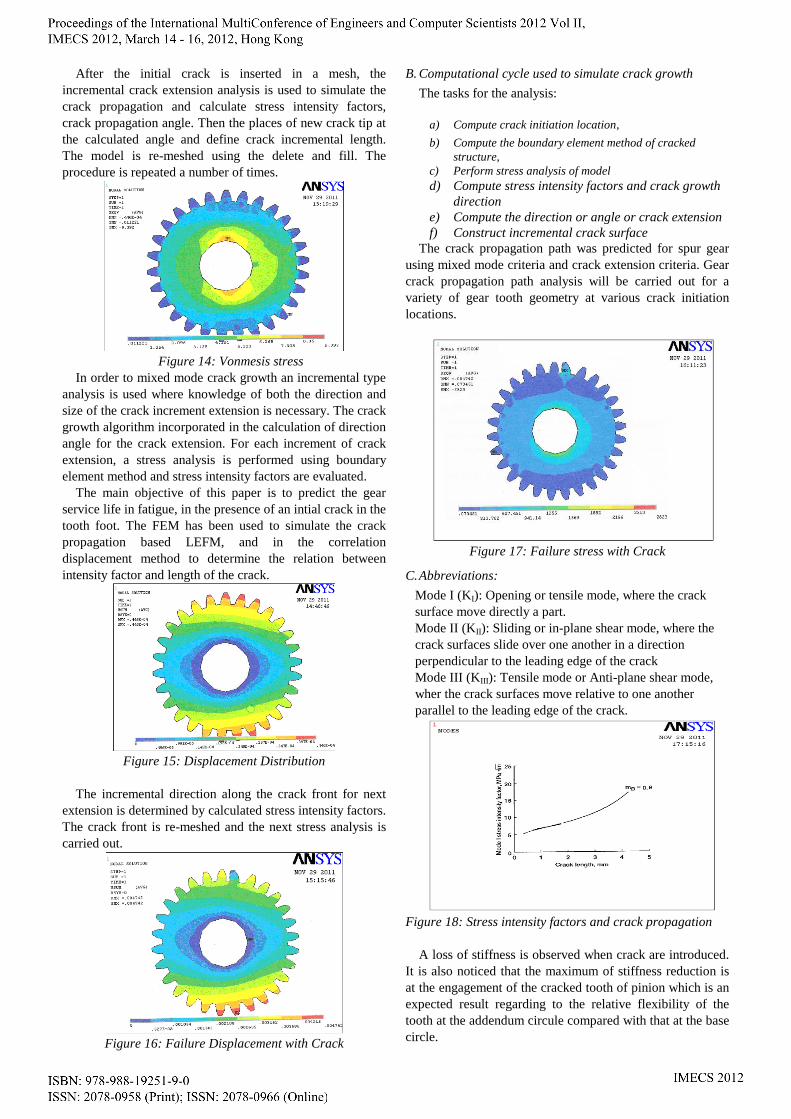
The crack propagation path was predicted for spur gear
using mixed mode criteria and crack extension criteria. Gear
crack propagation path analysis will be carried out for a
variety of gear tooth geometry at various crack initiation
locations.
Figure 17: Failure stress with Crack
C. Abbreviations:
Mode I (KI): Opening or tensile mode, where the crack
surface move directly a part.
Mode II (KII): Sliding or in-plane shear mode, where the
crack surfaces slide over one another in a direction
perpendicular to the leading edge of the crack
Mode III (KIII): Tensile mode or Anti-plane shear mode,
wher the crack surfaces move relative to one another
parallel to the leading edge of the crack.
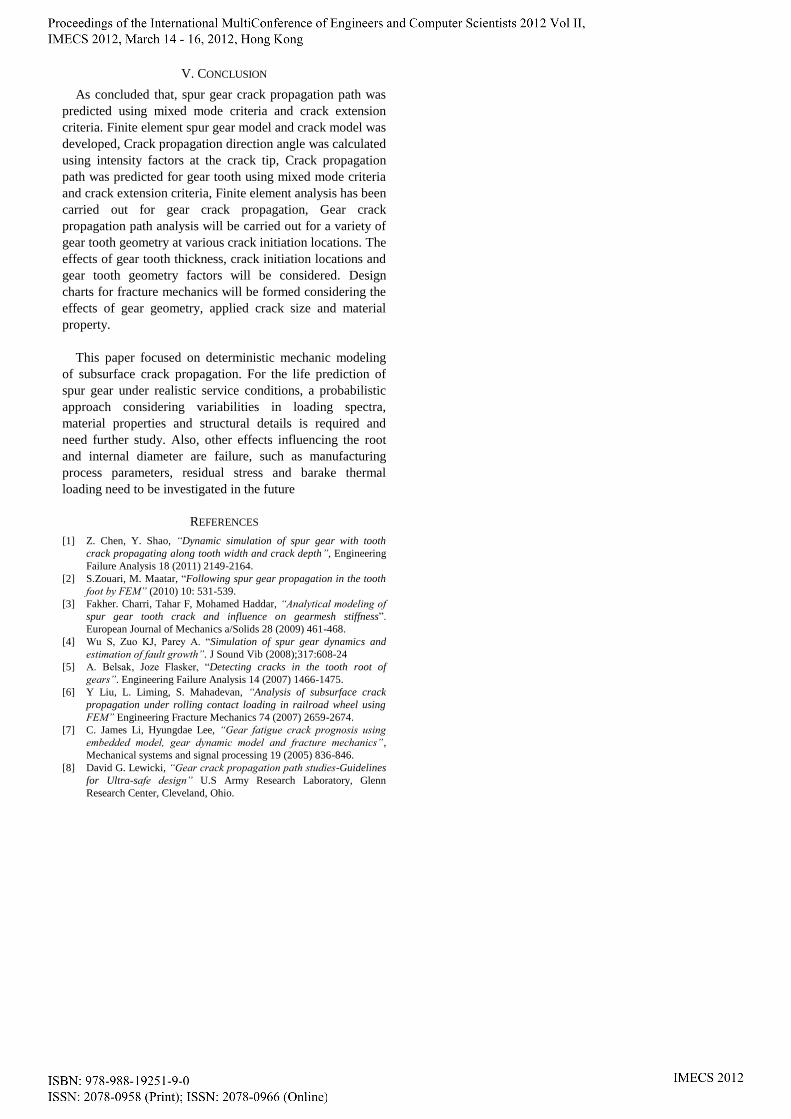
Figure 18: Stress intensity factors and crack propagation
A loss of stiffness is observed when crack are introduced.
It is also noticed that the maximum of stiffness reduction is
at the engagement of the cracked tooth of pinion which is an
expected result regarding to the relative flexibility of the
tooth at the addendum circule compared with that at the base
circle.
V. CONCLUSION
As concluded that, spur gear crack propagation path was
predicted using mixed mode criteria and crack extension
criteria. Finite element spur gear model and crack model was
developed, Crack propagation direction angle was calculated
using intensity factors at the crack tip, Crack propagation
path was predicted for gear tooth using mixed mode criteria
and crack extension criteria, Finite element analysis has been
carried out for gear crack propagation, Gear crack
propagation path analysis will be carried out for a variety of
gear tooth geometry at various crack initiation locations. The
effects of gear tooth thickness, crack initiation locations and
gear tooth geometry factors will be considered. Design
charts for fracture mechanics will be formed considering the
effects of gear geometry, applied crack size and material
property.
This paper focused on deterministic mechanic modeling
of subsurface crack propagation. For the life prediction of
spur gear under realistic service conditions, a probabilistic
approach considering variabilities in loading spectra,
material properties and structural details is required and
need further study. Also, other effects influencing the root
and internal diameter are failure, such as manufacturing
process parameters, residual stress and barake thermal
loading need to be investigated in the future
REFERENCES
[1] Z. Chen, Y. Shao, “Dynamic simulation of spur gear with tooth
crack propagating along tooth width and crack depth”, Engineering
Failure Analysis 18 (2011) 2149-2164.
[2] S.Zouari, M. Maatar, “Following spur gear propagation in the tooth
foot by FEM” (2010) 10: 531-539.
[3] Fakher. Charri, Tahar F, Mohamed Haddar, “Analytical modeling of
spur gear tooth crack and influence on gearmesh stiffness”.
European Journal of Mechanics a/Solids 28 (2009) 461-468.
[4] Wu S, Zuo KJ, Parey A. “Simulation of spur gear dynamics and
estimation of fault growth”. J Sound Vib (2008);317:608-24
[5] A. Belsak, Joze Flasker, “Detecting cracks in the tooth root of
gears”. Engineering Failure Analysis 14 (2007) 1466-1475.
[6] Y Liu, L. Liming, S. Mahadevan, “Analysis of subsurface crack
propagation under rolling contact loading in railroad wheel using
FEM” Engineering Fracture Mechanics 74 (2007) 2659-2674.
[7] C. James Li, Hyungdae Lee, “Gear fatigue crack prognosis using
embedded model, gear dynamic model and fracture mechanics”,
Mechanical systems and signal processing 19 (2005) 836-846.
[8] David G. Lewicki, “Gear crack propagation path studies-Guidelines
for Ultra-safe design” U.S Army Research Laboratory, Glenn
Research Center, Cleveland, Ohio.