squeezing price elasticity into the pricing matrix
TRANSCRIPT

Proprietary Information of Fractal Analytics Inc.
This document contains proprietary and confidential information of Fractal Analytics and subsidiaries (Fractal) and shall not be reproduced or transferred to other
documents, disclosed to others or used for any purpose other than that for which it is furnished, without the prior written consent of Fractal. It shall be returned to
Fractal upon request.
Squeezing Price Elasticity into the
Pricing Matrix
By Deepak Ramanathan
Fractal Analytics Inc.
Presented at the SC CAS Fall meeting 2013

© Fractal 2013 | Confidential
Key points to be covered in the next 60 minutes
1. European insurers have realized substantial benefits by
using price elasticity in their pricing models
2. In the US, though European approach is prohibited, ‘intuition
led’ changes motivated by price elasticity occur
3. By being a bit more scientific while incorporating elasticity
we can improve performance o Without changing the rating structure
o Without introducing new variables in the ROC
o While maintaining ‘loss cost’ as the most important component of pricing
4. Using price elasticity, we can optimize prices while staying
within the allowable band of loss cost indicated relativities
2

© Fractal 2013 | Confidential
How do you determine the scope for improvement
in your pricing model?
3
Move to a multivariate
structure Add more interaction
Enhanced
methodology
Better capture rate of
risk in top deciles
Requires a combination of market knowledge and subjectivity

© Fractal 2013 | Confidential
Average Pricing
0%
20%
40%
60%
80%
100%
0% 20% 40% 60% 80% 100%
Population sorted by Predicted Risk Low Risk High Risk
Cu
mu
lati
ve
% o
f A
ctu
al
Lo
ss
es
How does Progressive view improvements to
price segmentations?
4
2.0–ca. 1994
Ideal Model
8.0 - 2009
“9.0”?
Source: From Progressive’s 2010 handbook ( investor presentation)

© Fractal 2013 | Confidential
We can enhance current segmentation in the
following 4 ways
5
3. New Data
2. Existing Data
1. Better Technique
• Non-parametric techniques (RF, GBM) are showing promise
• Leverage existing data better by creating complex interactions
• Innovative data sources (Telematics, Traffic density, Social data etc)
• Incorporate customer characteristics (elasticity and LTV) into pricing
4. Beyond Cost Plus

© Fractal 2013 | Confidential
Elasticity based pricing & optimization is a well
known concept in the insurance industry
6
It is about reaching the efficiency frontier
Loss cost based pricing
More profit /
same volume
More volume /
same profit
Vo
lum
e (
GW
P)
Profit (1 – loss ratio)
© Fractal 2013 | Confidential
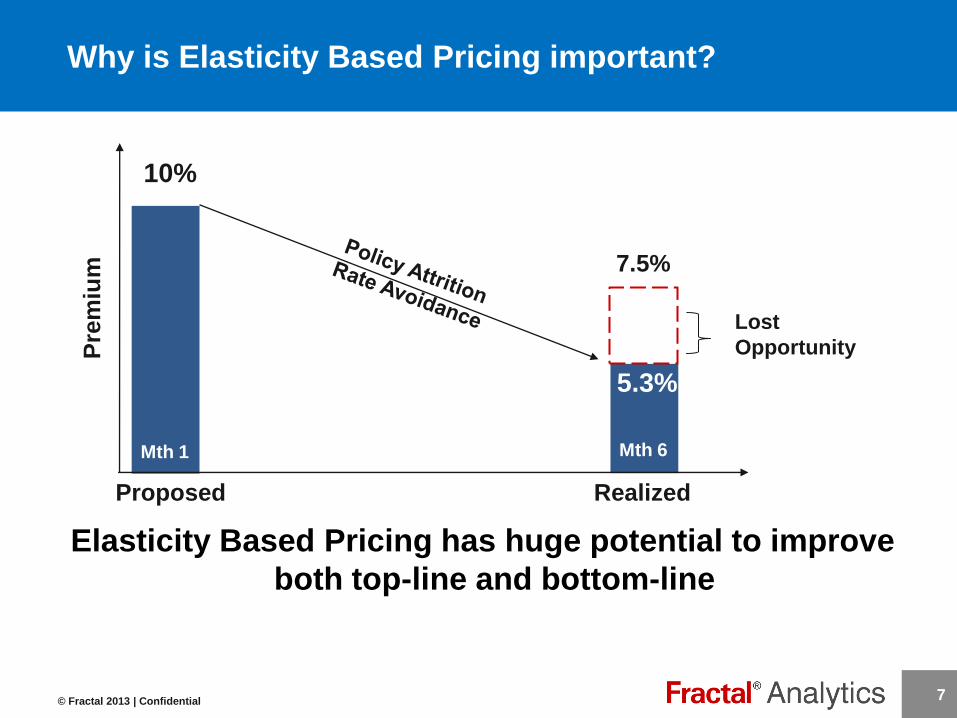
Why is Elasticity Based Pricing important?
Elasticity Based Pricing has huge potential to improve
both top-line and bottom-line
7
5.3%
10%
7.5%
Lost
Opportunity
Mth 1 Mth 6
Proposed Realized
Pre
miu
m

© Fractal 2013 | Confidential
European insurers leverage elasticity in pricing
8
UK market regulations make it easy for insurers to leverage price elasticity
Discounts are offered at point of sale
purely based on elasticity
Selective Discounts
Prices are changed rapidly, some times
multiple times in a day
Frequent Rate Changes
Insurers experiment with prices in the
marketplace to create data for elasticity
Price Testing

© Fractal 2013 | Confidential
In the US, elasticity had not been widely used in
the past because of…
9
• No price testing
• Price parity
• Timeframe in which rates can be
taken
Regulatory requirement
The wait is over
We can capture part of the gain within the regulatory framework
People like us are already doing this
Lack of good data, inability to price
test
Data hurdles

© Fractal 2013 | Confidential 10
We often override pure loss cost in favor of more revenue
Aren’t factors frequently revised after meeting the sales
team?
Isn’t actuarially justified discount such as persistency
discount overridden?
Isn’t rate capping used frequently to avoid disruption?
What is the rationale for such "intuition led", "common
sense led” decisions?
What if we could make these decisions more data driven?
…But ‘intuition led’ Elasticity Based Pricing is
common

© Fractal 2013 | Confidential
Scientific Elasticity Based Pricing requires three
essential components
11
This helps insurers go beyond ‘cost plus’ pricing model and incorporate
key customer characteristics
Index for customer loyalty and
cross-sell potential
Measures customer risk
Helps in segmenting
customers based on risk
attributes
Measures customers’
reaction to price changes
Helps realize different profit
margin depending on price
sensitivity
Future revenue potential /
Lifetime value (LTV)
Loss Cost Modeling
Cost of doing business Price Elasticity
PRICING

© Fractal 2013 | Confidential
…And requires a lead time of up to a year
12
It takes ~6 months to build elasticity & LTV capabilities.
It takes an additional 6 months to run a pilot and validate results.
• Policy level elasticity data Estimated renewal/conversion
Estimated renewal premium
• Policy level LTV data Estimated survival
Estimated future cross-sell
• Elasticity & LTV measurement at
various price changes

© Fractal 2013 | Confidential
Traditional definition of price elasticity is what we read
in text books
13
% change in quantity demanded for
a 1% change in price
e Q / Q
P / P
Where, Q is quantity sold and P is price
Definition
Formula
Estimation Method
Examples
Price testing: Change prices to
monitor demand change
• Oil, rice, salt inelastic (0.4- 0.6)
• Pleasure travel elastic ~ 1.5

© Fractal 2013 | Confidential
…However, in the US insurance context, this concept
deviates widely
14 P is premium; EP is earned premium
New vs. renewal business
e EP / EP
P / P
…By book type
…in its definition
…in the
methodology
…and is not a point
estimate
No price testing and lack of
reliable competitive data
Elasticity is a function of current
premium the magnitude of change

© Fractal 2013 | Confidential
• Assume 3 year
data
• ~ 5 MM annual
policies
• Annual price
change & 80%
renewal
…however estimation is not all that complex
15
Our goal is fill this sparse matrix… Doable?
Dasher Dancer Cupid Comet Rudolph
-20%
0%
5%
+20%
Customers
Pre
miu
m c
ha
ng
e in
%a
ge
Back of envelop
math
Results in
• ~ 7.8 M customer
• 2 data points / policy
• 5% of cells populated
.
.
.
.
.
.

© Fractal 2013 | Confidential
An ensemble of models is built to predict the
probability and magnitude of each response
Understanding price elasticity
Who is going
to buy / renew At what price?
16

© Fractal 2013 | Confidential
Customers exhibit varying tolerance towards price
changes
17
New business customers are more elastic than existing ones because
they tend to shop with multiple carriers before making a decision
80
85
90
95
100
105
110
115
120
-10% 0% 10%
Ind
exe
d to
Pre
miu
m E
arn
ed
a
t 0
% p
rice
ch
an
ge
Uniform price change
Renewal business revenue change by segment
80
85
90
95
100
105
110
115
120
-10% 0% 10%
Ind
exe
d to
Pre
miu
m E
arn
ed
a
t 0
% p
rice
ch
an
ge
Uniform price change
New business revenue change by segment
Illustration only
Segment A- Least Sensitive Portfolio Average Segment B- Most Sensitive
>>>

© Fractal 2013 | Confidential
We can optimize prices by varying a limited
number of rating factors using elasticity & LTV
18
Elasticity & LTV provide new insights about the customer. This can
help us select “better” relativities.
Model Relativity
Upper Confidence
Level
Lower Confidence
Level
Age
35 – 40 years
Selected Relativity
Model Relativity
Upper Confidence
Level
Lower Confidence
Level
Limits
30/50
Selected Relativity
Upper Confidence
Level
Lower Confidence
Level
Territory
Pasadena
Selected Relativity=
Model Relativity

© Fractal 2013 | Confidential
Tests show that this approach works
19
Case Study: Simulation results from a large P & C insurer in the US
Parameter US Regulatory
Scenario
Average premium
change 0% (by design)
Number of policies +0.9%
Written premium +3.5%
Loss ratio -1.0%
Better retention & better top line growth, while remaining risk neutral
UK Market
Scenario (-10% to +10%)
0% (by design)
+3.7%
+9.7%
-2.3%

© Fractal 2013 | Confidential
Other benefits include better forecasting and
objective decision making
20
Rate capping
Forecasting
Framing the Distribution
- Product debate

© Fractal 2013 | Confidential
In Summary…
Optimization techniques have evolved to incorporate elasticity
Due to limited regulations and potential upside, European companies have been early adopters
US insurers are realizing the value of elasticity led optimization
While the accrued benefits may not be as high as in the European scenario, there is money to be made within regulatory constraints
It takes a year to build this capability and go to market with it
21

United States | United Kingdom | Singapore | Dubai | India
fractalanalytics.com
For further details contact:
®
Fractal Analytics helps Fortune 500 companies understand and engage consumers to inspire loyalty through
predictive analytics.
Fractal serves as a strategic partner to market-leading companies by institutionalizing data-driven decisions
across the enterprise.
Deepak Ramanathan Vice President Client Consulting
323-719-4165
Thank You

© Fractal 2013 | Confidential
Customers exhibit varying tolerance towards price
changes
23
91
100
108
93
100
105
95
100
103
80
85
90
95
100
105
110
115
120
-10% 0% 10%
Indexed t
o P
rem
ium
Earn
ed
at
0%
price c
hange
Uniform price change
Renewal business revenue change by segment
Illustration only
Segment A- Least Sensitive Portfolio Average Segment B- Most Sensitive

© Fractal 2013 | Confidential
Customers exhibit varying tolerance towards price
changes
24
94
100
107
97
100
105
110
100
85
80
85
90
95
100
105
110
115
120
-10% 0% 10%
Indexed t
o P
rem
ium
Earn
ed
at
0%
price c
hange
Uniform price change
New business revenue change by segment
Illustration only
Segment A- Least Sensitive Portfolio Average Segment B- Most Sensitive
<<<

© Fractal 2013 | Confidential
To estimate renewal elasticity, we need historical
data about policy renewals
25
Premium information
Old premium (before renewal)
New premium (billed renewal)
Customer reaction
Did the customer attrite?
Or renew at the billed premium?
Or at a different premium?
Policy characteristics
All rating factors
Demographics
Competitive data
Required
data
elements

© Fractal 2013 | Confidential
To estimate new business elasticity, we need
historical quote data
26
Quote conversion information
Did the quote convert?
At what price?
Rating information
Rating engine
Dates of rate change
Historical rating factor relativities
Quote characteristics
All rating factors
Demographics
Competitive data
Required
data
elements