srf test areas cryogenic system controls graphical user interface
TRANSCRIPT
SRF TEST AREAS CRYOGENIC SYSTEM CONTROLS GRAPHICAL USER INTERFACE B. D. DeGraff, G. Ganster, A. Klebaner, A. D. Petrov, W. M. Soyars Fermi National Accelerator Laboratory Batavia, IL, 60510, USA ABSTRACT
Fermi National Accelerator Laboratory has constructed a superconducting 1.3 GHz cavity test facility at Meson Detector Building (MDB) and a superconducting 1.3 GHz cryomodule test facility located at the New Muon Lab Building (NML). The control of these 2K cryogenic systems is accomplished by using a Synoptic graphical user interface (GUI) to interact with the underlying Fermilab Accelerator Control System. The design, testing and operational experience of employing the Synoptic client-server system for graphical representation will be discussed. Details on the Synoptic deployment to the MDB and NML cryogenic sub-systems will also be discussed.
KEYWORDS: New Muon Lab, Meson Detector Building, Synoptic, Control System, Graphical User Interface INTRODUCTION For the past three decades, the various cryogenic systems at Fermilab have relied on the Accelerator Controls Network (ACNET) to provide both read backs and control of the operating systems. ACNET has evolved over these decades, but is generally comprised of three primary elements: it was originally a network protocol on top of the User Datagram Protocol (UDP) used for accelerator control systems, it comprised a console user environment in the accelerator control system, and it served as the hardware and software controls for the entire Fermilab complex. New cryogenic installations at the Meson Detector Building (MDB) and New Muon Laboratory (NML) were originally designed with stand-alone controls infrastructure. Starting in 2009, an administrative decision was made to transition these two facilities back to an ACNET user interface. At the time of this decision, a new Sun-Microsystem JAVA
FERMILAB-CONF-11-260-AD
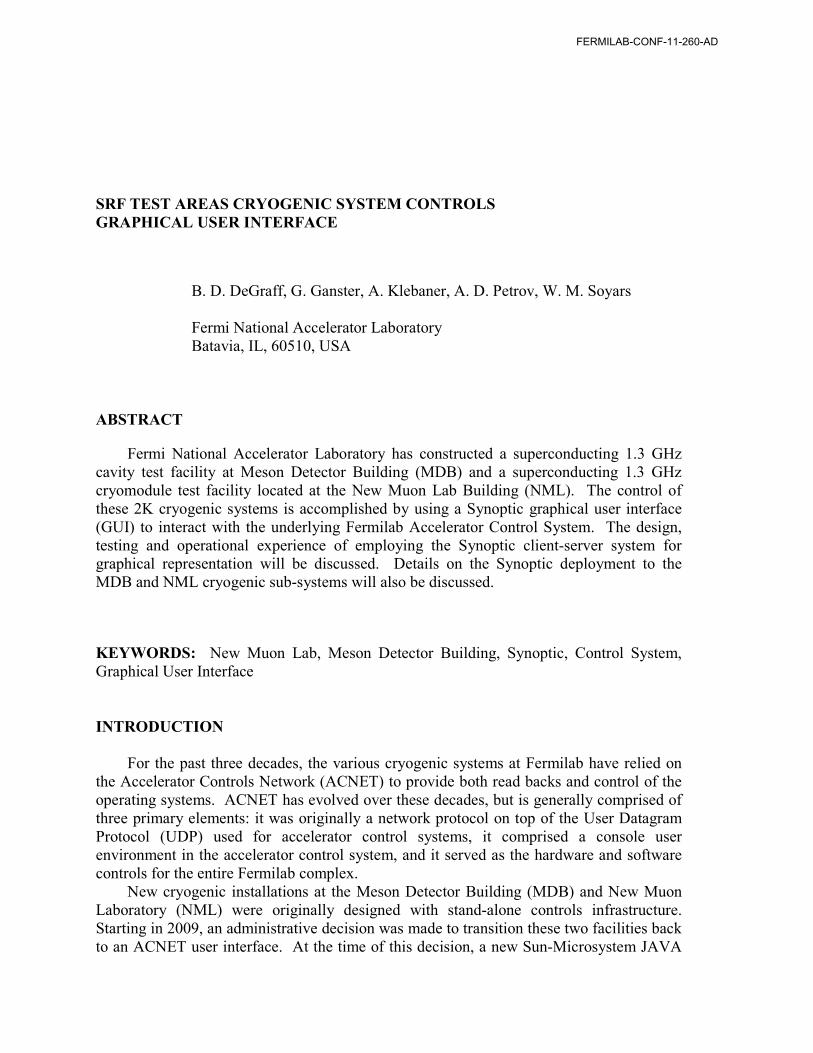
based Graphical User Interface (GUI) tool named Synoptic was developed at within the Fermilab Accelerator Division Controls Department. The control system for MDB and NML can now be broken down into three distinct components: programmable logic controllers (PLC) are used for all instrument input and output (I/O) and loop logic, ACNET is utilized for device conditioning for data-logging and alarm configuring, and Synoptic functions as the primary GUI for both display and control. Synoptic has completed a successful commissioning period at both MDB and NML and is now being fully used for both onsite and offsite monitoring and control of both systems. SYNOPTIC ARCHITECTURE DETAILS Structure And Components of Synoptic Control Interface Synoptic is a system for graphical representation of real-time data in the Fermilab Accelerator Control System. Synoptic provides uses with the ability to create both static and dynamic images that provide the ability for read-backs and settings. These displays can run either within a JAVA application or in a conventional browser as Scalable Vector Graphics (SVG) images which are updated constantly. As of September 2010, an open source version of Synoptic is available for public download under a Berkley Source Distribution (BSD) license. The Synoptic architecture is distributed over both a server central repository and local files on the client’s machines. This design allows for multiple clients to access the same graphical displays. FIGURE 1 shows a schematic representation of the distributed Synoptic architecture. There are three basic components to the Synoptic design package used to create, share and view the GUI. The first component of this package is the builder application. In this
FIGURE 1. Synoptic Architecture

FIGURE 2. NML North Heat Exchanger Synoptic Graphic Inside Builder Application construction program, the user creates the graphical components through a drag and drop system of placing and connecting components. In this scheme of creating images, the user does not need to be knowledgeable about the underlying programing. FIGURE 2 shows an example of the NML North Heat Exchanger display in the builder.
In the builder, the list of available static and dynamic components is available in a menu on the left side of the page. Static components are display in the builder as they would be seen in the viewer. Dynamic components display in the builder as blocks and are connected to input devices. Dynamic devices have a wide functionality for displaying different color configurations based the value of the input signal. Two state devices, like engines or valves, have the ability to display one color for one state and another color for another state. The second component of Synoptic is the viewer application. This application can be launched from within the ACNET control system or through a standalone browser with equal functionality for onsite operations. For use in a browser, the user is authenticated through the same Kerberos protocol used to gain access into ACNET. With this authentication, the Synoptic pages allow for both read and setting access. The user is able to navigate around different Synoptic view pages through a built in menu system. Each graphic has a unique address allowing building components to be configured on graphics to allow for single click access to new displays. This same mechanism allows the user to access deeper information on a given page, such as device control or more detailed information. The desired number of layers and complexity for a given control system is completely determined by the user through the setup in the builder application. The third component to the Synoptic system is the central repository of stored graphical images. This central repository is located on an Accelerator Division server and allows concurrent access by several users. Additionally, different users can be accessing the builder version of graphics simultaneously with users utilizing the viewer application for the same graphic. This simultaneous access is accomplished by using a check in and check out structure for modifying graphics in the builder application.
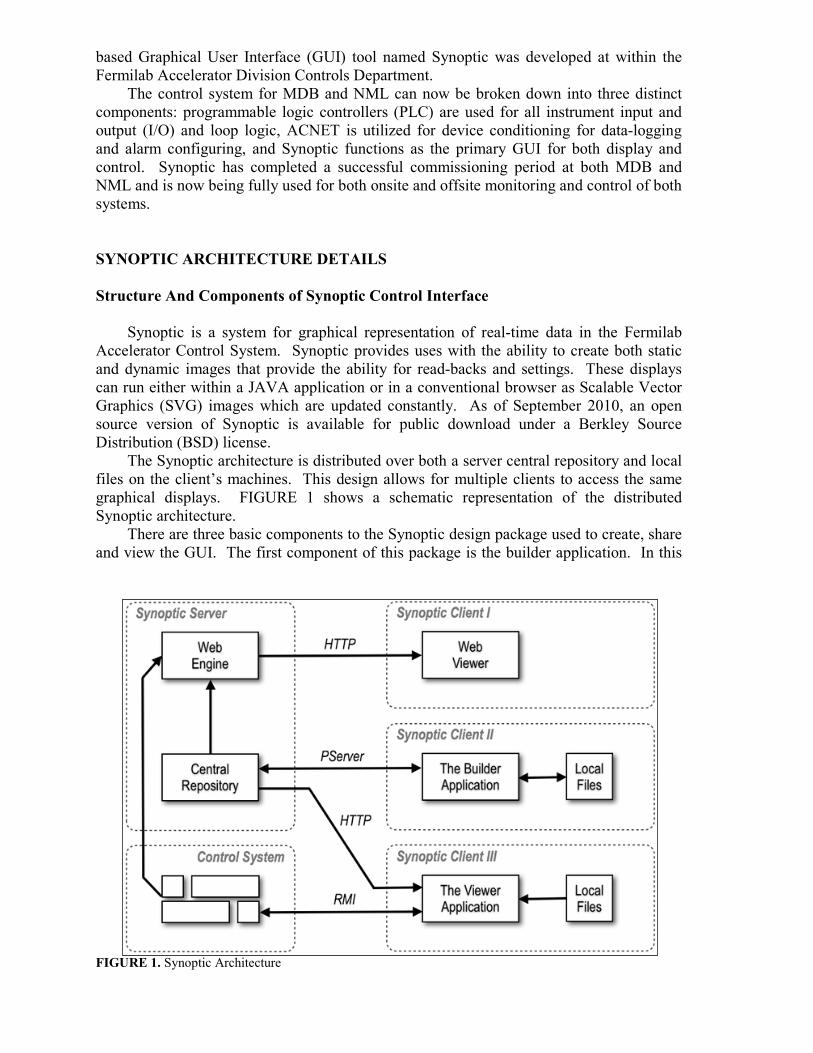
FIGURE 3. NML North Heat Exchanger Synoptic Graphic Inside Viewer Application SYNOPTIC IMPLEMENTATION The Synoptic GUI was first implemented for the north heat exchanger at NML. This system was brought online separate from the south heat exchanger and the rest of the operating NML infrastructure. FIGURE 3 shows the operational NML north heat exchanger as seen through the Synoptic viewer application. Once the commissioning period had finished for Synoptic with regards to the north heat exchanger, the graphics were developed to provide full control and monitoring for the entire NML system. The cryogenic system had graphics constructed for both heat exchangers, adsorbers, gas and liquid nitrogen storage, warm compressors, transfer lines, SCRF testing modules, warm vacuum pump and oxygen deficiency hazard monitoring (ODH). With the NML pages serving as a template, the entire MDB system was converted to Synoptic graphics with the same general page structure as NML. The ODH monitoring page is unique in that it does not represent a process diagram, but rather represent graphically the values of ODH monitoring hardware and the states of NML ODH protection equipment. FIGURE 4 shows the design of the ODH monitoring page. The component pages described above serve as the backbone for the GUI for both NML and MDB. On every graphic page, there are many elements that are selectable and when activated will display their own Synoptic graphic page. One example of this layering of Synoptic pages is valve control. Each valve in the system has its own loop control to allow the operator to make functional changes to the system. FIGURE 5 shows a loop control page for a MDB valve as seen from inside the viewer. Whenever possible, graphical pages were developed for NML and MDB as templates, much like callable function within a programming language. Templates were used for generation of control valve loop graphics, engine control graphics, and compressor control graphics. The responsibility for configuring the appropriate ACNET inputs into the Synoptic template was accomplished inside the Synoptic builder applications.

FIGURE 4. NML ODH Monitoring Graphic Inside Viewer Application
FIGURE 5. MDB Loop Control Graphic Inside Viewer Application
CONCLUSIONS The implementation of the Synoptic as the GUI for both NML and MDB has been a success. Both facilities are currently fulfilling their individual roles in SCRF testing as a result of successful availability of the cryogenic systems. The tools available for creating Synoptic pages will continue to be developed to serve the evolving needs of users.
ACKNOWLEDGEMENTS
Fermilab is operated by Universities Research Association Inc. under Contract No. DE-AC02-76CH03000 with the United States Department of Energy. The authors are grateful to all those in the Fermilab Cryogenic Department who have contributed to the successful operation both New Muon Lab and Meson Detector Building. Special thanks to Andrey Petrov and Tim Bolshakov for their early developmental work on the Synoptic Programing. REFERENCES 1. Soyars, W.,