sri annual meeting · agenda 1.30pm introduction and bp board context - carl-henric svanberg,...
TRANSCRIPT

SRI annual meeting
5th
December 2014
Carl-Henric Svanberg
Chairman

Cautionary statement
Forward-looking statements - cautionary statement
The presentations and the associated slides and discussion contain certain forecasts, projections and forward-looking statements – that is, statements related to future, not past events – with respect to the financial condition,
results of operation and businesses of BP and certain of the plans and objectives of BP with respect to these items. In particular, among other statements, certain statements regarding future focus on safety and efficiency in
operations; BP’s expectations in respect of future global demographic and economic trends, expectations regarding future trends in global energy demand and expectations regarding future contributions to global supply from
different energy sources; BP’s plans and expectations regarding the 'BP Proposition', including plans to focus on value rather than volume, active portfolio management, the delivery of material growth in operating cash flow
through 2018, strong capital discipline and growth in distributions to shareholders; BP’s plans to deliver an increase in operating cash flow by more than 50% by year end 2014 versus 2011; BP’s plans to operate in a way that
brings value to everyone affected by its work; BP’s forecasts regarding full year 2014 BOP reliability; BP’s plans regarding contractual commitments and relationships with subcontractors including commitments relating to BP’s
Human Rights Policy and to bribery, corruption and money laundering risks, the anticipated signing of future global agreements with main contractors and expectations regarding BP’s contractor management; BP’s expectations
regarding its forward agenda and the continued delivery of safe, reliable operations; certain plans and objectives described in the ‘Long-Term Technology View to 2050’ including expectations regarding the effects of future global
decarbonisation and of disruptive technologies; BP’s expectations regarding new geographic opportunities; BP’s expectations regarding the future development of 33 billion boe of resources into reserves; and BP’s expectations
and projections regarding the makeup of its future portfolio in the mid 2020s including the outlook for unconventionals, diversification of future cash flows, future portfolio resilience and the effects of future and current
technologies on BP’s portfolio; are all forward looking in nature.
By their nature, forward-looking statements involve risk and uncertainty because they relate to events and depend on circumstances that will or may occur in the future and are outside the control of BP. Actual results may differ
materially from those expressed in such statements, depending on a variety of factors, including the timing of the receipt of relevant third party and/or regulatory approvals; the timing and level of maintenance and/or turnaround
activity; the timing and volume of refinery additions and outages; the timing of bringing new fields onstream; the timing, quantum and nature of certain divestments; future levels of industry product supply, demand and pricing,
including supply growth in North America; OPEC quota restrictions; PSA effects; operational problems; economic and financial market conditions generally or in various countries and regions; political stability in relevant areas of
the world; changes in laws and governmental regulations; changes in sanctions and other trade restrictions; regulatory or legal actions including the types of enforcement action pursued and the nature of remedies sought or
imposed; the actions of prosecutors, regulatory authorities and courts; the impact on our reputation following the Gulf of Mexico oil spill; the actions of the Claims Administrator appointed under the Economic and Property
Damages Settlement; the actions of all parties to the Gulf of Mexico oil spill-related litigation at various phases of the litigation; exchange rate fluctuations; development and use of new technology; the success or otherwise of
partnering; the actions of competitors, trading partners, creditors, rating agencies and others; decisions by Rosneft’s management and board of directors in respect of strategy, operations or otherwise; the actions of contractors;
natural disasters and adverse weather conditions; changes in public expectations and other changes to business conditions; wars and acts of terrorism, cyber-attacks or sabotage; and other factors discussed under “Principal risks
and uncertainties” in BP’s Stock Exchange Announcement for the period ended 30 June 2014 and under “Risk factors” in our Annual Report and Form 20-F 2013 as filed with the US Securities and Exchange Commission (SEC).
Statement of Assumptions - The operating cash flow projections in this presentation for 2014 assume an oil price of $100/bbl and a Henry Hub gas price of $5/mmBtu, and, for 2015 to 2018, assume an oil price of $100/bbl and a
Henry Hub gas price of $5/mmBtu; real. These projections have been adjusted to (i) remove TNK-BP dividends from 2011 operating cash flow; (ii) include BP’s estimate of Rosneft dividends; and (iii) include the impact of payments
in respect of the settlements reached of all criminal and securities claims with the U.S. government and the SEC. These projections do not reflect any other future potential cash flows relating to other liabilities, contingent
liabilities, settlements or contingent assets arising from the Gulf of Mexico oil spill which may or may not arise during such periods. As disclosed in the Stock Exchange Announcement for the period ended 30 September 2014,
we are currently not able to reliably estimate the amount or timing of a number of contingent liabilities.
Cautionary note to US investors – This presentation contains references to non-proved resources and production outlooks based on non-proved resources that the SEC’s rules prohibit us from including in our filings with the
SEC. U.S. investors are urged to consider closely the disclosures in our Form 20-F, SEC File No. 1-06262. This form is available on our website at www.bp.com. You can also obtain this form from the SEC by calling 1-800-SEC-
0330 or by logging on to their website at www.sec.gov.
Tables and projections in this presentation are BP projections unless otherwise stated.
Stock Exchange Announcement: For further information on BP’s results, please see our Stock Exchange Announcement for the period ended 30 September 2014.
December 2014

Agenda
1.30pm Introduction and BP Board context - Carl-Henric Svanberg, Chairman
Industry context, our strategy and our
priorities
- Dev Sanyal, Executive vice president, strategy and
regions
Managing operational risk - Bob Fryar, Executive vice president, safety and
operational risk
Managing risk in the Upstream supply chain - Bernard Looney, Chief operating officer, Production
Qs and As
3.30pm Break
3.40pm The Long-Term Technology View - David Eyton, Group head of technology
Portfolio - Dominic Emery, Vice president, long-term planning
Qs and As
5pm Finish

Carl-Henric Svanberg
Chairman
BP Board context

Dev Sanyal
Executive vice president, strategy and
regions
Industry context, our
strategy and our priorities

Industry Context
NON-OECD
1990 2005 2020 2035 1990 2005 2020 2035
GDP PRIMARY ENERGY
OECD
NON-OECD
OECD
TRILLION
$2011 PPP
BILLION
TOE
140
120
100
80
60
40
20
0
12
9
6
3
0
Source: BP Energy Outlook 2035
1990 2005 2020 2035
40
30
20
45
35
25
15
%
SHARES OF PRIMARY ENERGY
OIL
GAS
COAL

Our Strategy
A focused oil and gas company delivering value over volume

The BP Proposition 2014 TO 2018
Active portfolio management
Growing sustainable
free cash flow
Material growth in operating
cash flow
Capital discipline
Growing distributions
Progressive dividend
Surplus cash biased to
further distributions
Value over volume

Bob Fryar
Executive vice president, safety and
operational risk
Managing operational risk

A safer, stronger BP
Three enduring principles guide our efforts, they are:
• Our operating management system (OMS) is the way BP operates
• To promote deep capability and a safe operating culture across all levels of BP
• To test our conduct of operating through self verification, independent
assurance and audit
BP’s agenda is a multi-year programme with activities risk-prioritized and
paced to achieve enduring and sustainable change.

• Operating requirements
• Performance improvement
• Local processes
OMS as the way BP operates

Promoting deep capability and a safe operating culture
• Leadership
• Hazard awareness
• Continuous improvement (CI)
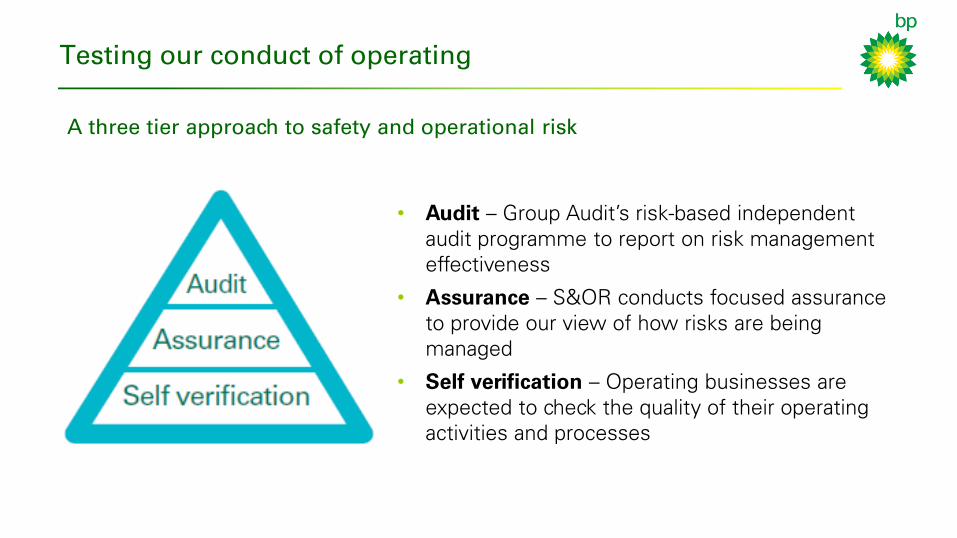
Testing our conduct of operating
• Audit – Group Audit’s risk-based independent
audit programme to report on risk management
effectiveness
• Assurance – S&OR conducts focused assurance
to provide our view of how risks are being
managed
• Self verification – Operating businesses are
expected to check the quality of their operating
activities and processes
A three tier approach to safety and operational risk

Safety and environmental performance
Number of Tier 1 & Tier 2 Process Safety Events (T1 & T2 PSE) Number of Losses of Primary Containment (LOPC)
Recordable Injury Frequency (RIF) Number of Oil Spills >=1bbl

Bernard Looney
Chief operating officer, Production
Managing risk in
the Upstream supply chain

Contractors in the Upstream
• 16,000 contractors
• ~70% of hours worked
• Prioritised by risk (PHCA), value (strategic,
core, transactional)
• 373 contracts with PHCA elements
• 29 strategic contractors
• $30bn annual spend
• Wells $9bn
• Operations $10bn
• Projects $10bn

Governance
• Category Management Common Process (CMCP)
• OMS 2.5 (“Working with Contractors”)
• Upstream Contractor Safety Management Procedure
• Contract Governance Boards
• Performance Reviews
Planning
Global
Category
Strategy
Sourcing Supplier
Management
Holding contractors to account for following their management system

Oversight – E-Wells

Global Operations Organization - Progress
Data excludes L48.
0
5
10
15
20
25
2010 2011 2012 2013 2014 YTD
GOO Process Safety -
Tier 1 Events
80%
85%
90%
95%
Upstream Operated
Plant Reliability

Global Wells Organization - Progress
BOP Reliability
Non-productive time (days)
603
415
203
0
100
200
300
400
500
600
700
2012 2013 2014
Forecast
• Dedicated team of experts
• Global BOP hot-line
• 4 focus areas:
• Troubleshooting and risk
assessment
• Maintenance
• Defect elimination
• Contractor engagement
19.9m
6th
Gen BOP
3.5m
BOP Reliability Team

Our agenda – non safety risks
• Human Rights
• Bribery, corruption and
money laundering
• Local Content

Forward agenda
• Safety – remains job #1
• Attentive to non safety risks
• Fewer, deeper, more collaborative
relationships
• Clearer ownership and accountabilities
• Self verification (contractor)
• Oversight (BP)
SRI annual meeting
5th
December 2014
Questions

SRI annual meeting
5th
December 2014

David Eyton
Group Head of Technology
The Long-Term Technology View

Opportunities to improve
end-use efficiency,
including transportation
Increasing competition
between value chains
No shortage of
hydrocarbons – but the
merit order could change
Value chains Consumption Resource base
Regional differences
Optimum solutions will differ owing to resource availability and above-ground factors
Cross-cutting themes
Modularity, digital opportunity and climate concerns
Long-Term Technology View to 2050

Technology impact on energy resources
• Abundant technically-accessible resources
• Discovered oil & gas endowment increasing
• Technology adding to resources
• Key oil & gas levers
seismic imaging
enhanced oil recovery
digital techniques
Centre for High Performance Computing, Houston

Decarbonisation
• Increasing competition between value chains
• Easier to decarbonise power than transportation
• Greatest impact switching from coal to natural gas
• Electric/fuel cell vehicles expensive
• Liquid transportation fuels remaining major part of mix

Disruptive technologies
• Digital, bio- and nano-technologies
• Horizon scanning
university programmes
venturing
• Great potential when applied to
enhanced oil recovery
batteries for transport
advanced solar conversion
gen IV nuclear

Social, environmental and policy factors
• Significant regional variation
access to resources
existing infrastructure
market regulation
• Complex relationships between energy
and other natural resource constraints
• Influence of public opinion and
consumer behaviour
• Fostering innovation

Dominic Emery
VP, Long-term planning
Portfolio

BP’s portfolio drivers
Safe, reliable &
efficient execution
Active portfolio
management
Capital framework Capabilities Resource renewal
and mix

Current portfolio
• A focused oil and gas company
• 44 billion boe resources
• 11 billion boe reserves
• 13 years reserves to production
• Diversity
• Geography
• Resource type
• Segment
Upstream and Downstream
Upstream only
Downstream only

Future portfolio
• Growing demand for gas
• Premium markets
• High value products
• Growing supply opportunities
• Unconventional oil and gas
• Long-life cash flows
• Portfolio diversity and resilience
2014 Mid 2020s
Oil
Gas
Conventional
Deepwater
Unconventional

SRI annual meeting
5th
December 2014
Questions

SRI annual meeting
5th
December 2014