sri lanka: a microeconomic and sociopolitical perspectivepublications.iwmi.org/pdf/h033356.pdf ·...
TRANSCRIPT
The Prospects of System of Rice Intensification Adoption in Sri Lanka A microeconomic and sociopolitical perspectivel
Regassa E Namara1 P Weligamage1
and R Barker
lIntemational Water Management Institute 127 Sunil Mawatha Pelawalte Battaramua
Mailing Address P 0 Box 2075 Colombo Sri Lanka Telephone +94-127874042784080 Fax +94-12786854
E-mailrnamaracgiarorg 2Inlemational Water Management Institute
127 Sunil Mawatha Pelawale Battaramulla Mailing Address P 0 Box 2075 Colombo Sri Lanka
Telephone +94-1 2787404 2784080 Fax +94-12786854 E-mail Pweligamagecgiarorg
3ntemational Water Management Institute P O Box 1025 Kasetsart University Bangkok 10903 Thailand
Telephone +66-2561-4433 Fax +66-2561-1230 Email rbarkercgiarorg
ABSTRACT
The yield gains in rice during the pre-World War II period in Japan and Taiwan and subsequently during the green revolution were based on heavy applications of chemical fertilizers and pesticides Today there is increasing interest world-wide as well as in Sri Lanka in assessing the potential for maintaining or increasing rice yields by sharply reducing or eliminating all together the use of chemicals and by decreasing irrigation requirements The System ofRice Intensification (SRI) first developed in Madagascar and now being tested in many countries is an example of such an approach The system is based largely on organic farming principles with heavy application of compost and additional requirements for spacing and transplanting of seedlings Some proponents claim that SRI will revolutionize the method of rice production while others see it as a fad
In Sri Lanka we have undertaken a study to systematically examine the experience of both SRI and non-SRI adopters Data was obtained in two locations from 120 farmers half of whom were SRI adopters We found a wide variation in the way that farmers practiced SRI with the majority of SRI adopters using the practice on only a portion of their farms and using some chemical inputs particularly urea SRI farmers reported about a 40 percent yield increase and returns for crop budgets were higher even charging a relatively high rate for labor However as found in other studies many farmers dis-adopted after a season or two largely because of heavy labor requirements But the poorer farmers with a low opportunity cost for labor and rainfed farmers reluctant to use heavy application of chemicals due to weather risks were more likely to continue with SRI Thus we conclude that SRI is a niche technology suitable for a limited number of farmers but that due to the high management requirements the spread of SRI will require a concerted extension effort
This research contributes to the Comprehensive Assessment of Water Management in Agriculture (wwwiwroiorglassessment) The research was supported by a grant from the Govemment of Netherlands to the Comprehensive Assessment
330
~
--
1
1 INTRODUCTIONA The South Asian region has been transformed from a state of severe food shortages and starvation of large members of its people during 1960s mainly due to the poor productivity of two of its staple cereals (ie rice and wheat) to surplus production although distribution is still a problem The main factors behind this transformation process were introduction of short-stature fertilizershyresponsive lodging- and disease- resistant and high-yielding varieties investments in irrigation infrastructure massive use of chemical fertilizers herbicides insecticides and fungicides and government support through extension and micro-credit provisions This process may simply be described as the conventional system ofproduction intensification This system of production intensification has made it possible to achieve food security at a national level but has had serious negative social and environmental externalities such as (i) depletion of water tables (ii) decline in soil fertility (ii) aggravation of air pollution and (iv) resistance of weeds to certain herbicides (Stoop et aI 2002)
There is a growing interest in what some regard as a new intensification process but what faffilers will tell you is in fact a very old process - farming without chemicals or with a minimum use of chemicals andor farming to reduce water requirements This is known by different labels such as low external-input sustainable agriculture organic farming ecological farming intermitent irrigation alternate wetting and drying aerobic rice cultivation etc The system of rice intensification (SRI) shares one or more ofthe aspects of these methods ofproduction
and 11 Dermition of SRIlzers
in What exactly is the SRI The system was developed in Madagascar by Fr De Laulanie a French ~ or priest and agriculturist through working with farmers (Uphoff etal 2002) Many have given The definitions and descriptions of SRI 2
All of these definitions underline the importance of lany conceptualizing SRI as a system rather than as a technology as it is not necessarily a fixed set of ling practices Therefore SRI is not a package of fixed technical specifications it is rather a system of and production formed based on certain core principles from soil chemistry and biology rice nee physiology and genetics and the principles of sustainability with the possibility of adjusting the
exact technical components based on the prevailing biophysical and socioeconomic realities of an area This definition calls for research and adaptation of the system to specific conditions of an
RI area rather than trying to impose practices relevant to one location on the other injudiciously ere SRI practices are still evolving and concerns are more about improving factor productivity ity of land labor water and nutrients and harnessing potential of soil biology for pushing up further aJ the yield plateau of rice The main components of SRI are (1) planting method (2) soil fertility or management (3) weed control and (4) water (irrigation) management These components should in always be tested and varied according to local conditions rather than simply adopted )r
s Planting method refers to the spacing configurations and age of seedlings Under SRI the rice e plartt is transplanted 8-15 days after germination which is much earlier than the usual three to of four weeks Transplanting should be done quickly and carefully preferably within 15-30 minutes
of uprooting on texturally finer soils One or two rice seedlings are transplanted per hill not in clumps of more than three seedlings as usually the case and damage to the roots is carefully avoided Planting is done on a square grid of25x25 em or even larger (up to 50x50 em) which is
2 For descriptions and defmitions of SRI see httpciifadcomelledusriJindexhtml
331
~ -o
much sparser than the usual 15x15cm or 20x20 cm Some also suggest 30 x 30 cm in the main season and 25 x 25 cm in the off-season as an appropriate spacing The spacing should be adjusted according to the local edaphic conditions but must facilitate weeding
Concerning the soil fertility management nutrients should be added to the soil preferably in the form of organic matter such as compost or mulch The use of chemical fertilizer should be minimized and gradually avoided as the nutrient status of the soil develops Weed control is best done with mechanical weeder often called rotating hoe starting 10 days after transplanting and then weeding every ten days at least 2 or 3 times but if possible until canopy closure This is necessary for growing rice when fields are not kept continuously flooded Weeding is done often not only to control weeds but also to aerate the soil around the plants
Irrigation Water Management is practiced in such a way that the soil is kept well drained rather than continuously flooded and saturated during the vegetative growth period Two possibilities are suggested (1) application of a small quantity of water daily but leaving the field dry for several short periods (2-6 days) to the point of surface cracking during tillering and (2) flood and dry the field for alternating periods of 3-6 days each which is known as Alternate Wetting and Drying (Barker et al 2001)
12 Objectives and Scope of the Study
Following the reports of its dramatic yield and water productivity advantages in Madagascar SRI has recently generated interest and discussions among researchers development practitioners and policy makers in other countries These discussions have often resulted in polarized views with one group advocating for the wider dissemination of the practice and another group questioning the plausibility of the reported advantages On-farm and on-station experiments have been setup in Africa Asia and Latin America to substantiate the alleged advantages3
These experiments vary in design and rigor from simple un-replicated on-farm trials conducted by NGOs either alone or in cooperation with NARES to meticulously designed factorial trials The yield advantages reported from these experiments range from 19 to 270 percent with yield levels as high as 15 to 20 tlha (McHugh et aI 2002 Bonlieu 1999) About 50 percent water savings are also reported with little or no reduction in yield (Thiyagarajan et aI 2002) But the results of these studies do not always converge and it is difficult to compare the results from one experiment with another 4 For instance an experimental result from the IRRI showed disappointingly low performance of SRI Similar study done at Rice Research and Development Institute at Batalagoda in Sri Lanka showed no significant difference between SRI and the conventional system of rice production (Wickramasinghe 2002 pers commu) Except for the Mosher and Barretts (2002) work in Madagascar most studies on SRI so far are limited to experimental and demonstration activities Hence there is a need for directly documenting farmers own independent experience with SRI
This study tries to fill this research gap based on Sri Lankan SRI farmers experience During the year 2002 more than 3000 farmers in 18 districts of Sri Lanka were estimated to be practicing
3 For detailed infonnation regarding this issue see httpcjifadcomelledusrilindexhtml 4Tle experiments were not standardized and the resulting yield figures were not standardized Some reports for instance give figures for yield advantage based on results from different plot size for SRI and conventional
332
~
--
1 the main SRI in small plots of about 02 ha on average (Batuwitage 20025 The specific objectives of the should be study were
1 To assess the dynamics and determinants of adoption of the System ofRice Intensification 2 To evaluate the farm-level productivity economics resources conservation and water saving
tbly in the impacts of the System of Rice Intensification adoption should be To assess the poverty outreach of SRI adoption and rol is best To derive research extension and policy implications mting and middote This is The paper is organized as follows The next section deals with methodology Section 3 provides a lone often brief site description Section 4 and 5 presents the pattern of adoption and determinants of
adoption and dis-adoption in the two study areas Section 6 compares the benefits and costs of SRI with conventional practices Section 7 shows the poverty impact of SRI The final section
ned rather presents the conclusions and implications ~ssibilities
d dry for flood and 2 METHODOLOGY AND DATA ~tting and
Data for this paper were obtained from surveys in two localities of Sri Lanka The data generation process followed two inter-related steps First focus group interviews and key informant surveys were undertaken at various times during September and November of 2002 A team of agricultural economists led by a principal researcher from the International Water Management
scar SRI Institute made visits to farmers fields the National rice breeding station an ecological farming )fiers and center (a training center undertaking farmer training on SRI) Agriculture Development Authority ews with branch offices and Ceylon Electricity Board (CEB) to assess the views of various stakeholders estioning regarding the prospects of SRI in Sri Lanka ~n setup eriments Second the views and perceptions of the stakeholders obtained in the first step were distilled into )s either specific research questions and hypotheses for empirical testing using structured (formal) he yield questionnaire survey A questionnaire was developed and pre-tested for administration to a levels as randomly selected set of SRI and non-SRI farmers The structured questionnaire survey was mgs are implemented in JanuaryFebruary 2003 by the research team with the help of trained enumerators esults of rom one 21 Operational Dermition of SRI Adoption showed
In the present case SRI adopters (or SRI farmers) are those farmers who tried SRI at least once ilopment during the last five years (1998 to 2002) on whole or part of their paddy fields Thus the and the definition includes partial adopters and those farmers who have tried SRI and then abandoned it for the or disadopters Disadopters are those SRI adopters who have discontinued practicing or those nited to who have not practiced SRI during the last Yala and A-faha seasons The non-adopters (or NonshyIllentingmiddot SRI farmers) are those who have not practiced SRI during the above reference period6
SRI adoption intensity refers to the proportion of farmers total paddy fields allotted to the SRI practicering the
Lcticing
5 Comprehensive descriptions of the SRl practices were published in the JanuaryFebruary 2000 issue of Javaya a orts for newspaper published by the Ministry of Agriculture
6 Henceforth adopters and SRl farmers and Non-adopters and Non-SRl farmers are used interchangeably
333
- ~
(9- -t)
v Ql~ -~
~ J) 0
22 Sampling Design and Procedure
Two stage stratified random sampling design was used to select 120 farmers in total (ie 60 each from the two study locations and 30 each from SRI and Non-SRI farmers per location) The two study locations were purposively selected based on the prevalence of SRI farmers for which the sampling frame was solicited from Ministry of Agriculture office Colombo In Ratnapura (Kalthota Irrigation Scheme) according to the CEB there were 66 farmers practicing SRI According to a register of SRI farmers compiled by the Ministry of Agriculture 45 percent ofall practicing SRI farmers in the country were in Kurunegala district
23 Analytical Framework
The data generated at the household and field levels were subjected to descriptive analyses to characterize the sample farmers rice crop management practices Multivariate statistical analyses such as logit and tobit regression models were used to assess factors influencing the incidence and intensity of adoption and disadoption of SRI Enterprise budgeting technique was used to assess the economics of SRI vis avis conventional system of rice production in the two locations (Figure 1) for yala and maha seasons ofthe year 2002
3 DESCRJPTION OF THE STUDY AREAS
31 Kaltota Irrigation System Kaltota is situated in Ratnapura district and in the Balangoda sub-district The district is predominantly a Wet Zone district while southeastern parts of it fall within the intermediate and dry zones Agricultural activities in Ratnapura are mainly based on plantation crops and mixed home-gardens generating spices Kaltota irrigation system is a river diversion system in Walawe River one of the major rivers in the country The system irrigates 1000 ha of lowland through two conveyance channels situated in either side of the river The left bank irrigates 128 ha of paddy lands in three tracts while the right bank canal irrigates 728 ha situated in seven tracts one of which is the ancient settlement where farmers have large land holdings A majority of the command area is cultivated in both seasons Amount of water available at the system has reduced since the construction of a reservoir for electricity generation above the water diversion point of the system As Kaltota farmers were historical users of water their right to use water from the river is recognized by the power authorities Farmers are eligible for a special irrigation release calculated on the basis ofhistorical water use A leak from the reservoir also increases the amount of water available at the diversion However CEB wants to minimize the amount of water released for non-electricity generating uses as this result in revenue loss Hence programs to reduce the demand for irrigation releases were introduced to farmers SRI appeared to be a potential water saver so CEB took steps in promoting SRI among farmers in the irrigation system
32 Kurunegala district
Kurunegala district is situated in the northwestern part of Sri Lanka It is the third largest district in terms of land area About 75 percent of the area of the district falls within the Intermediate Zone while its northern part fall within the Dry Zone and southern part in the Wet Zone Coconut cultivation in plantations as well as in small-holdings and paddy cultivation under minor irrigation are characteristics of the district In the southernmost parts of the district ginger is
334
~
grown as an annual crop mainly in paddy lands Kurunegala is a major paddy-producing area in 60 each the country During 2000 to 2002 the district accounted on average for 106 percent of the fhe two national rough rice production The district has 12621 ha of major irrigation under 15 irrigation hich the schemes and 33804 ha under 4188 minor tanks and 657 minor river diversion schemes About ltnapura 29028 ha of paddy land are rainfed 19 SRI nt ofall The Ministry of SAMURDIll responsible for poverty alleviation took a special interest in
promoting SRI through farmer training programs These programs were more effective in Kurunegala district mainly due to its proximity to the Nature Farming Center a training and research center on ecological farming and initiative by one regional farmer federation to produce and distribute hand weeders an essential tool for practicing SRI lyses to
lIlalyses cidence used to ICations
trict is lte and mixed in the
)w1and es 128 1 tracts of the
Kluced lint of im the elease DOunt water ms to bea
stem
strict diate onut linor er is
335
~ - (9
-t) gtgt e -1i- v 0
nshy-(b~
0
N
A o PrinGipal City
o Study Location
~ Zone Boundary
orvzbullbullbull
Colombo WetZobullbull
o
20 milesFigure 1 Study Locations
Locations of Study in Rathnapura District
336
amp
))~ ~ v -0
(1 -shyIc
4 THE SPATIAL AND TEMPORAL DYNAMICS OF SRI ADOPTION IN SRI LANKA
41 Adoption trends
System of Rice Intensification has only five years of history in Sri Lanka Only one fanner has reported to have first time learned about SRI in 1998 The majority of the SRI sample fanners in Kurunegala have learned about it in the year 2000 SRI sample fanners from Kalthota lagged behind Kurunegala farmers by about 2 years in awareness Even though about 117 percent of the SRI sample farmers are aware of SRI during 199899 actual practice commenced first in Kurunegala in the year 2000 The temporal dynamics of SRI awareness among adopters and nonshyadopters are quite similar (see Figures 2 and 3)
25 sect 20 ~
Cia 15 rJ 0 10 Q)
r
sect 5 Z 0
-----~---
--Kalthotar=~------krunegaj 1
Total
1998 1999 2000 2001 2002
Year
Figure 2 Year the fanners first learned about SRI
30 ----~--~~~--~
~
sect 25 ~ 20middot Kalthota~ r 0 15 Kurunegalar
10 Total0 ltU
8 5 ~
0
1999 2000 2001 2002
Year
Figure 3 Year ofawareness of SRI fanners
The non-SRI sample farmers who were aware of SRI but have not shown interest to practice it were asked why they do not intend to practice The response or reasons they gave are summarized in Table 1 Consistent with the practicing farmers observations the non-SRI farmers reported that the major obstacle to SRI adoption is the high labor demand and the tedious nature of the associated management practices such as transplanting and manual weeding
337
))~ 6)
-J 0 (~ shy-- (
~
Table 1 Reasons for unfavorable attitude of Non SRI farmers towards SRI Reasons Locations ()
Kalthota Kurunegala Total Requires more labor and effort 682 381 535 Climate is not good for SRI cultivations 45 00 23 Lack of necessary inputs 45 48 47 Water shortage and lack of suitable field 48136 93 Land tenure problem 45 00 23 Difficulties ofgetting organic fertilizer 45 00 23 Difficult to do management practices 00 238 116 No benefit 00 95 47 Field is located very far from home 00 48 23 Other SRI farmers failed 00 95 47 Lack of proper training 00 48 23 N 22 21 43
42 Farmers Perceptions of the Merits and Demerits of SRI
The advantages and disadvantages of SRI were elicited from the practicing farmers and the results are summarized in Tables 2 and 3 The most significant merits of SRI as compared to conventional system are (1) improved quantity and quality of paddy yield (2) savings in irrigation water and seed (3) reduced demand for external cash inputs like inorganic fertilizers and herbicides and (4) enhanced tolerance to biotic (eg diseases and insects) and abiotic stresses (eg lodging and low moisture stress) These views are quite consistent with the findings reported based on on-station and on-farm experimentation with SRI in some Asian African and Latin American countries
Table 2 Advantages of SRI relative to Conventional-farmers assessment No Criteria Percentreportin~yes N 1 More yield 830 53 2 Saves water 897 58 3 Saves seed 1000 60 4 More milling output 774 53 5 Less disease and pest attack 881 59 6 Less lodging of rice 914 58 7 Reduced demand for herbicide 911 60 8 Reduced demand for inorganic fertilizer 862 58 9 Less labor for harvesting 796 54 10 Less labor for trans~lanti~ 780 59 11 More tillers 983 59 12 Improves seed quality 909 55 13 Reduces input costs 850 60 14 Less labor for bund cleaning and construction 763 59 15 Environment friendlY 50 60
338
~ ~ ~~ -
(9
0 0 (
---- 11
---
Table 3 Disadvantages of SRI relative to conventional-farmers assessment No Criteria Percent respondin2 yes N 1 Weed control problem 60600 2 Transplanting is difficult 367 60 3 60SRI transplanting requires special skill 250 4 Requires skilled labor for management 317 60 5 Demand more labor input 500 60 6 60Requires additional workdays 650 7 59Requires more effort 746 8 57Organic matter not available 579 9 57Transporting organic matter is problematic 509
6010 Problems ofMW handling and availability 767 6011 Mice attack due to unclean bunds 17 5812 SRI requires well drained soils 690
13 559 59Does not work on flooded fields
The most important demerits of SRI relate to its extremely high demand for labor problems of weed control and organic matter availability 77 percent of the practicing farmers complain that the the rotary weeder recommended for use in the SRI system is not readily available and even ifIto available not easy to handle im
rers sses
S FACTORS INFLUENCING ADOPTION AND DISADOPTIONngs and
Sl Determinants of SRI Adoption
The two most popular functional forms used for dichotomous discrete choice adoption models are the logit and the prohit models The advantage of these models is that the probabilities are bounded between 0 and 1 The logit model is selected here The odds of SRI adoption are defmed as the ratio of the probability of adoption (pi) to the probability of non-adoption (I-Pi)
Specifically the model is
The Xs are the hypothesised explanatory variables as defined in table 4 The variables hypothesized to influence adoption of SRI were derived from own informal assessment and literature reviews (Moser and Barrett 2002 McHugh et aI 2002) Since these variables are unlikely to operate independently a variable-by-variable analysis of relationships with farmers adoption of SRI is likely to be misleading (Feder et aI 1985) Hence logit analysis which uses a number of independent variables has been used to predict the probability offarmers SRI adoption
339
e~ p~ -
amp
0v (1shyA
--
ized to influence the
POVGR(X12)
LOCFA(X13)
LABAV(XI4)
The logistic regression model fitted to analyze the effect of these variables on the adoption decisions offarmers is presented in the table 5 Dependency ratio (DEPRA) age of the household head (AGEHH) and proportion of annual income from non-farm activities (PRNIN) reduces the likelihood of a farmer being SRI adopter By contrast family size (F AMIS) years of schooling (YSCHH) and participation in agricultural training programs (NFTPA) significantly increase the probability of a farmer being SRI adopter For instance as the family size of the farmer increases by a unit the likelihood of being SRI farmer increases by 145 times (see the exp (8) for variable F AMIS) The proportion of children between 7 and 14 increases the likelihood of SRI adoptioIl This is consistent with our field observation-- children were actively participating in the transplanting of SRI fields 9 Moreover studies in other countries showed that women and
7 Five organizations were identified and farmers were asked to confum whether they are ordinary members or leaders of these organizations in the past and at present Thus each farmer can score a minimum of zero (meaning not a member of any organization in the past and at present) and a maximum of 20 (meaning the farmer is a member and flays leadership role in all organizations in the past and at present ie 5x2x2)
This index was constructed from a set of questions designed to elicit farmers opinion regarding labor supply in his or her village or community 9 Whether this may be considered as a possible negative social effect of SRl or not depends on the situation of the without SRl scenario regarding children and women participation in the labor force in any particular locality
340
childre (Rena
Locatic irrigatt Thesemiddot that the Whyal the ob~ differel soil dl toleran availab investn which enhanc additio soil an the cha abunda family
Themlt irrigati4 middle mayse import maybe along t ends ~ certain succes water I field d
AnOthl buffalc signifi
~ gtl P~ -
amp
0J M
children are particularly suited for handling the transplanting of small and delicate rice seedlings (Rena Pervez 2002)
Location of the farm along the irrigation canal and generally the type of farming system (ie irrigated or rainfed farming system) had remarkable influence on the adoption pattern of SRI These important patterns are revealed by the variables LOCFA and FYLWS The model showed that the probability of adoption of SRI among irrigated farms is lower than that of rainfed farms Why are rainfed farmers more likely to adopt SRI than irrigated farmers This might be due to (1) the observed production risk differential among the two types of farming systems (2) the wage difference between rainfed and irrigated areas and (3) Increased water holding capacity of the soil due to improvement in organic matter content and hence enhanced low moisture stress tolerance of the rice crop The rainfed rice farming faces risk and uncertainty regarding the availability and distribution of rainfall Therefore rainfed paddy fanners are cautious about investments in cash inputs such as fertilizer herbicides and pesticides Hence for them SRI which decreases the demand for high-risk cash inputs is an ideal alternative rice productivityshyenhancing strategy Moreover as elaborated in the section 51 of this paper SRI involves the addition of huge amount of organic fertilizer which improves the water-holding capacity of the soil and hence easing the risk of low-moisture stress On the other hand high labor input forms the characteristic feature of SRI practice thereby making it attractive in those areas were there is abundant labor with relative lower wages The positive sign of labor availability (LABAV) and family size (FAMIS) variables further corroborates this argument
on )ld he ng he es lie
The model shows that there is no significant difference between farmers located at the head of the irrigation canal and rain-fed farmers regarding SRI adoption But the probability of adoption of middle and tail farmers is sign~ficantly lower than that for rainfed farmers At the first glance this may seem to contradict the widely held view that SRI saves water But this finding underlines the importance of irrigation water supply uncertainty In the advent of supply uncertainty farmers may be reluctant not to flood their paddy fields when water is available Why are farmers located along the head of the canal more likely to adopt SRI than those situated in the middle and tail ends This may be due to the fact that at least for irrigated farmers there must be some degree of certainty regarding the availability of irrigation water (or control over water supply) for successful adoption of SRI (McHugh et aI 2002) Farmers at the middle and the tail maintain a water layer on their fields as buffer in case irrigation water arrive at large intervals Keeping the field drained is very risky if they have no control over water
Another important variable having almost significant positive impact on SRI adoption is cattle or buffalo ownership through its effect on manure availability The model also shows that there is no significant difference in SRI adoption between poor and rich farmers
or ot ld
341
~ -a-
--
Table 5 Detenninants ofSRI adoption -Results oflogit regression analysis Variable Code B SE Exo(8
CONSTANT -23134 29217 -Dependency Ratio (DEPRA) -00454 00277 0955 Proportion ofChildren in the Family(PCIDL) 00462 00285 1047 Family Size (FAMIS) I 03095 01791 1362 Age ofthe Household Head (AGEHH) -00509 00359 0950 Years ofSchooling of the Household HeadjYSCHH) 01645 00861 1178 Number of Training Programs Attended (NFTPA) Number ofExtension Contact7NEXCY)
~~----
01760 00343
00901 05146 ~~i
Proprotion ofIncome from Rice (PRICEj 00048 00117 1004 Proportion ofNon-fann Income (pRNlN) -00039 00124 0996 Incidence ofYield Loss due to Low Water Stress (FYLWS) 00575 01509 1059 An Index of Social amp Political Capital (POSOLl 00327 00821 1033 Poverty Group (poor) 00464 06746 1047 Poverty Group (Middle) -11770 06857 0308 Povert Group (Rich)-reference cateSory Location of the Fann or Field (Head) -02209 09935 0801 Location ofthe Fann or Field (Middle) -15452 09161 0213 I Location ofthe Fann or Field (Tail) -19079 09309 0l48 Location ofthe Fann or Field (Rain fed J-reference category An Index ofLabour Availability Perception (LABA V) 01334 01438 1142 Number of Cattle Owned (CATTL) 05139 I 03380 1671 Notes significant at 10 probability level significant at 5probability level -2 Log Likelihood 10898 Model Chi-square = 46284 (df= 18p=00003) Cox and Snell Rl=038511
Nagelkerke K=0513 Percent correctly predicted = 7679 N=112
S2 Intensity of Adoption of SRI
The intensity of adoption once the fanner has decided to practice SRI was evaluated using the proPQrtion of SRI area in the total paddy cultivated during maha and yala seasons and the proportion of fanners who allotted 100 percent of their paddy field to SRI These are shown in figures 4 and 5 The proportion of paddy area allotted to SRI ranges from about 39 percent in Kalthota to about 61 percent in Kurunegala during Yala season Some fanners have also allotted their total rice field to SRI The proportion of such fanners ranges from as low as 10 percent in Kalthota to as high as 50 percent in Kurunegala (see figure 5) The proportion of SRI farmers with 100 percent of their paddy fields SRI is higher during Yaa than during Maha in Kurunegala
II In OLS models the R2 statistic represents the proportion of variability in the dependent variable that can be explained by the independent variables For logit regression model an easily interpretable measure of the strength of the relationship between the dependent variable and the independent variables is not available Cox and SneD and Nagelkerke Rl are attempts to imitate the interpretation ofR2 in OLS regression They are attempts to measure strength of associations
342
~ shyo-
---
Exp(B ~17 -77 0955 85 1047 91 1362 59 0950 61 1178 01 1192 6 1034 17 1004 ~4 0996 9 1059 1 1033 6 1047 7 0308
5 0801 I 0213 ~ 0148
~ 1142 ) 1671
ISing the and the hown in rcent in allotted rcent in fanners negala
gth of and
This is in line with the presumption that Yala season is more water scarce than Maha season and one of the advantages of SRI is to save water as has been elaborated in the previous sections
70
60
ttl 50
~ 40 ~
~ 30
~ 20
10
0
jYala I l__ M~
Kalthota Kurunegala
Locations
Figure 4 Proportion ofRice area allotted to SRI in 2002
it 60 T-~--~-------------- rJ)
~
8 50
~ 40 +
~ 30
~ E 20 f it 10 rJ)
f 0
Kalthota Kurunegala
Locations
Figure 5 Proportion of SRI fanners who allotted 100 percent of paddy area to SRI in 2002
In the previous section detenninants of SRI adoption decision were assessed However the extent or intensity of adoption once the adoption decision is made is important infonnation for research extension and policy This issue was evaluated using tobit regression model which allows the estimation of the likelihood ofadoption as well as the extent or intensity of adoption It is preferable to logit adoption model when the decision to adopt also involves simultaneously a choice regarding the intensity of adoption as it does with SRI practice The model can be specified as
where Yi is a latent variable representing the use of the SRI X is a vector of independent variables described in table 4 13 is a vector of unknown parameters and Ei is a disturbance
343
~ -oshy
assumed to be independently and normally distributed with zero mean and constant variance~ and i = ]2 n (n is the number of sample households)
Denoting yi (the proportion of SRI area in the total cultivated rice area) as the observed dependent (censored) variable
The proportion of paddy area allotted to SRI was regressed against various factors hypothesized to influence SRI adoption A common mistake made when interpreting tobit coefficients is to treat them as effects of the independent variable for cases above the limit To avoid this drawback the tobit coefficients were decomposed following McDonald and Moffitt (1980) and the results are presented in table 6
1n the incidence of adoption model (ie logit model) discussed in the previous section informational variables such as participation in training program and extension contact poverty status location of the farm the farming system (ie irrigated vs rainfed farming) and level of education were important variables in predicting SRI adoption 1n the tobit model which estimates both the incidence and intensity of adoption the informational variables have lost their explanatory power 1nstead variables related to labor availability (DEPRA and PCHlL) and organic matter availability (CATTL) are more relevant
Table 6 also shows the decomposition of the total elasticity of the variables12 The decomposition
consists of two components the probability of adopting in the first place and the potential increase in the area allotted to SRI once the decision to adopt has been made For example the total elasticity value for the years of schooling (YSCHH) is 0974 meaning that a 10 percent increase in the years of schooling is expected to result in about 97 percent in adoption and use intensity of the SRI practice The probability of adoption will increase by 73 percent while the intensity of adoption will increase by 24 percent The other variables in the table can be interpreted in an analogous manner
12 An elasticity of adoption measures the responsiveness to a particular variable and is equal to the relative change in adoption of a technology with respect to a small relative change in a given variable from current levels The elasticities obtained from the tobit model take into account that a change in the explanatory variable will simultaneously affect the number of SRI adopters and the proportion of acreage under SRI
344
~ shyo--
---
~e and
Table ~ The det~rminants ofthe extent or intensity of adoption of SRI- results of probit
endent tshynt
~sized is to
back lsults
tion verty elof rhich their and
tion 53 Determinants of SRI Disadoption ltial
the Disadoption is one important aspect which have not been given due consideration in past ent adoption research Information on the reasons why certain group of farmers failed to stick to the use technology recommended for use is of crucial importance for researchers extension workers and the policy makers For instance research may draw upon the drawbacks of the technology and be improve upon those drawbacks to increase the chance of acceptability and wider dissemination of
the technology among the intended beneficiaries
In light of this fact a logit model was fitted to the data on SRI farmers Most of the variables in the SRI adoption modeling of section 51 were also included here The additional variables incorporated in the current model are (1) An index of positive perception of farmers towards SRI (POSIP) constructed based on the
reported advantages of SRI vis-a-vis the conventional system of rice production presented in table 2 The value of the variable ranges from 0 to 15 where 0 indicates lowest positive attitude of the SRI practitioners towards SRI and 15 shows the strongest positive attitude towards SRI This variable is expected to have a negative relationship with disadoption since those farmers who had positive attitude towards SRI are expected to continue with SRI
(2) An index of negative perception of farmers towards SRI (NEGAP) constructed based on the reported disadvantages of SRI vis-a-vis conventional system of rice production presented in table 3 The value of the variable ranges from 0 to 13 where 0 indicates lowest negative attitude of the SRI practitioners towards SRI and 13 shows the strongest negative attitude
345
gt)~ 6)
-0~
~ 0 rt
towards SRI This variable is expected to have a positive relationship with disadoption since those fanners who had a negative attitude towards SRI are expected to cease practicing SRI
(3) Average realized SRI yield (kgacre) for SRI farmers while they were practicing We expect that those farmers who had better paddy yield during their first season(s) of experimenting with SRI will continue with SRI Contrarily a low level of realized yield would lead to dis adoption
(4) The other important variable is the perception of farmers regarding the cost of capital or availability of cash (CASHR) This variable is particularly important in the sense that one of the cases for promoting SRI is due to its lesser reliance on external inputs hence lesser requirement for cash or capital The value for this variable ranges from 1 to 5 where 1 indicates severe cash constraint and 5 indicates the absence of cash constraint We expect this variable to have positive relationship with disadoption
T bl 7 Da e etermmants 0 Isa optIon 0 fSRIR- esu ts 0 I fl Oglt regressIon analysIs Variable p INTERCEPT 5935 An Index of Degree ofPositive Perception (pOSIP) -0262 An Index ofDegree ofNegative Perception (NEGAP) 0064 Average Realized Yield (AVERY) -0002 Episodes ofRice Yield Loss due to Water Stress (FRRYL) 0310 Labor Availability (LABA V) -0424 Proportion of Children in the Family (PCIDL) -0032 Poverty Group (poor) -3021 Poverty Group (Middle) -2504 Number ofExtension Contact (NEXCY) -0314 Dependency Ratio (DEPRA) 0052 Years ofSchooling of the Household Head (YSCHH) -0065 Proprotion of Income from Rice (PRICE) -0016 An Index ofLabor Availability Perception (CASHR) 0766 Note means the coefficIent IS slgmficant at 5 slgnrficance level -2 Log likelihood = 3743 Cox and Snell R2 = 048 Nagelkerke k = 066 Percent correctly predicted = 867
SE 5565 0300 0231 0001 0451 0312 0062 1505 1618 0215 0057 0187 0020 0591
exp(p) 377943
0769 1066 0998 1364 0655 0968 0049 0082 0730 1053 0937 0985 2151
All of the variables included in the disadoption model had the expected signs (table 7) However only average realized yield during the first season(s) of practicing SRI (AVERY) and poverty status (POYGR) variables had statistically significant effect on disadoption Hence the success or failure of farmers during initial adoption process determines the acceptance and the pace of dissemination of a technology In the adoption model (table 5) there is no significant difference in the probability of adoption of SRI between poor and rich farmers However the probability of disadoption among poor farmers is significantly lower than that among rich farmers This implies that once the poor farmers adopt SRI they have higher probability of continuing with it than rich farmers
346
~ shyo -
---
I since SRI
r y r f
f
Among the perception variables farmers perceived cash availability (CASHR) labor availability (LABAV) frequency of rice yield loss due to water shortage (FRRYL) and an index of farmers positive attitude towards SRI (POSID) respectively had strong coefficients However these were not statistically significant
6 THE MICROECONOMICS OF SRI
61 Rice agronomy and irrigation water management
Fanners agronomic practices level of cash input utilization and irrigation water management differentiated by system of production (SRI vs conventional) and seasons (wet-maha and dryshyyala) are shown in table 8 Expectedly there is substantial difference between the two systems of rice production regarding planting method fertility management and weed control practices For instance an average SRI-farmer transplants one 8-days-old rice seedling per hill on a square grid of about 23 by 23 cm While most conventional fields were planted by way of broadcasting few conventional farmers have practiced transplanting However the SRI transplanting differs from the conventional transplanting in many ways The conventional farmers planted on average four IS-days-old rice seedlings in a clump per hill on a square grid of 15 by 15 cm which is narrower than that for SRI
Concerning soil fertility management significant differences are noted between the two systems Generally SRI farmers used lesser doses of inorganic and higher doses of organic fertilizer per unit area as compared to conventional farmers Moreover a considerable number of SRI farmers abandoned altogether the use of inorganic fertilizers instead they put a lot of organic fertilizers The main sources of organic fertilizers include cow dung tree leaves straw poultry manure compost and rice bran
Weed control method is another important aspect differentiating the two systems of production SRI farmers use herbicides rarely instead they make use of a mechanical weeder andor hand weeding The conventional farmers rely heavily on herbicides and they flood their paddy fields with water as a means of weed control It is important to flood the field at the correct stage
One of the main advantages of SRI is its water saving with little or no reductions in the paddy yield (Thiyagarajan et aI 2002) We attempted to have an indirect and rough idea of the magnitude of on-farm or field-level water savings through farmer estimates of number of irrigation and hours of irrigation per unit area13
On average number of irrigations and hours of irrigation per unit area of SRI-fields are respectively about 24 percent and 23 percent lesser than the conventional paddy fields However the difference between SRI and conventional regarding hours of irrigation is not statistically significant Consistent to our a priori expectations the per hectare hours of irrigation (for both SRI and Conventional fields) during yala season is greater
13 F arrners were asked the number of irrigation done for each rice field they owned during Yala and Aaha seasons Moreover they were asked to give approximate hours elapsed during successive irrigation Then the number of irrigations was multiplied by the hours elapsed and divided by the area of the field to give an estimate of hours of irrigation per unit area We admit that for more conclusive results an exact field-level measurement needs to be done preferably for a number offarrners
347
~~ 6)
a - ) v 0 rrshy-
than that of Maha season This is because Yala season is relatively water scarce as compared to Maha season (see figure 7)
4~~----------------------------~
400 3~
~ 300 2~ ~ 200
~ l~ 100 ~
o
~ ~ ~ ~ ~ sect ~ g ~ ~ ~ ~ Mon1hs
~-WbTZa] bull DRY ZONE --shy
Figure 7Monthly rain fall distribution for the Dry and Wet Zones of Sri Lanka (1961-1990)
Table 8 also clearly indicates that generally SRI fields demand higher amount of human labor (about 3 times more) This arises from planting (about 37 man-days per ha) weeding (about 31 man-days per hal bund construction and cleaning (about 41 man-days per hal and organic fertilizer collection and transportation (126 man days per hal The corresponding figures for conventional fields are 8l man-days for planting (broadcasting) 16 man-days for weeding 114 man-days for bund construction and cleaning and 73 man-days per ha for organic matter collection and transportation The amount of bund construction and cleaning labor for SRI is significantly lower than that for conventional fields This is because the SRI farmers were advised not to clean bunds in order to harbor beneficial organisms as an integrated pest management strategy
348
g l
()
g e 8t ~ e pound VI bullell oJ
1 1
0
~ ~ shy--sect bull
~ ))
=~ --(9
0 (~
- ----
shybl
~
(
(0
til
0
~1
0 c
P
~
II g
~ t
amp
e w
g K
G
_ _
I
n~
_
I
8
Tab
le 8
In
T
b -
f
d [~-~
Pra
ctic
es o
r In
puts
SR
I C
onve
ntio
nal
Yal
a M
aha
Yal
a
~and
M
ean
SD
N
Mea
n SD
N
M
ean
SD
N
Mea
n T
ract
or h
ours
per
ha
26
232
32
24
18
7
32
28
183
12
9 28
pr
epar
atio
n B
ullo
ck h
ours
per
ha
24
438
32
17
35
0
32
19
475
12
9 17
P
lant
ing
Tra
nspl
anti
ng h
ours
per
ha
244
152
32
352
262
32
114
144
37
271
Bro
adca
stin
g ho
urs
per h
a
-
--
-67
8
420
8
7
63
Nw
nber
ofs
eedl
ings
per
hill
1
1 0
3 32
1
4 0
7 32
4
0 1
2 35
3
7 A
ge o
fsee
dlin
gs in
day
s 7
6 1
9 32
8
4 2
7 32
18
3
5 3
8
185
S
paci
ng b
etw
een
plan
ts in
inch
es
95
13
31
94
13
32
59
15
19
59
Spa
cing
bet
wee
n ro
ws
in i
nche
s 9
7 1
2 32
9
6 1
1 32
6
0 1
6 19
6
2 S
eed
rate
kg
per h
a 14
10
0
32
17
12
32
117
38
11
2 11
4 F
erti
liza
tion
U
reap
erh
a 77
73
0
32
78
804
32
14
1 86
2
128
133
(Ino
rgan
ic)
TD
Mk
g p
erh
a 76
13
05
32
516
78
2
32
97
800
12
8 96
N
PK
kg
per
ha
57
105
6 32
45
74
1
32
104
718
12
8 10
0 T
SP
kg
per
ha
-
-
-
13
120
8 12
8 4
f ~~~
MO
P k
g pe
r ha
--
--
--
03
33
I 12
8 0
5 F
erti
liza
tion
C
ow d
ung
in k
g p
er h
a 20
24
3066
32
14
22
2541
32
15
3 61
78
129
152
(Org
anic
) T
ree
leav
es in
kg
per h
a 10
13
1443
32
73
3 25
133
32
24
7 16
200
129
131
Str
aw i
n kg
per
ha
951
1900
4
32
261
799
0 3
2
170
706
4 12
9 28
7 P
oult
ry m
anur
e in
kg
per h
a 73
25
85
32
39
149
6 32
31
34
95
128
75
Com
post
in k
g pe
r ha
62
349
5 32
23
13
1 3
2
--
--
Ric
e br
an i
n kg
per
ha
23
945
32
8
437
32
-
--
Wee
ding
H
erbi
cide
s li
ter
per
ha
015
0
87
32
008
0
31
32
2
29
325
12
9 2
14
Hou
rs o
fMec
hani
cal
Wee
ding
per
ha
283
281
32
213
260
32
3
233
12
7 2
Han
d W
eedi
ng H
ours
per
ha
69
934
32
57
90
6
32
4
217
12
9 15
H
ours
ofb
un
d c
onst
ruct
ion
and
clea
ning
per
ha
28
48
0
32
38
51
32
8
8
862
12
9 94
Ir
riga
tion
M
ean
Num
ber o
fIrr
igat
ion
24
179
24
22
17
2
25
32
259
10
3 29
H
ours
of i
rrig
atio
n pe
r ha
1942
24
25
21
1720
21
16
23
25
89
40
38
97
2154
H
arve
stin
g P
er h
a ho
urs
ofh
arve
stin
g 32
8 26
62
31
326
376
7 13
35
5 25
46
I 11
5 26
5
Mah
a SD
18
9
380
18
10
444
0
9 3
9 1
3 1
5 38
0
815
75
6
749
19
9
43
594
2 51
02
1022
6
659
8
~~
-3
07
175
0 54
3
100
3 25
8
2993
18
17
N1 (
145
145
38
106
i~
38
23
23
132
147
147
147
147
147
14
5 I
145
I
143
I
145
-- 144
145
145
144
III
103
84
lJ
j
0 14
N r
efer
s to
the
num
ber
off
ield
s S
ince
mos
t oft
he f
arm
ers
had
mor
e th
an o
ne c
onve
ntio
nal r
ice
fiel
ds t
he n
umbe
r ofs
ampl
e ho
useh
olds
and
the
num
ber o
f fi
elds
may
var
y A
ll o
fthe
SR
I fa
rmer
s ha
d on
ly o
ne S
RI
field
M
oreo
ver
not
all
oft
he o
rigi
na16
0 S
RI
sam
ple
farm
ers
had
prac
tice
d S
RI
duri
ng 2
002
---
62 Yield Comparisons
The mean paddy yields obtained during the last three years differentiated by the system of production and seasons are listed in table 9 The mean SRI yield even though not as dmmatic as figures reported from many sources is about 44 percent more than that for the conventional method (F value = 474 P=0031) The reported conventional yields are well within the range of figures estimated by Sri Lanka Department of Census and Statistics The Departments estimate of paddy yields for the country lies between 25 and 41 t per hectare depending on the type of farming system (ie rainfed or irrigated rice farming) and the type of irrigation scheme (Kikuchi et aI 2002)
SRI is fertili~
contin fertili2 the co Interes or con and UI respon trend)
T bl e 9 Ri f management (Kgh) level d a ceyleIdsunder SRI and conventlOna system 0 a in the differel
Year Sri Conventional yield increase Yala Maha Mean Yala Maha Mean
2000 4097 6236 5488 3635 3644 3641 507 2001 5056 5327 5215 3516 3749 3633 435 2002 5737 5977 5811 4189 3832 4041 438 Mean 5299 5763 5524 3910 3757 3836 440
The set fertilizeuro the SUC4
However the yields reported in table 9 above conceal the effects of location and adoption15status The highest paddy yield (81 t ha) was recorded for SRI in Kalthota area during Maha
season for adopter group while the lowest (21 tha) was recorded for dis adopters during Yala season in Kurunegala (Table 10) Generally disadopters experienced the lowest paddy yield during the first year of adoption forcing them to discontinue the SRI pmctice The disadoption model of Section 53 also corroborates this fact Location-wise the yields recorded for Kalthota area are significantly better than those recorded for Kurunegala farmers irrespective ofthe system of production From table 10 one can also infer that the prospect of harvesting better paddy yield is higher for the Maha season than the Yala season which is in line with the usual expectation
Table 10 Paddy yield per acre by adoption status season year and location (kgha Location Year SRI Conventional
Ado ters Disado ters Ado tefs Disadopters Yala Maha Yala Maha Yala Maha Yala Maha
Kurunegala 2000 5726 7217 2102 4668 3501 3063 3769 4372 -
2001 6011 5499 4100 4628 4040 3628 2942 3851 2002 5619 5977 NA NA 3071 3702 3863 3911 Mean 5785 6231 3101 4648 3537 3464 3524 4045
Kalthota 2000 NA NA NA NA NA NA NA NA 2001 NA 8154 NA NA 6795 NA NA NA 2002 5806 NA NA NA 4900 NA NA NA Mean 5806 8154 NA NA 5848 NA NA NA
NA means not applicable
15 The original SRI sample farmers who have not practiced SRI during Yaa or Maha seasons of the year 2002 are regarded as disadopters By these criteria 20 of the 60 SRI sample farmers are disadopters
350
differet1 the orgc ofnutril
Table 1 Inorga
o oto 100 100 to 2 200ampa
--ornrutn F value The in
Table 1 Inorga
0 otol0( 100 to 200amp Grand F valueuro The 11
~ shyo-
---
- --
SRI is usually considered as a practice that gives substantial yield without the use of inorganic fertilizer (Barison 2002) Despite the advice not to use inorganic fertilizer some farmers have
tic as continued to use it with varying intensities The SRI farmers level of utilization of inorganictional fertilizer has been arbitrarily classified into four strata starting with zero level of utilization and ge of the corresponding paddy yields recorded for each stratum are reported are shown in Table 11
Interestingly the SRI farmers who did not apply any form of inorganic fertilizer recorded better or comparable yields to those farmers who applied up to and above 200 kg of fertilizer in Yala and up to 200 kg during Maha Another important observation is that while the paddy yield response to the applied fertilizer levels has slowed (ie the marginal product has shown declining trend) during Yala the yield response to additional levels of fertilizer has not reached optimum level during Maha The reason for this remarkable response difference may be due to variations in the level of available water during the two seasons Therefore the two seasons might need different fertilizer recommendations
The scenario for conventional paddy fields is different in that the response to the applied levels of fertilizer has been linear ie zero-inorganic fertilizer fields gave on average lower yields than the successive levels of fertilization especially during maha season (table 12) The reason for this difference is due to the fact that on SRI fields the added inorganic fertilizer was supplementary to )tion the organic fertilizer while for conventional fields chemical fertilizer was mostly the main source (aha of nutrients
Yala rield
Table 11 Yield comparison by level of fertilizer application (kgha )-SRI farmers tion
Inorganic fertilizer (kgha) I Yalanota Mean SD Ntern
0 5792 2715 5ieJd oto 100 4851 92133n 100 to 200 5954 2350 3 200 amp above 6481 2755 13r----------------------shyGrand mean 5825 2506 30 F value 1741(p=0195)s
MahaMeanshy SD~N 4349 2460 2 4159 3279 4 5362 2202 2 9133 1977 4 6049 3218 12 __~~285 (p=003 5)
The morgamc fertilizers were UREA TSP NPK and MOP
2 Table 12 Yield comparison by level of fertilizer application (kgha) - conventional farmers
la
ii3----~---Inorganic fertilizer (kgac) Yala c------shy
Mean SD N _M~a~r~~~_ __~ 0 3970 1786 9 1821 1136 ~ oto 100 4153 3797 J 1615 301699 28 100 to 200 4384 I 1975 68 3805 j 1930 35
1020200 amp above 5052 2153 4449 i 1522 4409 1936 80Grand mean 125 3758 i 1786
2625 (P=0056)F value 1058 (p=0370) The morgamc fertlhzers mclude UREA TSP NPK and MOP
351
~ -o shy
63 Profitability Comparisons
The microeconomics of the two systems of rice production was assessed using budgeting technique 16 Net returns were estimated for each farmer using the relationships
NR=GR-TC
VC=L- PXI I
TC=VC+F GR=RYRP
Where NR= Net Returns GR= Gross Returns VC= Variable Cost RY= Rice yield for SRI and conventional system RP= Rice price Pi =per unit price of the ith input and Xi= quantity of the ith input F is fixed cost and TC is total cost
The individual budgets prepared for each and every sample farmers differentiated by system of production and seasons (ie SRI and conventional) were averaged to facilitate easy comparisons (see table 13) Moreover the budgets were prepared under three wage-rate scenarios ie zero wage rate or family labor on-going farm wage rate and non-farm wage rate It is interesting to note that contrary to the survey farmers own subjective assessment and reports from different angles the cost of production per unit area for SRI is higher or at least comparable to that of conventional rice production17
Even though SRI reduces or avoids the use of cash inputs such as fertilizer and herbicides the resulting savings can not fully compensate for the additional costs born due to greater labor input for weeding transplanting and organic matter collection and transporting However the costs per unit of paddy output (Rupees per Kilogram) are lower than those of conventional due to significant increases in yield Consequently the estimated profit figures for SRI is almost double that of conventional practice for both seasons But it may be noted that this level ofprofitability is achieved with a lot ofdrudgery
In addition to the reported positive profitability figures table 13 also shows that some farmers experienced loss during both seasons This shows the advantage of budgeting for each farm than for average farm Two inferences may be made First the incidence of loss is higher for Yaa than for Maha season Secondly the incidence of loss among SRI farmers is substantially lower than that for conventional farms irrespective of the season
In Sri Lanka it is usually claimed that the competitiveness of rice sector has been worsen by the relative high wage rate Careful scrutiny of the costs and revenues of paddy production systems under three wage rate regimes presented in the table 13 tempts us to believe this claim
16 Entetprise budgeting technique was preferred to Partial Budgeting because SRI involves a major overhaul of the conventional rice production system Had the changes in the production system been minor partial budgeting would have been the natural choice according to C IMMYT (1988) 17 The costs include both cash and imputed labor and material costs
352
~ shy o-
enterprise following
)r SRI and
system of mparisons ie zero resting to ~ different
that of such as
costs and
than profit
may be
Table 13 Summary Results of the Enterprise budgets IProduction Seasonmiddot Wage rate Gross Total cost Net Costlkg Inciden bull system Revenue (RS) (RS) Revenue (RS) ce of
(Rs) loss SRI Yala Zero 34899 6506 29371 36 1
farm 34899 18907 15992 111 4 Non-farm 34899 24842 10223 150 6
Maha Zero 36720 5291 34575 22 0 farm 36720 20435 16285 87 1 Non-farm 37620 26493 13374 114 2
--_
Conventional Yala Zero 27017 10742 16032 76 9 farm 27017 18600 8417 133 27 Non-farm 27017 22248 4215 15s 29
i Maha Zero 23871 9503 14373 68 0 farm 23871 16381 7490 119 15
I Non-farm 23871 19687 4369 140 22
7 CONCLUSIONS AND IMPLICATIONS
1 The main advantages of SRI include yield increase reduced number of irrigations or irrigation-hours per irrigation and per unit area (ie increase in water productivity) reduced demand for cash inputs improved seed quality and higher milling ratio In addition to these private benefits SRI embodies added societal or environmental benefits due to reductions in the use of environment-unfriendly inputs such as herbicides and fertilizers It is not clear however if the observed on-farm water productivity can be translated into net water-saving at watershed or basin level which is an issue requiring further analyses This can be realized only if the practice is widely adopted and the farmers do not increase acreage
2 The System ofRice Intensification has a short history in Sri Lanka Its adoption process is dynamic in the sense that the adopters may quit the practice for some time and then reuse it when the circumstances allow This is because the practice involves little capital investment during initial adoption decision
3 The main variables influencing the incidence of SRI adoption are (i) location of the farm (ii) the type of farming system (ie irrigated Vs rain-fed farming) (iii) poverty status of the farmer (iv) participation in training programs (v) education status and (vi) the size and demographic structure of the farm family
4 The absence of significant difference in SRI adoption probability between farmers located at the head of irrigation canal and rain-fed farmers and the observed lower probability of SRI adoption among those located at the middle and tail end of irrigation canal underlines the importance of irrigation water supply risk and uncertainty variable in SRI adoption decision Hence contrary to the ideal SRI practice farmers at the middle and tail maintain a water layer on their field as a buffer to offset the risk of irregularity regarding irrigation water arrival This may also be done to reduce weed growth On the other hand the total dependence on rain for paddy cultivation means that the farmers are more cautious in
353
~ -o
investing in conventional yield enhancing cash inputs Therefore SRI which minimizes or avoids the use of such inputs is the logical alternative for rain-fed farmers
Barisshy5 SRI adopters mai nly come from the lowest and the highest poverty terciles of the farming convc
population In other words there is no significant difference in SRI adoption probability (http1between rich and poor farmers But poor farmers are likely to persist with SRI once they practice SRI than the rich farmers Moreover low realized yield during the first Barkeexperiment with SRI is the major factor behind discontinuing the SRI practice Proce
6 The main variables affecting the intensity of adoption of SRI are cattle ownership which Sri Lais a proxy for organic mater availability education status and the size and demographic structure of the farm family Batuv
7 The main problems associated with SRI practice are the demand for skills and high Norm amount of labor for weed control and transplanting non-availability of organic manure ofamiand limited availability of the rotary weeders (ht1JtL
8 The most appropriate domain (target group) for SRI adoption are those farmers a With limited land holdings
Bonlishyb Having bigger family size with high proportion of the family members capable of (htRL
engaging in work c Who are cash constrained d For whom rice constitutes the lions share ofannual income and consumption C~
e With limited alternative employment opportunities manw yTrigf With relative certainty regarding irrigation water supply and
g Practicing rainfed paddy cultivation 9 Generally SRI demands higher amounts labor per unit area (a lot of drudgery is involved) Feder
and induces the active participation of children between 7 and 14 years ofage and women Coun1 However whether this is a significant social disutility is a matter for further scrutiny
Javay issue
Kikuc produ BHaJ ~edil 2001
McDI staas
354
~ -o
lzes or REFERENCES
~rming Barison J (2002) Evaluation of nutrient up take and nutrient use efficiency of SRI and conventional rice cultivation methods in Madagascar ability (httpciifad comelleduSRIlproc 1 ISRI-32pdf) e they
~ first Barker R R Loeve Y H Li and T P Tuong (eds) (2001) Water Saving Irrigation for rice Proceedings of an lnternational Workshop held in Wuhan China 23-25 March 2001 Colombo which Sri Lanka lnternational Water Management lnstitute raphic
Batuwitage GP (2002) Adaptations of the system of rice intensification in Sri Lanka In high Norman Uphoff et al (eds) 2002 Assessment of the system of rice intensification Proceedings anure of and international conference held in Sanya China April 1-4 2002 (httpciifadcomelleduSRJlSRI-Assessmentspdf
Bonlieu F (1999) Summary offindings from thesis research on SRI )Ie of (httpciifad cornell edusribonlieu pdf)
I CIMMYT (1988) From agronomic data to farmer recommendations an economics trammg manual Completely revised edition Mexico City Centro lnternacional de Mejoramiento de Maiz y Trigo (CIMMYT)
ved) Feder G RE Just and DZilberman (1982) Adoption of Agricultural Innovation in Developing
men Countries A survey World Bank Staff Working Papers Number 542
Javaya (Newspaper Published by Sri Lanka Ministry ofAgriculture) JanuaryFebruary 2000 Issue
Kikuchi M R Barker MSamad and P Welingamage (2002) Comparative advantage of rice production in Sri Lanka with special reference to irrigation costs Sombilla M MHossain BHardy (eds) Development in the rice economy Proceedings of the international workshop on medium-and -long term prospects of rice supply and demand in the 21 st Century 3-5 December 2001 Los Banos Philippines International Rice Research Institute 436p
McDonald JF and R A Mofitt (1980) The use of tobit analysis Review ofeconomics and statistics Volume 62 (2) pp318-321
McHugh OV TS Steenhuis J Barison ECM Fernandez and NT Uphoff (2002) Farmer implementation of alternate wet and dry and non-flooded irrigation practices in the system of rice intensification In Water-Wise rice production Bourn BMA HB Hardy PS Bindraban T P Tuong and J K Ladha (eds) Proceedings of the International Workshop on Water-Wise Rice Production 8-11 April Los Banos Philippines lnternational Rice Research Institute
Moser CM and CB Barrett (2002) The system of rice intensification in practice Explaining low farmer adoption and high disadoption in Madagascarln Water-Wise rice production Bourn BMA H B Hardy PS Bindraban T PTuong and JK Ladha (eds) Proceedings of the
355
~ shy Q
International Workshop on Water-Wise Rice Production 8-11 April Los Banos Philippines International Rice Research Institute
Norman Uphoff et al (eds) (2002) Assessment of the system of rice intensification Proceedings ofan international conference held in Sanya China April 1-4 2002 (httpciifadcomelleduSRIISRI-Assessmentspdf)
Rena Perez (2002) Experience in Cuba with the system of rice intensification Norman Uphoff et al (eds)2002 Assessment of the system of rice intensification Proceedings ofan international conference held in Sanya China April 1-4 2002 Aftel (httpciifadcomelleduSRIISRI-Assessmentspdf) appe(
in us Stoop WA Norman Uphoff and Amir Kassam (2002) A review of agricultural research issues indus raised by the system of rice intensification (SRI) from Madagascar opportunities for improving Taiwa farming systems for resource-poor farmers Agricultural Systems 71 (2002) 249-274 positi
positi Tiyagarajan et al (2002) Effects of SRI practices on hybrid rice performance in Tamil Nadu on pat India In Water-Wise rice production Bourn BMA H B Hardy PS Bindraban TPTuong Metho and lK Ladha (eds) Proceedings of the International Workshop on Water-Wise Rice Production the po 8-11 April Los Banos Philippines Losbanos (Philippines) International Rice Research Institute recogn
averagl consen the intI agricul1 agricult product fields re KeyWl Method
356
-o~
--
1
1 INTRODUCTIONA The South Asian region has been transformed from a state of severe food shortages and starvation of large members of its people during 1960s mainly due to the poor productivity of two of its staple cereals (ie rice and wheat) to surplus production although distribution is still a problem The main factors behind this transformation process were introduction of short-stature fertilizershyresponsive lodging- and disease- resistant and high-yielding varieties investments in irrigation infrastructure massive use of chemical fertilizers herbicides insecticides and fungicides and government support through extension and micro-credit provisions This process may simply be described as the conventional system ofproduction intensification This system of production intensification has made it possible to achieve food security at a national level but has had serious negative social and environmental externalities such as (i) depletion of water tables (ii) decline in soil fertility (ii) aggravation of air pollution and (iv) resistance of weeds to certain herbicides (Stoop et aI 2002)
There is a growing interest in what some regard as a new intensification process but what faffilers will tell you is in fact a very old process - farming without chemicals or with a minimum use of chemicals andor farming to reduce water requirements This is known by different labels such as low external-input sustainable agriculture organic farming ecological farming intermitent irrigation alternate wetting and drying aerobic rice cultivation etc The system of rice intensification (SRI) shares one or more ofthe aspects of these methods ofproduction
and 11 Dermition of SRIlzers
in What exactly is the SRI The system was developed in Madagascar by Fr De Laulanie a French ~ or priest and agriculturist through working with farmers (Uphoff etal 2002) Many have given The definitions and descriptions of SRI 2
All of these definitions underline the importance of lany conceptualizing SRI as a system rather than as a technology as it is not necessarily a fixed set of ling practices Therefore SRI is not a package of fixed technical specifications it is rather a system of and production formed based on certain core principles from soil chemistry and biology rice nee physiology and genetics and the principles of sustainability with the possibility of adjusting the
exact technical components based on the prevailing biophysical and socioeconomic realities of an area This definition calls for research and adaptation of the system to specific conditions of an
RI area rather than trying to impose practices relevant to one location on the other injudiciously ere SRI practices are still evolving and concerns are more about improving factor productivity ity of land labor water and nutrients and harnessing potential of soil biology for pushing up further aJ the yield plateau of rice The main components of SRI are (1) planting method (2) soil fertility or management (3) weed control and (4) water (irrigation) management These components should in always be tested and varied according to local conditions rather than simply adopted )r
s Planting method refers to the spacing configurations and age of seedlings Under SRI the rice e plartt is transplanted 8-15 days after germination which is much earlier than the usual three to of four weeks Transplanting should be done quickly and carefully preferably within 15-30 minutes
of uprooting on texturally finer soils One or two rice seedlings are transplanted per hill not in clumps of more than three seedlings as usually the case and damage to the roots is carefully avoided Planting is done on a square grid of25x25 em or even larger (up to 50x50 em) which is
2 For descriptions and defmitions of SRI see httpciifadcomelledusriJindexhtml
331
~ -o
much sparser than the usual 15x15cm or 20x20 cm Some also suggest 30 x 30 cm in the main season and 25 x 25 cm in the off-season as an appropriate spacing The spacing should be adjusted according to the local edaphic conditions but must facilitate weeding
Concerning the soil fertility management nutrients should be added to the soil preferably in the form of organic matter such as compost or mulch The use of chemical fertilizer should be minimized and gradually avoided as the nutrient status of the soil develops Weed control is best done with mechanical weeder often called rotating hoe starting 10 days after transplanting and then weeding every ten days at least 2 or 3 times but if possible until canopy closure This is necessary for growing rice when fields are not kept continuously flooded Weeding is done often not only to control weeds but also to aerate the soil around the plants
Irrigation Water Management is practiced in such a way that the soil is kept well drained rather than continuously flooded and saturated during the vegetative growth period Two possibilities are suggested (1) application of a small quantity of water daily but leaving the field dry for several short periods (2-6 days) to the point of surface cracking during tillering and (2) flood and dry the field for alternating periods of 3-6 days each which is known as Alternate Wetting and Drying (Barker et al 2001)
12 Objectives and Scope of the Study
Following the reports of its dramatic yield and water productivity advantages in Madagascar SRI has recently generated interest and discussions among researchers development practitioners and policy makers in other countries These discussions have often resulted in polarized views with one group advocating for the wider dissemination of the practice and another group questioning the plausibility of the reported advantages On-farm and on-station experiments have been setup in Africa Asia and Latin America to substantiate the alleged advantages3
These experiments vary in design and rigor from simple un-replicated on-farm trials conducted by NGOs either alone or in cooperation with NARES to meticulously designed factorial trials The yield advantages reported from these experiments range from 19 to 270 percent with yield levels as high as 15 to 20 tlha (McHugh et aI 2002 Bonlieu 1999) About 50 percent water savings are also reported with little or no reduction in yield (Thiyagarajan et aI 2002) But the results of these studies do not always converge and it is difficult to compare the results from one experiment with another 4 For instance an experimental result from the IRRI showed disappointingly low performance of SRI Similar study done at Rice Research and Development Institute at Batalagoda in Sri Lanka showed no significant difference between SRI and the conventional system of rice production (Wickramasinghe 2002 pers commu) Except for the Mosher and Barretts (2002) work in Madagascar most studies on SRI so far are limited to experimental and demonstration activities Hence there is a need for directly documenting farmers own independent experience with SRI
This study tries to fill this research gap based on Sri Lankan SRI farmers experience During the year 2002 more than 3000 farmers in 18 districts of Sri Lanka were estimated to be practicing
3 For detailed infonnation regarding this issue see httpcjifadcomelledusrilindexhtml 4Tle experiments were not standardized and the resulting yield figures were not standardized Some reports for instance give figures for yield advantage based on results from different plot size for SRI and conventional
332
~
--
1 the main SRI in small plots of about 02 ha on average (Batuwitage 20025 The specific objectives of the should be study were
1 To assess the dynamics and determinants of adoption of the System ofRice Intensification 2 To evaluate the farm-level productivity economics resources conservation and water saving
tbly in the impacts of the System of Rice Intensification adoption should be To assess the poverty outreach of SRI adoption and rol is best To derive research extension and policy implications mting and middote This is The paper is organized as follows The next section deals with methodology Section 3 provides a lone often brief site description Section 4 and 5 presents the pattern of adoption and determinants of
adoption and dis-adoption in the two study areas Section 6 compares the benefits and costs of SRI with conventional practices Section 7 shows the poverty impact of SRI The final section
ned rather presents the conclusions and implications ~ssibilities
d dry for flood and 2 METHODOLOGY AND DATA ~tting and
Data for this paper were obtained from surveys in two localities of Sri Lanka The data generation process followed two inter-related steps First focus group interviews and key informant surveys were undertaken at various times during September and November of 2002 A team of agricultural economists led by a principal researcher from the International Water Management
scar SRI Institute made visits to farmers fields the National rice breeding station an ecological farming )fiers and center (a training center undertaking farmer training on SRI) Agriculture Development Authority ews with branch offices and Ceylon Electricity Board (CEB) to assess the views of various stakeholders estioning regarding the prospects of SRI in Sri Lanka ~n setup eriments Second the views and perceptions of the stakeholders obtained in the first step were distilled into )s either specific research questions and hypotheses for empirical testing using structured (formal) he yield questionnaire survey A questionnaire was developed and pre-tested for administration to a levels as randomly selected set of SRI and non-SRI farmers The structured questionnaire survey was mgs are implemented in JanuaryFebruary 2003 by the research team with the help of trained enumerators esults of rom one 21 Operational Dermition of SRI Adoption showed
In the present case SRI adopters (or SRI farmers) are those farmers who tried SRI at least once ilopment during the last five years (1998 to 2002) on whole or part of their paddy fields Thus the and the definition includes partial adopters and those farmers who have tried SRI and then abandoned it for the or disadopters Disadopters are those SRI adopters who have discontinued practicing or those nited to who have not practiced SRI during the last Yala and A-faha seasons The non-adopters (or NonshyIllentingmiddot SRI farmers) are those who have not practiced SRI during the above reference period6
SRI adoption intensity refers to the proportion of farmers total paddy fields allotted to the SRI practicering the
Lcticing
5 Comprehensive descriptions of the SRl practices were published in the JanuaryFebruary 2000 issue of Javaya a orts for newspaper published by the Ministry of Agriculture
6 Henceforth adopters and SRl farmers and Non-adopters and Non-SRl farmers are used interchangeably
333
- ~
(9- -t)
v Ql~ -~
~ J) 0
22 Sampling Design and Procedure
Two stage stratified random sampling design was used to select 120 farmers in total (ie 60 each from the two study locations and 30 each from SRI and Non-SRI farmers per location) The two study locations were purposively selected based on the prevalence of SRI farmers for which the sampling frame was solicited from Ministry of Agriculture office Colombo In Ratnapura (Kalthota Irrigation Scheme) according to the CEB there were 66 farmers practicing SRI According to a register of SRI farmers compiled by the Ministry of Agriculture 45 percent ofall practicing SRI farmers in the country were in Kurunegala district
23 Analytical Framework
The data generated at the household and field levels were subjected to descriptive analyses to characterize the sample farmers rice crop management practices Multivariate statistical analyses such as logit and tobit regression models were used to assess factors influencing the incidence and intensity of adoption and disadoption of SRI Enterprise budgeting technique was used to assess the economics of SRI vis avis conventional system of rice production in the two locations (Figure 1) for yala and maha seasons ofthe year 2002
3 DESCRJPTION OF THE STUDY AREAS
31 Kaltota Irrigation System Kaltota is situated in Ratnapura district and in the Balangoda sub-district The district is predominantly a Wet Zone district while southeastern parts of it fall within the intermediate and dry zones Agricultural activities in Ratnapura are mainly based on plantation crops and mixed home-gardens generating spices Kaltota irrigation system is a river diversion system in Walawe River one of the major rivers in the country The system irrigates 1000 ha of lowland through two conveyance channels situated in either side of the river The left bank irrigates 128 ha of paddy lands in three tracts while the right bank canal irrigates 728 ha situated in seven tracts one of which is the ancient settlement where farmers have large land holdings A majority of the command area is cultivated in both seasons Amount of water available at the system has reduced since the construction of a reservoir for electricity generation above the water diversion point of the system As Kaltota farmers were historical users of water their right to use water from the river is recognized by the power authorities Farmers are eligible for a special irrigation release calculated on the basis ofhistorical water use A leak from the reservoir also increases the amount of water available at the diversion However CEB wants to minimize the amount of water released for non-electricity generating uses as this result in revenue loss Hence programs to reduce the demand for irrigation releases were introduced to farmers SRI appeared to be a potential water saver so CEB took steps in promoting SRI among farmers in the irrigation system
32 Kurunegala district
Kurunegala district is situated in the northwestern part of Sri Lanka It is the third largest district in terms of land area About 75 percent of the area of the district falls within the Intermediate Zone while its northern part fall within the Dry Zone and southern part in the Wet Zone Coconut cultivation in plantations as well as in small-holdings and paddy cultivation under minor irrigation are characteristics of the district In the southernmost parts of the district ginger is
334
~
grown as an annual crop mainly in paddy lands Kurunegala is a major paddy-producing area in 60 each the country During 2000 to 2002 the district accounted on average for 106 percent of the fhe two national rough rice production The district has 12621 ha of major irrigation under 15 irrigation hich the schemes and 33804 ha under 4188 minor tanks and 657 minor river diversion schemes About ltnapura 29028 ha of paddy land are rainfed 19 SRI nt ofall The Ministry of SAMURDIll responsible for poverty alleviation took a special interest in
promoting SRI through farmer training programs These programs were more effective in Kurunegala district mainly due to its proximity to the Nature Farming Center a training and research center on ecological farming and initiative by one regional farmer federation to produce and distribute hand weeders an essential tool for practicing SRI lyses to
lIlalyses cidence used to ICations
trict is lte and mixed in the
)w1and es 128 1 tracts of the
Kluced lint of im the elease DOunt water ms to bea
stem
strict diate onut linor er is
335
~ - (9
-t) gtgt e -1i- v 0
nshy-(b~
0
N
A o PrinGipal City
o Study Location
~ Zone Boundary
orvzbullbullbull
Colombo WetZobullbull
o
20 milesFigure 1 Study Locations
Locations of Study in Rathnapura District
336
amp
))~ ~ v -0
(1 -shyIc
4 THE SPATIAL AND TEMPORAL DYNAMICS OF SRI ADOPTION IN SRI LANKA
41 Adoption trends
System of Rice Intensification has only five years of history in Sri Lanka Only one fanner has reported to have first time learned about SRI in 1998 The majority of the SRI sample fanners in Kurunegala have learned about it in the year 2000 SRI sample fanners from Kalthota lagged behind Kurunegala farmers by about 2 years in awareness Even though about 117 percent of the SRI sample farmers are aware of SRI during 199899 actual practice commenced first in Kurunegala in the year 2000 The temporal dynamics of SRI awareness among adopters and nonshyadopters are quite similar (see Figures 2 and 3)
25 sect 20 ~
Cia 15 rJ 0 10 Q)
r
sect 5 Z 0
-----~---
--Kalthotar=~------krunegaj 1
Total
1998 1999 2000 2001 2002
Year
Figure 2 Year the fanners first learned about SRI
30 ----~--~~~--~
~
sect 25 ~ 20middot Kalthota~ r 0 15 Kurunegalar
10 Total0 ltU
8 5 ~
0
1999 2000 2001 2002
Year
Figure 3 Year ofawareness of SRI fanners
The non-SRI sample farmers who were aware of SRI but have not shown interest to practice it were asked why they do not intend to practice The response or reasons they gave are summarized in Table 1 Consistent with the practicing farmers observations the non-SRI farmers reported that the major obstacle to SRI adoption is the high labor demand and the tedious nature of the associated management practices such as transplanting and manual weeding
337
))~ 6)
-J 0 (~ shy-- (
~
Table 1 Reasons for unfavorable attitude of Non SRI farmers towards SRI Reasons Locations ()
Kalthota Kurunegala Total Requires more labor and effort 682 381 535 Climate is not good for SRI cultivations 45 00 23 Lack of necessary inputs 45 48 47 Water shortage and lack of suitable field 48136 93 Land tenure problem 45 00 23 Difficulties ofgetting organic fertilizer 45 00 23 Difficult to do management practices 00 238 116 No benefit 00 95 47 Field is located very far from home 00 48 23 Other SRI farmers failed 00 95 47 Lack of proper training 00 48 23 N 22 21 43
42 Farmers Perceptions of the Merits and Demerits of SRI
The advantages and disadvantages of SRI were elicited from the practicing farmers and the results are summarized in Tables 2 and 3 The most significant merits of SRI as compared to conventional system are (1) improved quantity and quality of paddy yield (2) savings in irrigation water and seed (3) reduced demand for external cash inputs like inorganic fertilizers and herbicides and (4) enhanced tolerance to biotic (eg diseases and insects) and abiotic stresses (eg lodging and low moisture stress) These views are quite consistent with the findings reported based on on-station and on-farm experimentation with SRI in some Asian African and Latin American countries
Table 2 Advantages of SRI relative to Conventional-farmers assessment No Criteria Percentreportin~yes N 1 More yield 830 53 2 Saves water 897 58 3 Saves seed 1000 60 4 More milling output 774 53 5 Less disease and pest attack 881 59 6 Less lodging of rice 914 58 7 Reduced demand for herbicide 911 60 8 Reduced demand for inorganic fertilizer 862 58 9 Less labor for harvesting 796 54 10 Less labor for trans~lanti~ 780 59 11 More tillers 983 59 12 Improves seed quality 909 55 13 Reduces input costs 850 60 14 Less labor for bund cleaning and construction 763 59 15 Environment friendlY 50 60
338
~ ~ ~~ -
(9
0 0 (
---- 11
---
Table 3 Disadvantages of SRI relative to conventional-farmers assessment No Criteria Percent respondin2 yes N 1 Weed control problem 60600 2 Transplanting is difficult 367 60 3 60SRI transplanting requires special skill 250 4 Requires skilled labor for management 317 60 5 Demand more labor input 500 60 6 60Requires additional workdays 650 7 59Requires more effort 746 8 57Organic matter not available 579 9 57Transporting organic matter is problematic 509
6010 Problems ofMW handling and availability 767 6011 Mice attack due to unclean bunds 17 5812 SRI requires well drained soils 690
13 559 59Does not work on flooded fields
The most important demerits of SRI relate to its extremely high demand for labor problems of weed control and organic matter availability 77 percent of the practicing farmers complain that the the rotary weeder recommended for use in the SRI system is not readily available and even ifIto available not easy to handle im
rers sses
S FACTORS INFLUENCING ADOPTION AND DISADOPTIONngs and
Sl Determinants of SRI Adoption
The two most popular functional forms used for dichotomous discrete choice adoption models are the logit and the prohit models The advantage of these models is that the probabilities are bounded between 0 and 1 The logit model is selected here The odds of SRI adoption are defmed as the ratio of the probability of adoption (pi) to the probability of non-adoption (I-Pi)
Specifically the model is
The Xs are the hypothesised explanatory variables as defined in table 4 The variables hypothesized to influence adoption of SRI were derived from own informal assessment and literature reviews (Moser and Barrett 2002 McHugh et aI 2002) Since these variables are unlikely to operate independently a variable-by-variable analysis of relationships with farmers adoption of SRI is likely to be misleading (Feder et aI 1985) Hence logit analysis which uses a number of independent variables has been used to predict the probability offarmers SRI adoption
339
e~ p~ -
amp
0v (1shyA
--
ized to influence the
POVGR(X12)
LOCFA(X13)
LABAV(XI4)
The logistic regression model fitted to analyze the effect of these variables on the adoption decisions offarmers is presented in the table 5 Dependency ratio (DEPRA) age of the household head (AGEHH) and proportion of annual income from non-farm activities (PRNIN) reduces the likelihood of a farmer being SRI adopter By contrast family size (F AMIS) years of schooling (YSCHH) and participation in agricultural training programs (NFTPA) significantly increase the probability of a farmer being SRI adopter For instance as the family size of the farmer increases by a unit the likelihood of being SRI farmer increases by 145 times (see the exp (8) for variable F AMIS) The proportion of children between 7 and 14 increases the likelihood of SRI adoptioIl This is consistent with our field observation-- children were actively participating in the transplanting of SRI fields 9 Moreover studies in other countries showed that women and
7 Five organizations were identified and farmers were asked to confum whether they are ordinary members or leaders of these organizations in the past and at present Thus each farmer can score a minimum of zero (meaning not a member of any organization in the past and at present) and a maximum of 20 (meaning the farmer is a member and flays leadership role in all organizations in the past and at present ie 5x2x2)
This index was constructed from a set of questions designed to elicit farmers opinion regarding labor supply in his or her village or community 9 Whether this may be considered as a possible negative social effect of SRl or not depends on the situation of the without SRl scenario regarding children and women participation in the labor force in any particular locality
340
childre (Rena
Locatic irrigatt Thesemiddot that the Whyal the ob~ differel soil dl toleran availab investn which enhanc additio soil an the cha abunda family
Themlt irrigati4 middle mayse import maybe along t ends ~ certain succes water I field d
AnOthl buffalc signifi
~ gtl P~ -
amp
0J M
children are particularly suited for handling the transplanting of small and delicate rice seedlings (Rena Pervez 2002)
Location of the farm along the irrigation canal and generally the type of farming system (ie irrigated or rainfed farming system) had remarkable influence on the adoption pattern of SRI These important patterns are revealed by the variables LOCFA and FYLWS The model showed that the probability of adoption of SRI among irrigated farms is lower than that of rainfed farms Why are rainfed farmers more likely to adopt SRI than irrigated farmers This might be due to (1) the observed production risk differential among the two types of farming systems (2) the wage difference between rainfed and irrigated areas and (3) Increased water holding capacity of the soil due to improvement in organic matter content and hence enhanced low moisture stress tolerance of the rice crop The rainfed rice farming faces risk and uncertainty regarding the availability and distribution of rainfall Therefore rainfed paddy fanners are cautious about investments in cash inputs such as fertilizer herbicides and pesticides Hence for them SRI which decreases the demand for high-risk cash inputs is an ideal alternative rice productivityshyenhancing strategy Moreover as elaborated in the section 51 of this paper SRI involves the addition of huge amount of organic fertilizer which improves the water-holding capacity of the soil and hence easing the risk of low-moisture stress On the other hand high labor input forms the characteristic feature of SRI practice thereby making it attractive in those areas were there is abundant labor with relative lower wages The positive sign of labor availability (LABAV) and family size (FAMIS) variables further corroborates this argument
on )ld he ng he es lie
The model shows that there is no significant difference between farmers located at the head of the irrigation canal and rain-fed farmers regarding SRI adoption But the probability of adoption of middle and tail farmers is sign~ficantly lower than that for rainfed farmers At the first glance this may seem to contradict the widely held view that SRI saves water But this finding underlines the importance of irrigation water supply uncertainty In the advent of supply uncertainty farmers may be reluctant not to flood their paddy fields when water is available Why are farmers located along the head of the canal more likely to adopt SRI than those situated in the middle and tail ends This may be due to the fact that at least for irrigated farmers there must be some degree of certainty regarding the availability of irrigation water (or control over water supply) for successful adoption of SRI (McHugh et aI 2002) Farmers at the middle and the tail maintain a water layer on their fields as buffer in case irrigation water arrive at large intervals Keeping the field drained is very risky if they have no control over water
Another important variable having almost significant positive impact on SRI adoption is cattle or buffalo ownership through its effect on manure availability The model also shows that there is no significant difference in SRI adoption between poor and rich farmers
or ot ld
341
~ -a-
--
Table 5 Detenninants ofSRI adoption -Results oflogit regression analysis Variable Code B SE Exo(8
CONSTANT -23134 29217 -Dependency Ratio (DEPRA) -00454 00277 0955 Proportion ofChildren in the Family(PCIDL) 00462 00285 1047 Family Size (FAMIS) I 03095 01791 1362 Age ofthe Household Head (AGEHH) -00509 00359 0950 Years ofSchooling of the Household HeadjYSCHH) 01645 00861 1178 Number of Training Programs Attended (NFTPA) Number ofExtension Contact7NEXCY)
~~----
01760 00343
00901 05146 ~~i
Proprotion ofIncome from Rice (PRICEj 00048 00117 1004 Proportion ofNon-fann Income (pRNlN) -00039 00124 0996 Incidence ofYield Loss due to Low Water Stress (FYLWS) 00575 01509 1059 An Index of Social amp Political Capital (POSOLl 00327 00821 1033 Poverty Group (poor) 00464 06746 1047 Poverty Group (Middle) -11770 06857 0308 Povert Group (Rich)-reference cateSory Location of the Fann or Field (Head) -02209 09935 0801 Location ofthe Fann or Field (Middle) -15452 09161 0213 I Location ofthe Fann or Field (Tail) -19079 09309 0l48 Location ofthe Fann or Field (Rain fed J-reference category An Index ofLabour Availability Perception (LABA V) 01334 01438 1142 Number of Cattle Owned (CATTL) 05139 I 03380 1671 Notes significant at 10 probability level significant at 5probability level -2 Log Likelihood 10898 Model Chi-square = 46284 (df= 18p=00003) Cox and Snell Rl=038511
Nagelkerke K=0513 Percent correctly predicted = 7679 N=112
S2 Intensity of Adoption of SRI
The intensity of adoption once the fanner has decided to practice SRI was evaluated using the proPQrtion of SRI area in the total paddy cultivated during maha and yala seasons and the proportion of fanners who allotted 100 percent of their paddy field to SRI These are shown in figures 4 and 5 The proportion of paddy area allotted to SRI ranges from about 39 percent in Kalthota to about 61 percent in Kurunegala during Yala season Some fanners have also allotted their total rice field to SRI The proportion of such fanners ranges from as low as 10 percent in Kalthota to as high as 50 percent in Kurunegala (see figure 5) The proportion of SRI farmers with 100 percent of their paddy fields SRI is higher during Yaa than during Maha in Kurunegala
II In OLS models the R2 statistic represents the proportion of variability in the dependent variable that can be explained by the independent variables For logit regression model an easily interpretable measure of the strength of the relationship between the dependent variable and the independent variables is not available Cox and SneD and Nagelkerke Rl are attempts to imitate the interpretation ofR2 in OLS regression They are attempts to measure strength of associations
342
~ shyo-
---
Exp(B ~17 -77 0955 85 1047 91 1362 59 0950 61 1178 01 1192 6 1034 17 1004 ~4 0996 9 1059 1 1033 6 1047 7 0308
5 0801 I 0213 ~ 0148
~ 1142 ) 1671
ISing the and the hown in rcent in allotted rcent in fanners negala
gth of and
This is in line with the presumption that Yala season is more water scarce than Maha season and one of the advantages of SRI is to save water as has been elaborated in the previous sections
70
60
ttl 50
~ 40 ~
~ 30
~ 20
10
0
jYala I l__ M~
Kalthota Kurunegala
Locations
Figure 4 Proportion ofRice area allotted to SRI in 2002
it 60 T-~--~-------------- rJ)
~
8 50
~ 40 +
~ 30
~ E 20 f it 10 rJ)
f 0
Kalthota Kurunegala
Locations
Figure 5 Proportion of SRI fanners who allotted 100 percent of paddy area to SRI in 2002
In the previous section detenninants of SRI adoption decision were assessed However the extent or intensity of adoption once the adoption decision is made is important infonnation for research extension and policy This issue was evaluated using tobit regression model which allows the estimation of the likelihood ofadoption as well as the extent or intensity of adoption It is preferable to logit adoption model when the decision to adopt also involves simultaneously a choice regarding the intensity of adoption as it does with SRI practice The model can be specified as
where Yi is a latent variable representing the use of the SRI X is a vector of independent variables described in table 4 13 is a vector of unknown parameters and Ei is a disturbance
343
~ -oshy
assumed to be independently and normally distributed with zero mean and constant variance~ and i = ]2 n (n is the number of sample households)
Denoting yi (the proportion of SRI area in the total cultivated rice area) as the observed dependent (censored) variable
The proportion of paddy area allotted to SRI was regressed against various factors hypothesized to influence SRI adoption A common mistake made when interpreting tobit coefficients is to treat them as effects of the independent variable for cases above the limit To avoid this drawback the tobit coefficients were decomposed following McDonald and Moffitt (1980) and the results are presented in table 6
1n the incidence of adoption model (ie logit model) discussed in the previous section informational variables such as participation in training program and extension contact poverty status location of the farm the farming system (ie irrigated vs rainfed farming) and level of education were important variables in predicting SRI adoption 1n the tobit model which estimates both the incidence and intensity of adoption the informational variables have lost their explanatory power 1nstead variables related to labor availability (DEPRA and PCHlL) and organic matter availability (CATTL) are more relevant
Table 6 also shows the decomposition of the total elasticity of the variables12 The decomposition
consists of two components the probability of adopting in the first place and the potential increase in the area allotted to SRI once the decision to adopt has been made For example the total elasticity value for the years of schooling (YSCHH) is 0974 meaning that a 10 percent increase in the years of schooling is expected to result in about 97 percent in adoption and use intensity of the SRI practice The probability of adoption will increase by 73 percent while the intensity of adoption will increase by 24 percent The other variables in the table can be interpreted in an analogous manner
12 An elasticity of adoption measures the responsiveness to a particular variable and is equal to the relative change in adoption of a technology with respect to a small relative change in a given variable from current levels The elasticities obtained from the tobit model take into account that a change in the explanatory variable will simultaneously affect the number of SRI adopters and the proportion of acreage under SRI
344
~ shyo--
---
~e and
Table ~ The det~rminants ofthe extent or intensity of adoption of SRI- results of probit
endent tshynt
~sized is to
back lsults
tion verty elof rhich their and
tion 53 Determinants of SRI Disadoption ltial
the Disadoption is one important aspect which have not been given due consideration in past ent adoption research Information on the reasons why certain group of farmers failed to stick to the use technology recommended for use is of crucial importance for researchers extension workers and the policy makers For instance research may draw upon the drawbacks of the technology and be improve upon those drawbacks to increase the chance of acceptability and wider dissemination of
the technology among the intended beneficiaries
In light of this fact a logit model was fitted to the data on SRI farmers Most of the variables in the SRI adoption modeling of section 51 were also included here The additional variables incorporated in the current model are (1) An index of positive perception of farmers towards SRI (POSIP) constructed based on the
reported advantages of SRI vis-a-vis the conventional system of rice production presented in table 2 The value of the variable ranges from 0 to 15 where 0 indicates lowest positive attitude of the SRI practitioners towards SRI and 15 shows the strongest positive attitude towards SRI This variable is expected to have a negative relationship with disadoption since those farmers who had positive attitude towards SRI are expected to continue with SRI
(2) An index of negative perception of farmers towards SRI (NEGAP) constructed based on the reported disadvantages of SRI vis-a-vis conventional system of rice production presented in table 3 The value of the variable ranges from 0 to 13 where 0 indicates lowest negative attitude of the SRI practitioners towards SRI and 13 shows the strongest negative attitude
345
gt)~ 6)
-0~
~ 0 rt
towards SRI This variable is expected to have a positive relationship with disadoption since those fanners who had a negative attitude towards SRI are expected to cease practicing SRI
(3) Average realized SRI yield (kgacre) for SRI farmers while they were practicing We expect that those farmers who had better paddy yield during their first season(s) of experimenting with SRI will continue with SRI Contrarily a low level of realized yield would lead to dis adoption
(4) The other important variable is the perception of farmers regarding the cost of capital or availability of cash (CASHR) This variable is particularly important in the sense that one of the cases for promoting SRI is due to its lesser reliance on external inputs hence lesser requirement for cash or capital The value for this variable ranges from 1 to 5 where 1 indicates severe cash constraint and 5 indicates the absence of cash constraint We expect this variable to have positive relationship with disadoption
T bl 7 Da e etermmants 0 Isa optIon 0 fSRIR- esu ts 0 I fl Oglt regressIon analysIs Variable p INTERCEPT 5935 An Index of Degree ofPositive Perception (pOSIP) -0262 An Index ofDegree ofNegative Perception (NEGAP) 0064 Average Realized Yield (AVERY) -0002 Episodes ofRice Yield Loss due to Water Stress (FRRYL) 0310 Labor Availability (LABA V) -0424 Proportion of Children in the Family (PCIDL) -0032 Poverty Group (poor) -3021 Poverty Group (Middle) -2504 Number ofExtension Contact (NEXCY) -0314 Dependency Ratio (DEPRA) 0052 Years ofSchooling of the Household Head (YSCHH) -0065 Proprotion of Income from Rice (PRICE) -0016 An Index ofLabor Availability Perception (CASHR) 0766 Note means the coefficIent IS slgmficant at 5 slgnrficance level -2 Log likelihood = 3743 Cox and Snell R2 = 048 Nagelkerke k = 066 Percent correctly predicted = 867
SE 5565 0300 0231 0001 0451 0312 0062 1505 1618 0215 0057 0187 0020 0591
exp(p) 377943
0769 1066 0998 1364 0655 0968 0049 0082 0730 1053 0937 0985 2151
All of the variables included in the disadoption model had the expected signs (table 7) However only average realized yield during the first season(s) of practicing SRI (AVERY) and poverty status (POYGR) variables had statistically significant effect on disadoption Hence the success or failure of farmers during initial adoption process determines the acceptance and the pace of dissemination of a technology In the adoption model (table 5) there is no significant difference in the probability of adoption of SRI between poor and rich farmers However the probability of disadoption among poor farmers is significantly lower than that among rich farmers This implies that once the poor farmers adopt SRI they have higher probability of continuing with it than rich farmers
346
~ shyo -
---
I since SRI
r y r f
f
Among the perception variables farmers perceived cash availability (CASHR) labor availability (LABAV) frequency of rice yield loss due to water shortage (FRRYL) and an index of farmers positive attitude towards SRI (POSID) respectively had strong coefficients However these were not statistically significant
6 THE MICROECONOMICS OF SRI
61 Rice agronomy and irrigation water management
Fanners agronomic practices level of cash input utilization and irrigation water management differentiated by system of production (SRI vs conventional) and seasons (wet-maha and dryshyyala) are shown in table 8 Expectedly there is substantial difference between the two systems of rice production regarding planting method fertility management and weed control practices For instance an average SRI-farmer transplants one 8-days-old rice seedling per hill on a square grid of about 23 by 23 cm While most conventional fields were planted by way of broadcasting few conventional farmers have practiced transplanting However the SRI transplanting differs from the conventional transplanting in many ways The conventional farmers planted on average four IS-days-old rice seedlings in a clump per hill on a square grid of 15 by 15 cm which is narrower than that for SRI
Concerning soil fertility management significant differences are noted between the two systems Generally SRI farmers used lesser doses of inorganic and higher doses of organic fertilizer per unit area as compared to conventional farmers Moreover a considerable number of SRI farmers abandoned altogether the use of inorganic fertilizers instead they put a lot of organic fertilizers The main sources of organic fertilizers include cow dung tree leaves straw poultry manure compost and rice bran
Weed control method is another important aspect differentiating the two systems of production SRI farmers use herbicides rarely instead they make use of a mechanical weeder andor hand weeding The conventional farmers rely heavily on herbicides and they flood their paddy fields with water as a means of weed control It is important to flood the field at the correct stage
One of the main advantages of SRI is its water saving with little or no reductions in the paddy yield (Thiyagarajan et aI 2002) We attempted to have an indirect and rough idea of the magnitude of on-farm or field-level water savings through farmer estimates of number of irrigation and hours of irrigation per unit area13
On average number of irrigations and hours of irrigation per unit area of SRI-fields are respectively about 24 percent and 23 percent lesser than the conventional paddy fields However the difference between SRI and conventional regarding hours of irrigation is not statistically significant Consistent to our a priori expectations the per hectare hours of irrigation (for both SRI and Conventional fields) during yala season is greater
13 F arrners were asked the number of irrigation done for each rice field they owned during Yala and Aaha seasons Moreover they were asked to give approximate hours elapsed during successive irrigation Then the number of irrigations was multiplied by the hours elapsed and divided by the area of the field to give an estimate of hours of irrigation per unit area We admit that for more conclusive results an exact field-level measurement needs to be done preferably for a number offarrners
347
~~ 6)
a - ) v 0 rrshy-
than that of Maha season This is because Yala season is relatively water scarce as compared to Maha season (see figure 7)
4~~----------------------------~
400 3~
~ 300 2~ ~ 200
~ l~ 100 ~
o
~ ~ ~ ~ ~ sect ~ g ~ ~ ~ ~ Mon1hs
~-WbTZa] bull DRY ZONE --shy
Figure 7Monthly rain fall distribution for the Dry and Wet Zones of Sri Lanka (1961-1990)
Table 8 also clearly indicates that generally SRI fields demand higher amount of human labor (about 3 times more) This arises from planting (about 37 man-days per ha) weeding (about 31 man-days per hal bund construction and cleaning (about 41 man-days per hal and organic fertilizer collection and transportation (126 man days per hal The corresponding figures for conventional fields are 8l man-days for planting (broadcasting) 16 man-days for weeding 114 man-days for bund construction and cleaning and 73 man-days per ha for organic matter collection and transportation The amount of bund construction and cleaning labor for SRI is significantly lower than that for conventional fields This is because the SRI farmers were advised not to clean bunds in order to harbor beneficial organisms as an integrated pest management strategy
348
g l
()
g e 8t ~ e pound VI bullell oJ
1 1
0
~ ~ shy--sect bull
~ ))
=~ --(9
0 (~
- ----
shybl
~
(
(0
til
0
~1
0 c
P
~
II g
~ t
amp
e w
g K
G
_ _
I
n~
_
I
8
Tab
le 8
In
T
b -
f
d [~-~
Pra
ctic
es o
r In
puts
SR
I C
onve
ntio
nal
Yal
a M
aha
Yal
a
~and
M
ean
SD
N
Mea
n SD
N
M
ean
SD
N
Mea
n T
ract
or h
ours
per
ha
26
232
32
24
18
7
32
28
183
12
9 28
pr
epar
atio
n B
ullo
ck h
ours
per
ha
24
438
32
17
35
0
32
19
475
12
9 17
P
lant
ing
Tra
nspl
anti
ng h
ours
per
ha
244
152
32
352
262
32
114
144
37
271
Bro
adca
stin
g ho
urs
per h
a
-
--
-67
8
420
8
7
63
Nw
nber
ofs
eedl
ings
per
hill
1
1 0
3 32
1
4 0
7 32
4
0 1
2 35
3
7 A
ge o
fsee
dlin
gs in
day
s 7
6 1
9 32
8
4 2
7 32
18
3
5 3
8
185
S
paci
ng b
etw
een
plan
ts in
inch
es
95
13
31
94
13
32
59
15
19
59
Spa
cing
bet
wee
n ro
ws
in i
nche
s 9
7 1
2 32
9
6 1
1 32
6
0 1
6 19
6
2 S
eed
rate
kg
per h
a 14
10
0
32
17
12
32
117
38
11
2 11
4 F
erti
liza
tion
U
reap
erh
a 77
73
0
32
78
804
32
14
1 86
2
128
133
(Ino
rgan
ic)
TD
Mk
g p
erh
a 76
13
05
32
516
78
2
32
97
800
12
8 96
N
PK
kg
per
ha
57
105
6 32
45
74
1
32
104
718
12
8 10
0 T
SP
kg
per
ha
-
-
-
13
120
8 12
8 4
f ~~~
MO
P k
g pe
r ha
--
--
--
03
33
I 12
8 0
5 F
erti
liza
tion
C
ow d
ung
in k
g p
er h
a 20
24
3066
32
14
22
2541
32
15
3 61
78
129
152
(Org
anic
) T
ree
leav
es in
kg
per h
a 10
13
1443
32
73
3 25
133
32
24
7 16
200
129
131
Str
aw i
n kg
per
ha
951
1900
4
32
261
799
0 3
2
170
706
4 12
9 28
7 P
oult
ry m
anur
e in
kg
per h
a 73
25
85
32
39
149
6 32
31
34
95
128
75
Com
post
in k
g pe
r ha
62
349
5 32
23
13
1 3
2
--
--
Ric
e br
an i
n kg
per
ha
23
945
32
8
437
32
-
--
Wee
ding
H
erbi
cide
s li
ter
per
ha
015
0
87
32
008
0
31
32
2
29
325
12
9 2
14
Hou
rs o
fMec
hani
cal
Wee
ding
per
ha
283
281
32
213
260
32
3
233
12
7 2
Han
d W
eedi
ng H
ours
per
ha
69
934
32
57
90
6
32
4
217
12
9 15
H
ours
ofb
un
d c
onst
ruct
ion
and
clea
ning
per
ha
28
48
0
32
38
51
32
8
8
862
12
9 94
Ir
riga
tion
M
ean
Num
ber o
fIrr
igat
ion
24
179
24
22
17
2
25
32
259
10
3 29
H
ours
of i
rrig
atio
n pe
r ha
1942
24
25
21
1720
21
16
23
25
89
40
38
97
2154
H
arve
stin
g P
er h
a ho
urs
ofh
arve
stin
g 32
8 26
62
31
326
376
7 13
35
5 25
46
I 11
5 26
5
Mah
a SD
18
9
380
18
10
444
0
9 3
9 1
3 1
5 38
0
815
75
6
749
19
9
43
594
2 51
02
1022
6
659
8
~~
-3
07
175
0 54
3
100
3 25
8
2993
18
17
N1 (
145
145
38
106
i~
38
23
23
132
147
147
147
147
147
14
5 I
145
I
143
I
145
-- 144
145
145
144
III
103
84
lJ
j
0 14
N r
efer
s to
the
num
ber
off
ield
s S
ince
mos
t oft
he f
arm
ers
had
mor
e th
an o
ne c
onve
ntio
nal r
ice
fiel
ds t
he n
umbe
r ofs
ampl
e ho
useh
olds
and
the
num
ber o
f fi
elds
may
var
y A
ll o
fthe
SR
I fa
rmer
s ha
d on
ly o
ne S
RI
field
M
oreo
ver
not
all
oft
he o
rigi
na16
0 S
RI
sam
ple
farm
ers
had
prac
tice
d S
RI
duri
ng 2
002
---
62 Yield Comparisons
The mean paddy yields obtained during the last three years differentiated by the system of production and seasons are listed in table 9 The mean SRI yield even though not as dmmatic as figures reported from many sources is about 44 percent more than that for the conventional method (F value = 474 P=0031) The reported conventional yields are well within the range of figures estimated by Sri Lanka Department of Census and Statistics The Departments estimate of paddy yields for the country lies between 25 and 41 t per hectare depending on the type of farming system (ie rainfed or irrigated rice farming) and the type of irrigation scheme (Kikuchi et aI 2002)
SRI is fertili~
contin fertili2 the co Interes or con and UI respon trend)
T bl e 9 Ri f management (Kgh) level d a ceyleIdsunder SRI and conventlOna system 0 a in the differel
Year Sri Conventional yield increase Yala Maha Mean Yala Maha Mean
2000 4097 6236 5488 3635 3644 3641 507 2001 5056 5327 5215 3516 3749 3633 435 2002 5737 5977 5811 4189 3832 4041 438 Mean 5299 5763 5524 3910 3757 3836 440
The set fertilizeuro the SUC4
However the yields reported in table 9 above conceal the effects of location and adoption15status The highest paddy yield (81 t ha) was recorded for SRI in Kalthota area during Maha
season for adopter group while the lowest (21 tha) was recorded for dis adopters during Yala season in Kurunegala (Table 10) Generally disadopters experienced the lowest paddy yield during the first year of adoption forcing them to discontinue the SRI pmctice The disadoption model of Section 53 also corroborates this fact Location-wise the yields recorded for Kalthota area are significantly better than those recorded for Kurunegala farmers irrespective ofthe system of production From table 10 one can also infer that the prospect of harvesting better paddy yield is higher for the Maha season than the Yala season which is in line with the usual expectation
Table 10 Paddy yield per acre by adoption status season year and location (kgha Location Year SRI Conventional
Ado ters Disado ters Ado tefs Disadopters Yala Maha Yala Maha Yala Maha Yala Maha
Kurunegala 2000 5726 7217 2102 4668 3501 3063 3769 4372 -
2001 6011 5499 4100 4628 4040 3628 2942 3851 2002 5619 5977 NA NA 3071 3702 3863 3911 Mean 5785 6231 3101 4648 3537 3464 3524 4045
Kalthota 2000 NA NA NA NA NA NA NA NA 2001 NA 8154 NA NA 6795 NA NA NA 2002 5806 NA NA NA 4900 NA NA NA Mean 5806 8154 NA NA 5848 NA NA NA
NA means not applicable
15 The original SRI sample farmers who have not practiced SRI during Yaa or Maha seasons of the year 2002 are regarded as disadopters By these criteria 20 of the 60 SRI sample farmers are disadopters
350
differet1 the orgc ofnutril
Table 1 Inorga
o oto 100 100 to 2 200ampa
--ornrutn F value The in
Table 1 Inorga
0 otol0( 100 to 200amp Grand F valueuro The 11
~ shyo-
---
- --
SRI is usually considered as a practice that gives substantial yield without the use of inorganic fertilizer (Barison 2002) Despite the advice not to use inorganic fertilizer some farmers have
tic as continued to use it with varying intensities The SRI farmers level of utilization of inorganictional fertilizer has been arbitrarily classified into four strata starting with zero level of utilization and ge of the corresponding paddy yields recorded for each stratum are reported are shown in Table 11
Interestingly the SRI farmers who did not apply any form of inorganic fertilizer recorded better or comparable yields to those farmers who applied up to and above 200 kg of fertilizer in Yala and up to 200 kg during Maha Another important observation is that while the paddy yield response to the applied fertilizer levels has slowed (ie the marginal product has shown declining trend) during Yala the yield response to additional levels of fertilizer has not reached optimum level during Maha The reason for this remarkable response difference may be due to variations in the level of available water during the two seasons Therefore the two seasons might need different fertilizer recommendations
The scenario for conventional paddy fields is different in that the response to the applied levels of fertilizer has been linear ie zero-inorganic fertilizer fields gave on average lower yields than the successive levels of fertilization especially during maha season (table 12) The reason for this difference is due to the fact that on SRI fields the added inorganic fertilizer was supplementary to )tion the organic fertilizer while for conventional fields chemical fertilizer was mostly the main source (aha of nutrients
Yala rield
Table 11 Yield comparison by level of fertilizer application (kgha )-SRI farmers tion
Inorganic fertilizer (kgha) I Yalanota Mean SD Ntern
0 5792 2715 5ieJd oto 100 4851 92133n 100 to 200 5954 2350 3 200 amp above 6481 2755 13r----------------------shyGrand mean 5825 2506 30 F value 1741(p=0195)s
MahaMeanshy SD~N 4349 2460 2 4159 3279 4 5362 2202 2 9133 1977 4 6049 3218 12 __~~285 (p=003 5)
The morgamc fertilizers were UREA TSP NPK and MOP
2 Table 12 Yield comparison by level of fertilizer application (kgha) - conventional farmers
la
ii3----~---Inorganic fertilizer (kgac) Yala c------shy
Mean SD N _M~a~r~~~_ __~ 0 3970 1786 9 1821 1136 ~ oto 100 4153 3797 J 1615 301699 28 100 to 200 4384 I 1975 68 3805 j 1930 35
1020200 amp above 5052 2153 4449 i 1522 4409 1936 80Grand mean 125 3758 i 1786
2625 (P=0056)F value 1058 (p=0370) The morgamc fertlhzers mclude UREA TSP NPK and MOP
351
~ -o shy
63 Profitability Comparisons
The microeconomics of the two systems of rice production was assessed using budgeting technique 16 Net returns were estimated for each farmer using the relationships
NR=GR-TC
VC=L- PXI I
TC=VC+F GR=RYRP
Where NR= Net Returns GR= Gross Returns VC= Variable Cost RY= Rice yield for SRI and conventional system RP= Rice price Pi =per unit price of the ith input and Xi= quantity of the ith input F is fixed cost and TC is total cost
The individual budgets prepared for each and every sample farmers differentiated by system of production and seasons (ie SRI and conventional) were averaged to facilitate easy comparisons (see table 13) Moreover the budgets were prepared under three wage-rate scenarios ie zero wage rate or family labor on-going farm wage rate and non-farm wage rate It is interesting to note that contrary to the survey farmers own subjective assessment and reports from different angles the cost of production per unit area for SRI is higher or at least comparable to that of conventional rice production17
Even though SRI reduces or avoids the use of cash inputs such as fertilizer and herbicides the resulting savings can not fully compensate for the additional costs born due to greater labor input for weeding transplanting and organic matter collection and transporting However the costs per unit of paddy output (Rupees per Kilogram) are lower than those of conventional due to significant increases in yield Consequently the estimated profit figures for SRI is almost double that of conventional practice for both seasons But it may be noted that this level ofprofitability is achieved with a lot ofdrudgery
In addition to the reported positive profitability figures table 13 also shows that some farmers experienced loss during both seasons This shows the advantage of budgeting for each farm than for average farm Two inferences may be made First the incidence of loss is higher for Yaa than for Maha season Secondly the incidence of loss among SRI farmers is substantially lower than that for conventional farms irrespective of the season
In Sri Lanka it is usually claimed that the competitiveness of rice sector has been worsen by the relative high wage rate Careful scrutiny of the costs and revenues of paddy production systems under three wage rate regimes presented in the table 13 tempts us to believe this claim
16 Entetprise budgeting technique was preferred to Partial Budgeting because SRI involves a major overhaul of the conventional rice production system Had the changes in the production system been minor partial budgeting would have been the natural choice according to C IMMYT (1988) 17 The costs include both cash and imputed labor and material costs
352
~ shy o-
enterprise following
)r SRI and
system of mparisons ie zero resting to ~ different
that of such as
costs and
than profit
may be
Table 13 Summary Results of the Enterprise budgets IProduction Seasonmiddot Wage rate Gross Total cost Net Costlkg Inciden bull system Revenue (RS) (RS) Revenue (RS) ce of
(Rs) loss SRI Yala Zero 34899 6506 29371 36 1
farm 34899 18907 15992 111 4 Non-farm 34899 24842 10223 150 6
Maha Zero 36720 5291 34575 22 0 farm 36720 20435 16285 87 1 Non-farm 37620 26493 13374 114 2
--_
Conventional Yala Zero 27017 10742 16032 76 9 farm 27017 18600 8417 133 27 Non-farm 27017 22248 4215 15s 29
i Maha Zero 23871 9503 14373 68 0 farm 23871 16381 7490 119 15
I Non-farm 23871 19687 4369 140 22
7 CONCLUSIONS AND IMPLICATIONS
1 The main advantages of SRI include yield increase reduced number of irrigations or irrigation-hours per irrigation and per unit area (ie increase in water productivity) reduced demand for cash inputs improved seed quality and higher milling ratio In addition to these private benefits SRI embodies added societal or environmental benefits due to reductions in the use of environment-unfriendly inputs such as herbicides and fertilizers It is not clear however if the observed on-farm water productivity can be translated into net water-saving at watershed or basin level which is an issue requiring further analyses This can be realized only if the practice is widely adopted and the farmers do not increase acreage
2 The System ofRice Intensification has a short history in Sri Lanka Its adoption process is dynamic in the sense that the adopters may quit the practice for some time and then reuse it when the circumstances allow This is because the practice involves little capital investment during initial adoption decision
3 The main variables influencing the incidence of SRI adoption are (i) location of the farm (ii) the type of farming system (ie irrigated Vs rain-fed farming) (iii) poverty status of the farmer (iv) participation in training programs (v) education status and (vi) the size and demographic structure of the farm family
4 The absence of significant difference in SRI adoption probability between farmers located at the head of irrigation canal and rain-fed farmers and the observed lower probability of SRI adoption among those located at the middle and tail end of irrigation canal underlines the importance of irrigation water supply risk and uncertainty variable in SRI adoption decision Hence contrary to the ideal SRI practice farmers at the middle and tail maintain a water layer on their field as a buffer to offset the risk of irregularity regarding irrigation water arrival This may also be done to reduce weed growth On the other hand the total dependence on rain for paddy cultivation means that the farmers are more cautious in
353
~ -o
investing in conventional yield enhancing cash inputs Therefore SRI which minimizes or avoids the use of such inputs is the logical alternative for rain-fed farmers
Barisshy5 SRI adopters mai nly come from the lowest and the highest poverty terciles of the farming convc
population In other words there is no significant difference in SRI adoption probability (http1between rich and poor farmers But poor farmers are likely to persist with SRI once they practice SRI than the rich farmers Moreover low realized yield during the first Barkeexperiment with SRI is the major factor behind discontinuing the SRI practice Proce
6 The main variables affecting the intensity of adoption of SRI are cattle ownership which Sri Lais a proxy for organic mater availability education status and the size and demographic structure of the farm family Batuv
7 The main problems associated with SRI practice are the demand for skills and high Norm amount of labor for weed control and transplanting non-availability of organic manure ofamiand limited availability of the rotary weeders (ht1JtL
8 The most appropriate domain (target group) for SRI adoption are those farmers a With limited land holdings
Bonlishyb Having bigger family size with high proportion of the family members capable of (htRL
engaging in work c Who are cash constrained d For whom rice constitutes the lions share ofannual income and consumption C~
e With limited alternative employment opportunities manw yTrigf With relative certainty regarding irrigation water supply and
g Practicing rainfed paddy cultivation 9 Generally SRI demands higher amounts labor per unit area (a lot of drudgery is involved) Feder
and induces the active participation of children between 7 and 14 years ofage and women Coun1 However whether this is a significant social disutility is a matter for further scrutiny
Javay issue
Kikuc produ BHaJ ~edil 2001
McDI staas
354
~ -o
lzes or REFERENCES
~rming Barison J (2002) Evaluation of nutrient up take and nutrient use efficiency of SRI and conventional rice cultivation methods in Madagascar ability (httpciifad comelleduSRIlproc 1 ISRI-32pdf) e they
~ first Barker R R Loeve Y H Li and T P Tuong (eds) (2001) Water Saving Irrigation for rice Proceedings of an lnternational Workshop held in Wuhan China 23-25 March 2001 Colombo which Sri Lanka lnternational Water Management lnstitute raphic
Batuwitage GP (2002) Adaptations of the system of rice intensification in Sri Lanka In high Norman Uphoff et al (eds) 2002 Assessment of the system of rice intensification Proceedings anure of and international conference held in Sanya China April 1-4 2002 (httpciifadcomelleduSRJlSRI-Assessmentspdf
Bonlieu F (1999) Summary offindings from thesis research on SRI )Ie of (httpciifad cornell edusribonlieu pdf)
I CIMMYT (1988) From agronomic data to farmer recommendations an economics trammg manual Completely revised edition Mexico City Centro lnternacional de Mejoramiento de Maiz y Trigo (CIMMYT)
ved) Feder G RE Just and DZilberman (1982) Adoption of Agricultural Innovation in Developing
men Countries A survey World Bank Staff Working Papers Number 542
Javaya (Newspaper Published by Sri Lanka Ministry ofAgriculture) JanuaryFebruary 2000 Issue
Kikuchi M R Barker MSamad and P Welingamage (2002) Comparative advantage of rice production in Sri Lanka with special reference to irrigation costs Sombilla M MHossain BHardy (eds) Development in the rice economy Proceedings of the international workshop on medium-and -long term prospects of rice supply and demand in the 21 st Century 3-5 December 2001 Los Banos Philippines International Rice Research Institute 436p
McDonald JF and R A Mofitt (1980) The use of tobit analysis Review ofeconomics and statistics Volume 62 (2) pp318-321
McHugh OV TS Steenhuis J Barison ECM Fernandez and NT Uphoff (2002) Farmer implementation of alternate wet and dry and non-flooded irrigation practices in the system of rice intensification In Water-Wise rice production Bourn BMA HB Hardy PS Bindraban T P Tuong and J K Ladha (eds) Proceedings of the International Workshop on Water-Wise Rice Production 8-11 April Los Banos Philippines lnternational Rice Research Institute
Moser CM and CB Barrett (2002) The system of rice intensification in practice Explaining low farmer adoption and high disadoption in Madagascarln Water-Wise rice production Bourn BMA H B Hardy PS Bindraban T PTuong and JK Ladha (eds) Proceedings of the
355
~ shy Q
International Workshop on Water-Wise Rice Production 8-11 April Los Banos Philippines International Rice Research Institute
Norman Uphoff et al (eds) (2002) Assessment of the system of rice intensification Proceedings ofan international conference held in Sanya China April 1-4 2002 (httpciifadcomelleduSRIISRI-Assessmentspdf)
Rena Perez (2002) Experience in Cuba with the system of rice intensification Norman Uphoff et al (eds)2002 Assessment of the system of rice intensification Proceedings ofan international conference held in Sanya China April 1-4 2002 Aftel (httpciifadcomelleduSRIISRI-Assessmentspdf) appe(
in us Stoop WA Norman Uphoff and Amir Kassam (2002) A review of agricultural research issues indus raised by the system of rice intensification (SRI) from Madagascar opportunities for improving Taiwa farming systems for resource-poor farmers Agricultural Systems 71 (2002) 249-274 positi
positi Tiyagarajan et al (2002) Effects of SRI practices on hybrid rice performance in Tamil Nadu on pat India In Water-Wise rice production Bourn BMA H B Hardy PS Bindraban TPTuong Metho and lK Ladha (eds) Proceedings of the International Workshop on Water-Wise Rice Production the po 8-11 April Los Banos Philippines Losbanos (Philippines) International Rice Research Institute recogn
averagl consen the intI agricul1 agricult product fields re KeyWl Method
356
-o~

--
1 the main SRI in small plots of about 02 ha on average (Batuwitage 20025 The specific objectives of the should be study were
1 To assess the dynamics and determinants of adoption of the System ofRice Intensification 2 To evaluate the farm-level productivity economics resources conservation and water saving
tbly in the impacts of the System of Rice Intensification adoption should be To assess the poverty outreach of SRI adoption and rol is best To derive research extension and policy implications mting and middote This is The paper is organized as follows The next section deals with methodology Section 3 provides a lone often brief site description Section 4 and 5 presents the pattern of adoption and determinants of
adoption and dis-adoption in the two study areas Section 6 compares the benefits and costs of SRI with conventional practices Section 7 shows the poverty impact of SRI The final section
ned rather presents the conclusions and implications ~ssibilities
d dry for flood and 2 METHODOLOGY AND DATA ~tting and
Data for this paper were obtained from surveys in two localities of Sri Lanka The data generation process followed two inter-related steps First focus group interviews and key informant surveys were undertaken at various times during September and November of 2002 A team of agricultural economists led by a principal researcher from the International Water Management
scar SRI Institute made visits to farmers fields the National rice breeding station an ecological farming )fiers and center (a training center undertaking farmer training on SRI) Agriculture Development Authority ews with branch offices and Ceylon Electricity Board (CEB) to assess the views of various stakeholders estioning regarding the prospects of SRI in Sri Lanka ~n setup eriments Second the views and perceptions of the stakeholders obtained in the first step were distilled into )s either specific research questions and hypotheses for empirical testing using structured (formal) he yield questionnaire survey A questionnaire was developed and pre-tested for administration to a levels as randomly selected set of SRI and non-SRI farmers The structured questionnaire survey was mgs are implemented in JanuaryFebruary 2003 by the research team with the help of trained enumerators esults of rom one 21 Operational Dermition of SRI Adoption showed
In the present case SRI adopters (or SRI farmers) are those farmers who tried SRI at least once ilopment during the last five years (1998 to 2002) on whole or part of their paddy fields Thus the and the definition includes partial adopters and those farmers who have tried SRI and then abandoned it for the or disadopters Disadopters are those SRI adopters who have discontinued practicing or those nited to who have not practiced SRI during the last Yala and A-faha seasons The non-adopters (or NonshyIllentingmiddot SRI farmers) are those who have not practiced SRI during the above reference period6
SRI adoption intensity refers to the proportion of farmers total paddy fields allotted to the SRI practicering the
Lcticing
5 Comprehensive descriptions of the SRl practices were published in the JanuaryFebruary 2000 issue of Javaya a orts for newspaper published by the Ministry of Agriculture
6 Henceforth adopters and SRl farmers and Non-adopters and Non-SRl farmers are used interchangeably
333
- ~
(9- -t)
v Ql~ -~
~ J) 0
22 Sampling Design and Procedure
Two stage stratified random sampling design was used to select 120 farmers in total (ie 60 each from the two study locations and 30 each from SRI and Non-SRI farmers per location) The two study locations were purposively selected based on the prevalence of SRI farmers for which the sampling frame was solicited from Ministry of Agriculture office Colombo In Ratnapura (Kalthota Irrigation Scheme) according to the CEB there were 66 farmers practicing SRI According to a register of SRI farmers compiled by the Ministry of Agriculture 45 percent ofall practicing SRI farmers in the country were in Kurunegala district
23 Analytical Framework
The data generated at the household and field levels were subjected to descriptive analyses to characterize the sample farmers rice crop management practices Multivariate statistical analyses such as logit and tobit regression models were used to assess factors influencing the incidence and intensity of adoption and disadoption of SRI Enterprise budgeting technique was used to assess the economics of SRI vis avis conventional system of rice production in the two locations (Figure 1) for yala and maha seasons ofthe year 2002
3 DESCRJPTION OF THE STUDY AREAS
31 Kaltota Irrigation System Kaltota is situated in Ratnapura district and in the Balangoda sub-district The district is predominantly a Wet Zone district while southeastern parts of it fall within the intermediate and dry zones Agricultural activities in Ratnapura are mainly based on plantation crops and mixed home-gardens generating spices Kaltota irrigation system is a river diversion system in Walawe River one of the major rivers in the country The system irrigates 1000 ha of lowland through two conveyance channels situated in either side of the river The left bank irrigates 128 ha of paddy lands in three tracts while the right bank canal irrigates 728 ha situated in seven tracts one of which is the ancient settlement where farmers have large land holdings A majority of the command area is cultivated in both seasons Amount of water available at the system has reduced since the construction of a reservoir for electricity generation above the water diversion point of the system As Kaltota farmers were historical users of water their right to use water from the river is recognized by the power authorities Farmers are eligible for a special irrigation release calculated on the basis ofhistorical water use A leak from the reservoir also increases the amount of water available at the diversion However CEB wants to minimize the amount of water released for non-electricity generating uses as this result in revenue loss Hence programs to reduce the demand for irrigation releases were introduced to farmers SRI appeared to be a potential water saver so CEB took steps in promoting SRI among farmers in the irrigation system
32 Kurunegala district
Kurunegala district is situated in the northwestern part of Sri Lanka It is the third largest district in terms of land area About 75 percent of the area of the district falls within the Intermediate Zone while its northern part fall within the Dry Zone and southern part in the Wet Zone Coconut cultivation in plantations as well as in small-holdings and paddy cultivation under minor irrigation are characteristics of the district In the southernmost parts of the district ginger is
334
~
grown as an annual crop mainly in paddy lands Kurunegala is a major paddy-producing area in 60 each the country During 2000 to 2002 the district accounted on average for 106 percent of the fhe two national rough rice production The district has 12621 ha of major irrigation under 15 irrigation hich the schemes and 33804 ha under 4188 minor tanks and 657 minor river diversion schemes About ltnapura 29028 ha of paddy land are rainfed 19 SRI nt ofall The Ministry of SAMURDIll responsible for poverty alleviation took a special interest in
promoting SRI through farmer training programs These programs were more effective in Kurunegala district mainly due to its proximity to the Nature Farming Center a training and research center on ecological farming and initiative by one regional farmer federation to produce and distribute hand weeders an essential tool for practicing SRI lyses to
lIlalyses cidence used to ICations
trict is lte and mixed in the
)w1and es 128 1 tracts of the
Kluced lint of im the elease DOunt water ms to bea
stem
strict diate onut linor er is
335
~ - (9
-t) gtgt e -1i- v 0
nshy-(b~
0
N
A o PrinGipal City
o Study Location
~ Zone Boundary
orvzbullbullbull
Colombo WetZobullbull
o
20 milesFigure 1 Study Locations
Locations of Study in Rathnapura District
336
amp
))~ ~ v -0
(1 -shyIc
4 THE SPATIAL AND TEMPORAL DYNAMICS OF SRI ADOPTION IN SRI LANKA
41 Adoption trends
System of Rice Intensification has only five years of history in Sri Lanka Only one fanner has reported to have first time learned about SRI in 1998 The majority of the SRI sample fanners in Kurunegala have learned about it in the year 2000 SRI sample fanners from Kalthota lagged behind Kurunegala farmers by about 2 years in awareness Even though about 117 percent of the SRI sample farmers are aware of SRI during 199899 actual practice commenced first in Kurunegala in the year 2000 The temporal dynamics of SRI awareness among adopters and nonshyadopters are quite similar (see Figures 2 and 3)
25 sect 20 ~
Cia 15 rJ 0 10 Q)
r
sect 5 Z 0
-----~---
--Kalthotar=~------krunegaj 1
Total
1998 1999 2000 2001 2002
Year
Figure 2 Year the fanners first learned about SRI
30 ----~--~~~--~
~
sect 25 ~ 20middot Kalthota~ r 0 15 Kurunegalar
10 Total0 ltU
8 5 ~
0
1999 2000 2001 2002
Year
Figure 3 Year ofawareness of SRI fanners
The non-SRI sample farmers who were aware of SRI but have not shown interest to practice it were asked why they do not intend to practice The response or reasons they gave are summarized in Table 1 Consistent with the practicing farmers observations the non-SRI farmers reported that the major obstacle to SRI adoption is the high labor demand and the tedious nature of the associated management practices such as transplanting and manual weeding
337
))~ 6)
-J 0 (~ shy-- (
~
Table 1 Reasons for unfavorable attitude of Non SRI farmers towards SRI Reasons Locations ()
Kalthota Kurunegala Total Requires more labor and effort 682 381 535 Climate is not good for SRI cultivations 45 00 23 Lack of necessary inputs 45 48 47 Water shortage and lack of suitable field 48136 93 Land tenure problem 45 00 23 Difficulties ofgetting organic fertilizer 45 00 23 Difficult to do management practices 00 238 116 No benefit 00 95 47 Field is located very far from home 00 48 23 Other SRI farmers failed 00 95 47 Lack of proper training 00 48 23 N 22 21 43
42 Farmers Perceptions of the Merits and Demerits of SRI
The advantages and disadvantages of SRI were elicited from the practicing farmers and the results are summarized in Tables 2 and 3 The most significant merits of SRI as compared to conventional system are (1) improved quantity and quality of paddy yield (2) savings in irrigation water and seed (3) reduced demand for external cash inputs like inorganic fertilizers and herbicides and (4) enhanced tolerance to biotic (eg diseases and insects) and abiotic stresses (eg lodging and low moisture stress) These views are quite consistent with the findings reported based on on-station and on-farm experimentation with SRI in some Asian African and Latin American countries
Table 2 Advantages of SRI relative to Conventional-farmers assessment No Criteria Percentreportin~yes N 1 More yield 830 53 2 Saves water 897 58 3 Saves seed 1000 60 4 More milling output 774 53 5 Less disease and pest attack 881 59 6 Less lodging of rice 914 58 7 Reduced demand for herbicide 911 60 8 Reduced demand for inorganic fertilizer 862 58 9 Less labor for harvesting 796 54 10 Less labor for trans~lanti~ 780 59 11 More tillers 983 59 12 Improves seed quality 909 55 13 Reduces input costs 850 60 14 Less labor for bund cleaning and construction 763 59 15 Environment friendlY 50 60
338
~ ~ ~~ -
(9
0 0 (
---- 11
---
Table 3 Disadvantages of SRI relative to conventional-farmers assessment No Criteria Percent respondin2 yes N 1 Weed control problem 60600 2 Transplanting is difficult 367 60 3 60SRI transplanting requires special skill 250 4 Requires skilled labor for management 317 60 5 Demand more labor input 500 60 6 60Requires additional workdays 650 7 59Requires more effort 746 8 57Organic matter not available 579 9 57Transporting organic matter is problematic 509
6010 Problems ofMW handling and availability 767 6011 Mice attack due to unclean bunds 17 5812 SRI requires well drained soils 690
13 559 59Does not work on flooded fields
The most important demerits of SRI relate to its extremely high demand for labor problems of weed control and organic matter availability 77 percent of the practicing farmers complain that the the rotary weeder recommended for use in the SRI system is not readily available and even ifIto available not easy to handle im
rers sses
S FACTORS INFLUENCING ADOPTION AND DISADOPTIONngs and
Sl Determinants of SRI Adoption
The two most popular functional forms used for dichotomous discrete choice adoption models are the logit and the prohit models The advantage of these models is that the probabilities are bounded between 0 and 1 The logit model is selected here The odds of SRI adoption are defmed as the ratio of the probability of adoption (pi) to the probability of non-adoption (I-Pi)
Specifically the model is
The Xs are the hypothesised explanatory variables as defined in table 4 The variables hypothesized to influence adoption of SRI were derived from own informal assessment and literature reviews (Moser and Barrett 2002 McHugh et aI 2002) Since these variables are unlikely to operate independently a variable-by-variable analysis of relationships with farmers adoption of SRI is likely to be misleading (Feder et aI 1985) Hence logit analysis which uses a number of independent variables has been used to predict the probability offarmers SRI adoption
339
e~ p~ -
amp
0v (1shyA
--
ized to influence the
POVGR(X12)
LOCFA(X13)
LABAV(XI4)
The logistic regression model fitted to analyze the effect of these variables on the adoption decisions offarmers is presented in the table 5 Dependency ratio (DEPRA) age of the household head (AGEHH) and proportion of annual income from non-farm activities (PRNIN) reduces the likelihood of a farmer being SRI adopter By contrast family size (F AMIS) years of schooling (YSCHH) and participation in agricultural training programs (NFTPA) significantly increase the probability of a farmer being SRI adopter For instance as the family size of the farmer increases by a unit the likelihood of being SRI farmer increases by 145 times (see the exp (8) for variable F AMIS) The proportion of children between 7 and 14 increases the likelihood of SRI adoptioIl This is consistent with our field observation-- children were actively participating in the transplanting of SRI fields 9 Moreover studies in other countries showed that women and
7 Five organizations were identified and farmers were asked to confum whether they are ordinary members or leaders of these organizations in the past and at present Thus each farmer can score a minimum of zero (meaning not a member of any organization in the past and at present) and a maximum of 20 (meaning the farmer is a member and flays leadership role in all organizations in the past and at present ie 5x2x2)
This index was constructed from a set of questions designed to elicit farmers opinion regarding labor supply in his or her village or community 9 Whether this may be considered as a possible negative social effect of SRl or not depends on the situation of the without SRl scenario regarding children and women participation in the labor force in any particular locality
340
childre (Rena
Locatic irrigatt Thesemiddot that the Whyal the ob~ differel soil dl toleran availab investn which enhanc additio soil an the cha abunda family
Themlt irrigati4 middle mayse import maybe along t ends ~ certain succes water I field d
AnOthl buffalc signifi
~ gtl P~ -
amp
0J M
children are particularly suited for handling the transplanting of small and delicate rice seedlings (Rena Pervez 2002)
Location of the farm along the irrigation canal and generally the type of farming system (ie irrigated or rainfed farming system) had remarkable influence on the adoption pattern of SRI These important patterns are revealed by the variables LOCFA and FYLWS The model showed that the probability of adoption of SRI among irrigated farms is lower than that of rainfed farms Why are rainfed farmers more likely to adopt SRI than irrigated farmers This might be due to (1) the observed production risk differential among the two types of farming systems (2) the wage difference between rainfed and irrigated areas and (3) Increased water holding capacity of the soil due to improvement in organic matter content and hence enhanced low moisture stress tolerance of the rice crop The rainfed rice farming faces risk and uncertainty regarding the availability and distribution of rainfall Therefore rainfed paddy fanners are cautious about investments in cash inputs such as fertilizer herbicides and pesticides Hence for them SRI which decreases the demand for high-risk cash inputs is an ideal alternative rice productivityshyenhancing strategy Moreover as elaborated in the section 51 of this paper SRI involves the addition of huge amount of organic fertilizer which improves the water-holding capacity of the soil and hence easing the risk of low-moisture stress On the other hand high labor input forms the characteristic feature of SRI practice thereby making it attractive in those areas were there is abundant labor with relative lower wages The positive sign of labor availability (LABAV) and family size (FAMIS) variables further corroborates this argument
on )ld he ng he es lie
The model shows that there is no significant difference between farmers located at the head of the irrigation canal and rain-fed farmers regarding SRI adoption But the probability of adoption of middle and tail farmers is sign~ficantly lower than that for rainfed farmers At the first glance this may seem to contradict the widely held view that SRI saves water But this finding underlines the importance of irrigation water supply uncertainty In the advent of supply uncertainty farmers may be reluctant not to flood their paddy fields when water is available Why are farmers located along the head of the canal more likely to adopt SRI than those situated in the middle and tail ends This may be due to the fact that at least for irrigated farmers there must be some degree of certainty regarding the availability of irrigation water (or control over water supply) for successful adoption of SRI (McHugh et aI 2002) Farmers at the middle and the tail maintain a water layer on their fields as buffer in case irrigation water arrive at large intervals Keeping the field drained is very risky if they have no control over water
Another important variable having almost significant positive impact on SRI adoption is cattle or buffalo ownership through its effect on manure availability The model also shows that there is no significant difference in SRI adoption between poor and rich farmers
or ot ld
341
~ -a-
--
Table 5 Detenninants ofSRI adoption -Results oflogit regression analysis Variable Code B SE Exo(8
CONSTANT -23134 29217 -Dependency Ratio (DEPRA) -00454 00277 0955 Proportion ofChildren in the Family(PCIDL) 00462 00285 1047 Family Size (FAMIS) I 03095 01791 1362 Age ofthe Household Head (AGEHH) -00509 00359 0950 Years ofSchooling of the Household HeadjYSCHH) 01645 00861 1178 Number of Training Programs Attended (NFTPA) Number ofExtension Contact7NEXCY)
~~----
01760 00343
00901 05146 ~~i
Proprotion ofIncome from Rice (PRICEj 00048 00117 1004 Proportion ofNon-fann Income (pRNlN) -00039 00124 0996 Incidence ofYield Loss due to Low Water Stress (FYLWS) 00575 01509 1059 An Index of Social amp Political Capital (POSOLl 00327 00821 1033 Poverty Group (poor) 00464 06746 1047 Poverty Group (Middle) -11770 06857 0308 Povert Group (Rich)-reference cateSory Location of the Fann or Field (Head) -02209 09935 0801 Location ofthe Fann or Field (Middle) -15452 09161 0213 I Location ofthe Fann or Field (Tail) -19079 09309 0l48 Location ofthe Fann or Field (Rain fed J-reference category An Index ofLabour Availability Perception (LABA V) 01334 01438 1142 Number of Cattle Owned (CATTL) 05139 I 03380 1671 Notes significant at 10 probability level significant at 5probability level -2 Log Likelihood 10898 Model Chi-square = 46284 (df= 18p=00003) Cox and Snell Rl=038511
Nagelkerke K=0513 Percent correctly predicted = 7679 N=112
S2 Intensity of Adoption of SRI
The intensity of adoption once the fanner has decided to practice SRI was evaluated using the proPQrtion of SRI area in the total paddy cultivated during maha and yala seasons and the proportion of fanners who allotted 100 percent of their paddy field to SRI These are shown in figures 4 and 5 The proportion of paddy area allotted to SRI ranges from about 39 percent in Kalthota to about 61 percent in Kurunegala during Yala season Some fanners have also allotted their total rice field to SRI The proportion of such fanners ranges from as low as 10 percent in Kalthota to as high as 50 percent in Kurunegala (see figure 5) The proportion of SRI farmers with 100 percent of their paddy fields SRI is higher during Yaa than during Maha in Kurunegala
II In OLS models the R2 statistic represents the proportion of variability in the dependent variable that can be explained by the independent variables For logit regression model an easily interpretable measure of the strength of the relationship between the dependent variable and the independent variables is not available Cox and SneD and Nagelkerke Rl are attempts to imitate the interpretation ofR2 in OLS regression They are attempts to measure strength of associations
342
~ shyo-
---
Exp(B ~17 -77 0955 85 1047 91 1362 59 0950 61 1178 01 1192 6 1034 17 1004 ~4 0996 9 1059 1 1033 6 1047 7 0308
5 0801 I 0213 ~ 0148
~ 1142 ) 1671
ISing the and the hown in rcent in allotted rcent in fanners negala
gth of and
This is in line with the presumption that Yala season is more water scarce than Maha season and one of the advantages of SRI is to save water as has been elaborated in the previous sections
70
60
ttl 50
~ 40 ~
~ 30
~ 20
10
0
jYala I l__ M~
Kalthota Kurunegala
Locations
Figure 4 Proportion ofRice area allotted to SRI in 2002
it 60 T-~--~-------------- rJ)
~
8 50
~ 40 +
~ 30
~ E 20 f it 10 rJ)
f 0
Kalthota Kurunegala
Locations
Figure 5 Proportion of SRI fanners who allotted 100 percent of paddy area to SRI in 2002
In the previous section detenninants of SRI adoption decision were assessed However the extent or intensity of adoption once the adoption decision is made is important infonnation for research extension and policy This issue was evaluated using tobit regression model which allows the estimation of the likelihood ofadoption as well as the extent or intensity of adoption It is preferable to logit adoption model when the decision to adopt also involves simultaneously a choice regarding the intensity of adoption as it does with SRI practice The model can be specified as
where Yi is a latent variable representing the use of the SRI X is a vector of independent variables described in table 4 13 is a vector of unknown parameters and Ei is a disturbance
343
~ -oshy
assumed to be independently and normally distributed with zero mean and constant variance~ and i = ]2 n (n is the number of sample households)
Denoting yi (the proportion of SRI area in the total cultivated rice area) as the observed dependent (censored) variable
The proportion of paddy area allotted to SRI was regressed against various factors hypothesized to influence SRI adoption A common mistake made when interpreting tobit coefficients is to treat them as effects of the independent variable for cases above the limit To avoid this drawback the tobit coefficients were decomposed following McDonald and Moffitt (1980) and the results are presented in table 6
1n the incidence of adoption model (ie logit model) discussed in the previous section informational variables such as participation in training program and extension contact poverty status location of the farm the farming system (ie irrigated vs rainfed farming) and level of education were important variables in predicting SRI adoption 1n the tobit model which estimates both the incidence and intensity of adoption the informational variables have lost their explanatory power 1nstead variables related to labor availability (DEPRA and PCHlL) and organic matter availability (CATTL) are more relevant
Table 6 also shows the decomposition of the total elasticity of the variables12 The decomposition
consists of two components the probability of adopting in the first place and the potential increase in the area allotted to SRI once the decision to adopt has been made For example the total elasticity value for the years of schooling (YSCHH) is 0974 meaning that a 10 percent increase in the years of schooling is expected to result in about 97 percent in adoption and use intensity of the SRI practice The probability of adoption will increase by 73 percent while the intensity of adoption will increase by 24 percent The other variables in the table can be interpreted in an analogous manner
12 An elasticity of adoption measures the responsiveness to a particular variable and is equal to the relative change in adoption of a technology with respect to a small relative change in a given variable from current levels The elasticities obtained from the tobit model take into account that a change in the explanatory variable will simultaneously affect the number of SRI adopters and the proportion of acreage under SRI
344
~ shyo--
---
~e and
Table ~ The det~rminants ofthe extent or intensity of adoption of SRI- results of probit
endent tshynt
~sized is to
back lsults
tion verty elof rhich their and
tion 53 Determinants of SRI Disadoption ltial
the Disadoption is one important aspect which have not been given due consideration in past ent adoption research Information on the reasons why certain group of farmers failed to stick to the use technology recommended for use is of crucial importance for researchers extension workers and the policy makers For instance research may draw upon the drawbacks of the technology and be improve upon those drawbacks to increase the chance of acceptability and wider dissemination of
the technology among the intended beneficiaries
In light of this fact a logit model was fitted to the data on SRI farmers Most of the variables in the SRI adoption modeling of section 51 were also included here The additional variables incorporated in the current model are (1) An index of positive perception of farmers towards SRI (POSIP) constructed based on the
reported advantages of SRI vis-a-vis the conventional system of rice production presented in table 2 The value of the variable ranges from 0 to 15 where 0 indicates lowest positive attitude of the SRI practitioners towards SRI and 15 shows the strongest positive attitude towards SRI This variable is expected to have a negative relationship with disadoption since those farmers who had positive attitude towards SRI are expected to continue with SRI
(2) An index of negative perception of farmers towards SRI (NEGAP) constructed based on the reported disadvantages of SRI vis-a-vis conventional system of rice production presented in table 3 The value of the variable ranges from 0 to 13 where 0 indicates lowest negative attitude of the SRI practitioners towards SRI and 13 shows the strongest negative attitude
345
gt)~ 6)
-0~
~ 0 rt
towards SRI This variable is expected to have a positive relationship with disadoption since those fanners who had a negative attitude towards SRI are expected to cease practicing SRI
(3) Average realized SRI yield (kgacre) for SRI farmers while they were practicing We expect that those farmers who had better paddy yield during their first season(s) of experimenting with SRI will continue with SRI Contrarily a low level of realized yield would lead to dis adoption
(4) The other important variable is the perception of farmers regarding the cost of capital or availability of cash (CASHR) This variable is particularly important in the sense that one of the cases for promoting SRI is due to its lesser reliance on external inputs hence lesser requirement for cash or capital The value for this variable ranges from 1 to 5 where 1 indicates severe cash constraint and 5 indicates the absence of cash constraint We expect this variable to have positive relationship with disadoption
T bl 7 Da e etermmants 0 Isa optIon 0 fSRIR- esu ts 0 I fl Oglt regressIon analysIs Variable p INTERCEPT 5935 An Index of Degree ofPositive Perception (pOSIP) -0262 An Index ofDegree ofNegative Perception (NEGAP) 0064 Average Realized Yield (AVERY) -0002 Episodes ofRice Yield Loss due to Water Stress (FRRYL) 0310 Labor Availability (LABA V) -0424 Proportion of Children in the Family (PCIDL) -0032 Poverty Group (poor) -3021 Poverty Group (Middle) -2504 Number ofExtension Contact (NEXCY) -0314 Dependency Ratio (DEPRA) 0052 Years ofSchooling of the Household Head (YSCHH) -0065 Proprotion of Income from Rice (PRICE) -0016 An Index ofLabor Availability Perception (CASHR) 0766 Note means the coefficIent IS slgmficant at 5 slgnrficance level -2 Log likelihood = 3743 Cox and Snell R2 = 048 Nagelkerke k = 066 Percent correctly predicted = 867
SE 5565 0300 0231 0001 0451 0312 0062 1505 1618 0215 0057 0187 0020 0591
exp(p) 377943
0769 1066 0998 1364 0655 0968 0049 0082 0730 1053 0937 0985 2151
All of the variables included in the disadoption model had the expected signs (table 7) However only average realized yield during the first season(s) of practicing SRI (AVERY) and poverty status (POYGR) variables had statistically significant effect on disadoption Hence the success or failure of farmers during initial adoption process determines the acceptance and the pace of dissemination of a technology In the adoption model (table 5) there is no significant difference in the probability of adoption of SRI between poor and rich farmers However the probability of disadoption among poor farmers is significantly lower than that among rich farmers This implies that once the poor farmers adopt SRI they have higher probability of continuing with it than rich farmers
346
~ shyo -
---
I since SRI
r y r f
f
Among the perception variables farmers perceived cash availability (CASHR) labor availability (LABAV) frequency of rice yield loss due to water shortage (FRRYL) and an index of farmers positive attitude towards SRI (POSID) respectively had strong coefficients However these were not statistically significant
6 THE MICROECONOMICS OF SRI
61 Rice agronomy and irrigation water management
Fanners agronomic practices level of cash input utilization and irrigation water management differentiated by system of production (SRI vs conventional) and seasons (wet-maha and dryshyyala) are shown in table 8 Expectedly there is substantial difference between the two systems of rice production regarding planting method fertility management and weed control practices For instance an average SRI-farmer transplants one 8-days-old rice seedling per hill on a square grid of about 23 by 23 cm While most conventional fields were planted by way of broadcasting few conventional farmers have practiced transplanting However the SRI transplanting differs from the conventional transplanting in many ways The conventional farmers planted on average four IS-days-old rice seedlings in a clump per hill on a square grid of 15 by 15 cm which is narrower than that for SRI
Concerning soil fertility management significant differences are noted between the two systems Generally SRI farmers used lesser doses of inorganic and higher doses of organic fertilizer per unit area as compared to conventional farmers Moreover a considerable number of SRI farmers abandoned altogether the use of inorganic fertilizers instead they put a lot of organic fertilizers The main sources of organic fertilizers include cow dung tree leaves straw poultry manure compost and rice bran
Weed control method is another important aspect differentiating the two systems of production SRI farmers use herbicides rarely instead they make use of a mechanical weeder andor hand weeding The conventional farmers rely heavily on herbicides and they flood their paddy fields with water as a means of weed control It is important to flood the field at the correct stage
One of the main advantages of SRI is its water saving with little or no reductions in the paddy yield (Thiyagarajan et aI 2002) We attempted to have an indirect and rough idea of the magnitude of on-farm or field-level water savings through farmer estimates of number of irrigation and hours of irrigation per unit area13
On average number of irrigations and hours of irrigation per unit area of SRI-fields are respectively about 24 percent and 23 percent lesser than the conventional paddy fields However the difference between SRI and conventional regarding hours of irrigation is not statistically significant Consistent to our a priori expectations the per hectare hours of irrigation (for both SRI and Conventional fields) during yala season is greater
13 F arrners were asked the number of irrigation done for each rice field they owned during Yala and Aaha seasons Moreover they were asked to give approximate hours elapsed during successive irrigation Then the number of irrigations was multiplied by the hours elapsed and divided by the area of the field to give an estimate of hours of irrigation per unit area We admit that for more conclusive results an exact field-level measurement needs to be done preferably for a number offarrners
347
~~ 6)
a - ) v 0 rrshy-
than that of Maha season This is because Yala season is relatively water scarce as compared to Maha season (see figure 7)
4~~----------------------------~
400 3~
~ 300 2~ ~ 200
~ l~ 100 ~
o
~ ~ ~ ~ ~ sect ~ g ~ ~ ~ ~ Mon1hs
~-WbTZa] bull DRY ZONE --shy
Figure 7Monthly rain fall distribution for the Dry and Wet Zones of Sri Lanka (1961-1990)
Table 8 also clearly indicates that generally SRI fields demand higher amount of human labor (about 3 times more) This arises from planting (about 37 man-days per ha) weeding (about 31 man-days per hal bund construction and cleaning (about 41 man-days per hal and organic fertilizer collection and transportation (126 man days per hal The corresponding figures for conventional fields are 8l man-days for planting (broadcasting) 16 man-days for weeding 114 man-days for bund construction and cleaning and 73 man-days per ha for organic matter collection and transportation The amount of bund construction and cleaning labor for SRI is significantly lower than that for conventional fields This is because the SRI farmers were advised not to clean bunds in order to harbor beneficial organisms as an integrated pest management strategy
348
g l
()
g e 8t ~ e pound VI bullell oJ
1 1
0
~ ~ shy--sect bull
~ ))
=~ --(9
0 (~
- ----
shybl
~
(
(0
til
0
~1
0 c
P
~
II g
~ t
amp
e w
g K
G
_ _
I
n~
_
I
8
Tab
le 8
In
T
b -
f
d [~-~
Pra
ctic
es o
r In
puts
SR
I C
onve
ntio
nal
Yal
a M
aha
Yal
a
~and
M
ean
SD
N
Mea
n SD
N
M
ean
SD
N
Mea
n T
ract
or h
ours
per
ha
26
232
32
24
18
7
32
28
183
12
9 28
pr
epar
atio
n B
ullo
ck h
ours
per
ha
24
438
32
17
35
0
32
19
475
12
9 17
P
lant
ing
Tra
nspl
anti
ng h
ours
per
ha
244
152
32
352
262
32
114
144
37
271
Bro
adca
stin
g ho
urs
per h
a
-
--
-67
8
420
8
7
63
Nw
nber
ofs
eedl
ings
per
hill
1
1 0
3 32
1
4 0
7 32
4
0 1
2 35
3
7 A
ge o
fsee
dlin
gs in
day
s 7
6 1
9 32
8
4 2
7 32
18
3
5 3
8
185
S
paci
ng b
etw
een
plan
ts in
inch
es
95
13
31
94
13
32
59
15
19
59
Spa
cing
bet
wee
n ro
ws
in i
nche
s 9
7 1
2 32
9
6 1
1 32
6
0 1
6 19
6
2 S
eed
rate
kg
per h
a 14
10
0
32
17
12
32
117
38
11
2 11
4 F
erti
liza
tion
U
reap
erh
a 77
73
0
32
78
804
32
14
1 86
2
128
133
(Ino
rgan
ic)
TD
Mk
g p
erh
a 76
13
05
32
516
78
2
32
97
800
12
8 96
N
PK
kg
per
ha
57
105
6 32
45
74
1
32
104
718
12
8 10
0 T
SP
kg
per
ha
-
-
-
13
120
8 12
8 4
f ~~~
MO
P k
g pe
r ha
--
--
--
03
33
I 12
8 0
5 F
erti
liza
tion
C
ow d
ung
in k
g p
er h
a 20
24
3066
32
14
22
2541
32
15
3 61
78
129
152
(Org
anic
) T
ree
leav
es in
kg
per h
a 10
13
1443
32
73
3 25
133
32
24
7 16
200
129
131
Str
aw i
n kg
per
ha
951
1900
4
32
261
799
0 3
2
170
706
4 12
9 28
7 P
oult
ry m
anur
e in
kg
per h
a 73
25
85
32
39
149
6 32
31
34
95
128
75
Com
post
in k
g pe
r ha
62
349
5 32
23
13
1 3
2
--
--
Ric
e br
an i
n kg
per
ha
23
945
32
8
437
32
-
--
Wee
ding
H
erbi
cide
s li
ter
per
ha
015
0
87
32
008
0
31
32
2
29
325
12
9 2
14
Hou
rs o
fMec
hani
cal
Wee
ding
per
ha
283
281
32
213
260
32
3
233
12
7 2
Han
d W
eedi
ng H
ours
per
ha
69
934
32
57
90
6
32
4
217
12
9 15
H
ours
ofb
un
d c
onst
ruct
ion
and
clea
ning
per
ha
28
48
0
32
38
51
32
8
8
862
12
9 94
Ir
riga
tion
M
ean
Num
ber o
fIrr
igat
ion
24
179
24
22
17
2
25
32
259
10
3 29
H
ours
of i
rrig
atio
n pe
r ha
1942
24
25
21
1720
21
16
23
25
89
40
38
97
2154
H
arve
stin
g P
er h
a ho
urs
ofh
arve
stin
g 32
8 26
62
31
326
376
7 13
35
5 25
46
I 11
5 26
5
Mah
a SD
18
9
380
18
10
444
0
9 3
9 1
3 1
5 38
0
815
75
6
749
19
9
43
594
2 51
02
1022
6
659
8
~~
-3
07
175
0 54
3
100
3 25
8
2993
18
17
N1 (
145
145
38
106
i~
38
23
23
132
147
147
147
147
147
14
5 I
145
I
143
I
145
-- 144
145
145
144
III
103
84
lJ
j
0 14
N r
efer
s to
the
num
ber
off
ield
s S
ince
mos
t oft
he f
arm
ers
had
mor
e th
an o
ne c
onve
ntio
nal r
ice
fiel
ds t
he n
umbe
r ofs
ampl
e ho
useh
olds
and
the
num
ber o
f fi
elds
may
var
y A
ll o
fthe
SR
I fa
rmer
s ha
d on
ly o
ne S
RI
field
M
oreo
ver
not
all
oft
he o
rigi
na16
0 S
RI
sam
ple
farm
ers
had
prac
tice
d S
RI
duri
ng 2
002
---
62 Yield Comparisons
The mean paddy yields obtained during the last three years differentiated by the system of production and seasons are listed in table 9 The mean SRI yield even though not as dmmatic as figures reported from many sources is about 44 percent more than that for the conventional method (F value = 474 P=0031) The reported conventional yields are well within the range of figures estimated by Sri Lanka Department of Census and Statistics The Departments estimate of paddy yields for the country lies between 25 and 41 t per hectare depending on the type of farming system (ie rainfed or irrigated rice farming) and the type of irrigation scheme (Kikuchi et aI 2002)
SRI is fertili~
contin fertili2 the co Interes or con and UI respon trend)
T bl e 9 Ri f management (Kgh) level d a ceyleIdsunder SRI and conventlOna system 0 a in the differel
Year Sri Conventional yield increase Yala Maha Mean Yala Maha Mean
2000 4097 6236 5488 3635 3644 3641 507 2001 5056 5327 5215 3516 3749 3633 435 2002 5737 5977 5811 4189 3832 4041 438 Mean 5299 5763 5524 3910 3757 3836 440
The set fertilizeuro the SUC4
However the yields reported in table 9 above conceal the effects of location and adoption15status The highest paddy yield (81 t ha) was recorded for SRI in Kalthota area during Maha
season for adopter group while the lowest (21 tha) was recorded for dis adopters during Yala season in Kurunegala (Table 10) Generally disadopters experienced the lowest paddy yield during the first year of adoption forcing them to discontinue the SRI pmctice The disadoption model of Section 53 also corroborates this fact Location-wise the yields recorded for Kalthota area are significantly better than those recorded for Kurunegala farmers irrespective ofthe system of production From table 10 one can also infer that the prospect of harvesting better paddy yield is higher for the Maha season than the Yala season which is in line with the usual expectation
Table 10 Paddy yield per acre by adoption status season year and location (kgha Location Year SRI Conventional
Ado ters Disado ters Ado tefs Disadopters Yala Maha Yala Maha Yala Maha Yala Maha
Kurunegala 2000 5726 7217 2102 4668 3501 3063 3769 4372 -
2001 6011 5499 4100 4628 4040 3628 2942 3851 2002 5619 5977 NA NA 3071 3702 3863 3911 Mean 5785 6231 3101 4648 3537 3464 3524 4045
Kalthota 2000 NA NA NA NA NA NA NA NA 2001 NA 8154 NA NA 6795 NA NA NA 2002 5806 NA NA NA 4900 NA NA NA Mean 5806 8154 NA NA 5848 NA NA NA
NA means not applicable
15 The original SRI sample farmers who have not practiced SRI during Yaa or Maha seasons of the year 2002 are regarded as disadopters By these criteria 20 of the 60 SRI sample farmers are disadopters
350
differet1 the orgc ofnutril
Table 1 Inorga
o oto 100 100 to 2 200ampa
--ornrutn F value The in
Table 1 Inorga
0 otol0( 100 to 200amp Grand F valueuro The 11
~ shyo-
---
- --
SRI is usually considered as a practice that gives substantial yield without the use of inorganic fertilizer (Barison 2002) Despite the advice not to use inorganic fertilizer some farmers have
tic as continued to use it with varying intensities The SRI farmers level of utilization of inorganictional fertilizer has been arbitrarily classified into four strata starting with zero level of utilization and ge of the corresponding paddy yields recorded for each stratum are reported are shown in Table 11
Interestingly the SRI farmers who did not apply any form of inorganic fertilizer recorded better or comparable yields to those farmers who applied up to and above 200 kg of fertilizer in Yala and up to 200 kg during Maha Another important observation is that while the paddy yield response to the applied fertilizer levels has slowed (ie the marginal product has shown declining trend) during Yala the yield response to additional levels of fertilizer has not reached optimum level during Maha The reason for this remarkable response difference may be due to variations in the level of available water during the two seasons Therefore the two seasons might need different fertilizer recommendations
The scenario for conventional paddy fields is different in that the response to the applied levels of fertilizer has been linear ie zero-inorganic fertilizer fields gave on average lower yields than the successive levels of fertilization especially during maha season (table 12) The reason for this difference is due to the fact that on SRI fields the added inorganic fertilizer was supplementary to )tion the organic fertilizer while for conventional fields chemical fertilizer was mostly the main source (aha of nutrients
Yala rield
Table 11 Yield comparison by level of fertilizer application (kgha )-SRI farmers tion
Inorganic fertilizer (kgha) I Yalanota Mean SD Ntern
0 5792 2715 5ieJd oto 100 4851 92133n 100 to 200 5954 2350 3 200 amp above 6481 2755 13r----------------------shyGrand mean 5825 2506 30 F value 1741(p=0195)s
MahaMeanshy SD~N 4349 2460 2 4159 3279 4 5362 2202 2 9133 1977 4 6049 3218 12 __~~285 (p=003 5)
The morgamc fertilizers were UREA TSP NPK and MOP
2 Table 12 Yield comparison by level of fertilizer application (kgha) - conventional farmers
la
ii3----~---Inorganic fertilizer (kgac) Yala c------shy
Mean SD N _M~a~r~~~_ __~ 0 3970 1786 9 1821 1136 ~ oto 100 4153 3797 J 1615 301699 28 100 to 200 4384 I 1975 68 3805 j 1930 35
1020200 amp above 5052 2153 4449 i 1522 4409 1936 80Grand mean 125 3758 i 1786
2625 (P=0056)F value 1058 (p=0370) The morgamc fertlhzers mclude UREA TSP NPK and MOP
351
~ -o shy
63 Profitability Comparisons
The microeconomics of the two systems of rice production was assessed using budgeting technique 16 Net returns were estimated for each farmer using the relationships
NR=GR-TC
VC=L- PXI I
TC=VC+F GR=RYRP
Where NR= Net Returns GR= Gross Returns VC= Variable Cost RY= Rice yield for SRI and conventional system RP= Rice price Pi =per unit price of the ith input and Xi= quantity of the ith input F is fixed cost and TC is total cost
The individual budgets prepared for each and every sample farmers differentiated by system of production and seasons (ie SRI and conventional) were averaged to facilitate easy comparisons (see table 13) Moreover the budgets were prepared under three wage-rate scenarios ie zero wage rate or family labor on-going farm wage rate and non-farm wage rate It is interesting to note that contrary to the survey farmers own subjective assessment and reports from different angles the cost of production per unit area for SRI is higher or at least comparable to that of conventional rice production17
Even though SRI reduces or avoids the use of cash inputs such as fertilizer and herbicides the resulting savings can not fully compensate for the additional costs born due to greater labor input for weeding transplanting and organic matter collection and transporting However the costs per unit of paddy output (Rupees per Kilogram) are lower than those of conventional due to significant increases in yield Consequently the estimated profit figures for SRI is almost double that of conventional practice for both seasons But it may be noted that this level ofprofitability is achieved with a lot ofdrudgery
In addition to the reported positive profitability figures table 13 also shows that some farmers experienced loss during both seasons This shows the advantage of budgeting for each farm than for average farm Two inferences may be made First the incidence of loss is higher for Yaa than for Maha season Secondly the incidence of loss among SRI farmers is substantially lower than that for conventional farms irrespective of the season
In Sri Lanka it is usually claimed that the competitiveness of rice sector has been worsen by the relative high wage rate Careful scrutiny of the costs and revenues of paddy production systems under three wage rate regimes presented in the table 13 tempts us to believe this claim
16 Entetprise budgeting technique was preferred to Partial Budgeting because SRI involves a major overhaul of the conventional rice production system Had the changes in the production system been minor partial budgeting would have been the natural choice according to C IMMYT (1988) 17 The costs include both cash and imputed labor and material costs
352
~ shy o-
enterprise following
)r SRI and
system of mparisons ie zero resting to ~ different
that of such as
costs and
than profit
may be
Table 13 Summary Results of the Enterprise budgets IProduction Seasonmiddot Wage rate Gross Total cost Net Costlkg Inciden bull system Revenue (RS) (RS) Revenue (RS) ce of
(Rs) loss SRI Yala Zero 34899 6506 29371 36 1
farm 34899 18907 15992 111 4 Non-farm 34899 24842 10223 150 6
Maha Zero 36720 5291 34575 22 0 farm 36720 20435 16285 87 1 Non-farm 37620 26493 13374 114 2
--_
Conventional Yala Zero 27017 10742 16032 76 9 farm 27017 18600 8417 133 27 Non-farm 27017 22248 4215 15s 29
i Maha Zero 23871 9503 14373 68 0 farm 23871 16381 7490 119 15
I Non-farm 23871 19687 4369 140 22
7 CONCLUSIONS AND IMPLICATIONS
1 The main advantages of SRI include yield increase reduced number of irrigations or irrigation-hours per irrigation and per unit area (ie increase in water productivity) reduced demand for cash inputs improved seed quality and higher milling ratio In addition to these private benefits SRI embodies added societal or environmental benefits due to reductions in the use of environment-unfriendly inputs such as herbicides and fertilizers It is not clear however if the observed on-farm water productivity can be translated into net water-saving at watershed or basin level which is an issue requiring further analyses This can be realized only if the practice is widely adopted and the farmers do not increase acreage
2 The System ofRice Intensification has a short history in Sri Lanka Its adoption process is dynamic in the sense that the adopters may quit the practice for some time and then reuse it when the circumstances allow This is because the practice involves little capital investment during initial adoption decision
3 The main variables influencing the incidence of SRI adoption are (i) location of the farm (ii) the type of farming system (ie irrigated Vs rain-fed farming) (iii) poverty status of the farmer (iv) participation in training programs (v) education status and (vi) the size and demographic structure of the farm family
4 The absence of significant difference in SRI adoption probability between farmers located at the head of irrigation canal and rain-fed farmers and the observed lower probability of SRI adoption among those located at the middle and tail end of irrigation canal underlines the importance of irrigation water supply risk and uncertainty variable in SRI adoption decision Hence contrary to the ideal SRI practice farmers at the middle and tail maintain a water layer on their field as a buffer to offset the risk of irregularity regarding irrigation water arrival This may also be done to reduce weed growth On the other hand the total dependence on rain for paddy cultivation means that the farmers are more cautious in
353
~ -o
investing in conventional yield enhancing cash inputs Therefore SRI which minimizes or avoids the use of such inputs is the logical alternative for rain-fed farmers
Barisshy5 SRI adopters mai nly come from the lowest and the highest poverty terciles of the farming convc
population In other words there is no significant difference in SRI adoption probability (http1between rich and poor farmers But poor farmers are likely to persist with SRI once they practice SRI than the rich farmers Moreover low realized yield during the first Barkeexperiment with SRI is the major factor behind discontinuing the SRI practice Proce
6 The main variables affecting the intensity of adoption of SRI are cattle ownership which Sri Lais a proxy for organic mater availability education status and the size and demographic structure of the farm family Batuv
7 The main problems associated with SRI practice are the demand for skills and high Norm amount of labor for weed control and transplanting non-availability of organic manure ofamiand limited availability of the rotary weeders (ht1JtL
8 The most appropriate domain (target group) for SRI adoption are those farmers a With limited land holdings
Bonlishyb Having bigger family size with high proportion of the family members capable of (htRL
engaging in work c Who are cash constrained d For whom rice constitutes the lions share ofannual income and consumption C~
e With limited alternative employment opportunities manw yTrigf With relative certainty regarding irrigation water supply and
g Practicing rainfed paddy cultivation 9 Generally SRI demands higher amounts labor per unit area (a lot of drudgery is involved) Feder
and induces the active participation of children between 7 and 14 years ofage and women Coun1 However whether this is a significant social disutility is a matter for further scrutiny
Javay issue
Kikuc produ BHaJ ~edil 2001
McDI staas
354
~ -o
lzes or REFERENCES
~rming Barison J (2002) Evaluation of nutrient up take and nutrient use efficiency of SRI and conventional rice cultivation methods in Madagascar ability (httpciifad comelleduSRIlproc 1 ISRI-32pdf) e they
~ first Barker R R Loeve Y H Li and T P Tuong (eds) (2001) Water Saving Irrigation for rice Proceedings of an lnternational Workshop held in Wuhan China 23-25 March 2001 Colombo which Sri Lanka lnternational Water Management lnstitute raphic
Batuwitage GP (2002) Adaptations of the system of rice intensification in Sri Lanka In high Norman Uphoff et al (eds) 2002 Assessment of the system of rice intensification Proceedings anure of and international conference held in Sanya China April 1-4 2002 (httpciifadcomelleduSRJlSRI-Assessmentspdf
Bonlieu F (1999) Summary offindings from thesis research on SRI )Ie of (httpciifad cornell edusribonlieu pdf)
I CIMMYT (1988) From agronomic data to farmer recommendations an economics trammg manual Completely revised edition Mexico City Centro lnternacional de Mejoramiento de Maiz y Trigo (CIMMYT)
ved) Feder G RE Just and DZilberman (1982) Adoption of Agricultural Innovation in Developing
men Countries A survey World Bank Staff Working Papers Number 542
Javaya (Newspaper Published by Sri Lanka Ministry ofAgriculture) JanuaryFebruary 2000 Issue
Kikuchi M R Barker MSamad and P Welingamage (2002) Comparative advantage of rice production in Sri Lanka with special reference to irrigation costs Sombilla M MHossain BHardy (eds) Development in the rice economy Proceedings of the international workshop on medium-and -long term prospects of rice supply and demand in the 21 st Century 3-5 December 2001 Los Banos Philippines International Rice Research Institute 436p
McDonald JF and R A Mofitt (1980) The use of tobit analysis Review ofeconomics and statistics Volume 62 (2) pp318-321
McHugh OV TS Steenhuis J Barison ECM Fernandez and NT Uphoff (2002) Farmer implementation of alternate wet and dry and non-flooded irrigation practices in the system of rice intensification In Water-Wise rice production Bourn BMA HB Hardy PS Bindraban T P Tuong and J K Ladha (eds) Proceedings of the International Workshop on Water-Wise Rice Production 8-11 April Los Banos Philippines lnternational Rice Research Institute
Moser CM and CB Barrett (2002) The system of rice intensification in practice Explaining low farmer adoption and high disadoption in Madagascarln Water-Wise rice production Bourn BMA H B Hardy PS Bindraban T PTuong and JK Ladha (eds) Proceedings of the
355
~ shy Q
International Workshop on Water-Wise Rice Production 8-11 April Los Banos Philippines International Rice Research Institute
Norman Uphoff et al (eds) (2002) Assessment of the system of rice intensification Proceedings ofan international conference held in Sanya China April 1-4 2002 (httpciifadcomelleduSRIISRI-Assessmentspdf)
Rena Perez (2002) Experience in Cuba with the system of rice intensification Norman Uphoff et al (eds)2002 Assessment of the system of rice intensification Proceedings ofan international conference held in Sanya China April 1-4 2002 Aftel (httpciifadcomelleduSRIISRI-Assessmentspdf) appe(
in us Stoop WA Norman Uphoff and Amir Kassam (2002) A review of agricultural research issues indus raised by the system of rice intensification (SRI) from Madagascar opportunities for improving Taiwa farming systems for resource-poor farmers Agricultural Systems 71 (2002) 249-274 positi
positi Tiyagarajan et al (2002) Effects of SRI practices on hybrid rice performance in Tamil Nadu on pat India In Water-Wise rice production Bourn BMA H B Hardy PS Bindraban TPTuong Metho and lK Ladha (eds) Proceedings of the International Workshop on Water-Wise Rice Production the po 8-11 April Los Banos Philippines Losbanos (Philippines) International Rice Research Institute recogn
averagl consen the intI agricul1 agricult product fields re KeyWl Method
356
-o~
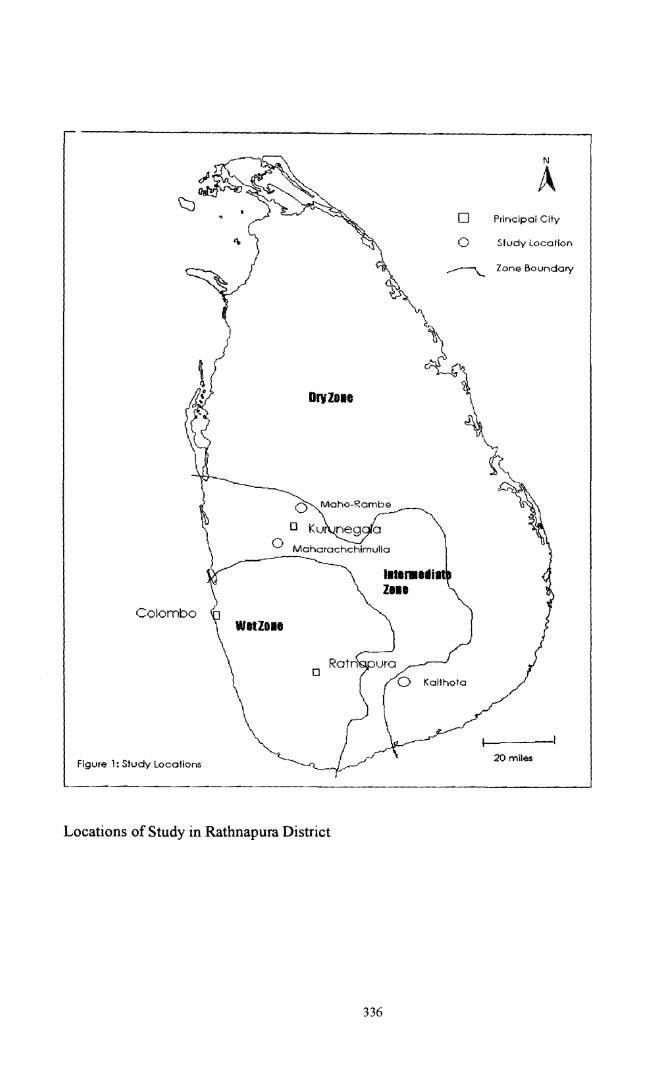
N
A o PrinGipal City
o Study Location
~ Zone Boundary
orvzbullbullbull
Colombo WetZobullbull
o
20 milesFigure 1 Study Locations
Locations of Study in Rathnapura District
336
amp
))~ ~ v -0
(1 -shyIc
4 THE SPATIAL AND TEMPORAL DYNAMICS OF SRI ADOPTION IN SRI LANKA
41 Adoption trends
System of Rice Intensification has only five years of history in Sri Lanka Only one fanner has reported to have first time learned about SRI in 1998 The majority of the SRI sample fanners in Kurunegala have learned about it in the year 2000 SRI sample fanners from Kalthota lagged behind Kurunegala farmers by about 2 years in awareness Even though about 117 percent of the SRI sample farmers are aware of SRI during 199899 actual practice commenced first in Kurunegala in the year 2000 The temporal dynamics of SRI awareness among adopters and nonshyadopters are quite similar (see Figures 2 and 3)
25 sect 20 ~
Cia 15 rJ 0 10 Q)
r
sect 5 Z 0
-----~---
--Kalthotar=~------krunegaj 1
Total
1998 1999 2000 2001 2002
Year
Figure 2 Year the fanners first learned about SRI
30 ----~--~~~--~
~
sect 25 ~ 20middot Kalthota~ r 0 15 Kurunegalar
10 Total0 ltU
8 5 ~
0
1999 2000 2001 2002
Year
Figure 3 Year ofawareness of SRI fanners
The non-SRI sample farmers who were aware of SRI but have not shown interest to practice it were asked why they do not intend to practice The response or reasons they gave are summarized in Table 1 Consistent with the practicing farmers observations the non-SRI farmers reported that the major obstacle to SRI adoption is the high labor demand and the tedious nature of the associated management practices such as transplanting and manual weeding
337
))~ 6)
-J 0 (~ shy-- (
~
Table 1 Reasons for unfavorable attitude of Non SRI farmers towards SRI Reasons Locations ()
Kalthota Kurunegala Total Requires more labor and effort 682 381 535 Climate is not good for SRI cultivations 45 00 23 Lack of necessary inputs 45 48 47 Water shortage and lack of suitable field 48136 93 Land tenure problem 45 00 23 Difficulties ofgetting organic fertilizer 45 00 23 Difficult to do management practices 00 238 116 No benefit 00 95 47 Field is located very far from home 00 48 23 Other SRI farmers failed 00 95 47 Lack of proper training 00 48 23 N 22 21 43
42 Farmers Perceptions of the Merits and Demerits of SRI
The advantages and disadvantages of SRI were elicited from the practicing farmers and the results are summarized in Tables 2 and 3 The most significant merits of SRI as compared to conventional system are (1) improved quantity and quality of paddy yield (2) savings in irrigation water and seed (3) reduced demand for external cash inputs like inorganic fertilizers and herbicides and (4) enhanced tolerance to biotic (eg diseases and insects) and abiotic stresses (eg lodging and low moisture stress) These views are quite consistent with the findings reported based on on-station and on-farm experimentation with SRI in some Asian African and Latin American countries
Table 2 Advantages of SRI relative to Conventional-farmers assessment No Criteria Percentreportin~yes N 1 More yield 830 53 2 Saves water 897 58 3 Saves seed 1000 60 4 More milling output 774 53 5 Less disease and pest attack 881 59 6 Less lodging of rice 914 58 7 Reduced demand for herbicide 911 60 8 Reduced demand for inorganic fertilizer 862 58 9 Less labor for harvesting 796 54 10 Less labor for trans~lanti~ 780 59 11 More tillers 983 59 12 Improves seed quality 909 55 13 Reduces input costs 850 60 14 Less labor for bund cleaning and construction 763 59 15 Environment friendlY 50 60
338
~ ~ ~~ -
(9
0 0 (
---- 11
---
Table 3 Disadvantages of SRI relative to conventional-farmers assessment No Criteria Percent respondin2 yes N 1 Weed control problem 60600 2 Transplanting is difficult 367 60 3 60SRI transplanting requires special skill 250 4 Requires skilled labor for management 317 60 5 Demand more labor input 500 60 6 60Requires additional workdays 650 7 59Requires more effort 746 8 57Organic matter not available 579 9 57Transporting organic matter is problematic 509
6010 Problems ofMW handling and availability 767 6011 Mice attack due to unclean bunds 17 5812 SRI requires well drained soils 690
13 559 59Does not work on flooded fields
The most important demerits of SRI relate to its extremely high demand for labor problems of weed control and organic matter availability 77 percent of the practicing farmers complain that the the rotary weeder recommended for use in the SRI system is not readily available and even ifIto available not easy to handle im
rers sses
S FACTORS INFLUENCING ADOPTION AND DISADOPTIONngs and
Sl Determinants of SRI Adoption
The two most popular functional forms used for dichotomous discrete choice adoption models are the logit and the prohit models The advantage of these models is that the probabilities are bounded between 0 and 1 The logit model is selected here The odds of SRI adoption are defmed as the ratio of the probability of adoption (pi) to the probability of non-adoption (I-Pi)
Specifically the model is
The Xs are the hypothesised explanatory variables as defined in table 4 The variables hypothesized to influence adoption of SRI were derived from own informal assessment and literature reviews (Moser and Barrett 2002 McHugh et aI 2002) Since these variables are unlikely to operate independently a variable-by-variable analysis of relationships with farmers adoption of SRI is likely to be misleading (Feder et aI 1985) Hence logit analysis which uses a number of independent variables has been used to predict the probability offarmers SRI adoption
339
e~ p~ -
amp
0v (1shyA
--
ized to influence the
POVGR(X12)
LOCFA(X13)
LABAV(XI4)
The logistic regression model fitted to analyze the effect of these variables on the adoption decisions offarmers is presented in the table 5 Dependency ratio (DEPRA) age of the household head (AGEHH) and proportion of annual income from non-farm activities (PRNIN) reduces the likelihood of a farmer being SRI adopter By contrast family size (F AMIS) years of schooling (YSCHH) and participation in agricultural training programs (NFTPA) significantly increase the probability of a farmer being SRI adopter For instance as the family size of the farmer increases by a unit the likelihood of being SRI farmer increases by 145 times (see the exp (8) for variable F AMIS) The proportion of children between 7 and 14 increases the likelihood of SRI adoptioIl This is consistent with our field observation-- children were actively participating in the transplanting of SRI fields 9 Moreover studies in other countries showed that women and
7 Five organizations were identified and farmers were asked to confum whether they are ordinary members or leaders of these organizations in the past and at present Thus each farmer can score a minimum of zero (meaning not a member of any organization in the past and at present) and a maximum of 20 (meaning the farmer is a member and flays leadership role in all organizations in the past and at present ie 5x2x2)
This index was constructed from a set of questions designed to elicit farmers opinion regarding labor supply in his or her village or community 9 Whether this may be considered as a possible negative social effect of SRl or not depends on the situation of the without SRl scenario regarding children and women participation in the labor force in any particular locality
340
childre (Rena
Locatic irrigatt Thesemiddot that the Whyal the ob~ differel soil dl toleran availab investn which enhanc additio soil an the cha abunda family
Themlt irrigati4 middle mayse import maybe along t ends ~ certain succes water I field d
AnOthl buffalc signifi
~ gtl P~ -
amp
0J M
children are particularly suited for handling the transplanting of small and delicate rice seedlings (Rena Pervez 2002)
Location of the farm along the irrigation canal and generally the type of farming system (ie irrigated or rainfed farming system) had remarkable influence on the adoption pattern of SRI These important patterns are revealed by the variables LOCFA and FYLWS The model showed that the probability of adoption of SRI among irrigated farms is lower than that of rainfed farms Why are rainfed farmers more likely to adopt SRI than irrigated farmers This might be due to (1) the observed production risk differential among the two types of farming systems (2) the wage difference between rainfed and irrigated areas and (3) Increased water holding capacity of the soil due to improvement in organic matter content and hence enhanced low moisture stress tolerance of the rice crop The rainfed rice farming faces risk and uncertainty regarding the availability and distribution of rainfall Therefore rainfed paddy fanners are cautious about investments in cash inputs such as fertilizer herbicides and pesticides Hence for them SRI which decreases the demand for high-risk cash inputs is an ideal alternative rice productivityshyenhancing strategy Moreover as elaborated in the section 51 of this paper SRI involves the addition of huge amount of organic fertilizer which improves the water-holding capacity of the soil and hence easing the risk of low-moisture stress On the other hand high labor input forms the characteristic feature of SRI practice thereby making it attractive in those areas were there is abundant labor with relative lower wages The positive sign of labor availability (LABAV) and family size (FAMIS) variables further corroborates this argument
on )ld he ng he es lie
The model shows that there is no significant difference between farmers located at the head of the irrigation canal and rain-fed farmers regarding SRI adoption But the probability of adoption of middle and tail farmers is sign~ficantly lower than that for rainfed farmers At the first glance this may seem to contradict the widely held view that SRI saves water But this finding underlines the importance of irrigation water supply uncertainty In the advent of supply uncertainty farmers may be reluctant not to flood their paddy fields when water is available Why are farmers located along the head of the canal more likely to adopt SRI than those situated in the middle and tail ends This may be due to the fact that at least for irrigated farmers there must be some degree of certainty regarding the availability of irrigation water (or control over water supply) for successful adoption of SRI (McHugh et aI 2002) Farmers at the middle and the tail maintain a water layer on their fields as buffer in case irrigation water arrive at large intervals Keeping the field drained is very risky if they have no control over water
Another important variable having almost significant positive impact on SRI adoption is cattle or buffalo ownership through its effect on manure availability The model also shows that there is no significant difference in SRI adoption between poor and rich farmers
or ot ld
341
~ -a-
--
Table 5 Detenninants ofSRI adoption -Results oflogit regression analysis Variable Code B SE Exo(8
CONSTANT -23134 29217 -Dependency Ratio (DEPRA) -00454 00277 0955 Proportion ofChildren in the Family(PCIDL) 00462 00285 1047 Family Size (FAMIS) I 03095 01791 1362 Age ofthe Household Head (AGEHH) -00509 00359 0950 Years ofSchooling of the Household HeadjYSCHH) 01645 00861 1178 Number of Training Programs Attended (NFTPA) Number ofExtension Contact7NEXCY)
~~----
01760 00343
00901 05146 ~~i
Proprotion ofIncome from Rice (PRICEj 00048 00117 1004 Proportion ofNon-fann Income (pRNlN) -00039 00124 0996 Incidence ofYield Loss due to Low Water Stress (FYLWS) 00575 01509 1059 An Index of Social amp Political Capital (POSOLl 00327 00821 1033 Poverty Group (poor) 00464 06746 1047 Poverty Group (Middle) -11770 06857 0308 Povert Group (Rich)-reference cateSory Location of the Fann or Field (Head) -02209 09935 0801 Location ofthe Fann or Field (Middle) -15452 09161 0213 I Location ofthe Fann or Field (Tail) -19079 09309 0l48 Location ofthe Fann or Field (Rain fed J-reference category An Index ofLabour Availability Perception (LABA V) 01334 01438 1142 Number of Cattle Owned (CATTL) 05139 I 03380 1671 Notes significant at 10 probability level significant at 5probability level -2 Log Likelihood 10898 Model Chi-square = 46284 (df= 18p=00003) Cox and Snell Rl=038511
Nagelkerke K=0513 Percent correctly predicted = 7679 N=112
S2 Intensity of Adoption of SRI
The intensity of adoption once the fanner has decided to practice SRI was evaluated using the proPQrtion of SRI area in the total paddy cultivated during maha and yala seasons and the proportion of fanners who allotted 100 percent of their paddy field to SRI These are shown in figures 4 and 5 The proportion of paddy area allotted to SRI ranges from about 39 percent in Kalthota to about 61 percent in Kurunegala during Yala season Some fanners have also allotted their total rice field to SRI The proportion of such fanners ranges from as low as 10 percent in Kalthota to as high as 50 percent in Kurunegala (see figure 5) The proportion of SRI farmers with 100 percent of their paddy fields SRI is higher during Yaa than during Maha in Kurunegala
II In OLS models the R2 statistic represents the proportion of variability in the dependent variable that can be explained by the independent variables For logit regression model an easily interpretable measure of the strength of the relationship between the dependent variable and the independent variables is not available Cox and SneD and Nagelkerke Rl are attempts to imitate the interpretation ofR2 in OLS regression They are attempts to measure strength of associations
342
~ shyo-
---
Exp(B ~17 -77 0955 85 1047 91 1362 59 0950 61 1178 01 1192 6 1034 17 1004 ~4 0996 9 1059 1 1033 6 1047 7 0308
5 0801 I 0213 ~ 0148
~ 1142 ) 1671
ISing the and the hown in rcent in allotted rcent in fanners negala
gth of and
This is in line with the presumption that Yala season is more water scarce than Maha season and one of the advantages of SRI is to save water as has been elaborated in the previous sections
70
60
ttl 50
~ 40 ~
~ 30
~ 20
10
0
jYala I l__ M~
Kalthota Kurunegala
Locations
Figure 4 Proportion ofRice area allotted to SRI in 2002
it 60 T-~--~-------------- rJ)
~
8 50
~ 40 +
~ 30
~ E 20 f it 10 rJ)
f 0
Kalthota Kurunegala
Locations
Figure 5 Proportion of SRI fanners who allotted 100 percent of paddy area to SRI in 2002
In the previous section detenninants of SRI adoption decision were assessed However the extent or intensity of adoption once the adoption decision is made is important infonnation for research extension and policy This issue was evaluated using tobit regression model which allows the estimation of the likelihood ofadoption as well as the extent or intensity of adoption It is preferable to logit adoption model when the decision to adopt also involves simultaneously a choice regarding the intensity of adoption as it does with SRI practice The model can be specified as
where Yi is a latent variable representing the use of the SRI X is a vector of independent variables described in table 4 13 is a vector of unknown parameters and Ei is a disturbance
343
~ -oshy
assumed to be independently and normally distributed with zero mean and constant variance~ and i = ]2 n (n is the number of sample households)
Denoting yi (the proportion of SRI area in the total cultivated rice area) as the observed dependent (censored) variable
The proportion of paddy area allotted to SRI was regressed against various factors hypothesized to influence SRI adoption A common mistake made when interpreting tobit coefficients is to treat them as effects of the independent variable for cases above the limit To avoid this drawback the tobit coefficients were decomposed following McDonald and Moffitt (1980) and the results are presented in table 6
1n the incidence of adoption model (ie logit model) discussed in the previous section informational variables such as participation in training program and extension contact poverty status location of the farm the farming system (ie irrigated vs rainfed farming) and level of education were important variables in predicting SRI adoption 1n the tobit model which estimates both the incidence and intensity of adoption the informational variables have lost their explanatory power 1nstead variables related to labor availability (DEPRA and PCHlL) and organic matter availability (CATTL) are more relevant
Table 6 also shows the decomposition of the total elasticity of the variables12 The decomposition
consists of two components the probability of adopting in the first place and the potential increase in the area allotted to SRI once the decision to adopt has been made For example the total elasticity value for the years of schooling (YSCHH) is 0974 meaning that a 10 percent increase in the years of schooling is expected to result in about 97 percent in adoption and use intensity of the SRI practice The probability of adoption will increase by 73 percent while the intensity of adoption will increase by 24 percent The other variables in the table can be interpreted in an analogous manner
12 An elasticity of adoption measures the responsiveness to a particular variable and is equal to the relative change in adoption of a technology with respect to a small relative change in a given variable from current levels The elasticities obtained from the tobit model take into account that a change in the explanatory variable will simultaneously affect the number of SRI adopters and the proportion of acreage under SRI
344
~ shyo--
---
~e and
Table ~ The det~rminants ofthe extent or intensity of adoption of SRI- results of probit
endent tshynt
~sized is to
back lsults
tion verty elof rhich their and
tion 53 Determinants of SRI Disadoption ltial
the Disadoption is one important aspect which have not been given due consideration in past ent adoption research Information on the reasons why certain group of farmers failed to stick to the use technology recommended for use is of crucial importance for researchers extension workers and the policy makers For instance research may draw upon the drawbacks of the technology and be improve upon those drawbacks to increase the chance of acceptability and wider dissemination of
the technology among the intended beneficiaries
In light of this fact a logit model was fitted to the data on SRI farmers Most of the variables in the SRI adoption modeling of section 51 were also included here The additional variables incorporated in the current model are (1) An index of positive perception of farmers towards SRI (POSIP) constructed based on the
reported advantages of SRI vis-a-vis the conventional system of rice production presented in table 2 The value of the variable ranges from 0 to 15 where 0 indicates lowest positive attitude of the SRI practitioners towards SRI and 15 shows the strongest positive attitude towards SRI This variable is expected to have a negative relationship with disadoption since those farmers who had positive attitude towards SRI are expected to continue with SRI
(2) An index of negative perception of farmers towards SRI (NEGAP) constructed based on the reported disadvantages of SRI vis-a-vis conventional system of rice production presented in table 3 The value of the variable ranges from 0 to 13 where 0 indicates lowest negative attitude of the SRI practitioners towards SRI and 13 shows the strongest negative attitude
345
gt)~ 6)
-0~
~ 0 rt
towards SRI This variable is expected to have a positive relationship with disadoption since those fanners who had a negative attitude towards SRI are expected to cease practicing SRI
(3) Average realized SRI yield (kgacre) for SRI farmers while they were practicing We expect that those farmers who had better paddy yield during their first season(s) of experimenting with SRI will continue with SRI Contrarily a low level of realized yield would lead to dis adoption
(4) The other important variable is the perception of farmers regarding the cost of capital or availability of cash (CASHR) This variable is particularly important in the sense that one of the cases for promoting SRI is due to its lesser reliance on external inputs hence lesser requirement for cash or capital The value for this variable ranges from 1 to 5 where 1 indicates severe cash constraint and 5 indicates the absence of cash constraint We expect this variable to have positive relationship with disadoption
T bl 7 Da e etermmants 0 Isa optIon 0 fSRIR- esu ts 0 I fl Oglt regressIon analysIs Variable p INTERCEPT 5935 An Index of Degree ofPositive Perception (pOSIP) -0262 An Index ofDegree ofNegative Perception (NEGAP) 0064 Average Realized Yield (AVERY) -0002 Episodes ofRice Yield Loss due to Water Stress (FRRYL) 0310 Labor Availability (LABA V) -0424 Proportion of Children in the Family (PCIDL) -0032 Poverty Group (poor) -3021 Poverty Group (Middle) -2504 Number ofExtension Contact (NEXCY) -0314 Dependency Ratio (DEPRA) 0052 Years ofSchooling of the Household Head (YSCHH) -0065 Proprotion of Income from Rice (PRICE) -0016 An Index ofLabor Availability Perception (CASHR) 0766 Note means the coefficIent IS slgmficant at 5 slgnrficance level -2 Log likelihood = 3743 Cox and Snell R2 = 048 Nagelkerke k = 066 Percent correctly predicted = 867
SE 5565 0300 0231 0001 0451 0312 0062 1505 1618 0215 0057 0187 0020 0591
exp(p) 377943
0769 1066 0998 1364 0655 0968 0049 0082 0730 1053 0937 0985 2151
All of the variables included in the disadoption model had the expected signs (table 7) However only average realized yield during the first season(s) of practicing SRI (AVERY) and poverty status (POYGR) variables had statistically significant effect on disadoption Hence the success or failure of farmers during initial adoption process determines the acceptance and the pace of dissemination of a technology In the adoption model (table 5) there is no significant difference in the probability of adoption of SRI between poor and rich farmers However the probability of disadoption among poor farmers is significantly lower than that among rich farmers This implies that once the poor farmers adopt SRI they have higher probability of continuing with it than rich farmers
346
~ shyo -
---
I since SRI
r y r f
f
Among the perception variables farmers perceived cash availability (CASHR) labor availability (LABAV) frequency of rice yield loss due to water shortage (FRRYL) and an index of farmers positive attitude towards SRI (POSID) respectively had strong coefficients However these were not statistically significant
6 THE MICROECONOMICS OF SRI
61 Rice agronomy and irrigation water management
Fanners agronomic practices level of cash input utilization and irrigation water management differentiated by system of production (SRI vs conventional) and seasons (wet-maha and dryshyyala) are shown in table 8 Expectedly there is substantial difference between the two systems of rice production regarding planting method fertility management and weed control practices For instance an average SRI-farmer transplants one 8-days-old rice seedling per hill on a square grid of about 23 by 23 cm While most conventional fields were planted by way of broadcasting few conventional farmers have practiced transplanting However the SRI transplanting differs from the conventional transplanting in many ways The conventional farmers planted on average four IS-days-old rice seedlings in a clump per hill on a square grid of 15 by 15 cm which is narrower than that for SRI
Concerning soil fertility management significant differences are noted between the two systems Generally SRI farmers used lesser doses of inorganic and higher doses of organic fertilizer per unit area as compared to conventional farmers Moreover a considerable number of SRI farmers abandoned altogether the use of inorganic fertilizers instead they put a lot of organic fertilizers The main sources of organic fertilizers include cow dung tree leaves straw poultry manure compost and rice bran
Weed control method is another important aspect differentiating the two systems of production SRI farmers use herbicides rarely instead they make use of a mechanical weeder andor hand weeding The conventional farmers rely heavily on herbicides and they flood their paddy fields with water as a means of weed control It is important to flood the field at the correct stage
One of the main advantages of SRI is its water saving with little or no reductions in the paddy yield (Thiyagarajan et aI 2002) We attempted to have an indirect and rough idea of the magnitude of on-farm or field-level water savings through farmer estimates of number of irrigation and hours of irrigation per unit area13
On average number of irrigations and hours of irrigation per unit area of SRI-fields are respectively about 24 percent and 23 percent lesser than the conventional paddy fields However the difference between SRI and conventional regarding hours of irrigation is not statistically significant Consistent to our a priori expectations the per hectare hours of irrigation (for both SRI and Conventional fields) during yala season is greater
13 F arrners were asked the number of irrigation done for each rice field they owned during Yala and Aaha seasons Moreover they were asked to give approximate hours elapsed during successive irrigation Then the number of irrigations was multiplied by the hours elapsed and divided by the area of the field to give an estimate of hours of irrigation per unit area We admit that for more conclusive results an exact field-level measurement needs to be done preferably for a number offarrners
347
~~ 6)
a - ) v 0 rrshy-
than that of Maha season This is because Yala season is relatively water scarce as compared to Maha season (see figure 7)
4~~----------------------------~
400 3~
~ 300 2~ ~ 200
~ l~ 100 ~
o
~ ~ ~ ~ ~ sect ~ g ~ ~ ~ ~ Mon1hs
~-WbTZa] bull DRY ZONE --shy
Figure 7Monthly rain fall distribution for the Dry and Wet Zones of Sri Lanka (1961-1990)
Table 8 also clearly indicates that generally SRI fields demand higher amount of human labor (about 3 times more) This arises from planting (about 37 man-days per ha) weeding (about 31 man-days per hal bund construction and cleaning (about 41 man-days per hal and organic fertilizer collection and transportation (126 man days per hal The corresponding figures for conventional fields are 8l man-days for planting (broadcasting) 16 man-days for weeding 114 man-days for bund construction and cleaning and 73 man-days per ha for organic matter collection and transportation The amount of bund construction and cleaning labor for SRI is significantly lower than that for conventional fields This is because the SRI farmers were advised not to clean bunds in order to harbor beneficial organisms as an integrated pest management strategy
348
g l
()
g e 8t ~ e pound VI bullell oJ
1 1
0
~ ~ shy--sect bull
~ ))
=~ --(9
0 (~
- ----
shybl
~
(
(0
til
0
~1
0 c
P
~
II g
~ t
amp
e w
g K
G
_ _
I
n~
_
I
8
Tab
le 8
In
T
b -
f
d [~-~
Pra
ctic
es o
r In
puts
SR
I C
onve
ntio
nal
Yal
a M
aha
Yal
a
~and
M
ean
SD
N
Mea
n SD
N
M
ean
SD
N
Mea
n T
ract
or h
ours
per
ha
26
232
32
24
18
7
32
28
183
12
9 28
pr
epar
atio
n B
ullo
ck h
ours
per
ha
24
438
32
17
35
0
32
19
475
12
9 17
P
lant
ing
Tra
nspl
anti
ng h
ours
per
ha
244
152
32
352
262
32
114
144
37
271
Bro
adca
stin
g ho
urs
per h
a
-
--
-67
8
420
8
7
63
Nw
nber
ofs
eedl
ings
per
hill
1
1 0
3 32
1
4 0
7 32
4
0 1
2 35
3
7 A
ge o
fsee
dlin
gs in
day
s 7
6 1
9 32
8
4 2
7 32
18
3
5 3
8
185
S
paci
ng b
etw
een
plan
ts in
inch
es
95
13
31
94
13
32
59
15
19
59
Spa
cing
bet
wee
n ro
ws
in i
nche
s 9
7 1
2 32
9
6 1
1 32
6
0 1
6 19
6
2 S
eed
rate
kg
per h
a 14
10
0
32
17
12
32
117
38
11
2 11
4 F
erti
liza
tion
U
reap
erh
a 77
73
0
32
78
804
32
14
1 86
2
128
133
(Ino
rgan
ic)
TD
Mk
g p
erh
a 76
13
05
32
516
78
2
32
97
800
12
8 96
N
PK
kg
per
ha
57
105
6 32
45
74
1
32
104
718
12
8 10
0 T
SP
kg
per
ha
-
-
-
13
120
8 12
8 4
f ~~~
MO
P k
g pe
r ha
--
--
--
03
33
I 12
8 0
5 F
erti
liza
tion
C
ow d
ung
in k
g p
er h
a 20
24
3066
32
14
22
2541
32
15
3 61
78
129
152
(Org
anic
) T
ree
leav
es in
kg
per h
a 10
13
1443
32
73
3 25
133
32
24
7 16
200
129
131
Str
aw i
n kg
per
ha
951
1900
4
32
261
799
0 3
2
170
706
4 12
9 28
7 P
oult
ry m
anur
e in
kg
per h
a 73
25
85
32
39
149
6 32
31
34
95
128
75
Com
post
in k
g pe
r ha
62
349
5 32
23
13
1 3
2
--
--
Ric
e br
an i
n kg
per
ha
23
945
32
8
437
32
-
--
Wee
ding
H
erbi
cide
s li
ter
per
ha
015
0
87
32
008
0
31
32
2
29
325
12
9 2
14
Hou
rs o
fMec
hani
cal
Wee
ding
per
ha
283
281
32
213
260
32
3
233
12
7 2
Han
d W
eedi
ng H
ours
per
ha
69
934
32
57
90
6
32
4
217
12
9 15
H
ours
ofb
un
d c
onst
ruct
ion
and
clea
ning
per
ha
28
48
0
32
38
51
32
8
8
862
12
9 94
Ir
riga
tion
M
ean
Num
ber o
fIrr
igat
ion
24
179
24
22
17
2
25
32
259
10
3 29
H
ours
of i
rrig
atio
n pe
r ha
1942
24
25
21
1720
21
16
23
25
89
40
38
97
2154
H
arve
stin
g P
er h
a ho
urs
ofh
arve
stin
g 32
8 26
62
31
326
376
7 13
35
5 25
46
I 11
5 26
5
Mah
a SD
18
9
380
18
10
444
0
9 3
9 1
3 1
5 38
0
815
75
6
749
19
9
43
594
2 51
02
1022
6
659
8
~~
-3
07
175
0 54
3
100
3 25
8
2993
18
17
N1 (
145
145
38
106
i~
38
23
23
132
147
147
147
147
147
14
5 I
145
I
143
I
145
-- 144
145
145
144
III
103
84
lJ
j
0 14
N r
efer
s to
the
num
ber
off
ield
s S
ince
mos
t oft
he f
arm
ers
had
mor
e th
an o
ne c
onve
ntio
nal r
ice
fiel
ds t
he n
umbe
r ofs
ampl
e ho
useh
olds
and
the
num
ber o
f fi
elds
may
var
y A
ll o
fthe
SR
I fa
rmer
s ha
d on
ly o
ne S
RI
field
M
oreo
ver
not
all
oft
he o
rigi
na16
0 S
RI
sam
ple
farm
ers
had
prac
tice
d S
RI
duri
ng 2
002
---
62 Yield Comparisons
The mean paddy yields obtained during the last three years differentiated by the system of production and seasons are listed in table 9 The mean SRI yield even though not as dmmatic as figures reported from many sources is about 44 percent more than that for the conventional method (F value = 474 P=0031) The reported conventional yields are well within the range of figures estimated by Sri Lanka Department of Census and Statistics The Departments estimate of paddy yields for the country lies between 25 and 41 t per hectare depending on the type of farming system (ie rainfed or irrigated rice farming) and the type of irrigation scheme (Kikuchi et aI 2002)
SRI is fertili~
contin fertili2 the co Interes or con and UI respon trend)
T bl e 9 Ri f management (Kgh) level d a ceyleIdsunder SRI and conventlOna system 0 a in the differel
Year Sri Conventional yield increase Yala Maha Mean Yala Maha Mean
2000 4097 6236 5488 3635 3644 3641 507 2001 5056 5327 5215 3516 3749 3633 435 2002 5737 5977 5811 4189 3832 4041 438 Mean 5299 5763 5524 3910 3757 3836 440
The set fertilizeuro the SUC4
However the yields reported in table 9 above conceal the effects of location and adoption15status The highest paddy yield (81 t ha) was recorded for SRI in Kalthota area during Maha
season for adopter group while the lowest (21 tha) was recorded for dis adopters during Yala season in Kurunegala (Table 10) Generally disadopters experienced the lowest paddy yield during the first year of adoption forcing them to discontinue the SRI pmctice The disadoption model of Section 53 also corroborates this fact Location-wise the yields recorded for Kalthota area are significantly better than those recorded for Kurunegala farmers irrespective ofthe system of production From table 10 one can also infer that the prospect of harvesting better paddy yield is higher for the Maha season than the Yala season which is in line with the usual expectation
Table 10 Paddy yield per acre by adoption status season year and location (kgha Location Year SRI Conventional
Ado ters Disado ters Ado tefs Disadopters Yala Maha Yala Maha Yala Maha Yala Maha
Kurunegala 2000 5726 7217 2102 4668 3501 3063 3769 4372 -
2001 6011 5499 4100 4628 4040 3628 2942 3851 2002 5619 5977 NA NA 3071 3702 3863 3911 Mean 5785 6231 3101 4648 3537 3464 3524 4045
Kalthota 2000 NA NA NA NA NA NA NA NA 2001 NA 8154 NA NA 6795 NA NA NA 2002 5806 NA NA NA 4900 NA NA NA Mean 5806 8154 NA NA 5848 NA NA NA
NA means not applicable
15 The original SRI sample farmers who have not practiced SRI during Yaa or Maha seasons of the year 2002 are regarded as disadopters By these criteria 20 of the 60 SRI sample farmers are disadopters
350
differet1 the orgc ofnutril
Table 1 Inorga
o oto 100 100 to 2 200ampa
--ornrutn F value The in
Table 1 Inorga
0 otol0( 100 to 200amp Grand F valueuro The 11
~ shyo-
---
- --
SRI is usually considered as a practice that gives substantial yield without the use of inorganic fertilizer (Barison 2002) Despite the advice not to use inorganic fertilizer some farmers have
tic as continued to use it with varying intensities The SRI farmers level of utilization of inorganictional fertilizer has been arbitrarily classified into four strata starting with zero level of utilization and ge of the corresponding paddy yields recorded for each stratum are reported are shown in Table 11
Interestingly the SRI farmers who did not apply any form of inorganic fertilizer recorded better or comparable yields to those farmers who applied up to and above 200 kg of fertilizer in Yala and up to 200 kg during Maha Another important observation is that while the paddy yield response to the applied fertilizer levels has slowed (ie the marginal product has shown declining trend) during Yala the yield response to additional levels of fertilizer has not reached optimum level during Maha The reason for this remarkable response difference may be due to variations in the level of available water during the two seasons Therefore the two seasons might need different fertilizer recommendations
The scenario for conventional paddy fields is different in that the response to the applied levels of fertilizer has been linear ie zero-inorganic fertilizer fields gave on average lower yields than the successive levels of fertilization especially during maha season (table 12) The reason for this difference is due to the fact that on SRI fields the added inorganic fertilizer was supplementary to )tion the organic fertilizer while for conventional fields chemical fertilizer was mostly the main source (aha of nutrients
Yala rield
Table 11 Yield comparison by level of fertilizer application (kgha )-SRI farmers tion
Inorganic fertilizer (kgha) I Yalanota Mean SD Ntern
0 5792 2715 5ieJd oto 100 4851 92133n 100 to 200 5954 2350 3 200 amp above 6481 2755 13r----------------------shyGrand mean 5825 2506 30 F value 1741(p=0195)s
MahaMeanshy SD~N 4349 2460 2 4159 3279 4 5362 2202 2 9133 1977 4 6049 3218 12 __~~285 (p=003 5)
The morgamc fertilizers were UREA TSP NPK and MOP
2 Table 12 Yield comparison by level of fertilizer application (kgha) - conventional farmers
la
ii3----~---Inorganic fertilizer (kgac) Yala c------shy
Mean SD N _M~a~r~~~_ __~ 0 3970 1786 9 1821 1136 ~ oto 100 4153 3797 J 1615 301699 28 100 to 200 4384 I 1975 68 3805 j 1930 35
1020200 amp above 5052 2153 4449 i 1522 4409 1936 80Grand mean 125 3758 i 1786
2625 (P=0056)F value 1058 (p=0370) The morgamc fertlhzers mclude UREA TSP NPK and MOP
351
~ -o shy
63 Profitability Comparisons
The microeconomics of the two systems of rice production was assessed using budgeting technique 16 Net returns were estimated for each farmer using the relationships
NR=GR-TC
VC=L- PXI I
TC=VC+F GR=RYRP
Where NR= Net Returns GR= Gross Returns VC= Variable Cost RY= Rice yield for SRI and conventional system RP= Rice price Pi =per unit price of the ith input and Xi= quantity of the ith input F is fixed cost and TC is total cost
The individual budgets prepared for each and every sample farmers differentiated by system of production and seasons (ie SRI and conventional) were averaged to facilitate easy comparisons (see table 13) Moreover the budgets were prepared under three wage-rate scenarios ie zero wage rate or family labor on-going farm wage rate and non-farm wage rate It is interesting to note that contrary to the survey farmers own subjective assessment and reports from different angles the cost of production per unit area for SRI is higher or at least comparable to that of conventional rice production17
Even though SRI reduces or avoids the use of cash inputs such as fertilizer and herbicides the resulting savings can not fully compensate for the additional costs born due to greater labor input for weeding transplanting and organic matter collection and transporting However the costs per unit of paddy output (Rupees per Kilogram) are lower than those of conventional due to significant increases in yield Consequently the estimated profit figures for SRI is almost double that of conventional practice for both seasons But it may be noted that this level ofprofitability is achieved with a lot ofdrudgery
In addition to the reported positive profitability figures table 13 also shows that some farmers experienced loss during both seasons This shows the advantage of budgeting for each farm than for average farm Two inferences may be made First the incidence of loss is higher for Yaa than for Maha season Secondly the incidence of loss among SRI farmers is substantially lower than that for conventional farms irrespective of the season
In Sri Lanka it is usually claimed that the competitiveness of rice sector has been worsen by the relative high wage rate Careful scrutiny of the costs and revenues of paddy production systems under three wage rate regimes presented in the table 13 tempts us to believe this claim
16 Entetprise budgeting technique was preferred to Partial Budgeting because SRI involves a major overhaul of the conventional rice production system Had the changes in the production system been minor partial budgeting would have been the natural choice according to C IMMYT (1988) 17 The costs include both cash and imputed labor and material costs
352
~ shy o-
enterprise following
)r SRI and
system of mparisons ie zero resting to ~ different
that of such as
costs and
than profit
may be
Table 13 Summary Results of the Enterprise budgets IProduction Seasonmiddot Wage rate Gross Total cost Net Costlkg Inciden bull system Revenue (RS) (RS) Revenue (RS) ce of
(Rs) loss SRI Yala Zero 34899 6506 29371 36 1
farm 34899 18907 15992 111 4 Non-farm 34899 24842 10223 150 6
Maha Zero 36720 5291 34575 22 0 farm 36720 20435 16285 87 1 Non-farm 37620 26493 13374 114 2
--_
Conventional Yala Zero 27017 10742 16032 76 9 farm 27017 18600 8417 133 27 Non-farm 27017 22248 4215 15s 29
i Maha Zero 23871 9503 14373 68 0 farm 23871 16381 7490 119 15
I Non-farm 23871 19687 4369 140 22
7 CONCLUSIONS AND IMPLICATIONS
1 The main advantages of SRI include yield increase reduced number of irrigations or irrigation-hours per irrigation and per unit area (ie increase in water productivity) reduced demand for cash inputs improved seed quality and higher milling ratio In addition to these private benefits SRI embodies added societal or environmental benefits due to reductions in the use of environment-unfriendly inputs such as herbicides and fertilizers It is not clear however if the observed on-farm water productivity can be translated into net water-saving at watershed or basin level which is an issue requiring further analyses This can be realized only if the practice is widely adopted and the farmers do not increase acreage
2 The System ofRice Intensification has a short history in Sri Lanka Its adoption process is dynamic in the sense that the adopters may quit the practice for some time and then reuse it when the circumstances allow This is because the practice involves little capital investment during initial adoption decision
3 The main variables influencing the incidence of SRI adoption are (i) location of the farm (ii) the type of farming system (ie irrigated Vs rain-fed farming) (iii) poverty status of the farmer (iv) participation in training programs (v) education status and (vi) the size and demographic structure of the farm family
4 The absence of significant difference in SRI adoption probability between farmers located at the head of irrigation canal and rain-fed farmers and the observed lower probability of SRI adoption among those located at the middle and tail end of irrigation canal underlines the importance of irrigation water supply risk and uncertainty variable in SRI adoption decision Hence contrary to the ideal SRI practice farmers at the middle and tail maintain a water layer on their field as a buffer to offset the risk of irregularity regarding irrigation water arrival This may also be done to reduce weed growth On the other hand the total dependence on rain for paddy cultivation means that the farmers are more cautious in
353
~ -o
investing in conventional yield enhancing cash inputs Therefore SRI which minimizes or avoids the use of such inputs is the logical alternative for rain-fed farmers
Barisshy5 SRI adopters mai nly come from the lowest and the highest poverty terciles of the farming convc
population In other words there is no significant difference in SRI adoption probability (http1between rich and poor farmers But poor farmers are likely to persist with SRI once they practice SRI than the rich farmers Moreover low realized yield during the first Barkeexperiment with SRI is the major factor behind discontinuing the SRI practice Proce
6 The main variables affecting the intensity of adoption of SRI are cattle ownership which Sri Lais a proxy for organic mater availability education status and the size and demographic structure of the farm family Batuv
7 The main problems associated with SRI practice are the demand for skills and high Norm amount of labor for weed control and transplanting non-availability of organic manure ofamiand limited availability of the rotary weeders (ht1JtL
8 The most appropriate domain (target group) for SRI adoption are those farmers a With limited land holdings
Bonlishyb Having bigger family size with high proportion of the family members capable of (htRL
engaging in work c Who are cash constrained d For whom rice constitutes the lions share ofannual income and consumption C~
e With limited alternative employment opportunities manw yTrigf With relative certainty regarding irrigation water supply and
g Practicing rainfed paddy cultivation 9 Generally SRI demands higher amounts labor per unit area (a lot of drudgery is involved) Feder
and induces the active participation of children between 7 and 14 years ofage and women Coun1 However whether this is a significant social disutility is a matter for further scrutiny
Javay issue
Kikuc produ BHaJ ~edil 2001
McDI staas
354
~ -o
lzes or REFERENCES
~rming Barison J (2002) Evaluation of nutrient up take and nutrient use efficiency of SRI and conventional rice cultivation methods in Madagascar ability (httpciifad comelleduSRIlproc 1 ISRI-32pdf) e they
~ first Barker R R Loeve Y H Li and T P Tuong (eds) (2001) Water Saving Irrigation for rice Proceedings of an lnternational Workshop held in Wuhan China 23-25 March 2001 Colombo which Sri Lanka lnternational Water Management lnstitute raphic
Batuwitage GP (2002) Adaptations of the system of rice intensification in Sri Lanka In high Norman Uphoff et al (eds) 2002 Assessment of the system of rice intensification Proceedings anure of and international conference held in Sanya China April 1-4 2002 (httpciifadcomelleduSRJlSRI-Assessmentspdf
Bonlieu F (1999) Summary offindings from thesis research on SRI )Ie of (httpciifad cornell edusribonlieu pdf)
I CIMMYT (1988) From agronomic data to farmer recommendations an economics trammg manual Completely revised edition Mexico City Centro lnternacional de Mejoramiento de Maiz y Trigo (CIMMYT)
ved) Feder G RE Just and DZilberman (1982) Adoption of Agricultural Innovation in Developing
men Countries A survey World Bank Staff Working Papers Number 542
Javaya (Newspaper Published by Sri Lanka Ministry ofAgriculture) JanuaryFebruary 2000 Issue
Kikuchi M R Barker MSamad and P Welingamage (2002) Comparative advantage of rice production in Sri Lanka with special reference to irrigation costs Sombilla M MHossain BHardy (eds) Development in the rice economy Proceedings of the international workshop on medium-and -long term prospects of rice supply and demand in the 21 st Century 3-5 December 2001 Los Banos Philippines International Rice Research Institute 436p
McDonald JF and R A Mofitt (1980) The use of tobit analysis Review ofeconomics and statistics Volume 62 (2) pp318-321
McHugh OV TS Steenhuis J Barison ECM Fernandez and NT Uphoff (2002) Farmer implementation of alternate wet and dry and non-flooded irrigation practices in the system of rice intensification In Water-Wise rice production Bourn BMA HB Hardy PS Bindraban T P Tuong and J K Ladha (eds) Proceedings of the International Workshop on Water-Wise Rice Production 8-11 April Los Banos Philippines lnternational Rice Research Institute
Moser CM and CB Barrett (2002) The system of rice intensification in practice Explaining low farmer adoption and high disadoption in Madagascarln Water-Wise rice production Bourn BMA H B Hardy PS Bindraban T PTuong and JK Ladha (eds) Proceedings of the
355
~ shy Q
International Workshop on Water-Wise Rice Production 8-11 April Los Banos Philippines International Rice Research Institute
Norman Uphoff et al (eds) (2002) Assessment of the system of rice intensification Proceedings ofan international conference held in Sanya China April 1-4 2002 (httpciifadcomelleduSRIISRI-Assessmentspdf)
Rena Perez (2002) Experience in Cuba with the system of rice intensification Norman Uphoff et al (eds)2002 Assessment of the system of rice intensification Proceedings ofan international conference held in Sanya China April 1-4 2002 Aftel (httpciifadcomelleduSRIISRI-Assessmentspdf) appe(
in us Stoop WA Norman Uphoff and Amir Kassam (2002) A review of agricultural research issues indus raised by the system of rice intensification (SRI) from Madagascar opportunities for improving Taiwa farming systems for resource-poor farmers Agricultural Systems 71 (2002) 249-274 positi
positi Tiyagarajan et al (2002) Effects of SRI practices on hybrid rice performance in Tamil Nadu on pat India In Water-Wise rice production Bourn BMA H B Hardy PS Bindraban TPTuong Metho and lK Ladha (eds) Proceedings of the International Workshop on Water-Wise Rice Production the po 8-11 April Los Banos Philippines Losbanos (Philippines) International Rice Research Institute recogn
averagl consen the intI agricul1 agricult product fields re KeyWl Method
356
-o~
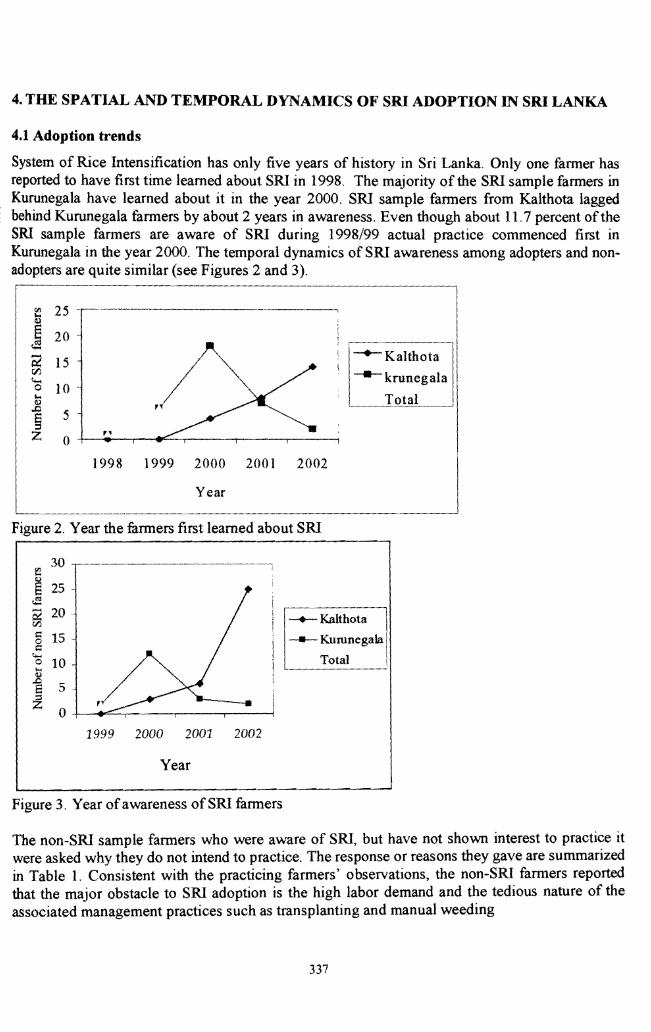
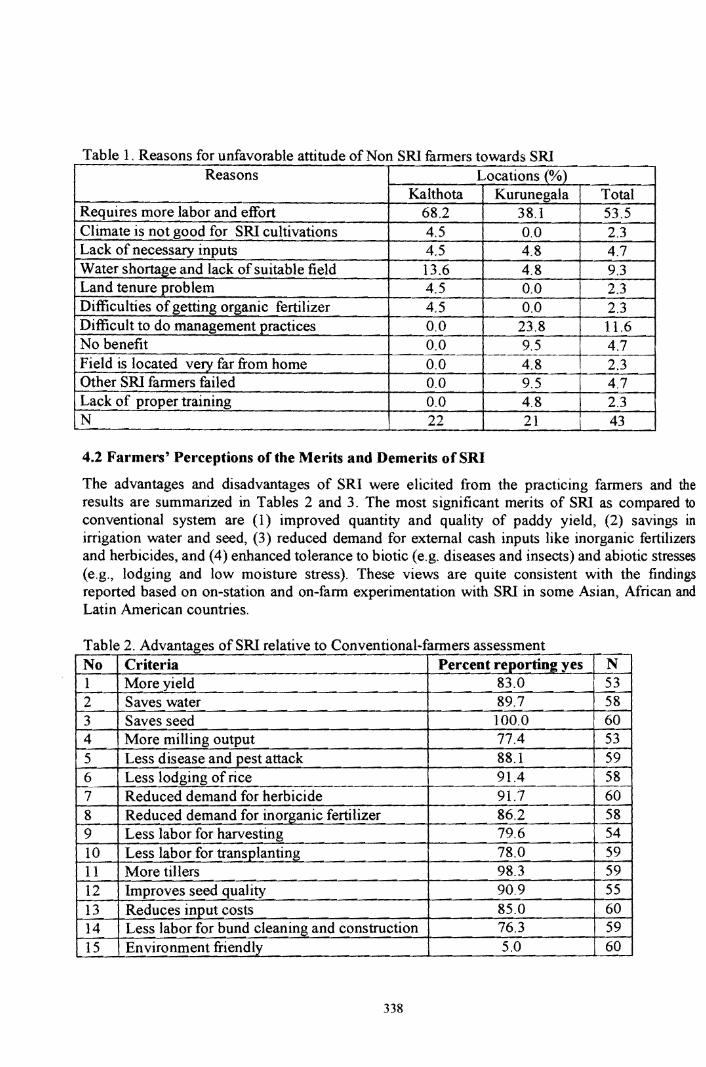

---
Table 3 Disadvantages of SRI relative to conventional-farmers assessment No Criteria Percent respondin2 yes N 1 Weed control problem 60600 2 Transplanting is difficult 367 60 3 60SRI transplanting requires special skill 250 4 Requires skilled labor for management 317 60 5 Demand more labor input 500 60 6 60Requires additional workdays 650 7 59Requires more effort 746 8 57Organic matter not available 579 9 57Transporting organic matter is problematic 509
6010 Problems ofMW handling and availability 767 6011 Mice attack due to unclean bunds 17 5812 SRI requires well drained soils 690
13 559 59Does not work on flooded fields
The most important demerits of SRI relate to its extremely high demand for labor problems of weed control and organic matter availability 77 percent of the practicing farmers complain that the the rotary weeder recommended for use in the SRI system is not readily available and even ifIto available not easy to handle im
rers sses
S FACTORS INFLUENCING ADOPTION AND DISADOPTIONngs and
Sl Determinants of SRI Adoption
The two most popular functional forms used for dichotomous discrete choice adoption models are the logit and the prohit models The advantage of these models is that the probabilities are bounded between 0 and 1 The logit model is selected here The odds of SRI adoption are defmed as the ratio of the probability of adoption (pi) to the probability of non-adoption (I-Pi)
Specifically the model is
The Xs are the hypothesised explanatory variables as defined in table 4 The variables hypothesized to influence adoption of SRI were derived from own informal assessment and literature reviews (Moser and Barrett 2002 McHugh et aI 2002) Since these variables are unlikely to operate independently a variable-by-variable analysis of relationships with farmers adoption of SRI is likely to be misleading (Feder et aI 1985) Hence logit analysis which uses a number of independent variables has been used to predict the probability offarmers SRI adoption
339
e~ p~ -
amp
0v (1shyA
--
ized to influence the
POVGR(X12)
LOCFA(X13)
LABAV(XI4)
The logistic regression model fitted to analyze the effect of these variables on the adoption decisions offarmers is presented in the table 5 Dependency ratio (DEPRA) age of the household head (AGEHH) and proportion of annual income from non-farm activities (PRNIN) reduces the likelihood of a farmer being SRI adopter By contrast family size (F AMIS) years of schooling (YSCHH) and participation in agricultural training programs (NFTPA) significantly increase the probability of a farmer being SRI adopter For instance as the family size of the farmer increases by a unit the likelihood of being SRI farmer increases by 145 times (see the exp (8) for variable F AMIS) The proportion of children between 7 and 14 increases the likelihood of SRI adoptioIl This is consistent with our field observation-- children were actively participating in the transplanting of SRI fields 9 Moreover studies in other countries showed that women and
7 Five organizations were identified and farmers were asked to confum whether they are ordinary members or leaders of these organizations in the past and at present Thus each farmer can score a minimum of zero (meaning not a member of any organization in the past and at present) and a maximum of 20 (meaning the farmer is a member and flays leadership role in all organizations in the past and at present ie 5x2x2)
This index was constructed from a set of questions designed to elicit farmers opinion regarding labor supply in his or her village or community 9 Whether this may be considered as a possible negative social effect of SRl or not depends on the situation of the without SRl scenario regarding children and women participation in the labor force in any particular locality
340
childre (Rena
Locatic irrigatt Thesemiddot that the Whyal the ob~ differel soil dl toleran availab investn which enhanc additio soil an the cha abunda family
Themlt irrigati4 middle mayse import maybe along t ends ~ certain succes water I field d
AnOthl buffalc signifi
~ gtl P~ -
amp
0J M
children are particularly suited for handling the transplanting of small and delicate rice seedlings (Rena Pervez 2002)
Location of the farm along the irrigation canal and generally the type of farming system (ie irrigated or rainfed farming system) had remarkable influence on the adoption pattern of SRI These important patterns are revealed by the variables LOCFA and FYLWS The model showed that the probability of adoption of SRI among irrigated farms is lower than that of rainfed farms Why are rainfed farmers more likely to adopt SRI than irrigated farmers This might be due to (1) the observed production risk differential among the two types of farming systems (2) the wage difference between rainfed and irrigated areas and (3) Increased water holding capacity of the soil due to improvement in organic matter content and hence enhanced low moisture stress tolerance of the rice crop The rainfed rice farming faces risk and uncertainty regarding the availability and distribution of rainfall Therefore rainfed paddy fanners are cautious about investments in cash inputs such as fertilizer herbicides and pesticides Hence for them SRI which decreases the demand for high-risk cash inputs is an ideal alternative rice productivityshyenhancing strategy Moreover as elaborated in the section 51 of this paper SRI involves the addition of huge amount of organic fertilizer which improves the water-holding capacity of the soil and hence easing the risk of low-moisture stress On the other hand high labor input forms the characteristic feature of SRI practice thereby making it attractive in those areas were there is abundant labor with relative lower wages The positive sign of labor availability (LABAV) and family size (FAMIS) variables further corroborates this argument
on )ld he ng he es lie
The model shows that there is no significant difference between farmers located at the head of the irrigation canal and rain-fed farmers regarding SRI adoption But the probability of adoption of middle and tail farmers is sign~ficantly lower than that for rainfed farmers At the first glance this may seem to contradict the widely held view that SRI saves water But this finding underlines the importance of irrigation water supply uncertainty In the advent of supply uncertainty farmers may be reluctant not to flood their paddy fields when water is available Why are farmers located along the head of the canal more likely to adopt SRI than those situated in the middle and tail ends This may be due to the fact that at least for irrigated farmers there must be some degree of certainty regarding the availability of irrigation water (or control over water supply) for successful adoption of SRI (McHugh et aI 2002) Farmers at the middle and the tail maintain a water layer on their fields as buffer in case irrigation water arrive at large intervals Keeping the field drained is very risky if they have no control over water
Another important variable having almost significant positive impact on SRI adoption is cattle or buffalo ownership through its effect on manure availability The model also shows that there is no significant difference in SRI adoption between poor and rich farmers
or ot ld
341
~ -a-
--
Table 5 Detenninants ofSRI adoption -Results oflogit regression analysis Variable Code B SE Exo(8
CONSTANT -23134 29217 -Dependency Ratio (DEPRA) -00454 00277 0955 Proportion ofChildren in the Family(PCIDL) 00462 00285 1047 Family Size (FAMIS) I 03095 01791 1362 Age ofthe Household Head (AGEHH) -00509 00359 0950 Years ofSchooling of the Household HeadjYSCHH) 01645 00861 1178 Number of Training Programs Attended (NFTPA) Number ofExtension Contact7NEXCY)
~~----
01760 00343
00901 05146 ~~i
Proprotion ofIncome from Rice (PRICEj 00048 00117 1004 Proportion ofNon-fann Income (pRNlN) -00039 00124 0996 Incidence ofYield Loss due to Low Water Stress (FYLWS) 00575 01509 1059 An Index of Social amp Political Capital (POSOLl 00327 00821 1033 Poverty Group (poor) 00464 06746 1047 Poverty Group (Middle) -11770 06857 0308 Povert Group (Rich)-reference cateSory Location of the Fann or Field (Head) -02209 09935 0801 Location ofthe Fann or Field (Middle) -15452 09161 0213 I Location ofthe Fann or Field (Tail) -19079 09309 0l48 Location ofthe Fann or Field (Rain fed J-reference category An Index ofLabour Availability Perception (LABA V) 01334 01438 1142 Number of Cattle Owned (CATTL) 05139 I 03380 1671 Notes significant at 10 probability level significant at 5probability level -2 Log Likelihood 10898 Model Chi-square = 46284 (df= 18p=00003) Cox and Snell Rl=038511
Nagelkerke K=0513 Percent correctly predicted = 7679 N=112
S2 Intensity of Adoption of SRI
The intensity of adoption once the fanner has decided to practice SRI was evaluated using the proPQrtion of SRI area in the total paddy cultivated during maha and yala seasons and the proportion of fanners who allotted 100 percent of their paddy field to SRI These are shown in figures 4 and 5 The proportion of paddy area allotted to SRI ranges from about 39 percent in Kalthota to about 61 percent in Kurunegala during Yala season Some fanners have also allotted their total rice field to SRI The proportion of such fanners ranges from as low as 10 percent in Kalthota to as high as 50 percent in Kurunegala (see figure 5) The proportion of SRI farmers with 100 percent of their paddy fields SRI is higher during Yaa than during Maha in Kurunegala
II In OLS models the R2 statistic represents the proportion of variability in the dependent variable that can be explained by the independent variables For logit regression model an easily interpretable measure of the strength of the relationship between the dependent variable and the independent variables is not available Cox and SneD and Nagelkerke Rl are attempts to imitate the interpretation ofR2 in OLS regression They are attempts to measure strength of associations
342
~ shyo-
---
Exp(B ~17 -77 0955 85 1047 91 1362 59 0950 61 1178 01 1192 6 1034 17 1004 ~4 0996 9 1059 1 1033 6 1047 7 0308
5 0801 I 0213 ~ 0148
~ 1142 ) 1671
ISing the and the hown in rcent in allotted rcent in fanners negala
gth of and
This is in line with the presumption that Yala season is more water scarce than Maha season and one of the advantages of SRI is to save water as has been elaborated in the previous sections
70
60
ttl 50
~ 40 ~
~ 30
~ 20
10
0
jYala I l__ M~
Kalthota Kurunegala
Locations
Figure 4 Proportion ofRice area allotted to SRI in 2002
it 60 T-~--~-------------- rJ)
~
8 50
~ 40 +
~ 30
~ E 20 f it 10 rJ)
f 0
Kalthota Kurunegala
Locations
Figure 5 Proportion of SRI fanners who allotted 100 percent of paddy area to SRI in 2002
In the previous section detenninants of SRI adoption decision were assessed However the extent or intensity of adoption once the adoption decision is made is important infonnation for research extension and policy This issue was evaluated using tobit regression model which allows the estimation of the likelihood ofadoption as well as the extent or intensity of adoption It is preferable to logit adoption model when the decision to adopt also involves simultaneously a choice regarding the intensity of adoption as it does with SRI practice The model can be specified as
where Yi is a latent variable representing the use of the SRI X is a vector of independent variables described in table 4 13 is a vector of unknown parameters and Ei is a disturbance
343
~ -oshy
assumed to be independently and normally distributed with zero mean and constant variance~ and i = ]2 n (n is the number of sample households)
Denoting yi (the proportion of SRI area in the total cultivated rice area) as the observed dependent (censored) variable
The proportion of paddy area allotted to SRI was regressed against various factors hypothesized to influence SRI adoption A common mistake made when interpreting tobit coefficients is to treat them as effects of the independent variable for cases above the limit To avoid this drawback the tobit coefficients were decomposed following McDonald and Moffitt (1980) and the results are presented in table 6
1n the incidence of adoption model (ie logit model) discussed in the previous section informational variables such as participation in training program and extension contact poverty status location of the farm the farming system (ie irrigated vs rainfed farming) and level of education were important variables in predicting SRI adoption 1n the tobit model which estimates both the incidence and intensity of adoption the informational variables have lost their explanatory power 1nstead variables related to labor availability (DEPRA and PCHlL) and organic matter availability (CATTL) are more relevant
Table 6 also shows the decomposition of the total elasticity of the variables12 The decomposition
consists of two components the probability of adopting in the first place and the potential increase in the area allotted to SRI once the decision to adopt has been made For example the total elasticity value for the years of schooling (YSCHH) is 0974 meaning that a 10 percent increase in the years of schooling is expected to result in about 97 percent in adoption and use intensity of the SRI practice The probability of adoption will increase by 73 percent while the intensity of adoption will increase by 24 percent The other variables in the table can be interpreted in an analogous manner
12 An elasticity of adoption measures the responsiveness to a particular variable and is equal to the relative change in adoption of a technology with respect to a small relative change in a given variable from current levels The elasticities obtained from the tobit model take into account that a change in the explanatory variable will simultaneously affect the number of SRI adopters and the proportion of acreage under SRI
344
~ shyo--
---
~e and
Table ~ The det~rminants ofthe extent or intensity of adoption of SRI- results of probit
endent tshynt
~sized is to
back lsults
tion verty elof rhich their and
tion 53 Determinants of SRI Disadoption ltial
the Disadoption is one important aspect which have not been given due consideration in past ent adoption research Information on the reasons why certain group of farmers failed to stick to the use technology recommended for use is of crucial importance for researchers extension workers and the policy makers For instance research may draw upon the drawbacks of the technology and be improve upon those drawbacks to increase the chance of acceptability and wider dissemination of
the technology among the intended beneficiaries
In light of this fact a logit model was fitted to the data on SRI farmers Most of the variables in the SRI adoption modeling of section 51 were also included here The additional variables incorporated in the current model are (1) An index of positive perception of farmers towards SRI (POSIP) constructed based on the
reported advantages of SRI vis-a-vis the conventional system of rice production presented in table 2 The value of the variable ranges from 0 to 15 where 0 indicates lowest positive attitude of the SRI practitioners towards SRI and 15 shows the strongest positive attitude towards SRI This variable is expected to have a negative relationship with disadoption since those farmers who had positive attitude towards SRI are expected to continue with SRI
(2) An index of negative perception of farmers towards SRI (NEGAP) constructed based on the reported disadvantages of SRI vis-a-vis conventional system of rice production presented in table 3 The value of the variable ranges from 0 to 13 where 0 indicates lowest negative attitude of the SRI practitioners towards SRI and 13 shows the strongest negative attitude
345
gt)~ 6)
-0~
~ 0 rt
towards SRI This variable is expected to have a positive relationship with disadoption since those fanners who had a negative attitude towards SRI are expected to cease practicing SRI
(3) Average realized SRI yield (kgacre) for SRI farmers while they were practicing We expect that those farmers who had better paddy yield during their first season(s) of experimenting with SRI will continue with SRI Contrarily a low level of realized yield would lead to dis adoption
(4) The other important variable is the perception of farmers regarding the cost of capital or availability of cash (CASHR) This variable is particularly important in the sense that one of the cases for promoting SRI is due to its lesser reliance on external inputs hence lesser requirement for cash or capital The value for this variable ranges from 1 to 5 where 1 indicates severe cash constraint and 5 indicates the absence of cash constraint We expect this variable to have positive relationship with disadoption
T bl 7 Da e etermmants 0 Isa optIon 0 fSRIR- esu ts 0 I fl Oglt regressIon analysIs Variable p INTERCEPT 5935 An Index of Degree ofPositive Perception (pOSIP) -0262 An Index ofDegree ofNegative Perception (NEGAP) 0064 Average Realized Yield (AVERY) -0002 Episodes ofRice Yield Loss due to Water Stress (FRRYL) 0310 Labor Availability (LABA V) -0424 Proportion of Children in the Family (PCIDL) -0032 Poverty Group (poor) -3021 Poverty Group (Middle) -2504 Number ofExtension Contact (NEXCY) -0314 Dependency Ratio (DEPRA) 0052 Years ofSchooling of the Household Head (YSCHH) -0065 Proprotion of Income from Rice (PRICE) -0016 An Index ofLabor Availability Perception (CASHR) 0766 Note means the coefficIent IS slgmficant at 5 slgnrficance level -2 Log likelihood = 3743 Cox and Snell R2 = 048 Nagelkerke k = 066 Percent correctly predicted = 867
SE 5565 0300 0231 0001 0451 0312 0062 1505 1618 0215 0057 0187 0020 0591
exp(p) 377943
0769 1066 0998 1364 0655 0968 0049 0082 0730 1053 0937 0985 2151
All of the variables included in the disadoption model had the expected signs (table 7) However only average realized yield during the first season(s) of practicing SRI (AVERY) and poverty status (POYGR) variables had statistically significant effect on disadoption Hence the success or failure of farmers during initial adoption process determines the acceptance and the pace of dissemination of a technology In the adoption model (table 5) there is no significant difference in the probability of adoption of SRI between poor and rich farmers However the probability of disadoption among poor farmers is significantly lower than that among rich farmers This implies that once the poor farmers adopt SRI they have higher probability of continuing with it than rich farmers
346
~ shyo -
---
I since SRI
r y r f
f
Among the perception variables farmers perceived cash availability (CASHR) labor availability (LABAV) frequency of rice yield loss due to water shortage (FRRYL) and an index of farmers positive attitude towards SRI (POSID) respectively had strong coefficients However these were not statistically significant
6 THE MICROECONOMICS OF SRI
61 Rice agronomy and irrigation water management
Fanners agronomic practices level of cash input utilization and irrigation water management differentiated by system of production (SRI vs conventional) and seasons (wet-maha and dryshyyala) are shown in table 8 Expectedly there is substantial difference between the two systems of rice production regarding planting method fertility management and weed control practices For instance an average SRI-farmer transplants one 8-days-old rice seedling per hill on a square grid of about 23 by 23 cm While most conventional fields were planted by way of broadcasting few conventional farmers have practiced transplanting However the SRI transplanting differs from the conventional transplanting in many ways The conventional farmers planted on average four IS-days-old rice seedlings in a clump per hill on a square grid of 15 by 15 cm which is narrower than that for SRI
Concerning soil fertility management significant differences are noted between the two systems Generally SRI farmers used lesser doses of inorganic and higher doses of organic fertilizer per unit area as compared to conventional farmers Moreover a considerable number of SRI farmers abandoned altogether the use of inorganic fertilizers instead they put a lot of organic fertilizers The main sources of organic fertilizers include cow dung tree leaves straw poultry manure compost and rice bran
Weed control method is another important aspect differentiating the two systems of production SRI farmers use herbicides rarely instead they make use of a mechanical weeder andor hand weeding The conventional farmers rely heavily on herbicides and they flood their paddy fields with water as a means of weed control It is important to flood the field at the correct stage
One of the main advantages of SRI is its water saving with little or no reductions in the paddy yield (Thiyagarajan et aI 2002) We attempted to have an indirect and rough idea of the magnitude of on-farm or field-level water savings through farmer estimates of number of irrigation and hours of irrigation per unit area13
On average number of irrigations and hours of irrigation per unit area of SRI-fields are respectively about 24 percent and 23 percent lesser than the conventional paddy fields However the difference between SRI and conventional regarding hours of irrigation is not statistically significant Consistent to our a priori expectations the per hectare hours of irrigation (for both SRI and Conventional fields) during yala season is greater
13 F arrners were asked the number of irrigation done for each rice field they owned during Yala and Aaha seasons Moreover they were asked to give approximate hours elapsed during successive irrigation Then the number of irrigations was multiplied by the hours elapsed and divided by the area of the field to give an estimate of hours of irrigation per unit area We admit that for more conclusive results an exact field-level measurement needs to be done preferably for a number offarrners
347
~~ 6)
a - ) v 0 rrshy-
than that of Maha season This is because Yala season is relatively water scarce as compared to Maha season (see figure 7)
4~~----------------------------~
400 3~
~ 300 2~ ~ 200
~ l~ 100 ~
o
~ ~ ~ ~ ~ sect ~ g ~ ~ ~ ~ Mon1hs
~-WbTZa] bull DRY ZONE --shy
Figure 7Monthly rain fall distribution for the Dry and Wet Zones of Sri Lanka (1961-1990)
Table 8 also clearly indicates that generally SRI fields demand higher amount of human labor (about 3 times more) This arises from planting (about 37 man-days per ha) weeding (about 31 man-days per hal bund construction and cleaning (about 41 man-days per hal and organic fertilizer collection and transportation (126 man days per hal The corresponding figures for conventional fields are 8l man-days for planting (broadcasting) 16 man-days for weeding 114 man-days for bund construction and cleaning and 73 man-days per ha for organic matter collection and transportation The amount of bund construction and cleaning labor for SRI is significantly lower than that for conventional fields This is because the SRI farmers were advised not to clean bunds in order to harbor beneficial organisms as an integrated pest management strategy
348
g l
()
g e 8t ~ e pound VI bullell oJ
1 1
0
~ ~ shy--sect bull
~ ))
=~ --(9
0 (~
- ----
shybl
~
(
(0
til
0
~1
0 c
P
~
II g
~ t
amp
e w
g K
G
_ _
I
n~
_
I
8
Tab
le 8
In
T
b -
f
d [~-~
Pra
ctic
es o
r In
puts
SR
I C
onve
ntio
nal
Yal
a M
aha
Yal
a
~and
M
ean
SD
N
Mea
n SD
N
M
ean
SD
N
Mea
n T
ract
or h
ours
per
ha
26
232
32
24
18
7
32
28
183
12
9 28
pr
epar
atio
n B
ullo
ck h
ours
per
ha
24
438
32
17
35
0
32
19
475
12
9 17
P
lant
ing
Tra
nspl
anti
ng h
ours
per
ha
244
152
32
352
262
32
114
144
37
271
Bro
adca
stin
g ho
urs
per h
a
-
--
-67
8
420
8
7
63
Nw
nber
ofs
eedl
ings
per
hill
1
1 0
3 32
1
4 0
7 32
4
0 1
2 35
3
7 A
ge o
fsee
dlin
gs in
day
s 7
6 1
9 32
8
4 2
7 32
18
3
5 3
8
185
S
paci
ng b
etw
een
plan
ts in
inch
es
95
13
31
94
13
32
59
15
19
59
Spa
cing
bet
wee
n ro
ws
in i
nche
s 9
7 1
2 32
9
6 1
1 32
6
0 1
6 19
6
2 S
eed
rate
kg
per h
a 14
10
0
32
17
12
32
117
38
11
2 11
4 F
erti
liza
tion
U
reap
erh
a 77
73
0
32
78
804
32
14
1 86
2
128
133
(Ino
rgan
ic)
TD
Mk
g p
erh
a 76
13
05
32
516
78
2
32
97
800
12
8 96
N
PK
kg
per
ha
57
105
6 32
45
74
1
32
104
718
12
8 10
0 T
SP
kg
per
ha
-
-
-
13
120
8 12
8 4
f ~~~
MO
P k
g pe
r ha
--
--
--
03
33
I 12
8 0
5 F
erti
liza
tion
C
ow d
ung
in k
g p
er h
a 20
24
3066
32
14
22
2541
32
15
3 61
78
129
152
(Org
anic
) T
ree
leav
es in
kg
per h
a 10
13
1443
32
73
3 25
133
32
24
7 16
200
129
131
Str
aw i
n kg
per
ha
951
1900
4
32
261
799
0 3
2
170
706
4 12
9 28
7 P
oult
ry m
anur
e in
kg
per h
a 73
25
85
32
39
149
6 32
31
34
95
128
75
Com
post
in k
g pe
r ha
62
349
5 32
23
13
1 3
2
--
--
Ric
e br
an i
n kg
per
ha
23
945
32
8
437
32
-
--
Wee
ding
H
erbi
cide
s li
ter
per
ha
015
0
87
32
008
0
31
32
2
29
325
12
9 2
14
Hou
rs o
fMec
hani
cal
Wee
ding
per
ha
283
281
32
213
260
32
3
233
12
7 2
Han
d W
eedi
ng H
ours
per
ha
69
934
32
57
90
6
32
4
217
12
9 15
H
ours
ofb
un
d c
onst
ruct
ion
and
clea
ning
per
ha
28
48
0
32
38
51
32
8
8
862
12
9 94
Ir
riga
tion
M
ean
Num
ber o
fIrr
igat
ion
24
179
24
22
17
2
25
32
259
10
3 29
H
ours
of i
rrig
atio
n pe
r ha
1942
24
25
21
1720
21
16
23
25
89
40
38
97
2154
H
arve
stin
g P
er h
a ho
urs
ofh
arve
stin
g 32
8 26
62
31
326
376
7 13
35
5 25
46
I 11
5 26
5
Mah
a SD
18
9
380
18
10
444
0
9 3
9 1
3 1
5 38
0
815
75
6
749
19
9
43
594
2 51
02
1022
6
659
8
~~
-3
07
175
0 54
3
100
3 25
8
2993
18
17
N1 (
145
145
38
106
i~
38
23
23
132
147
147
147
147
147
14
5 I
145
I
143
I
145
-- 144
145
145
144
III
103
84
lJ
j
0 14
N r
efer
s to
the
num
ber
off
ield
s S
ince
mos
t oft
he f
arm
ers
had
mor
e th
an o
ne c
onve
ntio
nal r
ice
fiel
ds t
he n
umbe
r ofs
ampl
e ho
useh
olds
and
the
num
ber o
f fi
elds
may
var
y A
ll o
fthe
SR
I fa
rmer
s ha
d on
ly o
ne S
RI
field
M
oreo
ver
not
all
oft
he o
rigi
na16
0 S
RI
sam
ple
farm
ers
had
prac
tice
d S
RI
duri
ng 2
002
---
62 Yield Comparisons
The mean paddy yields obtained during the last three years differentiated by the system of production and seasons are listed in table 9 The mean SRI yield even though not as dmmatic as figures reported from many sources is about 44 percent more than that for the conventional method (F value = 474 P=0031) The reported conventional yields are well within the range of figures estimated by Sri Lanka Department of Census and Statistics The Departments estimate of paddy yields for the country lies between 25 and 41 t per hectare depending on the type of farming system (ie rainfed or irrigated rice farming) and the type of irrigation scheme (Kikuchi et aI 2002)
SRI is fertili~
contin fertili2 the co Interes or con and UI respon trend)
T bl e 9 Ri f management (Kgh) level d a ceyleIdsunder SRI and conventlOna system 0 a in the differel
Year Sri Conventional yield increase Yala Maha Mean Yala Maha Mean
2000 4097 6236 5488 3635 3644 3641 507 2001 5056 5327 5215 3516 3749 3633 435 2002 5737 5977 5811 4189 3832 4041 438 Mean 5299 5763 5524 3910 3757 3836 440
The set fertilizeuro the SUC4
However the yields reported in table 9 above conceal the effects of location and adoption15status The highest paddy yield (81 t ha) was recorded for SRI in Kalthota area during Maha
season for adopter group while the lowest (21 tha) was recorded for dis adopters during Yala season in Kurunegala (Table 10) Generally disadopters experienced the lowest paddy yield during the first year of adoption forcing them to discontinue the SRI pmctice The disadoption model of Section 53 also corroborates this fact Location-wise the yields recorded for Kalthota area are significantly better than those recorded for Kurunegala farmers irrespective ofthe system of production From table 10 one can also infer that the prospect of harvesting better paddy yield is higher for the Maha season than the Yala season which is in line with the usual expectation
Table 10 Paddy yield per acre by adoption status season year and location (kgha Location Year SRI Conventional
Ado ters Disado ters Ado tefs Disadopters Yala Maha Yala Maha Yala Maha Yala Maha
Kurunegala 2000 5726 7217 2102 4668 3501 3063 3769 4372 -
2001 6011 5499 4100 4628 4040 3628 2942 3851 2002 5619 5977 NA NA 3071 3702 3863 3911 Mean 5785 6231 3101 4648 3537 3464 3524 4045
Kalthota 2000 NA NA NA NA NA NA NA NA 2001 NA 8154 NA NA 6795 NA NA NA 2002 5806 NA NA NA 4900 NA NA NA Mean 5806 8154 NA NA 5848 NA NA NA
NA means not applicable
15 The original SRI sample farmers who have not practiced SRI during Yaa or Maha seasons of the year 2002 are regarded as disadopters By these criteria 20 of the 60 SRI sample farmers are disadopters
350
differet1 the orgc ofnutril
Table 1 Inorga
o oto 100 100 to 2 200ampa
--ornrutn F value The in
Table 1 Inorga
0 otol0( 100 to 200amp Grand F valueuro The 11
~ shyo-
---
- --
SRI is usually considered as a practice that gives substantial yield without the use of inorganic fertilizer (Barison 2002) Despite the advice not to use inorganic fertilizer some farmers have
tic as continued to use it with varying intensities The SRI farmers level of utilization of inorganictional fertilizer has been arbitrarily classified into four strata starting with zero level of utilization and ge of the corresponding paddy yields recorded for each stratum are reported are shown in Table 11
Interestingly the SRI farmers who did not apply any form of inorganic fertilizer recorded better or comparable yields to those farmers who applied up to and above 200 kg of fertilizer in Yala and up to 200 kg during Maha Another important observation is that while the paddy yield response to the applied fertilizer levels has slowed (ie the marginal product has shown declining trend) during Yala the yield response to additional levels of fertilizer has not reached optimum level during Maha The reason for this remarkable response difference may be due to variations in the level of available water during the two seasons Therefore the two seasons might need different fertilizer recommendations
The scenario for conventional paddy fields is different in that the response to the applied levels of fertilizer has been linear ie zero-inorganic fertilizer fields gave on average lower yields than the successive levels of fertilization especially during maha season (table 12) The reason for this difference is due to the fact that on SRI fields the added inorganic fertilizer was supplementary to )tion the organic fertilizer while for conventional fields chemical fertilizer was mostly the main source (aha of nutrients
Yala rield
Table 11 Yield comparison by level of fertilizer application (kgha )-SRI farmers tion
Inorganic fertilizer (kgha) I Yalanota Mean SD Ntern
0 5792 2715 5ieJd oto 100 4851 92133n 100 to 200 5954 2350 3 200 amp above 6481 2755 13r----------------------shyGrand mean 5825 2506 30 F value 1741(p=0195)s
MahaMeanshy SD~N 4349 2460 2 4159 3279 4 5362 2202 2 9133 1977 4 6049 3218 12 __~~285 (p=003 5)
The morgamc fertilizers were UREA TSP NPK and MOP
2 Table 12 Yield comparison by level of fertilizer application (kgha) - conventional farmers
la
ii3----~---Inorganic fertilizer (kgac) Yala c------shy
Mean SD N _M~a~r~~~_ __~ 0 3970 1786 9 1821 1136 ~ oto 100 4153 3797 J 1615 301699 28 100 to 200 4384 I 1975 68 3805 j 1930 35
1020200 amp above 5052 2153 4449 i 1522 4409 1936 80Grand mean 125 3758 i 1786
2625 (P=0056)F value 1058 (p=0370) The morgamc fertlhzers mclude UREA TSP NPK and MOP
351
~ -o shy
63 Profitability Comparisons
The microeconomics of the two systems of rice production was assessed using budgeting technique 16 Net returns were estimated for each farmer using the relationships
NR=GR-TC
VC=L- PXI I
TC=VC+F GR=RYRP
Where NR= Net Returns GR= Gross Returns VC= Variable Cost RY= Rice yield for SRI and conventional system RP= Rice price Pi =per unit price of the ith input and Xi= quantity of the ith input F is fixed cost and TC is total cost
The individual budgets prepared for each and every sample farmers differentiated by system of production and seasons (ie SRI and conventional) were averaged to facilitate easy comparisons (see table 13) Moreover the budgets were prepared under three wage-rate scenarios ie zero wage rate or family labor on-going farm wage rate and non-farm wage rate It is interesting to note that contrary to the survey farmers own subjective assessment and reports from different angles the cost of production per unit area for SRI is higher or at least comparable to that of conventional rice production17
Even though SRI reduces or avoids the use of cash inputs such as fertilizer and herbicides the resulting savings can not fully compensate for the additional costs born due to greater labor input for weeding transplanting and organic matter collection and transporting However the costs per unit of paddy output (Rupees per Kilogram) are lower than those of conventional due to significant increases in yield Consequently the estimated profit figures for SRI is almost double that of conventional practice for both seasons But it may be noted that this level ofprofitability is achieved with a lot ofdrudgery
In addition to the reported positive profitability figures table 13 also shows that some farmers experienced loss during both seasons This shows the advantage of budgeting for each farm than for average farm Two inferences may be made First the incidence of loss is higher for Yaa than for Maha season Secondly the incidence of loss among SRI farmers is substantially lower than that for conventional farms irrespective of the season
In Sri Lanka it is usually claimed that the competitiveness of rice sector has been worsen by the relative high wage rate Careful scrutiny of the costs and revenues of paddy production systems under three wage rate regimes presented in the table 13 tempts us to believe this claim
16 Entetprise budgeting technique was preferred to Partial Budgeting because SRI involves a major overhaul of the conventional rice production system Had the changes in the production system been minor partial budgeting would have been the natural choice according to C IMMYT (1988) 17 The costs include both cash and imputed labor and material costs
352
~ shy o-
enterprise following
)r SRI and
system of mparisons ie zero resting to ~ different
that of such as
costs and
than profit
may be
Table 13 Summary Results of the Enterprise budgets IProduction Seasonmiddot Wage rate Gross Total cost Net Costlkg Inciden bull system Revenue (RS) (RS) Revenue (RS) ce of
(Rs) loss SRI Yala Zero 34899 6506 29371 36 1
farm 34899 18907 15992 111 4 Non-farm 34899 24842 10223 150 6
Maha Zero 36720 5291 34575 22 0 farm 36720 20435 16285 87 1 Non-farm 37620 26493 13374 114 2
--_
Conventional Yala Zero 27017 10742 16032 76 9 farm 27017 18600 8417 133 27 Non-farm 27017 22248 4215 15s 29
i Maha Zero 23871 9503 14373 68 0 farm 23871 16381 7490 119 15
I Non-farm 23871 19687 4369 140 22
7 CONCLUSIONS AND IMPLICATIONS
1 The main advantages of SRI include yield increase reduced number of irrigations or irrigation-hours per irrigation and per unit area (ie increase in water productivity) reduced demand for cash inputs improved seed quality and higher milling ratio In addition to these private benefits SRI embodies added societal or environmental benefits due to reductions in the use of environment-unfriendly inputs such as herbicides and fertilizers It is not clear however if the observed on-farm water productivity can be translated into net water-saving at watershed or basin level which is an issue requiring further analyses This can be realized only if the practice is widely adopted and the farmers do not increase acreage
2 The System ofRice Intensification has a short history in Sri Lanka Its adoption process is dynamic in the sense that the adopters may quit the practice for some time and then reuse it when the circumstances allow This is because the practice involves little capital investment during initial adoption decision
3 The main variables influencing the incidence of SRI adoption are (i) location of the farm (ii) the type of farming system (ie irrigated Vs rain-fed farming) (iii) poverty status of the farmer (iv) participation in training programs (v) education status and (vi) the size and demographic structure of the farm family
4 The absence of significant difference in SRI adoption probability between farmers located at the head of irrigation canal and rain-fed farmers and the observed lower probability of SRI adoption among those located at the middle and tail end of irrigation canal underlines the importance of irrigation water supply risk and uncertainty variable in SRI adoption decision Hence contrary to the ideal SRI practice farmers at the middle and tail maintain a water layer on their field as a buffer to offset the risk of irregularity regarding irrigation water arrival This may also be done to reduce weed growth On the other hand the total dependence on rain for paddy cultivation means that the farmers are more cautious in
353
~ -o
investing in conventional yield enhancing cash inputs Therefore SRI which minimizes or avoids the use of such inputs is the logical alternative for rain-fed farmers
Barisshy5 SRI adopters mai nly come from the lowest and the highest poverty terciles of the farming convc
population In other words there is no significant difference in SRI adoption probability (http1between rich and poor farmers But poor farmers are likely to persist with SRI once they practice SRI than the rich farmers Moreover low realized yield during the first Barkeexperiment with SRI is the major factor behind discontinuing the SRI practice Proce
6 The main variables affecting the intensity of adoption of SRI are cattle ownership which Sri Lais a proxy for organic mater availability education status and the size and demographic structure of the farm family Batuv
7 The main problems associated with SRI practice are the demand for skills and high Norm amount of labor for weed control and transplanting non-availability of organic manure ofamiand limited availability of the rotary weeders (ht1JtL
8 The most appropriate domain (target group) for SRI adoption are those farmers a With limited land holdings
Bonlishyb Having bigger family size with high proportion of the family members capable of (htRL
engaging in work c Who are cash constrained d For whom rice constitutes the lions share ofannual income and consumption C~
e With limited alternative employment opportunities manw yTrigf With relative certainty regarding irrigation water supply and
g Practicing rainfed paddy cultivation 9 Generally SRI demands higher amounts labor per unit area (a lot of drudgery is involved) Feder
and induces the active participation of children between 7 and 14 years ofage and women Coun1 However whether this is a significant social disutility is a matter for further scrutiny
Javay issue
Kikuc produ BHaJ ~edil 2001
McDI staas
354
~ -o
lzes or REFERENCES
~rming Barison J (2002) Evaluation of nutrient up take and nutrient use efficiency of SRI and conventional rice cultivation methods in Madagascar ability (httpciifad comelleduSRIlproc 1 ISRI-32pdf) e they
~ first Barker R R Loeve Y H Li and T P Tuong (eds) (2001) Water Saving Irrigation for rice Proceedings of an lnternational Workshop held in Wuhan China 23-25 March 2001 Colombo which Sri Lanka lnternational Water Management lnstitute raphic
Batuwitage GP (2002) Adaptations of the system of rice intensification in Sri Lanka In high Norman Uphoff et al (eds) 2002 Assessment of the system of rice intensification Proceedings anure of and international conference held in Sanya China April 1-4 2002 (httpciifadcomelleduSRJlSRI-Assessmentspdf
Bonlieu F (1999) Summary offindings from thesis research on SRI )Ie of (httpciifad cornell edusribonlieu pdf)
I CIMMYT (1988) From agronomic data to farmer recommendations an economics trammg manual Completely revised edition Mexico City Centro lnternacional de Mejoramiento de Maiz y Trigo (CIMMYT)
ved) Feder G RE Just and DZilberman (1982) Adoption of Agricultural Innovation in Developing
men Countries A survey World Bank Staff Working Papers Number 542
Javaya (Newspaper Published by Sri Lanka Ministry ofAgriculture) JanuaryFebruary 2000 Issue
Kikuchi M R Barker MSamad and P Welingamage (2002) Comparative advantage of rice production in Sri Lanka with special reference to irrigation costs Sombilla M MHossain BHardy (eds) Development in the rice economy Proceedings of the international workshop on medium-and -long term prospects of rice supply and demand in the 21 st Century 3-5 December 2001 Los Banos Philippines International Rice Research Institute 436p
McDonald JF and R A Mofitt (1980) The use of tobit analysis Review ofeconomics and statistics Volume 62 (2) pp318-321
McHugh OV TS Steenhuis J Barison ECM Fernandez and NT Uphoff (2002) Farmer implementation of alternate wet and dry and non-flooded irrigation practices in the system of rice intensification In Water-Wise rice production Bourn BMA HB Hardy PS Bindraban T P Tuong and J K Ladha (eds) Proceedings of the International Workshop on Water-Wise Rice Production 8-11 April Los Banos Philippines lnternational Rice Research Institute
Moser CM and CB Barrett (2002) The system of rice intensification in practice Explaining low farmer adoption and high disadoption in Madagascarln Water-Wise rice production Bourn BMA H B Hardy PS Bindraban T PTuong and JK Ladha (eds) Proceedings of the
355
~ shy Q
International Workshop on Water-Wise Rice Production 8-11 April Los Banos Philippines International Rice Research Institute
Norman Uphoff et al (eds) (2002) Assessment of the system of rice intensification Proceedings ofan international conference held in Sanya China April 1-4 2002 (httpciifadcomelleduSRIISRI-Assessmentspdf)
Rena Perez (2002) Experience in Cuba with the system of rice intensification Norman Uphoff et al (eds)2002 Assessment of the system of rice intensification Proceedings ofan international conference held in Sanya China April 1-4 2002 Aftel (httpciifadcomelleduSRIISRI-Assessmentspdf) appe(
in us Stoop WA Norman Uphoff and Amir Kassam (2002) A review of agricultural research issues indus raised by the system of rice intensification (SRI) from Madagascar opportunities for improving Taiwa farming systems for resource-poor farmers Agricultural Systems 71 (2002) 249-274 positi
positi Tiyagarajan et al (2002) Effects of SRI practices on hybrid rice performance in Tamil Nadu on pat India In Water-Wise rice production Bourn BMA H B Hardy PS Bindraban TPTuong Metho and lK Ladha (eds) Proceedings of the International Workshop on Water-Wise Rice Production the po 8-11 April Los Banos Philippines Losbanos (Philippines) International Rice Research Institute recogn
averagl consen the intI agricul1 agricult product fields re KeyWl Method
356
-o~

--
ized to influence the
POVGR(X12)
LOCFA(X13)
LABAV(XI4)
The logistic regression model fitted to analyze the effect of these variables on the adoption decisions offarmers is presented in the table 5 Dependency ratio (DEPRA) age of the household head (AGEHH) and proportion of annual income from non-farm activities (PRNIN) reduces the likelihood of a farmer being SRI adopter By contrast family size (F AMIS) years of schooling (YSCHH) and participation in agricultural training programs (NFTPA) significantly increase the probability of a farmer being SRI adopter For instance as the family size of the farmer increases by a unit the likelihood of being SRI farmer increases by 145 times (see the exp (8) for variable F AMIS) The proportion of children between 7 and 14 increases the likelihood of SRI adoptioIl This is consistent with our field observation-- children were actively participating in the transplanting of SRI fields 9 Moreover studies in other countries showed that women and
7 Five organizations were identified and farmers were asked to confum whether they are ordinary members or leaders of these organizations in the past and at present Thus each farmer can score a minimum of zero (meaning not a member of any organization in the past and at present) and a maximum of 20 (meaning the farmer is a member and flays leadership role in all organizations in the past and at present ie 5x2x2)
This index was constructed from a set of questions designed to elicit farmers opinion regarding labor supply in his or her village or community 9 Whether this may be considered as a possible negative social effect of SRl or not depends on the situation of the without SRl scenario regarding children and women participation in the labor force in any particular locality
340
childre (Rena
Locatic irrigatt Thesemiddot that the Whyal the ob~ differel soil dl toleran availab investn which enhanc additio soil an the cha abunda family
Themlt irrigati4 middle mayse import maybe along t ends ~ certain succes water I field d
AnOthl buffalc signifi
~ gtl P~ -
amp
0J M
children are particularly suited for handling the transplanting of small and delicate rice seedlings (Rena Pervez 2002)
Location of the farm along the irrigation canal and generally the type of farming system (ie irrigated or rainfed farming system) had remarkable influence on the adoption pattern of SRI These important patterns are revealed by the variables LOCFA and FYLWS The model showed that the probability of adoption of SRI among irrigated farms is lower than that of rainfed farms Why are rainfed farmers more likely to adopt SRI than irrigated farmers This might be due to (1) the observed production risk differential among the two types of farming systems (2) the wage difference between rainfed and irrigated areas and (3) Increased water holding capacity of the soil due to improvement in organic matter content and hence enhanced low moisture stress tolerance of the rice crop The rainfed rice farming faces risk and uncertainty regarding the availability and distribution of rainfall Therefore rainfed paddy fanners are cautious about investments in cash inputs such as fertilizer herbicides and pesticides Hence for them SRI which decreases the demand for high-risk cash inputs is an ideal alternative rice productivityshyenhancing strategy Moreover as elaborated in the section 51 of this paper SRI involves the addition of huge amount of organic fertilizer which improves the water-holding capacity of the soil and hence easing the risk of low-moisture stress On the other hand high labor input forms the characteristic feature of SRI practice thereby making it attractive in those areas were there is abundant labor with relative lower wages The positive sign of labor availability (LABAV) and family size (FAMIS) variables further corroborates this argument
on )ld he ng he es lie
The model shows that there is no significant difference between farmers located at the head of the irrigation canal and rain-fed farmers regarding SRI adoption But the probability of adoption of middle and tail farmers is sign~ficantly lower than that for rainfed farmers At the first glance this may seem to contradict the widely held view that SRI saves water But this finding underlines the importance of irrigation water supply uncertainty In the advent of supply uncertainty farmers may be reluctant not to flood their paddy fields when water is available Why are farmers located along the head of the canal more likely to adopt SRI than those situated in the middle and tail ends This may be due to the fact that at least for irrigated farmers there must be some degree of certainty regarding the availability of irrigation water (or control over water supply) for successful adoption of SRI (McHugh et aI 2002) Farmers at the middle and the tail maintain a water layer on their fields as buffer in case irrigation water arrive at large intervals Keeping the field drained is very risky if they have no control over water
Another important variable having almost significant positive impact on SRI adoption is cattle or buffalo ownership through its effect on manure availability The model also shows that there is no significant difference in SRI adoption between poor and rich farmers
or ot ld
341
~ -a-
--
Table 5 Detenninants ofSRI adoption -Results oflogit regression analysis Variable Code B SE Exo(8
CONSTANT -23134 29217 -Dependency Ratio (DEPRA) -00454 00277 0955 Proportion ofChildren in the Family(PCIDL) 00462 00285 1047 Family Size (FAMIS) I 03095 01791 1362 Age ofthe Household Head (AGEHH) -00509 00359 0950 Years ofSchooling of the Household HeadjYSCHH) 01645 00861 1178 Number of Training Programs Attended (NFTPA) Number ofExtension Contact7NEXCY)
~~----
01760 00343
00901 05146 ~~i
Proprotion ofIncome from Rice (PRICEj 00048 00117 1004 Proportion ofNon-fann Income (pRNlN) -00039 00124 0996 Incidence ofYield Loss due to Low Water Stress (FYLWS) 00575 01509 1059 An Index of Social amp Political Capital (POSOLl 00327 00821 1033 Poverty Group (poor) 00464 06746 1047 Poverty Group (Middle) -11770 06857 0308 Povert Group (Rich)-reference cateSory Location of the Fann or Field (Head) -02209 09935 0801 Location ofthe Fann or Field (Middle) -15452 09161 0213 I Location ofthe Fann or Field (Tail) -19079 09309 0l48 Location ofthe Fann or Field (Rain fed J-reference category An Index ofLabour Availability Perception (LABA V) 01334 01438 1142 Number of Cattle Owned (CATTL) 05139 I 03380 1671 Notes significant at 10 probability level significant at 5probability level -2 Log Likelihood 10898 Model Chi-square = 46284 (df= 18p=00003) Cox and Snell Rl=038511
Nagelkerke K=0513 Percent correctly predicted = 7679 N=112
S2 Intensity of Adoption of SRI
The intensity of adoption once the fanner has decided to practice SRI was evaluated using the proPQrtion of SRI area in the total paddy cultivated during maha and yala seasons and the proportion of fanners who allotted 100 percent of their paddy field to SRI These are shown in figures 4 and 5 The proportion of paddy area allotted to SRI ranges from about 39 percent in Kalthota to about 61 percent in Kurunegala during Yala season Some fanners have also allotted their total rice field to SRI The proportion of such fanners ranges from as low as 10 percent in Kalthota to as high as 50 percent in Kurunegala (see figure 5) The proportion of SRI farmers with 100 percent of their paddy fields SRI is higher during Yaa than during Maha in Kurunegala
II In OLS models the R2 statistic represents the proportion of variability in the dependent variable that can be explained by the independent variables For logit regression model an easily interpretable measure of the strength of the relationship between the dependent variable and the independent variables is not available Cox and SneD and Nagelkerke Rl are attempts to imitate the interpretation ofR2 in OLS regression They are attempts to measure strength of associations
342
~ shyo-
---
Exp(B ~17 -77 0955 85 1047 91 1362 59 0950 61 1178 01 1192 6 1034 17 1004 ~4 0996 9 1059 1 1033 6 1047 7 0308
5 0801 I 0213 ~ 0148
~ 1142 ) 1671
ISing the and the hown in rcent in allotted rcent in fanners negala
gth of and
This is in line with the presumption that Yala season is more water scarce than Maha season and one of the advantages of SRI is to save water as has been elaborated in the previous sections
70
60
ttl 50
~ 40 ~
~ 30
~ 20
10
0
jYala I l__ M~
Kalthota Kurunegala
Locations
Figure 4 Proportion ofRice area allotted to SRI in 2002
it 60 T-~--~-------------- rJ)
~
8 50
~ 40 +
~ 30
~ E 20 f it 10 rJ)
f 0
Kalthota Kurunegala
Locations
Figure 5 Proportion of SRI fanners who allotted 100 percent of paddy area to SRI in 2002
In the previous section detenninants of SRI adoption decision were assessed However the extent or intensity of adoption once the adoption decision is made is important infonnation for research extension and policy This issue was evaluated using tobit regression model which allows the estimation of the likelihood ofadoption as well as the extent or intensity of adoption It is preferable to logit adoption model when the decision to adopt also involves simultaneously a choice regarding the intensity of adoption as it does with SRI practice The model can be specified as
where Yi is a latent variable representing the use of the SRI X is a vector of independent variables described in table 4 13 is a vector of unknown parameters and Ei is a disturbance
343
~ -oshy
assumed to be independently and normally distributed with zero mean and constant variance~ and i = ]2 n (n is the number of sample households)
Denoting yi (the proportion of SRI area in the total cultivated rice area) as the observed dependent (censored) variable
The proportion of paddy area allotted to SRI was regressed against various factors hypothesized to influence SRI adoption A common mistake made when interpreting tobit coefficients is to treat them as effects of the independent variable for cases above the limit To avoid this drawback the tobit coefficients were decomposed following McDonald and Moffitt (1980) and the results are presented in table 6
1n the incidence of adoption model (ie logit model) discussed in the previous section informational variables such as participation in training program and extension contact poverty status location of the farm the farming system (ie irrigated vs rainfed farming) and level of education were important variables in predicting SRI adoption 1n the tobit model which estimates both the incidence and intensity of adoption the informational variables have lost their explanatory power 1nstead variables related to labor availability (DEPRA and PCHlL) and organic matter availability (CATTL) are more relevant
Table 6 also shows the decomposition of the total elasticity of the variables12 The decomposition
consists of two components the probability of adopting in the first place and the potential increase in the area allotted to SRI once the decision to adopt has been made For example the total elasticity value for the years of schooling (YSCHH) is 0974 meaning that a 10 percent increase in the years of schooling is expected to result in about 97 percent in adoption and use intensity of the SRI practice The probability of adoption will increase by 73 percent while the intensity of adoption will increase by 24 percent The other variables in the table can be interpreted in an analogous manner
12 An elasticity of adoption measures the responsiveness to a particular variable and is equal to the relative change in adoption of a technology with respect to a small relative change in a given variable from current levels The elasticities obtained from the tobit model take into account that a change in the explanatory variable will simultaneously affect the number of SRI adopters and the proportion of acreage under SRI
344
~ shyo--
---
~e and
Table ~ The det~rminants ofthe extent or intensity of adoption of SRI- results of probit
endent tshynt
~sized is to
back lsults
tion verty elof rhich their and
tion 53 Determinants of SRI Disadoption ltial
the Disadoption is one important aspect which have not been given due consideration in past ent adoption research Information on the reasons why certain group of farmers failed to stick to the use technology recommended for use is of crucial importance for researchers extension workers and the policy makers For instance research may draw upon the drawbacks of the technology and be improve upon those drawbacks to increase the chance of acceptability and wider dissemination of
the technology among the intended beneficiaries
In light of this fact a logit model was fitted to the data on SRI farmers Most of the variables in the SRI adoption modeling of section 51 were also included here The additional variables incorporated in the current model are (1) An index of positive perception of farmers towards SRI (POSIP) constructed based on the
reported advantages of SRI vis-a-vis the conventional system of rice production presented in table 2 The value of the variable ranges from 0 to 15 where 0 indicates lowest positive attitude of the SRI practitioners towards SRI and 15 shows the strongest positive attitude towards SRI This variable is expected to have a negative relationship with disadoption since those farmers who had positive attitude towards SRI are expected to continue with SRI
(2) An index of negative perception of farmers towards SRI (NEGAP) constructed based on the reported disadvantages of SRI vis-a-vis conventional system of rice production presented in table 3 The value of the variable ranges from 0 to 13 where 0 indicates lowest negative attitude of the SRI practitioners towards SRI and 13 shows the strongest negative attitude
345
gt)~ 6)
-0~
~ 0 rt
towards SRI This variable is expected to have a positive relationship with disadoption since those fanners who had a negative attitude towards SRI are expected to cease practicing SRI
(3) Average realized SRI yield (kgacre) for SRI farmers while they were practicing We expect that those farmers who had better paddy yield during their first season(s) of experimenting with SRI will continue with SRI Contrarily a low level of realized yield would lead to dis adoption
(4) The other important variable is the perception of farmers regarding the cost of capital or availability of cash (CASHR) This variable is particularly important in the sense that one of the cases for promoting SRI is due to its lesser reliance on external inputs hence lesser requirement for cash or capital The value for this variable ranges from 1 to 5 where 1 indicates severe cash constraint and 5 indicates the absence of cash constraint We expect this variable to have positive relationship with disadoption
T bl 7 Da e etermmants 0 Isa optIon 0 fSRIR- esu ts 0 I fl Oglt regressIon analysIs Variable p INTERCEPT 5935 An Index of Degree ofPositive Perception (pOSIP) -0262 An Index ofDegree ofNegative Perception (NEGAP) 0064 Average Realized Yield (AVERY) -0002 Episodes ofRice Yield Loss due to Water Stress (FRRYL) 0310 Labor Availability (LABA V) -0424 Proportion of Children in the Family (PCIDL) -0032 Poverty Group (poor) -3021 Poverty Group (Middle) -2504 Number ofExtension Contact (NEXCY) -0314 Dependency Ratio (DEPRA) 0052 Years ofSchooling of the Household Head (YSCHH) -0065 Proprotion of Income from Rice (PRICE) -0016 An Index ofLabor Availability Perception (CASHR) 0766 Note means the coefficIent IS slgmficant at 5 slgnrficance level -2 Log likelihood = 3743 Cox and Snell R2 = 048 Nagelkerke k = 066 Percent correctly predicted = 867
SE 5565 0300 0231 0001 0451 0312 0062 1505 1618 0215 0057 0187 0020 0591
exp(p) 377943
0769 1066 0998 1364 0655 0968 0049 0082 0730 1053 0937 0985 2151
All of the variables included in the disadoption model had the expected signs (table 7) However only average realized yield during the first season(s) of practicing SRI (AVERY) and poverty status (POYGR) variables had statistically significant effect on disadoption Hence the success or failure of farmers during initial adoption process determines the acceptance and the pace of dissemination of a technology In the adoption model (table 5) there is no significant difference in the probability of adoption of SRI between poor and rich farmers However the probability of disadoption among poor farmers is significantly lower than that among rich farmers This implies that once the poor farmers adopt SRI they have higher probability of continuing with it than rich farmers
346
~ shyo -
---
I since SRI
r y r f
f
Among the perception variables farmers perceived cash availability (CASHR) labor availability (LABAV) frequency of rice yield loss due to water shortage (FRRYL) and an index of farmers positive attitude towards SRI (POSID) respectively had strong coefficients However these were not statistically significant
6 THE MICROECONOMICS OF SRI
61 Rice agronomy and irrigation water management
Fanners agronomic practices level of cash input utilization and irrigation water management differentiated by system of production (SRI vs conventional) and seasons (wet-maha and dryshyyala) are shown in table 8 Expectedly there is substantial difference between the two systems of rice production regarding planting method fertility management and weed control practices For instance an average SRI-farmer transplants one 8-days-old rice seedling per hill on a square grid of about 23 by 23 cm While most conventional fields were planted by way of broadcasting few conventional farmers have practiced transplanting However the SRI transplanting differs from the conventional transplanting in many ways The conventional farmers planted on average four IS-days-old rice seedlings in a clump per hill on a square grid of 15 by 15 cm which is narrower than that for SRI
Concerning soil fertility management significant differences are noted between the two systems Generally SRI farmers used lesser doses of inorganic and higher doses of organic fertilizer per unit area as compared to conventional farmers Moreover a considerable number of SRI farmers abandoned altogether the use of inorganic fertilizers instead they put a lot of organic fertilizers The main sources of organic fertilizers include cow dung tree leaves straw poultry manure compost and rice bran
Weed control method is another important aspect differentiating the two systems of production SRI farmers use herbicides rarely instead they make use of a mechanical weeder andor hand weeding The conventional farmers rely heavily on herbicides and they flood their paddy fields with water as a means of weed control It is important to flood the field at the correct stage
One of the main advantages of SRI is its water saving with little or no reductions in the paddy yield (Thiyagarajan et aI 2002) We attempted to have an indirect and rough idea of the magnitude of on-farm or field-level water savings through farmer estimates of number of irrigation and hours of irrigation per unit area13
On average number of irrigations and hours of irrigation per unit area of SRI-fields are respectively about 24 percent and 23 percent lesser than the conventional paddy fields However the difference between SRI and conventional regarding hours of irrigation is not statistically significant Consistent to our a priori expectations the per hectare hours of irrigation (for both SRI and Conventional fields) during yala season is greater
13 F arrners were asked the number of irrigation done for each rice field they owned during Yala and Aaha seasons Moreover they were asked to give approximate hours elapsed during successive irrigation Then the number of irrigations was multiplied by the hours elapsed and divided by the area of the field to give an estimate of hours of irrigation per unit area We admit that for more conclusive results an exact field-level measurement needs to be done preferably for a number offarrners
347
~~ 6)
a - ) v 0 rrshy-
than that of Maha season This is because Yala season is relatively water scarce as compared to Maha season (see figure 7)
4~~----------------------------~
400 3~
~ 300 2~ ~ 200
~ l~ 100 ~
o
~ ~ ~ ~ ~ sect ~ g ~ ~ ~ ~ Mon1hs
~-WbTZa] bull DRY ZONE --shy
Figure 7Monthly rain fall distribution for the Dry and Wet Zones of Sri Lanka (1961-1990)
Table 8 also clearly indicates that generally SRI fields demand higher amount of human labor (about 3 times more) This arises from planting (about 37 man-days per ha) weeding (about 31 man-days per hal bund construction and cleaning (about 41 man-days per hal and organic fertilizer collection and transportation (126 man days per hal The corresponding figures for conventional fields are 8l man-days for planting (broadcasting) 16 man-days for weeding 114 man-days for bund construction and cleaning and 73 man-days per ha for organic matter collection and transportation The amount of bund construction and cleaning labor for SRI is significantly lower than that for conventional fields This is because the SRI farmers were advised not to clean bunds in order to harbor beneficial organisms as an integrated pest management strategy
348
g l
()
g e 8t ~ e pound VI bullell oJ
1 1
0
~ ~ shy--sect bull
~ ))
=~ --(9
0 (~
- ----
shybl
~
(
(0
til
0
~1
0 c
P
~
II g
~ t
amp
e w
g K
G
_ _
I
n~
_
I
8
Tab
le 8
In
T
b -
f
d [~-~
Pra
ctic
es o
r In
puts
SR
I C
onve
ntio
nal
Yal
a M
aha
Yal
a
~and
M
ean
SD
N
Mea
n SD
N
M
ean
SD
N
Mea
n T
ract
or h
ours
per
ha
26
232
32
24
18
7
32
28
183
12
9 28
pr
epar
atio
n B
ullo
ck h
ours
per
ha
24
438
32
17
35
0
32
19
475
12
9 17
P
lant
ing
Tra
nspl
anti
ng h
ours
per
ha
244
152
32
352
262
32
114
144
37
271
Bro
adca
stin
g ho
urs
per h
a
-
--
-67
8
420
8
7
63
Nw
nber
ofs
eedl
ings
per
hill
1
1 0
3 32
1
4 0
7 32
4
0 1
2 35
3
7 A
ge o
fsee
dlin
gs in
day
s 7
6 1
9 32
8
4 2
7 32
18
3
5 3
8
185
S
paci
ng b
etw
een
plan
ts in
inch
es
95
13
31
94
13
32
59
15
19
59
Spa
cing
bet
wee
n ro
ws
in i
nche
s 9
7 1
2 32
9
6 1
1 32
6
0 1
6 19
6
2 S
eed
rate
kg
per h
a 14
10
0
32
17
12
32
117
38
11
2 11
4 F
erti
liza
tion
U
reap
erh
a 77
73
0
32
78
804
32
14
1 86
2
128
133
(Ino
rgan
ic)
TD
Mk
g p
erh
a 76
13
05
32
516
78
2
32
97
800
12
8 96
N
PK
kg
per
ha
57
105
6 32
45
74
1
32
104
718
12
8 10
0 T
SP
kg
per
ha
-
-
-
13
120
8 12
8 4
f ~~~
MO
P k
g pe
r ha
--
--
--
03
33
I 12
8 0
5 F
erti
liza
tion
C
ow d
ung
in k
g p
er h
a 20
24
3066
32
14
22
2541
32
15
3 61
78
129
152
(Org
anic
) T
ree
leav
es in
kg
per h
a 10
13
1443
32
73
3 25
133
32
24
7 16
200
129
131
Str
aw i
n kg
per
ha
951
1900
4
32
261
799
0 3
2
170
706
4 12
9 28
7 P
oult
ry m
anur
e in
kg
per h
a 73
25
85
32
39
149
6 32
31
34
95
128
75
Com
post
in k
g pe
r ha
62
349
5 32
23
13
1 3
2
--
--
Ric
e br
an i
n kg
per
ha
23
945
32
8
437
32
-
--
Wee
ding
H
erbi
cide
s li
ter
per
ha
015
0
87
32
008
0
31
32
2
29
325
12
9 2
14
Hou
rs o
fMec
hani
cal
Wee
ding
per
ha
283
281
32
213
260
32
3
233
12
7 2
Han
d W
eedi
ng H
ours
per
ha
69
934
32
57
90
6
32
4
217
12
9 15
H
ours
ofb
un
d c
onst
ruct
ion
and
clea
ning
per
ha
28
48
0
32
38
51
32
8
8
862
12
9 94
Ir
riga
tion
M
ean
Num
ber o
fIrr
igat
ion
24
179
24
22
17
2
25
32
259
10
3 29
H
ours
of i
rrig
atio
n pe
r ha
1942
24
25
21
1720
21
16
23
25
89
40
38
97
2154
H
arve
stin
g P
er h
a ho
urs
ofh
arve
stin
g 32
8 26
62
31
326
376
7 13
35
5 25
46
I 11
5 26
5
Mah
a SD
18
9
380
18
10
444
0
9 3
9 1
3 1
5 38
0
815
75
6
749
19
9
43
594
2 51
02
1022
6
659
8
~~
-3
07
175
0 54
3
100
3 25
8
2993
18
17
N1 (
145
145
38
106
i~
38
23
23
132
147
147
147
147
147
14
5 I
145
I
143
I
145
-- 144
145
145
144
III
103
84
lJ
j
0 14
N r
efer
s to
the
num
ber
off
ield
s S
ince
mos
t oft
he f
arm
ers
had
mor
e th
an o
ne c
onve
ntio
nal r
ice
fiel
ds t
he n
umbe
r ofs
ampl
e ho
useh
olds
and
the
num
ber o
f fi
elds
may
var
y A
ll o
fthe
SR
I fa
rmer
s ha
d on
ly o
ne S
RI
field
M
oreo
ver
not
all
oft
he o
rigi
na16
0 S
RI
sam
ple
farm
ers
had
prac
tice
d S
RI
duri
ng 2
002
---
62 Yield Comparisons
The mean paddy yields obtained during the last three years differentiated by the system of production and seasons are listed in table 9 The mean SRI yield even though not as dmmatic as figures reported from many sources is about 44 percent more than that for the conventional method (F value = 474 P=0031) The reported conventional yields are well within the range of figures estimated by Sri Lanka Department of Census and Statistics The Departments estimate of paddy yields for the country lies between 25 and 41 t per hectare depending on the type of farming system (ie rainfed or irrigated rice farming) and the type of irrigation scheme (Kikuchi et aI 2002)
SRI is fertili~
contin fertili2 the co Interes or con and UI respon trend)
T bl e 9 Ri f management (Kgh) level d a ceyleIdsunder SRI and conventlOna system 0 a in the differel
Year Sri Conventional yield increase Yala Maha Mean Yala Maha Mean
2000 4097 6236 5488 3635 3644 3641 507 2001 5056 5327 5215 3516 3749 3633 435 2002 5737 5977 5811 4189 3832 4041 438 Mean 5299 5763 5524 3910 3757 3836 440
The set fertilizeuro the SUC4
However the yields reported in table 9 above conceal the effects of location and adoption15status The highest paddy yield (81 t ha) was recorded for SRI in Kalthota area during Maha
season for adopter group while the lowest (21 tha) was recorded for dis adopters during Yala season in Kurunegala (Table 10) Generally disadopters experienced the lowest paddy yield during the first year of adoption forcing them to discontinue the SRI pmctice The disadoption model of Section 53 also corroborates this fact Location-wise the yields recorded for Kalthota area are significantly better than those recorded for Kurunegala farmers irrespective ofthe system of production From table 10 one can also infer that the prospect of harvesting better paddy yield is higher for the Maha season than the Yala season which is in line with the usual expectation
Table 10 Paddy yield per acre by adoption status season year and location (kgha Location Year SRI Conventional
Ado ters Disado ters Ado tefs Disadopters Yala Maha Yala Maha Yala Maha Yala Maha
Kurunegala 2000 5726 7217 2102 4668 3501 3063 3769 4372 -
2001 6011 5499 4100 4628 4040 3628 2942 3851 2002 5619 5977 NA NA 3071 3702 3863 3911 Mean 5785 6231 3101 4648 3537 3464 3524 4045
Kalthota 2000 NA NA NA NA NA NA NA NA 2001 NA 8154 NA NA 6795 NA NA NA 2002 5806 NA NA NA 4900 NA NA NA Mean 5806 8154 NA NA 5848 NA NA NA
NA means not applicable
15 The original SRI sample farmers who have not practiced SRI during Yaa or Maha seasons of the year 2002 are regarded as disadopters By these criteria 20 of the 60 SRI sample farmers are disadopters
350
differet1 the orgc ofnutril
Table 1 Inorga
o oto 100 100 to 2 200ampa
--ornrutn F value The in
Table 1 Inorga
0 otol0( 100 to 200amp Grand F valueuro The 11
~ shyo-
---
- --
SRI is usually considered as a practice that gives substantial yield without the use of inorganic fertilizer (Barison 2002) Despite the advice not to use inorganic fertilizer some farmers have
tic as continued to use it with varying intensities The SRI farmers level of utilization of inorganictional fertilizer has been arbitrarily classified into four strata starting with zero level of utilization and ge of the corresponding paddy yields recorded for each stratum are reported are shown in Table 11
Interestingly the SRI farmers who did not apply any form of inorganic fertilizer recorded better or comparable yields to those farmers who applied up to and above 200 kg of fertilizer in Yala and up to 200 kg during Maha Another important observation is that while the paddy yield response to the applied fertilizer levels has slowed (ie the marginal product has shown declining trend) during Yala the yield response to additional levels of fertilizer has not reached optimum level during Maha The reason for this remarkable response difference may be due to variations in the level of available water during the two seasons Therefore the two seasons might need different fertilizer recommendations
The scenario for conventional paddy fields is different in that the response to the applied levels of fertilizer has been linear ie zero-inorganic fertilizer fields gave on average lower yields than the successive levels of fertilization especially during maha season (table 12) The reason for this difference is due to the fact that on SRI fields the added inorganic fertilizer was supplementary to )tion the organic fertilizer while for conventional fields chemical fertilizer was mostly the main source (aha of nutrients
Yala rield
Table 11 Yield comparison by level of fertilizer application (kgha )-SRI farmers tion
Inorganic fertilizer (kgha) I Yalanota Mean SD Ntern
0 5792 2715 5ieJd oto 100 4851 92133n 100 to 200 5954 2350 3 200 amp above 6481 2755 13r----------------------shyGrand mean 5825 2506 30 F value 1741(p=0195)s
MahaMeanshy SD~N 4349 2460 2 4159 3279 4 5362 2202 2 9133 1977 4 6049 3218 12 __~~285 (p=003 5)
The morgamc fertilizers were UREA TSP NPK and MOP
2 Table 12 Yield comparison by level of fertilizer application (kgha) - conventional farmers
la
ii3----~---Inorganic fertilizer (kgac) Yala c------shy
Mean SD N _M~a~r~~~_ __~ 0 3970 1786 9 1821 1136 ~ oto 100 4153 3797 J 1615 301699 28 100 to 200 4384 I 1975 68 3805 j 1930 35
1020200 amp above 5052 2153 4449 i 1522 4409 1936 80Grand mean 125 3758 i 1786
2625 (P=0056)F value 1058 (p=0370) The morgamc fertlhzers mclude UREA TSP NPK and MOP
351
~ -o shy
63 Profitability Comparisons
The microeconomics of the two systems of rice production was assessed using budgeting technique 16 Net returns were estimated for each farmer using the relationships
NR=GR-TC
VC=L- PXI I
TC=VC+F GR=RYRP
Where NR= Net Returns GR= Gross Returns VC= Variable Cost RY= Rice yield for SRI and conventional system RP= Rice price Pi =per unit price of the ith input and Xi= quantity of the ith input F is fixed cost and TC is total cost
The individual budgets prepared for each and every sample farmers differentiated by system of production and seasons (ie SRI and conventional) were averaged to facilitate easy comparisons (see table 13) Moreover the budgets were prepared under three wage-rate scenarios ie zero wage rate or family labor on-going farm wage rate and non-farm wage rate It is interesting to note that contrary to the survey farmers own subjective assessment and reports from different angles the cost of production per unit area for SRI is higher or at least comparable to that of conventional rice production17
Even though SRI reduces or avoids the use of cash inputs such as fertilizer and herbicides the resulting savings can not fully compensate for the additional costs born due to greater labor input for weeding transplanting and organic matter collection and transporting However the costs per unit of paddy output (Rupees per Kilogram) are lower than those of conventional due to significant increases in yield Consequently the estimated profit figures for SRI is almost double that of conventional practice for both seasons But it may be noted that this level ofprofitability is achieved with a lot ofdrudgery
In addition to the reported positive profitability figures table 13 also shows that some farmers experienced loss during both seasons This shows the advantage of budgeting for each farm than for average farm Two inferences may be made First the incidence of loss is higher for Yaa than for Maha season Secondly the incidence of loss among SRI farmers is substantially lower than that for conventional farms irrespective of the season
In Sri Lanka it is usually claimed that the competitiveness of rice sector has been worsen by the relative high wage rate Careful scrutiny of the costs and revenues of paddy production systems under three wage rate regimes presented in the table 13 tempts us to believe this claim
16 Entetprise budgeting technique was preferred to Partial Budgeting because SRI involves a major overhaul of the conventional rice production system Had the changes in the production system been minor partial budgeting would have been the natural choice according to C IMMYT (1988) 17 The costs include both cash and imputed labor and material costs
352
~ shy o-
enterprise following
)r SRI and
system of mparisons ie zero resting to ~ different
that of such as
costs and
than profit
may be
Table 13 Summary Results of the Enterprise budgets IProduction Seasonmiddot Wage rate Gross Total cost Net Costlkg Inciden bull system Revenue (RS) (RS) Revenue (RS) ce of
(Rs) loss SRI Yala Zero 34899 6506 29371 36 1
farm 34899 18907 15992 111 4 Non-farm 34899 24842 10223 150 6
Maha Zero 36720 5291 34575 22 0 farm 36720 20435 16285 87 1 Non-farm 37620 26493 13374 114 2
--_
Conventional Yala Zero 27017 10742 16032 76 9 farm 27017 18600 8417 133 27 Non-farm 27017 22248 4215 15s 29
i Maha Zero 23871 9503 14373 68 0 farm 23871 16381 7490 119 15
I Non-farm 23871 19687 4369 140 22
7 CONCLUSIONS AND IMPLICATIONS
1 The main advantages of SRI include yield increase reduced number of irrigations or irrigation-hours per irrigation and per unit area (ie increase in water productivity) reduced demand for cash inputs improved seed quality and higher milling ratio In addition to these private benefits SRI embodies added societal or environmental benefits due to reductions in the use of environment-unfriendly inputs such as herbicides and fertilizers It is not clear however if the observed on-farm water productivity can be translated into net water-saving at watershed or basin level which is an issue requiring further analyses This can be realized only if the practice is widely adopted and the farmers do not increase acreage
2 The System ofRice Intensification has a short history in Sri Lanka Its adoption process is dynamic in the sense that the adopters may quit the practice for some time and then reuse it when the circumstances allow This is because the practice involves little capital investment during initial adoption decision
3 The main variables influencing the incidence of SRI adoption are (i) location of the farm (ii) the type of farming system (ie irrigated Vs rain-fed farming) (iii) poverty status of the farmer (iv) participation in training programs (v) education status and (vi) the size and demographic structure of the farm family
4 The absence of significant difference in SRI adoption probability between farmers located at the head of irrigation canal and rain-fed farmers and the observed lower probability of SRI adoption among those located at the middle and tail end of irrigation canal underlines the importance of irrigation water supply risk and uncertainty variable in SRI adoption decision Hence contrary to the ideal SRI practice farmers at the middle and tail maintain a water layer on their field as a buffer to offset the risk of irregularity regarding irrigation water arrival This may also be done to reduce weed growth On the other hand the total dependence on rain for paddy cultivation means that the farmers are more cautious in
353
~ -o
investing in conventional yield enhancing cash inputs Therefore SRI which minimizes or avoids the use of such inputs is the logical alternative for rain-fed farmers
Barisshy5 SRI adopters mai nly come from the lowest and the highest poverty terciles of the farming convc
population In other words there is no significant difference in SRI adoption probability (http1between rich and poor farmers But poor farmers are likely to persist with SRI once they practice SRI than the rich farmers Moreover low realized yield during the first Barkeexperiment with SRI is the major factor behind discontinuing the SRI practice Proce
6 The main variables affecting the intensity of adoption of SRI are cattle ownership which Sri Lais a proxy for organic mater availability education status and the size and demographic structure of the farm family Batuv
7 The main problems associated with SRI practice are the demand for skills and high Norm amount of labor for weed control and transplanting non-availability of organic manure ofamiand limited availability of the rotary weeders (ht1JtL
8 The most appropriate domain (target group) for SRI adoption are those farmers a With limited land holdings
Bonlishyb Having bigger family size with high proportion of the family members capable of (htRL
engaging in work c Who are cash constrained d For whom rice constitutes the lions share ofannual income and consumption C~
e With limited alternative employment opportunities manw yTrigf With relative certainty regarding irrigation water supply and
g Practicing rainfed paddy cultivation 9 Generally SRI demands higher amounts labor per unit area (a lot of drudgery is involved) Feder
and induces the active participation of children between 7 and 14 years ofage and women Coun1 However whether this is a significant social disutility is a matter for further scrutiny
Javay issue
Kikuc produ BHaJ ~edil 2001
McDI staas
354
~ -o
lzes or REFERENCES
~rming Barison J (2002) Evaluation of nutrient up take and nutrient use efficiency of SRI and conventional rice cultivation methods in Madagascar ability (httpciifad comelleduSRIlproc 1 ISRI-32pdf) e they
~ first Barker R R Loeve Y H Li and T P Tuong (eds) (2001) Water Saving Irrigation for rice Proceedings of an lnternational Workshop held in Wuhan China 23-25 March 2001 Colombo which Sri Lanka lnternational Water Management lnstitute raphic
Batuwitage GP (2002) Adaptations of the system of rice intensification in Sri Lanka In high Norman Uphoff et al (eds) 2002 Assessment of the system of rice intensification Proceedings anure of and international conference held in Sanya China April 1-4 2002 (httpciifadcomelleduSRJlSRI-Assessmentspdf
Bonlieu F (1999) Summary offindings from thesis research on SRI )Ie of (httpciifad cornell edusribonlieu pdf)
I CIMMYT (1988) From agronomic data to farmer recommendations an economics trammg manual Completely revised edition Mexico City Centro lnternacional de Mejoramiento de Maiz y Trigo (CIMMYT)
ved) Feder G RE Just and DZilberman (1982) Adoption of Agricultural Innovation in Developing
men Countries A survey World Bank Staff Working Papers Number 542
Javaya (Newspaper Published by Sri Lanka Ministry ofAgriculture) JanuaryFebruary 2000 Issue
Kikuchi M R Barker MSamad and P Welingamage (2002) Comparative advantage of rice production in Sri Lanka with special reference to irrigation costs Sombilla M MHossain BHardy (eds) Development in the rice economy Proceedings of the international workshop on medium-and -long term prospects of rice supply and demand in the 21 st Century 3-5 December 2001 Los Banos Philippines International Rice Research Institute 436p
McDonald JF and R A Mofitt (1980) The use of tobit analysis Review ofeconomics and statistics Volume 62 (2) pp318-321
McHugh OV TS Steenhuis J Barison ECM Fernandez and NT Uphoff (2002) Farmer implementation of alternate wet and dry and non-flooded irrigation practices in the system of rice intensification In Water-Wise rice production Bourn BMA HB Hardy PS Bindraban T P Tuong and J K Ladha (eds) Proceedings of the International Workshop on Water-Wise Rice Production 8-11 April Los Banos Philippines lnternational Rice Research Institute
Moser CM and CB Barrett (2002) The system of rice intensification in practice Explaining low farmer adoption and high disadoption in Madagascarln Water-Wise rice production Bourn BMA H B Hardy PS Bindraban T PTuong and JK Ladha (eds) Proceedings of the
355
~ shy Q
International Workshop on Water-Wise Rice Production 8-11 April Los Banos Philippines International Rice Research Institute
Norman Uphoff et al (eds) (2002) Assessment of the system of rice intensification Proceedings ofan international conference held in Sanya China April 1-4 2002 (httpciifadcomelleduSRIISRI-Assessmentspdf)
Rena Perez (2002) Experience in Cuba with the system of rice intensification Norman Uphoff et al (eds)2002 Assessment of the system of rice intensification Proceedings ofan international conference held in Sanya China April 1-4 2002 Aftel (httpciifadcomelleduSRIISRI-Assessmentspdf) appe(
in us Stoop WA Norman Uphoff and Amir Kassam (2002) A review of agricultural research issues indus raised by the system of rice intensification (SRI) from Madagascar opportunities for improving Taiwa farming systems for resource-poor farmers Agricultural Systems 71 (2002) 249-274 positi
positi Tiyagarajan et al (2002) Effects of SRI practices on hybrid rice performance in Tamil Nadu on pat India In Water-Wise rice production Bourn BMA H B Hardy PS Bindraban TPTuong Metho and lK Ladha (eds) Proceedings of the International Workshop on Water-Wise Rice Production the po 8-11 April Los Banos Philippines Losbanos (Philippines) International Rice Research Institute recogn
averagl consen the intI agricul1 agricult product fields re KeyWl Method
356
-o~

--
Table 5 Detenninants ofSRI adoption -Results oflogit regression analysis Variable Code B SE Exo(8
CONSTANT -23134 29217 -Dependency Ratio (DEPRA) -00454 00277 0955 Proportion ofChildren in the Family(PCIDL) 00462 00285 1047 Family Size (FAMIS) I 03095 01791 1362 Age ofthe Household Head (AGEHH) -00509 00359 0950 Years ofSchooling of the Household HeadjYSCHH) 01645 00861 1178 Number of Training Programs Attended (NFTPA) Number ofExtension Contact7NEXCY)
~~----
01760 00343
00901 05146 ~~i
Proprotion ofIncome from Rice (PRICEj 00048 00117 1004 Proportion ofNon-fann Income (pRNlN) -00039 00124 0996 Incidence ofYield Loss due to Low Water Stress (FYLWS) 00575 01509 1059 An Index of Social amp Political Capital (POSOLl 00327 00821 1033 Poverty Group (poor) 00464 06746 1047 Poverty Group (Middle) -11770 06857 0308 Povert Group (Rich)-reference cateSory Location of the Fann or Field (Head) -02209 09935 0801 Location ofthe Fann or Field (Middle) -15452 09161 0213 I Location ofthe Fann or Field (Tail) -19079 09309 0l48 Location ofthe Fann or Field (Rain fed J-reference category An Index ofLabour Availability Perception (LABA V) 01334 01438 1142 Number of Cattle Owned (CATTL) 05139 I 03380 1671 Notes significant at 10 probability level significant at 5probability level -2 Log Likelihood 10898 Model Chi-square = 46284 (df= 18p=00003) Cox and Snell Rl=038511
Nagelkerke K=0513 Percent correctly predicted = 7679 N=112
S2 Intensity of Adoption of SRI
The intensity of adoption once the fanner has decided to practice SRI was evaluated using the proPQrtion of SRI area in the total paddy cultivated during maha and yala seasons and the proportion of fanners who allotted 100 percent of their paddy field to SRI These are shown in figures 4 and 5 The proportion of paddy area allotted to SRI ranges from about 39 percent in Kalthota to about 61 percent in Kurunegala during Yala season Some fanners have also allotted their total rice field to SRI The proportion of such fanners ranges from as low as 10 percent in Kalthota to as high as 50 percent in Kurunegala (see figure 5) The proportion of SRI farmers with 100 percent of their paddy fields SRI is higher during Yaa than during Maha in Kurunegala
II In OLS models the R2 statistic represents the proportion of variability in the dependent variable that can be explained by the independent variables For logit regression model an easily interpretable measure of the strength of the relationship between the dependent variable and the independent variables is not available Cox and SneD and Nagelkerke Rl are attempts to imitate the interpretation ofR2 in OLS regression They are attempts to measure strength of associations
342
~ shyo-
---
Exp(B ~17 -77 0955 85 1047 91 1362 59 0950 61 1178 01 1192 6 1034 17 1004 ~4 0996 9 1059 1 1033 6 1047 7 0308
5 0801 I 0213 ~ 0148
~ 1142 ) 1671
ISing the and the hown in rcent in allotted rcent in fanners negala
gth of and
This is in line with the presumption that Yala season is more water scarce than Maha season and one of the advantages of SRI is to save water as has been elaborated in the previous sections
70
60
ttl 50
~ 40 ~
~ 30
~ 20
10
0
jYala I l__ M~
Kalthota Kurunegala
Locations
Figure 4 Proportion ofRice area allotted to SRI in 2002
it 60 T-~--~-------------- rJ)
~
8 50
~ 40 +
~ 30
~ E 20 f it 10 rJ)
f 0
Kalthota Kurunegala
Locations
Figure 5 Proportion of SRI fanners who allotted 100 percent of paddy area to SRI in 2002
In the previous section detenninants of SRI adoption decision were assessed However the extent or intensity of adoption once the adoption decision is made is important infonnation for research extension and policy This issue was evaluated using tobit regression model which allows the estimation of the likelihood ofadoption as well as the extent or intensity of adoption It is preferable to logit adoption model when the decision to adopt also involves simultaneously a choice regarding the intensity of adoption as it does with SRI practice The model can be specified as
where Yi is a latent variable representing the use of the SRI X is a vector of independent variables described in table 4 13 is a vector of unknown parameters and Ei is a disturbance
343
~ -oshy
assumed to be independently and normally distributed with zero mean and constant variance~ and i = ]2 n (n is the number of sample households)
Denoting yi (the proportion of SRI area in the total cultivated rice area) as the observed dependent (censored) variable
The proportion of paddy area allotted to SRI was regressed against various factors hypothesized to influence SRI adoption A common mistake made when interpreting tobit coefficients is to treat them as effects of the independent variable for cases above the limit To avoid this drawback the tobit coefficients were decomposed following McDonald and Moffitt (1980) and the results are presented in table 6
1n the incidence of adoption model (ie logit model) discussed in the previous section informational variables such as participation in training program and extension contact poverty status location of the farm the farming system (ie irrigated vs rainfed farming) and level of education were important variables in predicting SRI adoption 1n the tobit model which estimates both the incidence and intensity of adoption the informational variables have lost their explanatory power 1nstead variables related to labor availability (DEPRA and PCHlL) and organic matter availability (CATTL) are more relevant
Table 6 also shows the decomposition of the total elasticity of the variables12 The decomposition
consists of two components the probability of adopting in the first place and the potential increase in the area allotted to SRI once the decision to adopt has been made For example the total elasticity value for the years of schooling (YSCHH) is 0974 meaning that a 10 percent increase in the years of schooling is expected to result in about 97 percent in adoption and use intensity of the SRI practice The probability of adoption will increase by 73 percent while the intensity of adoption will increase by 24 percent The other variables in the table can be interpreted in an analogous manner
12 An elasticity of adoption measures the responsiveness to a particular variable and is equal to the relative change in adoption of a technology with respect to a small relative change in a given variable from current levels The elasticities obtained from the tobit model take into account that a change in the explanatory variable will simultaneously affect the number of SRI adopters and the proportion of acreage under SRI
344
~ shyo--
---
~e and
Table ~ The det~rminants ofthe extent or intensity of adoption of SRI- results of probit
endent tshynt
~sized is to
back lsults
tion verty elof rhich their and
tion 53 Determinants of SRI Disadoption ltial
the Disadoption is one important aspect which have not been given due consideration in past ent adoption research Information on the reasons why certain group of farmers failed to stick to the use technology recommended for use is of crucial importance for researchers extension workers and the policy makers For instance research may draw upon the drawbacks of the technology and be improve upon those drawbacks to increase the chance of acceptability and wider dissemination of
the technology among the intended beneficiaries
In light of this fact a logit model was fitted to the data on SRI farmers Most of the variables in the SRI adoption modeling of section 51 were also included here The additional variables incorporated in the current model are (1) An index of positive perception of farmers towards SRI (POSIP) constructed based on the
reported advantages of SRI vis-a-vis the conventional system of rice production presented in table 2 The value of the variable ranges from 0 to 15 where 0 indicates lowest positive attitude of the SRI practitioners towards SRI and 15 shows the strongest positive attitude towards SRI This variable is expected to have a negative relationship with disadoption since those farmers who had positive attitude towards SRI are expected to continue with SRI
(2) An index of negative perception of farmers towards SRI (NEGAP) constructed based on the reported disadvantages of SRI vis-a-vis conventional system of rice production presented in table 3 The value of the variable ranges from 0 to 13 where 0 indicates lowest negative attitude of the SRI practitioners towards SRI and 13 shows the strongest negative attitude
345
gt)~ 6)
-0~
~ 0 rt
towards SRI This variable is expected to have a positive relationship with disadoption since those fanners who had a negative attitude towards SRI are expected to cease practicing SRI
(3) Average realized SRI yield (kgacre) for SRI farmers while they were practicing We expect that those farmers who had better paddy yield during their first season(s) of experimenting with SRI will continue with SRI Contrarily a low level of realized yield would lead to dis adoption
(4) The other important variable is the perception of farmers regarding the cost of capital or availability of cash (CASHR) This variable is particularly important in the sense that one of the cases for promoting SRI is due to its lesser reliance on external inputs hence lesser requirement for cash or capital The value for this variable ranges from 1 to 5 where 1 indicates severe cash constraint and 5 indicates the absence of cash constraint We expect this variable to have positive relationship with disadoption
T bl 7 Da e etermmants 0 Isa optIon 0 fSRIR- esu ts 0 I fl Oglt regressIon analysIs Variable p INTERCEPT 5935 An Index of Degree ofPositive Perception (pOSIP) -0262 An Index ofDegree ofNegative Perception (NEGAP) 0064 Average Realized Yield (AVERY) -0002 Episodes ofRice Yield Loss due to Water Stress (FRRYL) 0310 Labor Availability (LABA V) -0424 Proportion of Children in the Family (PCIDL) -0032 Poverty Group (poor) -3021 Poverty Group (Middle) -2504 Number ofExtension Contact (NEXCY) -0314 Dependency Ratio (DEPRA) 0052 Years ofSchooling of the Household Head (YSCHH) -0065 Proprotion of Income from Rice (PRICE) -0016 An Index ofLabor Availability Perception (CASHR) 0766 Note means the coefficIent IS slgmficant at 5 slgnrficance level -2 Log likelihood = 3743 Cox and Snell R2 = 048 Nagelkerke k = 066 Percent correctly predicted = 867
SE 5565 0300 0231 0001 0451 0312 0062 1505 1618 0215 0057 0187 0020 0591
exp(p) 377943
0769 1066 0998 1364 0655 0968 0049 0082 0730 1053 0937 0985 2151
All of the variables included in the disadoption model had the expected signs (table 7) However only average realized yield during the first season(s) of practicing SRI (AVERY) and poverty status (POYGR) variables had statistically significant effect on disadoption Hence the success or failure of farmers during initial adoption process determines the acceptance and the pace of dissemination of a technology In the adoption model (table 5) there is no significant difference in the probability of adoption of SRI between poor and rich farmers However the probability of disadoption among poor farmers is significantly lower than that among rich farmers This implies that once the poor farmers adopt SRI they have higher probability of continuing with it than rich farmers
346
~ shyo -
---
I since SRI
r y r f
f
Among the perception variables farmers perceived cash availability (CASHR) labor availability (LABAV) frequency of rice yield loss due to water shortage (FRRYL) and an index of farmers positive attitude towards SRI (POSID) respectively had strong coefficients However these were not statistically significant
6 THE MICROECONOMICS OF SRI
61 Rice agronomy and irrigation water management
Fanners agronomic practices level of cash input utilization and irrigation water management differentiated by system of production (SRI vs conventional) and seasons (wet-maha and dryshyyala) are shown in table 8 Expectedly there is substantial difference between the two systems of rice production regarding planting method fertility management and weed control practices For instance an average SRI-farmer transplants one 8-days-old rice seedling per hill on a square grid of about 23 by 23 cm While most conventional fields were planted by way of broadcasting few conventional farmers have practiced transplanting However the SRI transplanting differs from the conventional transplanting in many ways The conventional farmers planted on average four IS-days-old rice seedlings in a clump per hill on a square grid of 15 by 15 cm which is narrower than that for SRI
Concerning soil fertility management significant differences are noted between the two systems Generally SRI farmers used lesser doses of inorganic and higher doses of organic fertilizer per unit area as compared to conventional farmers Moreover a considerable number of SRI farmers abandoned altogether the use of inorganic fertilizers instead they put a lot of organic fertilizers The main sources of organic fertilizers include cow dung tree leaves straw poultry manure compost and rice bran
Weed control method is another important aspect differentiating the two systems of production SRI farmers use herbicides rarely instead they make use of a mechanical weeder andor hand weeding The conventional farmers rely heavily on herbicides and they flood their paddy fields with water as a means of weed control It is important to flood the field at the correct stage
One of the main advantages of SRI is its water saving with little or no reductions in the paddy yield (Thiyagarajan et aI 2002) We attempted to have an indirect and rough idea of the magnitude of on-farm or field-level water savings through farmer estimates of number of irrigation and hours of irrigation per unit area13
On average number of irrigations and hours of irrigation per unit area of SRI-fields are respectively about 24 percent and 23 percent lesser than the conventional paddy fields However the difference between SRI and conventional regarding hours of irrigation is not statistically significant Consistent to our a priori expectations the per hectare hours of irrigation (for both SRI and Conventional fields) during yala season is greater
13 F arrners were asked the number of irrigation done for each rice field they owned during Yala and Aaha seasons Moreover they were asked to give approximate hours elapsed during successive irrigation Then the number of irrigations was multiplied by the hours elapsed and divided by the area of the field to give an estimate of hours of irrigation per unit area We admit that for more conclusive results an exact field-level measurement needs to be done preferably for a number offarrners
347
~~ 6)
a - ) v 0 rrshy-
than that of Maha season This is because Yala season is relatively water scarce as compared to Maha season (see figure 7)
4~~----------------------------~
400 3~
~ 300 2~ ~ 200
~ l~ 100 ~
o
~ ~ ~ ~ ~ sect ~ g ~ ~ ~ ~ Mon1hs
~-WbTZa] bull DRY ZONE --shy
Figure 7Monthly rain fall distribution for the Dry and Wet Zones of Sri Lanka (1961-1990)
Table 8 also clearly indicates that generally SRI fields demand higher amount of human labor (about 3 times more) This arises from planting (about 37 man-days per ha) weeding (about 31 man-days per hal bund construction and cleaning (about 41 man-days per hal and organic fertilizer collection and transportation (126 man days per hal The corresponding figures for conventional fields are 8l man-days for planting (broadcasting) 16 man-days for weeding 114 man-days for bund construction and cleaning and 73 man-days per ha for organic matter collection and transportation The amount of bund construction and cleaning labor for SRI is significantly lower than that for conventional fields This is because the SRI farmers were advised not to clean bunds in order to harbor beneficial organisms as an integrated pest management strategy
348
g l
()
g e 8t ~ e pound VI bullell oJ
1 1
0
~ ~ shy--sect bull
~ ))
=~ --(9
0 (~
- ----
shybl
~
(
(0
til
0
~1
0 c
P
~
II g
~ t
amp
e w
g K
G
_ _
I
n~
_
I
8
Tab
le 8
In
T
b -
f
d [~-~
Pra
ctic
es o
r In
puts
SR
I C
onve
ntio
nal
Yal
a M
aha
Yal
a
~and
M
ean
SD
N
Mea
n SD
N
M
ean
SD
N
Mea
n T
ract
or h
ours
per
ha
26
232
32
24
18
7
32
28
183
12
9 28
pr
epar
atio
n B
ullo
ck h
ours
per
ha
24
438
32
17
35
0
32
19
475
12
9 17
P
lant
ing
Tra
nspl
anti
ng h
ours
per
ha
244
152
32
352
262
32
114
144
37
271
Bro
adca
stin
g ho
urs
per h
a
-
--
-67
8
420
8
7
63
Nw
nber
ofs
eedl
ings
per
hill
1
1 0
3 32
1
4 0
7 32
4
0 1
2 35
3
7 A
ge o
fsee
dlin
gs in
day
s 7
6 1
9 32
8
4 2
7 32
18
3
5 3
8
185
S
paci
ng b
etw
een
plan
ts in
inch
es
95
13
31
94
13
32
59
15
19
59
Spa
cing
bet
wee
n ro
ws
in i
nche
s 9
7 1
2 32
9
6 1
1 32
6
0 1
6 19
6
2 S
eed
rate
kg
per h
a 14
10
0
32
17
12
32
117
38
11
2 11
4 F
erti
liza
tion
U
reap
erh
a 77
73
0
32
78
804
32
14
1 86
2
128
133
(Ino
rgan
ic)
TD
Mk
g p
erh
a 76
13
05
32
516
78
2
32
97
800
12
8 96
N
PK
kg
per
ha
57
105
6 32
45
74
1
32
104
718
12
8 10
0 T
SP
kg
per
ha
-
-
-
13
120
8 12
8 4
f ~~~
MO
P k
g pe
r ha
--
--
--
03
33
I 12
8 0
5 F
erti
liza
tion
C
ow d
ung
in k
g p
er h
a 20
24
3066
32
14
22
2541
32
15
3 61
78
129
152
(Org
anic
) T
ree
leav
es in
kg
per h
a 10
13
1443
32
73
3 25
133
32
24
7 16
200
129
131
Str
aw i
n kg
per
ha
951
1900
4
32
261
799
0 3
2
170
706
4 12
9 28
7 P
oult
ry m
anur
e in
kg
per h
a 73
25
85
32
39
149
6 32
31
34
95
128
75
Com
post
in k
g pe
r ha
62
349
5 32
23
13
1 3
2
--
--
Ric
e br
an i
n kg
per
ha
23
945
32
8
437
32
-
--
Wee
ding
H
erbi
cide
s li
ter
per
ha
015
0
87
32
008
0
31
32
2
29
325
12
9 2
14
Hou
rs o
fMec
hani
cal
Wee
ding
per
ha
283
281
32
213
260
32
3
233
12
7 2
Han
d W
eedi
ng H
ours
per
ha
69
934
32
57
90
6
32
4
217
12
9 15
H
ours
ofb
un
d c
onst
ruct
ion
and
clea
ning
per
ha
28
48
0
32
38
51
32
8
8
862
12
9 94
Ir
riga
tion
M
ean
Num
ber o
fIrr
igat
ion
24
179
24
22
17
2
25
32
259
10
3 29
H
ours
of i
rrig
atio
n pe
r ha
1942
24
25
21
1720
21
16
23
25
89
40
38
97
2154
H
arve
stin
g P
er h
a ho
urs
ofh
arve
stin
g 32
8 26
62
31
326
376
7 13
35
5 25
46
I 11
5 26
5
Mah
a SD
18
9
380
18
10
444
0
9 3
9 1
3 1
5 38
0
815
75
6
749
19
9
43
594
2 51
02
1022
6
659
8
~~
-3
07
175
0 54
3
100
3 25
8
2993
18
17
N1 (
145
145
38
106
i~
38
23
23
132
147
147
147
147
147
14
5 I
145
I
143
I
145
-- 144
145
145
144
III
103
84
lJ
j
0 14
N r
efer
s to
the
num
ber
off
ield
s S
ince
mos
t oft
he f
arm
ers
had
mor
e th
an o
ne c
onve
ntio
nal r
ice
fiel
ds t
he n
umbe
r ofs
ampl
e ho
useh
olds
and
the
num
ber o
f fi
elds
may
var
y A
ll o
fthe
SR
I fa
rmer
s ha
d on
ly o
ne S
RI
field
M
oreo
ver
not
all
oft
he o
rigi
na16
0 S
RI
sam
ple
farm
ers
had
prac
tice
d S
RI
duri
ng 2
002
---
62 Yield Comparisons
The mean paddy yields obtained during the last three years differentiated by the system of production and seasons are listed in table 9 The mean SRI yield even though not as dmmatic as figures reported from many sources is about 44 percent more than that for the conventional method (F value = 474 P=0031) The reported conventional yields are well within the range of figures estimated by Sri Lanka Department of Census and Statistics The Departments estimate of paddy yields for the country lies between 25 and 41 t per hectare depending on the type of farming system (ie rainfed or irrigated rice farming) and the type of irrigation scheme (Kikuchi et aI 2002)
SRI is fertili~
contin fertili2 the co Interes or con and UI respon trend)
T bl e 9 Ri f management (Kgh) level d a ceyleIdsunder SRI and conventlOna system 0 a in the differel
Year Sri Conventional yield increase Yala Maha Mean Yala Maha Mean
2000 4097 6236 5488 3635 3644 3641 507 2001 5056 5327 5215 3516 3749 3633 435 2002 5737 5977 5811 4189 3832 4041 438 Mean 5299 5763 5524 3910 3757 3836 440
The set fertilizeuro the SUC4
However the yields reported in table 9 above conceal the effects of location and adoption15status The highest paddy yield (81 t ha) was recorded for SRI in Kalthota area during Maha
season for adopter group while the lowest (21 tha) was recorded for dis adopters during Yala season in Kurunegala (Table 10) Generally disadopters experienced the lowest paddy yield during the first year of adoption forcing them to discontinue the SRI pmctice The disadoption model of Section 53 also corroborates this fact Location-wise the yields recorded for Kalthota area are significantly better than those recorded for Kurunegala farmers irrespective ofthe system of production From table 10 one can also infer that the prospect of harvesting better paddy yield is higher for the Maha season than the Yala season which is in line with the usual expectation
Table 10 Paddy yield per acre by adoption status season year and location (kgha Location Year SRI Conventional
Ado ters Disado ters Ado tefs Disadopters Yala Maha Yala Maha Yala Maha Yala Maha
Kurunegala 2000 5726 7217 2102 4668 3501 3063 3769 4372 -
2001 6011 5499 4100 4628 4040 3628 2942 3851 2002 5619 5977 NA NA 3071 3702 3863 3911 Mean 5785 6231 3101 4648 3537 3464 3524 4045
Kalthota 2000 NA NA NA NA NA NA NA NA 2001 NA 8154 NA NA 6795 NA NA NA 2002 5806 NA NA NA 4900 NA NA NA Mean 5806 8154 NA NA 5848 NA NA NA
NA means not applicable
15 The original SRI sample farmers who have not practiced SRI during Yaa or Maha seasons of the year 2002 are regarded as disadopters By these criteria 20 of the 60 SRI sample farmers are disadopters
350
differet1 the orgc ofnutril
Table 1 Inorga
o oto 100 100 to 2 200ampa
--ornrutn F value The in
Table 1 Inorga
0 otol0( 100 to 200amp Grand F valueuro The 11
~ shyo-
---
- --
SRI is usually considered as a practice that gives substantial yield without the use of inorganic fertilizer (Barison 2002) Despite the advice not to use inorganic fertilizer some farmers have
tic as continued to use it with varying intensities The SRI farmers level of utilization of inorganictional fertilizer has been arbitrarily classified into four strata starting with zero level of utilization and ge of the corresponding paddy yields recorded for each stratum are reported are shown in Table 11
Interestingly the SRI farmers who did not apply any form of inorganic fertilizer recorded better or comparable yields to those farmers who applied up to and above 200 kg of fertilizer in Yala and up to 200 kg during Maha Another important observation is that while the paddy yield response to the applied fertilizer levels has slowed (ie the marginal product has shown declining trend) during Yala the yield response to additional levels of fertilizer has not reached optimum level during Maha The reason for this remarkable response difference may be due to variations in the level of available water during the two seasons Therefore the two seasons might need different fertilizer recommendations
The scenario for conventional paddy fields is different in that the response to the applied levels of fertilizer has been linear ie zero-inorganic fertilizer fields gave on average lower yields than the successive levels of fertilization especially during maha season (table 12) The reason for this difference is due to the fact that on SRI fields the added inorganic fertilizer was supplementary to )tion the organic fertilizer while for conventional fields chemical fertilizer was mostly the main source (aha of nutrients
Yala rield
Table 11 Yield comparison by level of fertilizer application (kgha )-SRI farmers tion
Inorganic fertilizer (kgha) I Yalanota Mean SD Ntern
0 5792 2715 5ieJd oto 100 4851 92133n 100 to 200 5954 2350 3 200 amp above 6481 2755 13r----------------------shyGrand mean 5825 2506 30 F value 1741(p=0195)s
MahaMeanshy SD~N 4349 2460 2 4159 3279 4 5362 2202 2 9133 1977 4 6049 3218 12 __~~285 (p=003 5)
The morgamc fertilizers were UREA TSP NPK and MOP
2 Table 12 Yield comparison by level of fertilizer application (kgha) - conventional farmers
la
ii3----~---Inorganic fertilizer (kgac) Yala c------shy
Mean SD N _M~a~r~~~_ __~ 0 3970 1786 9 1821 1136 ~ oto 100 4153 3797 J 1615 301699 28 100 to 200 4384 I 1975 68 3805 j 1930 35
1020200 amp above 5052 2153 4449 i 1522 4409 1936 80Grand mean 125 3758 i 1786
2625 (P=0056)F value 1058 (p=0370) The morgamc fertlhzers mclude UREA TSP NPK and MOP
351
~ -o shy
63 Profitability Comparisons
The microeconomics of the two systems of rice production was assessed using budgeting technique 16 Net returns were estimated for each farmer using the relationships
NR=GR-TC
VC=L- PXI I
TC=VC+F GR=RYRP
Where NR= Net Returns GR= Gross Returns VC= Variable Cost RY= Rice yield for SRI and conventional system RP= Rice price Pi =per unit price of the ith input and Xi= quantity of the ith input F is fixed cost and TC is total cost
The individual budgets prepared for each and every sample farmers differentiated by system of production and seasons (ie SRI and conventional) were averaged to facilitate easy comparisons (see table 13) Moreover the budgets were prepared under three wage-rate scenarios ie zero wage rate or family labor on-going farm wage rate and non-farm wage rate It is interesting to note that contrary to the survey farmers own subjective assessment and reports from different angles the cost of production per unit area for SRI is higher or at least comparable to that of conventional rice production17
Even though SRI reduces or avoids the use of cash inputs such as fertilizer and herbicides the resulting savings can not fully compensate for the additional costs born due to greater labor input for weeding transplanting and organic matter collection and transporting However the costs per unit of paddy output (Rupees per Kilogram) are lower than those of conventional due to significant increases in yield Consequently the estimated profit figures for SRI is almost double that of conventional practice for both seasons But it may be noted that this level ofprofitability is achieved with a lot ofdrudgery
In addition to the reported positive profitability figures table 13 also shows that some farmers experienced loss during both seasons This shows the advantage of budgeting for each farm than for average farm Two inferences may be made First the incidence of loss is higher for Yaa than for Maha season Secondly the incidence of loss among SRI farmers is substantially lower than that for conventional farms irrespective of the season
In Sri Lanka it is usually claimed that the competitiveness of rice sector has been worsen by the relative high wage rate Careful scrutiny of the costs and revenues of paddy production systems under three wage rate regimes presented in the table 13 tempts us to believe this claim
16 Entetprise budgeting technique was preferred to Partial Budgeting because SRI involves a major overhaul of the conventional rice production system Had the changes in the production system been minor partial budgeting would have been the natural choice according to C IMMYT (1988) 17 The costs include both cash and imputed labor and material costs
352
~ shy o-
enterprise following
)r SRI and
system of mparisons ie zero resting to ~ different
that of such as
costs and
than profit
may be
Table 13 Summary Results of the Enterprise budgets IProduction Seasonmiddot Wage rate Gross Total cost Net Costlkg Inciden bull system Revenue (RS) (RS) Revenue (RS) ce of
(Rs) loss SRI Yala Zero 34899 6506 29371 36 1
farm 34899 18907 15992 111 4 Non-farm 34899 24842 10223 150 6
Maha Zero 36720 5291 34575 22 0 farm 36720 20435 16285 87 1 Non-farm 37620 26493 13374 114 2
--_
Conventional Yala Zero 27017 10742 16032 76 9 farm 27017 18600 8417 133 27 Non-farm 27017 22248 4215 15s 29
i Maha Zero 23871 9503 14373 68 0 farm 23871 16381 7490 119 15
I Non-farm 23871 19687 4369 140 22
7 CONCLUSIONS AND IMPLICATIONS
1 The main advantages of SRI include yield increase reduced number of irrigations or irrigation-hours per irrigation and per unit area (ie increase in water productivity) reduced demand for cash inputs improved seed quality and higher milling ratio In addition to these private benefits SRI embodies added societal or environmental benefits due to reductions in the use of environment-unfriendly inputs such as herbicides and fertilizers It is not clear however if the observed on-farm water productivity can be translated into net water-saving at watershed or basin level which is an issue requiring further analyses This can be realized only if the practice is widely adopted and the farmers do not increase acreage
2 The System ofRice Intensification has a short history in Sri Lanka Its adoption process is dynamic in the sense that the adopters may quit the practice for some time and then reuse it when the circumstances allow This is because the practice involves little capital investment during initial adoption decision
3 The main variables influencing the incidence of SRI adoption are (i) location of the farm (ii) the type of farming system (ie irrigated Vs rain-fed farming) (iii) poverty status of the farmer (iv) participation in training programs (v) education status and (vi) the size and demographic structure of the farm family
4 The absence of significant difference in SRI adoption probability between farmers located at the head of irrigation canal and rain-fed farmers and the observed lower probability of SRI adoption among those located at the middle and tail end of irrigation canal underlines the importance of irrigation water supply risk and uncertainty variable in SRI adoption decision Hence contrary to the ideal SRI practice farmers at the middle and tail maintain a water layer on their field as a buffer to offset the risk of irregularity regarding irrigation water arrival This may also be done to reduce weed growth On the other hand the total dependence on rain for paddy cultivation means that the farmers are more cautious in
353
~ -o
investing in conventional yield enhancing cash inputs Therefore SRI which minimizes or avoids the use of such inputs is the logical alternative for rain-fed farmers
Barisshy5 SRI adopters mai nly come from the lowest and the highest poverty terciles of the farming convc
population In other words there is no significant difference in SRI adoption probability (http1between rich and poor farmers But poor farmers are likely to persist with SRI once they practice SRI than the rich farmers Moreover low realized yield during the first Barkeexperiment with SRI is the major factor behind discontinuing the SRI practice Proce
6 The main variables affecting the intensity of adoption of SRI are cattle ownership which Sri Lais a proxy for organic mater availability education status and the size and demographic structure of the farm family Batuv
7 The main problems associated with SRI practice are the demand for skills and high Norm amount of labor for weed control and transplanting non-availability of organic manure ofamiand limited availability of the rotary weeders (ht1JtL
8 The most appropriate domain (target group) for SRI adoption are those farmers a With limited land holdings
Bonlishyb Having bigger family size with high proportion of the family members capable of (htRL
engaging in work c Who are cash constrained d For whom rice constitutes the lions share ofannual income and consumption C~
e With limited alternative employment opportunities manw yTrigf With relative certainty regarding irrigation water supply and
g Practicing rainfed paddy cultivation 9 Generally SRI demands higher amounts labor per unit area (a lot of drudgery is involved) Feder
and induces the active participation of children between 7 and 14 years ofage and women Coun1 However whether this is a significant social disutility is a matter for further scrutiny
Javay issue
Kikuc produ BHaJ ~edil 2001
McDI staas
354
~ -o
lzes or REFERENCES
~rming Barison J (2002) Evaluation of nutrient up take and nutrient use efficiency of SRI and conventional rice cultivation methods in Madagascar ability (httpciifad comelleduSRIlproc 1 ISRI-32pdf) e they
~ first Barker R R Loeve Y H Li and T P Tuong (eds) (2001) Water Saving Irrigation for rice Proceedings of an lnternational Workshop held in Wuhan China 23-25 March 2001 Colombo which Sri Lanka lnternational Water Management lnstitute raphic
Batuwitage GP (2002) Adaptations of the system of rice intensification in Sri Lanka In high Norman Uphoff et al (eds) 2002 Assessment of the system of rice intensification Proceedings anure of and international conference held in Sanya China April 1-4 2002 (httpciifadcomelleduSRJlSRI-Assessmentspdf
Bonlieu F (1999) Summary offindings from thesis research on SRI )Ie of (httpciifad cornell edusribonlieu pdf)
I CIMMYT (1988) From agronomic data to farmer recommendations an economics trammg manual Completely revised edition Mexico City Centro lnternacional de Mejoramiento de Maiz y Trigo (CIMMYT)
ved) Feder G RE Just and DZilberman (1982) Adoption of Agricultural Innovation in Developing
men Countries A survey World Bank Staff Working Papers Number 542
Javaya (Newspaper Published by Sri Lanka Ministry ofAgriculture) JanuaryFebruary 2000 Issue
Kikuchi M R Barker MSamad and P Welingamage (2002) Comparative advantage of rice production in Sri Lanka with special reference to irrigation costs Sombilla M MHossain BHardy (eds) Development in the rice economy Proceedings of the international workshop on medium-and -long term prospects of rice supply and demand in the 21 st Century 3-5 December 2001 Los Banos Philippines International Rice Research Institute 436p
McDonald JF and R A Mofitt (1980) The use of tobit analysis Review ofeconomics and statistics Volume 62 (2) pp318-321
McHugh OV TS Steenhuis J Barison ECM Fernandez and NT Uphoff (2002) Farmer implementation of alternate wet and dry and non-flooded irrigation practices in the system of rice intensification In Water-Wise rice production Bourn BMA HB Hardy PS Bindraban T P Tuong and J K Ladha (eds) Proceedings of the International Workshop on Water-Wise Rice Production 8-11 April Los Banos Philippines lnternational Rice Research Institute
Moser CM and CB Barrett (2002) The system of rice intensification in practice Explaining low farmer adoption and high disadoption in Madagascarln Water-Wise rice production Bourn BMA H B Hardy PS Bindraban T PTuong and JK Ladha (eds) Proceedings of the
355
~ shy Q
International Workshop on Water-Wise Rice Production 8-11 April Los Banos Philippines International Rice Research Institute
Norman Uphoff et al (eds) (2002) Assessment of the system of rice intensification Proceedings ofan international conference held in Sanya China April 1-4 2002 (httpciifadcomelleduSRIISRI-Assessmentspdf)
Rena Perez (2002) Experience in Cuba with the system of rice intensification Norman Uphoff et al (eds)2002 Assessment of the system of rice intensification Proceedings ofan international conference held in Sanya China April 1-4 2002 Aftel (httpciifadcomelleduSRIISRI-Assessmentspdf) appe(
in us Stoop WA Norman Uphoff and Amir Kassam (2002) A review of agricultural research issues indus raised by the system of rice intensification (SRI) from Madagascar opportunities for improving Taiwa farming systems for resource-poor farmers Agricultural Systems 71 (2002) 249-274 positi
positi Tiyagarajan et al (2002) Effects of SRI practices on hybrid rice performance in Tamil Nadu on pat India In Water-Wise rice production Bourn BMA H B Hardy PS Bindraban TPTuong Metho and lK Ladha (eds) Proceedings of the International Workshop on Water-Wise Rice Production the po 8-11 April Los Banos Philippines Losbanos (Philippines) International Rice Research Institute recogn
averagl consen the intI agricul1 agricult product fields re KeyWl Method
356
-o~

---
Exp(B ~17 -77 0955 85 1047 91 1362 59 0950 61 1178 01 1192 6 1034 17 1004 ~4 0996 9 1059 1 1033 6 1047 7 0308
5 0801 I 0213 ~ 0148
~ 1142 ) 1671
ISing the and the hown in rcent in allotted rcent in fanners negala
gth of and
This is in line with the presumption that Yala season is more water scarce than Maha season and one of the advantages of SRI is to save water as has been elaborated in the previous sections
70
60
ttl 50
~ 40 ~
~ 30
~ 20
10
0
jYala I l__ M~
Kalthota Kurunegala
Locations
Figure 4 Proportion ofRice area allotted to SRI in 2002
it 60 T-~--~-------------- rJ)
~
8 50
~ 40 +
~ 30
~ E 20 f it 10 rJ)
f 0
Kalthota Kurunegala
Locations
Figure 5 Proportion of SRI fanners who allotted 100 percent of paddy area to SRI in 2002
In the previous section detenninants of SRI adoption decision were assessed However the extent or intensity of adoption once the adoption decision is made is important infonnation for research extension and policy This issue was evaluated using tobit regression model which allows the estimation of the likelihood ofadoption as well as the extent or intensity of adoption It is preferable to logit adoption model when the decision to adopt also involves simultaneously a choice regarding the intensity of adoption as it does with SRI practice The model can be specified as
where Yi is a latent variable representing the use of the SRI X is a vector of independent variables described in table 4 13 is a vector of unknown parameters and Ei is a disturbance
343
~ -oshy
assumed to be independently and normally distributed with zero mean and constant variance~ and i = ]2 n (n is the number of sample households)
Denoting yi (the proportion of SRI area in the total cultivated rice area) as the observed dependent (censored) variable
The proportion of paddy area allotted to SRI was regressed against various factors hypothesized to influence SRI adoption A common mistake made when interpreting tobit coefficients is to treat them as effects of the independent variable for cases above the limit To avoid this drawback the tobit coefficients were decomposed following McDonald and Moffitt (1980) and the results are presented in table 6
1n the incidence of adoption model (ie logit model) discussed in the previous section informational variables such as participation in training program and extension contact poverty status location of the farm the farming system (ie irrigated vs rainfed farming) and level of education were important variables in predicting SRI adoption 1n the tobit model which estimates both the incidence and intensity of adoption the informational variables have lost their explanatory power 1nstead variables related to labor availability (DEPRA and PCHlL) and organic matter availability (CATTL) are more relevant
Table 6 also shows the decomposition of the total elasticity of the variables12 The decomposition
consists of two components the probability of adopting in the first place and the potential increase in the area allotted to SRI once the decision to adopt has been made For example the total elasticity value for the years of schooling (YSCHH) is 0974 meaning that a 10 percent increase in the years of schooling is expected to result in about 97 percent in adoption and use intensity of the SRI practice The probability of adoption will increase by 73 percent while the intensity of adoption will increase by 24 percent The other variables in the table can be interpreted in an analogous manner
12 An elasticity of adoption measures the responsiveness to a particular variable and is equal to the relative change in adoption of a technology with respect to a small relative change in a given variable from current levels The elasticities obtained from the tobit model take into account that a change in the explanatory variable will simultaneously affect the number of SRI adopters and the proportion of acreage under SRI
344
~ shyo--
---
~e and
Table ~ The det~rminants ofthe extent or intensity of adoption of SRI- results of probit
endent tshynt
~sized is to
back lsults
tion verty elof rhich their and
tion 53 Determinants of SRI Disadoption ltial
the Disadoption is one important aspect which have not been given due consideration in past ent adoption research Information on the reasons why certain group of farmers failed to stick to the use technology recommended for use is of crucial importance for researchers extension workers and the policy makers For instance research may draw upon the drawbacks of the technology and be improve upon those drawbacks to increase the chance of acceptability and wider dissemination of
the technology among the intended beneficiaries
In light of this fact a logit model was fitted to the data on SRI farmers Most of the variables in the SRI adoption modeling of section 51 were also included here The additional variables incorporated in the current model are (1) An index of positive perception of farmers towards SRI (POSIP) constructed based on the
reported advantages of SRI vis-a-vis the conventional system of rice production presented in table 2 The value of the variable ranges from 0 to 15 where 0 indicates lowest positive attitude of the SRI practitioners towards SRI and 15 shows the strongest positive attitude towards SRI This variable is expected to have a negative relationship with disadoption since those farmers who had positive attitude towards SRI are expected to continue with SRI
(2) An index of negative perception of farmers towards SRI (NEGAP) constructed based on the reported disadvantages of SRI vis-a-vis conventional system of rice production presented in table 3 The value of the variable ranges from 0 to 13 where 0 indicates lowest negative attitude of the SRI practitioners towards SRI and 13 shows the strongest negative attitude
345
gt)~ 6)
-0~
~ 0 rt
towards SRI This variable is expected to have a positive relationship with disadoption since those fanners who had a negative attitude towards SRI are expected to cease practicing SRI
(3) Average realized SRI yield (kgacre) for SRI farmers while they were practicing We expect that those farmers who had better paddy yield during their first season(s) of experimenting with SRI will continue with SRI Contrarily a low level of realized yield would lead to dis adoption
(4) The other important variable is the perception of farmers regarding the cost of capital or availability of cash (CASHR) This variable is particularly important in the sense that one of the cases for promoting SRI is due to its lesser reliance on external inputs hence lesser requirement for cash or capital The value for this variable ranges from 1 to 5 where 1 indicates severe cash constraint and 5 indicates the absence of cash constraint We expect this variable to have positive relationship with disadoption
T bl 7 Da e etermmants 0 Isa optIon 0 fSRIR- esu ts 0 I fl Oglt regressIon analysIs Variable p INTERCEPT 5935 An Index of Degree ofPositive Perception (pOSIP) -0262 An Index ofDegree ofNegative Perception (NEGAP) 0064 Average Realized Yield (AVERY) -0002 Episodes ofRice Yield Loss due to Water Stress (FRRYL) 0310 Labor Availability (LABA V) -0424 Proportion of Children in the Family (PCIDL) -0032 Poverty Group (poor) -3021 Poverty Group (Middle) -2504 Number ofExtension Contact (NEXCY) -0314 Dependency Ratio (DEPRA) 0052 Years ofSchooling of the Household Head (YSCHH) -0065 Proprotion of Income from Rice (PRICE) -0016 An Index ofLabor Availability Perception (CASHR) 0766 Note means the coefficIent IS slgmficant at 5 slgnrficance level -2 Log likelihood = 3743 Cox and Snell R2 = 048 Nagelkerke k = 066 Percent correctly predicted = 867
SE 5565 0300 0231 0001 0451 0312 0062 1505 1618 0215 0057 0187 0020 0591
exp(p) 377943
0769 1066 0998 1364 0655 0968 0049 0082 0730 1053 0937 0985 2151
All of the variables included in the disadoption model had the expected signs (table 7) However only average realized yield during the first season(s) of practicing SRI (AVERY) and poverty status (POYGR) variables had statistically significant effect on disadoption Hence the success or failure of farmers during initial adoption process determines the acceptance and the pace of dissemination of a technology In the adoption model (table 5) there is no significant difference in the probability of adoption of SRI between poor and rich farmers However the probability of disadoption among poor farmers is significantly lower than that among rich farmers This implies that once the poor farmers adopt SRI they have higher probability of continuing with it than rich farmers
346
~ shyo -
---
I since SRI
r y r f
f
Among the perception variables farmers perceived cash availability (CASHR) labor availability (LABAV) frequency of rice yield loss due to water shortage (FRRYL) and an index of farmers positive attitude towards SRI (POSID) respectively had strong coefficients However these were not statistically significant
6 THE MICROECONOMICS OF SRI
61 Rice agronomy and irrigation water management
Fanners agronomic practices level of cash input utilization and irrigation water management differentiated by system of production (SRI vs conventional) and seasons (wet-maha and dryshyyala) are shown in table 8 Expectedly there is substantial difference between the two systems of rice production regarding planting method fertility management and weed control practices For instance an average SRI-farmer transplants one 8-days-old rice seedling per hill on a square grid of about 23 by 23 cm While most conventional fields were planted by way of broadcasting few conventional farmers have practiced transplanting However the SRI transplanting differs from the conventional transplanting in many ways The conventional farmers planted on average four IS-days-old rice seedlings in a clump per hill on a square grid of 15 by 15 cm which is narrower than that for SRI
Concerning soil fertility management significant differences are noted between the two systems Generally SRI farmers used lesser doses of inorganic and higher doses of organic fertilizer per unit area as compared to conventional farmers Moreover a considerable number of SRI farmers abandoned altogether the use of inorganic fertilizers instead they put a lot of organic fertilizers The main sources of organic fertilizers include cow dung tree leaves straw poultry manure compost and rice bran
Weed control method is another important aspect differentiating the two systems of production SRI farmers use herbicides rarely instead they make use of a mechanical weeder andor hand weeding The conventional farmers rely heavily on herbicides and they flood their paddy fields with water as a means of weed control It is important to flood the field at the correct stage
One of the main advantages of SRI is its water saving with little or no reductions in the paddy yield (Thiyagarajan et aI 2002) We attempted to have an indirect and rough idea of the magnitude of on-farm or field-level water savings through farmer estimates of number of irrigation and hours of irrigation per unit area13
On average number of irrigations and hours of irrigation per unit area of SRI-fields are respectively about 24 percent and 23 percent lesser than the conventional paddy fields However the difference between SRI and conventional regarding hours of irrigation is not statistically significant Consistent to our a priori expectations the per hectare hours of irrigation (for both SRI and Conventional fields) during yala season is greater
13 F arrners were asked the number of irrigation done for each rice field they owned during Yala and Aaha seasons Moreover they were asked to give approximate hours elapsed during successive irrigation Then the number of irrigations was multiplied by the hours elapsed and divided by the area of the field to give an estimate of hours of irrigation per unit area We admit that for more conclusive results an exact field-level measurement needs to be done preferably for a number offarrners
347
~~ 6)
a - ) v 0 rrshy-
than that of Maha season This is because Yala season is relatively water scarce as compared to Maha season (see figure 7)
4~~----------------------------~
400 3~
~ 300 2~ ~ 200
~ l~ 100 ~
o
~ ~ ~ ~ ~ sect ~ g ~ ~ ~ ~ Mon1hs
~-WbTZa] bull DRY ZONE --shy
Figure 7Monthly rain fall distribution for the Dry and Wet Zones of Sri Lanka (1961-1990)
Table 8 also clearly indicates that generally SRI fields demand higher amount of human labor (about 3 times more) This arises from planting (about 37 man-days per ha) weeding (about 31 man-days per hal bund construction and cleaning (about 41 man-days per hal and organic fertilizer collection and transportation (126 man days per hal The corresponding figures for conventional fields are 8l man-days for planting (broadcasting) 16 man-days for weeding 114 man-days for bund construction and cleaning and 73 man-days per ha for organic matter collection and transportation The amount of bund construction and cleaning labor for SRI is significantly lower than that for conventional fields This is because the SRI farmers were advised not to clean bunds in order to harbor beneficial organisms as an integrated pest management strategy
348
g l
()
g e 8t ~ e pound VI bullell oJ
1 1
0
~ ~ shy--sect bull
~ ))
=~ --(9
0 (~
- ----
shybl
~
(
(0
til
0
~1
0 c
P
~
II g
~ t
amp
e w
g K
G
_ _
I
n~
_
I
8
Tab
le 8
In
T
b -
f
d [~-~
Pra
ctic
es o
r In
puts
SR
I C
onve
ntio
nal
Yal
a M
aha
Yal
a
~and
M
ean
SD
N
Mea
n SD
N
M
ean
SD
N
Mea
n T
ract
or h
ours
per
ha
26
232
32
24
18
7
32
28
183
12
9 28
pr
epar
atio
n B
ullo
ck h
ours
per
ha
24
438
32
17
35
0
32
19
475
12
9 17
P
lant
ing
Tra
nspl
anti
ng h
ours
per
ha
244
152
32
352
262
32
114
144
37
271
Bro
adca
stin
g ho
urs
per h
a
-
--
-67
8
420
8
7
63
Nw
nber
ofs
eedl
ings
per
hill
1
1 0
3 32
1
4 0
7 32
4
0 1
2 35
3
7 A
ge o
fsee
dlin
gs in
day
s 7
6 1
9 32
8
4 2
7 32
18
3
5 3
8
185
S
paci
ng b
etw
een
plan
ts in
inch
es
95
13
31
94
13
32
59
15
19
59
Spa
cing
bet
wee
n ro
ws
in i
nche
s 9
7 1
2 32
9
6 1
1 32
6
0 1
6 19
6
2 S
eed
rate
kg
per h
a 14
10
0
32
17
12
32
117
38
11
2 11
4 F
erti
liza
tion
U
reap
erh
a 77
73
0
32
78
804
32
14
1 86
2
128
133
(Ino
rgan
ic)
TD
Mk
g p
erh
a 76
13
05
32
516
78
2
32
97
800
12
8 96
N
PK
kg
per
ha
57
105
6 32
45
74
1
32
104
718
12
8 10
0 T
SP
kg
per
ha
-
-
-
13
120
8 12
8 4
f ~~~
MO
P k
g pe
r ha
--
--
--
03
33
I 12
8 0
5 F
erti
liza
tion
C
ow d
ung
in k
g p
er h
a 20
24
3066
32
14
22
2541
32
15
3 61
78
129
152
(Org
anic
) T
ree
leav
es in
kg
per h
a 10
13
1443
32
73
3 25
133
32
24
7 16
200
129
131
Str
aw i
n kg
per
ha
951
1900
4
32
261
799
0 3
2
170
706
4 12
9 28
7 P
oult
ry m
anur
e in
kg
per h
a 73
25
85
32
39
149
6 32
31
34
95
128
75
Com
post
in k
g pe
r ha
62
349
5 32
23
13
1 3
2
--
--
Ric
e br
an i
n kg
per
ha
23
945
32
8
437
32
-
--
Wee
ding
H
erbi
cide
s li
ter
per
ha
015
0
87
32
008
0
31
32
2
29
325
12
9 2
14
Hou
rs o
fMec
hani
cal
Wee
ding
per
ha
283
281
32
213
260
32
3
233
12
7 2
Han
d W
eedi
ng H
ours
per
ha
69
934
32
57
90
6
32
4
217
12
9 15
H
ours
ofb
un
d c
onst
ruct
ion
and
clea
ning
per
ha
28
48
0
32
38
51
32
8
8
862
12
9 94
Ir
riga
tion
M
ean
Num
ber o
fIrr
igat
ion
24
179
24
22
17
2
25
32
259
10
3 29
H
ours
of i
rrig
atio
n pe
r ha
1942
24
25
21
1720
21
16
23
25
89
40
38
97
2154
H
arve
stin
g P
er h
a ho
urs
ofh
arve
stin
g 32
8 26
62
31
326
376
7 13
35
5 25
46
I 11
5 26
5
Mah
a SD
18
9
380
18
10
444
0
9 3
9 1
3 1
5 38
0
815
75
6
749
19
9
43
594
2 51
02
1022
6
659
8
~~
-3
07
175
0 54
3
100
3 25
8
2993
18
17
N1 (
145
145
38
106
i~
38
23
23
132
147
147
147
147
147
14
5 I
145
I
143
I
145
-- 144
145
145
144
III
103
84
lJ
j
0 14
N r
efer
s to
the
num
ber
off
ield
s S
ince
mos
t oft
he f
arm
ers
had
mor
e th
an o
ne c
onve
ntio
nal r
ice
fiel
ds t
he n
umbe
r ofs
ampl
e ho
useh
olds
and
the
num
ber o
f fi
elds
may
var
y A
ll o
fthe
SR
I fa
rmer
s ha
d on
ly o
ne S
RI
field
M
oreo
ver
not
all
oft
he o
rigi
na16
0 S
RI
sam
ple
farm
ers
had
prac
tice
d S
RI
duri
ng 2
002
---
62 Yield Comparisons
The mean paddy yields obtained during the last three years differentiated by the system of production and seasons are listed in table 9 The mean SRI yield even though not as dmmatic as figures reported from many sources is about 44 percent more than that for the conventional method (F value = 474 P=0031) The reported conventional yields are well within the range of figures estimated by Sri Lanka Department of Census and Statistics The Departments estimate of paddy yields for the country lies between 25 and 41 t per hectare depending on the type of farming system (ie rainfed or irrigated rice farming) and the type of irrigation scheme (Kikuchi et aI 2002)
SRI is fertili~
contin fertili2 the co Interes or con and UI respon trend)
T bl e 9 Ri f management (Kgh) level d a ceyleIdsunder SRI and conventlOna system 0 a in the differel
Year Sri Conventional yield increase Yala Maha Mean Yala Maha Mean
2000 4097 6236 5488 3635 3644 3641 507 2001 5056 5327 5215 3516 3749 3633 435 2002 5737 5977 5811 4189 3832 4041 438 Mean 5299 5763 5524 3910 3757 3836 440
The set fertilizeuro the SUC4
However the yields reported in table 9 above conceal the effects of location and adoption15status The highest paddy yield (81 t ha) was recorded for SRI in Kalthota area during Maha
season for adopter group while the lowest (21 tha) was recorded for dis adopters during Yala season in Kurunegala (Table 10) Generally disadopters experienced the lowest paddy yield during the first year of adoption forcing them to discontinue the SRI pmctice The disadoption model of Section 53 also corroborates this fact Location-wise the yields recorded for Kalthota area are significantly better than those recorded for Kurunegala farmers irrespective ofthe system of production From table 10 one can also infer that the prospect of harvesting better paddy yield is higher for the Maha season than the Yala season which is in line with the usual expectation
Table 10 Paddy yield per acre by adoption status season year and location (kgha Location Year SRI Conventional
Ado ters Disado ters Ado tefs Disadopters Yala Maha Yala Maha Yala Maha Yala Maha
Kurunegala 2000 5726 7217 2102 4668 3501 3063 3769 4372 -
2001 6011 5499 4100 4628 4040 3628 2942 3851 2002 5619 5977 NA NA 3071 3702 3863 3911 Mean 5785 6231 3101 4648 3537 3464 3524 4045
Kalthota 2000 NA NA NA NA NA NA NA NA 2001 NA 8154 NA NA 6795 NA NA NA 2002 5806 NA NA NA 4900 NA NA NA Mean 5806 8154 NA NA 5848 NA NA NA
NA means not applicable
15 The original SRI sample farmers who have not practiced SRI during Yaa or Maha seasons of the year 2002 are regarded as disadopters By these criteria 20 of the 60 SRI sample farmers are disadopters
350
differet1 the orgc ofnutril
Table 1 Inorga
o oto 100 100 to 2 200ampa
--ornrutn F value The in
Table 1 Inorga
0 otol0( 100 to 200amp Grand F valueuro The 11
~ shyo-
---
- --
SRI is usually considered as a practice that gives substantial yield without the use of inorganic fertilizer (Barison 2002) Despite the advice not to use inorganic fertilizer some farmers have
tic as continued to use it with varying intensities The SRI farmers level of utilization of inorganictional fertilizer has been arbitrarily classified into four strata starting with zero level of utilization and ge of the corresponding paddy yields recorded for each stratum are reported are shown in Table 11
Interestingly the SRI farmers who did not apply any form of inorganic fertilizer recorded better or comparable yields to those farmers who applied up to and above 200 kg of fertilizer in Yala and up to 200 kg during Maha Another important observation is that while the paddy yield response to the applied fertilizer levels has slowed (ie the marginal product has shown declining trend) during Yala the yield response to additional levels of fertilizer has not reached optimum level during Maha The reason for this remarkable response difference may be due to variations in the level of available water during the two seasons Therefore the two seasons might need different fertilizer recommendations
The scenario for conventional paddy fields is different in that the response to the applied levels of fertilizer has been linear ie zero-inorganic fertilizer fields gave on average lower yields than the successive levels of fertilization especially during maha season (table 12) The reason for this difference is due to the fact that on SRI fields the added inorganic fertilizer was supplementary to )tion the organic fertilizer while for conventional fields chemical fertilizer was mostly the main source (aha of nutrients
Yala rield
Table 11 Yield comparison by level of fertilizer application (kgha )-SRI farmers tion
Inorganic fertilizer (kgha) I Yalanota Mean SD Ntern
0 5792 2715 5ieJd oto 100 4851 92133n 100 to 200 5954 2350 3 200 amp above 6481 2755 13r----------------------shyGrand mean 5825 2506 30 F value 1741(p=0195)s
MahaMeanshy SD~N 4349 2460 2 4159 3279 4 5362 2202 2 9133 1977 4 6049 3218 12 __~~285 (p=003 5)
The morgamc fertilizers were UREA TSP NPK and MOP
2 Table 12 Yield comparison by level of fertilizer application (kgha) - conventional farmers
la
ii3----~---Inorganic fertilizer (kgac) Yala c------shy
Mean SD N _M~a~r~~~_ __~ 0 3970 1786 9 1821 1136 ~ oto 100 4153 3797 J 1615 301699 28 100 to 200 4384 I 1975 68 3805 j 1930 35
1020200 amp above 5052 2153 4449 i 1522 4409 1936 80Grand mean 125 3758 i 1786
2625 (P=0056)F value 1058 (p=0370) The morgamc fertlhzers mclude UREA TSP NPK and MOP
351
~ -o shy
63 Profitability Comparisons
The microeconomics of the two systems of rice production was assessed using budgeting technique 16 Net returns were estimated for each farmer using the relationships
NR=GR-TC
VC=L- PXI I
TC=VC+F GR=RYRP
Where NR= Net Returns GR= Gross Returns VC= Variable Cost RY= Rice yield for SRI and conventional system RP= Rice price Pi =per unit price of the ith input and Xi= quantity of the ith input F is fixed cost and TC is total cost
The individual budgets prepared for each and every sample farmers differentiated by system of production and seasons (ie SRI and conventional) were averaged to facilitate easy comparisons (see table 13) Moreover the budgets were prepared under three wage-rate scenarios ie zero wage rate or family labor on-going farm wage rate and non-farm wage rate It is interesting to note that contrary to the survey farmers own subjective assessment and reports from different angles the cost of production per unit area for SRI is higher or at least comparable to that of conventional rice production17
Even though SRI reduces or avoids the use of cash inputs such as fertilizer and herbicides the resulting savings can not fully compensate for the additional costs born due to greater labor input for weeding transplanting and organic matter collection and transporting However the costs per unit of paddy output (Rupees per Kilogram) are lower than those of conventional due to significant increases in yield Consequently the estimated profit figures for SRI is almost double that of conventional practice for both seasons But it may be noted that this level ofprofitability is achieved with a lot ofdrudgery
In addition to the reported positive profitability figures table 13 also shows that some farmers experienced loss during both seasons This shows the advantage of budgeting for each farm than for average farm Two inferences may be made First the incidence of loss is higher for Yaa than for Maha season Secondly the incidence of loss among SRI farmers is substantially lower than that for conventional farms irrespective of the season
In Sri Lanka it is usually claimed that the competitiveness of rice sector has been worsen by the relative high wage rate Careful scrutiny of the costs and revenues of paddy production systems under three wage rate regimes presented in the table 13 tempts us to believe this claim
16 Entetprise budgeting technique was preferred to Partial Budgeting because SRI involves a major overhaul of the conventional rice production system Had the changes in the production system been minor partial budgeting would have been the natural choice according to C IMMYT (1988) 17 The costs include both cash and imputed labor and material costs
352
~ shy o-
enterprise following
)r SRI and
system of mparisons ie zero resting to ~ different
that of such as
costs and
than profit
may be
Table 13 Summary Results of the Enterprise budgets IProduction Seasonmiddot Wage rate Gross Total cost Net Costlkg Inciden bull system Revenue (RS) (RS) Revenue (RS) ce of
(Rs) loss SRI Yala Zero 34899 6506 29371 36 1
farm 34899 18907 15992 111 4 Non-farm 34899 24842 10223 150 6
Maha Zero 36720 5291 34575 22 0 farm 36720 20435 16285 87 1 Non-farm 37620 26493 13374 114 2
--_
Conventional Yala Zero 27017 10742 16032 76 9 farm 27017 18600 8417 133 27 Non-farm 27017 22248 4215 15s 29
i Maha Zero 23871 9503 14373 68 0 farm 23871 16381 7490 119 15
I Non-farm 23871 19687 4369 140 22
7 CONCLUSIONS AND IMPLICATIONS
1 The main advantages of SRI include yield increase reduced number of irrigations or irrigation-hours per irrigation and per unit area (ie increase in water productivity) reduced demand for cash inputs improved seed quality and higher milling ratio In addition to these private benefits SRI embodies added societal or environmental benefits due to reductions in the use of environment-unfriendly inputs such as herbicides and fertilizers It is not clear however if the observed on-farm water productivity can be translated into net water-saving at watershed or basin level which is an issue requiring further analyses This can be realized only if the practice is widely adopted and the farmers do not increase acreage
2 The System ofRice Intensification has a short history in Sri Lanka Its adoption process is dynamic in the sense that the adopters may quit the practice for some time and then reuse it when the circumstances allow This is because the practice involves little capital investment during initial adoption decision
3 The main variables influencing the incidence of SRI adoption are (i) location of the farm (ii) the type of farming system (ie irrigated Vs rain-fed farming) (iii) poverty status of the farmer (iv) participation in training programs (v) education status and (vi) the size and demographic structure of the farm family
4 The absence of significant difference in SRI adoption probability between farmers located at the head of irrigation canal and rain-fed farmers and the observed lower probability of SRI adoption among those located at the middle and tail end of irrigation canal underlines the importance of irrigation water supply risk and uncertainty variable in SRI adoption decision Hence contrary to the ideal SRI practice farmers at the middle and tail maintain a water layer on their field as a buffer to offset the risk of irregularity regarding irrigation water arrival This may also be done to reduce weed growth On the other hand the total dependence on rain for paddy cultivation means that the farmers are more cautious in
353
~ -o
investing in conventional yield enhancing cash inputs Therefore SRI which minimizes or avoids the use of such inputs is the logical alternative for rain-fed farmers
Barisshy5 SRI adopters mai nly come from the lowest and the highest poverty terciles of the farming convc
population In other words there is no significant difference in SRI adoption probability (http1between rich and poor farmers But poor farmers are likely to persist with SRI once they practice SRI than the rich farmers Moreover low realized yield during the first Barkeexperiment with SRI is the major factor behind discontinuing the SRI practice Proce
6 The main variables affecting the intensity of adoption of SRI are cattle ownership which Sri Lais a proxy for organic mater availability education status and the size and demographic structure of the farm family Batuv
7 The main problems associated with SRI practice are the demand for skills and high Norm amount of labor for weed control and transplanting non-availability of organic manure ofamiand limited availability of the rotary weeders (ht1JtL
8 The most appropriate domain (target group) for SRI adoption are those farmers a With limited land holdings
Bonlishyb Having bigger family size with high proportion of the family members capable of (htRL
engaging in work c Who are cash constrained d For whom rice constitutes the lions share ofannual income and consumption C~
e With limited alternative employment opportunities manw yTrigf With relative certainty regarding irrigation water supply and
g Practicing rainfed paddy cultivation 9 Generally SRI demands higher amounts labor per unit area (a lot of drudgery is involved) Feder
and induces the active participation of children between 7 and 14 years ofage and women Coun1 However whether this is a significant social disutility is a matter for further scrutiny
Javay issue
Kikuc produ BHaJ ~edil 2001
McDI staas
354
~ -o
lzes or REFERENCES
~rming Barison J (2002) Evaluation of nutrient up take and nutrient use efficiency of SRI and conventional rice cultivation methods in Madagascar ability (httpciifad comelleduSRIlproc 1 ISRI-32pdf) e they
~ first Barker R R Loeve Y H Li and T P Tuong (eds) (2001) Water Saving Irrigation for rice Proceedings of an lnternational Workshop held in Wuhan China 23-25 March 2001 Colombo which Sri Lanka lnternational Water Management lnstitute raphic
Batuwitage GP (2002) Adaptations of the system of rice intensification in Sri Lanka In high Norman Uphoff et al (eds) 2002 Assessment of the system of rice intensification Proceedings anure of and international conference held in Sanya China April 1-4 2002 (httpciifadcomelleduSRJlSRI-Assessmentspdf
Bonlieu F (1999) Summary offindings from thesis research on SRI )Ie of (httpciifad cornell edusribonlieu pdf)
I CIMMYT (1988) From agronomic data to farmer recommendations an economics trammg manual Completely revised edition Mexico City Centro lnternacional de Mejoramiento de Maiz y Trigo (CIMMYT)
ved) Feder G RE Just and DZilberman (1982) Adoption of Agricultural Innovation in Developing
men Countries A survey World Bank Staff Working Papers Number 542
Javaya (Newspaper Published by Sri Lanka Ministry ofAgriculture) JanuaryFebruary 2000 Issue
Kikuchi M R Barker MSamad and P Welingamage (2002) Comparative advantage of rice production in Sri Lanka with special reference to irrigation costs Sombilla M MHossain BHardy (eds) Development in the rice economy Proceedings of the international workshop on medium-and -long term prospects of rice supply and demand in the 21 st Century 3-5 December 2001 Los Banos Philippines International Rice Research Institute 436p
McDonald JF and R A Mofitt (1980) The use of tobit analysis Review ofeconomics and statistics Volume 62 (2) pp318-321
McHugh OV TS Steenhuis J Barison ECM Fernandez and NT Uphoff (2002) Farmer implementation of alternate wet and dry and non-flooded irrigation practices in the system of rice intensification In Water-Wise rice production Bourn BMA HB Hardy PS Bindraban T P Tuong and J K Ladha (eds) Proceedings of the International Workshop on Water-Wise Rice Production 8-11 April Los Banos Philippines lnternational Rice Research Institute
Moser CM and CB Barrett (2002) The system of rice intensification in practice Explaining low farmer adoption and high disadoption in Madagascarln Water-Wise rice production Bourn BMA H B Hardy PS Bindraban T PTuong and JK Ladha (eds) Proceedings of the
355
~ shy Q
International Workshop on Water-Wise Rice Production 8-11 April Los Banos Philippines International Rice Research Institute
Norman Uphoff et al (eds) (2002) Assessment of the system of rice intensification Proceedings ofan international conference held in Sanya China April 1-4 2002 (httpciifadcomelleduSRIISRI-Assessmentspdf)
Rena Perez (2002) Experience in Cuba with the system of rice intensification Norman Uphoff et al (eds)2002 Assessment of the system of rice intensification Proceedings ofan international conference held in Sanya China April 1-4 2002 Aftel (httpciifadcomelleduSRIISRI-Assessmentspdf) appe(
in us Stoop WA Norman Uphoff and Amir Kassam (2002) A review of agricultural research issues indus raised by the system of rice intensification (SRI) from Madagascar opportunities for improving Taiwa farming systems for resource-poor farmers Agricultural Systems 71 (2002) 249-274 positi
positi Tiyagarajan et al (2002) Effects of SRI practices on hybrid rice performance in Tamil Nadu on pat India In Water-Wise rice production Bourn BMA H B Hardy PS Bindraban TPTuong Metho and lK Ladha (eds) Proceedings of the International Workshop on Water-Wise Rice Production the po 8-11 April Los Banos Philippines Losbanos (Philippines) International Rice Research Institute recogn
averagl consen the intI agricul1 agricult product fields re KeyWl Method
356
-o~
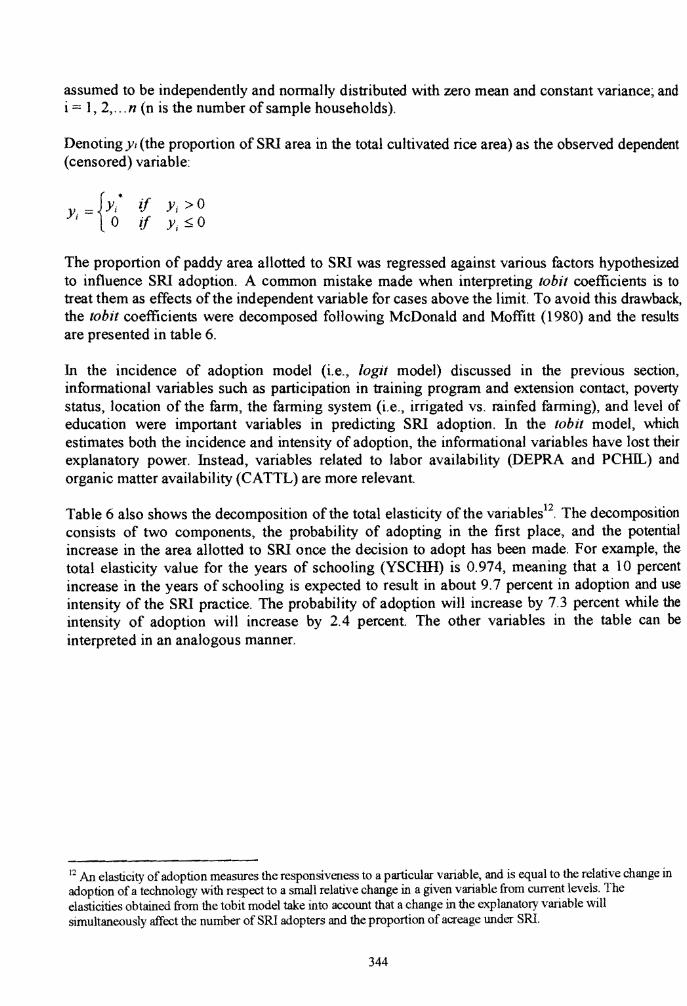
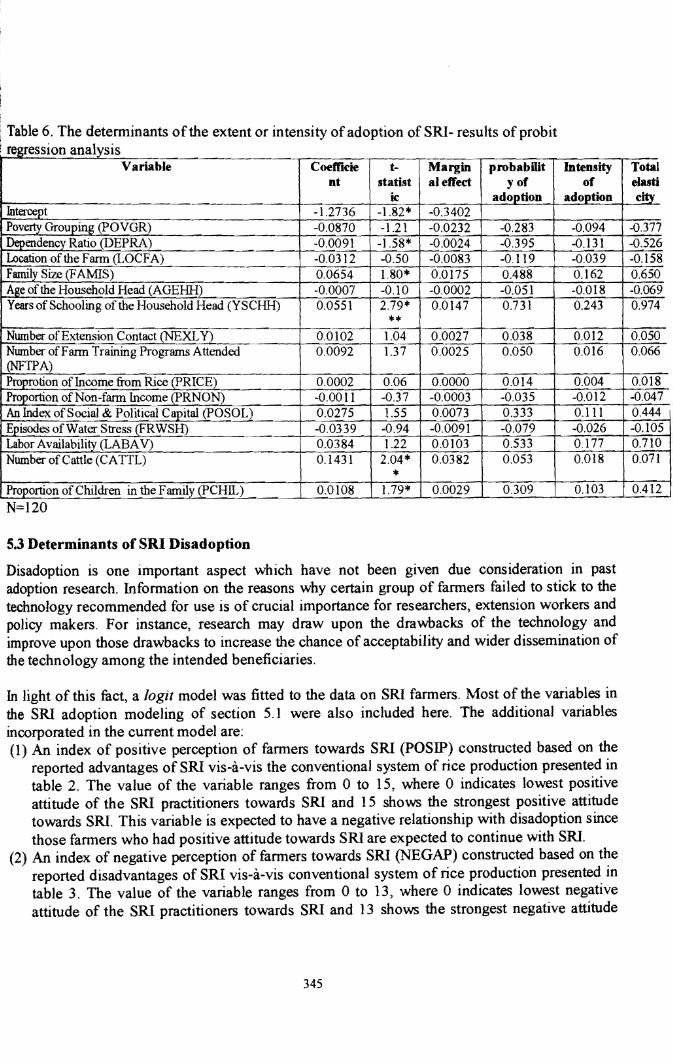
---
~e and
Table ~ The det~rminants ofthe extent or intensity of adoption of SRI- results of probit
endent tshynt
~sized is to
back lsults
tion verty elof rhich their and
tion 53 Determinants of SRI Disadoption ltial
the Disadoption is one important aspect which have not been given due consideration in past ent adoption research Information on the reasons why certain group of farmers failed to stick to the use technology recommended for use is of crucial importance for researchers extension workers and the policy makers For instance research may draw upon the drawbacks of the technology and be improve upon those drawbacks to increase the chance of acceptability and wider dissemination of
the technology among the intended beneficiaries
In light of this fact a logit model was fitted to the data on SRI farmers Most of the variables in the SRI adoption modeling of section 51 were also included here The additional variables incorporated in the current model are (1) An index of positive perception of farmers towards SRI (POSIP) constructed based on the
reported advantages of SRI vis-a-vis the conventional system of rice production presented in table 2 The value of the variable ranges from 0 to 15 where 0 indicates lowest positive attitude of the SRI practitioners towards SRI and 15 shows the strongest positive attitude towards SRI This variable is expected to have a negative relationship with disadoption since those farmers who had positive attitude towards SRI are expected to continue with SRI
(2) An index of negative perception of farmers towards SRI (NEGAP) constructed based on the reported disadvantages of SRI vis-a-vis conventional system of rice production presented in table 3 The value of the variable ranges from 0 to 13 where 0 indicates lowest negative attitude of the SRI practitioners towards SRI and 13 shows the strongest negative attitude
345
gt)~ 6)
-0~
~ 0 rt
towards SRI This variable is expected to have a positive relationship with disadoption since those fanners who had a negative attitude towards SRI are expected to cease practicing SRI
(3) Average realized SRI yield (kgacre) for SRI farmers while they were practicing We expect that those farmers who had better paddy yield during their first season(s) of experimenting with SRI will continue with SRI Contrarily a low level of realized yield would lead to dis adoption
(4) The other important variable is the perception of farmers regarding the cost of capital or availability of cash (CASHR) This variable is particularly important in the sense that one of the cases for promoting SRI is due to its lesser reliance on external inputs hence lesser requirement for cash or capital The value for this variable ranges from 1 to 5 where 1 indicates severe cash constraint and 5 indicates the absence of cash constraint We expect this variable to have positive relationship with disadoption
T bl 7 Da e etermmants 0 Isa optIon 0 fSRIR- esu ts 0 I fl Oglt regressIon analysIs Variable p INTERCEPT 5935 An Index of Degree ofPositive Perception (pOSIP) -0262 An Index ofDegree ofNegative Perception (NEGAP) 0064 Average Realized Yield (AVERY) -0002 Episodes ofRice Yield Loss due to Water Stress (FRRYL) 0310 Labor Availability (LABA V) -0424 Proportion of Children in the Family (PCIDL) -0032 Poverty Group (poor) -3021 Poverty Group (Middle) -2504 Number ofExtension Contact (NEXCY) -0314 Dependency Ratio (DEPRA) 0052 Years ofSchooling of the Household Head (YSCHH) -0065 Proprotion of Income from Rice (PRICE) -0016 An Index ofLabor Availability Perception (CASHR) 0766 Note means the coefficIent IS slgmficant at 5 slgnrficance level -2 Log likelihood = 3743 Cox and Snell R2 = 048 Nagelkerke k = 066 Percent correctly predicted = 867
SE 5565 0300 0231 0001 0451 0312 0062 1505 1618 0215 0057 0187 0020 0591
exp(p) 377943
0769 1066 0998 1364 0655 0968 0049 0082 0730 1053 0937 0985 2151
All of the variables included in the disadoption model had the expected signs (table 7) However only average realized yield during the first season(s) of practicing SRI (AVERY) and poverty status (POYGR) variables had statistically significant effect on disadoption Hence the success or failure of farmers during initial adoption process determines the acceptance and the pace of dissemination of a technology In the adoption model (table 5) there is no significant difference in the probability of adoption of SRI between poor and rich farmers However the probability of disadoption among poor farmers is significantly lower than that among rich farmers This implies that once the poor farmers adopt SRI they have higher probability of continuing with it than rich farmers
346
~ shyo -
---
I since SRI
r y r f
f
Among the perception variables farmers perceived cash availability (CASHR) labor availability (LABAV) frequency of rice yield loss due to water shortage (FRRYL) and an index of farmers positive attitude towards SRI (POSID) respectively had strong coefficients However these were not statistically significant
6 THE MICROECONOMICS OF SRI
61 Rice agronomy and irrigation water management
Fanners agronomic practices level of cash input utilization and irrigation water management differentiated by system of production (SRI vs conventional) and seasons (wet-maha and dryshyyala) are shown in table 8 Expectedly there is substantial difference between the two systems of rice production regarding planting method fertility management and weed control practices For instance an average SRI-farmer transplants one 8-days-old rice seedling per hill on a square grid of about 23 by 23 cm While most conventional fields were planted by way of broadcasting few conventional farmers have practiced transplanting However the SRI transplanting differs from the conventional transplanting in many ways The conventional farmers planted on average four IS-days-old rice seedlings in a clump per hill on a square grid of 15 by 15 cm which is narrower than that for SRI
Concerning soil fertility management significant differences are noted between the two systems Generally SRI farmers used lesser doses of inorganic and higher doses of organic fertilizer per unit area as compared to conventional farmers Moreover a considerable number of SRI farmers abandoned altogether the use of inorganic fertilizers instead they put a lot of organic fertilizers The main sources of organic fertilizers include cow dung tree leaves straw poultry manure compost and rice bran
Weed control method is another important aspect differentiating the two systems of production SRI farmers use herbicides rarely instead they make use of a mechanical weeder andor hand weeding The conventional farmers rely heavily on herbicides and they flood their paddy fields with water as a means of weed control It is important to flood the field at the correct stage
One of the main advantages of SRI is its water saving with little or no reductions in the paddy yield (Thiyagarajan et aI 2002) We attempted to have an indirect and rough idea of the magnitude of on-farm or field-level water savings through farmer estimates of number of irrigation and hours of irrigation per unit area13
On average number of irrigations and hours of irrigation per unit area of SRI-fields are respectively about 24 percent and 23 percent lesser than the conventional paddy fields However the difference between SRI and conventional regarding hours of irrigation is not statistically significant Consistent to our a priori expectations the per hectare hours of irrigation (for both SRI and Conventional fields) during yala season is greater
13 F arrners were asked the number of irrigation done for each rice field they owned during Yala and Aaha seasons Moreover they were asked to give approximate hours elapsed during successive irrigation Then the number of irrigations was multiplied by the hours elapsed and divided by the area of the field to give an estimate of hours of irrigation per unit area We admit that for more conclusive results an exact field-level measurement needs to be done preferably for a number offarrners
347
~~ 6)
a - ) v 0 rrshy-
than that of Maha season This is because Yala season is relatively water scarce as compared to Maha season (see figure 7)
4~~----------------------------~
400 3~
~ 300 2~ ~ 200
~ l~ 100 ~
o
~ ~ ~ ~ ~ sect ~ g ~ ~ ~ ~ Mon1hs
~-WbTZa] bull DRY ZONE --shy
Figure 7Monthly rain fall distribution for the Dry and Wet Zones of Sri Lanka (1961-1990)
Table 8 also clearly indicates that generally SRI fields demand higher amount of human labor (about 3 times more) This arises from planting (about 37 man-days per ha) weeding (about 31 man-days per hal bund construction and cleaning (about 41 man-days per hal and organic fertilizer collection and transportation (126 man days per hal The corresponding figures for conventional fields are 8l man-days for planting (broadcasting) 16 man-days for weeding 114 man-days for bund construction and cleaning and 73 man-days per ha for organic matter collection and transportation The amount of bund construction and cleaning labor for SRI is significantly lower than that for conventional fields This is because the SRI farmers were advised not to clean bunds in order to harbor beneficial organisms as an integrated pest management strategy
348
g l
()
g e 8t ~ e pound VI bullell oJ
1 1
0
~ ~ shy--sect bull
~ ))
=~ --(9
0 (~
- ----
shybl
~
(
(0
til
0
~1
0 c
P
~
II g
~ t
amp
e w
g K
G
_ _
I
n~
_
I
8
Tab
le 8
In
T
b -
f
d [~-~
Pra
ctic
es o
r In
puts
SR
I C
onve
ntio
nal
Yal
a M
aha
Yal
a
~and
M
ean
SD
N
Mea
n SD
N
M
ean
SD
N
Mea
n T
ract
or h
ours
per
ha
26
232
32
24
18
7
32
28
183
12
9 28
pr
epar
atio
n B
ullo
ck h
ours
per
ha
24
438
32
17
35
0
32
19
475
12
9 17
P
lant
ing
Tra
nspl
anti
ng h
ours
per
ha
244
152
32
352
262
32
114
144
37
271
Bro
adca
stin
g ho
urs
per h
a
-
--
-67
8
420
8
7
63
Nw
nber
ofs
eedl
ings
per
hill
1
1 0
3 32
1
4 0
7 32
4
0 1
2 35
3
7 A
ge o
fsee
dlin
gs in
day
s 7
6 1
9 32
8
4 2
7 32
18
3
5 3
8
185
S
paci
ng b
etw
een
plan
ts in
inch
es
95
13
31
94
13
32
59
15
19
59
Spa
cing
bet
wee
n ro
ws
in i
nche
s 9
7 1
2 32
9
6 1
1 32
6
0 1
6 19
6
2 S
eed
rate
kg
per h
a 14
10
0
32
17
12
32
117
38
11
2 11
4 F
erti
liza
tion
U
reap
erh
a 77
73
0
32
78
804
32
14
1 86
2
128
133
(Ino
rgan
ic)
TD
Mk
g p
erh
a 76
13
05
32
516
78
2
32
97
800
12
8 96
N
PK
kg
per
ha
57
105
6 32
45
74
1
32
104
718
12
8 10
0 T
SP
kg
per
ha
-
-
-
13
120
8 12
8 4
f ~~~
MO
P k
g pe
r ha
--
--
--
03
33
I 12
8 0
5 F
erti
liza
tion
C
ow d
ung
in k
g p
er h
a 20
24
3066
32
14
22
2541
32
15
3 61
78
129
152
(Org
anic
) T
ree
leav
es in
kg
per h
a 10
13
1443
32
73
3 25
133
32
24
7 16
200
129
131
Str
aw i
n kg
per
ha
951
1900
4
32
261
799
0 3
2
170
706
4 12
9 28
7 P
oult
ry m
anur
e in
kg
per h
a 73
25
85
32
39
149
6 32
31
34
95
128
75
Com
post
in k
g pe
r ha
62
349
5 32
23
13
1 3
2
--
--
Ric
e br
an i
n kg
per
ha
23
945
32
8
437
32
-
--
Wee
ding
H
erbi
cide
s li
ter
per
ha
015
0
87
32
008
0
31
32
2
29
325
12
9 2
14
Hou
rs o
fMec
hani
cal
Wee
ding
per
ha
283
281
32
213
260
32
3
233
12
7 2
Han
d W
eedi
ng H
ours
per
ha
69
934
32
57
90
6
32
4
217
12
9 15
H
ours
ofb
un
d c
onst
ruct
ion
and
clea
ning
per
ha
28
48
0
32
38
51
32
8
8
862
12
9 94
Ir
riga
tion
M
ean
Num
ber o
fIrr
igat
ion
24
179
24
22
17
2
25
32
259
10
3 29
H
ours
of i
rrig
atio
n pe
r ha
1942
24
25
21
1720
21
16
23
25
89
40
38
97
2154
H
arve
stin
g P
er h
a ho
urs
ofh
arve
stin
g 32
8 26
62
31
326
376
7 13
35
5 25
46
I 11
5 26
5
Mah
a SD
18
9
380
18
10
444
0
9 3
9 1
3 1
5 38
0
815
75
6
749
19
9
43
594
2 51
02
1022
6
659
8
~~
-3
07
175
0 54
3
100
3 25
8
2993
18
17
N1 (
145
145
38
106
i~
38
23
23
132
147
147
147
147
147
14
5 I
145
I
143
I
145
-- 144
145
145
144
III
103
84
lJ
j
0 14
N r
efer
s to
the
num
ber
off
ield
s S
ince
mos
t oft
he f
arm
ers
had
mor
e th
an o
ne c
onve
ntio
nal r
ice
fiel
ds t
he n
umbe
r ofs
ampl
e ho
useh
olds
and
the
num
ber o
f fi
elds
may
var
y A
ll o
fthe
SR
I fa
rmer
s ha
d on
ly o
ne S
RI
field
M
oreo
ver
not
all
oft
he o
rigi
na16
0 S
RI
sam
ple
farm
ers
had
prac
tice
d S
RI
duri
ng 2
002
---
62 Yield Comparisons
The mean paddy yields obtained during the last three years differentiated by the system of production and seasons are listed in table 9 The mean SRI yield even though not as dmmatic as figures reported from many sources is about 44 percent more than that for the conventional method (F value = 474 P=0031) The reported conventional yields are well within the range of figures estimated by Sri Lanka Department of Census and Statistics The Departments estimate of paddy yields for the country lies between 25 and 41 t per hectare depending on the type of farming system (ie rainfed or irrigated rice farming) and the type of irrigation scheme (Kikuchi et aI 2002)
SRI is fertili~
contin fertili2 the co Interes or con and UI respon trend)
T bl e 9 Ri f management (Kgh) level d a ceyleIdsunder SRI and conventlOna system 0 a in the differel
Year Sri Conventional yield increase Yala Maha Mean Yala Maha Mean
2000 4097 6236 5488 3635 3644 3641 507 2001 5056 5327 5215 3516 3749 3633 435 2002 5737 5977 5811 4189 3832 4041 438 Mean 5299 5763 5524 3910 3757 3836 440
The set fertilizeuro the SUC4
However the yields reported in table 9 above conceal the effects of location and adoption15status The highest paddy yield (81 t ha) was recorded for SRI in Kalthota area during Maha
season for adopter group while the lowest (21 tha) was recorded for dis adopters during Yala season in Kurunegala (Table 10) Generally disadopters experienced the lowest paddy yield during the first year of adoption forcing them to discontinue the SRI pmctice The disadoption model of Section 53 also corroborates this fact Location-wise the yields recorded for Kalthota area are significantly better than those recorded for Kurunegala farmers irrespective ofthe system of production From table 10 one can also infer that the prospect of harvesting better paddy yield is higher for the Maha season than the Yala season which is in line with the usual expectation
Table 10 Paddy yield per acre by adoption status season year and location (kgha Location Year SRI Conventional
Ado ters Disado ters Ado tefs Disadopters Yala Maha Yala Maha Yala Maha Yala Maha
Kurunegala 2000 5726 7217 2102 4668 3501 3063 3769 4372 -
2001 6011 5499 4100 4628 4040 3628 2942 3851 2002 5619 5977 NA NA 3071 3702 3863 3911 Mean 5785 6231 3101 4648 3537 3464 3524 4045
Kalthota 2000 NA NA NA NA NA NA NA NA 2001 NA 8154 NA NA 6795 NA NA NA 2002 5806 NA NA NA 4900 NA NA NA Mean 5806 8154 NA NA 5848 NA NA NA
NA means not applicable
15 The original SRI sample farmers who have not practiced SRI during Yaa or Maha seasons of the year 2002 are regarded as disadopters By these criteria 20 of the 60 SRI sample farmers are disadopters
350
differet1 the orgc ofnutril
Table 1 Inorga
o oto 100 100 to 2 200ampa
--ornrutn F value The in
Table 1 Inorga
0 otol0( 100 to 200amp Grand F valueuro The 11
~ shyo-
---
- --
SRI is usually considered as a practice that gives substantial yield without the use of inorganic fertilizer (Barison 2002) Despite the advice not to use inorganic fertilizer some farmers have
tic as continued to use it with varying intensities The SRI farmers level of utilization of inorganictional fertilizer has been arbitrarily classified into four strata starting with zero level of utilization and ge of the corresponding paddy yields recorded for each stratum are reported are shown in Table 11
Interestingly the SRI farmers who did not apply any form of inorganic fertilizer recorded better or comparable yields to those farmers who applied up to and above 200 kg of fertilizer in Yala and up to 200 kg during Maha Another important observation is that while the paddy yield response to the applied fertilizer levels has slowed (ie the marginal product has shown declining trend) during Yala the yield response to additional levels of fertilizer has not reached optimum level during Maha The reason for this remarkable response difference may be due to variations in the level of available water during the two seasons Therefore the two seasons might need different fertilizer recommendations
The scenario for conventional paddy fields is different in that the response to the applied levels of fertilizer has been linear ie zero-inorganic fertilizer fields gave on average lower yields than the successive levels of fertilization especially during maha season (table 12) The reason for this difference is due to the fact that on SRI fields the added inorganic fertilizer was supplementary to )tion the organic fertilizer while for conventional fields chemical fertilizer was mostly the main source (aha of nutrients
Yala rield
Table 11 Yield comparison by level of fertilizer application (kgha )-SRI farmers tion
Inorganic fertilizer (kgha) I Yalanota Mean SD Ntern
0 5792 2715 5ieJd oto 100 4851 92133n 100 to 200 5954 2350 3 200 amp above 6481 2755 13r----------------------shyGrand mean 5825 2506 30 F value 1741(p=0195)s
MahaMeanshy SD~N 4349 2460 2 4159 3279 4 5362 2202 2 9133 1977 4 6049 3218 12 __~~285 (p=003 5)
The morgamc fertilizers were UREA TSP NPK and MOP
2 Table 12 Yield comparison by level of fertilizer application (kgha) - conventional farmers
la
ii3----~---Inorganic fertilizer (kgac) Yala c------shy
Mean SD N _M~a~r~~~_ __~ 0 3970 1786 9 1821 1136 ~ oto 100 4153 3797 J 1615 301699 28 100 to 200 4384 I 1975 68 3805 j 1930 35
1020200 amp above 5052 2153 4449 i 1522 4409 1936 80Grand mean 125 3758 i 1786
2625 (P=0056)F value 1058 (p=0370) The morgamc fertlhzers mclude UREA TSP NPK and MOP
351
~ -o shy
63 Profitability Comparisons
The microeconomics of the two systems of rice production was assessed using budgeting technique 16 Net returns were estimated for each farmer using the relationships
NR=GR-TC
VC=L- PXI I
TC=VC+F GR=RYRP
Where NR= Net Returns GR= Gross Returns VC= Variable Cost RY= Rice yield for SRI and conventional system RP= Rice price Pi =per unit price of the ith input and Xi= quantity of the ith input F is fixed cost and TC is total cost
The individual budgets prepared for each and every sample farmers differentiated by system of production and seasons (ie SRI and conventional) were averaged to facilitate easy comparisons (see table 13) Moreover the budgets were prepared under three wage-rate scenarios ie zero wage rate or family labor on-going farm wage rate and non-farm wage rate It is interesting to note that contrary to the survey farmers own subjective assessment and reports from different angles the cost of production per unit area for SRI is higher or at least comparable to that of conventional rice production17
Even though SRI reduces or avoids the use of cash inputs such as fertilizer and herbicides the resulting savings can not fully compensate for the additional costs born due to greater labor input for weeding transplanting and organic matter collection and transporting However the costs per unit of paddy output (Rupees per Kilogram) are lower than those of conventional due to significant increases in yield Consequently the estimated profit figures for SRI is almost double that of conventional practice for both seasons But it may be noted that this level ofprofitability is achieved with a lot ofdrudgery
In addition to the reported positive profitability figures table 13 also shows that some farmers experienced loss during both seasons This shows the advantage of budgeting for each farm than for average farm Two inferences may be made First the incidence of loss is higher for Yaa than for Maha season Secondly the incidence of loss among SRI farmers is substantially lower than that for conventional farms irrespective of the season
In Sri Lanka it is usually claimed that the competitiveness of rice sector has been worsen by the relative high wage rate Careful scrutiny of the costs and revenues of paddy production systems under three wage rate regimes presented in the table 13 tempts us to believe this claim
16 Entetprise budgeting technique was preferred to Partial Budgeting because SRI involves a major overhaul of the conventional rice production system Had the changes in the production system been minor partial budgeting would have been the natural choice according to C IMMYT (1988) 17 The costs include both cash and imputed labor and material costs
352
~ shy o-
enterprise following
)r SRI and
system of mparisons ie zero resting to ~ different
that of such as
costs and
than profit
may be
Table 13 Summary Results of the Enterprise budgets IProduction Seasonmiddot Wage rate Gross Total cost Net Costlkg Inciden bull system Revenue (RS) (RS) Revenue (RS) ce of
(Rs) loss SRI Yala Zero 34899 6506 29371 36 1
farm 34899 18907 15992 111 4 Non-farm 34899 24842 10223 150 6
Maha Zero 36720 5291 34575 22 0 farm 36720 20435 16285 87 1 Non-farm 37620 26493 13374 114 2
--_
Conventional Yala Zero 27017 10742 16032 76 9 farm 27017 18600 8417 133 27 Non-farm 27017 22248 4215 15s 29
i Maha Zero 23871 9503 14373 68 0 farm 23871 16381 7490 119 15
I Non-farm 23871 19687 4369 140 22
7 CONCLUSIONS AND IMPLICATIONS
1 The main advantages of SRI include yield increase reduced number of irrigations or irrigation-hours per irrigation and per unit area (ie increase in water productivity) reduced demand for cash inputs improved seed quality and higher milling ratio In addition to these private benefits SRI embodies added societal or environmental benefits due to reductions in the use of environment-unfriendly inputs such as herbicides and fertilizers It is not clear however if the observed on-farm water productivity can be translated into net water-saving at watershed or basin level which is an issue requiring further analyses This can be realized only if the practice is widely adopted and the farmers do not increase acreage
2 The System ofRice Intensification has a short history in Sri Lanka Its adoption process is dynamic in the sense that the adopters may quit the practice for some time and then reuse it when the circumstances allow This is because the practice involves little capital investment during initial adoption decision
3 The main variables influencing the incidence of SRI adoption are (i) location of the farm (ii) the type of farming system (ie irrigated Vs rain-fed farming) (iii) poverty status of the farmer (iv) participation in training programs (v) education status and (vi) the size and demographic structure of the farm family
4 The absence of significant difference in SRI adoption probability between farmers located at the head of irrigation canal and rain-fed farmers and the observed lower probability of SRI adoption among those located at the middle and tail end of irrigation canal underlines the importance of irrigation water supply risk and uncertainty variable in SRI adoption decision Hence contrary to the ideal SRI practice farmers at the middle and tail maintain a water layer on their field as a buffer to offset the risk of irregularity regarding irrigation water arrival This may also be done to reduce weed growth On the other hand the total dependence on rain for paddy cultivation means that the farmers are more cautious in
353
~ -o
investing in conventional yield enhancing cash inputs Therefore SRI which minimizes or avoids the use of such inputs is the logical alternative for rain-fed farmers
Barisshy5 SRI adopters mai nly come from the lowest and the highest poverty terciles of the farming convc
population In other words there is no significant difference in SRI adoption probability (http1between rich and poor farmers But poor farmers are likely to persist with SRI once they practice SRI than the rich farmers Moreover low realized yield during the first Barkeexperiment with SRI is the major factor behind discontinuing the SRI practice Proce
6 The main variables affecting the intensity of adoption of SRI are cattle ownership which Sri Lais a proxy for organic mater availability education status and the size and demographic structure of the farm family Batuv
7 The main problems associated with SRI practice are the demand for skills and high Norm amount of labor for weed control and transplanting non-availability of organic manure ofamiand limited availability of the rotary weeders (ht1JtL
8 The most appropriate domain (target group) for SRI adoption are those farmers a With limited land holdings
Bonlishyb Having bigger family size with high proportion of the family members capable of (htRL
engaging in work c Who are cash constrained d For whom rice constitutes the lions share ofannual income and consumption C~
e With limited alternative employment opportunities manw yTrigf With relative certainty regarding irrigation water supply and
g Practicing rainfed paddy cultivation 9 Generally SRI demands higher amounts labor per unit area (a lot of drudgery is involved) Feder
and induces the active participation of children between 7 and 14 years ofage and women Coun1 However whether this is a significant social disutility is a matter for further scrutiny
Javay issue
Kikuc produ BHaJ ~edil 2001
McDI staas
354
~ -o
lzes or REFERENCES
~rming Barison J (2002) Evaluation of nutrient up take and nutrient use efficiency of SRI and conventional rice cultivation methods in Madagascar ability (httpciifad comelleduSRIlproc 1 ISRI-32pdf) e they
~ first Barker R R Loeve Y H Li and T P Tuong (eds) (2001) Water Saving Irrigation for rice Proceedings of an lnternational Workshop held in Wuhan China 23-25 March 2001 Colombo which Sri Lanka lnternational Water Management lnstitute raphic
Batuwitage GP (2002) Adaptations of the system of rice intensification in Sri Lanka In high Norman Uphoff et al (eds) 2002 Assessment of the system of rice intensification Proceedings anure of and international conference held in Sanya China April 1-4 2002 (httpciifadcomelleduSRJlSRI-Assessmentspdf
Bonlieu F (1999) Summary offindings from thesis research on SRI )Ie of (httpciifad cornell edusribonlieu pdf)
I CIMMYT (1988) From agronomic data to farmer recommendations an economics trammg manual Completely revised edition Mexico City Centro lnternacional de Mejoramiento de Maiz y Trigo (CIMMYT)
ved) Feder G RE Just and DZilberman (1982) Adoption of Agricultural Innovation in Developing
men Countries A survey World Bank Staff Working Papers Number 542
Javaya (Newspaper Published by Sri Lanka Ministry ofAgriculture) JanuaryFebruary 2000 Issue
Kikuchi M R Barker MSamad and P Welingamage (2002) Comparative advantage of rice production in Sri Lanka with special reference to irrigation costs Sombilla M MHossain BHardy (eds) Development in the rice economy Proceedings of the international workshop on medium-and -long term prospects of rice supply and demand in the 21 st Century 3-5 December 2001 Los Banos Philippines International Rice Research Institute 436p
McDonald JF and R A Mofitt (1980) The use of tobit analysis Review ofeconomics and statistics Volume 62 (2) pp318-321
McHugh OV TS Steenhuis J Barison ECM Fernandez and NT Uphoff (2002) Farmer implementation of alternate wet and dry and non-flooded irrigation practices in the system of rice intensification In Water-Wise rice production Bourn BMA HB Hardy PS Bindraban T P Tuong and J K Ladha (eds) Proceedings of the International Workshop on Water-Wise Rice Production 8-11 April Los Banos Philippines lnternational Rice Research Institute
Moser CM and CB Barrett (2002) The system of rice intensification in practice Explaining low farmer adoption and high disadoption in Madagascarln Water-Wise rice production Bourn BMA H B Hardy PS Bindraban T PTuong and JK Ladha (eds) Proceedings of the
355
~ shy Q
International Workshop on Water-Wise Rice Production 8-11 April Los Banos Philippines International Rice Research Institute
Norman Uphoff et al (eds) (2002) Assessment of the system of rice intensification Proceedings ofan international conference held in Sanya China April 1-4 2002 (httpciifadcomelleduSRIISRI-Assessmentspdf)
Rena Perez (2002) Experience in Cuba with the system of rice intensification Norman Uphoff et al (eds)2002 Assessment of the system of rice intensification Proceedings ofan international conference held in Sanya China April 1-4 2002 Aftel (httpciifadcomelleduSRIISRI-Assessmentspdf) appe(
in us Stoop WA Norman Uphoff and Amir Kassam (2002) A review of agricultural research issues indus raised by the system of rice intensification (SRI) from Madagascar opportunities for improving Taiwa farming systems for resource-poor farmers Agricultural Systems 71 (2002) 249-274 positi
positi Tiyagarajan et al (2002) Effects of SRI practices on hybrid rice performance in Tamil Nadu on pat India In Water-Wise rice production Bourn BMA H B Hardy PS Bindraban TPTuong Metho and lK Ladha (eds) Proceedings of the International Workshop on Water-Wise Rice Production the po 8-11 April Los Banos Philippines Losbanos (Philippines) International Rice Research Institute recogn
averagl consen the intI agricul1 agricult product fields re KeyWl Method
356
-o~
---
I since SRI
r y r f
f
Among the perception variables farmers perceived cash availability (CASHR) labor availability (LABAV) frequency of rice yield loss due to water shortage (FRRYL) and an index of farmers positive attitude towards SRI (POSID) respectively had strong coefficients However these were not statistically significant
6 THE MICROECONOMICS OF SRI
61 Rice agronomy and irrigation water management
Fanners agronomic practices level of cash input utilization and irrigation water management differentiated by system of production (SRI vs conventional) and seasons (wet-maha and dryshyyala) are shown in table 8 Expectedly there is substantial difference between the two systems of rice production regarding planting method fertility management and weed control practices For instance an average SRI-farmer transplants one 8-days-old rice seedling per hill on a square grid of about 23 by 23 cm While most conventional fields were planted by way of broadcasting few conventional farmers have practiced transplanting However the SRI transplanting differs from the conventional transplanting in many ways The conventional farmers planted on average four IS-days-old rice seedlings in a clump per hill on a square grid of 15 by 15 cm which is narrower than that for SRI
Concerning soil fertility management significant differences are noted between the two systems Generally SRI farmers used lesser doses of inorganic and higher doses of organic fertilizer per unit area as compared to conventional farmers Moreover a considerable number of SRI farmers abandoned altogether the use of inorganic fertilizers instead they put a lot of organic fertilizers The main sources of organic fertilizers include cow dung tree leaves straw poultry manure compost and rice bran
Weed control method is another important aspect differentiating the two systems of production SRI farmers use herbicides rarely instead they make use of a mechanical weeder andor hand weeding The conventional farmers rely heavily on herbicides and they flood their paddy fields with water as a means of weed control It is important to flood the field at the correct stage
One of the main advantages of SRI is its water saving with little or no reductions in the paddy yield (Thiyagarajan et aI 2002) We attempted to have an indirect and rough idea of the magnitude of on-farm or field-level water savings through farmer estimates of number of irrigation and hours of irrigation per unit area13
On average number of irrigations and hours of irrigation per unit area of SRI-fields are respectively about 24 percent and 23 percent lesser than the conventional paddy fields However the difference between SRI and conventional regarding hours of irrigation is not statistically significant Consistent to our a priori expectations the per hectare hours of irrigation (for both SRI and Conventional fields) during yala season is greater
13 F arrners were asked the number of irrigation done for each rice field they owned during Yala and Aaha seasons Moreover they were asked to give approximate hours elapsed during successive irrigation Then the number of irrigations was multiplied by the hours elapsed and divided by the area of the field to give an estimate of hours of irrigation per unit area We admit that for more conclusive results an exact field-level measurement needs to be done preferably for a number offarrners
347
~~ 6)
a - ) v 0 rrshy-
than that of Maha season This is because Yala season is relatively water scarce as compared to Maha season (see figure 7)
4~~----------------------------~
400 3~
~ 300 2~ ~ 200
~ l~ 100 ~
o
~ ~ ~ ~ ~ sect ~ g ~ ~ ~ ~ Mon1hs
~-WbTZa] bull DRY ZONE --shy
Figure 7Monthly rain fall distribution for the Dry and Wet Zones of Sri Lanka (1961-1990)
Table 8 also clearly indicates that generally SRI fields demand higher amount of human labor (about 3 times more) This arises from planting (about 37 man-days per ha) weeding (about 31 man-days per hal bund construction and cleaning (about 41 man-days per hal and organic fertilizer collection and transportation (126 man days per hal The corresponding figures for conventional fields are 8l man-days for planting (broadcasting) 16 man-days for weeding 114 man-days for bund construction and cleaning and 73 man-days per ha for organic matter collection and transportation The amount of bund construction and cleaning labor for SRI is significantly lower than that for conventional fields This is because the SRI farmers were advised not to clean bunds in order to harbor beneficial organisms as an integrated pest management strategy
348
g l
()
g e 8t ~ e pound VI bullell oJ
1 1
0
~ ~ shy--sect bull
~ ))
=~ --(9
0 (~
- ----
shybl
~
(
(0
til
0
~1
0 c
P
~
II g
~ t
amp
e w
g K
G
_ _
I
n~
_
I
8
Tab
le 8
In
T
b -
f
d [~-~
Pra
ctic
es o
r In
puts
SR
I C
onve
ntio
nal
Yal
a M
aha
Yal
a
~and
M
ean
SD
N
Mea
n SD
N
M
ean
SD
N
Mea
n T
ract
or h
ours
per
ha
26
232
32
24
18
7
32
28
183
12
9 28
pr
epar
atio
n B
ullo
ck h
ours
per
ha
24
438
32
17
35
0
32
19
475
12
9 17
P
lant
ing
Tra
nspl
anti
ng h
ours
per
ha
244
152
32
352
262
32
114
144
37
271
Bro
adca
stin
g ho
urs
per h
a
-
--
-67
8
420
8
7
63
Nw
nber
ofs
eedl
ings
per
hill
1
1 0
3 32
1
4 0
7 32
4
0 1
2 35
3
7 A
ge o
fsee
dlin
gs in
day
s 7
6 1
9 32
8
4 2
7 32
18
3
5 3
8
185
S
paci
ng b
etw
een
plan
ts in
inch
es
95
13
31
94
13
32
59
15
19
59
Spa
cing
bet
wee
n ro
ws
in i
nche
s 9
7 1
2 32
9
6 1
1 32
6
0 1
6 19
6
2 S
eed
rate
kg
per h
a 14
10
0
32
17
12
32
117
38
11
2 11
4 F
erti
liza
tion
U
reap
erh
a 77
73
0
32
78
804
32
14
1 86
2
128
133
(Ino
rgan
ic)
TD
Mk
g p
erh
a 76
13
05
32
516
78
2
32
97
800
12
8 96
N
PK
kg
per
ha
57
105
6 32
45
74
1
32
104
718
12
8 10
0 T
SP
kg
per
ha
-
-
-
13
120
8 12
8 4
f ~~~
MO
P k
g pe
r ha
--
--
--
03
33
I 12
8 0
5 F
erti
liza
tion
C
ow d
ung
in k
g p
er h
a 20
24
3066
32
14
22
2541
32
15
3 61
78
129
152
(Org
anic
) T
ree
leav
es in
kg
per h
a 10
13
1443
32
73
3 25
133
32
24
7 16
200
129
131
Str
aw i
n kg
per
ha
951
1900
4
32
261
799
0 3
2
170
706
4 12
9 28
7 P
oult
ry m
anur
e in
kg
per h
a 73
25
85
32
39
149
6 32
31
34
95
128
75
Com
post
in k
g pe
r ha
62
349
5 32
23
13
1 3
2
--
--
Ric
e br
an i
n kg
per
ha
23
945
32
8
437
32
-
--
Wee
ding
H
erbi
cide
s li
ter
per
ha
015
0
87
32
008
0
31
32
2
29
325
12
9 2
14
Hou
rs o
fMec
hani
cal
Wee
ding
per
ha
283
281
32
213
260
32
3
233
12
7 2
Han
d W
eedi
ng H
ours
per
ha
69
934
32
57
90
6
32
4
217
12
9 15
H
ours
ofb
un
d c
onst
ruct
ion
and
clea
ning
per
ha
28
48
0
32
38
51
32
8
8
862
12
9 94
Ir
riga
tion
M
ean
Num
ber o
fIrr
igat
ion
24
179
24
22
17
2
25
32
259
10
3 29
H
ours
of i
rrig
atio
n pe
r ha
1942
24
25
21
1720
21
16
23
25
89
40
38
97
2154
H
arve
stin
g P
er h
a ho
urs
ofh
arve
stin
g 32
8 26
62
31
326
376
7 13
35
5 25
46
I 11
5 26
5
Mah
a SD
18
9
380
18
10
444
0
9 3
9 1
3 1
5 38
0
815
75
6
749
19
9
43
594
2 51
02
1022
6
659
8
~~
-3
07
175
0 54
3
100
3 25
8
2993
18
17
N1 (
145
145
38
106
i~
38
23
23
132
147
147
147
147
147
14
5 I
145
I
143
I
145
-- 144
145
145
144
III
103
84
lJ
j
0 14
N r
efer
s to
the
num
ber
off
ield
s S
ince
mos
t oft
he f
arm
ers
had
mor
e th
an o
ne c
onve
ntio
nal r
ice
fiel
ds t
he n
umbe
r ofs
ampl
e ho
useh
olds
and
the
num
ber o
f fi
elds
may
var
y A
ll o
fthe
SR
I fa
rmer
s ha
d on
ly o
ne S
RI
field
M
oreo
ver
not
all
oft
he o
rigi
na16
0 S
RI
sam
ple
farm
ers
had
prac
tice
d S
RI
duri
ng 2
002
---
62 Yield Comparisons
The mean paddy yields obtained during the last three years differentiated by the system of production and seasons are listed in table 9 The mean SRI yield even though not as dmmatic as figures reported from many sources is about 44 percent more than that for the conventional method (F value = 474 P=0031) The reported conventional yields are well within the range of figures estimated by Sri Lanka Department of Census and Statistics The Departments estimate of paddy yields for the country lies between 25 and 41 t per hectare depending on the type of farming system (ie rainfed or irrigated rice farming) and the type of irrigation scheme (Kikuchi et aI 2002)
SRI is fertili~
contin fertili2 the co Interes or con and UI respon trend)
T bl e 9 Ri f management (Kgh) level d a ceyleIdsunder SRI and conventlOna system 0 a in the differel
Year Sri Conventional yield increase Yala Maha Mean Yala Maha Mean
2000 4097 6236 5488 3635 3644 3641 507 2001 5056 5327 5215 3516 3749 3633 435 2002 5737 5977 5811 4189 3832 4041 438 Mean 5299 5763 5524 3910 3757 3836 440
The set fertilizeuro the SUC4
However the yields reported in table 9 above conceal the effects of location and adoption15status The highest paddy yield (81 t ha) was recorded for SRI in Kalthota area during Maha
season for adopter group while the lowest (21 tha) was recorded for dis adopters during Yala season in Kurunegala (Table 10) Generally disadopters experienced the lowest paddy yield during the first year of adoption forcing them to discontinue the SRI pmctice The disadoption model of Section 53 also corroborates this fact Location-wise the yields recorded for Kalthota area are significantly better than those recorded for Kurunegala farmers irrespective ofthe system of production From table 10 one can also infer that the prospect of harvesting better paddy yield is higher for the Maha season than the Yala season which is in line with the usual expectation
Table 10 Paddy yield per acre by adoption status season year and location (kgha Location Year SRI Conventional
Ado ters Disado ters Ado tefs Disadopters Yala Maha Yala Maha Yala Maha Yala Maha
Kurunegala 2000 5726 7217 2102 4668 3501 3063 3769 4372 -
2001 6011 5499 4100 4628 4040 3628 2942 3851 2002 5619 5977 NA NA 3071 3702 3863 3911 Mean 5785 6231 3101 4648 3537 3464 3524 4045
Kalthota 2000 NA NA NA NA NA NA NA NA 2001 NA 8154 NA NA 6795 NA NA NA 2002 5806 NA NA NA 4900 NA NA NA Mean 5806 8154 NA NA 5848 NA NA NA
NA means not applicable
15 The original SRI sample farmers who have not practiced SRI during Yaa or Maha seasons of the year 2002 are regarded as disadopters By these criteria 20 of the 60 SRI sample farmers are disadopters
350
differet1 the orgc ofnutril
Table 1 Inorga
o oto 100 100 to 2 200ampa
--ornrutn F value The in
Table 1 Inorga
0 otol0( 100 to 200amp Grand F valueuro The 11
~ shyo-
---
- --
SRI is usually considered as a practice that gives substantial yield without the use of inorganic fertilizer (Barison 2002) Despite the advice not to use inorganic fertilizer some farmers have
tic as continued to use it with varying intensities The SRI farmers level of utilization of inorganictional fertilizer has been arbitrarily classified into four strata starting with zero level of utilization and ge of the corresponding paddy yields recorded for each stratum are reported are shown in Table 11
Interestingly the SRI farmers who did not apply any form of inorganic fertilizer recorded better or comparable yields to those farmers who applied up to and above 200 kg of fertilizer in Yala and up to 200 kg during Maha Another important observation is that while the paddy yield response to the applied fertilizer levels has slowed (ie the marginal product has shown declining trend) during Yala the yield response to additional levels of fertilizer has not reached optimum level during Maha The reason for this remarkable response difference may be due to variations in the level of available water during the two seasons Therefore the two seasons might need different fertilizer recommendations
The scenario for conventional paddy fields is different in that the response to the applied levels of fertilizer has been linear ie zero-inorganic fertilizer fields gave on average lower yields than the successive levels of fertilization especially during maha season (table 12) The reason for this difference is due to the fact that on SRI fields the added inorganic fertilizer was supplementary to )tion the organic fertilizer while for conventional fields chemical fertilizer was mostly the main source (aha of nutrients
Yala rield
Table 11 Yield comparison by level of fertilizer application (kgha )-SRI farmers tion
Inorganic fertilizer (kgha) I Yalanota Mean SD Ntern
0 5792 2715 5ieJd oto 100 4851 92133n 100 to 200 5954 2350 3 200 amp above 6481 2755 13r----------------------shyGrand mean 5825 2506 30 F value 1741(p=0195)s
MahaMeanshy SD~N 4349 2460 2 4159 3279 4 5362 2202 2 9133 1977 4 6049 3218 12 __~~285 (p=003 5)
The morgamc fertilizers were UREA TSP NPK and MOP
2 Table 12 Yield comparison by level of fertilizer application (kgha) - conventional farmers
la
ii3----~---Inorganic fertilizer (kgac) Yala c------shy
Mean SD N _M~a~r~~~_ __~ 0 3970 1786 9 1821 1136 ~ oto 100 4153 3797 J 1615 301699 28 100 to 200 4384 I 1975 68 3805 j 1930 35
1020200 amp above 5052 2153 4449 i 1522 4409 1936 80Grand mean 125 3758 i 1786
2625 (P=0056)F value 1058 (p=0370) The morgamc fertlhzers mclude UREA TSP NPK and MOP
351
~ -o shy
63 Profitability Comparisons
The microeconomics of the two systems of rice production was assessed using budgeting technique 16 Net returns were estimated for each farmer using the relationships
NR=GR-TC
VC=L- PXI I
TC=VC+F GR=RYRP
Where NR= Net Returns GR= Gross Returns VC= Variable Cost RY= Rice yield for SRI and conventional system RP= Rice price Pi =per unit price of the ith input and Xi= quantity of the ith input F is fixed cost and TC is total cost
The individual budgets prepared for each and every sample farmers differentiated by system of production and seasons (ie SRI and conventional) were averaged to facilitate easy comparisons (see table 13) Moreover the budgets were prepared under three wage-rate scenarios ie zero wage rate or family labor on-going farm wage rate and non-farm wage rate It is interesting to note that contrary to the survey farmers own subjective assessment and reports from different angles the cost of production per unit area for SRI is higher or at least comparable to that of conventional rice production17
Even though SRI reduces or avoids the use of cash inputs such as fertilizer and herbicides the resulting savings can not fully compensate for the additional costs born due to greater labor input for weeding transplanting and organic matter collection and transporting However the costs per unit of paddy output (Rupees per Kilogram) are lower than those of conventional due to significant increases in yield Consequently the estimated profit figures for SRI is almost double that of conventional practice for both seasons But it may be noted that this level ofprofitability is achieved with a lot ofdrudgery
In addition to the reported positive profitability figures table 13 also shows that some farmers experienced loss during both seasons This shows the advantage of budgeting for each farm than for average farm Two inferences may be made First the incidence of loss is higher for Yaa than for Maha season Secondly the incidence of loss among SRI farmers is substantially lower than that for conventional farms irrespective of the season
In Sri Lanka it is usually claimed that the competitiveness of rice sector has been worsen by the relative high wage rate Careful scrutiny of the costs and revenues of paddy production systems under three wage rate regimes presented in the table 13 tempts us to believe this claim
16 Entetprise budgeting technique was preferred to Partial Budgeting because SRI involves a major overhaul of the conventional rice production system Had the changes in the production system been minor partial budgeting would have been the natural choice according to C IMMYT (1988) 17 The costs include both cash and imputed labor and material costs
352
~ shy o-
enterprise following
)r SRI and
system of mparisons ie zero resting to ~ different
that of such as
costs and
than profit
may be
Table 13 Summary Results of the Enterprise budgets IProduction Seasonmiddot Wage rate Gross Total cost Net Costlkg Inciden bull system Revenue (RS) (RS) Revenue (RS) ce of
(Rs) loss SRI Yala Zero 34899 6506 29371 36 1
farm 34899 18907 15992 111 4 Non-farm 34899 24842 10223 150 6
Maha Zero 36720 5291 34575 22 0 farm 36720 20435 16285 87 1 Non-farm 37620 26493 13374 114 2
--_
Conventional Yala Zero 27017 10742 16032 76 9 farm 27017 18600 8417 133 27 Non-farm 27017 22248 4215 15s 29
i Maha Zero 23871 9503 14373 68 0 farm 23871 16381 7490 119 15
I Non-farm 23871 19687 4369 140 22
7 CONCLUSIONS AND IMPLICATIONS
1 The main advantages of SRI include yield increase reduced number of irrigations or irrigation-hours per irrigation and per unit area (ie increase in water productivity) reduced demand for cash inputs improved seed quality and higher milling ratio In addition to these private benefits SRI embodies added societal or environmental benefits due to reductions in the use of environment-unfriendly inputs such as herbicides and fertilizers It is not clear however if the observed on-farm water productivity can be translated into net water-saving at watershed or basin level which is an issue requiring further analyses This can be realized only if the practice is widely adopted and the farmers do not increase acreage
2 The System ofRice Intensification has a short history in Sri Lanka Its adoption process is dynamic in the sense that the adopters may quit the practice for some time and then reuse it when the circumstances allow This is because the practice involves little capital investment during initial adoption decision
3 The main variables influencing the incidence of SRI adoption are (i) location of the farm (ii) the type of farming system (ie irrigated Vs rain-fed farming) (iii) poverty status of the farmer (iv) participation in training programs (v) education status and (vi) the size and demographic structure of the farm family
4 The absence of significant difference in SRI adoption probability between farmers located at the head of irrigation canal and rain-fed farmers and the observed lower probability of SRI adoption among those located at the middle and tail end of irrigation canal underlines the importance of irrigation water supply risk and uncertainty variable in SRI adoption decision Hence contrary to the ideal SRI practice farmers at the middle and tail maintain a water layer on their field as a buffer to offset the risk of irregularity regarding irrigation water arrival This may also be done to reduce weed growth On the other hand the total dependence on rain for paddy cultivation means that the farmers are more cautious in
353
~ -o
investing in conventional yield enhancing cash inputs Therefore SRI which minimizes or avoids the use of such inputs is the logical alternative for rain-fed farmers
Barisshy5 SRI adopters mai nly come from the lowest and the highest poverty terciles of the farming convc
population In other words there is no significant difference in SRI adoption probability (http1between rich and poor farmers But poor farmers are likely to persist with SRI once they practice SRI than the rich farmers Moreover low realized yield during the first Barkeexperiment with SRI is the major factor behind discontinuing the SRI practice Proce
6 The main variables affecting the intensity of adoption of SRI are cattle ownership which Sri Lais a proxy for organic mater availability education status and the size and demographic structure of the farm family Batuv
7 The main problems associated with SRI practice are the demand for skills and high Norm amount of labor for weed control and transplanting non-availability of organic manure ofamiand limited availability of the rotary weeders (ht1JtL
8 The most appropriate domain (target group) for SRI adoption are those farmers a With limited land holdings
Bonlishyb Having bigger family size with high proportion of the family members capable of (htRL
engaging in work c Who are cash constrained d For whom rice constitutes the lions share ofannual income and consumption C~
e With limited alternative employment opportunities manw yTrigf With relative certainty regarding irrigation water supply and
g Practicing rainfed paddy cultivation 9 Generally SRI demands higher amounts labor per unit area (a lot of drudgery is involved) Feder
and induces the active participation of children between 7 and 14 years ofage and women Coun1 However whether this is a significant social disutility is a matter for further scrutiny
Javay issue
Kikuc produ BHaJ ~edil 2001
McDI staas
354
~ -o
lzes or REFERENCES
~rming Barison J (2002) Evaluation of nutrient up take and nutrient use efficiency of SRI and conventional rice cultivation methods in Madagascar ability (httpciifad comelleduSRIlproc 1 ISRI-32pdf) e they
~ first Barker R R Loeve Y H Li and T P Tuong (eds) (2001) Water Saving Irrigation for rice Proceedings of an lnternational Workshop held in Wuhan China 23-25 March 2001 Colombo which Sri Lanka lnternational Water Management lnstitute raphic
Batuwitage GP (2002) Adaptations of the system of rice intensification in Sri Lanka In high Norman Uphoff et al (eds) 2002 Assessment of the system of rice intensification Proceedings anure of and international conference held in Sanya China April 1-4 2002 (httpciifadcomelleduSRJlSRI-Assessmentspdf
Bonlieu F (1999) Summary offindings from thesis research on SRI )Ie of (httpciifad cornell edusribonlieu pdf)
I CIMMYT (1988) From agronomic data to farmer recommendations an economics trammg manual Completely revised edition Mexico City Centro lnternacional de Mejoramiento de Maiz y Trigo (CIMMYT)
ved) Feder G RE Just and DZilberman (1982) Adoption of Agricultural Innovation in Developing
men Countries A survey World Bank Staff Working Papers Number 542
Javaya (Newspaper Published by Sri Lanka Ministry ofAgriculture) JanuaryFebruary 2000 Issue
Kikuchi M R Barker MSamad and P Welingamage (2002) Comparative advantage of rice production in Sri Lanka with special reference to irrigation costs Sombilla M MHossain BHardy (eds) Development in the rice economy Proceedings of the international workshop on medium-and -long term prospects of rice supply and demand in the 21 st Century 3-5 December 2001 Los Banos Philippines International Rice Research Institute 436p
McDonald JF and R A Mofitt (1980) The use of tobit analysis Review ofeconomics and statistics Volume 62 (2) pp318-321
McHugh OV TS Steenhuis J Barison ECM Fernandez and NT Uphoff (2002) Farmer implementation of alternate wet and dry and non-flooded irrigation practices in the system of rice intensification In Water-Wise rice production Bourn BMA HB Hardy PS Bindraban T P Tuong and J K Ladha (eds) Proceedings of the International Workshop on Water-Wise Rice Production 8-11 April Los Banos Philippines lnternational Rice Research Institute
Moser CM and CB Barrett (2002) The system of rice intensification in practice Explaining low farmer adoption and high disadoption in Madagascarln Water-Wise rice production Bourn BMA H B Hardy PS Bindraban T PTuong and JK Ladha (eds) Proceedings of the
355
~ shy Q
International Workshop on Water-Wise Rice Production 8-11 April Los Banos Philippines International Rice Research Institute
Norman Uphoff et al (eds) (2002) Assessment of the system of rice intensification Proceedings ofan international conference held in Sanya China April 1-4 2002 (httpciifadcomelleduSRIISRI-Assessmentspdf)
Rena Perez (2002) Experience in Cuba with the system of rice intensification Norman Uphoff et al (eds)2002 Assessment of the system of rice intensification Proceedings ofan international conference held in Sanya China April 1-4 2002 Aftel (httpciifadcomelleduSRIISRI-Assessmentspdf) appe(
in us Stoop WA Norman Uphoff and Amir Kassam (2002) A review of agricultural research issues indus raised by the system of rice intensification (SRI) from Madagascar opportunities for improving Taiwa farming systems for resource-poor farmers Agricultural Systems 71 (2002) 249-274 positi
positi Tiyagarajan et al (2002) Effects of SRI practices on hybrid rice performance in Tamil Nadu on pat India In Water-Wise rice production Bourn BMA H B Hardy PS Bindraban TPTuong Metho and lK Ladha (eds) Proceedings of the International Workshop on Water-Wise Rice Production the po 8-11 April Los Banos Philippines Losbanos (Philippines) International Rice Research Institute recogn
averagl consen the intI agricul1 agricult product fields re KeyWl Method
356
-o~
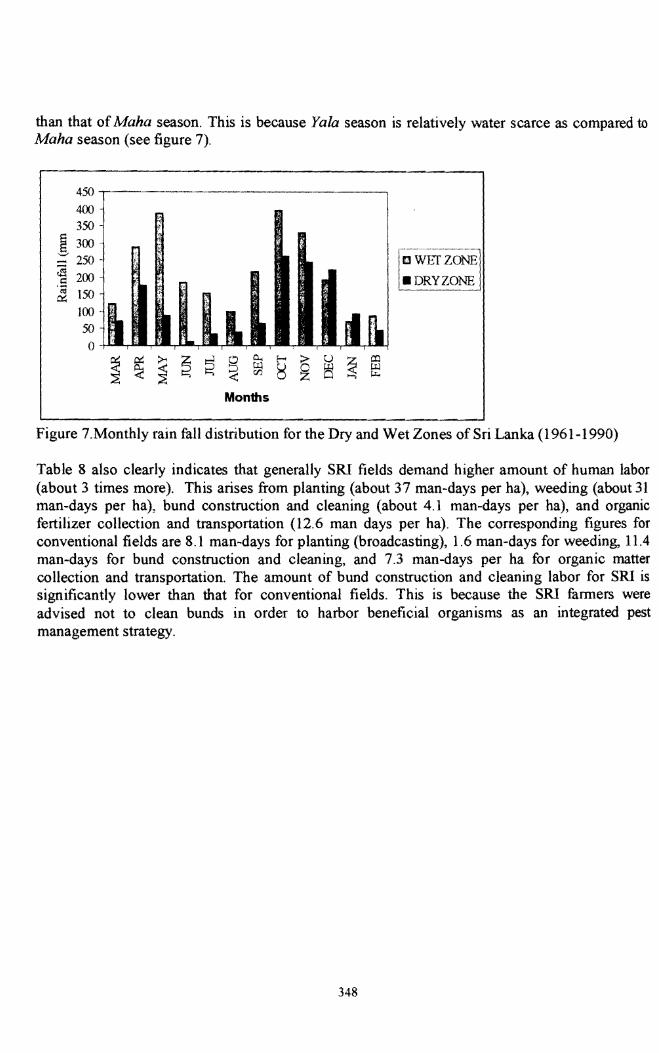
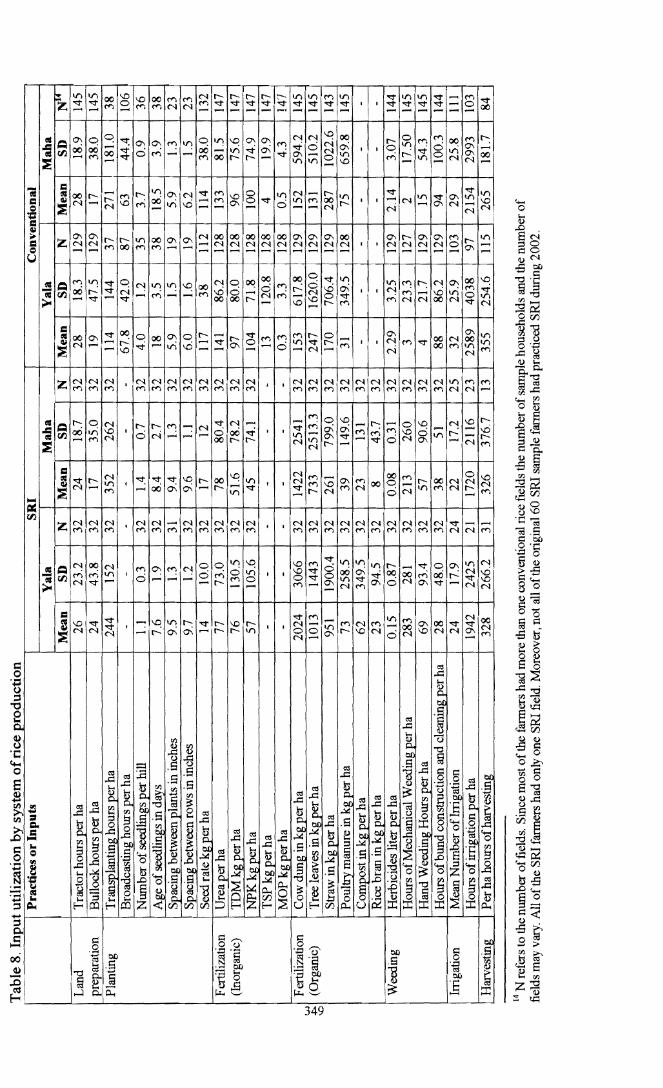

---
- --
SRI is usually considered as a practice that gives substantial yield without the use of inorganic fertilizer (Barison 2002) Despite the advice not to use inorganic fertilizer some farmers have
tic as continued to use it with varying intensities The SRI farmers level of utilization of inorganictional fertilizer has been arbitrarily classified into four strata starting with zero level of utilization and ge of the corresponding paddy yields recorded for each stratum are reported are shown in Table 11
Interestingly the SRI farmers who did not apply any form of inorganic fertilizer recorded better or comparable yields to those farmers who applied up to and above 200 kg of fertilizer in Yala and up to 200 kg during Maha Another important observation is that while the paddy yield response to the applied fertilizer levels has slowed (ie the marginal product has shown declining trend) during Yala the yield response to additional levels of fertilizer has not reached optimum level during Maha The reason for this remarkable response difference may be due to variations in the level of available water during the two seasons Therefore the two seasons might need different fertilizer recommendations
The scenario for conventional paddy fields is different in that the response to the applied levels of fertilizer has been linear ie zero-inorganic fertilizer fields gave on average lower yields than the successive levels of fertilization especially during maha season (table 12) The reason for this difference is due to the fact that on SRI fields the added inorganic fertilizer was supplementary to )tion the organic fertilizer while for conventional fields chemical fertilizer was mostly the main source (aha of nutrients
Yala rield
Table 11 Yield comparison by level of fertilizer application (kgha )-SRI farmers tion
Inorganic fertilizer (kgha) I Yalanota Mean SD Ntern
0 5792 2715 5ieJd oto 100 4851 92133n 100 to 200 5954 2350 3 200 amp above 6481 2755 13r----------------------shyGrand mean 5825 2506 30 F value 1741(p=0195)s
MahaMeanshy SD~N 4349 2460 2 4159 3279 4 5362 2202 2 9133 1977 4 6049 3218 12 __~~285 (p=003 5)
The morgamc fertilizers were UREA TSP NPK and MOP
2 Table 12 Yield comparison by level of fertilizer application (kgha) - conventional farmers
la
ii3----~---Inorganic fertilizer (kgac) Yala c------shy
Mean SD N _M~a~r~~~_ __~ 0 3970 1786 9 1821 1136 ~ oto 100 4153 3797 J 1615 301699 28 100 to 200 4384 I 1975 68 3805 j 1930 35
1020200 amp above 5052 2153 4449 i 1522 4409 1936 80Grand mean 125 3758 i 1786
2625 (P=0056)F value 1058 (p=0370) The morgamc fertlhzers mclude UREA TSP NPK and MOP
351
~ -o shy
63 Profitability Comparisons
The microeconomics of the two systems of rice production was assessed using budgeting technique 16 Net returns were estimated for each farmer using the relationships
NR=GR-TC
VC=L- PXI I
TC=VC+F GR=RYRP
Where NR= Net Returns GR= Gross Returns VC= Variable Cost RY= Rice yield for SRI and conventional system RP= Rice price Pi =per unit price of the ith input and Xi= quantity of the ith input F is fixed cost and TC is total cost
The individual budgets prepared for each and every sample farmers differentiated by system of production and seasons (ie SRI and conventional) were averaged to facilitate easy comparisons (see table 13) Moreover the budgets were prepared under three wage-rate scenarios ie zero wage rate or family labor on-going farm wage rate and non-farm wage rate It is interesting to note that contrary to the survey farmers own subjective assessment and reports from different angles the cost of production per unit area for SRI is higher or at least comparable to that of conventional rice production17
Even though SRI reduces or avoids the use of cash inputs such as fertilizer and herbicides the resulting savings can not fully compensate for the additional costs born due to greater labor input for weeding transplanting and organic matter collection and transporting However the costs per unit of paddy output (Rupees per Kilogram) are lower than those of conventional due to significant increases in yield Consequently the estimated profit figures for SRI is almost double that of conventional practice for both seasons But it may be noted that this level ofprofitability is achieved with a lot ofdrudgery
In addition to the reported positive profitability figures table 13 also shows that some farmers experienced loss during both seasons This shows the advantage of budgeting for each farm than for average farm Two inferences may be made First the incidence of loss is higher for Yaa than for Maha season Secondly the incidence of loss among SRI farmers is substantially lower than that for conventional farms irrespective of the season
In Sri Lanka it is usually claimed that the competitiveness of rice sector has been worsen by the relative high wage rate Careful scrutiny of the costs and revenues of paddy production systems under three wage rate regimes presented in the table 13 tempts us to believe this claim
16 Entetprise budgeting technique was preferred to Partial Budgeting because SRI involves a major overhaul of the conventional rice production system Had the changes in the production system been minor partial budgeting would have been the natural choice according to C IMMYT (1988) 17 The costs include both cash and imputed labor and material costs
352
~ shy o-
enterprise following
)r SRI and
system of mparisons ie zero resting to ~ different
that of such as
costs and
than profit
may be
Table 13 Summary Results of the Enterprise budgets IProduction Seasonmiddot Wage rate Gross Total cost Net Costlkg Inciden bull system Revenue (RS) (RS) Revenue (RS) ce of
(Rs) loss SRI Yala Zero 34899 6506 29371 36 1
farm 34899 18907 15992 111 4 Non-farm 34899 24842 10223 150 6
Maha Zero 36720 5291 34575 22 0 farm 36720 20435 16285 87 1 Non-farm 37620 26493 13374 114 2
--_
Conventional Yala Zero 27017 10742 16032 76 9 farm 27017 18600 8417 133 27 Non-farm 27017 22248 4215 15s 29
i Maha Zero 23871 9503 14373 68 0 farm 23871 16381 7490 119 15
I Non-farm 23871 19687 4369 140 22
7 CONCLUSIONS AND IMPLICATIONS
1 The main advantages of SRI include yield increase reduced number of irrigations or irrigation-hours per irrigation and per unit area (ie increase in water productivity) reduced demand for cash inputs improved seed quality and higher milling ratio In addition to these private benefits SRI embodies added societal or environmental benefits due to reductions in the use of environment-unfriendly inputs such as herbicides and fertilizers It is not clear however if the observed on-farm water productivity can be translated into net water-saving at watershed or basin level which is an issue requiring further analyses This can be realized only if the practice is widely adopted and the farmers do not increase acreage
2 The System ofRice Intensification has a short history in Sri Lanka Its adoption process is dynamic in the sense that the adopters may quit the practice for some time and then reuse it when the circumstances allow This is because the practice involves little capital investment during initial adoption decision
3 The main variables influencing the incidence of SRI adoption are (i) location of the farm (ii) the type of farming system (ie irrigated Vs rain-fed farming) (iii) poverty status of the farmer (iv) participation in training programs (v) education status and (vi) the size and demographic structure of the farm family
4 The absence of significant difference in SRI adoption probability between farmers located at the head of irrigation canal and rain-fed farmers and the observed lower probability of SRI adoption among those located at the middle and tail end of irrigation canal underlines the importance of irrigation water supply risk and uncertainty variable in SRI adoption decision Hence contrary to the ideal SRI practice farmers at the middle and tail maintain a water layer on their field as a buffer to offset the risk of irregularity regarding irrigation water arrival This may also be done to reduce weed growth On the other hand the total dependence on rain for paddy cultivation means that the farmers are more cautious in
353
~ -o
investing in conventional yield enhancing cash inputs Therefore SRI which minimizes or avoids the use of such inputs is the logical alternative for rain-fed farmers
Barisshy5 SRI adopters mai nly come from the lowest and the highest poverty terciles of the farming convc
population In other words there is no significant difference in SRI adoption probability (http1between rich and poor farmers But poor farmers are likely to persist with SRI once they practice SRI than the rich farmers Moreover low realized yield during the first Barkeexperiment with SRI is the major factor behind discontinuing the SRI practice Proce
6 The main variables affecting the intensity of adoption of SRI are cattle ownership which Sri Lais a proxy for organic mater availability education status and the size and demographic structure of the farm family Batuv
7 The main problems associated with SRI practice are the demand for skills and high Norm amount of labor for weed control and transplanting non-availability of organic manure ofamiand limited availability of the rotary weeders (ht1JtL
8 The most appropriate domain (target group) for SRI adoption are those farmers a With limited land holdings
Bonlishyb Having bigger family size with high proportion of the family members capable of (htRL
engaging in work c Who are cash constrained d For whom rice constitutes the lions share ofannual income and consumption C~
e With limited alternative employment opportunities manw yTrigf With relative certainty regarding irrigation water supply and
g Practicing rainfed paddy cultivation 9 Generally SRI demands higher amounts labor per unit area (a lot of drudgery is involved) Feder
and induces the active participation of children between 7 and 14 years ofage and women Coun1 However whether this is a significant social disutility is a matter for further scrutiny
Javay issue
Kikuc produ BHaJ ~edil 2001
McDI staas
354
~ -o
lzes or REFERENCES
~rming Barison J (2002) Evaluation of nutrient up take and nutrient use efficiency of SRI and conventional rice cultivation methods in Madagascar ability (httpciifad comelleduSRIlproc 1 ISRI-32pdf) e they
~ first Barker R R Loeve Y H Li and T P Tuong (eds) (2001) Water Saving Irrigation for rice Proceedings of an lnternational Workshop held in Wuhan China 23-25 March 2001 Colombo which Sri Lanka lnternational Water Management lnstitute raphic
Batuwitage GP (2002) Adaptations of the system of rice intensification in Sri Lanka In high Norman Uphoff et al (eds) 2002 Assessment of the system of rice intensification Proceedings anure of and international conference held in Sanya China April 1-4 2002 (httpciifadcomelleduSRJlSRI-Assessmentspdf
Bonlieu F (1999) Summary offindings from thesis research on SRI )Ie of (httpciifad cornell edusribonlieu pdf)
I CIMMYT (1988) From agronomic data to farmer recommendations an economics trammg manual Completely revised edition Mexico City Centro lnternacional de Mejoramiento de Maiz y Trigo (CIMMYT)
ved) Feder G RE Just and DZilberman (1982) Adoption of Agricultural Innovation in Developing
men Countries A survey World Bank Staff Working Papers Number 542
Javaya (Newspaper Published by Sri Lanka Ministry ofAgriculture) JanuaryFebruary 2000 Issue
Kikuchi M R Barker MSamad and P Welingamage (2002) Comparative advantage of rice production in Sri Lanka with special reference to irrigation costs Sombilla M MHossain BHardy (eds) Development in the rice economy Proceedings of the international workshop on medium-and -long term prospects of rice supply and demand in the 21 st Century 3-5 December 2001 Los Banos Philippines International Rice Research Institute 436p
McDonald JF and R A Mofitt (1980) The use of tobit analysis Review ofeconomics and statistics Volume 62 (2) pp318-321
McHugh OV TS Steenhuis J Barison ECM Fernandez and NT Uphoff (2002) Farmer implementation of alternate wet and dry and non-flooded irrigation practices in the system of rice intensification In Water-Wise rice production Bourn BMA HB Hardy PS Bindraban T P Tuong and J K Ladha (eds) Proceedings of the International Workshop on Water-Wise Rice Production 8-11 April Los Banos Philippines lnternational Rice Research Institute
Moser CM and CB Barrett (2002) The system of rice intensification in practice Explaining low farmer adoption and high disadoption in Madagascarln Water-Wise rice production Bourn BMA H B Hardy PS Bindraban T PTuong and JK Ladha (eds) Proceedings of the
355
~ shy Q
International Workshop on Water-Wise Rice Production 8-11 April Los Banos Philippines International Rice Research Institute
Norman Uphoff et al (eds) (2002) Assessment of the system of rice intensification Proceedings ofan international conference held in Sanya China April 1-4 2002 (httpciifadcomelleduSRIISRI-Assessmentspdf)
Rena Perez (2002) Experience in Cuba with the system of rice intensification Norman Uphoff et al (eds)2002 Assessment of the system of rice intensification Proceedings ofan international conference held in Sanya China April 1-4 2002 Aftel (httpciifadcomelleduSRIISRI-Assessmentspdf) appe(
in us Stoop WA Norman Uphoff and Amir Kassam (2002) A review of agricultural research issues indus raised by the system of rice intensification (SRI) from Madagascar opportunities for improving Taiwa farming systems for resource-poor farmers Agricultural Systems 71 (2002) 249-274 positi
positi Tiyagarajan et al (2002) Effects of SRI practices on hybrid rice performance in Tamil Nadu on pat India In Water-Wise rice production Bourn BMA H B Hardy PS Bindraban TPTuong Metho and lK Ladha (eds) Proceedings of the International Workshop on Water-Wise Rice Production the po 8-11 April Los Banos Philippines Losbanos (Philippines) International Rice Research Institute recogn
averagl consen the intI agricul1 agricult product fields re KeyWl Method
356
-o~