sri venkateswara college of engineering and technology. edwards deming, joseph m. juran, philip...
TRANSCRIPT
1
Sri Venkateswara
College of Engineering and Technology
QUESTION BANK
SUBJECT: TOTAL QUALITY MANAGEMENT Dept/Sem: ECE/VII
SUB CODE: GE2022
UNIT-I
1. Define Quality.
A. 1. Fitness for intended use. (Joseph Juran). 2. Conformance to specifications. (Philip Crosby).
3. The totality of features of a product or service that bears on its ability to satisfy a stated or
implied need. (American Society of Quality).
2. Define Total Quality Management.
A. 1. The art of managing the total organization to achieve excellence in all spheres of
activity.(Besterfield). 2. The integration of all functions and processes within an organization in
order to achieve the continuous improvement of the quality of goods and services. (Omachonu).
3. Mention the basic features of TQM.
A. 1. Management commitment, 2. Focus on customer (both external and internal), 3. Employee
involvement, empowerment, 4. Continuous improvement, 5. Treating suppliers as partners, and
6. Establish performance measures for processes.
4. What are the major benefits of TQM?
A. Improved quality, higher productivity, employee participation, teamwork, working
relationships, customer satisfaction, employee satisfaction, communication, profitability, market
share, and stock price performance.
5. What are some major obstacles to TQM implementation?
A. Lack of management commitment, Inability to change organizational culture, Improper
planning, Lack of continuous training and education, Paying inadequate attention to internal and
external customers, Inadequate use of empowerment and teamwork, Lack of employee
involvement, Emphasis on short-term results, etc.
6. What are the various quality statements?
A. The quality statements include the vision statement, mission statement, and quality policy
statement.
7. What is a Vision statement?
A. A short declaration of what an organization aspires to be in the future. It is an ideal state that
an organization continually strives to achieve. It is timeless, inspirational, and becomes deeply
shared within the organization.
8. What is a Mission statement?
A. The mission statement answers the following questions: who we are, who are our customers,
what we do, and how we do it. The mission provides the guide map, milestones for achieving the
vision.
9. What is the importance of customer focus for an organization?

2
A. Customers are the most important asset of an organization. An organization’s success depends
on how many customers it has, how much they buy, how often they buy, and how long they are
retained (loyalty).
10. Distinguish between ‘internal customer’ and ‘external customer’.
A. An external customer exists outside the organization and can be defined in many ways – user,
buyer, influencer. He generally falls into one of three categories: current, prospective, or lost
customer. Every function within the organization – engineering, production, order processing, etc.
– has an internal customer. Every person in a process is considered a customer of the preceding
operation. For example, Manufacturing is a customer for Purchasing, and Dispatching is a
customer for Packaging.
11. What are the three levels of quality in the Kano model of customer satisfaction?
A. (i) Basic quality, (ii) Performance quality, and (iii) Excitement quality. The products
corresponding to these three quality levels were termed as ‘Dissatisfiers’, ‘Satisfiers’ and
‘Delighters/Exciters’ respectively in the Kano model.
12. What is importance of customer retention?
A. It costs a company six times more to sell a product to a new customer than it does to sell to an
existing one. Loyal customers generate more revenue, and are also cheaper to maintain. Customer
loyalty facilitates cross-selling/up-selling of a company’s other products/services, and also acts as
an effective barrier to the entry of competition.
13. What are the major dimensions of product quality?
A. Performance, features, usability, conformance to standards/specifications, reliability,
durability, maintainability, etc.
14. What are the major dimensions of service quality?
A. Service duration, timeliness, completeness, consistency, convenience, accuracy, courtesy, etc.
15. What is meant by ‘Cost of quality’?
A. Quality costs are defined as costs associated with non-achievement of product/service quality.
In simple terms, quality cost is the cost of poor products/services. All costs associated with poor
quality and its correction are integrated into one system to enhance the quality management
function.
16. What are the four categories of quality costs?
A. 1. Prevention costs, 2. Appraisal costs, 3. Internal failure costs, and 4. External failure costs.
17. What are internal failure costs?
A. These are costs required to identify, repair, replace, or dispose off defective products/services
prior to delivery to the customer.
18. Mention the names of some major contributors to the quality movement.
A. Edwards Deming, Joseph M. Juran, Philip Crosby, Feigenbaum, Ishikawa, Taguchi, Shingo,
Walter Shewhart, etc.
19. What is Deming Cycle?
A. P-D-S-A (Plan-Do-Study-Act) cycle of continuous improvement.
20. What is Deming’s “System of Profound Knowledge”?
3
A. Deming summarized his philosophy in what he called “A System of Profound Knowledge”. It
comprised of 4 parts: (1) appreciation for a system, (2) some knowledge of the theory of
variation, (3) theory of knowledge, and (4) psychology. Deming recognized the synergy among
these diverse subjects and developed them into a theory of management.
PART-B
1. Explain the Dimensions of product quality.
Dimensions of quality
Quality has different dimensions. These dimensions are somewhat independent and therefore, a
product can be excellent in one dimension and average or poor in another.
Dimensions of product quality:
1. Performance: primary product characteristics, e.g. picture brightness in TV.
2. Features: secondary characteristics, added features, e.g. remote control, picture-in-picture.
3. Usability: ease of use with minimum training.
4. Conformance: meeting specifications, industry standards,. (E.g. ISI specs., emission norms).
5. Reliability: consistency of performance over a specified time period under specified conditions.
6. Durability: extent of useful life, sturdiness.
7. Maintainability/Serviceability: ease of attending to maintenance, repairs.
8. Efficiency: ratio of output to input. E.g. mileage, braking distance, processing time.
9. Aesthetics: sensory characteristics, e.g. appearance, exterior finish, texture, color, shape, etc.
10. Reputation: subjective assessment based of past performance, brand image, industry ranking.
11. Safety: in items like pressure cookers, electrical items, toys, cranes, etc.
2. Explain the Dimensions of service quality.
Dimensions of service quality:
1. Time: how much time a customer must wait / undergo service.
2. Timeliness: whether service will be performed when promised.
3. Completeness: whether all items in the order are included.
4. Consistency: consistent service every time, and for every customer. Reliability of service.
5. Accessibility/Convenience: ease of obtaining the service.
6. Accuracy: absence of mistakes.
7.Responsiveness: quick response, resolution of unexpected problems.
8. Courtesy: cheerful, friendly service.
9. Competency/Expertise: In professions like doctors, lawyers, mechanics, etc.
3. Explain the evolution of TQM.
HISTORICAL REVIEW OF TQM:
* Ancient Egypt, 1400 B.C. – Pyramids, wall paintings show evidence of measurement,
inspection, accuracy.
* Middle Ages – Age of craftsmanship. The skilled craftsperson served as both manufacturer and
inspector. Pride in workmanship. Spread of skills through apprentice training.
* 1798 – Concept of interchangeable parts. U.S. Government awarded Eli Whitney a two-year
contract to supply 2,000 muskets to the armed forces. Due to myriad problems in accurate making
and matching of parts, it took more than 10 years to complete the project. It was the precursor to
the Industrial Revolution in the early 19th century.
* Early 1900s – Taylor’s Scientific Management era. Separation of planning and execution
functions. Inclusion of product inspection as a stage in manufacturing. Segmentation of a job into

4
specific work tasks, with focus on efficiency. Quality assurance fell into the hands of inspectors.
Inspection became the primary means of quality control during the first half of the 20th century.
* 1920s – Bell Telephone Labs in USA was the leader in industrial quality assurance. Early
pioneers of quality control – Walter Shewhart, Dodge, Edwards Deming – belonged to this
company. Shewhart introduced control charts, Statistical Quality Control. Dodge and Romig
introduced Acceptance Sampling. Quality became a separate discipline handled by experts, and
workers, managers stopped bothering about quality.
* World War II (1940s) – Large-scale use of Quality Control in industry. American Society for
Quality (ASQ) set up.
* Post-World War II (late 1940s, early 1950s) – Two US consultants, Deming and Joseph Juran,
visited Japan and introduced SQC techniques to the Japanese to help them rebuild their war-
shattered economy and industry. The two focused on top management rather than on quality
specialists. Juran began his ‘Cost of Quality’ approach.
* 1951 – The Union of Japanese Scientists & Engineers (JUSE) instituted the Deming Prize to
reward companies which excelled in quality.
* Mid-1950s – Feigenbaum (USA) introduced the concept of Total Quality Control (TQC) to
expand the quality focus beyond manufacturing to include design, procurement, and other
supporting functions.
* 1960s – Philip Crosby (USA) introduced the concept of ‘Zero Defects’.
* 1970s – Japanese overtook the Western manufacturers in quality. Invasion and capture of US,
European markets by Japanese products.
* Late 1970s – Crisis response in the US to the Japanese domination. Dramatic shift from quality
assurance to a strategic approach to quality. Shift from a reactive to a pro-active approach of
prevention rather than finding and correcting defects. Also an era of increased consumer
awareness, assertiveness, government safety regulations, product liability judgments in courts.
Quality became the key to survival, global competitiveness.
* 1980 – Start of a quality revolution in USA. Origin: Deming’s TV program on NBS titled “If
Japan Can, Why Can’t We?” which became highly popular. Top companies like Ford, GM, P&G
sought Deming’s help to revolutionize their approach to quality. Launch of TQM movement.
* 1987 – US government established the Malcolm Baldrige National Quality Award. ISO 9000
standards came into existence, mainly through efforts in Europe. Quality practices were extended
to service sector to include schools, hospitals, transportation, etc.
* Current scenario – TQM principles are recognized as the basis for high performance and
competitive success. Quality principles have got integrated so tightly with daily work activities
that quality is no longer viewed as something special.
4. Write basic concepts of TQM?
BASIC CONCEPTS/PRINCIPLES OF TQM:
1. Management commitment
2. Focus on customer (both external and internal)
3. Employee involvement, empowerment
4. Continuous improvement
5. Treating suppliers as partners
6. Establish performance measures for processes
7. Designing products for quality
8. Quality at source
9. Defect prevention
10. Root cause corrective action
11. Benchmarking
12. Training
13. Positive motivation
14. Team work
5
15. Management by fact and
16. Quick response.
5. Explain the contributions of Deming to TQM.
Deming’s 14 points for Management:
1. Create and publicize to all employees the aims and purposes of the organization.
2. Adopt the new philosophy (of customer satisfaction, continuous improvement, defect
prevention, management-labour cooperation, etc.).
3. Stop dependence on inspection to achieve quality. (Managers must understand how variation
affects their processes and take steps to reduce the causes of variation. Workers must take
responsibility for their own work).
4. End the practice of awarding business on the basis of price tag alone. (Costs due to inferior
materials/components increase costs in the later stages of production. Suppliers themselves are
part of the whole system and hence should be treated as long-term partners).
5. Improve constantly and forever the system of production and service .(Aim for small,
incremental, continuous improvements – not merely in the area of production but also covering
transportation, maintenance, sales, service, administration, etc. – all areas of the organization).
6. Institute training. (Employees need the proper tools and knowledge to do a good job, and it is
management’s responsibility to provide these. Training not only improves quality and
productivity, but also enhances workers’ morale).
7. Adopt modern methods of supervision and leadership. (Managers, Supervisors should act as
coaches, facilitators and not as policemen).
8. Drive out fear. (Fear in work manifests as fear of reprisal, fear of failure, fear of change, fear of
the unknown. Fear encourages short-term, selfish thinking, not long-term improvement for the
benefit of all).
9. Break down barriers between departments and individuals. (Promote teamwork).
10. Eliminate the use of slogans and exhortations. (Workers cannot improve solely through
motivational methods when the system in which they work constrains their performance. On the
contrary, they will become frustrated, and their performance will decrease further).
11. Eliminate work standards, numerical quotas, and MBO. (Numerical quotas reflect short-term
perspectives and do not encourage long-term improvement. Workers may shortcut quality to
reach the goal. The typical MBO system focuses on results, not processes, and encourages short-
term behavior).
12. Remove barriers to pride in workmanship. (Treating workers as commodities; giving them
monotonous jobs, inferior tools; performance appraisals, management assuming it is smarter than
workers and not using the workers’ knowledge and experience to the fullest extent).
13. Encourage education and self-improvement for everyone.
14. Take action to achieve the transformation. (The TQ philosophy is a major cultural change,and
many firms find it difficult. Top management must take the initiative and include everyone in it).
6. Explain the contributions of Juran to TQM.
Biographical:
+ Joseph M. Juran, Ph.D. (1904- ). Born in Romania. His parents migrated to the USA.
+ Worked at Western Electric Co.from 1924 to 1941. There he got exposed to the concepts of
Shewhart.
Contributions:
+ In 1951, he published ‘Quality Control Handbook’ which is still a standard reference for quality
control departments in organizations.
6
+ Traveled to Japan in 1954 to teach quality management to the Japanese at the invitation of the
Japanese Union of Scientists and Engineers (JUSE). Juran and Deming introduced the concept of
SQC to the Japanese. Helped the Japanese to improve quality to unprecedented levels.
+ Developed, published in 1986, the Juran Trilogy (Quality Trilogy) of three inter-related
processes – quality planning, quality control, and quality improvement – for managing quality.
+ He popularized the concept of Fitness for Quality – comprising of Quality of Design, Quality
of Conformance, Availability (reliability), Safety and Field Service.
+ Along with Deming, he introduced the concept of ‘Quality Assurance’.
+ He formulated a Quality Planning Roadmap. [1. Identify your customers, 2. Find out their
needs, 3. Translate them into technical requirements, 4. Develop the product, 5. Develop and
validate the process, and 6. Translate the resulting plan to the operating personnel.]
+ He advocated the accounting and analysis of quality costs to focus attention on quality
problems.
+ He emphasized that upper management in particular needed training and experience in
managing for quality. At the operational level, his focus was on increasing conformance to
specifications through the elimination of defects, supported by statistical analysis.
+ Founded Juran Institute in 1979 to provide training, consulting services for improving business
performance and attaining quality leadership.
+ His book ‘Managerial Breakthrough’ (1964) presented the concept of ‘Universal
Breakthrough Sequence (or Breakthrough improvement), which has now evolved into Six
Sigma, the basis for quality initiatives worldwide.
+ Juran described quality from the customer perspective as having two aspects: (i) Higher quality
means a greater number of features that meet customers’ needs. (ii) ‘Freedom from trouble’ –
higher quality consists of fewer defects.
+ Juran is recognized as the person who added the human dimension to quality – broadening it
from its statistical origins, and thus helping develop the concept of TQM.
7. Explain the contributions of Crossby to TQM.
Biographical:
* Philip B. Crosby (1926-2001)
* Was Corporate Vice President for Quality at International Telephones & Telegraph (AT&T) for
14 years after working his way up from line inspector.
* After leaving AT&T, he established Philip Crosby Associates in 1979 to develop and offer
training programs. Guided GM, Chrysler, Xerox, Motorola, etc. in quality management.
* He wrote 13 books on quality, many of which were translated into 17 languages, sold millions
of copies, and changed the way management looked at quality. Two of his most popular books
are: ‘Quality is Free’(1979) and ‘Quality Without Tears’ (1984).
Contributions:
* He developed the concept of Zero Defects.
* He stated that “doing it right the first time” is less expensive than the costs of detecting and
correcting defects.
* The book ‘Quality Without Tears’ contains the essence of Crosby’s philosophy embodied in
two concepts: (i) Absolutes of Quality Management, and (ii) Basic Elements of Improvement.
+ (i) Absolutes of Quality Management: (1) Quality means conformance to requirements, not elegance.
(2) Quality is achieved by prevention, not appraisal.
(3) The performance standard is zero defects, not acceptable quality levels. Quality is free.
(4) Quality is measured by the price of non-conformance, not indexes.
+ (ii) Basic Elements of Improvement
7
(1) Determination: Top management must be serious about quality improvement.
(2) Education: Through education, the Absolutes must be made understandable to everyone.
(3) Implementation: Every manager must understand the implementation process.
* He enumerated 14 steps for quality improvement {[1] Establish management commitment,
[2] Form quality improvement team, [3] Establish quality measures, [4] Evaluate the cost of
quality, [5] Establish quality awareness, [6] Instigate corrective action, [7] Carry out Zero
Defect planning, [8] Undertake employee training, [9] Hold a Zero-Defect Day, [10] Employee
goal setting, [11] Error cause removal, [12] Establish recognition, [13] Establish Quality
Councils, and [14] Do it all over again.}
* He developed ‘Quality Vaccine’. Crosby advocated the concept of Quality Vaccine for
successful implementation of TQM. Its three major components are:
(1) Integrity – towards customers, employees, and suppliers.
(2) Communication - both internal and external.
(3) Systems and Operations.
8. Explain the TQM framework.
* Basic concepts/principles of TQM:
1. Management commitment, 2. Focus on customer (both external and internal), 3. Employee
involvement, empowerment, 4. Continuous improvement, 5. Treating suppliers as partners,
6. Establish performance measures for processes, 7. Designing products for quality, 8. Quality at
source, 9. Defect prevention, 10. Root cause corrective action, 11. Benchmarking, 12. Training,
13. Positive motivation, 14. Team work, 15. Management by fact, and 16. Quick response.
* Cause-and-effect cycle of TQM:
TQM High quality product/service High productivity, lower cost Lower price More
competitive position High profit, growth Job security Satisfying place to work.
* Stages in the evolution of quality:
Inspection Quality Control (QC) Quality Assurance (QA) Quality Mgmt. (QM) TQM
* Benefits of quality systems:
Increase in – system efficiency, worker morale, customer satisfaction.
Decrease in – complaints, costs, production time.
9. State and explain the barriers to TQM implementation in an organization.
* Many organizations, especially small ones with niche products, are comfortable with their
current state. They are satisfied with their current level of performance and profits. Organizations
with this culture will see little need for TQM until they begin to lose market share.
Awareness comes about when (a) the organization loses market share or (b) TQM is
mandated by the customer, or (c) management realizes that TQM is a better way to run a business
and compete in domestic and world markets.
Once an organization embarks on TQM, the following are some of the major obstacles
encountered in implementation:
1. Lack of management commitment: Management does not allocate sufficient time and resources
for TQM implementation. The purpose is not clearly, consistently communicated to all personnel.
Management’s compensation is not linked to quality goals such as failure costs, customer
complaints, and cycle time reduction.
8
2. Inability to change organizational culture: Even individuals resist change; changing an
organization’s culture is much more difficult and may require as much as 5 years or more.
Exhortations, speeches, slogans are effective only in the short run.
3. Improper planning: Absence of two-way communication of ideas during the development of
the plan and its implementation.
4. Lack of continuous training and education.
5. Incompatible organizational structure and differences between individuals/departments.
6. Ineffective measurement techniques for key characteristics of the organization. Lack of access
to data and results.
7. Paying inadequate attention to internal and external customers. Inability to understand the
changing needs and expectations of customers. Absence of effective feedback mechanisms.
8. Inadequate use of empowerment and teamwork.
9. Lack of employee involvement.
10. Non-cooperation of first-line managers and middle management.
11. Lack of clarity in vision.
12. Emphasis on short-term results.
13. Setting of unmanageable, unrealistic goals.
14. Bureaucratic system.
15. TQM is considered as a quick-fix solution to current problems.
16. Treating suppliers as adversaries to be manipulated, taken advantage of.
17. Adversarial relationship between workers/unions and management.
18. Motivating employees through fear of punishment.
19. Failure to continually improve. Tendency to sit back and rest on one’s laurels. Rigidly
sticking to one ‘success formula’.
UNIT-II
21. Why should suppliers be treated as partners?
A. Costs due to inferior materials/components from suppliers increase costs in the later stages of
production. Suppliers themselves are part of the whole system and hence should be treated as
long-term partners.
22. What is the ‘Juran Trilogy’ (‘Quality Trilogy’)? (Dec 2011)
A The Juran Trilogy (Quality Trilogy) consists of three inter-related processes – quality
planning, quality control, and quality improvement – for managing quality.
23. What are Crosby’s Four Absolutes of Quality Management?
A. (1) Quality means conformance to requirements, not elegance. (2) Quality is achieved by
prevention, not appraisal. (3) The performance standard is zero defects, not acceptable quality
levels. Quality is free. (4) Quality is measured by the price of non-conformance, not indexes.
24. Mention the major contribution of Feigenbaum to quality.
A. He was the originator of the concept of Total Quality Control (TQC). His concept of Total
Quality Control was used as the foundation by the Japanese for their practice called ‘Company-
Wide Quality Control’ [CWQC] which began in the 1960s and later evolved into TQM.
25. What are Quality Circles (QC)?
A. QC is a small team of people (around 8 to 10) coming from the same work area/department
who voluntarily meet on a regular basis (about an hour every week) to identify, investigate,
analyze and solve work-related problems. QC can be viewed from three angles: (i) as a form of
participative management, (ii) as a HRD technique, and (iii) as a problem-solving technique.
9
26. What are the roles assigned to people in Quality Circles?
A. The QC organization has a four-tier structure consisting of Members, Leaders, Facilitators,
and Steering Committee.
27. What are the steps in implementing Quality Circle projects?
A. (1) Select the problem, (2) Study the problem, (3) Plan the improvement, (4) Carry out the
improvement, (5) Check the results, (6) Form conclusions, (7) Present to management, (8) Obtain
approval, and (9) Implement on regular basis.
28. Mention some tools used by Quality Circles for solving problems.
A. Data collection, Brainstorming, Check sheets, Pareto Analysis, Cause & Effect diagrams,
Control charts, Presentation techniques, etc. are used by quality circles in solving problems.
29. Mention some major objectives of Quality Circle projects.
A. 1. Improve quality and productivity. 2. Cost reduction. 3. Effective utilization of resources.
4. Avoid unnecessary errors, defects. 5. Solve work-related problems that interfere with
production, etc.
30. What are the Japanese 5S principles? (Dec 2011)
A. The 5S’s stand for five Japanese words: Seiri, Seiton, Seiso, Seiketsu, and Shitsuke. In
English, they mean Sort, Arrange, Clean up, Systematize, and Discipline respectively.
31. What does Seiri mean?
A. Separate out all unnecessary things and remove them, retaining only necessary things.
32. What does Seiton mean?
A. Put required things in proper order so that they can be easily accessed for use and quickly put
away in their proper locations after use.
33. What does Seiso mean?
A. Keep machinery and work environment clean.
34. What does Seiketsu mean?
A. Develop routine practices for orderly, systematic working.
35. What does Shitsuke mean?
A. Impart systematic training and coaching to ensure discipline in 5S implementation.
36. Mention some benefits of implementing 5S principles.
A. 5S increases productivity, eliminates waste, reduces inventory, creates a pleasant workplace,
improves safety, and increases the overall efficiency and effectiveness of people and machines.
37. Explain Kaizen (Dec 2011)
Kaizen, which is a Japanese word that means gradual and orderly continuous improvement, is a
philosophy that covers all business activities and everyone in an organization. In the kaizen
philosophy, improvement in all areas of business – cost, meeting delivery schedules, employee
safety and skill development, supplier relations, new product development, and productivity –
serve to improve the quality of the firm. Thus, any activity directed toward improvement falls
under the kaizen umbrella.
10
38. Explain Supplier Rating.
A supplier rating system (often called a scorecard system) is usually based on quality, delivery,
and service; however, some customers have added other categories, such as lead time, product
support, technology, etc.
39.Define Empowerment
. Empowerment requires a sincere belief and trust in people. It involves employees directly in
decision-making processes, giving them the security and confidence to make decisions, and
providing them with the necessary tools and training.
40. Distinguish between Reward and Recognition. (Dec 2010)
Recognition & reward: Creating incentives for suppliers is one way to ensure that they
remain committed to a quality improvement strategy. Incentives may be in the form of a preferred
supplier category with its rewards. Recognition may be in the form of publication of outstanding
contributions in the customer’s newsletter, a letter of commendation, or a plaque.
PART-B
1. Explain the different types of Teams. (Dec 2011)
A team is defined as a group of people working together to achieve common objectives or goals.
Teamwork is the cumulative actions of the team in which each member of the team subordinates
his individual interests to fulfill the objectives or goals of the group.
Process improvement teams: The members represent each operation of the process. When the
targeted process includes many work units or the entire organization, a cross-functional team may
be more appropriate with work unit teams operating as sub-teams. The life cycle of this type of
team is usually temporary – it is disbanded when the objective has been achieved.
Cross-functional teams: The members represent a number of different functional areas such as
engineering, marketing, accounting, production, quality, and human resources. It may also
include the customer and/or the supplier. A design review team is a good example of a cross-
functional team. This type of team breaks down functional area boundaries.
Problem-solving teams: Members gather to solve a specific problem and then disband.
Project teams: Teams with a specific mission to develop something new or to accomplish a
complex task.
Self-directed/self-managed work teams: They are the epitome of the empowered organization –
they not only do the work but also manage it. There is wide discretion to organize their work
subject to organizational work flow requirements.
2. What are the various steps involved in developing a team.
Effective teams are goal-oriented, independent, open, supportive and empowered. Problem
solving drives the team concept. The three basic functions of a team are to identify, analyze and
solve quality and productivity problems. These three basic functions can be expanded into the
following nine steps:
Identify: 1. Develop list of problems, 2. Select problem to tackle.
Analyze: 3. Collect data, 4. Focus attention, 5. Find causes.
Solve: 6. Develop solutions, 7. Pick best solution, 8. Develop follow-up plan, and 9. Implement.
3. Explain all the elements in 5’S principle and also the implentation procedure of 5’S in a
manufaturingcompany. (Dec 2011)
* The 5S’s stand for five Japanese words: Seiri, Seiton, Seiso, Seiketsu, and
Shitsuke. The 5S is not only useful to improve the physical environment, but also the thinking
processes.
11
1. Seiri (Sort): Separate out all unnecessary things and remove them, retaining only necessary
things. Accumulation, mixing of unnecessary things and wastes with needed items leads to
clutter, confusion and mess, thereby reducing the efficiency of working. Seiri also involves
keeping the number of things as low as possible and at a convenient location. If the workplace is
clean, there is greater motivation to carry out the job; but if the place is full of unwanted things, it
will be difficult to work effectively.
2. Seiton (Arrange): Put required things in proper order so that they can be easily accessed for
use and quickly put away in their proper locations after use. It prevents people from wasting their
time searching for things. “A place for everything and everything in its place”.
3. Seiso (Clean up): Keep machinery and work environment clean. Employees should be
responsible for cleaning their own workplaces. Workers should clean up the workplace first thing
before they commence work and at the end of the day before they leave. They should also see that
their workplace remains clean and tidy throughout the day. Any dirt, spillage, etc. should be
attended to immediately.
If cleanliness is not maintained, it can be harmful to the personnel [health hazards], machinery
[can fail due to dust, dirt, etc.], and materials [due to contamination], thereby causing quality and
productivity problems.
4. Seiketsu (Systematize, Standardize): Develop routine practices for orderly, systematic
working. If the 5S processes are standardized, it becomes easier to continuously maintain the
organization’s neatness and cleanliness. An effective means of achieving Seiketsu is Visual
management – like signboards, marked parking lots, marking of aisles, identification labels, etc.
Another important consideration is transparency – tools, files, etc. should be visible so that it is
easy to locate them. This will reduce the time for searching.
5. Shitsuke (Discipline): Impart systematic training and coaching to ensure discipline in 5S
implementation. Discipline comes through repetition and practice. Self-discipline goes beyond
discipline. It is essential for the successful implementation of the 5S principles.
* In a factory, 5S increases productivity, eliminates waste, reduces inventory, creates a pleasant
workplace, improves safety, and increases the overall efficiency and effectiveness of people and
machines.
* The logic behind the 5S principles is that organization, neatness, cleanliness, standardization,
and discipline at the workplace are basic requirements for producing high quality products and
services, with high productivity and little or no wastage; hence the importance of combining the
5S principles in TQM.
4. Write about the system of recognition an reward followed in an organisation. (Dec 2011)
Recognition is a form of employee motivation in which the organization publicly
acknowledges the positive contributions an individual or team has made to the success of the
organization. Reward is something tangible such as a cash award, plaque, certificate, special
dinner, theatre tickets, etc. to promote desirable behavior. Recognition and reward go together to
form a system for letting people know they are valuable members of the organization. They can
be monetary or non-monetary, formal or informal, individual or group.
+ The recognition and reward system must have clear recognition criteria. Policies and
procedures must be consistently and fairly applied throughout the organization. Recognition
should be valid, genuine, and meaningful for the giver and the recipient; it should not be used to
manipulate people.
+ In the selection of individuals/teams to be recognized or rewarded, employees should be
involved along with the manager(s), and sometimes the customer and supplier too.
12
+ While the reward may be delayed until an appropriate time, the recognition should be on a
timely basis. Rewards should be appropriate to the improvement level – the greater the
improvement, the greater the reward. They should also be perceived to be of value.
+ Individual rewards include cash awards, gift certificates, dinner out, event tickets, trips, etc.
Group rewards are similar and can also include an outing, group lunch or dinner, allowing the
team to make some decisions affecting their work, etc.
+ People like to be recognized, either as a team or individually. A person’s feeling of
achievement, value to the organization, knowing the organization cares, and having peer
recognition may be more important than any reward. In addition to the plaque or certificate given
at a formal function, other forms of recognition include name/picture on the bulletin board,
articles in newsletters,/journals, letters to families, personal phone calls or notes, increased
responsibility, and on-the-spot praise.
5. What are the steps involved in continuous improvement process . (Dec 2011)
Continuous improvement is an inherent part of the TQM process. It transforms the drive towards
quality into a never-ending journey. This concept allows companies to start with modest
beginnings and make small incremental improvements towards excellence.
+ Effective continuous improvement needs the support of performance measurement methods.
Performance measurement systems help people to identify and measure, in quantitative terms, the
sizes of improvements.
* Steps in Continuous Improvement Strategy:
1. Define the current status: This can be addressed from any of several perspectives viz. number
of defects, cost of defects, customer satisfaction indices, and the like.
2. Define continuous improvement objectives: While the first step asks the question “where are
we?” the second step asks the question “where should we be going?”. The objectives should be
based on a realistic appraisal of what the organization, with its available resources, is capable of
achieving. It is better to set modest improvement goals at first to realize a few initial successes,
which will help to motivate employees to accept the continuous improvement philosophy.
3. Select continuous improvement projects: These are the specific areas in which the
organization desires to seek improvement. Some examples of improvement projects are: [i]
frequent product failures during final testing, [ii] delayed payments to suppliers, [iii] delays in
attending to machine breakdowns. Each of these projects provide the framework of an action plan
for the organization to realize continuous improvement.
4. Assign teams: After selecting the projects, the organization has to assign people to work on
these projects and empower them to attain the continuous improvement objectives set. The
concepts of employee involvement, empowerment and teamwork are extremely important to
achieve continuous improvement as they allow an organization to achieve significant synergies
and fully utilize its human resources.
5. Define the process: Once a team has been assigned a project, the first task of the team is to
define the process it is assigned. This is done by preparing a flow chart for the process. Flow
charts provide the visibility of the entire process to all those who work on the process. It also
reveals various problem areas and inefficiencies. Each step in the process should be critically
examined by asking the question: What happens if this step is eliminated? If nothing happens,
then that particular step should be removed from the process.
6. Define sources of variability: The next step is to identify areas in which variability can creep
into the process. Reducing variability is another key concept of TQM, because anything done to
reduce variability will result in improved quality. Two sources of variability are chance causes
and assignable causes. Variability reduction focuses on ensuring that the assignable causes (due
to human factors) are eliminated from the process. According to Deming, 85% of a company’s
13
quality problems are due to variability induced by problems in the process and not workmanship.
Eliminating process deficiencies and minimizing process variability will prevent future defects.
7. Implement change: Formulate a pilot program in a small area to test the effectiveness of the
suggested improvement project. Based on feedback indicating any glitches and problem areas,
make suitable modifications and go in for full-scale implementation. Continue to monitor the
process using the same measurement criteria once the upgrade has been fully implemented.
6. Write short notes on :i) customer perception of quality and ii) Customer complaints (Dec
2010)
CUSTOMER PERCEPTION OF QUALITY # One of the basic concepts of TQM – continuous improvement – implies that there is no
acceptable quality level because customers’ needs, values, expectations are constantly changing
and becoming more demanding. [Refer Kano model].
# An American Society for Quality (ASQ) survey on end user perceptions of important factors
that influenced purchases showed the following ranking: 1. Performance, 2. Features, 3. Service,
4. Warranty, 5. Price, and 6. Reputation. The first four factors are part of product/service quality.
Hence it is evident that product/service quality is considered more important than price.
# Other factors felt important by customers are: Availability, Reliability, Maintainability, Care in
handling (of products as well as customers), Response time.
# The way to assess customers’ perception of quality is by measuring customer satisfaction (by
carrying out customer satisfaction surveys).
CUSTOMER COMPLAINTS
+ Although complaints are reactive in nature, they are vital in gearing data on customer
perceptions. A dissatisfied customer can easily become a lost customer. Many organizations use
customer dissatisfaction as the primary measure to assess their process improvement efforts.
+ A survey by American Society for Quality (ASQ) showed that only about 1% of customers
bothered to complain to management, around 20% took the trouble to complain to front-line
personnel, and almost 80% did nothing.
+ Frequently, dissatisfied customers switch to a competitor and don’t say anything. The average
organization takes its customer base for granted, assuming that no complaints is good news.
Every single complaint should be accepted, analyzed, and acted upon, for it represents the tip of
the iceberg.
+ Another study indicated more than 50% of dissatisfied customers will buy again if their
complaint is heard and resolved. Only 20% will buy again if their complaint is heard but not
resolved. Less than 10% will be repeat buyers when a complaint is not heard. Such complaints do
reach other potential customers, thereby damaging the company’s reputation and business
prospects.
+ An organization can save both money and customers by training and empowering front-line
employees (those who directly deal with customers) to solve problems directly with customers.
Customers want problems solved quickly and efficiently. Management should encourage
employees to take risks, make decisions, and not be afraid of making a mistake.
+ Studies have shown that the better the service at the point of sale, the fewer the complaints and
the greater the sales volume. Unmotivated, dissatisfied employees are as noticeable as dissatisfied
customers. It’s just as important to focus on employee satisfaction as customer satisfaction.
* Some actions organizations can take to handle customer complaints:
1. Investigate customers’ experiences by actively seeking feedback, both positive and negative,
and act on it promptly.
2. Develop procedures for resolving complaints that include empowering front-line personnel.
3. Analyze complaints to go into their root cause.
4. Identify process and material variations and then eliminate the root cause. “More inspection” is
not corrective action.
14
5. Establish customer measures and constantly monitor them.
6. Communicate complaint information, as well as the results of all investigations and solutions,
to all people in the organization.
7. Provide a monthly complaint report to the Quality Council for their evaluation and, if needed,
the setting up of process improvement teams.
8. Identify customers’ expectations beforehand rather than afterward through complaint analysis.
7. List the five levels in Maslow’s Hierarchy of needs and describe in detail each leve l.
* Maslow’s Hierarchy of Needs:
+ Maslow’s hierarchy consists of physical (survival), security, social, esteem, and self-
actualization needs. Once a given level is satisfied, it ceases to be a motivator, and the next higher
level need becomes the motivator.
+ Level 1 needs of food, clothing, and shelter are usually provided by a job. Level 1 needs also
include a conducive working environment such as proper lighting, ventilation, fan, A/C, etc.
+ Level 2 (security) can mean a safe place to work and job security. It also includes having
privacy on the job such as separate cabin, lockable storage for personal items, etc.
+ Level 3 (social) needs involve giving a person the opportunity to be part of a group. Employees
should also be provided with both formal social areas such as conference rooms and cafeterias,
and informal areas such as water coolers and bulletin boards. Being a member of a team is a good
way to meet the social needs of an individual.
+ Level 4 (esteem) needs: Everyone, regardless of position or nature of job, wants to be
recognized as a person of value to the organization. Provision of business cards, separate work
space, office protocols, etc. provides employees with a certain level of self-esteem.
+ Level 5 (self-actualization) says that individuals must be given the opportunity to go as far as
their abilities will take them. In this regard, many organizations have a policy of promoting from
within.
8. What are the characteristics of empowered employee? And also discuss the benefits of
empowered environment.
Characteristics of empowered employees: [1] They feel responsible for their own task. [2]
They are given a free hand in their work. [3] They balance their own goals with those of their
organization. [4] They are well trained, equipped, creative, and customer oriented. [5] They are
critical, have self-esteem, and are motivated. [6] They monitor and improve their work
continuously. [7] They constantly seek new goals and challenges.
+ Benefits of empowerment: [1] It builds confidence in workers by showing them that the
company has confidence in their ability to make decisions on their own. [2] It generates
commitment and pride in employees. [3]It gives employees better experience and an opportunity
to advance their careers. [4] It benefits customers by reducing bureaucratic red tape that
customers encounter – such as seeking a superior’s approval/signature – which makes customer
transactions speedier and more pleasant.
9. Explain in detail the concept of Employee involvement.
Employee involvement (EI) refers to any activity by which employees participate in
work-related decisions with the aim of tapping the creative energies of all employees and
improving their motivation.
+ The various levels of employee involvement is summarized in the following table. As total
quality matures in an organization, higher levels of employee involvement become evident.
Level
Action
Primary
outcome

15
1. Information sharing Managers decide, then inform employees Conformance
2. Dialogue Managers get employee input, then decide Acceptance
3. Special problem
solving
Managers assign a one-time problem to selected
employees
Contribution
4. Intra-group problem
solving
Intact groups meet weekly to solve local
problems
Commitment
5. Inter-group problem
solving
Cross-functional groups meet to solve mutual
problems
Cooperation
6. Focused problem
solving
Intact groups extend daily involvement in a
specific issue
Concentration
7. Limited self-direction Team functions with minimum supervision Accountability
8. Total self-direction Executives facilitate self-management Ownership
+ EI is rooted in the psychology of human needs and supported by the motivation models of
Maslow, Herzberg, and McGregor. Employees are motivated through exciting work,
responsibility, and recognition. EI provides a powerful means of achieving the highest order
individual needs of self-realization and fulfillment, thereby improving employee morale and
commitment, with resultant improvements in quality and productivity.
+ One of the easiest ways to promote employee involvement is the suggestion system. It is a
management tool for the submission, evaluation, and implementation of an employee’s idea to
save cost, increase quality, or improve other elements of work such as safety.
+ Major factors contributing to employee involvement are: motivation, compensation, recognition
& reward system, working environment, organization culture and climate, leadership, and
empowerment.
10. Write short note on: Supplier partnership, Partnerning, supplier selection, supplier rating.
Supplier Partnership.
+ An organization spends a substantial portion of its resources on the purchase of raw materials,
components, and services. Therefore, supplier quality can greatly affect the overall cost and
quality of a product or service. It is important for the customer to work with suppliers in a
partnering atmosphere to achieve high quality levels in its end products and services.
+ Organizations (customers) and their suppliers have the same goal – to satisfy the end user.
Since both the customer and the supplier have limited resources, they must work together as
partners for their mutual benefit.
+ There have been a number of forces that have changed supplier relations. Prior to the 1980s,
purchase decisions were typically based on price, thereby awarding contracts to the lowest bidder.
As a result, quality and timely delivery were sacrificed. The advent of the TQM philosophy
exemplified by Deming’s fourth point (Stop awarding business based on price alone) addressed
this problem.
Another force changing supplier relations was the introduction of the just-in-time (JIT) concept.
It calls for raw materials and components to reach the shop-floor in small quantities when they
are needed and not before. As a result, the supplier will have many more process setups, thus
becoming a JIT organization itself.
The practice of continuous process improvement has also caused many suppliers to develop
partnership with their customers. Suppliers are now taking increased product-development
responsibilities. They are becoming involved in product design, formation of specifications, and
component testing.
A final force is ISO 9000 which requires suppliers to work towards zero defects, 100% on-time
delivery, and a process for continuous improvement.
16
All these forces have changed adversarial customer-supplier relationships into mutually beneficial
partnerships. Joint efforts improve quality, reduce costs, and increase market share for both
parties.
PARTNERING
+ Partnering is a long-term commitment between two or more organizations for the purpose of
achieving specific business goals. The relationship is based upon trust, dedication to common
goals, and an understanding of each participant’s expectations and values. Benefits include
improved quality, increased efficiency, and lower cost.
+ There are three key elements to a partnering relationship: long-term commitment, trust, and
shared vision.
1. Long-term commitment: Long-term commitment provides the needed environment for both
parties to work toward continuous improvement. Each party contributes its unique strengths to the
processes. A supplier might not take risks, such as acquiring new equipment or systems, without a
long-term commitment.
2. Trust: Mutual trust forms the basis for a strong working relationship that is non-adversarial.
The purchasing function must be subordinate to the overall relationship goals and objectives.
Open and frequent communication avoids disputes while strengthening the relationship. The
parties should have access to each other’s business plans and technical information, such as
product and process parameters. In addition, they may share or integrate resources such as
training activities, administrative systems, and equipment. Both parties become motivated when
“win-win” solutions are sought rather than “win-lose” solutions.
3. Shared vision: Each of the partnering organizations must understand the need to satisfy the
final customer. Shared goals ensure a common direction and must be aligned with each party’s
mission. Employees of both parties should think and act for their common good. Decisions must
be formulated and implemented as a team.
SUPPLIER SELECTION
+ Before deciding on suppliers, the organization has to decide whether to produce or outsource a
particular item. This decision is a strategic one and must be made after answering the following
questions: How critical is the item to the design of the product or service? Does the organization
have the technical knowledge to produce the items internally? Are there suppliers who specialize
in producing the item? These questions must be answered in terms of cost, delivery, quality,
safety, and the acquisition of technical knowledge.
+ Once the decision has been made to outsource, then the supplier must be selected. The
following are some important criteria for evaluation and selection of suppliers:
- The supplier has the capability to produce the item in quantities needed by the organization.
- The supplier has excellent quality practices and a commitment to quality.
- The supplier maintains high technical standards and has the capability of dealing with future
technological innovations.
- The price is right and the delivery dates can be met.
- The supplier is easily accessible in terms of transportation and communication.
- The supplier has a track record of customer satisfaction and organization credibility.
- The supplier has an effective quality system and improvement program such as ISO 9000.
- The supplier understands and appreciates the management philosophy of the organization.
SUPPLIER RATING
* The customer rates suppliers to: [i] obtain an overall rating of supplier performance, [ii] ensure
complete communication with suppliers regarding their performance in the areas of quality,
service, delivery, and other measures the customer desires, and [iii] provide each supplier a
detailed, factual record of problems for corrective action.
17
* A supplier rating system (often called a scorecard system) is usually based on quality, delivery,
and service; however, some customers have added other categories, such as lead time, product
support, technology, etc. These categories may also have subcategories.
* These basic categories are weighted, with quality usually given the greatest weight. A score is
given to each category by means of a numerical value or a letter grade, which can then be
converted to a numerical value.
* Reports are prepared and issued quarterly, and overall grades are provided to each supplier. The
basic objective of such supplier rating systems is to have high quality, dependable suppliers in the
long run.
UNIT – III
TQM TOOLS & TECHNIQUES I
PART - A
1. List the seven tools of quality.
1. Check sheets.
2. Histograms.
3. Cause and effect diagrams.
4. Pareto diagrams.
5. Stratification analysis.
6. Scatter diagrams, and
7. Control charts.
2. What is check sheet?
A check sheet or tally sheet is a form for systematic data gathering and registering to get
a clear view of the facts.
3. When do you use the check sheet?
A check sheet is used to indicate the frequency of a certain occurrence.
4. What are the types of check sheets commonly used?
1. Process distribution check sheet.
2. Defective item check sheet.
3. Defect location check sheet, and
4. Defect factor check sheet.
5. What is histogram?
A histogram is a bar chart / diagram showing a distribution of variable quantities or
characteristics. It is graphical display of the frequency distribution of numerical data.
6. When do you use histogram?
A histogram is used to show clearly where the most frequently occurring values are located and
the data is distributed.
It enables the analyst to quickly visualize the features of a complete set of data.
7. What are the various types of histogram?
1. Bell-shaped.
2. Double-peaked.
3. Plateau.
18
4. Comb.
5. Skewed.
6. Truncated.
7. Isolated peak and
8. Edged peak.
8. What is cause and effect diagram?
The cause and effect diagram or Fishbone diagram is a graphical-tabular chart to list and analyze
the potential causes of a given problem.
9. Under what situations, one can use cause and effect diagram?
The cause and effect diagram has unlimited application in research manufacturing, marketing,
office operations, services, etc.
10. What are the uses of CE diagram?
The cause and effect diagrams are used:
To analyse cause and effect relationships
To facilitate the search for solutions of related problems.
To standardize existing and proposed operations and
To educate and train personnel in decision-making and corrective action activities.
11. What is Pareto diagram?
A pareto diagram is a diagnostic tool commonly used for separating the vital few causes that
account for a dominant share of quality loss.
12. State the Pareto principle.
Pareto principle states that a few of the defects accounts for most of the effects.
13. What are the purposes of pareto principle.
Pareto analysis can be used in a wide range of situations, where one need to priorities problems
based on its relative importance.
14. What is stratification?
Stratification is a method of analysis of data by grouping it in different ways.
15. What is scatter diagram?
The scatter diagram is a simple graphical device to depict the relationship between two variables.
16. When do you use the scatter diagram?
The purpose of the scatter diagram is to display what happens to one variable when another
variable is changed.
17. What is control chart?
A control chart is a graph that displays data taken over time and the variation of this data.
18. What are the types of control charts?
Control charts for variables – for measurable data such as time, length, temperature, weight,
pressure, etc.
Control charts for characteristics- for quantifiable data such as number of defects, typing errors in
a report, etc.

19
19. When do you use control chart?
The purpose of control chart is to identify when the process has gone out of statistical control,
thus signaling the need for some corrective action to be taken.
20. Define statistics applications of statistical techniques?
Statistics is defined as the science that deals with the collection, tabulation, analysis,
interpretation and presentation of quantitative data.
21. What are major functions of statistical analysis? Write down the applications of
statistical techniques?
The major functions of statistical analysis are:
Reducing the complexity of the situation,
Making comparisons and drawing conclusions,
Estimating and predicating, and
Decision-making.
Statistical techniques are applicable in all situations where quantification is possible. The
statistical analysis has become indispensable to practically every field that exists.
22. What are the types of graphs used in representing frequency distribution?
Histogram,
Frequency polygon and frequency curve, and
Cumulative frequency or the ‘Ogive’
23. How do obtain frequency curve?
A frequency curve is obtained by drawing a smooth freehand curve through the points of the
frequency polygon. The cumulative frequency curve (also called an Ogive) obtained by plotting
upper class limits (or lower class limits) against the ‘less than’ (or ‘more than’) cumulative
frequencies is known as ‘less than’ Ogive (or ‘more than’ Ogive).
24. What do you mean by measure of central tendency? What are the three measures of
central tendency?
A measure of central tendency of a distribution is a numerical value that describes the central
position of the data.
1. Mean, 2, Median, and 3. Mode.
25. What are the three measures of dispersion?
Measures of dispersion tell us how the individual observations are spread on either side of the
centre.
1. Range, 2.Mean deviation, and 3. Standard deviation
26. What is meant by attribute? What is the use of control charts for attributes?
An attribute refers to those quality characteristics that confirm to specifications or do not conform
to specifications.
Control charts for attributes monitor the number of defects or fraction defects or fraction defect
rate present in the sample.
p chart: The chart for fraction rejected as non-conforming to specification
np chart: The control chart for number of non-conforming items.
c chart: The control chart for number of defects.
u chart: The control chart for number of defects per unit.
20
27. Define fraction defective (p).
It is defined as the ratio of the number of defective articles found in any inspection to the total
number of articles actually inspected.
Mathematically, p = np/n
Where P= Fraction defective,
np = Number of defectives, and
n = Number of items inspected in the sub-group
28. When up chart is preferred over p chart? Why a np chart is preferred over p chart?
When subgroup size is constant, the np chart is preferred over p chart.
In np chart, when the subgroup size is variable, the expected number of rejectable items per
subgroup will also change. This means that a different central line as well as different control
limits for every subgroup on the chart. This makes the chart very confusing and almost not
understandable by shop personnel. Therefore when the subgroup size is variable, np chart is not
recommended.
29. Write down the difference between a defect and defective.
An item is said to be defective if it fails to conform to the specifications in any of the
characteristics. Each characteristics that does not meet the specifications is called defect. For
example, if a casting contains undesirable hard sports, below holes, etc., the casting is defective
and the hard spots, below holes, etc., are the defects.
30. Differentiate between producer’s risk and consumer’s risk.
Producer’s risk: It is the probability of rejecting a good lot which otherwise would have been
accepted.
Consumer’s risk: It is the probability of accepting a defective lot which otherwise would have
been rejected.
31. What is six sigma?
Six sigma is similar to Zero Defects (ZD), is a philosophical benchmark or standard of excellence
proposed by Philip Crosby. Six sigma strives for perfection. It allows for only 3.4 defects per
million opportunities (or 99.99966 percent accuracy).
32. What are the five phases in six sigma process?
The five phases in six sigma process are:
1. Define, 2. Measure, 3. Analyse, 4. Improve, and 5. Control
33. Brief the scope of six sigma principle.
The six sigma concept is originated from manufacturing field. Now it is applied to non-
manufacturing processes also. Today one can apply six sigma to many fields such as services,
medical and insurance procedures, call centres, etc.
PART – B
1. Explain briefly about check sheet (or) data collection sheet with an example.
Check sheet (data collection sheet)
i. What is it?
A check sheet*, also known as tally sheet, is a form for systematic data gathering and
registering to get a clear view of the facts.
It is used to keep track of how often something occurs.
21
The form of the check sheet is tailored for each situation / application.
ii. When do we use it?
A check list is used to indicate the frequency of a certain occurrence.
iii. How do we construct it?
A checklist may be constructed using the following steps:
Formulate the objective for collecting data
Decide which data is necessary.
Determine who and how data will be analyzed.
Draw a format to record data.
Collect and record data problem-wise by putting tally lines.
Start counting by tallying on the list; |, ||, |||, |||| and |||| represent the numbers 1,2,3,4 and 5
respectively.
Mark on the list the total number of facts, which were noticed.
iv. Types of check sheets
The widely used different types of check sheets are:
Process distribution check sheet:
This check sheet is used to collect on process variability.
Defective item check sheet:
This check sheet is intended to specify the variety of defects occurring, together with their
frequency of occurrence.
Defect location check sheet:
This check sheet is intended to identify where defects occur on the product.
Defect factor check sheet:
This check sheet is used to monitor the input parameters in a process that might affect the
incidence of defects.
Illustration
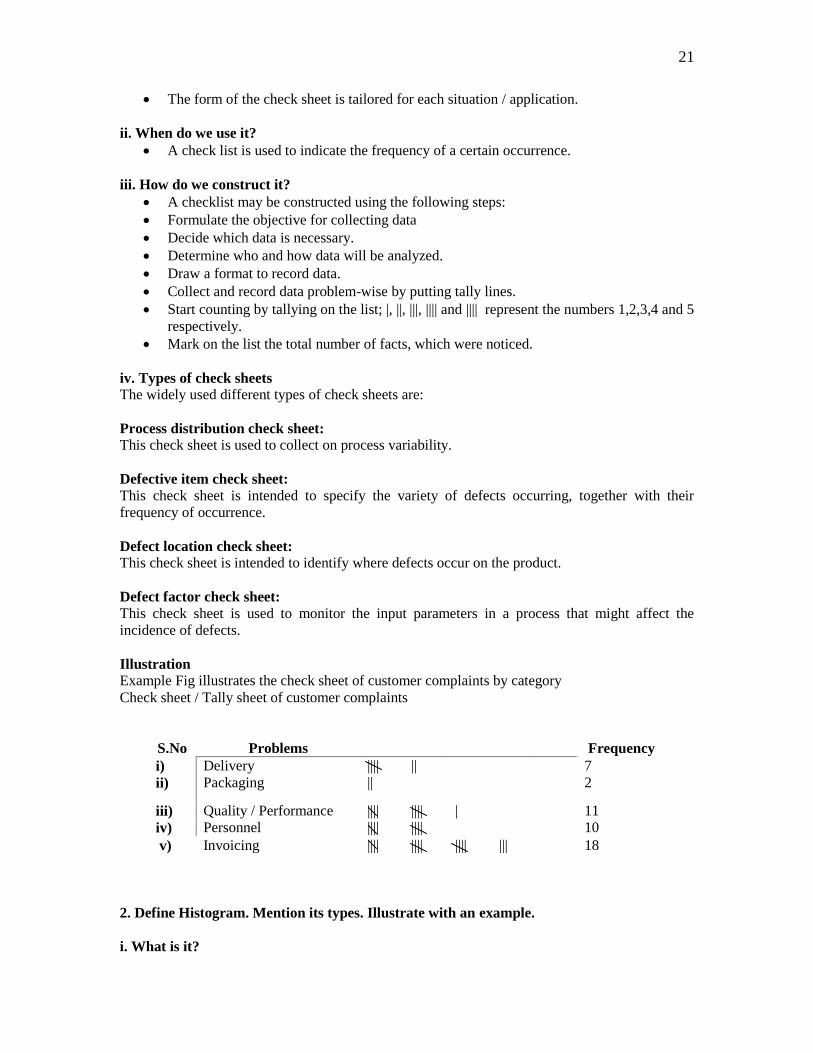
Example Fig illustrates the check sheet of customer complaints by category
Check sheet / Tally sheet of customer complaints
S.No Problems Frequency
i) Delivery |||| || 7
ii) Packaging || 2
iii) Quality / Performance |||| |||| | 11
iv) Personnel |||| |||| 10
v) Invoicing |||| |||| |||| ||| 18
2. Define Histogram. Mention its types. Illustrate with an example.
i. What is it?
22
A histogram is a bar chart / diagram showing a distribution of variable quantities or
characteristics.
It is a graphical display of the frequency distribution of the numerical data.
The data are displayed as a series of rectangles of equal width and varying heights.
ii. When do we use it?
A histogram is used to show clearly where the most frequently occurring values are located and
the data is distributed.
It is also a tool for determining the maximum process results.
It enables the analyst to quickly visualize the features of a complete set of data.
iii. How do we construct it?
A histogram may be constructed using the following steps:
1. After the data collection, count the number of data values collected.
2. Determine the range of the data.
Range = Highest value – Lowest value
3. Discuss about Types of histograms and their interpretations.
23
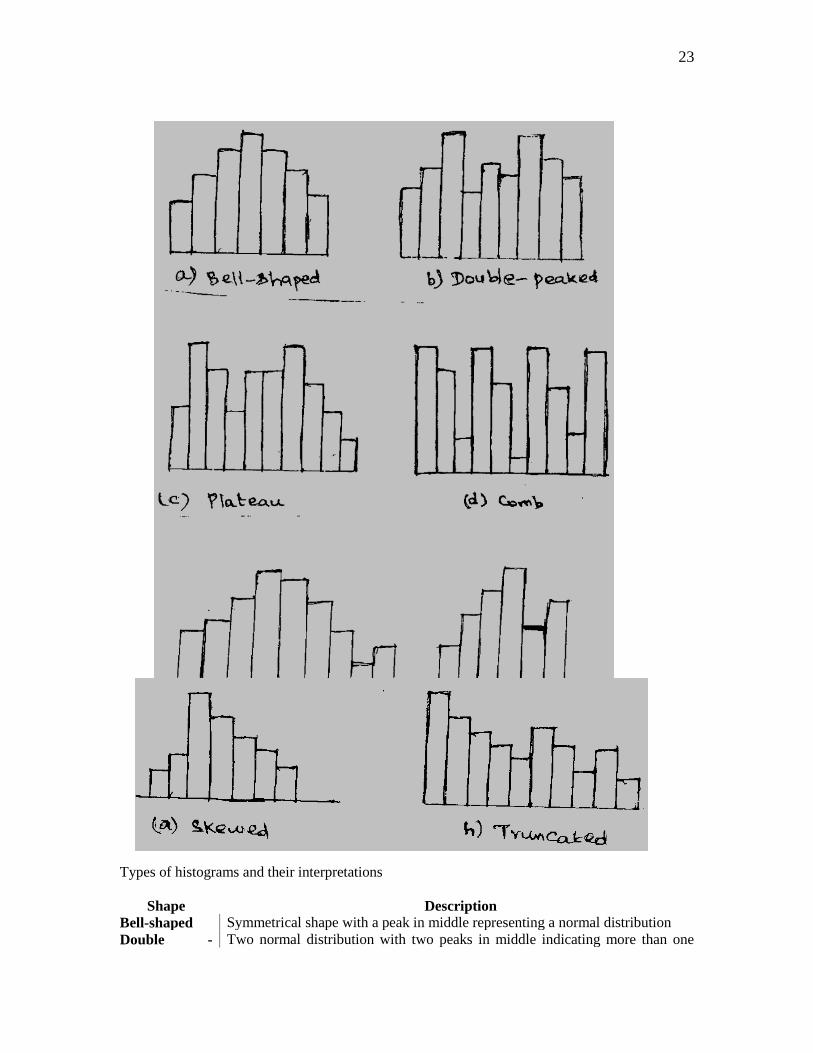
Types of histograms and their interpretations
Shape Description
Bell-shaped Symmetrical shape with a peak in middle representing a normal distribution
Double - Two normal distribution with two peaks in middle indicating more than one
24
Peaked distribution at work
Plateau Flat top, no distinct peak and tails indicating more than one distribution at
work.
Comb Alternative peaks showing possible errors in data collection and analysis.
Skewed An asymmetrical shape positively or negatively skewed – usually reflecting
limits in the specification on one side.
Truncated An asymmetrical shape with a peak at the end. Usually being a part of a normal
distribution with part of it having been removed.
Isolated peak Two normal distributions suggesting two processes taking place at the same
time.
Edged Peak A normal distribution curve with a large peak at one end indicating errors in
data recoding.
4. Explain the cause and effect diagram (or) fishbone diagram.
What is it?
The cause and effect (CE) diagram is a graphical-tabular chart to list and analysis the potential
causes of a given problem.
The cause and effect diagram is also called the fishbone diagram because of its appearance and
the Ishikawa diagram after the man who developed it in 1943.
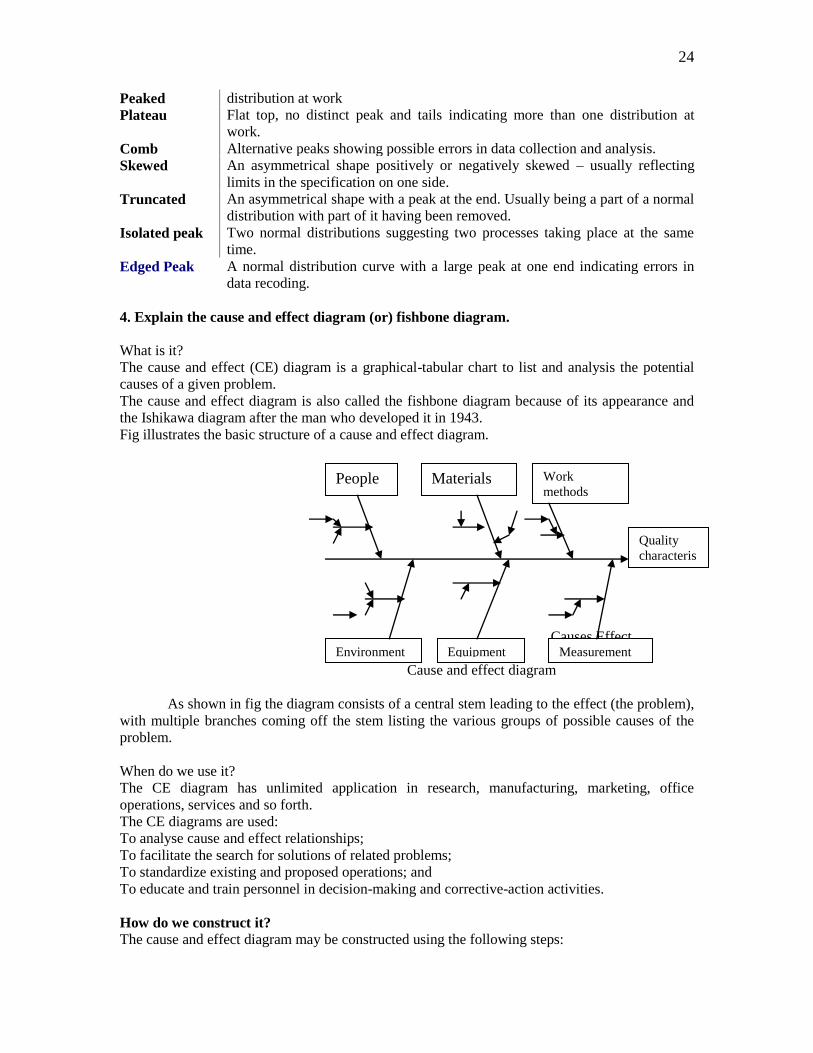
Fig illustrates the basic structure of a cause and effect diagram.
Causes Effect
Cause and effect diagram
As shown in fig the diagram consists of a central stem leading to the effect (the problem),
with multiple branches coming off the stem listing the various groups of possible causes of the
problem.
When do we use it?
The CE diagram has unlimited application in research, manufacturing, marketing, office
operations, services and so forth.
The CE diagrams are used:
To analyse cause and effect relationships;
To facilitate the search for solutions of related problems;
To standardize existing and proposed operations; and
To educate and train personnel in decision-making and corrective-action activities.
How do we construct it?
The cause and effect diagram may be constructed using the following steps:
People Materials Work
methods
Quality
characteris
tics
Environment
Equipment Measurement
25
Define the effect (the problem) clearly and concisely.
Mark the short description of the effect in a box. Then draw a line from this box towards
left.
List down all the possible minor and major causes through a brainstorming* session.
Mark the major causes on the branches and minor causes in the sub-branches of the CE
diagrams.
Look for possible solutions for these causes.
Introduce the changes.
5. Define pareto diagram. Explain how to construct it? Also explain the stratification
Analysis.
PARETO DIAGRAM
What is it?
A Pareto diagram is a diagnostic tool commonly used for separating the vital few causes
that account for a dominant share of quality loss.
This tool is named after Wilfred Pareto, the Italian economist, who devised this tool first.
The Pareto diagram is based on the Pareto Principle, which states that few of the defects
account for most of the effects.
Pareto analysis is also called as 80/20 rule and as ABC analysis. It means only 20% of
problems (defects) account for 80% of the effects.
This analysis is a method of classifying items, events or activities according to their
relative importance.
When do we use it?
Pareto analysis can be used in a wide range of situations where one need to priorities problems
based on its relative importance.
It can be used as a risk assessment technique from activity level to system level.
How can we construct it?
A Pareto diagram can be constructed using the following steps:
Obtain data, using a check sheet or brainstorm.
Arrange the data in descending order starting from the largest category to smallest.
Calculate the total and percentage of the total that each category represents.
Compute the cumulative percentages.
Draw a bar chart with two vertical axis, mark the measured values for each cause, starting
from zero till the total number of causes. The right vertical axis should have the same
height and should go from 0 to 100%. This axis displays the cumulative percentages. List
the different kinds of causes along the horizontal axis, from left to right in descending
order of frequency or costs.
Draw a bar above each item whose height represents the number for that cause.
Plot a cumulative percentage line.
Now draw a horizontal line from 80% (on the right vertical axis) to the left till the point
of intersection with the cumulative line, and then draw a vertical line from this
intersection down wards till the horizontal axis. Left from this intersection point are the
20% of causes (the most essential bottlenecks) which causes 30% of the damages.
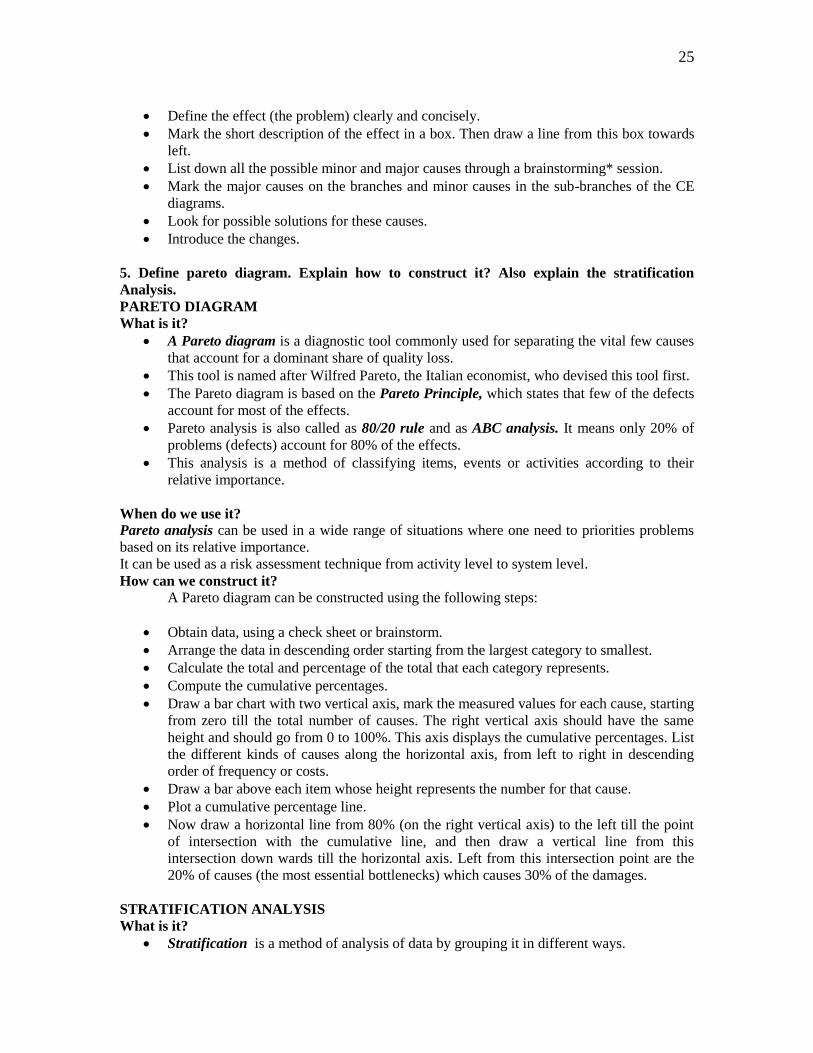
STRATIFICATION ANALYSIS
What is it?
Stratification is a method of analysis of data by grouping it in different ways.
26
Literally, stratification means segregating a group of measurements, observations or any
other data into several sub-groups on the basis of certain characteristics. These stratified
data are used for identifying the influencing factors.
Machines, suppliers, operators, tools gauges or time-dependent sources like shifts,
prepost lunch, start or end of shifts, etc., are strata with respect to which the study of
various is conducted for diagnosis and possible control/prevention of variations.
Thus stratification is a simple, very effective QC tool for improving the quality.
Stratification Analysis procedure
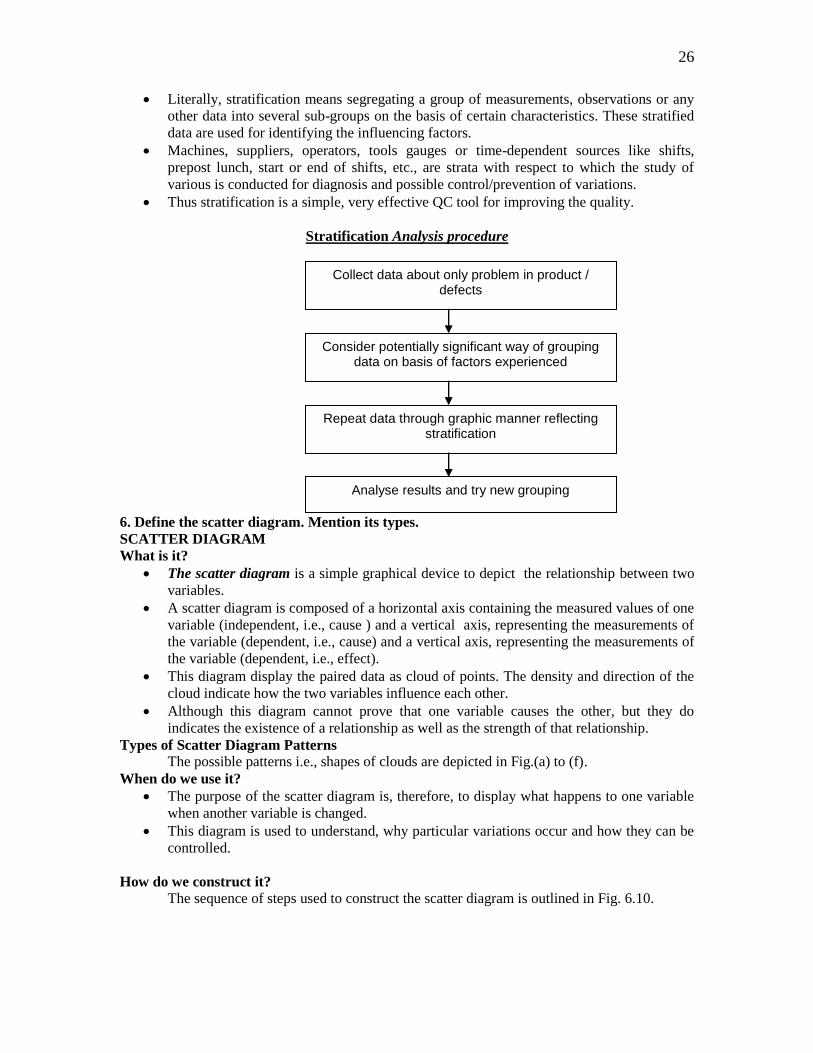
6. Define the scatter diagram. Mention its types.
SCATTER DIAGRAM
What is it?
The scatter diagram is a simple graphical device to depict the relationship between two
variables.
A scatter diagram is composed of a horizontal axis containing the measured values of one
variable (independent, i.e., cause ) and a vertical axis, representing the measurements of
the variable (dependent, i.e., cause) and a vertical axis, representing the measurements of
the variable (dependent, i.e., effect).
This diagram display the paired data as cloud of points. The density and direction of the
cloud indicate how the two variables influence each other.
Although this diagram cannot prove that one variable causes the other, but they do
indicates the existence of a relationship as well as the strength of that relationship.
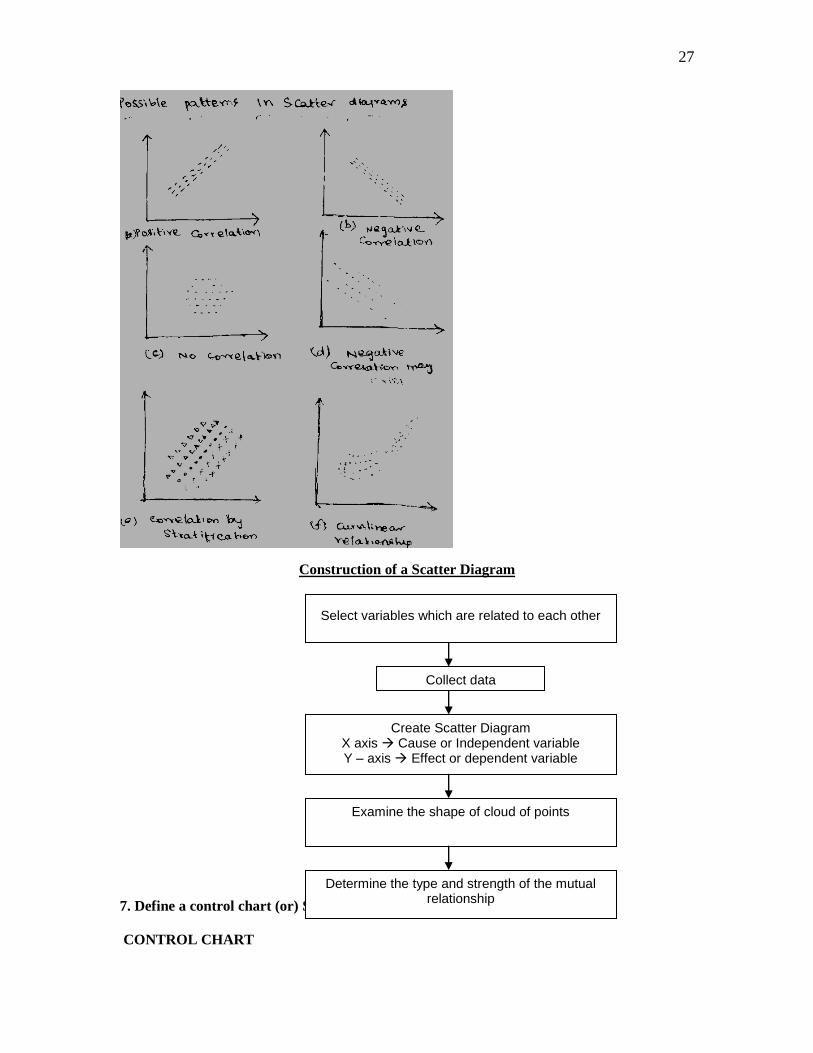
Types of Scatter Diagram Patterns
The possible patterns i.e., shapes of clouds are depicted in Fig.(a) to (f).
When do we use it?
The purpose of the scatter diagram is, therefore, to display what happens to one variable
when another variable is changed.
This diagram is used to understand, why particular variations occur and how they can be
controlled.
How do we construct it?
The sequence of steps used to construct the scatter diagram is outlined in Fig. 6.10.
Collect data about only problem in product / defects
Consider potentially significant way of grouping data on basis of factors experienced
Repeat data through graphic manner reflecting stratification
Analyse results and try new grouping
27
Construction of a Scatter Diagram
7. Define a control chart (or) Shewhart chart.
CONTROL CHART
Select variables which are related to each other
Create Scatter Diagram X axis Cause or Independent variable Y – axis Effect or dependent variable
Examine the shape of cloud of points
Determine the type and strength of the mutual relationship
Collect data
28
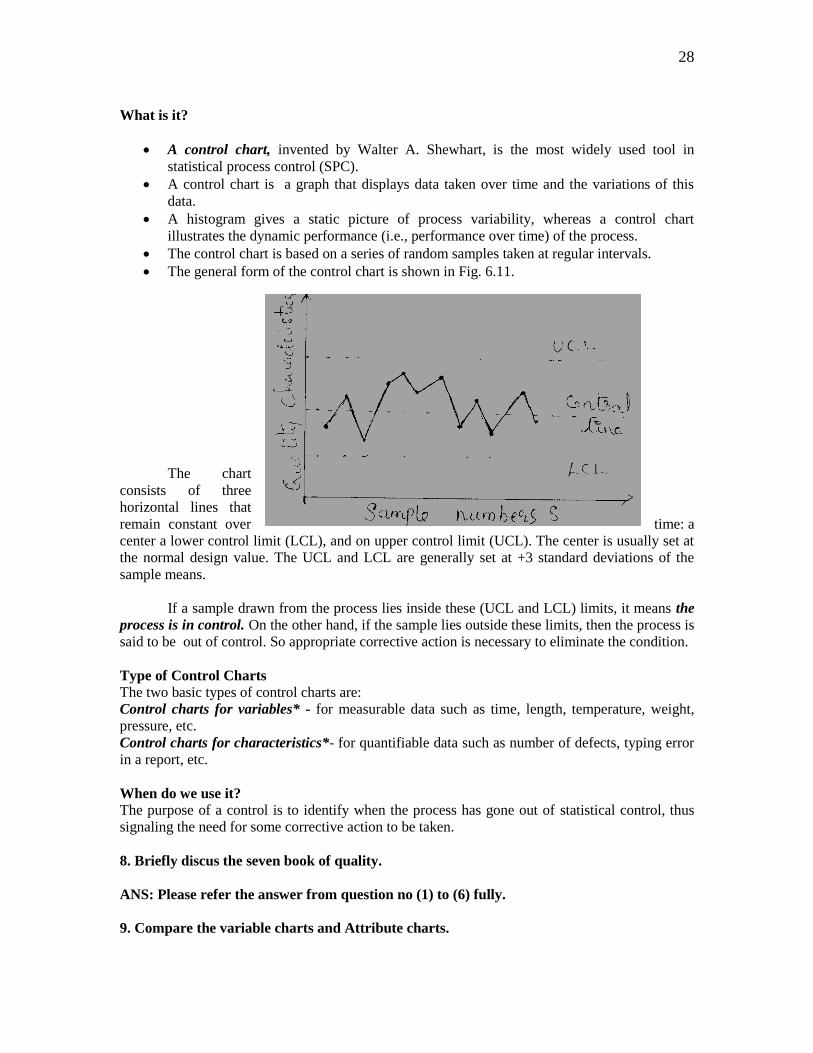
What is it?
A control chart, invented by Walter A. Shewhart, is the most widely used tool in
statistical process control (SPC).
A control chart is a graph that displays data taken over time and the variations of this
data.
A histogram gives a static picture of process variability, whereas a control chart
illustrates the dynamic performance (i.e., performance over time) of the process.
The control chart is based on a series of random samples taken at regular intervals.
The general form of the control chart is shown in Fig. 6.11.
The chart
consists of three
horizontal lines that
remain constant over time: a
center a lower control limit (LCL), and on upper control limit (UCL). The center is usually set at
the normal design value. The UCL and LCL are generally set at +3 standard deviations of the
sample means.
If a sample drawn from the process lies inside these (UCL and LCL) limits, it means the
process is in control. On the other hand, if the sample lies outside these limits, then the process is
said to be out of control. So appropriate corrective action is necessary to eliminate the condition.
Type of Control Charts
The two basic types of control charts are:
Control charts for variables* - for measurable data such as time, length, temperature, weight,
pressure, etc.
Control charts for characteristics*- for quantifiable data such as number of defects, typing error
in a report, etc.
When do we use it?
The purpose of a control is to identify when the process has gone out of statistical control, thus
signaling the need for some corrective action to be taken.
8. Briefly discus the seven book of quality.
ANS: Please refer the answer from question no (1) to (6) fully.
9. Compare the variable charts and Attribute charts.

29
Comparison of three types of control charts
Statistical measure
plotted Average X and range R Percentage non-
conforming (p)
Number of non-
conformities (c)
Types of data
required
Variable data (measured values of a
characteristic)
Attribute data
(Number of defective
units of product)
Attribute data (number
of defects per unit of
product)
General field of
application
Control of individual characteristics Control of overall
fraction defective of
a process
Control of overall
number of defects per
unit
Significant
advantages
Provides maximum utilization of
information available from data
Provides detailed information on process
average and variations for control of
individual dimensions
Data required are
often already
available from
inspection records.
Easily understood by
all personnel.
Provides an overall
picture of quality.
Same advantages as p-
chart but also provides
a measure of
defectiveness.
Significant
disadvantages
Not understood unless training is provided,
can cause confusion between control limits
and tolerance limits.
Cannot be used with go/no go type of data.
Does not provide
detailed information
for control of
individual
characteristics.
Does not recognize
different degrees of
defectiveness in units
of product.
Does not provide
detailed information
for control of
individual
characteristics.
Sample size Usually 4 or 5 Uses given
inspection results for
samples of 25, 50 or
100
Any convenient unit
of product such as 50
m of wire or one
computer set.
10. Explain briefly the concept of Six Sigma.
WHAT IS SIX SIGMA?
Six sigma stands for six standard deviation from mean (sigma is the Greek letter used to
represent standard deviation in statistics).
Six sigma, similar to Zero Defect (ZD), is a philosophical benchmark or standard of
excellence proposed by Philip Crosby.
Six sigma methodology provides the techniques and tools to improve the capability and
reduce the defects in any process.
It was started by Motorola in 1987, in its manufacturing division.
Six sigma strives for perfection. It allows for only 3.4 defects per million
opportunities (or 99.999666 percent accuracy). Here a defect can be anything from a
faulty party to an incorrect customer bill.
Six sigma improves the process performance, decrease variation and maintains
consistent quality of the process output. This leads to defect reduction and
improvements in profits, product quality and customer satisfaction.
Six sigma incorporates the basic principles and techniques used in business, statistics and
engineering.
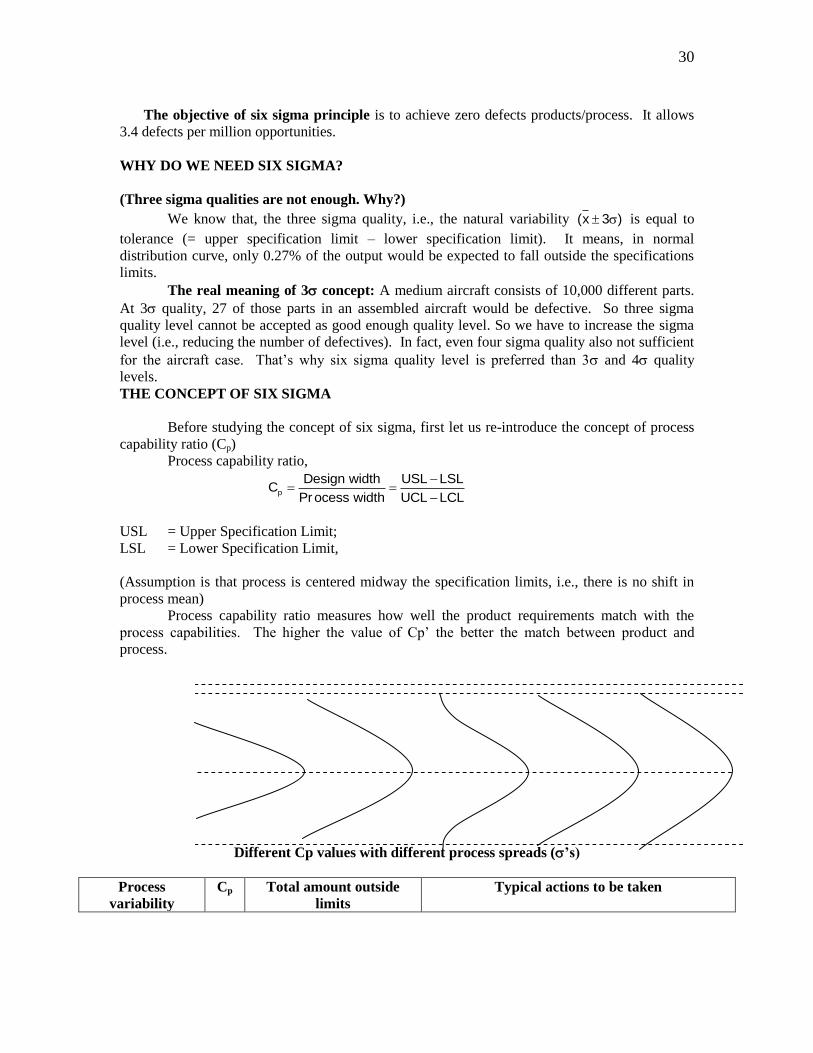
30
The objective of six sigma principle is to achieve zero defects products/process. It allows
3.4 defects per million opportunities.
WHY DO WE NEED SIX SIGMA?
(Three sigma qualities are not enough. Why?)
We know that, the three sigma quality, i.e., the natural variability (x 3 ) is equal to
tolerance (= upper specification limit – lower specification limit). It means, in normal
distribution curve, only 0.27% of the output would be expected to fall outside the specifications
limits.
The real meaning of 3 concept: A medium aircraft consists of 10,000 different parts.
At 3 quality, 27 of those parts in an assembled aircraft would be defective. So three sigma
quality level cannot be accepted as good enough quality level. So we have to increase the sigma
level (i.e., reducing the number of defectives). In fact, even four sigma quality also not sufficient
for the aircraft case. That’s why six sigma quality level is preferred than 3 and 4 quality
levels.
THE CONCEPT OF SIX SIGMA
Before studying the concept of six sigma, first let us re-introduce the concept of process
capability ratio (Cp)
Process capability ratio,
p
Design width USL LSLC
Process width UCL LCL
USL = Upper Specification Limit;
LSL = Lower Specification Limit,
(Assumption is that process is centered midway the specification limits, i.e., there is no shift in
process mean)
Process capability ratio measures how well the product requirements match with the
process capabilities. The higher the value of Cp’ the better the match between product and
process.
Different Cp values with different process spreads (’s)
Process
variability
Cp Total amount outside
limits
Typical actions to be taken
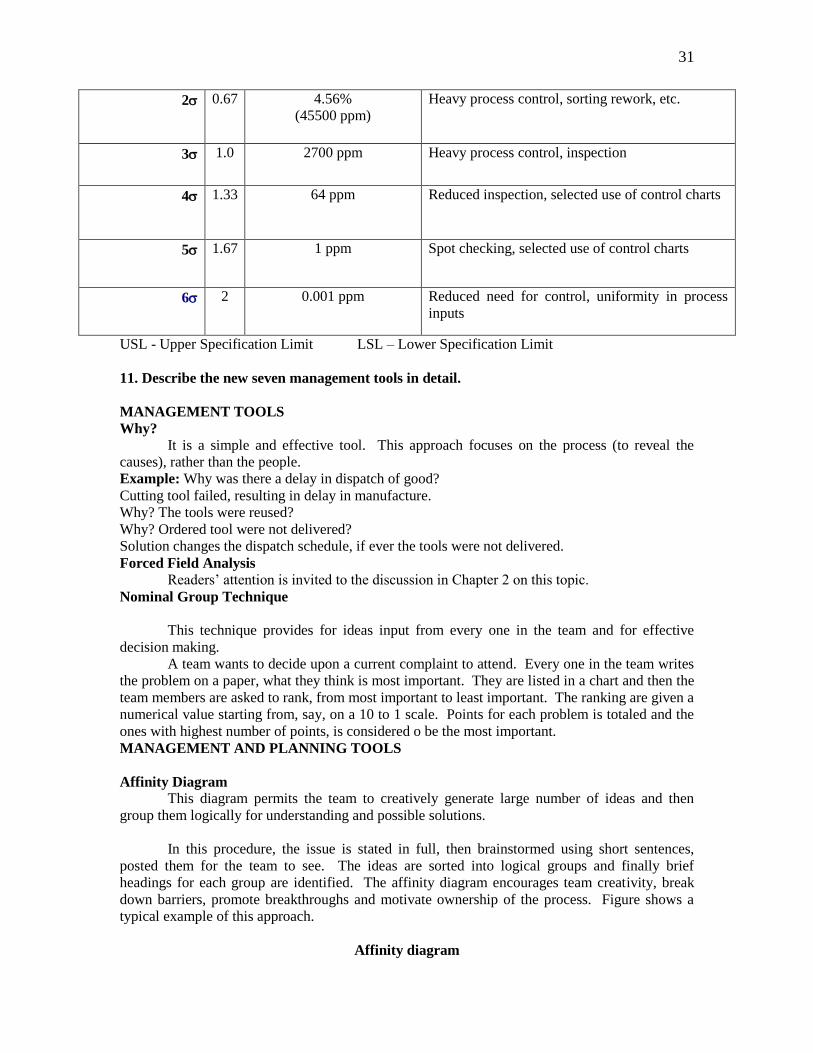
31
2 0.67 4.56%
(45500 ppm)
Heavy process control, sorting rework, etc.
3 1.0 2700 ppm Heavy process control, inspection
4 1.33 64 ppm Reduced inspection, selected use of control charts
5 1.67 1 ppm Spot checking, selected use of control charts
6 2 0.001 ppm Reduced need for control, uniformity in process
inputs
USL - Upper Specification Limit LSL – Lower Specification Limit
11. Describe the new seven management tools in detail.
MANAGEMENT TOOLS
Why?
It is a simple and effective tool. This approach focuses on the process (to reveal the
causes), rather than the people.
Example: Why was there a delay in dispatch of good?
Cutting tool failed, resulting in delay in manufacture.
Why? The tools were reused?
Why? Ordered tool were not delivered?
Solution changes the dispatch schedule, if ever the tools were not delivered.
Forced Field Analysis
Readers’ attention is invited to the discussion in Chapter 2 on this topic.
Nominal Group Technique
This technique provides for ideas input from every one in the team and for effective
decision making.
A team wants to decide upon a current complaint to attend. Every one in the team writes
the problem on a paper, what they think is most important. They are listed in a chart and then the
team members are asked to rank, from most important to least important. The ranking are given a
numerical value starting from, say, on a 10 to 1 scale. Points for each problem is totaled and the
ones with highest number of points, is considered o be the most important.
MANAGEMENT AND PLANNING TOOLS
Affinity Diagram
This diagram permits the team to creatively generate large number of ideas and then
group them logically for understanding and possible solutions.
In this procedure, the issue is stated in full, then brainstormed using short sentences,
posted them for the team to see. The ideas are sorted into logical groups and finally brief
headings for each group are identified. The affinity diagram encourages team creativity, break
down barriers, promote breakthroughs and motivate ownership of the process. Figure shows a
typical example of this approach.
Affinity diagram
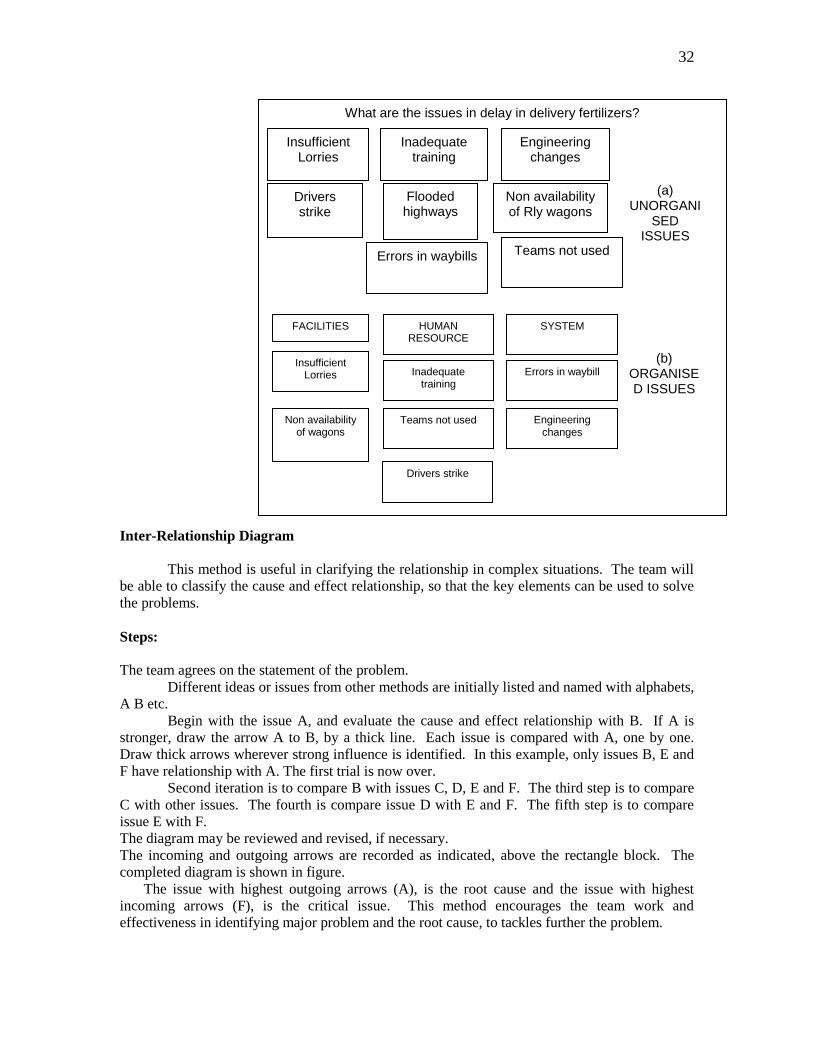
32
Inter-Relationship Diagram
This method is useful in clarifying the relationship in complex situations. The team will
be able to classify the cause and effect relationship, so that the key elements can be used to solve
the problems.
Steps:
The team agrees on the statement of the problem.
Different ideas or issues from other methods are initially listed and named with alphabets,
A B etc.
Begin with the issue A, and evaluate the cause and effect relationship with B. If A is
stronger, draw the arrow A to B, by a thick line. Each issue is compared with A, one by one.
Draw thick arrows wherever strong influence is identified. In this example, only issues B, E and
F have relationship with A. The first trial is now over.
Second iteration is to compare B with issues C, D, E and F. The third step is to compare
C with other issues. The fourth is compare issue D with E and F. The fifth step is to compare
issue E with F.
The diagram may be reviewed and revised, if necessary.
The incoming and outgoing arrows are recorded as indicated, above the rectangle block. The
completed diagram is shown in figure.
The issue with highest outgoing arrows (A), is the root cause and the issue with highest
incoming arrows (F), is the critical issue. This method encourages the team work and
effectiveness in identifying major problem and the root cause, to tackles further the problem.
What are the issues in delay in delivery fertilizers?
Insufficient Lorries
Inadequate training
Engineering changes
Drivers strike
Flooded highways
Non availability of Rly wagons
(a) UNORGANI
SED ISSUES
Errors in waybills Teams not used
FACILITIES
Insufficient Lorries
Non availability of wagons
HUMAN RESOURCE
Teams not used
Inadequate training
Drivers strike
SYSTEM
Engineering changes
Errors in waybill
(b) ORGANISED ISSUES
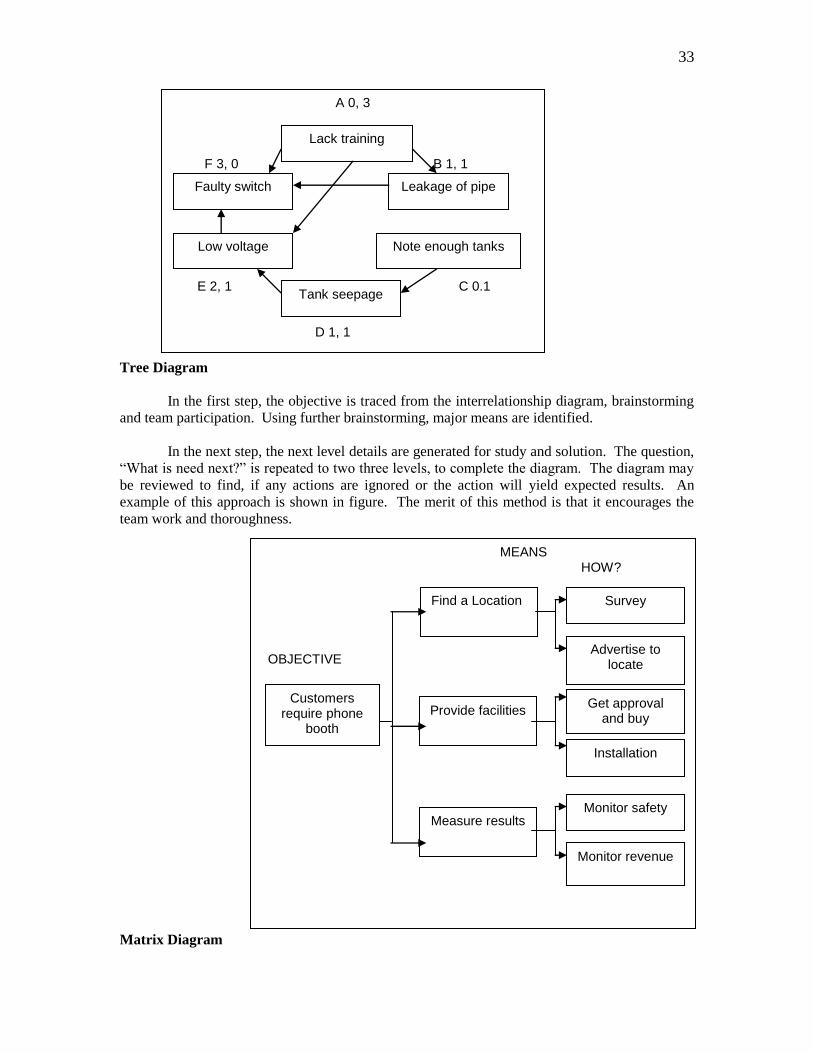
33
Interrelationship diagram
Tree Diagram
In the first step, the objective is traced from the interrelationship diagram, brainstorming
and team participation. Using further brainstorming, major means are identified.
In the next step, the next level details are generated for study and solution. The question,
“What is need next?” is repeated to two three levels, to complete the diagram. The diagram may
be reviewed to find, if any actions are ignored or the action will yield expected results. An
example of this approach is shown in figure. The merit of this method is that it encourages the
team work and thoroughness.
Tree diagram
Matrix Diagram
A 0, 3
F 3, 0 B 1, 1 E 2, 1 C 0.1 D 1, 1
Lack training
Faulty switch Leakage of pipe
Low voltage Note enough tanks
Tank seepage
MEANS HOW?
OBJECTIVE
Customers require phone
booth
Find a Location
Provide facilities
Measure results
Survey
Advertise to locate
Get approval and buy
Installation
Monitor safety
Monitor revenue
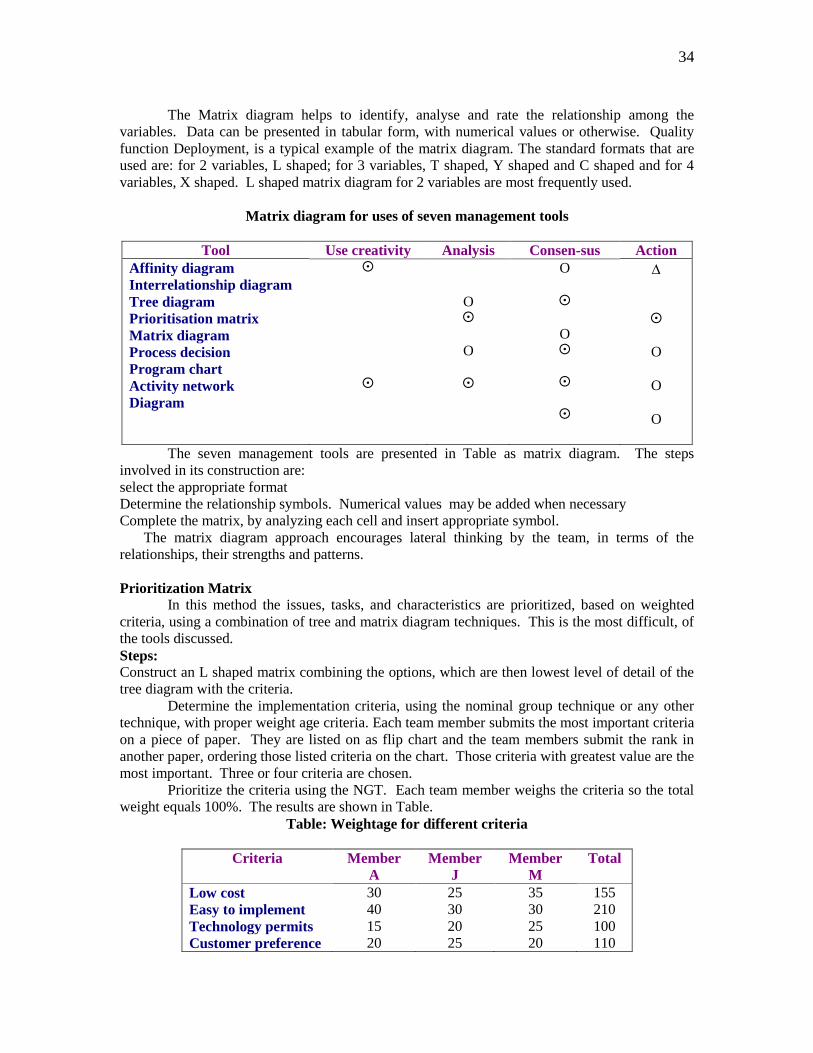
34
The Matrix diagram helps to identify, analyse and rate the relationship among the
variables. Data can be presented in tabular form, with numerical values or otherwise. Quality
function Deployment, is a typical example of the matrix diagram. The standard formats that are
used are: for 2 variables, L shaped; for 3 variables, T shaped, Y shaped and C shaped and for 4
variables, X shaped. L shaped matrix diagram for 2 variables are most frequently used.
Matrix diagram for uses of seven management tools
Tool Use creativity Analysis Consen-sus Action
Affinity diagram
Interrelationship diagram
Tree diagram
Prioritisation matrix
Matrix diagram
Process decision
Program chart
Activity network
Diagram
O
O
O
O
O
O
O
The seven management tools are presented in Table as matrix diagram. The steps
involved in its construction are:
select the appropriate format
Determine the relationship symbols. Numerical values may be added when necessary
Complete the matrix, by analyzing each cell and insert appropriate symbol.
The matrix diagram approach encourages lateral thinking by the team, in terms of the
relationships, their strengths and patterns.
Prioritization Matrix
In this method the issues, tasks, and characteristics are prioritized, based on weighted
criteria, using a combination of tree and matrix diagram techniques. This is the most difficult, of
the tools discussed.
Steps:
Construct an L shaped matrix combining the options, which are then lowest level of detail of the
tree diagram with the criteria.
Determine the implementation criteria, using the nominal group technique or any other
technique, with proper weight age criteria. Each team member submits the most important criteria
on a piece of paper. They are listed on as flip chart and the team members submit the rank in
another paper, ordering those listed criteria on the chart. Those criteria with greatest value are the
most important. Three or four criteria are chosen.
Prioritize the criteria using the NGT. Each team member weighs the criteria so the total
weight equals 100%. The results are shown in Table.
Table: Weightage for different criteria
Criteria Member
A
Member
J
Member
M
Total
Low cost
Easy to implement
Technology permits
Customer preference
30
40
15
20
25
30
20
25
35
30
25
20
155
210
100
110
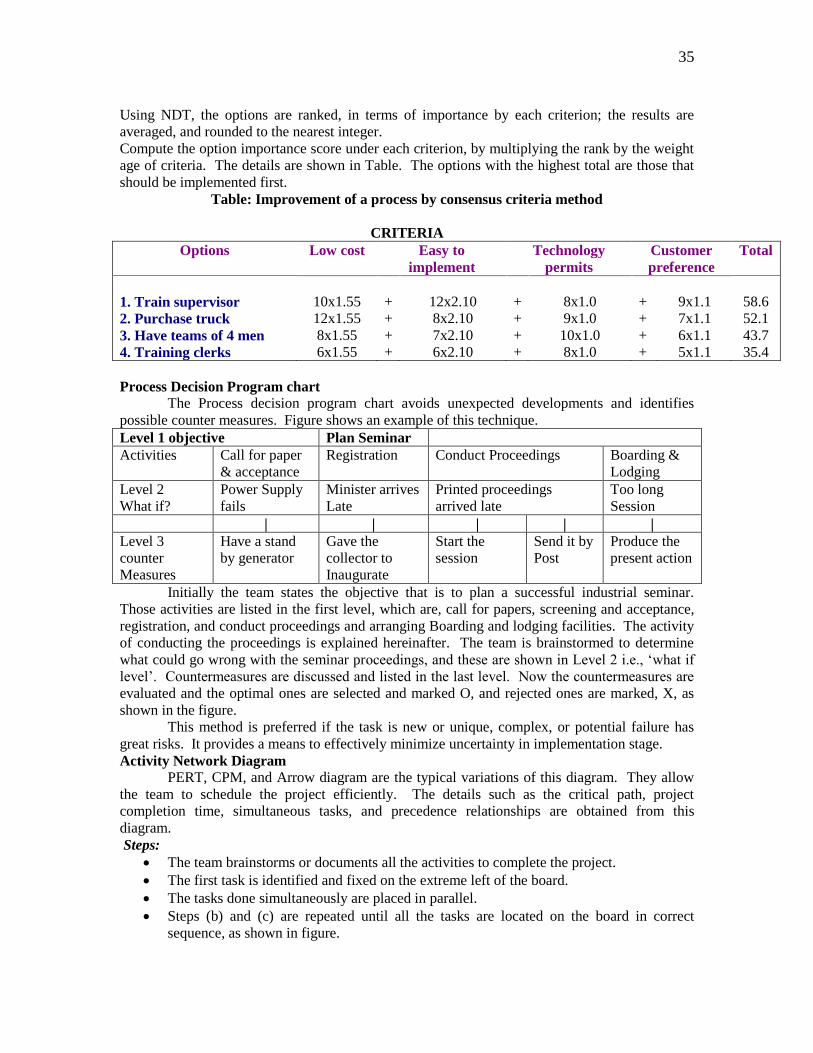
35
Using NDT, the options are ranked, in terms of importance by each criterion; the results are
averaged, and rounded to the nearest integer.
Compute the option importance score under each criterion, by multiplying the rank by the weight
age of criteria. The details are shown in Table. The options with the highest total are those that
should be implemented first.
Table: Improvement of a process by consensus criteria method
CRITERIA
Options Low cost Easy to
implement
Technology
permits
Customer
preference
Total
1. Train supervisor
2. Purchase truck
3. Have teams of 4 men
4. Training clerks
10x1.55
12x1.55
8x1.55
6x1.55
+
+
+
+
12x2.10
8x2.10
7x2.10
6x2.10
+
+
+
+
8x1.0
9x1.0
10x1.0
8x1.0
+
+
+
+
9x1.1
7x1.1
6x1.1
5x1.1
58.6
52.1
43.7
35.4
Process Decision Program chart
The Process decision program chart avoids unexpected developments and identifies
possible counter measures. Figure shows an example of this technique.
Level 1 objective Plan Seminar
Activities Call for paper
& acceptance
Registration Conduct Proceedings Boarding &
Lodging
Level 2
What if?
Power Supply
fails
Minister arrives
Late
Printed proceedings
arrived late
Too long
Session
| | | | |
Level 3
counter
Measures
Have a stand
by generator
Gave the
collector to
Inaugurate
Start the
session
Send it by
Post
Produce the
present action
Initially the team states the objective that is to plan a successful industrial seminar.
Those activities are listed in the first level, which are, call for papers, screening and acceptance,
registration, and conduct proceedings and arranging Boarding and lodging facilities. The activity
of conducting the proceedings is explained hereinafter. The team is brainstormed to determine
what could go wrong with the seminar proceedings, and these are shown in Level 2 i.e., ‘what if
level’. Countermeasures are discussed and listed in the last level. Now the countermeasures are
evaluated and the optimal ones are selected and marked O, and rejected ones are marked, X, as
shown in the figure.
This method is preferred if the task is new or unique, complex, or potential failure has
great risks. It provides a means to effectively minimize uncertainty in implementation stage.
Activity Network Diagram
PERT, CPM, and Arrow diagram are the typical variations of this diagram. They allow
the team to schedule the project efficiently. The details such as the critical path, project
completion time, simultaneous tasks, and precedence relationships are obtained from this
diagram.
Steps:
The team brainstorms or documents all the activities to complete the project.
The first task is identified and fixed on the extreme left of the board.
The tasks done simultaneously are placed in parallel.
Steps (b) and (c) are repeated until all the tasks are located on the board in correct
sequence, as shown in figure.
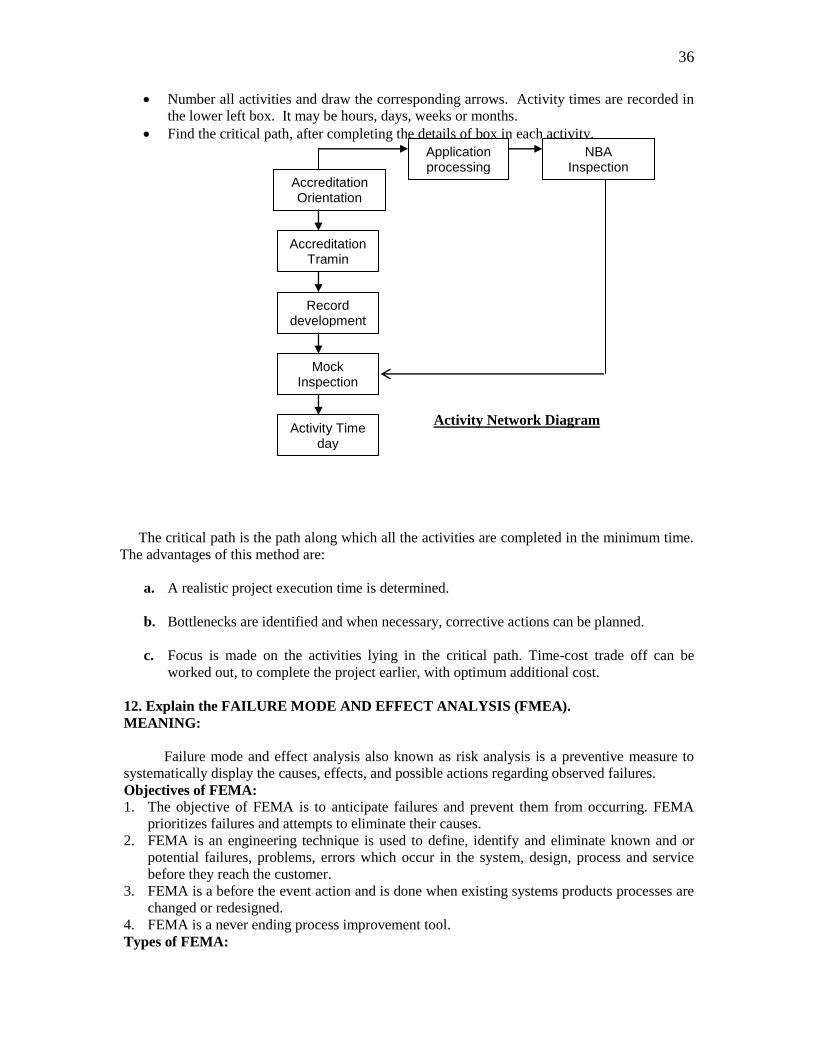
36
Number all activities and draw the corresponding arrows. Activity times are recorded in
the lower left box. It may be hours, days, weeks or months.
Find the critical path, after completing the details of box in each activity.
Activity Network Diagram
The critical path is the path along which all the activities are completed in the minimum time.
The advantages of this method are:
a. A realistic project execution time is determined.
b. Bottlenecks are identified and when necessary, corrective actions can be planned.
c. Focus is made on the activities lying in the critical path. Time-cost trade off can be
worked out, to complete the project earlier, with optimum additional cost.
12. Explain the FAILURE MODE AND EFFECT ANALYSIS (FMEA).
MEANING:
Failure mode and effect analysis also known as risk analysis is a preventive measure to
systematically display the causes, effects, and possible actions regarding observed failures.
Objectives of FEMA:
1. The objective of FEMA is to anticipate failures and prevent them from occurring. FEMA
prioritizes failures and attempts to eliminate their causes.
2. FEMA is an engineering technique is used to define, identify and eliminate known and or
potential failures, problems, errors which occur in the system, design, process and service
before they reach the customer.
3. FEMA is a before the event action and is done when existing systems products processes are
changed or redesigned.
4. FEMA is a never ending process improvement tool.
Types of FEMA:
Accreditation Orientation
Application processing
NBA Inspection
Accreditation Tramin
Record development
Mock Inspection
Activity Time day

37
1. System FEMA
2. Design FEMA
3. Process FEMA
4. Service FEMA
5. Equipment FEMA
6. Maintenance FEMA
7. Concept FEMA
8. Environmental FEMA
Benefits of FEMA:
1. Improve product/process reliability and quality.
2. Increase customer satisfaction.
3. Early identification and elimination of potential product/process failure modes.
4. Prioritize product or process deficiencies
5. Capture engineering/organization knowledge
6. Document and track the actions taken to reduce risk
7. Provide focus for improved testing and development.
8. Minimize late changes and associated cost.
9. Act as catalyst for teamwork and idea exchange between functions.
Meaning of reliability:
Reliability is one of the most important characteristics of any product, no matter what its
application. Reliability is also an important aspect when dealing with customer satisfaction.
Whether the customer is internal or external. Customers want a product that will have a relatively
long service life, with long times between failures. However, as products become more complex
in nature, traditional design methods are not adequate for ensuring low rates of failure. This
problem gave rise to the concept of designing reliability into the product itself.
Reliability requirements:
The acceptance of a certain product or process is subject to meeting certain set of given
requirements for reliability of the product or process. It is however important to realize that
although the definition for reliability is relatively simple, the customer and the supplier may have
different definitions of what failure constitute. This common agreement on what constitutes
reliability should be defined in terms of influence on other related systems, the complexity of the
failure, and finally the relative criticality of the failure.
Failure rate:
A vast majority of products follow a very familiar pattern of failure. When no information
is known about the reliability or conversely, failure of a product, component, system or process,
except the failure rate which is a constant, periods of failure can conveniently be modeled by an
exponential distribution. The failures of most products can be classified in to three main
categories: debug, chance, and wear out. The first of these includes a high failure rate at the
initial stages because of inappropriate use or flaws in the design or manufacturing. The next
category is the failure of the product due to accidents, poor maintenance, or limitations on the
design. The final category covers failure after the product or process has performed as expected
for at least the amount of time given by the manufacturer as the product or process life. A
successful design or process ideally fails only in this method.
13. Explain about STAGES OF FEMA.
The FEMA methodology has four stages: they are:
Stage1: specifying possibilities
1. Functions
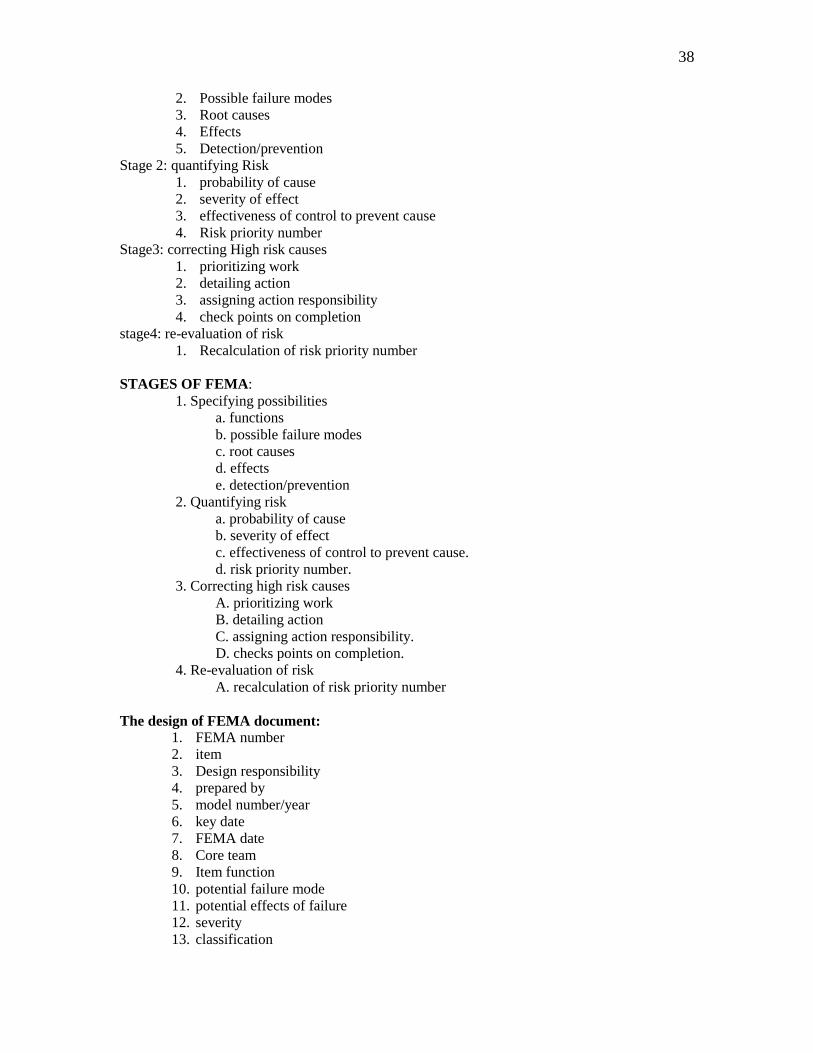
38
2. Possible failure modes
3. Root causes
4. Effects
5. Detection/prevention
Stage 2: quantifying Risk
1. probability of cause
2. severity of effect
3. effectiveness of control to prevent cause
4. Risk priority number
Stage3: correcting High risk causes
1. prioritizing work
2. detailing action
3. assigning action responsibility
4. check points on completion
stage4: re-evaluation of risk
1. Recalculation of risk priority number
STAGES OF FEMA:
1. Specifying possibilities
a. functions
b. possible failure modes
c. root causes
d. effects
e. detection/prevention
2. Quantifying risk
a. probability of cause
b. severity of effect
c. effectiveness of control to prevent cause.
d. risk priority number.
3. Correcting high risk causes
A. prioritizing work
B. detailing action
C. assigning action responsibility.
D. checks points on completion.
4. Re-evaluation of risk
A. recalculation of risk priority number
The design of FEMA document:
1. FEMA number
2. item
3. Design responsibility
4. prepared by
5. model number/year
6. key date
7. FEMA date
8. Core team
9. Item function
10. potential failure mode
11. potential effects of failure
12. severity
13. classification
39
14. potential causes mechanisms of failure
15. occurrence
16. current design controls
17. detection
18. risk priority number
19. Recommend actions Responsibility and target completion dates
20. actions taken
The process of FEMA and documentation
1. process function requirements
2. potential failure mode
3. potential effects of failure
4. severity
5. classification
6. potential causes mechanisms of failure
7. occurrence
8. current process controls
9. detection
14. What is BENCH MARKING? Explain its Types.
MEANING:
Bench marking is the process of determining who is the very best, who sets the standard,
and what that standard is. In cricket, one could argue that two consecutive world cup champions
made the Australian cricket team the benchmark.
Definition:
American productivity and quality centre has defined the benchmarking as “the process
of identifying, understanding, and adopting outstanding practices and process from organizations
anywhere in the world to an organization to improve its performance.
DAVID KEARNS defines benchmarking as “the continuous process of measuring
products, services and practices against the toughest competitors or those companies recognized
as industry leaders.”
THORE defines benchmarking as “the systematic comparison of elements of
performance of an organization against those of other organizations, usually with the aim of
mutual improvement.”
Objectives of benchmarking:
1. Benchmarking aims at a goal setting process to facilitate comparison with the best.
2. It aims at motivating and stimulating company employees towards the goal of continuous
quality improvement.
3. It aims at external orientation of the company
4. It aims at identifying a technological breakthrough
5. It aims at searching for industry best practices.
Types of Benchmarking
Classification based on the object to be benchmarked:
1. Product Benchmarking: this refers to comparison of different features and attributes of
competing products and services.
40
2. Performance Benchmarking: this refers to comparison of performance indicators related
to a business as a whole or to the group of critical activities or processes.
3. Process Benchmarking: this refers to comparison of processes. It identifies a more effective
and efficient process to be implemented.
4. Strategic Benchmarking: this refers to examining competitive position in the market place.
It helps the company to study the business strategy of another successful business and use the
strategy for becoming more competitive.
Classification based on the organizations against whom one is Benchmarking:
1. Internal Benchmarking: it refers to comparison of performance between departments,
plants, subsidiaries, within the organization.
2. Industry Benchmarking: It refers to comparison of performance by the organization
3. Competitive Benchmarking: It refers to comparison of performance against direct
competitors.
4. Best in class Benchmarking: It refers to comparison of performance with best practices
prevalent in an organization irrespective of products and services.
5. Relationship Benchmarking: it refers to comparison of performance with the
Benchmarking Company which already has a relationship like customer-supplier relations,
joint venture arrangement, etc.
Steps in benchmarking process:
Phase 1: Planning:
Step1: What can be benchmarked? (I.e., deciding what to benchmark)
Step2: To whom or what shall we compare (Identifying benchmark partners)
Step3: Determine data collection method and collect data
Phase 2: Analysis:
Step4: determine the current performance gap
Step 5: Project future performance levels
Phase 3: Integration:
Step6: communicate benchmark findings and gain acceptance.
Step7: Establish functional goals
Phase 4: Action
Step8: Develop action plans
Step9: Implements specific actions and monitor the progress
Step10: Recalibrate benchmarks
Phase 5: Maturity:
Step 11: Attain the leadership position.
Step 12: Integrate practices into the process.
41
Benefits of benchmarking:
a. . Creating a culture that values continuous improvement to achieve excellence.
b. . Sharing the best practices between benchmarking partners.
c. . Prioritizing the areas that need improvement.
d. . Enhancing creativity by devaluing the not invented here syndrome
e. . Increasing sensitivity to changes in the external environment.
f. .Shifting the corporate mindset from relative complacency to a strong sense of urgency
for ongoing improvement.
g. .Focusing resources through performance target set with employee unit.
PITFALLS OF BENCHMARKING:
Bench marking is based on learning from others, rather that developing new and
improved approaches. Since the process being studied is there for all to see , therefore a firm will
find that benchmarking cannot give them a sustained competitive advantage. Although helpful
benchmarking should never be the primary strategy for improvement.
If all the industries employ the benchmarking approach, it will lead to stagnation of ideas,
strategies best industry practices, etc. so benchmarking should not be a substitute for innovation.
It must be a mere improvement tool.
Unit-IV
1. What are the various approaches to improving reliability of a product?
A. Standardization, redundancy, over-design, de-rating, design simplification, understanding the
physics of failure, burn-in, and Failure Mode and Effect Analysis (FMEA).
2. What is Product Life Characteristics Curve?
A. The failure rate curve, called the product life characteristics curve, shows the failure rates
(failures per unit time) against time. It is also called as bathtub curve because of its shape.
3. What are the three stages shown on a Product Life Characteristics Curve?
A. The curve consists of three distinct stages: Early failure (‘infant mortality’ or ‘debug’), useful
life (‘normal failure’ or ‘chance’) and wear out (‘old age’) failure. The curve shows that the
failure rates are higher at the early and end stages of a product’s life and relatively low in between
the two extremes.
4. What is the usefulness of the Product Life Characteristics Curve?
A. Knowing the product life characteristics curve for a particular product helps engineers predict
failure behavior and take suitable decisions.
5. What is the essential feature of Total Productive Maintenance (TPM)?
A. TPM is keeping plant and equipment at their highest productive level through cooperation of
all areas of the enterprise. TPM brings maintenance into focus as a necessary and vital part of the
business. It is not regarded as a non-profit activity. Down time for maintenance is scheduled as an
integral part of the manufacturing process.
6. What are the overall goals of TPM (nov/dec 2008)?
42
A. The overall goals of TPM are: Maintaining and improving equipment capacity. Maintaining
equipment for life. Using support from all areas of operation. Encouraging inputs from all
employees. Using teams for continuous improvement.
7. What are the different ways of classifying maintenance activities?
A. Maintenance activities can be classified in various ways:
* Planned (or preventive) maintenance vs. Unplanned (or breakdown) maintenance
* Preventive maintenance can be sub-classified into Periodic maintenance and Predictive
maintenance
* Running maintenance vs. Shutdown maintenance
* Time-based maintenance vs. Condition-based maintenance
8. What is some performance measures used to assess the success of TPM?
A. Mean Time Between Failures (MTBF), Mean Time To Repair (MTTR), Availability (A),
Reliability (R), Maintainability (M), Rate efficiency (RE), Speed efficiency (SE), Performance
efficiency (PE), Quality rate (Q), and Overall Equipment Efficiency (OEE).
9. What are the eight pillars of TPM?
A. The eight pillars of TPM are: [1] 5S, [2] Jishu Hozen (Autonomous Maintenance), [3]
Kobetsu Kaizen (KK), [4] Planned Maintenance (PM), [5] Quality Maintenance (QM), [6]
Training, [7] Office TPM, and [8] Safety, Health and Environment.
10. What are the three categories of losses identified in TPM?
A. (A) Losses that impede equipment efficiency (B) Losses that impede human work efficiency
and (C) Losses that impede effective use of production resources.
11. What is Office TPM?
A. Office TPM is aimed at improving quality, productivity and efficiency in the administrative
functions and identifying and eliminating losses.
12. What is Business Process Reengineering (BPR)?
A. The fundamental rethinking and radical redesign of business processes to improve
performance dramatically in terms of measures like cost, quality, service, and speed.
13. What are some key requirements for success in BPR implementation?
A. The key requirements for success in BPR are: (a) fundamental understanding of processes, (b)
creative thinking, and (c) effective use of information technology.
14. Distinguish between Kaizen and BPR.
A. Kaizen involves incremental improvements, whereas BPR involves breakthrough
improvements. Both are essential for successful implementation of TQM.
15. What are the seven principles of reengineering?
A. 1. Organize around outcomes, not tasks, 2. Those who use the output of the process must
perform the process, 3. Merge information processing work into the real work that produces the
information, 4. Treat geographically dispersed resources as though they are centralized, 5. Link
parallel activities instead of integrating their results, 6. Put the decision point where the work is
performed, and 7. Capture information once – at the source.
16. Mention the major steps in BPR implementation.
43
A. 1. Develop business vision and process objectives. 2. Study the existing procedures. 3. Identify
the process for reengineering. 4. Identify customer requirements. 5. Understand the current
process. 6. Identify gaps between current process and customer requirements. 7. Evaluate
enablers (organizational issues, information technology). 8. Develop improved process. 9.
Develop action plan for implementation. 10. Implement the reengineered process. 11. Follow up.
17. What are some factors affecting the success of BPR implementation?
A. (i) Critical/core processes, (ii) Strong leadership, (iii) Cross-functional teams, (iv) Information
technology, (v) ‘Clean slate’ philosophy, and (vi) Process analysis.
18. Mention some major benefits of BPR.
A. 1. Better financial performance, 2. Enhanced customer satisfaction, 3. Cost reduction, 4. Better
product/service quality, 5. Increase in productivity, 6. Improved flexibility / responsiveness, 7.
Reduced process times, 8. Improved employee participation, 9. Increased competitiveness, 10.
Improved delivery performance.
19. Mention some major limitations of BPR.
A. Reengineering involves a great deal of risk. Some major limitations of BPR are: (i) BPR is
strong medicine, often resulting in massive layoffs, (ii) It could cause disruptions in existing jobs,
management systems, and organizational structures, (iii) It often involves large investments,
especially in I.T., (iv) BPR cannot succeed in organizational cultures which are resistant to
change, and (v) BPR is not simple or easily done, nor is it appropriate for all processes and for all
organizations.
20. What is QFD?
Quality function development may be defined as a system for translating consumer
requirements into appropriate requirements at every stage, from research through product design
and development, to manufacture, distribution, installation and marketing, sales and service.
PART-B
1. Explain about TAGUCHI’S QUALITY LOSS FUNCTION. (MAY/JUNE 2009)
Taguchi’s methods are statistical methods developed largely by Genichi Taguchi to
improve the quality of manufactured goods
Taguchi methods are controversial among many convention western statisticians.
Taguchi’s principle contributions to statistics are:
1. Taguchi loss function;
2. the philosophy of off-line quality control; and
3. Innovations in the design of experiments.
Taguchi loss function:
Taguchi defines quality as “the loss imparted by the product to society from the time the
product is shipped”.
This loss includes costs to operate, failure to function, maintenance and repair costs,
customer dissatisfaction injuries caused by poor design and similar costs.
Defective products/ parts that are detected repaired reworked or scrapped before
shipment are not considered part of this loss.
The essence of the loss function concept is that whenever a product deviates from its
target performance it generates a loss to society.
This loss is minimum when performance is right on target, but it grows gradually as one
deviates from the target.
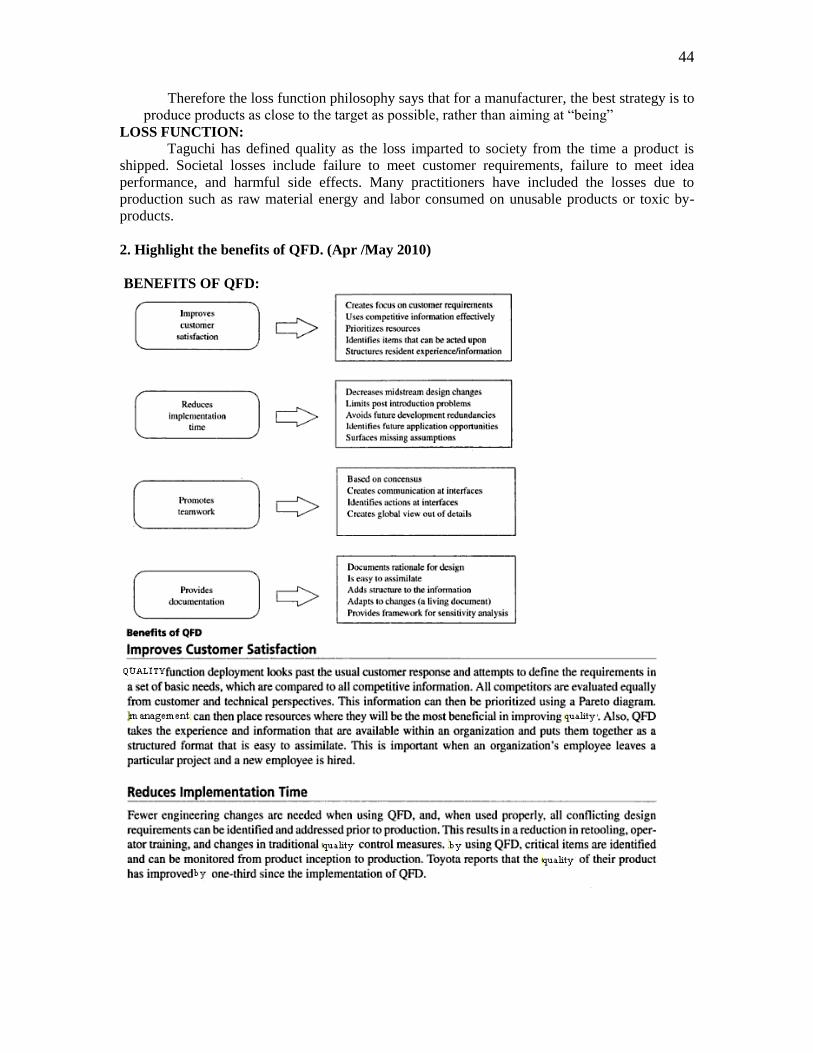
44
Therefore the loss function philosophy says that for a manufacturer, the best strategy is to
produce products as close to the target as possible, rather than aiming at “being”
LOSS FUNCTION:
Taguchi has defined quality as the loss imparted to society from the time a product is
shipped. Societal losses include failure to meet customer requirements, failure to meet idea
performance, and harmful side effects. Many practitioners have included the losses due to
production such as raw material energy and labor consumed on unusable products or toxic by-
products.
2. Highlight the benefits of QFD. (Apr /May 2010)
BENEFITS OF QFD:
45
3. Briefly explain the steps involved in QFD (NOV/DEC 2010)
QUALITY FUNCTION DEVELOPMENT PROCESS:
Phase 1: product planning
Step1: list customer requirements
Step2: List technical descriptors
Step3: Develop a relationship between WHATS AND HOWS
Step4: Develop a interrelationship matrix between HOWS
Step5: Do competitive assessments
Step6: Develop prioritized customer requirements
Step7: Develop prioritized technical descriptors.
Phase 2: part development
Step8: Deploy QFD process down to sub-components level both in terms of requirements and
characteristics.
Step9: Deploy the component deployment chart. Relate the critical sub-component control
characteristics.
Phase 3: process planning
Step10: Develop the relationship between the critical characteristics and process used to create
the characteristics
Step11: Develop the control plan relating critical control to critical processes.
Phase 4: production planning
Step 12: Tabulate operating instructions from process requirements
Step13: develop prototype and do testing
Step14: Launch the final product to the market.
4. Explain each section of the basic structures of house of quality. (APR/MAY 2010)
HOUSE OF QUALITY:
The primary planning tool used in QFD is the house of quality. The house of quality converts the
voice of the customer into product design characteristics. QFD uses a series of matrix diagrams,
also called ‘quality tables’, resembles connected houses.
Basic structure of house of quality:
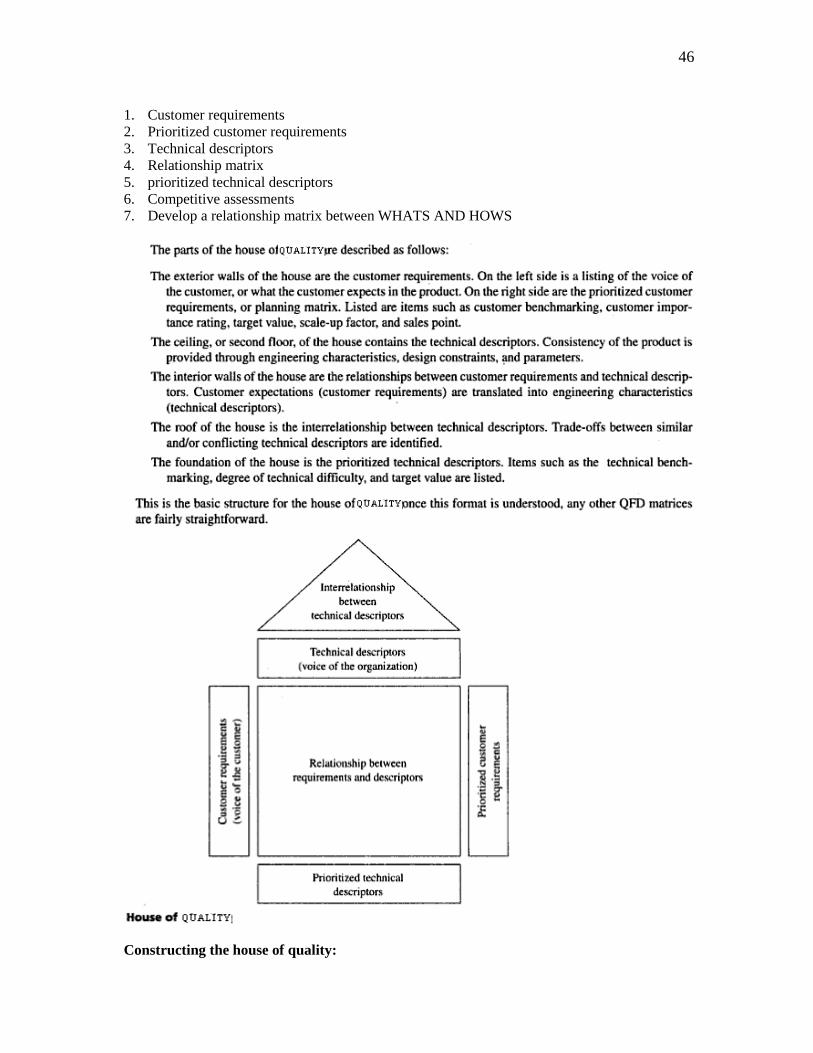
46
1. Customer requirements
2. Prioritized customer requirements
3. Technical descriptors
4. Relationship matrix
5. prioritized technical descriptors
6. Competitive assessments
7. Develop a relationship matrix between WHATS AND HOWS
Constructing the house of quality:
47
Step1: List customer requirements
Step2: List technical descriptors
Step3: Develop a relationship matrix between HOWS
Step4: competitive assessments
Step5: Develop prioritized customer requirements
Step6: Develop prioritized technical descriptors
4. DISCUSS OBJECTIVES OF QUALITY FUNCTION DEPLOYMENT.
Quality function deployment is a systematic and organized approach of taking customer
needs and demands into consideration while designing new products and services or while
improving the existing products and services.
Definition:
Quality function deployment may be defined as a system for translating consumer
requirements into appropriate requirements at every stage, from research through product design
and development, to manufacture, distribution, installation and marketing, sales and service.
OBJECTIVES OF QFD:
1. To identify the true voice of the customer and to use this knowledge to develop products
which satisfy customers.
2. To help in the organization and analysis of all the pertinent information associated with the
project.
3. Quality function development aims at translating the customers voice into product
specifications.
5. GIVE DETAILED NOTES ABOUT QUALITY CIRCLE.
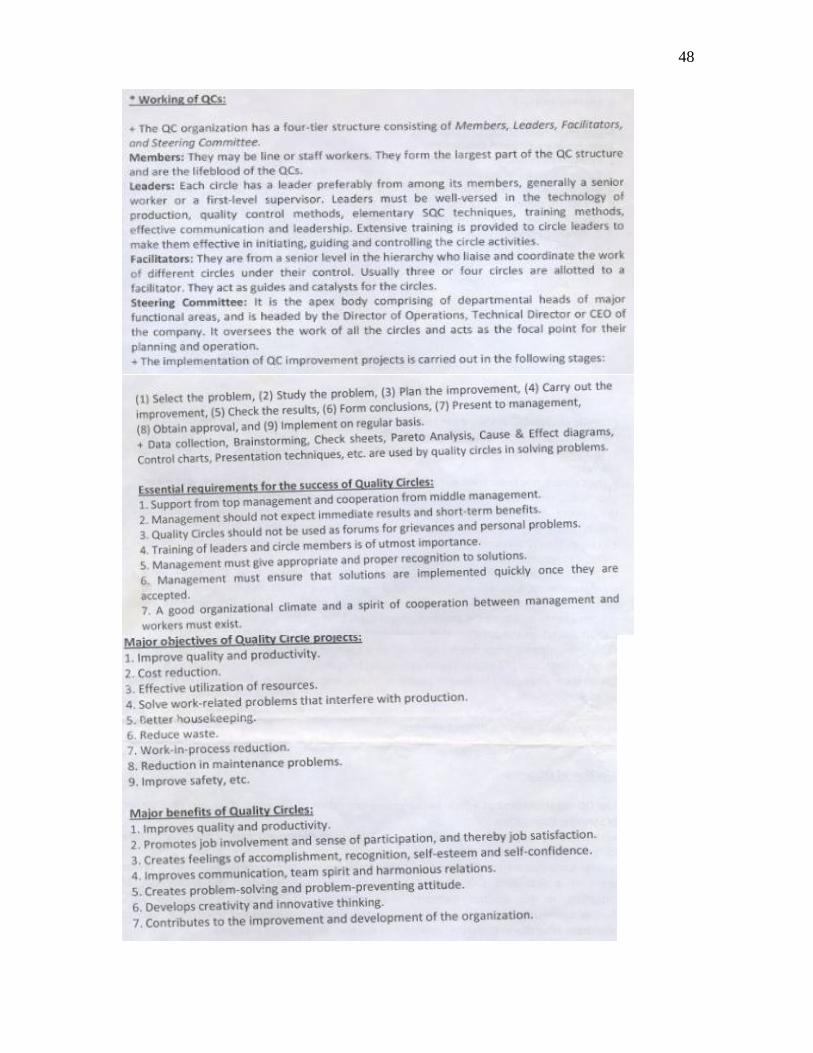
48
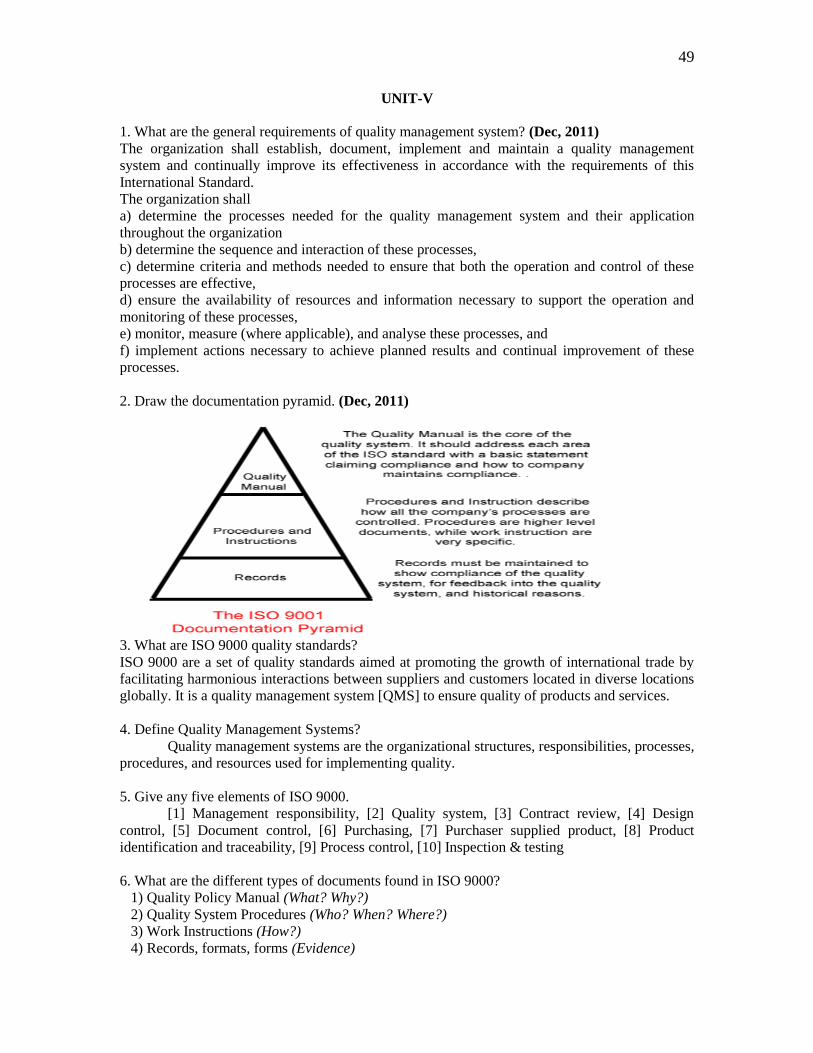
49
UNIT-V
1. What are the general requirements of quality management system? (Dec, 2011)
The organization shall establish, document, implement and maintain a quality management
system and continually improve its effectiveness in accordance with the requirements of this
International Standard.
The organization shall
a) determine the processes needed for the quality management system and their application
throughout the organization
b) determine the sequence and interaction of these processes,
c) determine criteria and methods needed to ensure that both the operation and control of these
processes are effective,
d) ensure the availability of resources and information necessary to support the operation and
monitoring of these processes,
e) monitor, measure (where applicable), and analyse these processes, and
f) implement actions necessary to achieve planned results and continual improvement of these
processes.
2. Draw the documentation pyramid. (Dec, 2011)
3. What are ISO 9000 quality standards?
ISO 9000 are a set of quality standards aimed at promoting the growth of international trade by
facilitating harmonious interactions between suppliers and customers located in diverse locations
globally. It is a quality management system [QMS] to ensure quality of products and services.
4. Define Quality Management Systems?
Quality management systems are the organizational structures, responsibilities, processes,
procedures, and resources used for implementing quality.
5. Give any five elements of ISO 9000.
[1] Management responsibility, [2] Quality system, [3] Contract review, [4] Design
control, [5] Document control, [6] Purchasing, [7] Purchaser supplied product, [8] Product
identification and traceability, [9] Process control, [10] Inspection & testing
6. What are the different types of documents found in ISO 9000?
1) Quality Policy Manual (What? Why?)
2) Quality System Procedures (Who? When? Where?)
3) Work Instructions (How?)
4) Records, formats, forms (Evidence)
50
7. What are the eight quality principles underlying ISO 9000: 2000?
[1] Customer focus, [2] Leadership, [3] Involvement of people, [4] Process approach, [5] System
approach to management, [6] Continuous improvement, [7] Decisions based on facts, and
[8] Mutually beneficial supplier relationships.
8. Define quality system audit.
Quality system audits is a systematic, independent examination to determine whether quality
activities and results comply with planned arrangements, whether these arrangements are
implemented effectively, and whether these are suitable to achieve objectives.
9. What are the different types of audit?
First party audit (internal), Second party audit (by customer), and Third party audit (by
independent agency). Another classification: System audit, Process audit, Product audit,
Adequacy audit, and Compliance audit.
10. What are the different stages in conducting quality audit?
1. Audit planning – schedules, personnel, notifications, checklist.
2. Performance – opening meetings, audit process, noting of non-conformities.
3. Reporting – Observations, suggestions for corrective action
4. Follow-up – implementation of corrective action.
11. What are the quality function needs served by the computer?
[1] data collection, [2] data analysis and reporting, [3] statistical analysis, [4] process control, [5]
test and inspection, and [6] system design
12. What are the documentation requirements of quality management systems?
The quality management system documentation shall include
a) documented statements of a quality policy and quality objectives,
b) a quality manual
c)documented procedures and records required by this International Standard, and
d) documents, including records, determined by the organization to be necessary to ensure the
effective planning, operation and control of its processes.
13. What is quality manual?
The organization shall establish and maintain a quality manual that includes
a) the scope of the quality management system, including details of and justification for any
exclusions
b) the documented procedures established for the quality management system, or reference to
them, and
c) a description of the interaction between the processes of the quality management system.
14. Explain the management’s responsibility for ISO.
Top management shall provide evidence of its commitment to the development and
implementation of the
quality management system and continually improving its effectiveness by
e) communicating to the organization the importance of meeting customer as well as statutory and
regulatory
requirements,
f) establishing the quality policy,
g) ensuring that quality objectives are established,

51
h) conducting management reviews, and
i) ensuring the availability of resources.
15. What is the need for ISO standards?
ISO 9000 is needed to unify the quality terms and definitions used by industrialized nations and
use terms to demonstrate a supplier’s capability of controlling its processes.
16. What is third party audit? (Dec, 2010)
The third party certification audit is carried out much in the same way as first party and second
party quality system assessments and audits. However, the big difference is that an independent
accredited auditing body carries out the assessment and audit, as opposed to carrying it out by the
organization themselves. Also note that the organization going for third party audits are
responsible for the payment of the third party audit process.
17. Give the objectives of internal audit.
a) Determine the actual performance conforms to the documented qualitysystems.
b) Initiate corrective action activities in response to deficiencies.
c) Follow up on noncompliance items of previous audits.
d) Provide continued improvement in the system through feedback to management.
18. What is Environment Management Systems Standards?
An EMS meeting the requirements of ISO 14001:2004 is a management tool enabling an
organization of any size or type to:
identify and control the environmental impact of its activities, products or services, and
to
improve its environmental performance continually, and to
implement a systematic approach to setting environmental objectives and targets, to
achieving these and to demonstrating that they have been achieved.
19. What are the benefits of ISO 14001?
• Facilitate trade and remove trade barriers
• improve environmental performance of planet earth
• Build consensus that there is a need for environment management and a common terminology
for EMS.
20. What are the requirements of ISO 14001?
i. General requirements
ii. Environmental policy
iii. Planning
iv. Implementation and operation
v. Checking and corrective action
vi. Management review
PART-B
1. Explain the elements of ISO 9000 standards.
• Management responsibility
• The Quality system
• Contract review
• Design control
• Document and data control
52
• Purchasing
• Control of customer-supplied product
• Product identification and traceability
• Process control
• Inspection and testing
• Control of inspection, measuring and test equipment
• Inspection and test status
• Control of nonconforming product
• Corrective and preventive action
• Handling, storage, packaging, preservation and delivery
• Control of quality records
• Internal quality audits
• Training
• Servicing
• Statistical techniques
2. Discuss about implementation of ISO 9000
Implementation steps
• Top management commitment
• Appoint the management representative
• Awareness
• Appoint an implementation team
• Training
• Time schedule
• Select element owners
• Review the present system
• Write the document
• Install the new system.
• Internal audit
• Management review
• Pre-assessment
• Registration
3. Explain documentation in quality standard.
Documents
Quality Policy Manual (What?, Why?)
Quality System Procedures (Who?, When?, Where?)
Work Instructions (how?)
Records, Formats, Forms (Evidence)
4. Explain Quality Audits in detail. (Dec, 2011)
Quality audit is the process of systematic examination of a quality system carried out by an
internal or external quality auditor or an audit team. It is an important part of organization's
quality management system and is a key element in the ISO quality system standard, ISO 9001.
Audit Planning: schedules, personnel, checklist
Execution – opening meetings, audit process, noting of conformities
Reporting – observations, suggestions for corrective actions
Follow-up – implementation of corrective actions
Checklist: o Whether system to ensure quality has been established
o Whether the system is documented
53
o Whether the documented system meets requirements
o Whether the system implemented is documented
o Whether the system is effective in achieving orgn. objectives & goals
5. Explain ISO 14000 environmental standards.
An EMS meeting the requirements of ISO 14001:2004 is a management tool enabling an
organization of any size or type to:
identify and control the environmental impact of its activities, products or services, and to
improve its environmental performance continually, and to
implement a systematic approach to setting environmental objectives and targets, to
achieving these and to demonstrating that they have been achieved.
General requirements
• Environmental policy
• Planning
• Implementation and operation
• Checking and corrective action
• Management review
6. Explain the benefits of ISO 9000.
ISO 9000
Fewer on-site audit by customers.
Increased market share.
Improved quality, both internally and externally.
Improve product and service quality levels from suppliers.
Greater awareness of quality by employees.
A documented formal systems.
Reduced operating costs.
7. Explain the benefits of EMS. (Dec, 2011)
a. Global
• Facilitate trade and remove trade barriers
• improve environmental performance of planet earth
• Build consensus that there is a need for environment management and a common
terminology for EMS.
b. Organizational
• Assuring customers of a commitment to environmental management
• Meeting customer requirements
• Maintaining a good public / community relations image
• Satisfying investor criteria and improving access to capital
• Obtaining insurance at reasonable cost
• Increasing market share that results from a competitive advantage
• Reducing incidents that result in liability