série scientifique scientific series incentives for pollution control
TRANSCRIPT

Série ScientifiqueScientific Series
99s-11
Incentives for PollutionControl: Regulation or
(and?) Information
Jérôme Foulon, Paul Lanoie,Benoît Laplante
MontréalMars 1999
CIRANO
Le CIRANO est un organisme sans but lucratif constitué en vertu de la Loi des compagnies du Québec.Le financement de son infrastructure et de ses activités de recherche provient des cotisations de sesorganisations-membres, d=une subvention d=infrastructure du ministère de l=Industrie, du Commerce, dela Science et de la Technologie, de même que des subventions et mandats obtenus par ses équipes derecherche. La Série Scientifique est la réalisation d=une des missions que s=est données le CIRANO, soitde développer l=analyse scientifique des organisations et des comportements stratégiques.
CIRANO is a private non-profit organization incorporated under the Québec Companies Act. Itsinfrastructure and research activities are funded through fees paid by member organizations, aninfrastructure grant from the Ministère de l=Industrie, du Commerce, de la Science et de la Technologie,and grants and research mandates obtained by its research teams. The Scientific Series fulfils one of themissions of CIRANO: to develop the scientific analysis of organizations and strategic behaviour.
Les organisations-partenaires / The Partner Organizations
$École des Hautes Études Commerciales$École Polytechnique$Université Concordia$Université de Montréal$Université du Québec à Montréal$Université Laval$Université McGill$MEQ$MICST$Alcan Aluminium Ltée$Banque Nationale du Canada$Bell Canada$Développement des ressources humaines Canada (DRHC)$Egis$Fédération des caisses populaires Desjardins de Montréal et de l=Ouest-du-Québec$Hydro-Québec$Imasco$Industrie Canada$Microcell Labs inc.$Raymond Chabot Grant Thornton$Téléglobe Canada$Ville de Montréal
© 1999 Jérôme Foulon, Paul Lanoie et Benoît Laplante. Tous droits réservés. All rights reserved.Reproduction partielle permise avec citation du document source, incluant la notice ©.Short sections may be quoted without explicit permission, provided that full credit, including © notice,is given to the source.
ISSN 1198-8177
Ce document est publié dans l=intention de rendre accessibles les résultats préliminaires de larecherche effectuée au CIRANO, afin de susciter des échanges et des suggestions. Les idées et lesopinions émises sont sous l=unique responsabilité des auteurs, et ne représentent pas nécessairementles positions du CIRANO ou de ses partenaires.This paper presents preliminary research carried out at CIRANO and aims to encourage discussionand comment. The observations and viewpoints expressed are the sole responsibility of the authors.They do not necessarily represent positions of CIRANO or its partners.
Incentives for Pollution Control:Regulation or (and?) Information*
Jérôme FoulonH, Paul LanoieI, Benoît Laplante'
Résumé / Abstract
* Corresponding Author: Paul Lanoie, CIRANO, 2020 University Street, 25th floor, Montréal, Qc, CanadaH3A 2A5 Tel: (514) 985-4020 Fax: (514) 985-4039 e-mail: [email protected] auteurs remercient le Réseau canadien sur la gestion durable des forêts pour avoir financé cetterecherche.
† École des Hautes Études Commerciales
‡ École des Hautes Études Commerciales and CIRANO
§ Banque Mondiale
De plus en plus de décideurs publics dans le domaine del’environnement ont adopté des politiques de diffusion de l’information pour créerdes incitations à une meilleure performance environnementale. Dans cette étude,nous examinons l’impact d’une liste noire de pollueurs publiée à tous les six mois,depuis 1990, par le Ministère de l’environnement en Colombie-Britannique qui,parallèlement à cela, poursuit une stratégie traditionnelle de contrôle et de mise enapplication de la réglementation. Les recherches précédentes ont examiné de façonisolée l’impact des mesures traditionnelles de réglementation et l’impact desprogrammes d’information, alors que nous proposons d’étudier simultanément leseffets de ces deux types de mesures. Ce faisant, nous pourrons avoir une idée del’impact « relatif » des mesures traditionnelles et émergentes. Nos résultatssuggèrent que la liste des pollueurs de Colombie-Britannique a eu un impact plusimportant que les poursuites et les amendes traditionnellement émises par lesautorités gouvernementales. Nos résultats montrent également que l’adoption denormes environnementales plus strictes a eu un effet important sur la performanceenvironnementale des usines étudiées.
An increasing number of regulators have adopted public disclosureprograms to create incentives for pollution control. In this paper, we study theimpact of British Columbia’s list of polluters whereby the province’senvironmental regulator reveals the name of plants which are either not complyingwith the regulation or are of concern to the regulator. Simultaneously however, theregulator continues to undertake legal action for those violating the regulation.Previous analyses have focused on studying either the impact of the traditionalmonitoring and enforcement practices or the impact of information programs. Inthis paper, we perform an empirical analysis of the impact of both traditionalenforcement and information strategies within the context of a single program. Wethus provide insights on the relative impact of the traditional (fines and penalties)and emerging (information) enforcement strategies. Our results suggest thatBritish Columbia’s list of polluters has a larger impact on both emissions levelsand compliance status than orders, fines and penalties traditionally imposed by the

Ministry and courts. Our results also demonstrate that the adoption of stricterstandards and penalties had a significant impact on emissions levels.
Mots Clés : Information, réglementation
Keywords : Regulation, information
1
1. Introduction
Issues pertaining to the monitoring and enforcement of environmentalregulations have surprisingly been the object of only recent and still fewempirical analyses.1 An essential issue of interest is the impact of the variousmonitoring and enforcement actions on the environmental performance of theplants. Magat and Viscusi (1990), and Laplante and Rilstone (1996) haveshown that inspections (or the threat of inspections) significantly reduceabsolute levels of water pollution emissions of pulp and paper plants in theUnited States and Canada respectively. Gray and Deily (1996) have shownthat increased enforcement actions in the U.S. steel industry have significantlyreduced non-compliance with air pollution emissions standards. Nadeau(1997) has shown that both inspections and enforcement impact the durationof firms’ violation of air pollution standards in the pulp and paper industry.2
In view of the difficulties associated with the monitoring and enforcement ofenvironmental standards and regulations, an increasing number ofenvironmental regulators around the world have seeked to complement orsupplement traditional enforcement actions (fines and penalties) with theadoption of structured information programs by which the environmentalperformance of polluters is revealed.3 Economists have undertaken empiricalanalyses aimed at measuring the impact of such information programs.4 Theimpact analysed concerns both the reaction of capital markets to the revealedinformation (Hamilton (1995), Konar and Cohen (1997), Lanoie et al. (1998)),and the changes in the environmental performance of plants as a result of theinformation release (Konar and Cohen (1997), Afsah et al. (1997)).5 Whilefew in numbers, it is generally shown in these papers that capital markets react
1 For a comprehensive survey of the (modest) empirical literature, see Cohen (1998). Deily andGray (1991) asserts that their paper is « the first empirical study of the EPA’s enforcementactivity at the plant level. ».2 If traditional monitoring and enforcement strategies appear to impact the environmentalperformance of the plants, it then becomes of further interest to understand the determinants of theregulator’s allocation of resources devoted to implementation. Empirical analyses on this issueinclude Deily and Gray (1991), Dion et al. (1998), Helland (1998) and Nadeau (1997).3 Examples of such programs now abound in both developed (e.g. the Toxics Release Inventoryin the United States) and developing countries (e.g. the ECOWATCH program in thePhilippines).4 It may be useful to distinguish between structured information programs whereby theinformation release is part of a clearly articulated strategy undertaken by the regulator to revealthe environmental performance of plants from unstructured information of the type one finds innewspapers, on a more ad hoc basis.
2
significantly to both positive and negative environmental news, and thataffected firms then markedly improve their environmental performance.
From a policy perspective, a potential weakness of the current body ofempirical analyses is their focus on studying either the impact of thetraditional monitoring and enforcement practices or the impact of informationprograms. It is to be noted that none of the above papers combine an empiricalanalysis of the impact of both traditional enforcement and informationstrategies within the context of a single research effort. In this paper, weaddress this weakness and thus hope to provide insights on the relative impactof the traditional (fines and penalties) and emerging (information)enforcement strategies.
Since July 1990, the Ministry of Environment, Lands and Parks of BritishColumbia, Canada (henceforth MOE) publishes a list of firms that either donot comply with the existing regulation or whose environmental performanceis of concern to the MOE. Simultaneously however, the Ministry continues toundertake legal action for those violating the regulation. These unique featuresallow us to analyse the relative contribution of both types of enforcementactions on the performance of polluters. To do so, we focus on theenvironmental performance of the pulp and paper plants appearing on the list.Our results suggest that British Columbia’s list of polluters has a larger impacton both emissions levels and compliance status than penalties traditionallyimposed by the MOE and courts. However, the analysis also suggests that theadoption of much stricter environmental standards in 1990 accompanied witha 60 fold increase in the maximum level of penalty explains a large proportionof the reduction in the level of emissions and improvement in compliancestatus. Our results imply that both regulation and information explain theenvironmental performance of plants.
In the next section, we briefly describe the institutional and regulatory contextcurrently in place in British Columbia, and the model we purport to test. InSection 3, both the estimation strategy and dataset are described. Results arepresented in Section 4. We briefly conclude in Section 5.
5 Analysis of capital market reactions to unstructured information includes Badrinath andBolster (1996), Dasgupta et al. (1998), Klassen and McLaughlin (1996), Lanoie and Laplante(1994), Muoghalu et al. (1990).
3
2. Context and model
2.1 Context
Industry and regulatory context
Canada is the largest producer of pulp and paper in the world withapproximately 33% of world production. Within Canada, the 23 pulp andpaper plants located in British Columbia account for approximately 30% ofthe Canadian production, with 6.5 million tons of pulp and 1.5 million tons ofpaper produced in 1992. These amounted to a total production value ofapproximately 4 billion dollars (CAN),6 and 8.5% of British Columbia’sGDP.7
Pulp is produced essentially with mechanical and/or chemical processes.Mechanical processes are usually more efficient in terms of the requiredamount of wood input to produce a metric ton of pulp. However, the processproduces a fiber of lesser quality than chemical processes. These latter onesare therefore usually preferred. Both sulfite and kraft are chemical pulpproduction processes. Sulfite processes produce pulp of high quality whichneeds to be washed, but does not require a bleaching of the pulp. However,sulfite processes involve high production costs mainly because of theimpossibility to recover the chemicals used in the process. Kraft processesproduce pulp of very high quality. Moreover, kraft offers the possibility ofchemical recovery thus making it less expensive to use than sulfite processes.However, kraft processes produce a pulp of a darker color ; this makes itnecessary for the pulp to be bleached before being sent to paper machine. Thewashing and bleaching steps of the production process are important sourcesof pollution : washing produces large amount of biological oxygen demand(BOD) and total suspended solids (TSS), while bleaching further producesdioxins and furans used to bleach the dark pulp. If the industry is a majorcontributor to British Columbia's economic activity, it is also one of the mostimportant sources of pollution.
In Canada, jurisdiction over water pollution control (and more generally overpollution control) is shared by the federal and provincial governments. Thebasis of the overlap relies on the Constitution Act of 1867.8 Insofar as water
6 In 1992, 1 $ CAN was approximately worth 0.75 $ US.7 Province of British Columbia (1993).8 The involvement of the federal government in matters of environmental protection is madepossible through its jurisdiction over fisheries, harbours, criminal law, and its residual power tolegislate for the peace, order and good government of Canada. The appropriate roles and
4
pollution is concerned, the Federal government has played an important rolethrough its Fisheries Act9 under which Pulp and Paper Effluent Regulations10
were first introduced in 1971. However, these Federal regulations weredevised in a way that resulted in the bulk of the pulp and paper plants inBritish Columbia being outside the realm of the regulation, and therefore nothaving to comply with any of the regulatory standards defined in the Federalregulations.
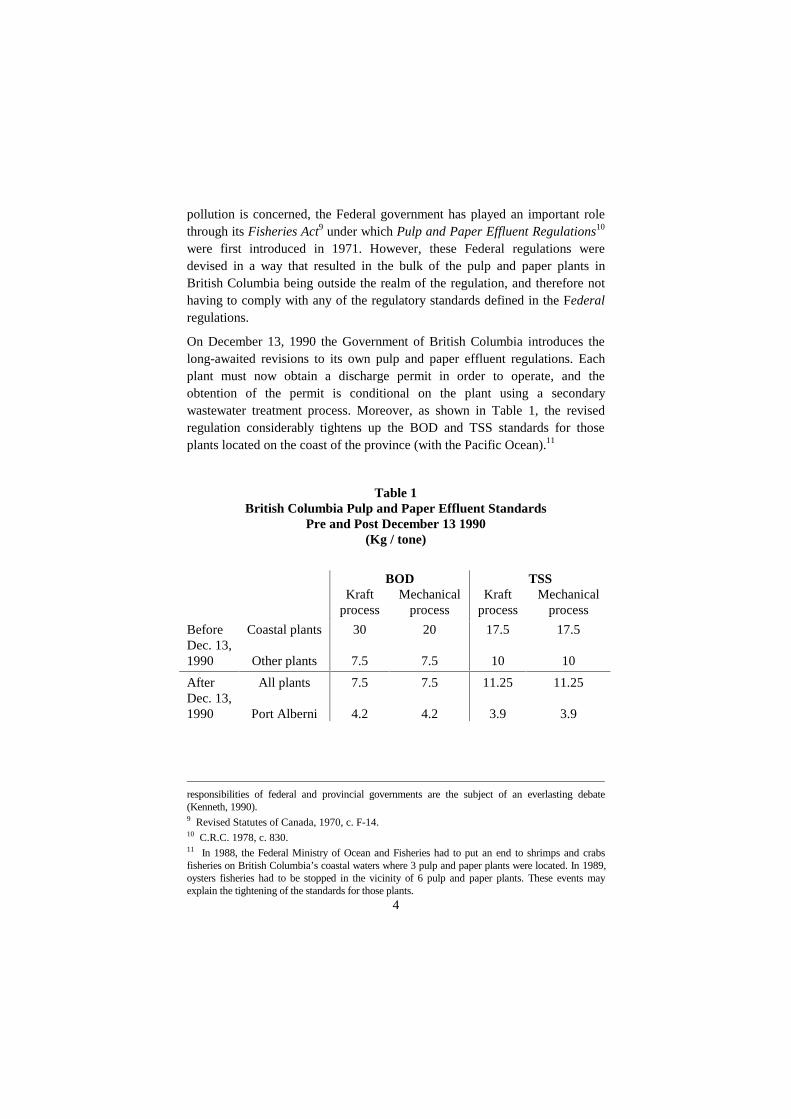
On December 13, 1990 the Government of British Columbia introduces thelong-awaited revisions to its own pulp and paper effluent regulations. Eachplant must now obtain a discharge permit in order to operate, and theobtention of the permit is conditional on the plant using a secondarywastewater treatment process. Moreover, as shown in Table 1, the revisedregulation considerably tightens up the BOD and TSS standards for thoseplants located on the coast of the province (with the Pacific Ocean).11
Table 1British Columbia Pulp and Paper Effluent Standards
Pre and Post December 13 1990(Kg / tone)
BOD TSSKraft
processMechanical
processKraft
processMechanical
process
BeforeDec. 13,1990
Coastal plants
Other plants
30
7.5
20
7.5
17.5
10
17.5
10
AfterDec. 13,1990
All plants
Port Alberni
7.5
4.2
7.5
4.2
11.25
3.9
11.25
3.9
responsibilities of federal and provincial governments are the subject of an everlasting debate(Kenneth, 1990).9 Revised Statutes of Canada, 1970, c. F-14.10 C.R.C. 1978, c. 830.11 In 1988, the Federal Ministry of Ocean and Fisheries had to put an end to shrimps and crabsfisheries on British Columbia’s coastal waters where 3 pulp and paper plants were located. In 1989,oysters fisheries had to be stopped in the vicinity of 6 pulp and paper plants. These events mayexplain the tightening of the standards for those plants.

5
While the effluent standards were location specific (coastal vs non-coastal)and process specific (kraft vs mechanical), homogeneous standards wereintroduced in 1990, with all plants but one having to comply with the sameeffluent standards, irrespective of their location and production process. Notethat the standards were considerably tighter for those plants located on thecoastal zone. Standards became effective over a period of 3 years, and allplants had to comply with the new standards by 1994.
Simultaneously with the adoption of the revised regulation, the MOE seekedto increase incentives for abatement and compliance with the new set ofstandards. As a result, the maximum fines for offences under the WasteManagement Act increased from 50 000 $ (CAN) to 3 million $. At the sametime, the MOE declares its commitment to pursue its recently devised strategyto publicize, twice a year, the name of plants falling short of an adequateenvironmental performance.
British Columbia’s list of polluters
On July 13 1990, the MOE of British Columbia released for the first time (inBritish Columbia and in Canada) a list of industrial operations (andmunicipalities) which were either not complying with their waste managementpermits or which were deemed by the Ministry to be a potential pollutionconcern. The Minister then declared that
the release of this material is a clear indication of ourgovernment’s intention to deal forthrightly and decisivelywith pollution concerns. (MOE, Press Release, July 13,1990)
For each entry, the following information is provided : Name of the firm ;location ; type of concern (e.g. mining operation effluent, pulp mill effluent,sawmill emissions) ; the reason(s) for which the firm is on the list ; and thenumber of times the firm has been on the list (e.g. second time onnoncompliance report ; fourth time on the list).
In order to be listed in the non-compliance section of the list, a firm needs tobe significantly out of compliance with its permit requirements and standards.Typical entries (reasons) in this section of the list are of the following nature :
- Exceeded permit limits for total suspended solids in July,August, and September ;
6
- Exceeded permit limits for maximum and average totalsuspended solids in October, for biological oxygen demand3 of 13 days in November and for pH two days inDecember ;
- Exceeded permit limit for opacity for 4 of 6 months ;
- Incomplete submission of monitoring data.
Operations of concern to the Ministry were defined as « operations some ofwhich are technically in compliance and others where permits do not exist orare not required but which by their nature cause concern to the Ministry. »(Press Release, July 13, 1990). Typical entries in this section were of thefollowing nature :
- Concern with possible impact of effluent on Kitimat River,especially at low river flows ;
- Close proximity of landfill leachate to fish bearing streams ;
- Odor problem related to the emission of sulphur gases fromthe effluent treatment system ;
- Numerous spills and bypasses ;
- Grizzly bears attracted by the disposal of waste at the locallandfill.
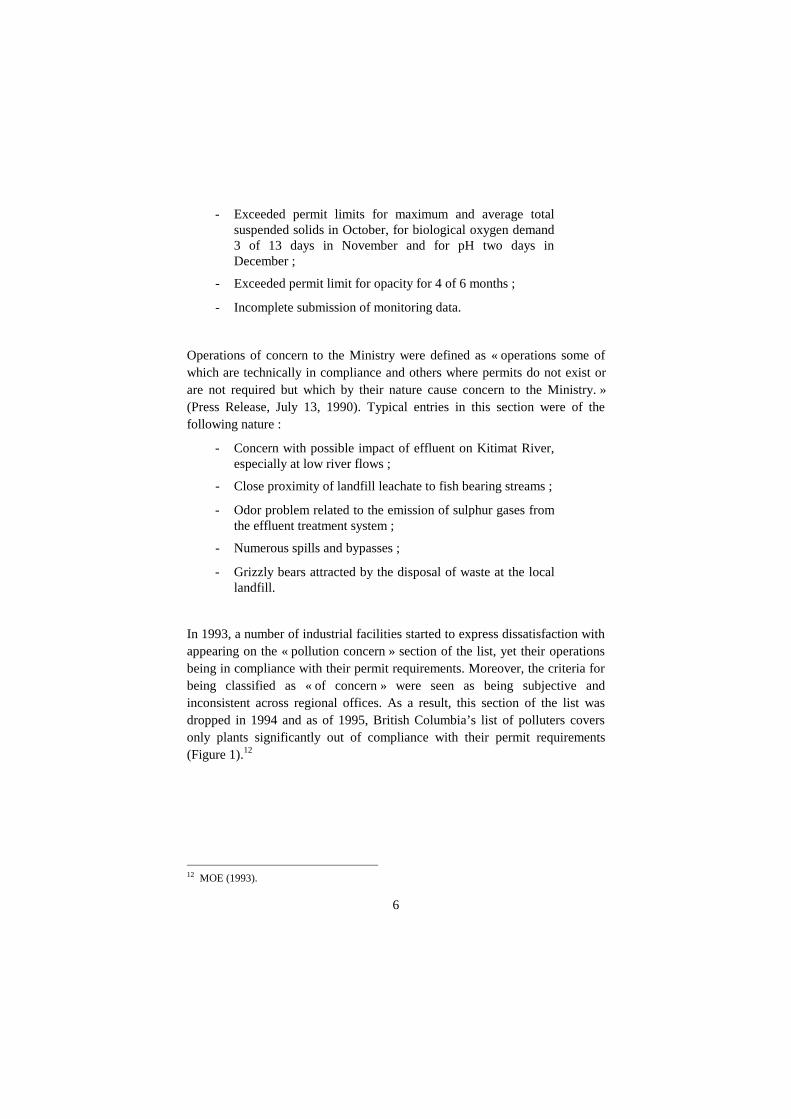
In 1993, a number of industrial facilities started to express dissatisfaction withappearing on the « pollution concern » section of the list, yet their operationsbeing in compliance with their permit requirements. Moreover, the criteria forbeing classified as « of concern » were seen as being subjective andinconsistent across regional offices. As a result, this section of the list wasdropped in 1994 and as of 1995, British Columbia’s list of polluters coversonly plants significantly out of compliance with their permit requirements(Figure 1).12
12 MOE (1993).
7
Figure 1Total number of citations « Of concern » vs « Out of compliance »
1990-1996
2.2 Model
Following the traditional paradigm for analyzing pollution control issues, theregulator is expected to set and enforce rules of environmental behavior. Inkeeping with this understanding of the problem, the policy analysis literaturehas focused on appropriate roles for ‘ex ante’ regulation (standards vs.market-based instruments) and ‘ex post’ liability claims by injured parties.This conventional policy discussion has focused almost exclusively oninteractions between the regulator and the plant. However, recent research hassuggested powerful roles for two additional agents : the community and themarket. Indeed, recent evidence throughout the world suggests thatneighboring communities can have a powerful influence on plants’environmental performance (Blackman and Bannister, 1998 ; Pargal and
0
50
100
150
200
250
300
90 91 92 93 94 95 96
YearsNON-COMPLIANCE OF-CONCERN

8
Wheeler, 1996). Communities which are richer, better educated, and moreorganized find many ways of enforcing environmental norms. Where formalregulators are present, communities use the political process to influence thetightness of enforcement. Where formal regulators are absent or ineffective,‘informal regulation’ is implemented through community groups or NGOs.
Moreover, firms operate in local, national and international markets, wheremany agents can affect revenues and costs. Environmental considerations nowaffect the decisions of many of these agents. With the worldwide advent ofenvironmental legislation, investors are increasingly scrutinizingenvironmental performance. Among other factors, they have to weigh thepotential for financial losses from regulatory penalties and liabilitysettlements. In recent years, the importance of investor interest has beenincreased by the growth of new stock markets and the internationalization ofinvestment. For similar reasons, international and local suppliers of financing,industrial equipment, and engineering services are increasingly reluctant to dobusiness with firms known as being large polluters or experiencing problemswith environmental regulations. Recent evidence from both the OECD anddeveloping countries suggests that environmental reputation matters for firmswhose expected costs or revenues are affected by judgments of environmentalperformance by customers, suppliers, and stockholders.13
Once we introduce a world of multiple agents (and consequently multipleincentives), there may be a need to rethink the regulator’s appropriate role inpollution management. It may be that this role is no longer confined toproducing, monitoring and enforcing rules and standards. Instead, theregulator can gain leverage through non-traditional programs which harnessthe power of communities and markets. In this context, there may be ampleroom for information-oriented approaches such as the public disclosure ofplants’ environmental performance.
The notion that such a role exists has certainly gained support amongenvironmental policy-makers. Despite this widespread acceptance of a role forthe regulator to provide environmental information, the normative foundationsfor a public intervention of that nature have not been formally studied. Inparticular, the question of whether and under what circumstancesenvironmental information should be publicly provided has not beenadequately addressed.14
13 See Cohen (1998) for a thorough review of these studies.14 An exception is Kennedy et al. (1994).

9
From an empirical perspective, the impact of existing public disclosureprograms on the environmental performance of the plants largely remains tobe tested. To our knowledge, only Hamilton (1995) and Konar and Cohen(1997) have proceeded to a formal econometric analysis of this impact ; bothof their studies however are based on the U.S. EPA’s Toxics ReleaseInventory (TRI). We do not know of any other formal analysis of other publicdisclosure programs.15 Moreover, given the characteristics of the TRIprogram, these authors are unable to account for the impact of the publicdisclosure strategy relative to traditional form of prosecutions, fines, andpenalties. In this context, it becomes difficult to determine whether or notinformation can be an effective regulatory mechanism relative to traditionalforms of enforcement actions. As pointed out by Konar and Cohen(1997), « before information remedies are used more frequently as regulatorymechanisms, we need to understand how they work and what effect they haveon firm behavior ».
Hence, while recent literature appears to indicate a role for public disclosureprograms, it is not yet clear whether or not these programs should complementor supplement traditional forms of enforcement. In particular, once theregulator can pursue court actions, fines, and penalties as they typically havedone with the enactment of environmental regulations, is there still a role forpublic disclosure? Can public disclosure create further incentives for pollutioncontrol? Given recent research, the model we therefore proceed to test in thispaper is of the following nature :
Pollution = f (Regulation, Traditional Enforcement, Public disclosure, X)
where X is a vector of control variables. In the next section, we proceed todetail our estimation strategy and dataset.
15 Afsah et al. (1997) provide statistical evidence of the impact of Indonesia’s public disclosureprogram known as PROPER. However, the available information limited them to conduct an exante – ex post analysis. They show that the plants object to the first public disclosure in 1995reduced their emissions of BOD by approximately 45% within a period of 18 months.
10
3. Estimation strategy and dataset
For the purpose of our empirical analysis, we use plant-level yearly data fromthe pulp and paper industry since this industry has a long history ofenvironmental regulation and generally offers the best availability ofemissions data.16
Over the period 1987-1996, 24 pulp and paper plants were in operation inBritish Columbia. After discussion with the MOE, 4 plants were excludedsince their manufacturing processes were hardly comparable with those of theother plants. Five other plants were dropped since MOE’s files wereincomplete, especially over the period 1987-1990.
Let us turn to the variables used to estimate our model. The definition, mean,and standard deviation of the variables are provided in Table 2. The datasetwas entirely provided by the MOE. Most of the data came from public reports.However, data on emissions and limits was provided to us upon specialrequest, and involved a manual investigation of a large number of files.
The analysis is performed for both BOD and TSS. For each of them, we usetwo different ways of defining the dependent variable, as was used in Laplanteand Rilstone (1996) : the absolute level of pollution (ABSBOD, ABSTSS),and a measure of the level of compliance with the emissions standards(COMPBOD, COMPTSS), which is defined as : (actual emissions –allowable emissions) / allowable emissions.17
16 Magat and Viscusi (1990), Laplante and Rilstone (1996), Dion et al. (1998), Lanoie et al.(1998) also use the pulp and paper industry for a similar reason.17 Allowable emissions (kg / day) are calculated as : emissions standards (kg / tonne) times dailyproduction (tonnes / day).
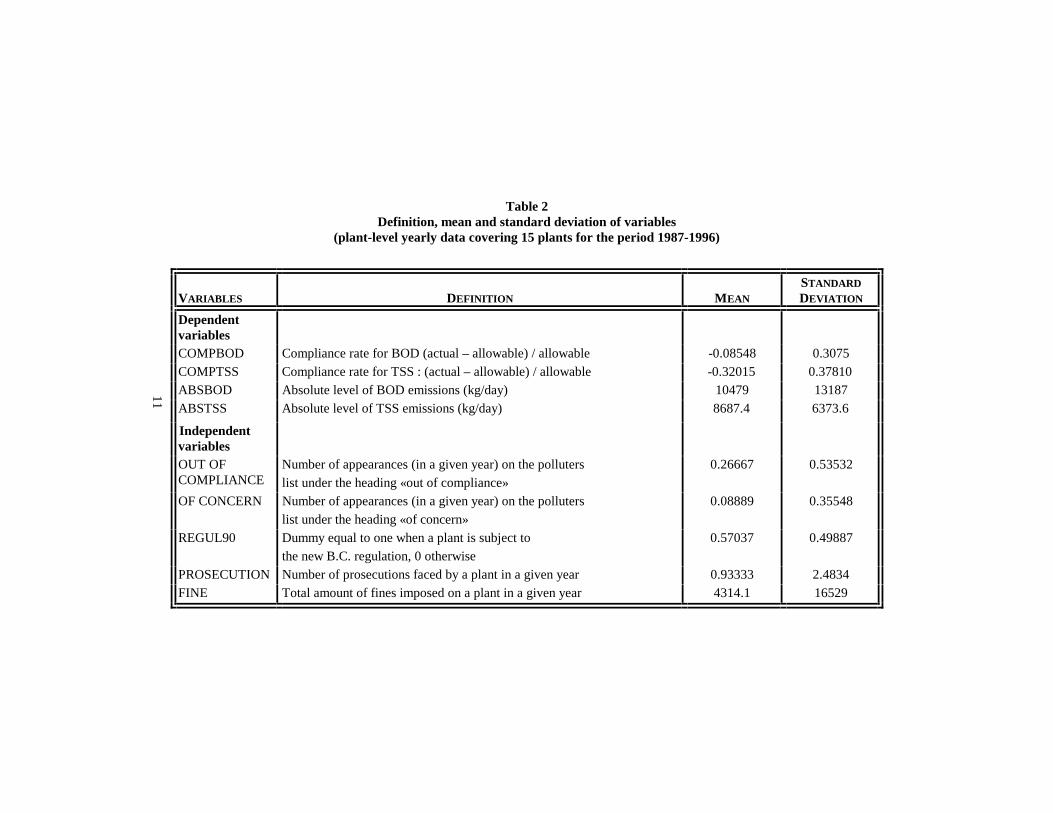
Table 2Definition, mean and standard deviation of variables
(plant-level yearly data covering 15 plants for the period 1987-1996)
VARIABLES DEFINITION MEAN
STANDARD
DEVIATION
DependentvariablesCOMPBOD Compliance rate for BOD (actual – allowable) / allowable -0.08548 0.3075COMPTSS Compliance rate for TSS : (actual – allowable) / allowable -0.32015 0.37810ABSBOD Absolute level of BOD emissions (kg/day) 10479 13187ABSTSS Absolute level of TSS emissions (kg/day) 8687.4 6373.6
IndependentvariablesOUT OFCOMPLIANCE
Number of appearances (in a given year) on the polluterslist under the heading «out of compliance»
0.26667 0.53532
OF CONCERN Number of appearances (in a given year) on the polluterslist under the heading «of concern»
0.08889 0.35548
REGUL90 Dummy equal to one when a plant is subject tothe new B.C. regulation, 0 otherwise
0.57037 0.49887
PROSECUTION Number of prosecutions faced by a plant in a given year 0.93333 2.4834FINE Total amount of fines imposed on a plant in a given year 4314.1 16529
11
2
Table 2 (cont’d)
VARIABLES DEFINITION MEAN
STANDARD
DEVIATION
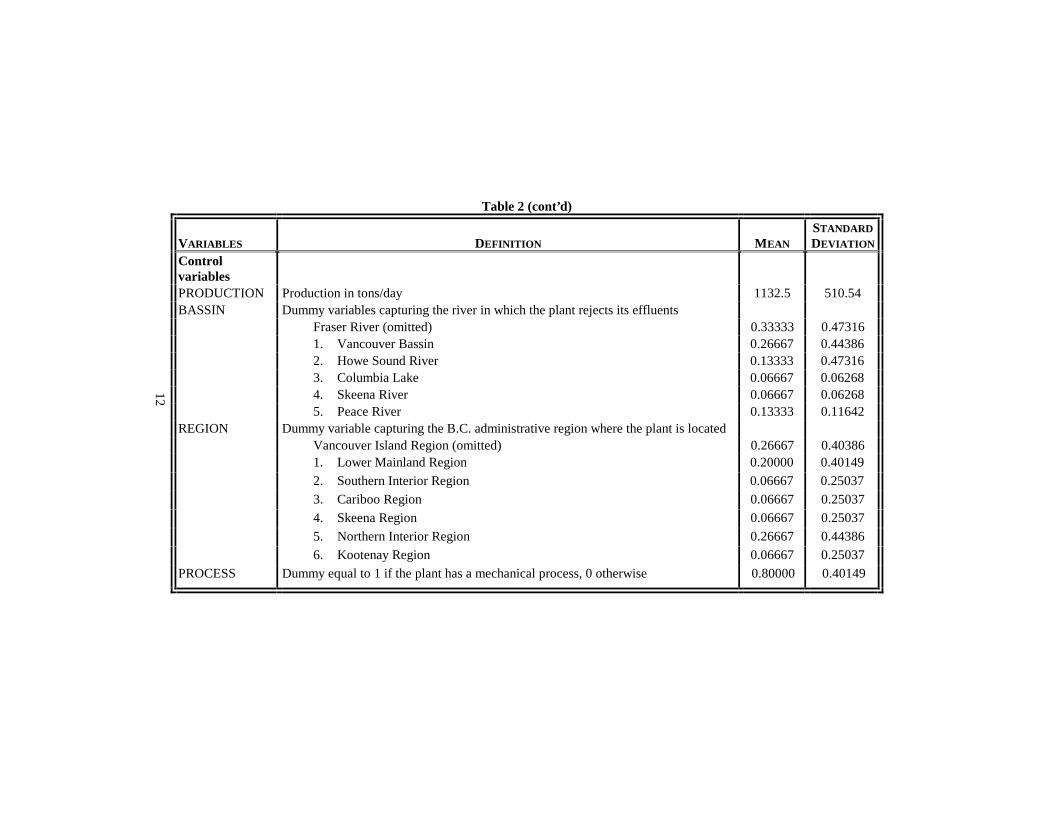
ControlvariablesPRODUCTION Production in tons/day 1132.5 510.54BASSIN Dummy variables capturing the river in which the plant rejects its effluents
Fraser River (omitted) 0.33333 0.473161. Vancouver Bassin 0.26667 0.443862. Howe Sound River 0.13333 0.473163. Columbia Lake 0.06667 0.062684. Skeena River 0.06667 0.062685. Peace River 0.13333 0.11642
REGION Dummy variable capturing the B.C. administrative region where the plant is locatedVancouver Island Region (omitted) 0.26667 0.403861. Lower Mainland Region 0.20000 0.40149
2. Southern Interior Region 0.06667 0.25037
3. Cariboo Region 0.06667 0.25037
4. Skeena Region 0.06667 0.25037
5. Northern Interior Region 0.26667 0.44386
6. Kootenay Region 0.06667 0.25037
PROCESS Dummy equal to 1 if the plant has a mechanical process, 0 otherwise 0.80000 0.40149
12

13
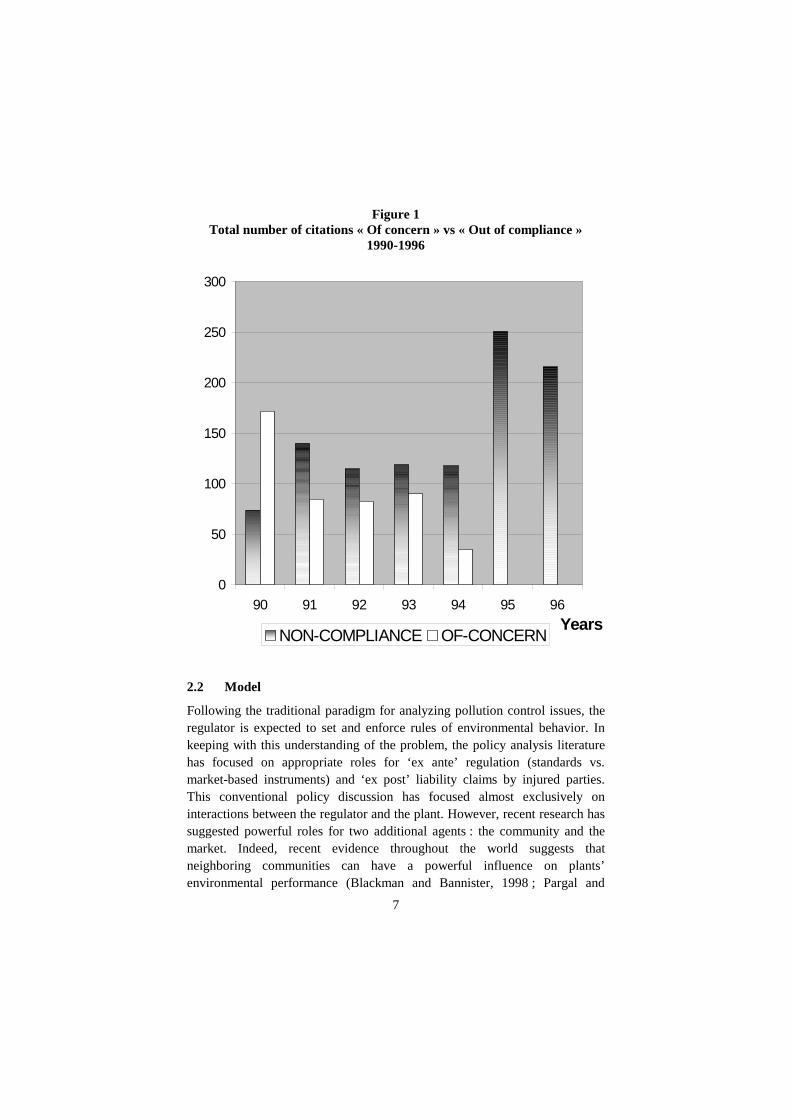
Observe in Figure 2 that emissions levels fell considerably over theperiod of analysis and that compliance rate significantly improved.
Figure 2Actual emissions and limits
0,00
5,00
10,00
15,00
20,00
25,00
87 88 89 90 91 92 93 94 95 96Years
kg/t
BOD kg/t TSS kg/tlimit BOD limit TSS
Our independent variables capture the appearance of the plants on the list ofpolluters, the tightening of the standards in 1990, and the prosecutions andfines imposed on the plants over the period of analysis. As explainedpreviously, until 1994, the lists were divided into two categories : of concernand out of compliance. Accordingly, we have two variables to capture theappearance of the plants on these lists. Since two lists are published everyyear, and since we are using yearly data, we define the variable OFCONCERN as the number of times a plant has appeared on the lists under thisheading in a given year (OUT OF COMPLIANCE is defined the same way).We also lag these variables to allow the plants some time to react to theirappearance on the lists18. In our sample, only one plant never appeared on any
18 As in Magat and Viscusi (1990) and Lanoie (1992), the use of a lagged policy variable may bejustified to avoid any simultaneity problem.

14
list, while another has appeared only once under the OF CONCERN category.On the contrary, two plants have appeared seven times each on the thirteenlists that were available (six times under the OUT OF COMPLIANCEcategory).
The variable PROSECUTION is defined as the number of prosecutionsagainst a plant in a given year, while FINE is the total amount of finesimposed on a plant in a given year. These variables are lagged to allow forsome time of reaction. From 1987 to 1996, there were 126 prosecutionsagainst the plants in our sample, but only 17 of these resulted in a fine beingimposed ; these fines totaled 582 400 $.
A dummy variable, REGUL90, captures the introduction of the more stringentregulation in 1990. As mentioned earlier, the regulation became effective overthe period 1991–1994. Hence, the variable REGUL90 takes the value 1starting only during the exact year each plant was to operate under the newregulation.
We also include a number of CONTROL VARIABLES. As in Magat andViscusi (1990) and Laplante and Rilstone (1996), a LAGGED DEPENDENTVARIABLE is introduced to serve as a proxy for the firm’s stock of capitalrelated to pollution control and for the general character of its abatementtechnology. Firms with high levels of pollution in the past are likely tocontinue to have high levels in the future because the nature of theirtechnology makes it costly to achieve pollution reductions.
We were able to account for the actual level of plants’ PRODUCTIONthrough a calculation performed using two sets of pollution limits. Indeed, theMOE produces two series of limits : one expressed in terms of kilograms/tonsand another one expressed in terms of kilograms/day. Given that we wereprovided with the two series, it was easy to calculate a measure of productionexpressed in terms of tons/day. To our knowledge, this is the first time ameasure of the real production is used in a study on pollution levels. Previousauthors, such as Magat and Viscusi (1990) and Laplante and Rilstone (1996),used a measure based on plants’ production capacity. During the period understudy, the average production followed a somewhat erratic path : a sharpincrease was observed in the first three years (1987-1990), followed by animportant reduction in the 1990-91 recession, then followed by a steadyincrease until 1996.
Two sets of variables are introduced to capture the localisation of the plants :BASSIN and REGION. BASSIN refers to the river in which each plant rejectsits pollutants, while REGION refers to the B.C. administrative region where
15
the plant is situated. Localisation variables are useful to account for aspectssuch as varying importance of the ecologist lobby across regions, orpotentially different levels of monitoring across regions. These differencesmay be due, among other things, to the level of deterioration of the localecosystems (Pargal and Wheeler (1996), Dion et al. (1998)).
Finally, a dummy variable is included to account for the pulp PRODUCTIONPROCESS of the mill. Our PROCESS variable is equal to one when themechanical process is used. Its coefficient is expected to be negative.
4. Empirical results
The estimations are performed using a generalized least-squares (GLS)procedure based on the cross-sectionnally and time-wise autoregressive modelpresented in Kmenta (1986, pp.616-625)19. Table 3 and 4 present the resultspertaining to BOD and TSS respectively. Each table includes eightspecifications, four using the compliance rate as the dependent variable andfour using the absolute level of pollutant. For each dependent variable, thevarious specifications allow for different sets of localisation variables, and forlagged or contemporaneous environmental policy variables20. Overall, theexplanatory power of the different specifications is satisfactory, and the resultsare fairly stable across specifications.
The appearance of a plant on the list under the heading OUT OFCOMPLIANCE has a contemporaneous impact on both pollutants. Indeed, allcoefficients of the variable OUT OF COMPLIANCE, except one, are negativeand significant. For BOD, the appearance on the list leads to an improvementof 0.063 in the compliance rate, and to a reduction in the absolute level ofemissions in the range of 1111-1164 kg/day. For TSS, the appearance on thelist leads to an improvement of the compliance rate of 0.094, and to areduction in the absolute level of emissions in the range of 1225-1261 kg/day.
19 Initial tests showed the presence first-order serial correlation and of heteroskedasticity.20 Other attempts were made using a time trend, fixed effects or the plants’ age as additionalindependent variables. Their inclusion did not improve significantly the explanatory power of ourregressions as confirmed by log-likelihood ratio tests.

13
Table 3: REGRESSION RESULTS – BODCoefficients (t-statistics)
1 2 3 4 5 6 7 8Dependent variables COMPBOD COMPBOD COMPBOD COMPBOD ABSBOD ABSBOD ABSBOD ABSBOD
R SQUARE 0.8947 0.8896 0.9030 0.9002 0.8852 0.8824 0.8841 0.8823COMPBOD(1) b 0.60685
(13.71)*0.57159(12.94)*
0.64456(14.62)*
0.60413(13.53)*
ABSBOD(1) 0.65556(12.97)*
0.64247(13.17)*
0.66219(13.04)*
0.64804(13.27)*
PRODUCTION -0.67E-04(-1.179)
-0.89E-04(-1.59)
-0.79E-04(-1.477)
-0.11E-03(-2.094)*
1.1544(0.292)
1.5326(1.279)
1.2197(0.234)
1.6450(1.434)
PROSECUTION 0.26E-02(0.2972)
0.35E-02(0.4021)
63.552(0.5223
80.709(0.6493)
PROSECUTION(1) -0.16E-02(-0.1637)
-0.30E-03(-0.033)
-68.518(-0.5573)
-66.051(-0.5244)
FINE 0.66E-06(0.4134)
0.78E-06(0.4725)
-0.31E-01(-1.78)**
-0.32E-01(-1.80)**
FINE(1) -0.29E-05(-1.938)*
-0.33E-05(-2.033)*
-0.25E-01(-1.560)
-0.25E-01(-1.494)
REGUL90 -0.17193(-3.882)*
-0.17191(-3.774)*
-0.15814(-3.828)*
-0.16664(-3.981)
-4310(-5.045)*
-4511.1(-5.194)*
-3799.6(-4.484)*
-4046(-4.708)*
OF CONCERN 0.53E-020.1215)
0.14E-01(0.3187)
-1098(-1.231)
-1059.6(-1.19)
OF CONCERN(1) -0.12E-01(-0.2727)
-0.39E-01(-0.8782)
-329.93(-0.3823)
-250.39(-0.2893)
OUT OF COMPLIANCE -0.63E-01(-1.85)**
-0.48E-01(-1.318)
-1164.4(-2.032)*
-1111.4(-1.91)**
OUT OFCOMPLIANCE(1)
-0.26E-01(-0.6968)
-0.31E-01(-0.8509)
-262.08(-0.3993)
-175.90(-2684)
16

14
PROCESS -0.14426(-2.183)*
-0.16612(-2.229)*
-0.12587(-1.850)*
-0.14222(-1.87)**
-1490(-1.056)
-2389.1(-1.72)**
-1331.5(-0.9626)
-2295.7(-1.69)**
REGION 1 -0.48E-01(-0.7489)
-0.39E-01(-0.5940)
-1044(-0.6878)
-645.30(-0.4414)
REGION 2 -0.30E-01(-0.3371)
-0.36E-01(-0.4686)
-1657.1(-0.9010)
-1261.3(-0.7071)
REGION 3 -0.28424(-1.11)
-0.37233(-1.34)
-2323.7(-1.141)
-2126.2(-1.079)
REGION 4 0.84E-02(0.60E-01)
-0.97E-02(-0.1005)
927.22(0.4213)
679.14(0.2820)
REGION 5 0.48E-01(0.9108)
0.16E-01(0.2944)
-683.79(-0.5187)
-482.87(-0.3810)
REGION 6 0.65635(1.410)
0.47485(0.9113)
473.26(0.2119)
331.74(0.1429)
BASSIN 1 0.27E-01(0.5328)
0.38E-01(0.8045)
1799.4(1.336)
1623.4(1.238)
BASSIN 2 0.16573(0.9922)
0.16561(1.121)
212.56(0.1913)
384.44(0.3604)
BASSIN 3 0.78573(1.659)**
0.63661(1.193)
1907.4(0.9609)
1548(0.7398)
BASSIN 4 0.24E-01(0.1727)
0.24E-01(0.2563)
2278.8(1.134)
1803.8(0.8050)
BASSIN 5 0.40E-01(0.4148)
-0.92E-02(-0.0985)
1852.5(1.051)
1906.8(1.143)
CONSTANT -0.32E-02(-0.3E-01)
-0.15E-01(-0.1582)
0.34E-01(0.3339)
0.34E-01(0.3939)
4481.3(1.859)**
3089.8(1.667)**
3587.8(1.515)
2438.6(1.345)
Fischer test 24.41* 24.41* 24.81* 25.71* 23.00* 24.36* 23.29* 24.79*LIKELIHOOD RATIOTEST
190.93* 188.86* 197.88* 196.03* 93.57* 91.61* 89.98* 87.88*
* significant at 5%, ** significant at 10% ; b (1) means that the variable has been lagged one year
17

15
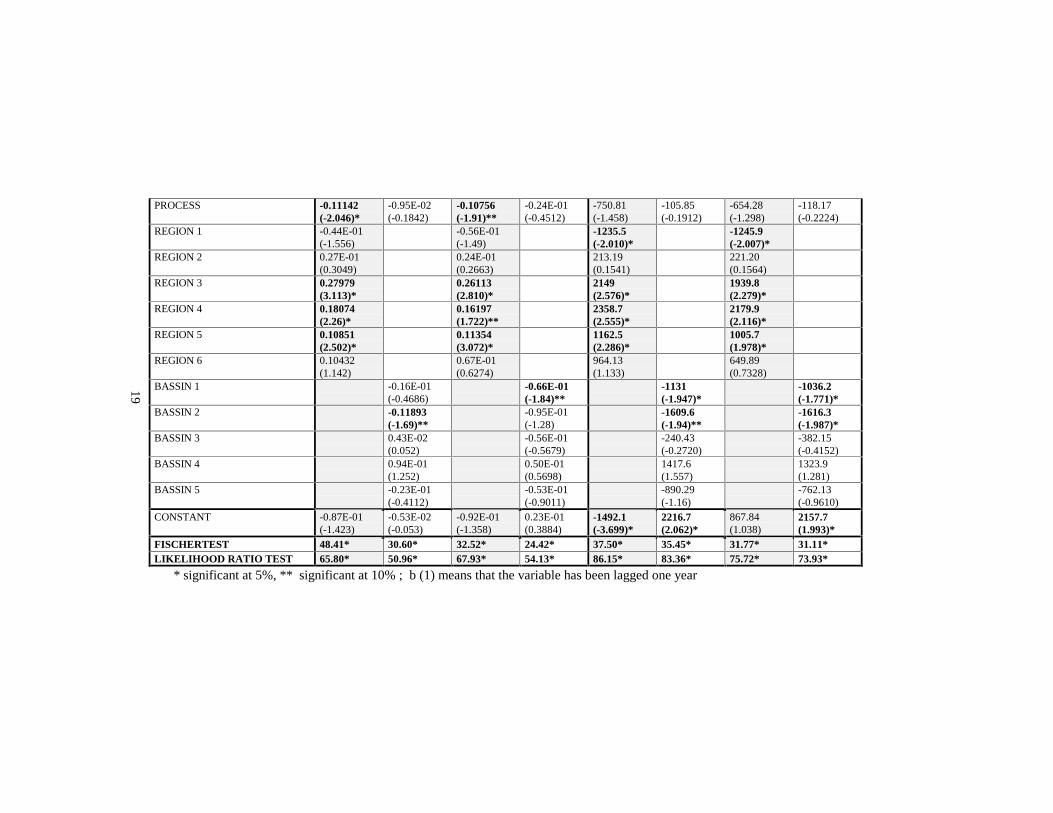
TABLE 4: REGRESSION RESULTS – TSSCoefficients (t-statistics)
9 10 11 12 13 14 15 16Dependent variables COMPTSS COMPTSS COMPTSS COMPTSS ABSTSS ABSTSS ABSTSS ABSTSS
R SQUARE 0.9679 0.9194 0.9328 0.9053 0.9477 0.9380 0.9439 0.9358COMPTSS(1) b 0.60324
(11.43)*0.75797(14.63)*
0.61274(9.397)*
0.72925(11.82)*
ABSTSS(1) 0.62004(12.33)*
0.63228(11.10)*
0.58671(11.38)*
0.60083(10.38)*
PRODUCTION -0.56E-04(-1.924)**
-0.62E-04(-1.729)*
-0.50E-04(-1.473)
-0.57E-04(-1.499)
2.4796(3.908)*
1.6780(2.431)*
2.7832(4.357)*
2.1067(3.058)*
PROSECUTION -0.18E-02(-0.4848)
-0.26E-02(-0.4436)
1.2534(0.0155)
-23.552(-0.2872)
PROSECUTION(1) -0.45E-02(-0.9946)
-0.37E-02(-0.6278)
-35.591(-0.4583)
-62.611(-0.7571)
FINE 0.16E-05(1.553)
0.21E-05(1.877)**
0.52E-02(0.4768)
0.24E-02(0.2018)
FINE(1) -0.93E-06(-1.393)
-0.84E-06(-0.9770)
-0.14E-03(-0.014)
0.58E-03(0.0508)
REGUL90 -0.70E-01(-2.503)*
-0.23E-01(-0.8591)
-0.69E-01(-2.392)*
-0.41E-01(-1.263)
-1492.1(-3.699)*
-1291.4(-3.139)*
-1909.6(-4.628)*
-1745.2(-4.165)*
OF CONCERN -0.48E-01(-2.296)*
-0.69E-01(-1.95)**
-33.697(-0.087)
43.531(0.1020)
OF CONCERN(1) -0.26E-01(-0.7079)
-0.32E-01(-0.7600)
-346.53(-0.9288)
-325.81(-0.8024)
OUT OF COMPLIANCE -0.93E-01(-3.914)*
-0.95E-01(-3.123)*
-1261.2(-3.588)*
-1225.1(3.413)*
OUT OF COMPLIANCE(1) -0.38E-01(-1.367)
-0.45E-01(-1.381)
-495.98(-1.203)
-482.26(-1.139)
18
16
PROCESS -0.11142(-2.046)*
-0.95E-02(-0.1842)
-0.10756(-1.91)**
-0.24E-01(-0.4512)
-750.81(-1.458)
-105.85(-0.1912)
-654.28(-1.298)
-118.17(-0.2224)
REGION 1 -0.44E-01(-1.556)
-0.56E-01(-1.49)
-1235.5(-2.010)*
-1245.9(-2.007)*
REGION 2 0.27E-01(0.3049)
0.24E-01(0.2663)
213.19(0.1541)
221.20(0.1564)
REGION 3 0.27979(3.113)*
0.26113(2.810)*
2149(2.576)*
1939.8(2.279)*
REGION 4 0.18074(2.26)*
0.16197(1.722)**
2358.7(2.555)*
2179.9(2.116)*
REGION 5 0.10851(2.502)*
0.11354(3.072)*
1162.5(2.286)*
1005.7(1.978)*
REGION 6 0.10432(1.142)
0.67E-01(0.6274)
964.13(1.133)
649.89(0.7328)
BASSIN 1 -0.16E-01(-0.4686)
-0.66E-01(-1.84)**
-1131(-1.947)*
-1036.2(-1.771)*
BASSIN 2 -0.11893(-1.69)**
-0.95E-01(-1.28)
-1609.6(-1.94)**
-1616.3(-1.987)*
BASSIN 3 0.43E-02(0.052)
-0.56E-01(-0.5679)
-240.43(-0.2720)
-382.15(-0.4152)
BASSIN 4 0.94E-01(1.252)
0.50E-01(0.5698)
1417.6(1.557)
1323.9(1.281)
BASSIN 5 -0.23E-01(-0.4112)
-0.53E-01(-0.9011)
-890.29(-1.16)
-762.13(-0.9610)
CONSTANT -0.87E-01(-1.423)
-0.53E-02(-0.053)
-0.92E-01(-1.358)
0.23E-01(0.3884)
-1492.1(-3.699)*
2216.7(2.062)*
867.84(1.038)
2157.7(1.993)*
FISCHERTEST 48.41* 30.60* 32.52* 24.42* 37.50* 35.45* 31.77* 31.11*LIKELIHOOD RATIO TEST 65.80* 50.96* 67.93* 54.13* 86.15* 83.36* 75.72* 73.93*
* significant at 5%, ** significant at 10% ; b (1) means that the variable has been lagged one year
19

20
The significance of the contemporaneous OUT OF COMPLIANCE variableand not of the lagged variable is not necessarily surprising given that there aregenerally two lists a year (in certain years, the first list was published inJanuary). The appearance on the list under the heading OF CONCERN seemsto have no impact on pollution, which may suggest that the MOE may havebeen correct to eliminate this category in 1994.
The variable capturing the major change in regulation REGUL90 is almosteverywhere negative and significant. The impact of this new regulation isstrong : improvement in the compliance rate of 0.158 for BOD and of 0.07 forTSS ; reduction of the level of emissions in the range of 3800-4511 kg/day forBOD and in the range of 1291–1909 kg/day for TSS.
As discussed earlier, such a change in limits leads to an increase the expectedprobability of being caught in non-compliance with the negative consequencesthat may follow for firms. Plants’ reactions to the new limits have beenimportant ; as shown in Figure 2, plants had a better rate of compliance at theend of the period with stricter limits than at the beginning of the period whenlimits were less stringent. Discussions with MOE officials led us to believethat, with the new limits, all firms had to be equipped with « state-of-the-art »abatement technologies (secondary treatment), which have been installed inonly few recent plants before the new regulation was adopted.
PROSECUTIONS have no impact on either types of pollutants, while laggedFINES lead to an improvement in the BOD compliance rate (elasticity in the-0.15 / -0.17 range). It is instructive to compare the magnitude of the impact offines versus appearing as being « out of compliance ». Can it be said whetherthe « information approach » has a greater or a smaller impact than thetraditional enforcement mechanisms? It is difficult to compare the coefficientsof these variables given that the FINE variable is continuous and can beinterpreted through the calculation of a conventional elasticity, while the OUTOF COMPLIANCE variable is a non-continuous dummy variable.Nevertheless, three observations can be made.
First, the appearance on the out of compliance list has an impact on both typesof pollutants (expressed either in absolute terms or in terms of compliancerate), while the fines only have an effect on the BOD compliance rate (and noton absolute emissions levels). Second, our coefficients indicate that doublingthe average size of the fines would lead to an improvement in the BODcompliance rate of approximately 15 %, i.e. a reduction of 0.013 in thecompliance rate ; on the other hand, an additional appearance on the OUT OFCOMPLIANCE list leads to a reduction of 0.063 in the BOD compliance rate.

21
Third, the fact that lagged FINES variable is significant, while it is thecontemporaneous OUT OF COMPLIANCE variable that is significant, maysuggest that lists of worste polluters can provide a stronger incentive thanconventional enforcement measures for a quick response to correct adamageable situation. Altogether, these three observations suggest that theB.C. lists could have had a stronger impact than the fines as they wereapplied.
Among the CONTROL VARIABLES, the lagged dependent variable haseverywhere a strong and significant impact. The coefficients are in the0.57-0.75 range, which implies that approximately 65% of the pollution in agiven year (absolute emissions or compliance rate) is explained by thepollution in the preceding year. Similar results were observed elsewhere(Magat and Viscusi (1990) have coefficients in the 0.95-0.98 range).
The PRODUCTION level has a positive impact on the absolute level of TSSemissions and a negative impact on the TSS compliance rate (elasticity in therange 0.22 / 0.36 for the absolute level of pollution, and in the range-0.21 / -0.26 for the compliance rate). These results suggest that larger firmsmay be able to comply more easily with the regulation for reasons like theexistence of economies of scale in the abatement technology. For BOD, thesame pattern is observed in the signs of the coefficients, but only one of themis significant. This result parallels that of Lanoie et al. (1998) showing thatreductions in production may be a good mean to reduce TSS emissions, butnot necessarily a good way to influence BOD emissions.
The LOCALISATION variables are never significant, except one, in theregressions related to BOD, while many of them are significant in theregressions related to TSS. This indicates that, for TSS, specificcharacteristics of the localisation, like stringency of local DOE officials, havean influence. Lastly, the coefficients of our PROCESS variable areeverywhere negative, and they tend to be more significant in the BODregressions than in the TSS. This shows that, as expected, the use of themechanical process leads to higher compliance rate and lower absolute levelsof emissions.
22
5. Conclusion
This paper has examined the relative impact of both traditional enforcementpractices and information strategies on pollution levels and rates ofcompliance. The analysis was performed in the context of British Columbiawhere the MOE publishes, since 1990, a list of firms that either do not complywith the existing regulation or that are of concern to the MOE, and wheresimultaneously the Ministry continues to undertake legal action for thoseviolating the regulation. The empirical investigation was based on a samplecovering 15 plants in the B.C. pulp and paper industry during the period 1987– 1996, and two types of pollutants were considered : BOD and TSS. Ourresults showed that (1) a tightening up of the standards in 1990 had a verysignificant impact on plants’ environmental performance ; (2) appearances onpolluters’ list under the heading « out of compliance » led plants to improvetheir environmental performance ; and (3) fines had a beneficial impact onplants’ compliance rates with respect to BOD. Furthermore, we provided someevidence that the impact of appearing on the polluters’ list was stronger thanthat of fines.
Our analysis suggests that, although useful, information strategies cannotnecessarily replace traditional enforcement practices in the area ofenvironmental protection. In fact, these two approaches can perhaps better beused as complementary policy instruments in order to achieve improvementsin firms’ environmental performance. This way of proceeding presents theadvantage of putting different types of pressure (reputational, financial,judiciary) on firms, increasing the likelihood that they will undertake actionsin line with environmental protection.
23
References
Afsah, S., B. Laplante, and D. Wheeler (1997), Regulation in the informationage : Indonesian public information program for environmentalmanagement, World Bank, Development Research Group,Washington, D.C.
Badrinath, S.G. and P.J. Bolster (1996), “The role of market forces in EPAenforcement activity”, Journal of Regulatory Economics, 10, 165-81.
Backman, A. and G.J. Bannister (1998), “Community pressure and cleantechnology in the informal sector. An econometric analysis of theadoption of propane by traditional Mexican brickmakers”, Journal ofEnvironmental Economics and Management, 35, 1-21.
Cohen, M. (1998), Monitoring and enforcement of environmental policy.Forthcoming in Tietenberg and Folmer (eds), International yearbookof environmental and resource economics, Volume III, Edward ElgarPublishers.
Dasgupta, S., B. Laplante, and N. Mamingi (1998), Capital market responsesto environmental performance in developing countries, World Bank,Development Research Group, Washington, D.C.
Deily, M.E. and W.B. Gray (1991), “Enforcement of pollution regulations in adeclining industry”, Journal of Environmental Economics andManagement, 21, 260-74.
Dion, C., P. Lanoie, and B. Laplante (1998), “Monitoring of pollutionregulation : Do local conditions matter ?”, Journal of RegulatoryEconomics, 13, 5-18.
Environment Canada (1983), The basic technology of the pulp and paperindustry and its environment protection practices, Ottawa.
Gray, W.B. and M.E. Deily (1996), “Compliance and enforcement : airpollution regulation in the U.S. steel industry”, Journal ofEnvironmental Economics and Management, 31, 96-111.
Hamilton, J.T. (1995), “Pollution as news : Media and stock market reactionsto the Toxics Release Inventory data”, Journal of EnvironmentalEconomics and Management, 28, 98-113.
Helland, E. (1998), “The enforcement of pollution control laws : Inspections,violations, and self-reporting”, Review of Economic and Statistics,141-53.

24
Kennedy, P.W., B. Laplante, and J. Maxwell (1994), “Pollution policy : therole of publicly provided information”, Journal of EnvironmentalEconomics and Management, 26, 31-43.
Kenneth, S.A. (1991), Monitoring interjurisdictional waters in Canada : Aconstitutional analysis, Canadian Institute of Resources Law, Facultyof Law, University of Calgary, Calgary, Alberta, Canada.
Klassen, R.D. and C.P. McLaughlin (1996), “The impact of environmentalmanagement on firm performance”, Management Science, 42,1199-1214.
Kmenta, J. (1986), Elements of econometrics, 2nd Edition. New York :MacMillan.
Konar, S. and M.A. Cohen (1996), “Information as regulation : The effect ofcommunity right to know laws on toxic emission”, Journal ofEnvironmental Economics and Management, 32, 109-124.
Lanoie, P., “The impact of occupational safety and health regulation on therisk of workplace accidents – Quebec, 1983–1987”, Journal of HumanResources, XXVII (1992) : 643-660.
Lanoie, P., and B. Laplante (1994), “The market response to environmentalincidents in Canada : A theoretical and empirical analysis”, SouthernEconomic Journal, 60, 657-72.
Lanoie, P., B. Laplante, and M. Roy (1998), “Can capital markets createincentives for pollution control ?”, Ecological Economics, 26, 31-41.
Lanoie, P., M. Thomas, and J. Fearnley (1998), “Firms responses to effluentregulations : pulp and paper in Ontario, 1985-1989”, Journal ofRegulatory Economics, 13 (1998) : 103-120.
Laplante, B., and P. Rilstone (1996), “Environmental inspections andemissions of the pulp and paper industry in Quebec”, Journal ofEnvironmental Economics and Management, 31, 19-36.
Magat, W.A. and W.K. Viscusi (1990), “Effectiveness of the EPA’sregulatory enforcement : The case of industrial effluent standards”,Journal of Law and Economics, 33, 331-60.
Ministry of Environment, Lands, and Parks (1993), Revising the significantnoncompliance and pollution concern list, a discussion paper, BritishColumbia.

25
Muoghalu, M., H.D. Robison, and J.L. Glascock (1990), “Hazardous wastelawsuits, stockholder returns, and deterrence”, Southern EconomicJournal, 7, 357-70.
Nadeau, L.W. (1997), “EPA effectiveness at reducing the duration of plant-level noncompliance”, Journal of Environmental Economics andManagement, 34, 54-78.
Pargal, S. and D. Wheeler (1996), “Informal regulation of industrial pollutionin developing countries : Evidence from Indonesia”, Journal ofPolitical Economy, 104, 1314-1327.
Province of British Columbia (1993), B.C.’s Pulp Mills : Effluent StatusReport, Victoria, British Columbia, Canada.
Liste des publications au CIRANO *
Cahiers CIRANO / CIRANO Papers (ISSN 1198-8169)
96c-1 Peut-on créer des emplois en réglementant le temps de travail ? / Robert Lacroix
95c-2 Anomalies de marché et sélection des titres au Canada / Richard Guay, Jean-FrançoisL'Her et Jean-Marc Suret
95c-1 La réglementation incitative / Marcel Boyer
94c-3 L'importance relative des gouvernements : causes, conséquences et organisationsalternative / Claude Montmarquette
94c-2 Commercial Bankruptcy and Financial Reorganization in Canada / Jocelyn Martel
94c-1 Faire ou faire faire : La perspective de l'économie des organisations / Michel Patry
Série Scientifique / Scientific Series (ISSN 1198-8177)
99s-10 Le coût du capital des entreprises à base de connaissance au Canada / Jean-Marc Suret,Cécile Carpentier et Jean-François L'Her
99s-09 Stratégies de financement des entreprises françaises : Une analyse empirique / CécileCarpentier et Jean-Marc Suret
99s-08 Non-Traded Asset Valuation with Portfolio Constraints: A Binomial Approach / JérômeDetemple et Suresh Sundaresan
99s-07 A Theory of Abuse of Authority in Hierarchies / Kouroche Vafaï
99s-06 Specific Investment, Absence of Commitment and Observability / Patrick González
99s-05 Seasonal Nonstationarity and Near-Stationarity / Eric Ghysels, Denise R. Osborn et PauloM. M. Rodrigues
99s-04 Emerging Markets and Trading Costs / Eric Ghysels et Mouna Cherkaoui
99s-03 Sector-Specific Training and Mobility in Germany / Lars Vilhuber
99s-02 Women's Wages in Women's Work: A US/Canada Comparison of the Roles of Unionsand Public Goods' Sector Jobs / Michael Baker et Nicole M. Fortin
99s-01 Globalization and Worker Welfare in Late Nineteenth Century Europe / MichaelHuberman et Wayne Lewchuk
98s-41 Dynamic Equilibrium with Liquidity Constraints / Jérôme Detemple et Angel Serrat
98s-40 Monetary Policy Rules with Model and Data Uncertainty / Eric Ghysels, Norman R.Swanson et Myles Callan
98s-39 Environmental Risks: Should Banks Be Liable? / Karine Gobert et Michel Poitevin
98s-38 Better Observability Promotes the Adoption of More Flexible Technologies / MarcelBoyer, Armel Jacques et Michel Moreaux
98s-37 Job Characteristics, Wages and the Employment Contract / W. Bentley MacLeod etDaniel Parent
98s-36 Observability, Commitment and Flexibility / Marcel Boyer, Armel Jaques et MichelMoreaux
* Vous pouvez consulter la liste complète des publications du CIRANO et les publicationselles-mêmes sur notre site World Wide Web à l'adresse suivante :http://www.cirano.umontreal.ca/publication/page1.html