ssr mitigation with tcsc in power systems
TRANSCRIPT

SSR mitigation with TCSC in power
systems
THESIS SUBMITTED FOR THE DEGREE OF
DOCTOR OF PHILOSOPHY
RUI ZHENG
School of Engineering
Cardiff University
Cardiff, 2017
I
3 Declaration
This work has not been submitted in substance for any other degree or award at this or any
other university or place of learning, nor is being submitted concurrently in candidature for
any degree or other award.
Signed …………………………………(candidate) Date ………………….…………….………
STATEMENT 1
This thesis is being submitted in partial fulfillment of the requirements for the degree
of ………(insert MCh, MD, MPhil, PhD etc, as appropriate)
Signed …………………………………(candidate) Date ………………….…………….………
STATEMENT 2
This thesis is the result of my own independent work/investigation, except where otherwise
stated, and the thesis has not been edited by a third party beyond what is permitted by Cardiff
University’s Policy on the Use of Third Party Editors by Research Degree Students. Other
sources are acknowledged by explicit references. The views expressed are my own.
Signed …………………………………(candidate) Date ………………….…………….………
STATEMENT 3
I hereby give consent for my thesis, if accepted, to be available online in the University’s
Open Access repository and for inter-library loan, and for the title and summary to be made
available to outside organisations.
Signed …………………………………(candidate) Date ………………….…………….………
STATEMENT 4: PREVIOUSLY APPROVED BAR ON ACCESS
I hereby give consent for my thesis, if accepted, to be available online in the University’s
Open Access repository and for inter-library loans after expiry of a bar on access previously
approved by the Academic Standards & Quality Committee.
Signed …………………………………(candidate) Date ………………….…………….………

II
3 Abstract
Thyristor-Controlled Series Capacitor (TCSC) is considered as solutions to the fast
increasing demand in modern power systems. The TCSC project located at Hutton
substation in the Great Britain (GB) power system is used to reinforce the existing
transmission line to meet the 2020 target by introducing more renewable energy into
the network. It is also able to provide system stability improvement and Sub-
Synchronous Resonance (SSR) mitigation with its flexbile operational princinples.
SSR problems in power systems are caused by the interaction between the mechanical
turbine shaft system and the electrical system resonance. The capability of TCSC in
SSR mitigation in High Voltage Alternative Current (HVAC) systems is investigated.
The study is conducted in two aspects, the inherent capability of TCSC to mitigate
SSR and the active control scheme of TCSC for SSR damping. The operational
principle of TCSC and the dynamic performance of TCSC under SSR impacts are
analysed. It is found that the regulation of thyristors allows TCSC to transform sub-
synchronous components into fundamental components. This ability of TCSC
contributes to an improvement in SSR damping.
A Sub-Synchronous Damping Controller (SSDC) for TCSC is to secure the
mitigation of SSR. But conventional SSDC has its limitations and challenges in
implementation. These limitations include communication delays due to remote
information transmitting at the generator side and the poor performance of bandpass
filters due to its variable frequency response. A new SSDC scheme is proposed to solve
the limitations and to improve the performance of SSR damping.
A physical TCSC device is designed and implemented at the laboratory scale. By
interconnecting with Real-Time Digital Simulation (RTDS) and Power Amplifier (PA),

III
a TCSC platform is set up to perform experimental tests. The effectiveness of the
proposed SSDC scheme is validated with both simulation software on
PSCAD/EMTDC and the TCSC platform. The simulation results agree with the
experimental test results. The developed TCSC platform can be utilised for testing
other control schemes for SSR mitigations.
IV
3 Acknowledgements
This dissertation would not have been possible without the invaluable and incessant
support that I receive from many generous people.
I would like to convey my deepest and most sincere gratitude to my supervisor,
Prof. Jun Liang, for delivering his extraordinary expertise, understanding and patience
to shape my Ph.D. career. I am profoundly indebted to Prof. Nick Jenkins for his
invaluable and ranging guidance on my research and inspiring support on improving
my language skills. I would like to give very special thanks to Dr. Wenlong Ming for
his extremely kind encouragement and brilliant assistance throughout my laboratory
research. My thanks go to Prof. Jianzhong Wu who supported me in many ways during
my undergraduate study in Cardiff. I also would like to thank Miss Catherine Roderick
for her efforts in helping me improve my presentation skills.
My heartfelt gratitude goes to the industrial friends, Prof. Oriol Gomis and Mr.
Cristian Chillon, for their kindly assistance with the implementation of TCSC device.
I wish to express my gratitude to all my colleagues and friends who help me
navigate life as a Ph.D. student. I would like to thank Dr. Sheng Wang, Dr. Senthooran
Balasubramaniam, and Mr Tibin Joseph, for releasing me from those hard periods and
helping me through troubles. My thanks also go to Mr Gen Li and Dr. Chuanyue Li,
who supported me with their strong knowledge. I am also grateful to all colleagues at
CIREGS, in particular friends within the MEDOW projects for creating such a friendly
environment. I would like to thank Dr. Oluwole Adeuyi who encouraged me to
complete the hardware TCSC device.

V
I am particularly thankful to my parents, for their intellectual contributions to my
academic nature. More importantly, I appreciate for their unconditionally support,
incessant encouragement and undoubted faith in my succeeding the Ph.D. career
throughout all these years. I also appreciate the help from Miss Lijie Yang, who helped
me with proofreading and encouraged me during the hard period.

VI
3 Table of Contents
Declaration ...................................................................... I
Abstract ........................................................................... II
Acknowledgements ...................................................... IV
Table of Contents ........................................................ VI
List of Tables .................................................................. X
List of Figures ............................................................... XI
List of abbreviations .................................................. XIV
Chapter 1 ......................................................................... 1
Introduction ................................................................... 1
1.1 Development of the GB power system ............................................................ 1
1.2 Research motivation ......................................................................................... 5
1.3 Objectives and contributions of the thesis ........................................................ 6
1.4 Thesis structure ................................................................................................ 7
Chapter 2 ......................................................................... 9
Literature review .......................................................... 9
2.1 Introduction ...................................................................................................... 9

VII
2.2 A review of series compensation technology ................................................. 10
2.3 An overview of Sub-Synchronous Interaction (SSI) ...................................... 15
2.4 Review on SSR phenomenon ......................................................................... 19
2.5 Study methods for SSR .................................................................................. 25
2.6 Conventional solutions to SSR problems ....................................................... 30
2.7 Summary ........................................................................................................ 32
Chapter 3 ....................................................................... 34
Principles of Thyristor Controlled Series
Capacitor ...................................................................... 34
3.1 Development of FACTS devices .................................................................... 34
3.2 Thyristor-Controlled Series Capacitor ........................................................... 36
3.3 Principles of TCSC operations ....................................................................... 38
3.4 The selection of TCSC parameters to avoid dual-resonance ......................... 44
3.5 Applications of TCSC in power systems ....................................................... 48
3.6 Summary ........................................................................................................ 52
Chapter 4 ....................................................................... 54
Inherent characteristic of TCSC in SSR mitigation
......................................................................................... 54
4.1 Introduction .................................................................................................... 54
4.2 SSR damping via power conversion of TCSC ............................................... 54

VIII
4.3 The study system for TCSC’s contribution in SSR mitigation ...................... 64
4.4 TCSC characteristic and its impacts on mitigating SSR problems ................ 65
4.5 Summary ........................................................................................................ 76
Chapter 5 ....................................................................... 79
Experimental platform for sub-synchronous
resonance test with Thyristor-Controlled Series
Capacitor ...................................................................... 79
5.1 Introduction .................................................................................................... 79
5.2 Overview of the experimental platform for TCSC-SSR test .......................... 80
5.3 Design, parameters and rating of the TCSC test rig ....................................... 82
5.4 Specifications of equipment in the platform .................................................. 88
5.5 Configuration of the TCSC test rig for SSR study ......................................... 97
5.6 Synchronising and interconnecting grids ....................................................... 99
5.7 Comparison between simulation and real time experiment results .............. 101
5.8 Summary ...................................................................................................... 104
Chapter 6 ..................................................................... 105
Mitigation of SSR– a supplementary damping
controller for TCSC ................................................ 105
6.1 Introduction .................................................................................................. 105
6.2 Review of TCSC supplementary damping controller for SSR .................... 106
IX
6.3 A new controller with local measurements only .......................................... 107
6.4 Software simulation and hardware validation .............................................. 114
6.5 Summary ...................................................................................................... 118
Chapter 7 ..................................................................... 120
Conclusions and future work ................................ 120
7.1 Conclusions .................................................................................................. 120
7.2 Future work .................................................................................................. 122
Reference ................................................................... 124
Appendix I ..................................................................... 148
Appendix II .................................................................... 150
Publications ................................................................ 151

X
3 List of Tables
Table 2.1 Ratings of FSC installations in the UK ................................................. 13
Table 2.2 Over-current capability requirements for a 1000kV FSC bank ............ 14
Table 3.1 The relationship between TCSC operational regions and firing angles 45
Table 4.1 Parameters of TCSC under test ............................................................. 59
Table 4.2 SSR mode and corresponding series compensation level ..................... 65
Table 4.3 Parameters and corresponding compensation levels of TCSC and FSC for
defined cases .............................................................................................................. 66
Table 4.4 Results summary of the three case studies ............................................ 71
Table 4.5 Definition of studied cases .................................................................... 73
Table 5.1 Hutton TCSC project parameters: TCSC and FSC ............................... 86
Table 5.2 Scaled parameters including the line impedance, the TCSC impedance
and the FSC impedance .............................................................................................. 87
Table 5.3 Parameters of components in the modified FBM system in
RSCAD/RTDS ........................................................................................................... 99

XI
3 List of Figures
Fig. 1.1 Comparisons of the UK electricity generation in the 2nd quarter of year
2016 and 2017 [2] ........................................................................................................ 2
Fig. 1.2 Geographical locations of wind generation [3] .......................................... 3
Fig. 1.3 Reinforcements in the GB power system to meet the 2020 target [4] ....... 4
Fig. 2.1 Power-angle curve considering different compensation levels ................ 11
Fig. 2.2 Typical layout of a FSC [10] .................................................................... 12
Fig. 2.3 Classification of SSI and their relationships between different devices
involved ...................................................................................................................... 16
Fig. 2.4 Demonstration of the mechanism of the new SSI event .......................... 18
Fig. 2.5 Dynamics of the PSMG under the new SSI event ................................... 18
Fig. 2.6 Simplified synchronous machine equivalent circuit regarding to induction
generator effect........................................................................................................... 21
Fig. 2.7 Typical waveforms and their zoom-in plots under SSR events ............... 24
Fig. 2.8 An application of the complex torque coefficient method in measuring the
electrical torque in power systems ............................................................................. 30
Fig. 3.1 A typical configuration of series compensated systems with TCSC ....... 38
Fig. 3.2 A simplified configuration of TCSC [84] ................................................ 39
Fig. 3.3 Typical waveforms in TCSC .................................................................... 39
Fig. 3.4 Typical waveforms of TCR current and the capacitor current in TCSC . 40
Fig. 3.5 TCSC current flows in the thyristor blocked mode [81] .......................... 41
Fig. 3.6 TCSC current flows in the thyristor bypassed mode [81] ........................ 41
Fig. 3.7 TCSC current flows in two Vernier modes (a) inductive mode, (b)
capacitive mode [81] .................................................................................................. 42
Fig. 3.8 TCSC impedanceimpedance-firing angle characteristic .......................... 43
Fig. 3.9 The TCSC impedanceimpedance against firing angle characteristics with
different factor 𝛚 values ............................................................................................ 46
Fig. 3.10 The TCSC impedance characteristic plot when 𝛚 is smaller than 1 ..... 47
Fig. 3.11 The TCSC impedance characteristic with 𝛚 higher than 3 ................... 47
Fig. 4.1 Changes in capacitor zero-crossing points affected by sub-synchronous
components……………………………………………………………………………...57
Fig. 4.2 The study of TCSC resistive behaviour with the current injection method…59

XII
Fig. 4.3 Block diagram used to deduce TCSC impedance at the synchronous frequency
and the sub-synchronous frequency……………………………………………………..60
Fig. 4.4 TCSC resistance at 37 Hz, 27 Hz and 17 Hz with varying firing angles……61
Fig. 4.5 TCSC resistance at the synchronous frequency with varying firing angles…62
Fig. 4.6 Frequency spectrum of the line current when the injected component is at 37
Hz………………………………………………………………………………………..63
Fig. 4.7 The frequency spectrum of the line current when the injected component is at
17 Hz…………………………………………………………………………………….64
Fig. 4.8 The IEEE FBM system configuration with turbine shaft model and series
compensation [64]……………………………………………………………………….65
Fig. 4.9 Electrical damping calculated with FSC in different cases…………………68
Fig. 4.10 Electrical damping calculated with TCSC in three cases………………….68
Fig. 4.11 Simulation results of the active power and the LPA-LPB torque
considering FSC or TCSC in case 1 ........................................................................... 68
Fig. 4.12 Simulation results of the active power and the LPA-LPB torque
considering FSC or TCSC in case 2 ........................................................................... 69
Fig. 4.13 Simulation results of the active power and the LPA-LPB torque
considering FSC or TCSC in case 3 ........................................................................... 70
Fig. 4.14 Simulation results of the active power and the LPA-LPB torque with
different firing angles ................................................................................................. 72
Fig. 4.15 Simulation results of case 1 when the ratio of TCSC/FSC is 1:1 .......... 74
Fig. 4.16 Simulation results of case 2 when the ratio of TCSC/FSC is 1:2 .......... 74
Fig. 4.17 Simulation results of case 3 when the ratio of TCSC/FSC is 1:3 .......... 75
Fig. 5.1 An overview of the TCSC-SSR experimental platform configuration .... 80
Fig. 5.2 Single line diagram of TCSC cabinet ...................................................... 82
Fig. 5.3 Transmission circuit between Hark and Hutton substation in the UK [147]
.................................................................................................................................... 84
Fig. 5.4 RSCAD model of the turbine generator and transmission system ........... 89
Fig. 5.5 An overview of the TCSC cabinet ........................................................... 91
Fig. 5.6 Components inside the TCSC cabinet ..................................................... 93
Fig. 5.7 (a) The three-phase auto-transformer and (b) the grid simulator amplifier
.................................................................................................................................... 94
XIII
Fig. 5.8 (a) The completed PCB diversion board and (b) the schematic diagram of
the PCB diversion board ............................................................................................ 95
Fig. 5.9 The front panel of the DSpace MicroLabBox .......................................... 96
Fig. 5.10 Block diagram of the PC and the DSpace MicroLabBox connection .... 97
Fig. 5.11 Single line diagram of the modified study system ................................. 99
Fig. 5.12 The modified network for grid synchronizing ..................................... 101
Fig. 5.13 (a) Simulated phase A current after the closure of the main circuit breaker
and (b) after the opening of by-pass switch to put capacitors in the network .......... 102
Fig. 5.14 TCSC test rig phase A current measured by a CT during start-up period
.................................................................................................................................. 103
Fig. 6.1 Polar diagram of 𝒊𝒔𝒖𝒃∆𝒂and induced 𝒊𝒔𝒖𝒃′ ....................................... 109
Fig. 6.2 The structure of TCSC control strategy ................................................. 111
Fig. 6.3 Comparisons between band-pass filter and RF in gain and phase margins
.................................................................................................................................. 113
Fig. 6.4 Control block diagram ........................................................................... 113
Fig. 6.5 Single line diagram of the test system in PSCAD/EMTDC .................. 114
Fig. 6.6 Waveforms of (a) TCSC firing angle (b) Generator rotor speed (c) TCR
current and its Zoom-in (d) Excitor-Generator torque and its zoom-in obtained from
PSCAD ..................................................................................................................... 116
Fig. 6.7 Waveforms of (a) TCSC firing angle (b) Generator rotor speed (c) TCR
current and its Zoom-in (d) Excitor-Generator torque and its zoom-in obtained on the
experimental platform .............................................................................................. 117

XIV
3 List of abbreviations
A/D Analogue/Digital
AC Alternate Current
CC Constant-Current
CI Constant-Impedance
CT Current Transducers
DC Direct Current
ERCOT Electric Reliability Council of Texas
FACTS Flexible AC Transmission System
FFT Fast Fourier Transform
FSC Fixed Series Compensation
HVAC High Voltage AC
HVDC High-Voltage Direct Current
IEEE Institute of Electrical and Electronics Engineers
IGE Induction Generator Effect
LCC Line Commuted Converter
LQR Linear-Quadratic Regulator
MOV Metal Oxide Varistor
MTDC Multi-Terminal DC
NGET National Grid Electricity Transmission
PA Power Amplifier
PCB Printed Circuit Board
PLL Phase Locked Loop
PMSG Permanent-Magnetic Synchronous Generators
PMU Phasor Measurement Units

XV
RF Resonant Filters
RTDS Real Time Digital Simulator
RTI Real Time Interface
SPT Scottish Power Transmission
SSCI Sub-Synchronous Control Interaction
SSDC Sub-Synchronous Damping Controller
SSI Sub-Synchronous Interaction
SSR Sub-Synchronous Resonance
SSSC Static Synchronous Series Compensator
SSTI Sub-Synchronous Torsional Interaction
STATCOM Static Synchronous Compensator
SVC Static Var Compensator
SVR Synchronous Voltage Reversal
TCR Thyristor-Controlled Reactor
TCSC Thyristor Controlled Series Capacitor
T-G Turbine-Generator
TI Torsional Interaction
TSO Transmission System Operators
TTE Transient Torque Effect
UPFC Unified Power Flow Controller
VT Voltage Transducers
WAMS Wide-Area Measurement System

1
Chapter 1
Introduction
This chapter introduces the background of the GB power system, motivation of this
research, and contributions of the thesis. The structure of the thesis is also given.
DEVELOPMENT OF THE GB POWER SYSTEM
To face the challenges caused by environment and climate changes, the GB power
system is experiencing great changes. The continuously developing economy results
in increased demands for electrical power generation and transmission. The existing
power system requires reinforcements to meet the demand for higher and more stable
power transfer, as its power transfer capability is approaching the limit.
1.1.1 The UK future energy policy
Global warming and climate change resulted by greenhouse gas emissions have
raised a lot of concern. To help contribute to preventing the climate change, the UK
government announced the 2020 target in 2010 to source 15% of all energy
consumption and 10% of transport fuels from renewables [1]. According to the plan,
the following sub-objectives are to be achieved:
30% of total electricity from renewable generation
12% of the heat energy from renewable resources
10% of energy consumption in transport from renewable generation
The statistic indicates that the UK is expected to exceed the 30% electricity sub-
target but may fail the other two sub-targets in transport fuels and heat. Fig. 1.1 shows

2
the electricity generation shares in the second quarter of year 2016 and 2017 [2]. The
result indicates electricity generations from renewables achieve 29.8% which is 13.6%
higher than it was in the second quarter of year 2016.
Fig. 1.1 Comparisons of the UK electricity generation in the 2nd quarter of year
2016 and 2017 [2]
To meet the 2020 target, the wind power is expected to play the leading role.
According to the government’s delivery Roadmap [3], by 2020, wind power
generation within the UK could contribute between 3.7% and 5.8% of the estimated
total energy consumption.
The development of wind power has progressed rapidly over the past 20 years. Up
to Q3 in 2017, the wind power capacity in the UK has reached around 18 GW, and
generated around 32.6 GWh in the first 3 quarters of 2017, which contributes 15% to
the total electricity consumption throughout this year.
Locations of wind generation are unevenly distributed. Fig. 1.2 shows the
geographical distribution of the wind generation [3]. The wind generation is
centralised in the coastal area, especially in the Scotland and northern England.

3
Fig. 1.2 Geographical locations of wind generation [3]
1.1.2 Reinforcing the existing GB power system
The integration of renewable generation requires reinforcements to the existing GB
power system to meet the power transfer requirements. Reinforcements include series
compensation techniques placed at the main transmission routes and additional HVDC
links based on power electronics converters. Fig. 1.3 demonstrates the locations of
reinforcements to the existing power system [4].

4
Fig. 1.3 Reinforcements in the GB power system to meet the 2020 target [4]
According to Fig. 1.3, three Fixed Series Compensation (FSC) projects and a
Thyristor Controlled Series Capacitor (TCSC) project are installed interconnecting the
Scottish system to the north of England. The power transfer capacity is boosted from
1100 MW to 4400 MW through these compensators. However, as the first application
of series capacitor in the UK, the potential interaction and risks of SSR problems need
to be addressed.

5
RESEARCH MOTIVATION
Generating units, especially wind turbine generators and thermal turbine generators
are vulnerable to Sub-Synchronous Resonance (SSR) risks introduced by series
compensation techniques in the GB power system.
One way to solve the potential SSR risks is to install conventional countermeasures
based on a detailed study about which generating units are under SSR risks, i.e. filters
or damping circuits to prevent sub-synchronous currents from flowing back to
generating units. This is a time-consuming task and requires experienced engineers to
design or modify the existing control systems or protection schemes. However, the
better solution is to utilise the benefits of the controllable TCSC due to the installation
of TCSC is located at the main corridor interconnecting generating units and the
demand. Since the FSC and TCSC projects are in series and placed in the main corridor
that interconnects the Scottish system and the England system, SSR risks caused by
FSC can be eliminated by TCSC without investing in extra devices.
The TCSC project at the Hutton substation is the first project of this kind in the UK.
The Transmission System Operators (TSO) in the UK still lack the experience and
confidence in the operation of TCSC and its capability in solve SSR problems, as the
mechanism of TCSC inherent capability in SSR mitigation is still not clear. The
National Grid UK has conducted case studies which indicate the SSR risk has been
eliminated by use of TCSC [5]. The system electrical damping is found to be positive
enough to damp all SSR modes between 12 Hz and 38 Hz, which covers all the range
of concerned mechanical frequencies. However, with the construction of new wind
turbines, or with an un-scheduled configuration changing, SSR may still occur at

6
unexpected frequencies. This is because that newly installed turbine generators may
have new SSR modes.
OBJECTIVES AND CONTRIBUTIONS OF THE THESIS
The objectives and contributions of the Ph. D research are outlined as follow:
• Investigate the impact of TCSC device on the GB power system in terms of
SSR.
A detailed study about the inherent characteristic of TCSC has been
conducted and the dynamic performance of TCSC under impacts of SSR
events has been investigated. The selection of TCSC parameters in a hybrid
compensation system with both FSC and TCSC has been studied, to provide
a guidance to TSOs in designing TCSC projects.
• Set up an experimental platform with physical TCSC device for validations.
A TCSC device has been designed and built based in the laboratory
environment. The device is connected to the grid emulator, which consists
a Real Time Digital Simulator (RTDS) and a Power Amplifier (PA). SSR
problems have been replicated on the platform and the effectiveness of
TCSC’s capability in SSR mitigation have been validated. This platform can
be extended for other studies on compensation-related issues.
• Propose a novel control scheme for TCSC to mitigate SSR events with
higher adaptability to future system conditions.
A novel control scheme for TCSC in SSR mitigation have been proposed to
improve the adaptability in practical projects. Unlike traditional control
strategies, which requires remote communication links to be established
7
between generating units and TCSC device, this control scheme considers
local measurements for SSR detection and discrimination to provide a faster
response and easier access to control system modifications.
THESIS STRUCTURE
The rest chapters of the thesis are structured as follow.
Chapter 2 provides the literature review of the development of series compensation
technique, and the definition and classification of SSR. Some commonly used study
methods for SSR phenomenon are introduced, with special attention to the complex
torque coefficient method, which is used in the study of SSR within this thesis. Last,
the state-of-the-art of conventional solutions to SSR problems is presented.
Chapter 3 reviews the technology of TCSC, including its history, commissioned
projects and relevant research topics. The operational principle and performance of
TCSC are presented, mainly operated under the capacitive mode. The principle in
selecting TCSC parameters to avoid the dual-resonance phenomenon is also
demonstrated.
Chapter 4 investigates the inherent characteristic of TCSC and the response of
TCSC to SSR events. A theory is proposed that TCSC operated with constant firing
angle control still has the ability to improve SSR damping by transforming sub-
synchronous components into synchronous components. This theory is validated by
comparing the energy at different frequencies before and after the regulation of
thyristors. Case studies have been conducted to show the damping performance
improved by the application of TCSC is highly related to the energy conversion ability
of TCSC. The performance of a hybrid compensation scheme with both TCSC and

8
FSC contributing different percentages of compensation levels is studied to provide a
guidance in designing series compensation projects.
Chapter 5 demonstrates the procedure of establishing the TCSC platform. The
design for the TCSC device is presented, including the topology, protection schemes
and parameter selections. The control system is developed, and the involved software
and firmware are introduced.
Chapter 6 describes the capability of TCSC in SSR mitigation with its
controllability. Limitations of conventional damping schemes based on TCSC
controller are discussed. Some modifications are proposed to eliminate the limitations
and contribute to a novel SSR damping scheme. The effectiveness of the proposed
damping scheme is validated with simulation case studies and experimental tests.
Chapter 7 presents the conclusion drawn from this thesis, and the recommended
future work.

9
Chapter 2
Literature review
2.1 INTRODUCTION
In AC power systems, series capacitors are connected in series with transmission
line to reduce the overall equivalent impedance of the transmission system. This helps
to increase the maximum power transfer capability and improve the system stability.
Because of these benefits, Fixed Series Capacitor (FSC) technologies are widely used
around the world.
However, one drawback of FSC technology is the SSR phenomenon. Turbine
generator shaft is consist of many individual masses with different inertias. When
rotating as a whole shaft, the torque between different adjacent masses has an inherent
resonant frequency, which is also referred as a SSR mode. An electrical resonance at
a complementary frequency to the shaft inherent frequency may interact with the SSR
mode and amplfy the torsional oscillation on the shaft. This electro-mechanical
phenomenon can reduce the lifetime of turbine generator shafts or even break down
the shaft to cause severe accidents.
In 2013, FSC installations were commissioned at Moffat, Eccles and Gretna [6-8]
to interconnect the Scottish Power Transmission (SPT) and National Grid Electricity
Transmission (NGET), and TCSC installtions were completed by the end of 2014.
Since this is the first series compensation technique adopted in the GB power system,
the concern of SSR events also rises. This chapter reviews the background of FSC and
SSR, and commonly used technologies for SSR mitigation.

10
2.2 A REVIEW OF SERIES COMPENSATION TECHNOLOGY
2.2.1 Benefits of series compensation techniques
The application of the series compensation dates back to 1930s. In AC transmission
system, the maximum active power transferable over a certain power transmission line
is inversely proportional to the series impedance of the transmission line. Thus, by
using a series capacitor and compensating the series impedance to a certain level, the
transmission line is electrically shortened, and higher power transfer can be achieved.
This is a cost-effective solution to face bulk power transmission challenges compared
with building extra transmission lines [7]. Besides, the series capacitor can balance
voltage drops caused by the line impedance. Consequently, the voltage stability is also
improved.
The active power transfer through a transmission line is determined by its terminal
voltages at each end, and is inversely proportional to the overall impedance of the
transmission system. The relationship can be expressed in (2.1).
𝑃 =𝑉𝑆𝑉𝑅
𝑋𝑡𝑠𝑖𝑛𝛿 (2.1)
where 𝑉𝑆 𝑎𝑛𝑑 𝑉𝑅 are the sending and receiving terminal voltages, and 𝛿 is their
phase angle difference. 𝑋𝑡 is the overall impedance of the transmission system.
Considering that the terminal voltage magnitudes are kept constant, the maximum
power transfer occurs when the phase angle difference 𝛿 becomes 90°.
Application of the FSC technique can help to improve the maximum power transfer
without building extra transmission lines. The relationship between the inserted FSC
impedance and the transmission line impedance is defined as the series compensation
level, denoted by 𝑘.

11
𝑘 =𝑋𝐹𝑆𝐶
𝑋𝑇 (2.2)
where 𝑋𝐹𝑆𝐶 is the impedance of inserted FSC, and 𝑋𝑇 is the total impedance of the
transmission system before compensating. The compensation level 𝑘 is smaller than
100%.
Thus, the reduced impedance of the overall transmission system can be derived in
terms of the compensation level, as:
𝑋𝑒𝑓𝑓 = 𝑋𝑇 − 𝑋𝐹𝑆𝐶 = 𝑋𝑇(1 − 𝑘) (2.3)
where 𝑋𝑒𝑓𝑓 is the effective impedance of the compensated transmission line. The
maximum power flow in terms of the series compensation level is given as:
𝑃 =𝑉𝑆𝑉𝑅
𝑋𝑇(1−𝑘)𝑠𝑖𝑛𝛿 (2.4)
Considering that the sending and receiving end voltages are constant at 1 pu, the
power-angle curve regarding different compensation levels can be presented as Fig.
2.1.
Fig. 2.1 Power-angle curve considering different compensation levels
According to Fig. 2.1, the power transfer capability is greatly affected by the
compensation level. Given that the compensation level is at 30%, the power transfer

12
capability is boosted by 50%. If the compensation level achieves 75%, the power
transfer capability is boosted to 400% of the non-compensated capability.
2.2.2 Installation of FSC in the GB power system
FSC technique has become a mature and cost-effective solution to bulk AC power
transmission. A typical layout of a FSC installation in industrial projects is given in
Fig. 2.2.
𝑉𝑆 𝑉𝑅
𝐿1 𝐿2 𝐶𝐹𝑆𝐶
𝑀𝑂𝑉
By-pass switch
Air gap Damping circuit
Earth switch Earth switch
Fig. 2.2 Typical layout of a FSC [10]
In industrial projects, FSC is equipped with MOV to protect it from over-voltage
events. A paralleled switch is used to insert or by-pass FSC from the network, denoted
as the By-pass switch in Fig. 2.2. When FSC is by-passed, its stored energy needs to
be discharged through a closed circuit containing a damping circuit to limit the

13
discharging current. The damping circuit is controlled through a damping switch and
it is open-circuit during normal operations. Two earth switches are used to protect FSC
from fault events.
Table 2.1 Ratings of FSC installations in the UK
Moffat Gretna Eccles 1 Eccles 2
Voltage rating 400 kV 400 kV 400 kV 400 kV
Power rating 560 MVAr 560 MVAr 442 MVAr 442 MVAr
The FSC projects in the UK are installed at Moffat, Eccles and Gretna, and their
ratings are listed in Table 2.1 [9]. These capacitor banks are equipped with SSR filters
and help to reduce the overall impedance between Strathaven and Harker and Eccles
and Stella by 35% [10].
Generally, the design of the compensation level should consider following aspects:
• The voltage at the terminal substaion;
• The voltage distrubition along the transmission line;
• Requirements of the system stability;
• Power flows between paralleled transmission lines.
A reasonable compensation level should be within 20% - 80% [11] depending on
site requirements and considerations listed above. When FSC is installed on a
transmission corridor directly connected to turbine generator units, the risk of SSR
problems needs to be addressed.

14
2.2.3 Operations of FSC
In the design of industrial FSC projects, specifications of the continuous and fault
currents flowing through a FSC must be given. According to [11], an industrial
standard of 1000kV FSC’s capability in over-current operations is given in Table 2.2.
Table 2.2 Over-current capability requirements for a 1000kV FSC bank
Current Typical duration
Typical over-current
value
Rated current Continuous 1.0 pu
1.10*rated current 8 hours in every 12 hours 1.10 pu
1.20*rated current 2 hours in every 8 hours 1.20 pu
1.35*rated current 30 mins in every 6 hours 1.35 pu
1.50*rated current 10 mins in every 2 hours 1.50 pu
Current swings 1s – 10 s 1.70 pu – 2 pu
Table 2.2 shows typical operational requirements for FSC under industrial
standards. It indicates that the current rating of FSC bank should be higher than the
system current rating considering the maximum power transfer under continuous
operations. This allows system operators to flexibly utilise the FSC’s capability in
over-current operations to face fault conditions or power transfer requirements in an
emergency.

15
2.3 AN OVERVIEW OF SUB-SYNCHRONOUS INTERACTION (SSI)
2.3.1 Classification of Sub-Synchronous Interaction
Interactions within sub-synchronous frequency ranges in power systems are defined
as Sub-Synchronous Interaction (SSI). In power systems, SSI can be various.
According to [12], reasons of SSI can be installations of FSC or converter control
systems. Generally, there are three types of SSI events based on involved devices and
the source of sub-synchronous components, Sub-Synchronous Resonance (SSR), Sub-
Synchronous Torsional Interaction (SSTI) and Sub-Synchronous Control Interaction
(SSCI).
SSR occurs due to the addition of series compensation onto the system, while SSTI
is due to the integration of High-Voltage Direct Current (HVDC) links. The potential
effect of both SSR and SSTI on the network is the interaction with generator shafts,
and in severe cases they can both cause shaft fatigues and failures. Another type of
SSI, known as SSCI, occurs between the control system and the electrical transmission
network at complementary frequencies of control system torsional modes. The severity
of SSI problems is increasing with the development of series compensation techniques
and HVDC techniques in the GB power system.

16
Fig. 2.3 Classification of SSI and their relationships between different devices
involved
However, it should be noted that the classification of SSI still exists with crossing-
overs and disagreements among academics and industries. In this thesis, it adopts the
classification accepted by most European and US researchers and the UK National
Grid. Fig. 2.3 shows this classification of SSI phenomenon and the devices involved
in corresponding SSI events.
Sub-Synchronous Resonance :
SSR is caused by the installation of series capacitors and is an interaction between the
turbine generator shaft system and the compensated electrical network. There are three
types of commonly observed SSR events which are discussed in section 2.4.
Sub-Synchronous Control Interaction:
SSCI occurs between the control system of power electronics and the series capacitor
[13-17]. The first SSCI event was observed in 2009 between power electronics control
systems in wind turbines and the series capacitor in Electric Reliability Council of
Sub-Synchronous Interaction (SSI)
Sub-Synchronous Resonance (SSR)
Sub-Synchronous Control Interaction (SSCI)
Sub-Synchronous Torsional Interaction (SSTI)
Torsional Interaction Effect
(TI)
Induction Generator Effect
(IGE)
Transient Torque Effect (TTE)
DC Line
DC
AC DC
AC

17
Texas (ERCOT). The wind turbines then suffered crossbar failures caused by the
oscillating current with heavy sub-synchronous distortions. After this event, ERCOT
requires a detailed study on all wind turbines that are directly connected to series
capacitors to address SSCI risks.
Sub-Synchronous Torsional Interaction:
The first SSTI event was observed in 1977 at Square Butte, between the classic Line
Commuted Converter (LCC) in a HVDC link and the turbine generator. This led to an
extensive research on SSTI to find out the mechanism of SSTI [18-21]. The reason of
SSTI is that the converter working as a rectifier reduces the electrical damping within
sub-synchronous frequency ranges. Therefore, the system induces sub-synchronous
harmonics that cannot be damped by the electrical network, and these sub-synchronous
components may interact with the natural torsional modes of the turbine generator to
cause SSTI. A solution to SSTI is to design and equip the converter with Sub-
Synchronous Damping Controller (SSDC) [20, 21].
2.3.2 New SSI phenomenon
The classification shown in Fig. 2.3 is based on previous SSI events. However, as
the complexity of modern power systems has increased, more SSI phenomena are
observed, and they belong to none of the listed classifications.
In 2014, a sub-synchronous power oscillation was captured by the Wide-Area
Measurement System (WAMS) in XinJiang Province, northwestern China. These sub-
synchronous oscillations were oriented from some directly-drive Permanent-Magnetic
Synchronous Generators (PMSG), but then spread rapidly to nearby AC grids [22-24].
Fig. 2.4 presents the occurrence of the newly found SSI event.

18
Fig. 2.4 Demonstration of the mechanism of the new SSI event
In this new SSI event, the interaction is found between a non-compensated weak
AC grid and the wind turbine converter. Study in [24] found that the converter control
system performs negative resistive and capacitive at sub-synchronous frequencies.
This forms a R-L-C circuit along with the AC grid and induces sub-synchronous
currents. These currents then interact with particular torsional modes of the converter
control system. This new SSI event is a pure electrical event without interacting with
the mechanical turbine system. Fig. 2.5 shows the phase A current and power
oscillations during this event.
Fig. 2.5 Dynamics of the PSMG under the new SSI event
AC
DC AC
DC
AC grid𝑗𝜔𝐿 𝑅
𝑅 −𝑗/𝜔𝐶
Time (sec)
1.9 2.1 2.3 2.5 2.7 2.9
Ph
ase
A
cu
rre
nt
(kA
)
Ac
tiv
e p
ow
er
(MW
)

19
There are still many research topics in SSI, however, limited by time, the scope for
this thesis focuses on SSR-TI only.
2.4 REVIEW ON SSR PHENOMENON
2.4.1 Definition of SSR
SSR can cause severe damages to power devices and is the most common concern
among other SSI problems. Though numerous studies have been made on previous
SSR events, the short distance transmission system in the UK makes a different case
for SSR concerns. Especially in the UK, with the newly-installed series compensation
devices, study of SSR and its impacts on the GB power system are of particular
interests.
The discovery of SSR dates back to 1930s when FSC was first adopted in
transmission systems. Engineers discovered the potential interaction between the
capacitor and turbine generators and proposed the first paper on SSR in 1937 [25], but
the first SSR event was not observed until 1970 at the Mohave units in the USA [26].
This event caused a big black-out in the Texas area and drew lots of attention from
both industries and academics, while a second event followed in the next year. Lots of
researches have been conducted after the SSR events on turbine generator modelling
[27-29] and system modelling [30-32].
To study the mechanism of SSR event, a general model for study was proposed by
the IEEE working group as the First Benchmark model [27]. This model is based on
the Navajo project including a 892.4 MVA turbine generator and a 500 kV
transmission line with series compensation. It provides a guidance of how to study
SSR events. In 1979, a first paper was published by the IEEE working group to propose
terms and definitions for SSR [33]. These definitions and symbols were soon accepted

20
by both industries and academics. Another extended paper of definitions and symbols
to describe SSR event was followed in 1985 by IEEE working group to give a more
detailed guidance for SSR phenomenon [34].
According to [35], the formal definition of SSR is:
“Subsynchronous resonance is an electric power system condition where the
electric network exchanges energy with a turbine generator at one or more of the
natural frequencies of the combined system below the synchronous frequency of the
system.”
The definition of SSR includes any possible conditions that an interaction or energy
exchange at sub-synchronous frequencies. Typically, there are two types of modes, the
natural mode and the forced mode [36]. A natural mode of oscillation refers to the
inherent system characteristic, and a most common example is the series compensation
which forms a R-L-C network with a series resonant frequency below synchronous
frequency. As for a forced mode, it refers to an oscillation driven by controllable
devices or the control system.
2.4.2 Classification of different SSR interactions
The interaction between the electrical system and the turbine generator can occur
in different ways in terms of sub-synchronous frequencies. Among them, there are
three types of SSR interactions [37] most commonly studied and concerned. They are:
• Induction Generator Effect (IGE)
• Torsional Interaction (TI)
• Transient Torque Effect (TTE)

21
Induction Generator Effect
The IGE is resulted by the self-excitation of the electrical system [169, 170]. As
seen in Fig. 2.6, the rotor resistance, viewed from the armature, can become negative
under the impact of sub-synchronous current. When sub-synchronous current, at
frequency of 𝑓𝑛 , is flowing through the rotor, the rotor behaves like an induction
machine running at above synchronous speed. Then the slip becomes negative which
is determined by (2.5).
𝑠 =𝑓𝑛−𝑓0
𝑓𝑛 (2.5)
Since the frequency of sub-synchronous current, 𝑓𝑛 , is determined by the series
compensation level, the apparent negative rotor resistance can exceed the positive
resistance of the armature. In that case, the overall resistance, denoted as 𝑅𝑒𝑓𝑓 ,
becomes negative and this reduces the stability of the system, according to (2.6).
𝑅𝑒𝑓𝑓 =1−𝑠
𝑠𝑅𝑟 + 𝑅𝑎 (2.6)
The IGE is a pure electrical phenomenon and is independent from the turbine shaft
characteristic.
Fig. 2.6 Simplified synchronous machine equivalent circuit regarding to induction
generator effect
Neglect
1 − 𝑠
𝑠𝑅𝑟
𝑅𝑟 𝑅𝑎 𝑋𝑙 𝑋𝑟
𝑋𝑚
𝑖𝑠

22
Torsional Interaction
The TI occurs between the electrical system and the mechanical turbine shaft
system, this is an electro-mechanical phenomenon.
To summarise, the occurrence of TI-SSR must fulfil the following conditions:
• A mechanical torsional mode at a frequency within sub-synchronous
frequency ranges
• The generator mass must participate with one of other swinging masses at
the torsional mode frequency
• The electrical system must induce a resonant component at a
complementary frequency to the mechanical frequency
For given turbine generators, their turbine shafts may have some fixed mechanical
torsional modes that lie within sub-synchronous frequencies ranges. The relationship
between the mechanical torsional frequency and the electrical resonant frequency that
can excite a torsional mode can be expressed as:
elesysTM fff − (2.7)
where TMf is the frequency of a torsional mode, sysf and elef are the system
frequency and the frequency of the electrical component.
A torsional mode can be excited when there is a sub-synchronous component at the
complementary frequency, and if the overall damping is not enough, the oscillation
grows and SSR event happens. The electrical sub-synchronous component can be
found in different cases, but most commonly in series compensated AC systems or can
be found with power electronic devices. In this thesis, the scope is limited to series

23
compensated AC systems. Then, the determination of the electrical sub-synchronous
component frequency is given as:
TCsysele XXff /= (2.8)
here CX is the impedance of series compensator, and TX is the total impedance of
the system, including the transmission line impedance, connected transformer leakage
impedance and the load impedance. The term 𝑋𝐶
𝑋𝑇⁄ is the compensation level
provided by series compensators.
Transient Torque Effect
TTE is mainly caused by system disturbances and the induced transient current. In
AC systems, sudden changes in the network can result in large transient current which
tends to oscillate at the natural frequency of the network. If there are no series
capacitors, the transient current is only DC current that can be damped quickly by the
system natural damping. However, with series capacitors, the transient current tends
to oscillate at a frequency determined by (2.8), which is below the synchronous
frequency. If there are more capacitor banks located in the network, there can be
multiple oscillation frequencies in the transient current. Similar to TI effect, if the
frequency of the sub-synchronous current is at complementary frequency of a torsional
frequency of the turbine shaft, a large torque oscillation can be excited since the
magnitude of torque oscillation is proportional to the magnitude of the transient current.
The TTE is a severe event since the fault current can cause a very high peak torque
and the situation in real power systems is very complex with many different sub-
synchronous frequencies.

24
2.4.3 Typical waveforms to describe SSR event
The SSR event affects both the mechanical system and the electrical system. It can
be observed in the Turbine-Generator (T-G) torque or in the line current flow.
(a) Electrical torque waveform and its zoom-in plot under SSR event
(b) Current waveform and its zoom-in plot under SSR event
Fig. 2.7 Typical waveforms and their zoom-in plots under SSR events
Fig. 2.7 gives typical waveforms for the T-G electrical torque and the line current
under the impact of SSR. The SSR is triggered at 1.5s by applying a large disturbance
and the torsional mode is at 16 Hz which is reflected in the electrical torque. The
complementary frequency to this torsional mode is 34 Hz and this sub-synchronous
current is found in the line current along with the synchronous component at 50 Hz.
SSR problem is very severe in real projects since it may break turbine shaft down
if unattended for a long time. The torsional oscillation can cause shaft masses to suffer

25
metal fatigue which will dramatically reduce the lifetime of the shaft system. In the
first SSR event, 1970, the turbine shaft broke down and was blown to miles away.
Therefore, SSR must be avoided in power systems with suitable countermeasures, i.e.
static and dynamic filters [38], dynamic stabilizer [39], and excitation system damper
[40].
2.5 STUDY METHODS FOR SSR
2.5.1 Frequency scanning
There are several analytical methods to investigate SSR, the frequency scanning
method is a widely used and effective tool for SSR study [41-46] , especially in IGE
study.
Frequency scanning technique calculates the equivalent circuit resistance and
impedance seen from the generator side, usually behind the stator windings of the
generator to consider the rotor resistance for IGE study. If the equivalent resistance
and impedance occur to be close to or below zero, the circuit can be expected to be
suffering oscillations. However, this is also the limitation of frequency scanning
method. The system impedance has to be seen from a certain generator side and the
rest components are equivalent to a passive circuit. In complex networks, to identify
SSR risks for different generating units, the frequency scanning must be repeated for
different system conditions at each generator terminal of interest.
In [47-49], some modifications were made to improve the performance of
frequency scanning method in large scale power system with higher complexities. The
function is also extended to SSCI study by optimising the discrimination algorithms.

26
2.5.2 Eigenvalue analysis
The dynamic behaviour of The dynamic behaviour of a power system can be
described with a set of non-linear first order differential equations [50]:
= 𝒇(𝒙, 𝒖) (2.9)
𝒚 = 𝒈(𝒙, 𝒖) (2.10)
where
f is the vector containing the set of first-order non-linear differential equations, x
and u are the vectors containing the state variables and input variables respectively. g
is the vector of non-linear algebraic equations, and y is the vector containing output
variables.
Linearising the system allows investigation on the system’s response to small
disturbances. Detailed linearization can be found in [50-51]. Then the vector x and y
in 2.9 and 2.10 can be expressed as:
∆ = 𝐀∆𝒙 + 𝐁∆𝒖 (2.11)
∆𝒚 = 𝑪∆𝒙 + 𝑫∆𝒖 (2.12)
where
𝐀 =
[ 𝜕𝑓1
𝜕𝑥1⋯
𝜕𝑓1
𝜕𝑥𝑛
⋮ ⋱ ⋮𝜕𝑓𝑛
𝜕𝑥1⋯
𝜕𝑓𝑛
𝜕𝑥𝑛]
𝐁 =
[ 𝜕𝑓1
𝜕𝑢1⋯
𝜕𝑓1
𝜕𝑢𝑛
⋮ ⋱ ⋮𝜕𝑓𝑛
𝜕𝑢1⋯
𝜕𝑓𝑛
𝜕𝑢𝑛]
𝐂 =
[ 𝜕𝑔1
𝜕𝑥1⋯
𝜕𝑔1
𝜕𝑥𝑛
⋮ ⋱ ⋮𝜕𝑔𝑛
𝜕𝑥1⋯
𝜕𝑔𝑛
𝜕𝑥𝑛]
𝐃 =
[ 𝜕𝑔1
𝜕𝑢1⋯
𝜕𝑔1
𝜕𝑢𝑛
⋮ ⋱ ⋮𝜕𝑔𝑛
𝜕𝑢1⋯
𝜕𝑔𝑛
𝜕𝑢𝑛]

27
Therefore, the matrices A, B, C and D contain the partial derivatives of the
functions in f and g to the state variables x and the input variables u. The characteristic
equation of matrix A is given in 2.13, and values of s which satisfy 2.13 are known as
eigenvalues of matrix A.
det(𝑠𝑰 − 𝑨) = 0 (2.13)
The stability in a small non-linear system can be obtained by the eigenvalues of the
matrix A [53]:
a. If the eigenvalues have negative real parts, the system is asymptotically stable;
b. If there are at least one eigenvalues having a positive real part, the system is
unstable;
c. If the eigenvalues have real parts that equal to zero, the system stability cannot
be determined based on the first approximation.
The disadvantage of eigenvalue analysis method is that only small system can be
analysed. Eigenvalue analysis method requires modelling of the system with necessary
state variables to describe the system condition. In large systems, the system matrix
can be of 500th order or more, which makes the computation a time-consuming task.
Some work has been done to solve large systems by selecting necessary state variables
only and optimising the programming [53-54].
2.5.3 Complex torque coefficient method
Complex torque coefficient method has been extensively applied in the SSR
analysis since it was first proposed by I. M. Canay [64]. Compared with the other tools
for SSR study like eigenvalue analysis and frequency scanning, the complex torque

28
coefficient method is easier to realize as it does not require linearization of complex
power systems. While the limitation is that the complex torque coefficient method can
be only applied to single T-G system with other components to be fixed frequency
sources [65]. But since the study system in this chapter is based on the single
transmission line system with one T-G, this disadvantage is not a problem.
To a T-G under study, its electromechanical dynamic under small signal
disturbance can be represented by the following relationship:
∆𝑇𝑒 = 𝐾𝑆∆𝛿 + 𝐾𝐷∆𝜔 (2.14)
where ∆𝑇𝑒 is the increment in the electrical torque, 𝐾𝑆 and 𝐾𝐷 are the synchronous
torque coefficient and damping torque coefficient, ∆𝛿 and ∆𝜔 are the increment in the
power angle and the generator rotor speed respectively. The relationship between
power angle 𝛿 and rotor speed 𝜔 is:
∆𝜔 =1
𝜔0
𝑑∆𝛿
𝑑𝑡 (2.15)
Assume a small disturbance at sub-synchronous frequency of 𝜌𝜔0 (𝜌 < 1) is
injected onto the rotor speed, then the phasor expression of (2.14) and (2.15) can be
derived as
∆𝜔 =𝟏
𝜔0(𝑗𝜌𝜔0)∆𝛿 = 𝑗𝜌∆𝛿 (2.16)
and
∆𝑇𝑒 = 𝐾𝑆(𝜌)∆𝛿 + 𝐾𝐷(𝜌)∆𝜔 (2.17)
where the term with a bar over it means it is in phasor form. Therefore, dividing
(2.17) with ∆𝜔 gives the expression for the damping torque coefficient at different
sub-synchronous frequencies depending on 𝜌:

29
∆𝑇𝑒
∆𝜔= −𝑗
1
𝜌𝐾𝑆(𝜌) + 𝐾𝐷(𝜌) (2.18)
Here 𝐾𝐷(𝜌) represents the damping factor at sub-synchronous frequency 𝜌𝜔0 for
the electrical system. If the mechanical damping is neglected, the requirement for a
stable SSR mode is related to 𝐾𝐷(𝜌) that
𝐾𝐷(𝜌) > 0 (2.19)
Therefore, the steps to obtain the 𝐾𝐷(𝜌) in time domain simulation can be
summarized as follow:
(a). For a certain operating point, inject a small disturbance onto the mechanical
torque input of the T-G:
𝑇𝑚 = 𝑇𝑚0 + ∆𝑇𝑚 = 𝑇𝑚0 + 𝑇𝜌 cos(𝜌𝜔0𝑡 + 𝜑𝜌) (2.20)
Here 𝑇𝑚0 is the initial mechanical torque input, and 𝜌𝜔0 represents the sub-
synchronous frequency (𝜌 < 1).
(b). After the injection of sub-synchronous torque ∆𝑇𝑚, simulate the system until it
reaches steady state again, and obtain the electrical torque 𝑇𝑒 and rotor speed 𝜔.
(c). Use Fourier Transform to obtain the phasor information of 𝑇𝑒 and 𝜔, for ∆𝑇𝑒
and ∆𝜔 at different frequencies 𝜌𝜔0, then calculate 𝐾𝐷(𝜌).

30
G
AC gridL CR
C
FSC
tcsc
CB
FFT divide
∆𝜔 & ∆𝑇𝑒
∆
∆𝑇
𝐾𝐷(𝜌)
𝑇𝑚0 + ∆𝑇𝑚
Fig. 2.8 An application of the complex torque coefficient method in measuring the
electrical torque in power systems
Fig. 2.8 shows the implementation of the complex torque coefficient method in the
FBM system. The electrical system including transmission line, series compensator,
TCSC and the AC grid, is equivalent to a circuit from the generator side.
2.6 CONVENTIONAL SOLUTIONS TO SSR PROBLEMS
Thefollowing solutions have been used to help reduce impacts of SSR on power
systems and generating units:
Static filter:
A static filter with specified bandwidth is suitable for known SSR modes in a power
system [66-67]. The configuration of a static filter can be either a L-C filter or a
damping circuit. When placed at the generator side, the filter needs to be in series to
block sub-synchronous currents to flow back to generator. Or the static filter can be
placed in parallel with the FSC as a damping circuit.
∆𝜔
∆𝑇𝑒

31
Dynamic filter:
A dynamic filter is an active device with self-adaptability to different SSR modes
[68-69]. The dynamic filter is placed in series with the generator and picks the rotor
speed derivation as input to extract the frequency of the SSR event. When sub-
synchronous component is detected, the dynamic filter can induce a sub-synchronous
voltage in opposite direction to compensate the sub-synchronous voltage in the
armature.
Dynamic stabiliser:
Dynamic stabiliser is achieved by thyristor controlled shunt reactors connected to
the generator to regulate sub-synchronous oscillations [71-72]. Generally, a shunt
reactor is placed at the low voltage winding of the generator to absorb the reactive
power. With the regulation of thyristor modules, the thyristor-controlled shunt reactor
can be extended for SSR mitigation. The input is the generator rotor speed derivation
and the thyristor regulation can induce suitable waveforms circulating in the shunt
circuit to damp the sub-synchronous oscillation.
Protective relays:
Protective relays are commonly used methods among SSR countermeasures [73-
74]. A relay can detect SSR event in the network and send control signals to trigger
other units like by-pass switches or circuit breakers. The detection of SSR event can
be achieved by either sensing rotor speed or sensing the generator armature current
flow.

32
NGH scheme:
In 1981, a configuration based on thyristor modules was proposed by N. G.
Hingorani [55]. This configuration consists of a series capacitor in parallel with a
resistor which is regulated by an anti-paralleled thyristor module. When sub-
synchronous current flows through the series capacitor, the voltage across the capacitor
is also impacted by the sub-synchronous distortion. By regulating thyristor gate pulses,
the parallel circuit can provide additional damping to mitigate SSR event.
According to [31], the mitigation of SSR events in the GB power system is mainly
achieved by installing filters and protective relays. However, there are some potential
solutions based on FACTS technology that have been proposed by researchers. Some
damping schemes are based on the controllability of power electronics, including
Static Var Compensator (SVC) [56-58], Static Synchronous Compensator
(STATCOM) [59-62] and TCSC [63].
In this thesis, the scope is limited to solutions with TCSC only.
2.7 SUMMARY
This chapter presents the background of series compensation technology and SSI
phenomena. The review highlights the FSC and SSR.
FSC in modern power systems allows a cost-effective solution to bulk power
transfer requirements though it has the drawback of bringing in potential SSR risks.
The design of a FSC requires system analysis over the power flow and the voltage
distribution. In industrial projects, a typical FSC is installed along with a damping
circuit and MOV arresters for protection. The design of FSC ratings is usually
determined higher than the system rating to face transient high current flow and
emergencies.

33
The term SSI is an overall definition including all interactions that occur within
sub-synchronous frequency ranges. The classification of SSI is generally divided into
three categories: SSR, SSCI and SSTI. This classification is based on the devices that
are involved in the interaction. However, with the development of power systems and
the integration of more controllable power electronics devices, new type of interaction
also occurs. A new type of SSI happened between the HVDC converter control system
and a weak AC grid in China. So far there is no definition about this type of SSI.
SSR events have been observed in 1970 and studied since that. SSR is caused by
the interaction between the turbine shaft natural torsional modes and the electrical
resonant component induced by the series R-L-C circuit. There are several study tools
to study SSR events, including frequency scanning, eigenvalue analysis, and complex
torque coefficient. In industrial projects, some countermeasures to SSR have been
applied, but the low adaptability to new system conditions and difficulties in
modifications limit their applications. Therefore, the current focus is on the mitigation
of SSR with FACTS devices.

34
Chapter 3
Principles of Thyristor Controlled Series Capacitor
TCSC is an advanced series compensator and is considered a solution to SSR
problems. As one of the members of Flexible AC Transmission System (FACTS)
family, TCSC has been used in modern power systems as a reinforcement.
In this chapter, a brief introduction about the development of FACTS devices is
given. The basic principles of TCSC and installed TCSC projects along with
applications are presented.
3.1 DEVELOPMENT OF FACTS DEVICES
Developments of FACTS devices have been moving rapidly during the past decades.
In HVAC systems, the main objective is to transfer power flow with the highest
security. However, with passive components, this task can be challenging since system
operators have a limited controllability over the impedance of power systems when
failures or problems occur. FACTS devices are proposed to allow a better control over
the power system in many key parameters, i.e. the system impedance or the terminal
voltage.
FACTS devices are based on power electronics technology which allows a very fast
response to system dynamics [75]. This fills the gap between different system control
levels and allow a much higher controllability for operators to smoothly operate the
system.
A variety of FACTS devices have been proposed to contribute to a flexible control
of system parameters. In the conventional power flow control, methods are limited to

35
the generator side, the transmission line compensator switching and voltage
regulations [76]. The fixed characteristics of the apparatus result in fixed power angles
which limit the stability of the whole power system. But with FACTS devices, the
smooth controllability allows a continuous variation in the system impedance and the
power angle, which is reflected by a higher stability in the power transfer.
The success of power electronics applications in power systems has promoted the
development of a production of more cost-effective devices with the capability to
withstand high voltage and current along with a fast response time. Among them, some
most widely used devices are listed here.
Static VAr Compensator (SVC): A shunt-connected device capable of providing
or consuming the reactive power. It can be used in the voltage control, the reactive
power compensation, the low-frequency oscillation damping and the stability
improvement.
Static Synchronous Series Compensator (SSSC): SSSC is a voltage source
inverter connected in series with the transmission line via a coupling transformer. It
allows flexible control over the system impedance by regulating the voltage and
current phase angles. Therefore, SSSC can be used to control the energy storage
system and to control the power flow and the system stability.
Unified Power Flow Controller (UPFC): UPFC is capable of controlling power
flow between parallel corridors, improving the system transient stability and
mitigating system oscillations. A typical UPFC configuration consists of an excitation
transformer, a boosting transformer and two voltage source converters.
Static Synchronous Compensator (STATCOM): STATCOM is similar to SVC
but it provides a faster response in the reactive power control to voltage variations.

36
Thyristor-Controlled Series Compensator (TCSC): This is a series connected
device aiming to provide a flexible control over the system impedance. It consists of a
series capacitor bank in parallel with a Thyristor-Controlled Reactor (TCR). TCSC is
majorly used for the power flow control and boosting, the stability improvement and
the SSR mitigation. In this thesis, the scope is limited to TCSC only.
3.2 THYRISTOR-CONTROLLED SERIES CAPACITOR
TCSC is an advanced series compensation technique with all benefits provided by
Fixed Series Capacitor (FSC) but is also capable of controlling the inserted impedance,
primary in a capacitive mode. The main objective of using TCSC is to improve the
power transfer capability but there are other benefits[77-80]:
• Improving the system stability
• Mitigating SSR problems
In AC power systems, the power transfer capability is determined by the terminal
voltage magnitudes at sending and receiving nodes, their phase angle difference, and
the overall impedance between the two ends.
Conventional solutions to reduce the overall impedance include building extra
transmission lines in parallel and inserting series capacitors which are controlled by
mechanical switches. Building extra lines is not a cost-effective method since it
requires a large amount of investment and may cause large impacts on the environment
nearby. This solution is not adopted by most system operators around the world.
Putting FSC is a common solution since series capacitors can compensate the voltage
drop caused by the line inductance and increase the power transfer capability by
reducing the overall inductive impedance of the system.

37
In the past decades, FSC controlled by mechanical switches has been used; however,
there are several limitations [77]:
• Lack of an effective controllability at high compensation levels
• Lack of a smooth controllability in variations of the compensation levels
• Re-inserting capacitors can cause a voltage offset across capacitors
• Low damping performance within sub-synchronous frequency ranges can
cause SSR
Compared with FSC, TCSC provides a more reliable performance in solving above
limitations, and this has been proved in practical projects around the world. The
configurations of a TCSC compensated system is shown in Fig. 3.1.
The configuration of a TCSC device is similar to a FSC device, except for the
Thyristor-Controlled Reactor (TCR) denoted as 𝐿𝑇𝐶𝑅 . 𝐿1 and 𝐿2 are two parts of a
transmission line. 𝐶𝑇𝐶𝑆𝐶 is the physical capacitor of TCSC which determines the
minimum capacitance of TCSC. A Metal Oxide Varistor (MOV) is used to protect
TCSC from over voltage conditions, and the By-pass switch allows disconnecting
TCSC from the network under fault conditions. A damping circuit is designed to safely
discharge the energy stored in capacitors with a spark-gap which triggers when the
discharging current is high.

38
𝐿𝑇𝐶𝑅
Vs Vr
MOV
By-pass swtich
Damping circuitSpark-gap
𝐿1 𝐿2
𝐶𝑇𝐶𝑆𝐶
Fig. 3.1 A typical configuration of series compensated systems with TCSC
3.3 PRINCIPLES OF TCSC OPERATIONS
3.3.1 TCSC control
The controllability of TCSC is enabled by thyristor modules. Firing instants of
thyristors are defined by the variable, firing angle α. This α is operated between 90°
and 180° for the forward thyristor, with reference to the positive-going zero-crossing
points of the capacitor voltage. In this way, thyristor conducting instants are
synchronised with the capacitor voltage zero-crossing points. Fig. 3.2 shows the
typical components of interests in a TCSC [82]. Terms 𝑖𝐿 and 𝑖𝑙𝑖𝑛𝑒 are the TCR current
and the line current respectively, while 𝑖𝐶 and 𝑢𝐶 is the capacitor current and voltage.
𝑇1 and 𝑇2 are the gate signals to the positive and negative thyristors respectively.

39
ic
Fig. 3.2 A simplified configuration of TCSC [84]
α
... ...
β
𝑖𝑙𝑖𝑛𝑒 𝑢C
𝑖L
𝑡0
𝑇1
𝑇2
Fig. 3.3 Typical waveforms in TCSC
When a TCSC device is fired under steady state conditions, the typical waveforms
of its TCR current (𝑖𝐿), the capacitor voltage (𝑢𝐶) and the line current (𝑖𝑙𝑖𝑛𝑒) , and the
relationship between 𝛼 and 𝑢C are shown in Fig. 3.3. Once the thyristor is conducting,
the current is generated by the capacitor voltage and the thyristor turn-off time is
determined at the instant when the current drops to zero. The period of the thyristor
conduction is denoted as 𝛽, in degrees. Assume the resistance of TCSC is neglected,

40
the relationship between the firing angle 𝛼 and the conduction angle 𝛽 can be derived
as:
α = π −β
2 (3. 1)
When thyristors are on, the current begins to circulate within the parallel circuit of
TCSC and provokes the capacitor voltage with a boost. This results in the capacitor
current to be boosted with small humps, as shown in Fig. 3.4. This circulating current
usually results in a higher peak current flow in the capacitor. Therefore, the design of
TCSC capacitor requires case studies and a higher current rating than the system
current rating.
Fig. 3.4 Typical waveforms of TCR current and the capacitor current in TCSC
3.3.2 Operational modes of TCSC
TCSC is usually operated in three different modes, aiming for different objectives:
the thyristor-blocked mode, the thyristor-bypassed mode and the Vernier mode [81].
The corresponding firing angles for these modes are 180°, 90°, and between 90° to
180°. TCSC is supposed to work within 90° to 180° and shall not go beyond this range.

41
The thyristor blocked mode: In this mode, thyristors are fully blocked and no
current is flowing through the TCR branch. This can be achieved by either sending no
triggering signals or setting the firing angle to 180°. In this case TCSC is just a series
capacitor and all conditions for FSC apply. Fig. 3.5 shows directions of current flows
in this mode.
Fig. 3.5 TCSC current flows in the thyristor blocked mode [81]
The thyristor bypassed mode: This mode occurs when the firing angle is set to
90° and thyristors are fully conducted. In this case, TCSC becomes a parallel L-C
circuit, and the overall impedance of TCSC becomes inductive. Fig. 3.6 shows the
current flows within TCSC in this mode.
Fig. 3.6 TCSC current flows in the thyristor bypassed mode [81]
The Vernier mode: Vernier mode refers to the condition where discrete current
flow within the TCR branch and it happens when the firing angle is between 90° to
180°. Due to the regulation of thyristors in the current flow through the TCR branch,
the RMS value of the TCR current can vary thus making the equivalent impedance of
C tcsc
L tcsc
line
I cap
I
C tcsc
L tcsc
line
I cap
Itcr

42
TCR changing from the base value of the TCR inductance to infinite. Depending on
the design of TCSC parameters, usually two vernier regions exist based on whether
TCSC apparent impedance is inductive or capacitive. Fig. 3.7 shows the current flow
in either modes respectively.
(a)
(b)
Fig. 3.7 TCSC current flows in two Vernier modes (a) inductive mode, (b)
capacitive mode [81]
3.3.3 Mathematical models of TCSC
Unlike FSC, TCSC has a very complex characteristic. The non-linearity due to
thyristors triggering makes it difficult to derive a mathematical representation suitable
for all frequency bands. Therefore, the commonly used model of TCSC is based on its
dynamics at the synchronous frequency, and the apparent impedance of TCSC at the
synchronous frequency can be derived [82]:
I
C tcsc
L tcsc
line
I cap
Itcr
Inductive
mode
I
C tcsc
L tcsc
line
I cap
Itcr
Capacitive
mode

43
XTCSC(α) = −𝑋𝐶 + 𝐶1(2(𝜋 − 𝛼) + sin(2(𝜋 − 𝛼)))
−𝐶_2 cos 2 (𝜋 − 𝛼)(𝜔 tan(𝜔(𝜋 − 𝛼)) − tan(𝜋 − 𝛼)) (3. 2)
where
C1 =X𝐶+𝑋𝐿𝐶
𝜋 (3. 3)
C2 = 4𝑋𝐿𝐶
2
𝑋𝐿𝜋 (3. 4)
X𝐿𝐶 =𝑋𝐶𝑋𝐿
𝑋𝐶−𝑋𝐿 (3. 5)
𝜔 = √𝑋𝐶
𝑋𝐿 (3.6)
and 𝐿 and 𝐶 are the inductance and the capacitance of TCSC.
According to (3.2), TCSC impedance against firing angle characteristic can be
plotted.
Fig. 3.8 TCSC impedance-firing angle characteristic
TCSC reactance (ohm)
18090
Firing angle (degree)
Inductive
Capacitive
Resonant area

44
Fig. 3.8 shows a typical TCSC impedance-firing angle characteristic. When the
firing angle is synchronised with the capacitor voltage, its operational range varies
within 90° to 180°, and the limits represent the fully conducted mode and the fully
blocked mode respectively. When the firing angle approaches to the middle of the
range, as indicated as the resonant area in Fig. 3.8, the TCSC impedance control
becomes more sensitive to changes in firing angles and the boost factor is moving to a
higher level. A boost factor is the ratio between the effective impedance of TCSC and
the base capacitor impedance of TCSC. In this case, even small distortions may lead
to a large variation in the TCSC impedance and the system can become unstable.
Therefore, there are limitations for the TCSC operational range and the boost factor,
which determines TCSC effective impedance over its base impedance, i.e. boost factor
< 3. Additionally, in practical projects, TCSC under high boost factors can only be
operated for a short term, i.e. <10 mins.
3.4 THE SELECTION OF TCSC PARAMETERS TO AVOID DUAL-
RESONANCE
The selection of the base capacitance in the design of TCSC project is based on the
system requirement. The base capacitance determines the compensation TCSC can
provide when TCSC is operated at the thyristor-blocked mode. Based on the
transmission system line impedance and the expectation for future power demands, the
capacitor of TCSC is chosen at a reasonable level. However, the selection of TCR
inductance can be varied to adjust the performance of TCSC according to system
requirements, i.e. a larger capacitive operational range [83, 84].
A factor, defined as ω in (3.6), is used to determine the ratio between the TCSC
base capacitance and the TCR inductance. From (3.2), it indicates that the factor ω

45
affects the characteristic of TCSC. Normally, as indicated in Fig. 3.8, TCSC has two
operational regions, the inductive region and the capacitive region. The effective
impedance of the TCSC varies with firing angles smoothly in the two regions.
However, there is a resonant region between the inductive region and the capacitive
region where TCSC effective impedance approaches to infinity. Therefore, the
relationship between the firing angle and TCSC operational regions can be
summarised in Table 3. 1.
Table 3. 1 indicates that 𝛼𝐿𝑙𝑖𝑚 and 𝛼𝐶𝑙𝑖𝑚 determine the ranges of different regions.
Here 𝛼𝐿𝑙𝑖𝑚 and 𝛼𝐶𝑙𝑖𝑚 are the higher and lower limits for the inductive region and the
capacitive region respectively. The determination of 𝛼𝐿𝑙𝑖𝑚 and 𝛼𝐶𝑙𝑖𝑚 is only affected
by the factor ω.
Table 3.1 The relationship between TCSC operational regions and firing angles
Range of firing angles Operational region
90° ≤ α ≤ 𝛼𝐿𝑙𝑖𝑚 Inductive
𝛼𝐿𝑙𝑖𝑚 ≤ 𝛼 ≤ 𝛼𝐶𝑙𝑖𝑚 Resonant
𝛼𝐶𝑙𝑖𝑚 ≤ 𝛼 ≤ 180° Capacitive
An example is given considering the TCSC base capacitance, 𝑋𝐶, to be 1 pu. By
varying ω, the TCSC impedance vs. firing angle characteristics are obtained with
Matlab plots, as shown in Fig. 3.9.

46
Fig. 3.9 The TCSC impedance against firing angle characteristics with different
factor 𝛚 values
From Fig. 3.9, it can be concluded that TCSC operational regions are affected by
the factor ω. When ω is varied between 1<ω<3, the range of the capacitive region is
increased with a smaller ω value, while the inductive region is narrowed.
However, if ω lies beyond the range 1< ω<3, the characteristic is changed. When
ω equals to 1, the configuration becomes a parallel resonant circuit, which must be
avoided. And if ω drops below 1, the effective impedance of the TCR, denoted as
𝑋𝑇𝐶𝑅,𝑒𝑓𝑓, is always larger than the capacitor impedance 𝑋𝐶. The effective impedance
of TCSC is always capacitive as
𝑋𝑇𝐶𝑆𝐶,𝑒𝑓𝑓 = −𝑋𝑇𝐶𝑅,𝑒𝑓𝑓∗𝑋𝐶
𝑋𝑇𝐶𝑅,𝑒𝑓𝑓−𝑋𝐶< 0 (3.7)
Fig. 3.10 shows the TCSC impedance vs. firing angle characteristic when the factor
ω is selected to be 0.7. It indicates that TCSC can only be operated under the capacitive
mode in this case. There is no resonant area in this case. When the firing angle is at
180°, thyristors are fully blocked and TCSC provides the minimum compensation level.

47
Fig. 3.10 The TCSC impedance characteristic plot when 𝛚 is smaller than 1
If ω further increases to be higher than 3, a situation occurs as the multi-resonance.
Fig. 3.11 shows an example of the TCSC impedance characteristic with ω set to 3.3.
Fig. 3.11 The TCSC impedance characteristic with 𝛚 higher than 3
From Fig. 3.11, within the operational range of TCSC, between 90° and 180°, there
are two resonant areas. This reduces the span of the TCSC operation in either the
inductive mode or the capacitive mode.
The flexible operational modes and the smooth controllability are the main benefits
of TCSC. To utilise these benefits, a reasonable selection of the factor ω is advised
between 2.3 and 2.8 [85, 86].

48
3.5 APPLICATIONS OF TCSC IN POWER SYSTEMS
3.5.1 Installed TCSC projects
There have been 10 TCSC projects commissioned in the world, located in the US,
Sweden, China, India and Brazil. The latest TCSC project was commissioned in the
GB power system by the National Grid in 2014. These TCSC projects are installed to
meet different system contingencies including the transient stability, power
oscillations, and SSR, etc.
The Kayenta TCSC project: The first TCSC project in the world is the Kayenta
TCSC project in 1990, referred to as the Advanced Series Capacitor before.
The Kayenta TCSC device is placed on a 230 kV transmission line of 320 km
between Shiprock to Glen Canyon [87]. The compensation is provided by two
capacitor modules of 55 ohms each. One of the capacitor module is split into two
segments of 40 ohms and 15 ohms. A TCR is placed in parallel with the 15 ohms
capacitor to form TCSC and to control the effective impedance. The main objective of
the Kayenta TCSC project is to improve the power transfer capability from 300 MW
to 400 MW.
The Slatt TCSC project: The second TCSC project is at Slatt substation on a 500
kV transmission line in 1995 in the US.
The Slatt TCSC device is split into six separate TCSC modules with individual by-
pass switches. Each TCSC module can provide a continuous capacitive impedance
between 4 Ωto 8 Ωand can be independently controlled from other modules. This
configuration of TCSC allows more control over the system impedance since each

49
TCSC sub-module is independent from other modules, but it also increases the
investment cost due to more components [88].
The Stode TCSC project: This TCSC project commissioned in 1997 in Sweden is
to reinforce the 400 kV transmission system connecting the hydro and nuclear power
generation in the north and the load centre in the south. The initial plan was to install
FSC to provide a compensation level of 70%, but the system was found affected by
SSR [89]. To mitigate SSR problems, the compensation is re-designed with FSC
providing 49% compensation level while TCSC providing 21% compensation level.
The Imperatriz TCSC project and The Serra da Mesa TCSC project: The two
TCSC projects were commissioned in 1999 to reinforce the North-South
interconnection line in Brazil [90].
The transmission line is around 1020 km long working at 500 kV, provided with a
total compensation level of 66%. A hybrid compensation scheme with both FSC and
TCSC are used, where FSC contributes 54% and TCSC contributes 12%. The
installation of these compensation allows the power transfer capability to be boosted
to 1300 MW. The main purpose of TCSC installation is to damp low-frequency
oscillations in the system [91-92].
TCSC projects in India: There have been three TCSC projects in India, the Kanpur
- Ballabhgarh TCSC project, the Rourkela – Raipur TCSC project and the Purnea-
Gorakhpur TCSC Project.
The Kanpur - Ballabhgarh TCSC project is the first TCSC project in India on a 400
kV, 400 km transmission line. TCSC is used in combination with FSC to provide a
total of 55% compensation, of which 20% is provided by TCSC [93, 94].

50
The Rourkela – Raipur TCSC project [95] is completed in 2004, providing a
maximum compensation level of 10% to a 400 kV system. The min purpose of the
TCSC project is to improve the power transfer.
The Purnea-Gorakhpur TCSC Project [96] is completed in 2012 as the largest
TCSC project in the world. The rating of the TCSC device is 1.7 GVAr to improve the
power transfer capability from 9.5 GW to 30 GW to power the northern industrial
region.
TCSC projects in China: The first TCSC project in China is commissioned in
2000 [97-98] at Fengtun site. The 500 kV transmission line is boosted from 1.6 GW
to 2 GW. The installation of TCSC is to avoid building an extra line in parallel [99].
Another Chinese TCSC project is at Pingguo substation in southern China to
improve the system transient stability and to solve SSR. The overall compensation
level is 40%, of which 35% is provided by FSC and 5% is provided by TCSC [100].
The Hutton TCSC project: The latest TCSC project in the world is commissioned
in late 2014 at Hutton substation in the GB power system [101]. This project is to help
meet the 2020 target in the UK as reinforcements to the Anglo-Scottish circuit. Studies
indicates that the power capacity is boosted by 33% from 3.3 GW to 4.4 GW [102].
The Hutton TCSC project reinforces the main 400 kV corridor that interconnects
the wind generations in Scotland and the load centre in England. TCSC is used to
provide 35% compensation level. Passive filter technology is chosen to prevent the
production of SSR [103]. Case studies in [103] indicates that TCSC could improve the
system transient stability and damp SSR.

51
3.5.2 Applications of TCSC
Applications of TCSC are enabled by the various control strategies in response to
different system problems, including the power oscillation damping, the power system
transient stability, the coordination with other controllers and the SSR damping [116].
The Power oscillation damping (POD) is a feature of TCSC to solve the power
oscillation problems in large power systems. With a longer transmission distance and
a higher power transfer, the inter-area oscillation is an inherent problem which can
lead to instability.
To solve this problem, researchers proposed different methods to optimise the
performance and parameters of the POD controller, including the 𝐻∞ optimisation
technique [104-107], the pole placement technique [108-110], and the Linear-
Quadratic Regulator (LQR) technique [111-112]. Some work was conducted to
investigate the optimised location of TCSC device based on economic considerations
and utilisation of device efficiency [40]. There have been different methods to find out
the optimised location including the sensitivity index based technique and the linear
programming technique [115].
The transient stability is caused by major system disturbances including circuit
breaker operations and relay system operations. Some papers presented the risk
analysis on transient instability in power system [117-118].
Authors in [119-120] mainly discussed the improvements in system transient
stability with installations of TCSC without designing extra controllers. The
effectiveness was studied in different system topologies and different system
conditions. Results indicated that the system transient stability can be improved by an
optimised placement of TCSC.

52
Additionally, some control algorithms for TCSC to improve the transient stability
were proposed in [121-122].
The coordinated control was discussed in [123-126] to avoid adverse interactions
among TCSC and other FACTS devices control systems. In [123-124] coordinated
control schemes for TCSC and SVC to improve the system transient stability were
proposed. In [125-126] coordinated controllers were designed to damp inter-area
oscillations with FACTS devices and HVDC links.
The SSR damping was studied with TCSC from the frequency response [127] and
the active damping controller [128]. The study on TCSC’s frequency response was
conducted based on the impedance model of TCSC [129-130]. Results indicate that
TCSC possesses a different characteristic from FSC and this characteristic improves
the SSR damping.
The SSR damping controller is a supplementary scheme for TCSC to mitigate SSR.
In [131] the author stated that even though TCSC is found capable of damping SSR, a
supplementary SSR damping controller is required to secure SSR mitigation. The
design of the SSR damping controller was proposed based on the observed-state
feedback method [132-133], the root-locus design method [131] and the electrical
damping method [134-136].
3.6 SUMMARY
In this chapter, the development of FACTS technology is briefly presented, and
some members of FACTS family are introduced. The review highlights the TCSC.
The industrial configuration of TCSC has been described and functions of relevant
components are discussed. The basic control of TCSC has been demonstrated in details,
including the synchronisation of the gate signals with the capacitor voltage, and

53
different operational modes of TCSC. The selection of TCSC parameters is also
discussed. The determination of the base capacitance is based on the system
requirements in future power transfer capability and compensation level, while the
inductance of the TCR can affect the impedance characteristic of TCSC. The study
with a factor 𝜔, which defines the relationship between the base capacitor impedance
and the TCR impedance, shows that the factor 𝜔 with different values can vary the
operational range of TCSC. A reasonable range of 𝜔 is between 2.3 and 2.8. Otherwise
the operational range of firing angle is narrowed and multi resonant areas may occur.
Existing TCSC projects around the world are discussed along with their key ratings.
The application of TCSC is majorly for power transfer boosts but TCSC is also
regarded as a solution to system stability problems. Some research on the system
transient stability, the power oscillation damping, the coordinated control and the SSR
damping are summarised.

54
Chapter 4
Inherent characteristic of TCSC in SSR mitigation
4.1 INTRODUCTION
TCSC has been suggested to have better performance than FSC in terms of SSR
issues [137-139]. Lots of research have been conducted on SSR mitigation with TCSC
controllability [132, 133, 140] and TCSC frequency response [141-142]. These results
indicate that TCSC can improve the modal damping within sub-synchronous
frequency ranges with the regulation of thyristors. Researches in [135, 142] on TCSC’s
impedance imply that TCSC could behave inductively within sub-synchronous
frequency ranges which can break the conditions of SSR. Some studies also indicate
that TCSC behaves negative resistive at synchronous frequency [143, 144], but there
is no further investigation into this phenomenon.
In this chapter, the contribution of TCSC in improving SSR damping is explained
with the power conversion ability of TCSC. The negative-resistive performance of
TCSC is studied and explained with the power conversion ability of TCSC. Various
case studies are conducted to investigate the effectiveness of the power conversion
ability in improving SSR damping and how TCSC parameters are affecting this ability.
4.2 SSR DAMPING VIA POWER CONVERSION OF TCSC
TCSC’s controllability is due to the regulation of the anti-paralleled thyristor banks,
which is controlled based on the synchronisation with the TCSC capacitor voltage or
line current. However, when sub-synchronous components occur in the system and
flow through TCSC, thyristors force-regulate these sub-synchronous components and

55
affect their waveforms, thus changing the energy carried by these sub-synchronous
components. In this section, this phenomenon is investigated.
4.2.1 Dynamics of TCSC with sub-synchronous injection
The control system of TCSC is based on the synchronisation with the fundamental
component of the TCSC capacitor voltage or the line current. The synchronisation is
achieved using Phase Lock Loop (PLL) to track the phasor information and eliminate
sub-synchronous or super-synchronous harmonics. There have been a lot of research
on how to improve the performance of PLL [64, 65, 145].
In a steady state, the capacitor voltage of TCSC is symmetrical to its zero-crossing
points if there is no harmonic distorting the system. However, with sub-synchronous
components in the capacitor voltage, the zero-crossing instants of the capacitor voltage
are varied. Fig. 4.1 shows the waveforms of the capacitor voltage with and without
distortions from sub-synchronous components. In this case, if the control system of
TCSC is still based on a constant firing angle control, the induced TCR current
becomes unsymmetrical and imbalanced.
Fig. 4.1 (a) shows the ideal capacitor voltage and TCR current waveforms without
distortions. The zero-crossing points of the capacitor voltage occur every 0.05s based
on a 50 Hz system. Fig. 4.1 (b) shows the impact of distortions from a sub-synchronous
component. Compared with Fig. 4.1 (a), the first zero-crossing point of the capacitor
voltage in Fig. 4.1 (b) is delayed. Since the firing instants of thyristors are kept the
same, the larger instantaneous capacitor voltage results in a larger TCR current, which
in turn accelerates the discharging and charging procedures of the capacitor voltage.
In this way, thyristors try to regulate the sub-synchronous component and bring the
zero-crossing point of the capacitor voltage back to the correct instant.

56
Similarly, the second zero-crossing point of the capacitor voltage in Fig. 4.1 (b)
occurs slightly earlier than expected. In this case, the induced TCR current is also
reduced and thus the discharging rate of the capacitor voltage is slowed, which
indicates that TCSC is trying to delay the zero-crossing of the capacitor voltage back
to its synchronised position.
(a) Capacitor voltage and TCR current waveforms without sub-synchronous
distortions
(b) Capacitor voltage and TCR current waveforms with sub-synchronous
distortions
Fig. 4.1 Changes in capacitor zero-crossing points affected by sub-synchronous
components
As shown in Fig. 4.1 (b), the first zero-crossing point of the distorted waveform is
slightly delayed from expected point. If left unattended, the next zero-crossing point

57
shall be further delayed. However, due to control of thyristors, the second zero-
crossing point arrives slightly earlier. This example indicates that TCSC has the ability
to bring the capacitor voltage’s zero-crossing points back to the synchronous
frequency, though sub-synchronous components are not fully eliminated, as can be
seen in Fig. 4.1 (b) that the capacitor voltage waveform is still distorted. It should be
noted that this ability is not obtained from a closed-loop control scheme but is inherited
from the basic operation of TCSC.
4.2.2 The resistive behaviour of TCSC
TCSC’s characteristic within sub-synchronous frequency ranges has drawn lots of
attentions from researchers. The inductive or capacitive sub-synchronous behaviour is
modelled and investigated [132-133], and results indicate that TCSC working under
high compensation levels can behave inductive within sub-synchronous frequency
ranges. Then the circuit becomes inductive and the condition that SSR occurs is broken.
Moreover, TCSC is also found to perform negative resistive at the synchronous
frequency [140-142]. In this section, the resistive behaviour of TCSC is investigated.
A method to study the resistive behaviour has been proposed in [140], as shown in
Fig. 4.2. TCSC is powered by an ideal voltage source at the synchronous frequency
and the control of thyristors is based on the synchronous capacitor voltage only. The
impact of sub-synchronous components on the operation of TCSC is tested by injecting
the sub-synchronous current at a small magnitude, i.e. 0.1 pu.

58
u (t)0
i (t)sub
iline
uc
Fig. 4.2 The study of TCSC resistive behaviour with the current injection method
The reaction of TCSC to the injected sub-synchronous current is directly reflected
in the capacitor voltage and the line current. Fig. 4.3 shows the procedure of deriving
TCSC resistance and reactance at both the synchronous frequency and the sub-
synchronous frequency. Fast Fourier Transform (FFT) is used on the capacitor voltage
𝑢𝑐 and the line current 𝑖𝑙𝑖𝑛𝑒 , to extract the magnitude and the phase angle of
fundamental components and sub-synchronous components. The resistance and the
reactance at the synchronous frequency or the sub-synchronous frequency are
calculated with corresponding signals in the format as follow:
𝑋 =𝑉𝑚
𝐼𝑚sin(𝑉𝑝 − 𝐼𝑝) (4.1)
𝑅 =𝑉𝑚
𝐼𝑚cos(𝑉𝑝 − 𝐼𝑝) (4.2)
where the subscripts ‘m’ and ‘p’ refer to the magnitude and the phase angle
respectively, and the subscripts ‘fun’ and ‘sub’ indicate the fundamental frequency and
the sub-synchronous frequency.

59
FFT
÷
- sin
cos× ×
uc
iline
Rtcsc,fun Xtcsc,sub
Vm,fun
Im,fun
Vp,fun
Ip,fun
Fundamental components
Subsynchronous components
÷
- sin
cos× Rtcsc,sub
Vm,sub
Im,sub
Vp,sub
Ip,sub
× Xtcsc,sub
Fig. 4.3 Block diagram used to deduce TCSC impedance at the synchronous
frequency and the sub-synchronous frequency
Table 4.1 Parameters of TCSC under test
TCSC
Compensation level after boosting (%)
Capacitance (uF) Inductance (mH)
35uF 40 mH 46%
Considering the test system configuration as shown in Fig. 4.2, and making TCSC
parameters as shown in Table 4.1, a study on the resistance of TCSC is conducted to
investigate the impacts of different firing angles, which is varied from 150° to 175°.
The injected sub-synchronous current is maintained the same in both magnitudes and
phases, but its frequency is varied at 17 Hz, 27 Hz and 37 Hz, to represent typical sub-
synchronous harmonics. The calculated TCSC resistance within sub-synchronous
frequencies are shown in below Fig. 4.4.

60
Fig. 4.4 TCSC resistance at 37 Hz, 27 Hz and 17 Hz with varying firing angles
Fig. 4.4 indicates the impacts of firing angle on TCSC resistive behaviours at sub-
synchronous frequencies. It shows that the resistance of TCSC within sub-synchronous
frequencies increase first with firing angle but then start to decrease after reaching a
peak value. The occurrence of this peak value varies within the sub-synchronous
frequency ranges. The trend shows that TCSC with a lower firing angle appears more
resistive at higher sub-synchronous frequencies, while larger firing angle makes TCSC
resistance decrease at the same frequency after reaching the peak point. When the
firing angle is approaching to 180°, which means thyristors are fully blocked and
TCSC is acting as FSC, the resistances at all sub-synchronous frequencies decreases
to zero.
Fig. 4.5 TCSC resistance at the synchronous frequency with varying firing angles

61
Fig. 4.5 shows that the TCSC synchronous resistance varies with firing angles when
injected sub-synchronous current is at 17 Hz, 27 Hz, or 37 Hz. It can be observed that
the negative resistance at synchronous frequency is maintained throughout all firing
angle ranges. However, when the firing angle is lower, TCSC’s synchronous resistance
has less response to changes in frequencies of injected voltages. If the firing angle
increases, the synchronous resistance is greatly affected by the frequencies of injected
current.
4.2.3 Relationship between the energy conversion and resistive
behaviour of TCSC
In Section 4.2.2, results indicate that TCSC behaves resistively at sub-synchronous
frequencies, and it also behaves as a negative resistance at the synchronous frequency.
In an AC system, a resistor causes power losses determined as square of current
multiplied by resistance. Similarly, a negative resistance at the synchronous frequency
represents that energy is transformed and extracted to the synchronous frequency.
Therefore, some numerical calculations are conducted upon power changes at both the
sub-synchronous frequency and the synchronous frequency, to investigate the
relationship between the resistive behaviours and power changes.
Considering the case study in Section 4.2.2, the injected sub-synchronous current
is at 37 Hz. The line current is measured and analysed with FFT to obtain information
of sub-synchronous components and synchronous components. Fig. 4.6 gives the
frequency spectrum of the line current.

62
Fig. 4.6 Frequency spectrum of the line current when the injected component is at
37 Hz
With the extracted voltage and current magnitudes using FFT, and the calculated
resistances at 37 Hz and 50 Hz, the power losses can be deduced respectively.
At 37 Hz, the current magnitude is 0.02623 kA, and the resistance is 133.4 Ω.
Therefore, the power loss at 37 Hz is
𝑃𝑠𝑢𝑏 = 𝐼𝑠𝑢𝑏2 ∙ 𝑅𝑠𝑢𝑏 = 0.026232 ∗ 133.4 = 0.092 MW (4.3)
At 50 Hz, the current magnitude is 0.808 kA, while the resistance is -0.14 Ω. Then
the power loss caused by the negative resistance is
𝑃𝑓𝑢𝑛𝑑 = 𝐼𝑓𝑢𝑛𝑑2 ∙ 𝑅𝑓𝑢𝑛𝑑 = 0.8082 ∗ (−0.14) = −0.0914 MW (4.4)
Comparing 𝑃𝑠𝑢𝑏 and 𝑃𝑓𝑢𝑛𝑑, the difference between them is around 0.6%, which can
be neglected. The positive power loss at 37 Hz is apparently transformed into a
synchronous component and the negative power loss can be regarded as a result of
injected power tranformed into synchronous power.
Similarly, another study based on case 1 is conducted with the injected sub-
synchronous voltage being tuned to 17 Hz instead, while other parameters are kept the
same. Fig. 4.7 is the frequency spectrum of the line current in this case.

63
Fig. 4.7 The frequency spectrum of the line current when the injected component is
at 17 Hz
At 17 Hz, the current magnitude is 0.02335 kA, and the resistance is 142.99 Ω.
Therefore, the power loss at 17 Hz is
𝑃𝑠𝑢𝑏 = 𝐼𝑠𝑢𝑏2 ∙ 𝑅𝑠𝑢𝑏 = 0.023352 ∗ 142.99 = 0.078 MW (4.5)
While at 50 Hz, the current magnitude is 0.807 kA, and the resistance is -0.098 Ω.
Then the power loss caused by the negative resistance is
𝑃𝑓𝑢𝑛𝑑 = 𝐼𝑓𝑢𝑛𝑑2 ∙ 𝑅𝑓𝑢𝑛𝑑 = 0.8072 ∗ (−0.098) = −0.079 MW (4.6)
Therefore, it can be observed that the power loss at 17 Hz matches the negative
power loss at 50 Hz with ignorable errors, which is around 1.3%.
The above two case studies indicate that TCSC’s resistive behaviours at sub-
synchronous frequencies are related to its negative resistive behaviour at the
synchronous frequency. The positive and negative resistive behaviours are due to
power conversions from sub-synchronous components to synchronous components. In
this way, since sub-synchronous components are partially transformed into
synchronous components, the interaction with these sub-synchronous components is
expected to be weakened. Thus the severity of SSR can be reduced.

64
4.3 THE STUDY SYSTEM FOR TCSC’S CONTRIBUTION IN SSR
MITIGATION
To investigate the SSR phenomena, an example system model is proposed by the
Institute of Electrical and Electronics Engineers (IEEE) Working Group [64]. The
FBM system is preferred than the GB three-machine system. The reason is that in both
systems only one turbine generator is studied in detail. In the GB three-machine system,
the other two grids are modelled as ideal voltage sources. Therefore, there is no actual
difference between the FBM system and the GB three-machine system in SSR study.
A detailed parameter list is given in Appendix I. Fig. 4.8 shows the system
configuration with turbine-shaft which is represented by a multi-mass model. L and R
are the transmission line inductance and resistance respectively. The variable capacitor,
denoted as C, represents the inserted compensation, which can be either FSC or TCSC.
Fig. 4.8 The IEEE FBM system configuration with turbine shaft model and series
compensation [64]
The FBM system is used to study a typical series-compensated transmission system.
According to [64], there are four torsional modes within sub-synchronous frequency
ranges that can be studied. Four masses (HP, IP, LPA and LPB) and an exciter mass
G
400kV 400kV
AC grid
Excitor
26/400kV
L C R
L=0.5 pu
S
S=896MVA
pf=0.9 R=0.06 pu
LPB
LPA
IP
HP

65
are connected to the generator mass. The series compensation levels that can excite a
SSR mode are listed in Table 4.2.
From Table 4.2, it can be concluded that the FBM system can suffer SSR at different
compensation levels, and each listed level corresponds to one torsional mode
respectively.
Table 4.2 SSR mode and corresponding series compensation level
Mode of oscillation Frequency Series compensation level (in 50 Hz system)
TM1 15.83 Hz 46%
TM2 20.22 Hz 36%
TM3 25.42 Hz 24%
TM4 32.26 Hz 13%
4.4 TCSC CHARACTERISTIC AND ITS IMPACTS ON MITIGATING SSR
PROBLEMS
4.4.1 TCSC and FSC comparisons under different compensation
levels
Three case studies in Table 4.3 with either FSC or TCSC to provide the
compensation individually are tested. In each case, the firing angle of TCSC is kept
constant at 160°. As summarised in section 4.2.4, TCSC at this firing angle has a
stronger ability to transform sub-synchronous components at higher frequencies than
that at lower frequencies. The case studies are used to compare the impacts of TCSC

66
in improving the electrical damping within sub-synchronous frequency ranges, with
that provided by FSC. The electrical damping is obtained with the complex torque
coefficient method in each case study.
Table 4.3 Parameters and corresponding compensation levels of TCSC and FSC for
defined cases
FSC
TCSC
Compensation level
after boosting (%) Capacitance
(uF)
Inductance
(mH)
Case 1 30uF 35uF 40 mH 46%
Case 2 60uF 65uF 27 mH 23%
Case 3 100uF 110uF 17 mH 13%
The frequency of the injected sub-synchronous current is controlled with the multi-
run block in PSCAD, with an increment of 1 Hz in each run. The frequency of the
disturbance ∆𝑇𝑚 ranges from 5 Hz to 45 Hz, to cover the sub-synchronous frequency
ranges. The electrical torque and the rotor speed are measured at the synchronous
generator side. By using FFT analysis on their derivatives, the phasor information can
be obtained. The details of the complex torque coefficient method are introduced in
Section 2.5.3 in the previous chapter.

67
Fig. 4.9 Electrical damping calculated with FSC in different cases
Fig. 4.9 shows the electrical damping measured when only FSC is in the network
regarding to the three cases. In case 1, there is a dip in the electrical damping at around
16 Hz, which is the frequency of TM1. Similarly, case 2 and case 3 have dips in
damping at around 26 Hz and 32 Hz. These results indicate that the three cases are
unstable and suffer SSR modes of TM1, TM3 and TM4 respectively.
Fig. 4.10 Electrical damping calculated with TCSC in three cases
When TCSC is used to replace FSC, and is operated at a constant firing angle, the
electrical damping is shown in Fig. 4.10. Compared with FSC, TCSC with the same
compensation level possesses a better overall electrical damping characteristic, which
is closer to zero or even positive at some frequencies. If the damping is positive, the
Frequency (Hz)
5 10 15 20 25 30 35 40 45
Ele
ctr
ica
l da
mp
ing
(pu
)
-15
-10
-5
0
5
TCSC in case 1
TCSC in case 2
TCSC in case 3
TM1 TM3 TM4

68
oscillation is expected to be damped. Damping dips caused by FSC are improved at
concerned SSR frequencies, from lowest -60 pu to lowest -12 pu. Besides, when TCSC
base impedance is lower, the overall damping characteristic is better, as indicated that
the overall damping in case 3 is better than that in case 1. Moreover, despite of the dip
at around 30 Hz in case 1, the overall trend shows that the electrical damping is better
at higher frequencies. This matches with the ability of the power conversion of TCSC
when the firing angle is selected to be 160°.
A simulation is conducted using the FBM system as shown in Fig. 4.10, and results
are shown in Fig. 4.11.
500
-500
1000
Act
ive
po
we
r(M
W)
-20
20
LPA
-LP
B t
orq
ue
(pu
)
0
1.0 2.0 3.0 4.0 5.0 6.00Time (sec)
1.0 2.0 3.0 4.0 5.0 6.00Time (sec)
(a) Active power with FSC at 57% compensation level
(b) LPA-LPB torque with FSC at 57% compensation level
0 250
500
Act
ive
po
we
r(M
W)
LPA
-LP
B t
orq
ue
(pu
)
2 4 6 8 100Time (sec)
(c) Active power with TCSC at 57% compensation level
(d) LPA-LPB torque with TCSC at 57% compensation level
0
0
1
2 4 6 8 100-1
Time (sec)
2
Fig. 4.11 Simulation results of the active power and the LPA-LPB torque
considering FSC or TCSC in case 1
In Fig. 4.11, the two plots on the left are the active power and LPA-LPB torque
when FSC is in the system. It can be observed that with FSC the system suffers SSR
problems when a fault is applied at 4s. The two plots on the right are the corresponding
performance with TCSC replacing FSC. A fault is also applied at 4s but the oscillation
is limited and grow in a slower rate than that with FSC. In 6s after the fault, the LPA-

69
LPB torque oscillation reaches around 2 pu, compared with that magnitude reaches
around 20 pu in 2s after the fault with FSC. The oscillation frequency is at around 16
Hz, and the result indicates that TCSC is contributing to better damping but it is not
enough to mitigate SSR in this case.
-1000
1000
Act
ive
po
we
r(M
W)
-10
10
LPA
-LP
B t
orq
ue
(pu
)
0
1.0 2.0 3.0 4.0 5.0 6.00Time (sec)
1.0 2.0 3.0 4.0 5.0 6.00Time (sec)
(a) Active power with FSC at 27% compensation level
(b) LPA-LPB torque with FSC at 27% compensation level
0250
500
Act
ive
po
we
r(M
W)
LPA
-LP
B t
orq
ue
(pu
)
2 4 6 8 100Time (sec)
(c) Active power with TCSC at 27% compensation level
(d) LPA-LPB torque with TCSC at 27% compensation level
0
0.5
1
2 4 6 8 100
0
Time (sec)
1.520
Fig. 4.12 Simulation results of the active power and the LPA-LPB torque
considering FSC or TCSC in case 2
In case 2, the system compensation level is reduced to 23% and the SSR frequency
is at 26 Hz. With FSC, as shown in Fig. 4.12 (a) and (b), the system performance is
very poor. The oscillation in LPA-LPB torque grows to around 15 pu in 2s after the
fault. However, as shown in Fig. 4.12 (c) and (d), TCSC provides a better damping
performance at 26 Hz and the oscillation in LPA-LPB torque is growing very slowly.
This result indicates that TCSC is more capable of damping SSR at higher frequencies
than at lower frequencies.
In case 3, the compensation level is further reduced to 13%, and the corresponding
SSR frequency is at 32 Hz. Fig. 4.13 (a) and (b) show the system performance with
FSC only, where the SSR problem becomes severe and the oscillation magnitude

70
grows to around 60 pu. However, with TCSC, the SSR is damped. As shown in Fig.
4.13 (c) and (d) that the active power has little distortions from the SSR event and the
oscillation in LPA-LPB torque is decreasing in its magnitude.
-500
500
Act
ive
po
we
r(M
W)
-50
50
LPA
-LP
B t
orq
ue
(pu
)
0
1.0 2.0 3.0 4.0 5.0 6.00Time (sec)
1.0 2.0 3.0 4.0 5.0 6.00Time (sec)
(a) Active power with FSC at 17% compensation level
(b) LPA-LPB torque with FSC at 17% compensation level
0250
500
Act
ive
po
we
r(M
W)
LPA
-LP
B t
orq
ue
(pu
)
2 4 6 8 100Time (sec)
(c) Active power with TCSC at 17% compensation level
(d) LPA-LPB torque with TCSC at 17% compensation level
0
0.5
1
2 4 6 8 100
0
Time (sec)
-1000
Fig. 4.13 Simulation results of the active power and the LPA-LPB torque
considering FSC or TCSC in case 3
In summary, the results of the above case studies are listed in the below table.

71
Table 4.4 Results summary of the three case studies
Case
number Stability
FSC
Stability LPA-LPB torque at
10s (peak-peak pu)
Stability LPA-LPB torque at
10s (peak-peak pu)
Case 1 Not stable 40 Not stable 3
Case 2 Not stable 30 Not stable 1.5
Case 3 Not stable 150 Stable 0.75
4.4.2 Impacts of different TCSC firing angles on the performance
of SSR damping
TCSC’s firing angle selection also has an impact on SSR damping performance.
The study is conducted upon varying firing angles in order to understand how the
damping performance can be influenced by varying firing angles. Parameters in case
1 in Table 4.3 are used and only TCSC is inserted in the network to provide the
compensation.
Fig. 4.16 shows the simulation results, with firing angles changed at 160°, 165° and
170°. As the compensation level is 46%, the SSR frequency is at 16 Hz. According to
the power conversion ability of TCSC and the resistive performance study in section
4.2.2, TCSC with a smaller firing angle has a better damping performance of SSR. The
reason for this is that the larger firing angle is, the shorter thyristors are conducted per

72
cycle. If the firing angle approaches to 180°, thyristors are fully blocked and TCSC
acts as FSC. In that case, TCSC has the same damping characteristic with FSC.
Simulation results match the study results in section 4.2.2 very well. When the firing
angle is 160°, as shown in Fig. 4.14 (a) and (b), the growth of SSR oscillation in LPA-
LPB torque is relatively slower. The magnitude in LPA-LPB torque oscillation reaches
only 2 pu at 10s. With the firing angle increasing, the damping of SSR provided by
TCSC gets poorer. As can be observed in Fig. 4.14 (c) and (d), the oscillation in the
LPA-LPB torque grows to 10 pu and the active power flow is obviously distorted with
sub-synchronous harmonics. A similar trend can be verified in Fig. 4.14 (e) and (f) that
the damping gets even poorer when the firing angle is increased to 170°.
250
500
Act
ive
po
we
r(M
W)
LPA
-LP
B t
orq
ue
(pu
)
2 4 6 8 100Time (sec)
(a) Active power with TCSC firing angle 160 (b) LPA-LPB torque with TCSC firing angle 160
0
0
1
2 4 6 8 100-1
Time (sec)
2
500
1000
Act
ive
po
we
r(M
W)
LPA
-LP
B t
orq
ue
(pu
)
2 4 6 8 100Time (sec)
(c) Active power with TCSC firing angle 165 (d) LPA-LPB torque with TCSC firing angle 165
0 -10
0
2 4 6 8 100Time (sec)
10
500
1000
Act
ive
po
we
r(M
W)
LPA
-LP
B t
orq
ue
(pu
)
2 4 6 8 100Time (sec)
(e) Active power with TCSC firing angle 170 (d) LPA-LPB torque with TCSC firing angle 170
0
-20
0
2 4 6 8 100Time (sec)
20
10
-10
Fig. 4.14 Simulation results of the active power and the LPA-LPB torque with different
firing angles

73
4.4.3 Impacts of different TCSC/FSC ratios on the performance of
SSR damping
Compared with FSC, TCSC is much more expensive. Therefore, a convenient way
is to install TCSC in a combination with FSC to reduce the cost. In practical projects
[146], TCSC is designed to contribute to 1/3 of the base compensation to maintain a
smooth controllability and SSR mitigating capability, but there are few studies on the
selection of the compensation level provided by TCSC. Therefore, four cases are
defined to investigate the impacts of different TCSC/FSC ratios on the overall damping
performance of SSR.
Table 4.5 Definition of studied cases
Overall compensation
45%
TCSC compensation
level (%)
FSC compensation
level (%)
Ratio
Case 1 22% 22% 1:1
Case 2 15% 30% 1:2
Case 3 11% 33% 1:3
Case 4 9% 36% 1:4
Table 4.5 gives the percentages of TCSC and FSC in the four cases. The ratio of
TCSC/FSC varies from 1:4 to 1:1 to investigate the overall damping performance with
different levels of TCSC. TCSC is controlled with a constant firing angle at 160° , the
boosting level is around 1.2 pu at this firing angle. The displayed TCSC compensation
in Table 4.5 is the boosted compensation level.

74
0
-100
100
Ca
pac
ito
r vo
ltag
e (k
V)
1.0 2.0 3.0 4.0 5.0 6.00Time (sec)
1
0.5
1.5
LPA
-LP
B t
orq
ue
(pu
)
0
250
0
1000
Act
ive
po
we
r(M
W)
500
750
1.0 2.0 3.0 4.0 5.0 6.00Time (sec)
25
0
50
TCSC
cap
acit
ive
re
acta
nce
(oh
m)
1.0 2.0 3.0 4.0 5.0 6.00Time (sec)
1.0 2.0 3.0 4.0 5.0 6.00Time (sec)
(a) TCSC capacitor voltage (b) LPA-LPB torque waveform
(c) Active power flow through TCSC (d) TCSC capacitive reactance
Fig. 4.15 Simulation results of case 1 when the ratio of TCSC/FSC is 1:1
In case 1, half of the compensation levels are provided by TCSC. The system
performance is shown in Fig. 4.15. In Fig. 4.15 (b), the LPA-LPB torque is oscillating
and the magnitude of the oscillation is growing slowly. This indicates the electrical
damping provided by TCSC in this case is good. However, the system is also suffering
a low-frequency oscillation, as shown in Fig. 4.15 (c) the active power flow plot. This
low-frequency oscillation is slowly damped.
0
-100
100
Ca
pac
ito
r vo
ltag
e (k
V)
1.0 2.0 3.0 4.0 5.0 6.00Time (sec)
1
0.5
1.5
LPA
-LP
B t
orq
ue
(pu
)
0
250
0
1000
Act
ive
po
we
r(M
W)
500
750
1.0 2.0 3.0 4.0 5.0 6.00Time (sec)
25
0
50
TCSC
cap
acit
ive
re
acta
nce
(oh
m)
1.0 2.0 3.0 4.0 5.0 6.00Time (sec)
1.0 2.0 3.0 4.0 5.0 6.00Time (sec)
(a) TCSC capacitor voltage (b) LPA-LPB torque waveform
(c) Active power flow through TCSC (d) TCSC capacitive reactance
Fig. 4.16 Simulation results of case 2 when the ratio of TCSC/FSC is 1:2

75
In case 2, the ratio is changed to 1:2 which means the percentage of TCSC is reduced.
In Fig. 4.16 (b) the severity of SSR problem gets higher than that in case 1. The
oscillation magnitude in Fig. 4.16 (b) reaches 1.5 pu at 6 s. The system still suffers
low-frequency oscillation when the fault is applied at 3 s and it is slowly damped.
0
-50
50
Ca
pac
ito
r vo
ltag
e (k
V)
1.0 2.0 3.0 4.0 5.0 6.00Time (sec)
1
0.5
1.5
LPA
-LP
B t
orq
ue
(pu
)
0
250
0
1000
Act
ive
po
we
r(M
W)
500
750
1.0 2.0 3.0 4.0 5.0 6.00Time (sec)
25
0
TCSC
cap
acit
ive
re
acta
nce
(oh
m)
1.0 2.0 3.0 4.0 5.0 6.00Time (sec)
1.0 2.0 3.0 4.0 5.0 6.00Time (sec)
(a) TCSC capacitor voltage (b) LPA-LPB torque waveform
(c) Active power flow through TCSC (d) TCSC capacitive reactance
2
Fig. 4.17 Simulation results of case 3 when the ratio of TCSC/FSC is 1:3
In case 3, Fig. 4.17, with more FSC replacing TCSC to provide compensation, the
SSR becomes more severe while the power swing caused by the step change in
generator output is not much affected.
0
-50
50
Ca
pac
ito
r vo
ltag
e (k
V)
1.0 2.0 3.0 4.0 5.0 6.00Time (sec)
1
0
2
LPA
-LP
B t
orq
ue
(pu
)
250
0
1000
Act
ive
po
we
r(M
W)
500
750
1.0 2.0 3.0 4.0 5.0 6.00Time (sec)
20
0TCSC
cap
acit
ive
re
acta
nce
(oh
m)
1.0 2.0 3.0 4.0 5.0 6.00Time (sec)
1.0 2.0 3.0 4.0 5.0 6.00Time (sec)
(a) TCSC capacitor voltage (b) LPA-LPB torque waveform
(c) Active power flow through TCSC (d) TCSC capacitive reactance
3
30
10
Fig. 4.18 Simulation results of case 4 when the ratio of TCSC/FSC is 1:4

76
With the ratio drops to 1:4, as seen in Fig. 4.18, the SSR problem becomes very
severe. Oscillations at the SSR frequency can be clearly observed in the capaccitor
voltage, the active power and the measured TCSC impedance. Regarding to the low-
frequency oscillation, the change in the ratio between TCSC and FSC fails to improve
the low-frequency oscillation damping very much.
From the comparison, it can be seen that the ratio between TCSC base impedance
and FSC impedance dramatically influence the SSR damping. With more
compensation contributed by TCSC, the SSR damping performance is much better.
However, regarding to low-frequency power swings, the ratio between TCSC and FSC
does not have obvious impacts on this performance. The low-frequency power swing
is more related to the characteristic at synchronous frequency, which are kept the same
in above tests. Therefore, the percentage of TCSC plays an important role in affecting
the SSR mitigation, but this needs to be balanced between the SSR mitigation
capability and the capital cost.
4.5 SUMMARY
TCSC inherent characteristic based on the thyristor’s regulation provides the ability
to transform the sub-synchronous energy into the synchronous energy. This ability can
be clearly observed in the dynamic behaviour of TCSC with sub-synchronous
distortions, that TCSC tries to bring the zero-crossing points of the capacitor voltage
back to the synchronous frequency.
The resistive performance of TCSC is explained by using the power conversion
ability. The positive resistance of TCSC at sub-synchronous frequencies consume the
energy carried by sub-synchronous components while the negative resistance at

77
synchronous frequency is the result of the energy being transformed into synchronous
components.
The effectiveness of the power conversion ability of TCSC is varied with TCSC
firing angles and is also varied with the frequency of the sub-synchronous component.
It can be concluded that at a specified sub-synchronous frequency, the best
performance of this ability occurs when the firing angle is around 150° to 160°. TCSC
at larger firing angle performs poorly in transforming sub-synchronous components
and the performance is improved with firing angles decreasing. However, if the firing
angle drops to below 150° the performance is still weakened.
Moreover, TCSC with larger firing angles is more capable of transforming sub-
synchronous components at lower frequencies than at higher frequencies. This trend
is changed when the firing angle decreases. When the firing angle drops to around
155°, TCSC is more capable of transforming sub-synchronous components at higher
frequencies.
An investigation is conducted with TCSC or FSC providing different compensation
levels, which cause the frequency of SSR to be varied. The results indicate that TCSC
with the larger firing angle provides a better damping performance to SSR at higher
frequencies. This matches the findings in the power conversion studies.
Another study on the combination of TCSC and FSC with consideration in both the
low-frequency oscillation and the SSR damping is conducted. Cases are defined with
various ratios between the TCSC base capacitor impedance and the FSC impedance.
The results indicate that the ratio has few impacts on system low-frequency oscillations
but can affect SSR damping greatly. With more percentages of compensation provided
by FSC, the system has a poorer SSR damping. When the ratio is down to 1:4, the SSR

78
severity is quite strong and the power flow is heavily distorted by sub-synchronous
harmonics within 3s.

79
Chapter 5
Experimental platform for sub-synchronous
resonance test with Thyristor-Controlled Series
Capacitor
5.1 INTRODUCTION
An experimental hardware platform has been designed and developed to validate
the effectiveness of the proposed controller. This chapter describes the details of the
TCSC-SSR experimental platform that has been designed at the laboratory level
including a grid emulator connected to a TCSC test rig. The motivation behind this
setup is to investigate the functions of the TCSC device in power systems, and sub-
synchronous interactions between turbine generator shaft systems and the series
compensator. Solutions using TCSC to solve the sub-synchronous problem are
proposed and validated on this platform.
In this chapter, the configuration of the platform is presented. The design of the
TCSC test rig and the method to select its parameters are demonstrated. Specifications
of the platform are introduced, including the TCSC prototype, the grid emulator, the
power amplifier and the AC grid. The control system and the software are also
demonstrated. To avoid the over-current situation when the main circuit breaker inside
the TCSC test rig is closed, a solution is proposed with both simulation and real-time
experimental results compared.

80
5.2 OVERVIEW OF THE EXPERIMENTAL PLATFORM FOR TCSC-SSR
TEST
5.2.1 Configuration of the experimental platform
Fig. 5.1 shows the overview of the experimental platform representing a turbine
generator emulator connected to the AC grid through TCSC compensated lines.
Fig. 5.1 An overview of the TCSC-SSR experimental platform configuration
The platform consists of a power system simulator, a controller platform, a TCSC
device connected to the AC grid via transformer, and a PC to monitor/control system
dynamics. Fig. 5.1 shows how the system is modelled. The HV generating unit
including the mechanical turbine shaft is modelled in RTDS, along with the
transformer and part of the transmission cable. The physical TCSC device is embeded
in the experimental platform. The connection between TCSC and the power system
simulator is achieved with the interface of PA and current feed-back signals. Control
RTDS
DSPACE
TCSCPAPower system simulator
PCB
G
Exciter
HP IPA IPB LP
Mechanical
torque
BUS 1
CC
Iabc
Vabc
BUS 2
kV V
A kA
S1
Main circuit
breaker
By-pass switch
Gate signalsMeasurements

81
signals of thyristors in the TCSC device are sent via a Printed Circuit Board (PCB)
from the dSPACE controller.
All components of TCSC are assembled within a cabinet of size 150cm x 100 cm x
50cm. There are two power sockets and one signal I/O socket on this cabinet. The
input power socket is connected to the output of the PA while the output power socket
is connected to the AC grid via an auto-transformer. These connections are via power
cables of 5-pin and 32A rating. The signal I/O socket is a D-Sub 26-pin connector, and
is connected to a PCB via a flat cable. These signals include both analogue
measurements of voltage/current within TCSC, and digital control/state signals, i.e.
thyristor triggering pulses or the state of a circuit breaker.
The control platform is implemented on the dSPACE MicroLabBox. Due to the
design of the dSPACE MicroLabBox, the digital and analogue sockets are separated
by the manufacturer. However, all analogue and digital signals of the TCSC are
assembled together on one PCB to save room in the cabinet, and are transmitted via
one D-Sub socket. To adapt to the digital and analogue socket requirements on the
MicroLabBox, a PCB is designed as an interface to re-arrange TCSC I/O signals to
individual pins. To achieve this, two 50-pin D-Sub sockets and one 26-pin D-Sub
socket are mounted on the PCB. The 26-pin socket is used to send/receive signals
to/from the TCSC device, while the two 50-pin sockets are used to separate digital
signals from analogue signals. All controls, monitoring, and system modifications are
completed on the PC and being downloaded to the dSPACE MicroLabBox.

82
5.3 DESIGN, PARAMETERS AND RATING OF THE TCSC TEST RIG
5.3.1 Topology design
To perform effective and flexible validation on the experimental platform, some
modifications are added to the general three-phase topology of TCSC. Fig. 5.2 shows
the single-line diagram of the designed TCSC device.
The TCSC device has two power connectors. The input socket is connected to the
output of the grid simulator amplifier, while the output socket is connected to the AC
power grid. The AC grid is also used to power up the internal PCB and measuring
units through a AC/DC converter that provides 10V/24V DC.
Fig. 5.2 Single line diagram of TCSC cabinet
𝐿𝑇𝐶𝑅
MOV
SW3
R
𝐿1
𝐶2
Input Output
SW2
AC
DC
PCB and measure
units
SW1
𝐶1
V
A
AA
SW4
SW5

83
In Fig. 5.2, the switch SW1 and the resistor R are used to add a fast and safe
discharging loop if the capacitors get overcharged. SW1 is the parallel resistor switch
and is open in normal conditions, and can be manually controlled.
The inductor 𝐿𝑇𝐶𝑅 is the TCR, and the inductor 𝐿1 represents part of the
transmission line inductance.
The circuit breaker located in the main circuit, SW2, is designed as the main circuit
breaker, which also acts as a protection scheme that can be opened automatically if the
current exceeds a certain level, i.e. 16 A. Manually control over SW2 is also available.
Two capacitors C1 and C2 can be used, and their capacitance are different. A switch
SW4 is used to insert/remove C1 into/from the network to enable a different
capacitance level. A MOV is used to protect the capacitors from over-voltage risks if
the capacitor voltage exceeds 50V.
SW3, the short circuit switch, is used to operate the TCSC in the by-pass mode.
This will by-pass capacitors and thyristors, and leave only the inductor L2 in the
network. This design is to minimise the influence of the main circuit breaker closure.
SW3 can be manually controller.
The power to internal measuring units and PCB is provided by the AC grid via a
AC/DC converter. The converter works under 100V/240V AC and outputs 10V/24V
DC to supply the operations of PCB and measuring units. A switch, SW5, is used to
control the power supply.
Internal measurements are achieved by placements of different sensors, voltage and
current measuring units, which are located at different locations to allow a full
monitoring during the operation of TCSC. These measurements are 3-phase capacitor

84
voltage, line current, TCR current and capacitor current. The output terminal voltage
are also measured as phase-to-phase voltage.
5.3.2 Selection of TCSC parameters
The TCSC device used in the lab is working under 240/415V, and is a scaled down
model of the real TCSC project located between the Hark substation and the Hutton
substation. The transmission circuit structure [147] is shown in Fig. 5.3.
G1
G2
G3
BUS1
FSC2
TCSC
BUS2 BUS3BUS4
BUS5
Fig. 5.3 Transmission circuit between Hark and Hutton substation in the UK [147]
The overall transmission system covers an 82 km long transmission line, which is
represented by the typical overhead line model, as an R-L circuit with 0.03 ohm and
0.7 mH per kilometre [148]. In Fig. 5.3, G1, G2 and G3 represent the Scottish power
system, the Wales power system and the England power system respectively. Bus 2
and Bus 3 are the Hark substation and the Hutton substation which is the main corridor
between the Scotland and England transmission systems.
To perform the scaling, the base impedance for the high-voltage and low-voltage
systems need to be addressed. For the high-voltage system, the power rating is
considered to be [147]:
𝑆 = 800 + 𝑗120 MVA (5.1)

85
TCSC is designed to provide variable compensation between 15% and 45%, and in
combination with FSC providing an extra 20% compensation. Therefore, the physical
capacitor of TCSC should be 15% of the total system impedance:
𝑋𝐶,𝑇𝐶𝑆𝐶 = 𝑋𝑆𝑌𝑆 ∗ 15% = 25 𝑜ℎ𝑚𝑠 ∗ 15% = 4.15 Ω, (5.2)
and 𝐶𝑇𝐶𝑆𝐶 =1
𝑋𝐶,𝑇𝐶𝑆𝐶∗𝜔0=
1
4.15∗2∗𝜋∗50= 767 uF (5.3)
The selection of the TCR is based on the physical capacitance of the TCSC, and the
square root of their impedance ratio should lie between 2.3 and 2.7. Here the ratio is
determined as 2.7. Then the TCR inductance is deduced as:
𝑋𝑇𝐶𝑅 =𝑋𝐶,𝑇𝐶𝑆𝐶
2.72 = 4.15Ω
7.29= 0.569Ω (5.4)
𝐿𝑇𝐶𝑅 =𝑋𝑇𝐶𝑅
𝜔0=
0.569 Ω
2∗𝜋∗50= 1.81mH (5.5)
Similarly, the capacitance of the FSC can be determined as:
𝑋𝐹𝑆𝐶 = 𝑋𝑆𝑌𝑆 ∗ 20% = 25 Ω ∗ 20% = 5.53 Ω (5.6)
and 𝐶𝐹𝑆𝐶 =1
𝑋𝐹𝑆𝐶∗𝜔0=
1
5.53∗2∗𝜋∗50= 575.6 uF (5.7)
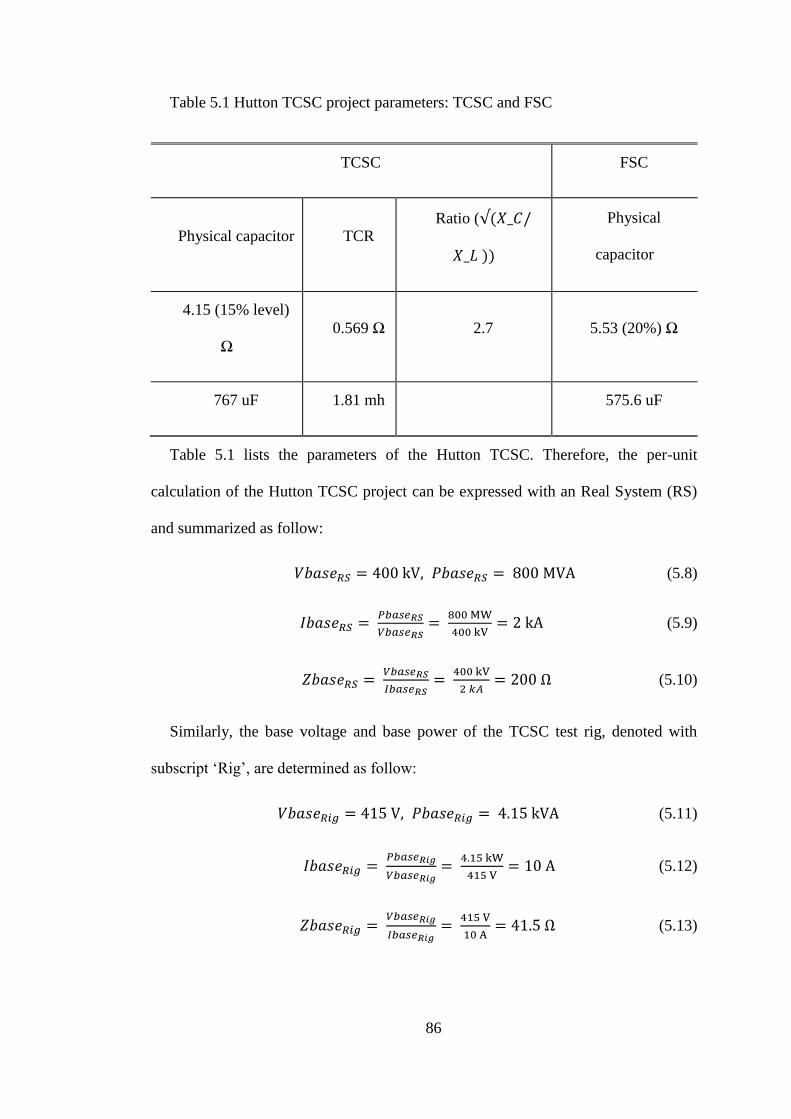
86
Table 5.1 Hutton TCSC project parameters: TCSC and FSC
TCSC FSC
Physical capacitor TCR Ratio (√(𝑋_𝐶/
𝑋_𝐿 ))
Physical
capacitor
4.15 (15% level)
Ω
0.569 Ω 2.7 5.53 (20%) Ω
767 uF 1.81 mh 575.6 uF
Table 5.1 lists the parameters of the Hutton TCSC. Therefore, the per-unit
calculation of the Hutton TCSC project can be expressed with an Real System (RS)
and summarized as follow:
𝑉𝑏𝑎𝑠𝑒𝑅𝑆 = 400 kV, 𝑃𝑏𝑎𝑠𝑒𝑅𝑆 = 800 MVA (5.8)
𝐼𝑏𝑎𝑠𝑒𝑅𝑆 = 𝑃𝑏𝑎𝑠𝑒𝑅𝑆
𝑉𝑏𝑎𝑠𝑒𝑅𝑆=
800 MW
400 kV= 2 kA (5.9)
𝑍𝑏𝑎𝑠𝑒𝑅𝑆 = 𝑉𝑏𝑎𝑠𝑒𝑅𝑆
𝐼𝑏𝑎𝑠𝑒𝑅𝑆=
400 kV
2 𝑘𝐴= 200 Ω (5.10)
Similarly, the base voltage and base power of the TCSC test rig, denoted with
subscript ‘Rig’, are determined as follow:
𝑉𝑏𝑎𝑠𝑒𝑅𝑖𝑔 = 415 V, 𝑃𝑏𝑎𝑠𝑒𝑅𝑖𝑔 = 4.15 kVA (5.11)
𝐼𝑏𝑎𝑠𝑒𝑅𝑖𝑔 = 𝑃𝑏𝑎𝑠𝑒𝑅𝑖𝑔
𝑉𝑏𝑎𝑠𝑒𝑅𝑖𝑔=
4.15 kW
415 V= 10 A (5.12)
𝑍𝑏𝑎𝑠𝑒𝑅𝑖𝑔 = 𝑉𝑏𝑎𝑠𝑒𝑅𝑖𝑔
𝐼𝑏𝑎𝑠𝑒𝑅𝑖𝑔=
415 V
10 A= 41.5 Ω (5.13)

87
Then the scaling factor can be obtained by dividing the RS base impedance by the
test rig base impedance:
𝑆𝑐𝑎𝑙𝑒 𝑓𝑎𝑐𝑡𝑜𝑟 (𝑝𝑢) = 𝑍𝑏𝑎𝑠𝑒𝑅𝑖𝑔
𝑍𝑏𝑎𝑠𝑒𝑅𝑆=
41.5
200= 0.2075 (5.14)
With the scaling factor, TCSC and FSC parameters given in table 5.1 can be scaled
to low-voltage level by multiplying their impedance by the scale factor. This gives
designed TCSC parameters and these parameters are given in table 5.2.
Table 5.2 Scaled parameters including the line impedance, the TCSC impedance
and the FSC impedance
Line inductor Line resistor TCSC capacitor TCSC inductor
Before scaling 57.4 mH 2.46 Ω 767 μF 1.81 mH
After scaling 11.91 mH 0.51 Ω 3696 μF 0.375 Mh
These components, TCSC capacitor and TCSC inductor as listed in Table 4.2, their
parameters after scaling make the final TCSC device.
5.3.3 Protection schemes
As the TCSC test rig is designed for SSR research, some protection schemes are
used to prevent the system from getting unstable and damaging the test rig.
Since the device is designed at a current rating of 10 A, an event-triggered scheme
under over-current conditions is installed by placing a sensor to monitor the current
that flows through the inductor 𝐿1, as denoted in Fig. 5.2. When this case occurs, the
main circuit breaker, denoted as SW2, will be opened to interrupt the current flow.
88
The over-voltage risk on capacitor is also considered and can be reduced by the
MOV to limit the voltage over capacitors to 50 V maximum. If this is the case, the
main circuit breaker will also be triggered to open, and meanwhile the paralleled
resistor will be inserted into the network to discharge capacitor voltages. This
operation is achieved by closing the circuit breaker next to the resistor, denoted as
SW1.
In order to maximise the network impedance during the start-up period, an extra
circuit breaker is designed to isolate the series connected capacitors thus leaving the
inductor L1 alone in the network to limit the start-up current. This circuit breaker is
denoted as SW3 and kept open until needed, i.e. to limit the impact current with closure
of the main circuit breaker SW2.
5.4 SPECIFICATIONS OF EQUIPMENT IN THE PLATFORM
5.4.1 Grid simulator amplifier
The platform uses a Spizenberger & Spies PAS 1000 amplifier. This amplifier
composes three four-quadrant amplifiers, resistive dump load, and a control unit. This
unit connects directly to the RTDS system and provides a high-fidelity three-phase
400V output to whichever experimental systems may be connected. The combination
of the RTDS and the amplifier effectively allows experimental systems to become part
of a physical AC network (scaled in power rating). A detailed datasheet can be found
in [149].
This grid simulator amplifier allows a rated power of 1000 VA output under
continuous operation, and a short-term operation with 20% over-rating for 10 min.
Circuit breakers are installed inside to cut emergent over-current or fault conditions if
the current exceeds 10 A.

89
The output control over the grid simulator amplifier is via three digital signal
channels, fed from the RTDS to form the waveforms of the three-phase analogue
signals. Output terminals are directly connected to the TCSC test rig to provide three-
phase voltage.
5.4.2 Turbine generator emulator
To emulate the turbine generator, there are generally two aspects to be modelled:
the mechanical dynamics within the turbine generator shaft and the electro-magnetic
dynamics. RSCAD, a software programme designed suitable for RTDS, is used to
model both the mechanical system of the generator shaft and the electrical system. The
model in RSCAD is shown in Fig. 5.4.
G
Exciter
HP IPA IPB LP
Mechanical
torque
Xline
BUS 1
GTAIx
GTAOx
A/D
D/A
XFSC
CC
Iabc
Vabc
BUS 2
Fig. 5.4 RSCAD model of the turbine generator and transmission system
In Fig. 5.4, the turbine shaft of the synchronous generator is modelled by a four-
mass system connected to the generator and the exciter. The parameters of them are
obtained from the IEEE FBM system and the operating frequency is modified to 50
Hz [150]. The transmission line is modelled by an inductor denoted as 𝑋𝑙𝑖𝑛𝑒 . A FSC,
denoted as 𝑋𝐹𝑆𝐶 , is placed to provide some series compensation of 30%. The analogue
signals are exchanged by using an interface which consists of two RTDS I/O cards,
GTAIx and GTAOx. In this way, the load is modelled by a controlled current source
whose signal is fed by external current measurements via card GTAIx. As for the

90
external network, the analogue voltage is provided by the grid simulator amplifier,
controlled by the digital voltage measurements at BUS 2 and transformed into
analogue outputs via card GTAOx with proper scaling.
5.4.3 The TCSC device
The TCSC test platform uses a three-phase 7kW TCSC device for power flow and
SSR mitigation studies. Upon the design, the TCSC device is supposed to have
interoperability with other devices in the lab, i.e. with voltage source converters or the
PMSG. In addition to the commonly used modes of a TCSC device, some extra
functions are added:
• Capacitor by-passed mode: both thyristors and capacitors in TCSC device are
by-passed that TCSC acts as a small inductor in this case
• Two-compensation-level FSC mode: with thyristors un-triggered, the number
of capacitors that are connected to the network can be selected between two
values
• TCSC mode: with thyristor triggered, the base capacitor value can be selected
The device is assembled in a cabinet as shown in Fig. 5.5. On the front panel, several
buttons and switches are placed to enable manually control over the device. For each
button, a LED is placed correspondingly to indicate the state of that button. The
location of each switch and their functions are related to section 5.3.1.

91
Fig. 5.5 An overview of the TCSC cabinet
The TCSC device is designed with two power connectors and one D-Sub connector
for signal exchanging. The input power connector is connected to the output of the
grid simulator amplifier, while the output socket is connected to the AC grid. The D-
Sub connector allows 26 channels of signals, including both digital and analogue I/O,
and is connected to the MicroLabBox for monitoring and control. The analogue signals
are measuring signals obtained from measuring units which are placed inside the
TCSC device. There are 14 measurements all together, and all the measurements are
limited between ±9 V by the PCB adaption board. The measurements ranges go as
follows:
• Load output phase-to-phase voltage (pin 3 and pin 6): ±981V → ±9V
• Capacitor voltage (pin 1, pin 2 and pin 4): ±324V → ±9V
• All current measurements (pin 5, pin 7 to pin 13): ±55A → ±9V
PCB power
supply control
button
Main circuit
breaker switch
(SW2)
Emergent stop
button Paralleled resistor
control button (SW1) Extra capacitor
enable/disable
switch (SW4)
D-Sub connector for
signal processing
5-pin power
sockets and
cables
input
output
Short circuit control
button (SW3)
92
The rest signals are digital signals, at either 0V or 5V. Control signals are taken as
inputs to control thyristors or switches, while states of some switches are outputted to
monitor the operation of the device. Definitions of these pins are given in the Appendix
II.
5.4.4 onfiguration of the TCSC and the test platform
The layout within the TCSC cabinet is shown in Fig. 5.6. Two capacitor banks lay
at the bottom of the cabinet, as C1 and C2. C1 consists of 6 capacitors (600 uF each)
per phase and C2 consists of 3 capacitors per phase. The two capacitor banks are
connected in parallel, with a selective switch to enable or disable C2 from the network.
In the middle are circuit breakers, AC/DC converters and contactors. The main
circuit breaker SW2 is connected to the front panel through the metal rod. On its right
is another metal rod which is used to control capacitors connected to the network. Two
AC/DC converters are used to supply power to different components at different
voltage levels. The black one on the right is providing 24V DC and the light green one
on the left is used to generate 15V DC voltage. The two contactors on the left of the
Fig. 5.6 represent SW1 (Paralleled resistor control) and SW3 (Short circuit control).
Behind them are the three-phase line inductors.
The PCB is used to assemble measurements and control signals for input and output
uses. On its left is the voltage measuring units.

93
Fig. 5.6 Components inside the TCSC cabinet
The connection between TCSC and the AC grid is via the 3-phase auto-transformer,
as shown in Fig. 5.7 (a). The input of the transformer is connected to the AC grid and
its output is connected to the output of the TCSC via a 5-pin power cable with banana
connectors. In Fig. 5.7 (b) the grid simulator amplifier is connected to the input of the
TCSC. Current measurements are taken by three current claps and are fed back to the
RTDS.
Main circuit
breaker SW2
3 phase C1
(6 capacitors
each phase)
3 phase C2
(3 capacitors
each phase)
Output
Input
Voltage
measuring
units
Contactors
SW1 and SW3
Extra capacitor
switch
PCB
Converters
Thyristors
Resistors

94
(a) (b)
Fig. 5.7 (a) The three-phase auto-transformer and (b) the grid simulator amplifier
5.4.5 Signal processing and dSPACE MicroLabBox
The measurements and signals control within TCSC device are assembled onto a
PCB and transmitted via a 26-pin flat cable. To extend the function of these signals,
another PCB is used to divide them to two different connectors, since the
MicroLabBox have separate digital and analogue I/Os. Fig. 5.8 shows the schematic
diagram and the completed interface PCB.
As shown in Fig. 5.8 (b), the D-Sub connector, denoted as X1, is a 26-pin connector
connected to the PCB within the TCSC device. The left and right connectors represent
the digital and analogue connectors respectively, as shown on the board, and both of
them are of 50 pins to fit the MicroLabBox specifications. The two colours of
connections, representing connections on the top and bottom layers of the PCB, are
red and blue respectively.
Current
transducer

95
Fig. 5.8 (a) shows the completed PCB using the design of Fig. 5.8 (b). In Fig. 5.8
(a), the bottom layer is upside. Therefore, the copper soldering shown represents the
blue connections in Fig. 5.8 (b).
(a) (b)
Fig. 5.8 (a) The completed PCB diversion board and (b) the schematic diagram of
the PCB diversion board
Connectors from Fig. 5.8 (a) are connected to digital and analogue sockets on
dSPACE MicroLabBox’s panel respectively, as shown in Fig. 5.9. For this product,
the manufacturer does not allow users to self-define pins but offers a table of pre-
defined functions for all pins. The definitions of these pins can be found on the top of
the MicroLabBox or in the manual [151].
X
1
Dig
ital
Analo
gue
Analo
gue
Dig
ital
X
1

96
Fig. 5.9 The front panel of the dSPACE MicroLabBox
As for the digital I/O connectors, the digital reference signal can be connected to
several pins pre-defined by the manufacturer, according to [151], these pins are
denoted as ‘GND’. However, as for analogue I/O connectors, the pin denoted as ‘GND’
cannot be used as analogue reference as they are shared with digital ground. In that
case, analogue measurements would suffer some levels of DC offset. As each pin is
allocated to a channel or its reference channel, the correct solution is to connect
measurements to different channels, i.e. ch1-ch24 according to [151], while the
analogue ground should be connected to corresponding channels with overbar, i.e. 𝑐ℎ1
and 𝑐ℎ1 . Therefore, these reference channels with overbars on the MicroLabBox are
parallel-connected to the analogue ground pin of the PCB.
5.4.6 dSPACE ControlDesk v5.5
The monitoring and control over TCSC device are achieved by using a dSPACE-
developed software suitable for MicroLabBox, the ControlDesk v5.5. This software is
linked to Matlab and provides an additional library DS1202 for ADC blocks for
MicroLabBox. Connections to DSpace have to be conFig.d and compiled by Matlab
Simulink and the supported library before the model runs in the ControlDesk v5.5, as
shown in Fig. 5.10.

97
PC
Simulink
ADCControl system
DAC
Ethernet
ControlDesk
interface
Monitoring
Switching
Control
MicroLabBox
Connector panel
DAC ADC
RAM
Fig. 5.10 Block diagram of the PC and the dSPACE MicroLabBox connection
In MATLAB Simulink, the ADC/DAC blocks are supported by the Real Time
Interface (RTI) block library, DS1202 in this case, which is a pre-defined library by
dSPACE [152]. The RTI allows a smart and automatic implementation of Simulink
models on the real-time hardware. After compiling, some files are generated by
MATLAB Simulink and can be read in ControlDesk v5.5. Particularly, the file
xxx.map is of most importance as it contains the information of the MATLAB
Simulink model and its variables, which can be monitored or controlled in
ControlDesk v5.5.
5.5 CONFIGURATION OF THE TCSC TEST RIG FOR SSR STUDY
The studied system is based on the IEEE FBM system and the mechanical
parameters of the synchronous generator and multi-mass models are obtained from
[150]. However, due to the output limitation is 1kVA from the grid simulator amplifier
in the laboratory, the study system is modified and scaled to fit this restriction. This
affects both the HV system model in the RTDS and the voltage level of the TCSC test
rig at LV.
For the TCSC device in the lab, parameters of its components cannot be changed,
i.e. the capacitance or inductance. However, this device is designed with the HV
system with a scale factor in base impedances between the LV and HV systems as

98
discussed in section 5.3.2. The scale factor should be kept the same to maintain a
correct information exchange between HV and LV systems, therefore, new ratings are
selected for both LV and HV systems. As the power rating of the grid simulator
amplifier is 1kVA, therefore, new voltage rating and current rating are needed.
Assuming the terminal voltage rating to be 50V rms phase-to-ground, and the current
rating is selected to be 6A rms per phase. Thus, the three-phase power can be
determined as:
𝑆3𝑝ℎ𝑎𝑠𝑒 = 3 ∗ 𝑉 ∗ 𝐼 = 3 ∗ 50 V ∗ 6 A = 900 VA (5.15)
The single phase power rating is 300VA. Then the per-unit calculation for the LV
TCSC test rig can be given as:
𝑉′𝑏𝑎𝑠𝑒𝑅𝑖𝑔 = 50 V, 𝑃′𝑏𝑎𝑠𝑒𝑅𝑖𝑔 = 300 VA (5.16)
𝐼′𝑏𝑎𝑠𝑒𝑅𝑖𝑔 = 𝑃′𝑏𝑎𝑠𝑒𝑅𝑖𝑔
𝑉′𝑏𝑎𝑠𝑒𝑅𝑖𝑔=
300 VA
50 V= 6 A (5.17)
𝑍′𝑏𝑎𝑠𝑒𝑅𝑖𝑔 = 𝑉′𝑏𝑎𝑠𝑒𝑅𝑖𝑔
𝐼′𝑏𝑎𝑠𝑒𝑅𝑖𝑔=
50 V
6 A= 8.33 Ω (5.18)
The new base parameters are denoted with a superscript to indicate that they are
designed for the modified study system. To keep the scaling factor obtained in section
5.3.2 unchanged, the new base values for the RS should be derived as:
𝑍′𝑏𝑎𝑠𝑒𝑅𝑆 = 𝑍′𝑏𝑎𝑠𝑒𝑅𝑖𝑔
𝑠𝑐𝑎𝑙𝑒 𝑓𝑎𝑐𝑡𝑜𝑟=
8.33 Ω
0.2075 pu= 40.16 Ω (5.19)
𝑀𝑎𝑘𝑒 𝑉′𝑏𝑎𝑠𝑒𝑅𝑆 = 50 𝑘𝑉, 𝑡ℎ𝑢𝑠 𝐼′𝑏𝑎𝑠𝑒𝑅𝑆 = 𝑉′𝑏𝑎𝑠𝑒𝑅𝑆
𝑍′𝑏𝑎𝑠𝑒𝑅𝑆=
50 kV
40.16 Ω= 1.24 kA (5.20)
𝑃′𝑏𝑎𝑠𝑒𝑅𝑆 = 𝑉′𝑏𝑎𝑠𝑒𝑅𝑆 ∗ 𝐼′𝑏𝑎𝑠𝑒𝑅𝑆 = 50 kV ∗ 1.24 kA = 62.25 MVA (5.21)
Therefore, parameters of the modified FBM system can be determined using above
calculation results. Their per-unit values are kept the same from [150], but their actual

99
values are changed with the new base values presented above. These components that
modelled in RSCAD/RTDS are given in Table 5.3, and the modified study system is
shown in Fig. 5.11.
Table 5.3 Parameters of components in the modified FBM system in
RSCAD/RTDS
Modified FBM system model parameters
Voltage Power
Transformer
leakage
impedance
Line inductor
FSC capacitor
(20%
compensation)
per-unit 1 pu 1 pu 0.14 pu 0.5 pu 0.128 pu
Actual
value 50 kV
186.75
MVA
18 mH (5.62
ohm)
64 mH
(20.08 Ω)
620 μF
(5.14 Ω)
G
Exciter
HP IPA IPB LP
Mechanical
torque
Xline
BUS 1
50kVXFSC
CC
Iabc
Vabc
BUS 2
186.75MVA
26kV/50kV 64 mH 620 uF
3600 uF
0.385 mH
kV V
A kA
50V
BUS 3
1.8 mH
Main circuit
breaker
Fig. 5.11 Single line diagram of the modified study system
5.6 SYNCHRONISING AND INTERCONNECTING GRIDS
In the AC system, the synchronization between two grids can be a challenge as the
transient current can exceed the rating level and cause damages to equipment when
two grids are interconnected. As in the TCSC test rig, the closure of the main circuit
breaker stands for the connection between the AC grid and the power system simulator.
As the phase angle of the AC grid is uncontrollable, a large phase angle difference

100
between the AC grid and the output of the power amplifier can cause high current
flowing through the TCSC test rig. This condition should be avoided and some
countermeasures must be taken.
Inserting external resistors will limit the transient current when closing the main
circuit breaker, and these resistors are by-passed when the test rig gets stable. However,
this requires additional three-phase resistors along with corresponding by-pass
switches, which is beyond the scope at the moment of design. Therefore, in this TCSC
test rig, the solution is to add a virtual temporary voltage source within the RTDS and
control the voltage output to limit the current during the start-up period. In this way, a
link between the AC grid and the simulated high-voltage system is established. Then
it can be regarded as the AC grid has been synchronized to the power system simulator
through a paralleled link.
Fig. 5.12 shows the configuration of for network synchronizing. Before the closure
of the main circuit breaker, the test rig stands as an open circuit. The voltage at bus 2
is regulated to be slightly lagging that at bus 3, by adding a time delay of 10 us to the
voltage measurements from the VT located at bus 3, and feeding that waveform to S2
with proper scaling up. This small time delay of 10 us is only 0.05% of a full cycle
time at 50 Hz, so it can be roughly neglected. The reason of applying this delay is to
make sure the simulation in RTDS runs smoothly during start-up period. Since the
phase difference between S2 and S3 is very small, i.e. 10us, it can be assumed that S2
represents S3 in the HV system in RTDS. In this way, the power system simulator,
whose voltage output is determined by the synchronous generator G, is synchronized
to S3 with some power flow through link between generator G and S2. Meanwhile,
the mechanical torque input to the generator G is reduced to make the output current
as small as possible. The power flow between generator G and load S2 can be

101
monitored and be limited to a secured level. When the main circuit breaker is closed,
the link between generator G and S3 is established and part of the power is delivered
through this link. This ensures that the power flowing between generator G and the
load S3 is limited to safe level and the transient current is controlled by regulating the
output of the generator G.
G
Exciter
HP IPA IPB LP
Mechanical
torque
Xline
BUS 1
50kVXFSC
CC
Iabc
Vabc
BUS 2
186.75MVA
26kV/50kV 64 mH 620 uF
kV V
A kA
50V
BUS 3
1.8 mH
VabcV kV
S2
S3S1
Main circuit
breaker 3600 uF
0.385 mH
By-pass switch
Fig. 5.12 The modified network for grid synchronizing
Once the system is stable, the link between S2 and Bus 2 will be removed by
opening the circuit breaker located next to S2. Then the system is restored to the system
depicted in Fig. 5.11.
5.7 COMPARISON BETWEEN SIMULATION AND REAL TIME
EXPERIMENT RESULTS
An initial test is carried out to examine the dynamics of the platform, with the
current mitigation technique. A simulation using RSCAD/RTDS is conducted based
on the system shown in Fig. 5.12, to check the transient current that would occur with
the main circuit breaker closed. All the physical components, the TCSC device and the
AC grid are modelled within RSCAD with the scaled parameters indicated in Fig. 5.12.
Fig. 5.13 shows the real-time simulation results of phase A current in RTDS. The
change in Fig. 5.13 (a) indicates the main circuit breaker is closed, which happens at
around 1s in the timeline. At this moment the capacitors and TCR are by-passed. The

102
transient current grows to -10 A peak value and oscillates at around 0.833 Hz, which
is a low-frequency oscillation. The oscillation is slowly damped that even after 4s the
oscillation is still observable. The steady-state current is expected to be around 5A
peak-to-peak.
(a)
(b)
Fig. 5.13 (a) Simulated phase A current after the closure of the main circuit breaker
and (b) after the opening of by-pass switch to put capacitors in the network
In Fig. 5.13 (b), continued from Fig. 5.13 (a), the change is due to the opening of
the by-pass switch. This puts capacitors into the network and causes the transient

103
current to grow to around 10 A peak value. Compared with the current in Fig. 5.13 (a),
the oscillation is damped in a faster way, which indicates the series compensation is
helpful in damping low frequency oscillation. After 2.5s the oscillation is damped and
the current gets steady to around 6A peak-to-peak.
Fig. 5.14 TCSC test rig phase A current measured by a CT during start-up period
Fig. 5.14 shows the real-time experimental phase A current obtained from a CT and
monitored on an oscilloscope, with the TCSC test rig connected. The CT is measuring
current that flows out of the grid simulator amplifier. The Y axis is the current
magnitude of 5A/step, and the X axis is the time of 1s/step. When the main circuit
breaker is closed, the current flow increases to around 9A peak value at its first swing,
which is slightly smaller than that in the simulation. The low frequency oscillation still
exists as that was illustrated in the simulation and it is slowly damped. After 3s, the
by-pass switch is opened to put capacitors in the network. This increases the current
Main circuit breaker closed By-pass switch opened

104
peak value to around 9.5A, which is within our limitations (<10A) and a bit smaller
than simulation results. These results indicate that the actions of synchronizing are
successful and the real-time experimental results match the simulation results with
very small difference.
5.8 SUMMARY
In this chapter, the TCSC platform for SSR testing is presented. The combination
of the grid emulator, RTDS, and the hardware TCSC device, allows a detailed research
into but not limited to SSR problems.
The connection of the TCSC platform is validated successfully with some basic
tests. An interconnection challenge is found in the commissioning mission and a
solution is proposed to solve the challenge by inserting a virtual parallel transmission
line. The effectiveness of the solution is tested in the simulation and then validated by
real-time experiments. The simulation results agree with the experimental result,
which proves the solution is working properly.
Other sub-synchronous interaction phenomena can also be studied on this platform,
i.e. SSCI between series compensation (provided by TCSC) and wind turbines
(modelled in RTDS). And the implementation of control systems based on the DSpace
module allows flexible modification to suit different scenarios.

105
Chapter 6
Mitigation of SSR– a supplementary damping
controller for TCSC
6.1 INTRODUCTION
There have been a lot of research on TCSC’s controllability and its application in
SSR mitigation. Among those installed TCSC projects around the world, TCSC is
usually operated with a constant firing angle control under normal conditions, while a
closed loop controller can be activated for power oscillation damping purposes, i.e. the
Kayenta TCSC project and the Slatt TCSC project [153]. In terms of SSR mitigation,
researchers have stated that the commonly used closed-loop controllers of TCSC
cannot mitigate SSR events but can contribute more damping compared with open-
loop control scheme [154-156].
To fully eliminate SSR impacts, some supplementary damping controllers have
been proposed [134, 157-161]. However, the robustness and adaptability of these
supplementary controllers limit their applications in real power systems. Therefore,
this chapter proposes a new supplementary controller for SSR mitigation. This
controller can effectively distinguish sub-synchronous components from fundamental
components, and act quickly to mitigate SSR. The novelty of this control scheme is
provided by the high-performance filter and multi-channel control loops. However,
some disadvantages may exist as the design of the control scheme need information
about the generator torsional modes, which is difficult to be obtained. Its control
structure and advantages compared with conventional controllers are discussed.

106
Validation of the effectiveness of the proposed controller is provided with simulation
results in PSCAD/EMTDC and hardware experimental platform.
6.2 REVIEW OF TCSC SUPPLEMENTARY DAMPING CONTROLLER FOR
SSR
The intention of actively using TCSC to mitigate SSR problems raises a lot of
research ideas. Among these ideas, a critical topic is the development of a
supplementary SSR damping control scheme. Unlike other closed-loop control
schemes of TCSC, the supplementary damping control scheme is only designed for
SSR mitigation. The control scheme should be only activated when SSR phenomenon
is detected in the network, which can be observed in the generator mechanical torques
and the electrical power output.
There have been several TCSC control schemes proposed in [162-165]. The
Synchronous Voltage Reversal (SVR) scheme discussed in [163, 164] presents the
maintenance of TCSC fundamental impedance through synchronising the voltage
zero-crossing points under impacts of SSR. An iterative calculation based on
instantaneous measurements is conducted within each cycle to vary the instants of
thyristor triggering. However, the control objective of this scheme is the impedance of
TCSC at synchronous frequency, and its effectiveness in SSR mitigation is limited
within lower TCSC boosting factors. A Sub-Synchronous Damping Controller (SSDC)
is proposed in [134, 157-158] and [160, 161] to measure and control the electrical
damping within sub-synchronous frequency ranges with TCSC. The generator rotor
speed derivation is used to extract the sub-synchronous information and to derive the
firing angle variation. The design of these SSDC is also difficult that the phase lags
caused by the conventional bandpass filter are varying at different sub-synchronous

107
frequencies. This increases the difficulty in designing phase compensators for different
SSR modes. In [159], the author proposed a solution with multi-channels to
individually design the phase compensator for different SSR mode. But the poor
performance of conventional bandpass filters is still causing problems in designing
when the sub-synchronous frequency is close to its cut-off frequency.
In the above control schemes, to detect the phasor information of sub-synchronous
components, remote signals at the generator side, including the rotor speed and the
generator electrical torque. This increases the phase delay between the actual sub-
synchronous components and measured sub-synchronous components and requires
careful phase compensation before these components can be used in the SSDC.
In order to utilise advantages of the supplementary SSDC, the adaptability and
robustness of SSDC needs to be improved. The priority is to extract the sub-
synchronous information with local measurements which can provide a faster response,
and to solve the variable phase lags caused at different sub-synchronous frequencies
caused by conventional bandpass filters.
6.3 A NEW CONTROLLER WITH LOCAL MEASUREMENTS ONLY
6.3.1 Control principle
To monitor SSR problems in power systems, there are several features that can be
used to indicate SSR occurrence. The sub-synchronous component in the line current
is one of them. In the GB power system, the compensated line is the main corridor
connecting the Scottish power system and the England power system. Therefore, if a
SSR event occurs, the sub-synchronous current must flow through TCSC device.
Compared with the remote information at generator side, the benefits of using the local
current measurements to extract sub-synchronous information are as follow:
108
• Local current measurements are easier to be obtained with CTs and the
communication delay caused by distant data transmitting can be avoided.
• By using D-Q transformation on the current measurement, the Q-axis
current contains only DC component and sub-synchronous components,
which solves the challenge to distinguish sub-synchronous component from
synchronous component.
• To detect SSR events, monitoring units are distributed at different
generators under SSR risks. This is simplified by centralising the SSR
detection at TCSC site only.
The mechanism of SSR problem is the sub-synchronous current flowing back to
turbine generator rotor to cause the interaction. Therefore, a solution to mitigate SSR
problems is to eliminate these sub-synchronous currents so that the interaction is
weakened or even removed.
The small signal test is a conventional method to investigate the frequency response
of TCSC [166-168]. Based on the test system configuration in [166], when the firing
angle is replaced by an oscillating component sub-synchronous frequency 𝜔𝑠𝑢𝑏, the
TCSC will induce a sub-synchronous current accordingly at a frequency of ω0 − 𝜔𝑠𝑢𝑏.
In this way, if a sub-synchronous current 𝑖𝑠𝑢𝑏 is observed in the system, the
supplementary controller can inject a harmonic ∆α into the firing angle of TCSC to
induce another sub-synchronous current 𝑖𝑠𝑢𝑏′. The target is to make sure the phase
different between 𝑖𝑠𝑢𝑏 and 𝑖𝑠𝑢𝑏′ is around 180°.
According to the simulation results using the small signal test, the phase angle of
the induced sub-synchronous current 𝑖𝑠𝑢𝑏
′ is between 80~100° lagging the phase
angle of ∆α . Therefore, when the sub-synchronous current 𝑖𝑠𝑢𝑏 is given, the

109
supplementary control can measure its phase angle and generate the harmonic firing
angle ∆α compensated by 90° lagging. In this way, the two sub-synchronous currents
are almost in opposite directions and will cancel each other. Fig. 6.1 shows the polar
diagram of the sub-synchronous current 𝑖𝑠𝑢𝑏, and how ∆ can be varied to induce the
𝑖𝑠𝑢𝑏′ to cancel 𝑖𝑠𝑢𝑏.
Fig. 6.1 Polar diagram of 𝒊𝒔𝒖𝒃, ∆𝒂 and induced 𝒊𝒔𝒖𝒃
′
It should also be noted that the SSR risks are all due to the installation of the series
compensation between the Scottish and England power systems. This means sub-
synchronous components can only be flowing through this corridor and can be
controlled by the series connected TCSC. With this control SSDC scheme, the
mitigation of SSR via this link can be achieved.
𝑖𝑠𝑢𝑏
∆α
80~100°
Phase variation
.
.
𝑖𝑠𝑢𝑏′
.
𝑖𝑠𝑢𝑏
𝑖𝑠𝑢𝑏′
∆𝛼

110
6.3.2 Structure of the SSDC
Compared with normally used closed-loop Constant-Impedance (CI) or Constant-
Current (CC) control, the supplementary SSDC is more focused on SSR mitigation
rather than normal TCSC operation. Therefore, the supplementary controller is only
activated when SSR problem is observed in the system, while the normal open-loop or
closed-loop control are operated throughout the time. This allows TCSC to recover to
designed compensation level fast after the occurrence of SSR.
The structure of the proposed SSDC cooperating with the basic control loop of
TCSC is depicted in Fig. 6.2. The input to the supplementary controller is the local
current measurement. For conventional damping schemes with bandpass filters, one
of the limitations is that their poor performance at frequencies close to the synchronous
frequency. For example, in a 50 Hz system, most bandpass filters can only cover up to
40 Hz. If a SSR event is at higher frequency that is close to 50 Hz, that sub-
synchronous component cannot be distinguished from the synchronous component. To
solve this challenge, a DQ transformation is conducted to obtain the d-axis component
of the line current. In this way, the synchronous component in the line current is
transformed into DC component, while the sub-synchronous component is changed to
its complementary frequency. Different from conventional bandwidth filters, several
independent Resonant Filters (RF) are used to replace the bandwidth filter. Each RF
focuses on a potential SSR frequency which can be obtained from manufacturers or
pre-studies. The d-axis current, 𝑖𝑑, is sent to these RFs. The outputs of the RFs will be
sub-synchronous components which will be considered as ∆α𝑖 after scaling and phase
compensation. Here 𝑖 denotes the ith torsional mode in potential. The sum of all ∆α𝑖
gives the overall ∆α forms the final firing signal input with α0.

111
∆α
Resonant
filter 1
Resonant
filter 2
Resonant
filter 3
Resonant
filter n
...
k1
k2
k3
kn
∑ id
∑
α0
iq
Phase
compensator 1
Phase
compensator 2
Phase
compensator 3
Phase
compensator n
ABC
/DQ
Iline
R LLine
CTCSC
Infinite
busLsys
TCRL
C FSCxT
VTCSC
Per Unit PLL
Synchronisation
signal
Firing pulse
generator
SSDC loop
...
Fig. 6.2 The structure of TCSC control strategy
The synchronisation signal is obtained based on the TCSC capacitor voltage
𝑉𝑇𝐶𝑆𝐶 through PLL block. Along with the finalised firing angle which is the sum of α0
and ∆α, the synchronisation signal are sent to the pulse generator to produce the firing
pulses. These pulses are delivered to thyristors accordingly. α0 is the reference firing
angle used in the open-loop control loop for TCSC.
6.3.3 Phase compensation
The phase compensation is to make sure the induced sub-synchronous current
would cancel each other to weaken the interaction between them and turbine shafts. In
conventional solutions, the phase compensators for different torsional modes have to
be approximated as the phase shifts caused by filters are varying at different
frequencies. Compared with conventional bandpass filters, whose bode diagram is
shown in Fig. 6.3 (a), an ideal RF has the advantage in its very high gain at the

112
characteristic frequency while very little gain at other frequencies. This allows a more
accurate information extraction than conventional bandpass filters. Moreover, a RF
does not cause phase shift at the characteristic frequency, as depicted in Fig. 6.3 (b).
This allows an easier design of phase compensator for each torsional mode and better
performance.
Fig. 6.3 (a) shows the typical band-pass filter with bandwidth from 20 Hz to 40 Hz.
When the input signal is through this filter, the phase shift caused by the filter varies
at different frequencies, up to ±45°. This is causing a lot of difficulties in designing
phase compensators for different SSR modes located within this bandwidth with
conventional SSDCs. An average phase compensation is to be made to approximately
compensate the phase shifts caused by the band-pass filter, where the performance of
the SSDC can be poor. However, in Fig. 6.3 (b), the phase shift challenge is solved
since the RF has very narrow frequency response and ideally zero phase shift. For any
given SSR modes, different RFs can be designed to extract the sub-synchronous
components without causing phase shift. This allows the designer to only consider the
phase compensator based on the polar diagram as shown in Fig. 6.1 to induce an
opposite sub-synchronous current.
The control diagram is constructed as shown in Fig. 6.3. The phase compensation
is provided by a fixed delay block, which compensates one quarter of a cycle time
related to the sub-synchronous component. The term 𝜔𝑐 is referring to the sub-
synchronous frequency, while 𝑇𝑐 is the corresponding cycle time. Since the delay
block does not affect the gain-frequency characteristic of the filter, its accuracy is
secured in this way.

113
(a) Frequency response for a conventional band-pass filter covering 20-40 Hz
(b) Frequency response for a RF with characteristic frequency at 30 Hz
Fig. 6.3 Comparisons between band-pass filter and RF in gain and phase margins
Resonant filter
Phase compensator
∑
Fig. 6.4 Control block diagram
For each potential torsional mode, a control loop as shown in Fig. 6.4 is designed.
The output of each control loop is denoted as ∆𝛼𝑖 and represents the harmonic at
𝑖𝑑
𝐾𝑠
𝑠2 + 𝜔𝑐2 𝑒−𝑗𝑇𝑐/4
∆𝛼𝑖
𝛼0
α

114
specific sub-synchronous frequency. The outputs of all control loops considering all
torsional modes will be summed together with the initial firing angle 𝛼0 to form the
final firing angle α sent to trigger TCSC device. However, it should be noted that if a
torsional mode is not excited at all, the corresponding output of that control loop will
be quite small so that it will not affect the overall control of TCSC.
6.4 SOFTWARE SIMULATION AND HARDWARE VALIDATION
6.4.1 Test system
The system under test is a single line transmission system as shown in Fig. 6.5. The
mechanical dynamics of the turbine generator is modelled as 4 masses, denoted as HP,
IPA, IPB and LP. The voltage rating of the high voltage system is at 50 kV and the
power rating is 186.75 MVA. The line inductance is 64 mH and a FSC of 620 uF is
inserted to provide a basic compensation of 30%. The low voltage circuit is to
represent the TCSC test rig in the lab, which is working at 50 V and 6 A rating. The
equivalent compensation provided by TCSC under 160° firing angle is around 15%.
The parameters of the multi-mass model are kept the same from the IEEE FBM system
[64], therefore, at 45% compensation the system is about to suffer SSR at 16 Hz. To
solve the problem, the proposed SSDC with local current measurements is
implemented.
Fig. 6.5 Single line diagram of the test system in PSCAD/EMTDC
G
Exciter
HP IPA IPB LP
Mechanical
torque
Xline
BUS 1
50kVXFSC
CC
Iabc
Vabc
BUS 2
186.75MVA
26kV/50kV 64 mH 620 uF
3600 uF
0.385 mH
kV V
A kA
50V
BUS 3
1.8 mH
Main circuit
breaker

115
6.4.2 Simulation results and hardware validation
In this test, the effectiveness of the proposed SSDC is validated. The synchronous
generator with multi-mass model to model the turbine mechanical dynamics is
delivering power along the transmission line to the AC load. Notice that the voltage
level is scaled down from 50 kV to 50 V in the TCSC test rig. in PSCAD simulation,
this is realised through controlled three-phase voltage source and current source, with
proper scaling up or scaling down respectively, as indicated in Fig. 6.5.
TCSC is activated throughout the test and the system is having a compensation of
45%. A disturbance is applied at 4s to excite SSR event. The SSDC is not activated
until 6s after SSR event. This is to allow SSR event to grow so that it can be clearly
observed. In real projects, a threshold of the magnitude of SSR in line current can be
used to trigger the SSDC.
Results from both digital simulation and experimental tests indicate the
effectiveness of the proposed SSDC (see Fig. 6.6 and Fig 6.7 respectively). Before the
SSDC is activated at around 10 s, the firing angle of TCSC is kept at 160 degree as an
open-loop control. During this period, the SSR event triggered at 4 s by the disturbance
is growing. This can be reflected from figure (b) rotor speed and figure (d) exciter-
generator torque waveforms. The zoomed-in plot of the exciter-generator torque
illustrates that the SSR event is at around 16 Hz. After 10s, when the SSDC is activated,
the firing angle is injected with an oscillating component which is derived based on
the sub-synchronous component in the line current. With this control, the growing
oscillations in the rotor speed and exciter-generator torque are being damped.

116
(a) (b)
(c)
(d)
Fig. 6.6 Waveforms of (a) TCSC firing angle (b) Generator rotor speed (c) TCR current and its Zoom-in (d) Excitor-Generator torque and its
zoom-in obtained from PSCAD

117
(a) (b)
(c)
(d)
Fig. 6.7 Waveforms of (a) TCSC firing angle (b) Generator rotor speed (c) TCR current and its Zoom-in (d) Excitor-Generator torque and its
zoom-in obtained on the experimental platform

118
By comparing the Fig. 6.6 and Fig. 6.7, the simulation results and experimental
results match each in the trend very well. There are a few differences in the start-up
period before 4s. This is due to the start-up period in PSCAD is very short while the
experimental platform has to be operated for a few minutes to get into the steady-state.
Therefore, the initial rotor speed and exciter-generator torque are much higher on the
platform than that in the PSCAD simulation. Additionally, the disturbance applied at
4s is causing more oscillations on the experimental platform than in the PSCAD
simulation. But the overall trend in SSR damping and control dynamics indicate the
experimental platform is following the simulation model.
6.5 SUMMARY
This chapter presents the limitation of conventional SSDCs and the challenge in
practical projects. The low adaptability of conventional SSDCs with band-pass filters
requires lots of work to redesign the control system for new SSR problems. Besides,
the unavoidable delay caused by remote information transmitting from the generator
side to the SSDC reduces the accuracy and reliability of conventional SSDC scheme.
To solve the above limitations and challenges, modifications are conducted to
propose a new supplementary damping control scheme. This new scheme uses only
line current as input to extract sub-synchronous information. The conventional band-
pass filter is replaced by the resonant filter with better performance in the phase and
gain margins. This increases the accuracy of sub-synchronous extraction and the
performance in discriminating sub-synchronous components from fundamental
components. Moreover, multiple control loops are designed to individually focus on
each known SSR frequency. As each control loop is operated and phase shifted

119
separately, it is easier to insert new control loops for new SSR modes without
distorting other loops.
The effectiveness of the proposed SSDC scheme is validated in PSCAD simulation
and the results are promising. A physical TCSC device is used to perform real-time
experiments. The matching of simulation results and experimental results indicate the
proposed SSDC is effective and the method is practical to be implemented on real
TCSC sites.

120
Chapter 7
Conclusions and future work
7.1 CONCLUSIONS
7.1.1 Inherent capability of TCSC in SSR mitigation
TCSC has been installed in the GB power system. To investigate the damping
contribution of TCSC in mitigating SSR, the inherent characteristic of TCSC is studied
in this work.
Due to thyristor regulation, a TCSC can behave as a resistor within sub-
synchronous frequency ranges even the thyristors are fired at a constant firing angle.
This resistive behaviour is caused by the power conversion ability of TCSC. Power
carried by sub-synchronous currents is transformed into components at the
synchronous frequency. In this procedure, sub-synchronous power seems to be
consumed by TCSC thus TCSC behaves like a resistor at these frequencies. At
synchronous frequency, additional power transformed from sub-synchronous
frequencies is induced by TCSC thus TCSC behaves as a negative resistor at
synchronous frequency.
With the power conversion ability, TCSC weakens the interaction between the
turbine shaft system and the electrical resonant component. The investigation into the
electrical damping provided by TCSC with the complex torque coefficient method
indicates that the trend of the improved electrical damping is similar with the
resistance-frequency curve of TCSC within sub-synchronous frequency ranges. It

121
proves the improved electrical damping is highly related to the power conversion
ability of TCSC at different frequencies.
7.1.2 Physical TCSC platform
A physical TCSC device is designed and configured to form the experimental
platform. The control system of the TCSC device is implemented on a master computer
via dSPACE MicroLabBox and the dSPACE ControlDesk software. The platform is
interconnected with the grid emulator, which consists of a RTDS and a power amplifier,
to establish the interaction with a HVAC system. Currents flowing through the TCSC
platform are fed back to the grid emulator to reflect dynamics in the platform.
The commissioning of the device is completed with some early tests on the basic
operations of TCSC and switching of circuit breakers. The results indicate that the
TCSC platform is working correctly. SSR is implemented on the platform for testing,
and can be clearly observed in the power and current flow through the platform.
Experimental tests find that TCSC with a constant firing angle control scheme is not
able to damp SSR. The proposed SSR damping controller is implemented on the
platform and the effectiveness is validated on the platform.
7.1.3 Control scheme of TCSC for SSR mitigation
The mechanical dynamics of the turbine generator shaft is modelled in the grid
emulator and the SSR problem is realised on the TCSC platform. The voltage output
of the grid emulator is observed with distortions of sub-synchronous components.
Supplementary damping controllers for TCSC to solve SSR have been proposed by
many researchers. But the limitations of conventional SSDC make it impractical in
industrial projects, due to the low adaptability of traditional band-pass filters and the
122
remote information required at the generator side. A modified damping control scheme
is proposed in this thesis to eliminate above limitations. The proposed damping control
scheme uses only local current measurements as input and adopts resonant filters to
replace conventional band-pass filters. Besides, the application of multi-channel
control loops allows the SSDC to be modified for new SSR modes since each control
loop is individually designed for one SSR mode only.
Validations of the effectiveness of the proposed SSDC scheme are conducted both
on the PSCAD/EMTC simulation software and on the experimental platform of TCSC.
The comparisons between the simulation results and the experimental results show
good agreements with each other. Both results indicate that the proposed SSDC
scheme provides a fast damping performance to SSR problems.
7.2 FUTURE WORK
The work presented in the thesis can be extended in the future as follow:
7.2.1 Integration of TCSC platform with Multi-Terminal DC
(MTDC) network
With the integration of the HVDC links into the GB power system, the interaction
between MTDC network and the AC system is drawing lots attention. Topics in this
area can be the impacts of faults in AC/DC systems on DC/AC networks, interactions
between DC converter control systems and power electronics devices in AC systems,
and protection schemes. At Cardiff University, a 4-terminal MTDC network has been
constructed and can be interconnected with the TCSC platform to form an AC-DC
interconnection.

123
7.2.2 Self-adaptive SSR damping controller for TCSC
Adaptability is an important feature of a damping controller. A controller with good
self-adaptability allows the controller to self-detect SSR frequency and activate
corresponding damping mode.
Under a SSR event, a reliable SSR damping controller is expected to fast
discriminate the SSR frequency from other components. By selecting reasonable
thresholds for the SSR detection and discrimination, the controller can switch to
different SSR damping modes when the detected SSR frequency moves from one
mode to another. However, this requires detailed case studies and an algorithm to
detect and analyse SSR frequencies. In conventional studies, SSR detection is usually
achieved by FFT analysis. This method is not practical in real projects as it requires
longer response time which is not acceptable under SSR impacts. A solution can be
based on Phasor Measurement Units (PMUs) which allows real time analysis and fast
response. The phase delay caused by remote communication can be compensated with
a fixed phase shift. Therefore, the future work should consider modifications in the
SSR detection method with PMUs.
7.2.3 Eigenvalue analysis of the proposed scheme
Eigenvalue analysis is a strong tool for system stability study. However, due to the
complexity of the power system and the high non-linearity of the proposed control
scheme, eigenvalue analysis is not realised in the thesis. It is recommended to model
the control scheme along with the studied system with space equations and work out
the eigenvalues to predict the stability of the system under certain operation points.

124
Reference
[1]. 2020 renewable heat and transport targets, [Online]. Available:
https://publications.parliament.uk/pa/cm201617/cmselect/cmenergy/173/17305.htm#
footnote-198
[2]. UK Energy Statistics, Q2 2017, [Online]. Available:
https://www.gov.uk/government/uploads/system/uploads/attachment_data/file/64775
0/Press_Notice_September_2017.pdf
[3]. Road map, [Online]. Available:
https://www.gov.uk/government/uploads/system/uploads/attachment_data/file/48128
/2167-uk-renewable-energy-roadmap.pdf
[4]. ENSG ‘Our Electricity Transmission Network: A Vision for 2020’, Full report,
July 2009.
[5]. System Operability Framework 2015, [Online]. Available:
https://www.nationalgrid.com/sites/default/files/documents/44046-
SOF%202015%20Full%20Document.pdf
[6]. Our Electricity Transmission Network: a vision for 2020, [Online]. Available:
https://www.gov.uk/government/uploads/system/uploads/attachment_data/file/48274
/4263-ensgFull.pdf
[7]. C. Hor, J. Finn, G. Thumm and S. Mortimer, "Introducing series compensation
in the UK transmission network," 9th IET International Conference on AC and DC
Power Transmission (ACDC 2010), London, 2010, pp. 1-5.

125
[8]. Working on high voltage series compensation equipment, [Online]. Available:
https://www.spenergynetworks.co.uk/userfiles/file/31B_OPSAF-
11_078%20Issue_1_MSP2.13_Working_on_HV_Series_Compensation_Equipment.
[9]. GE-Exclusive Technology Helps Scottish Utility Integrate Renewable Energy
and Meet Complex Grid Challenges, [Online]. Available:
http://www.gegridsolutions.com/press/GEExclusiveTechnology/
[10]. Mechanically Switched Capacitor with Damping Network (MSCDN)
[Online]. Available:
https://www.spenergynetworks.co.uk/pages/mscdn_series_compensation.aspx
[11]. China National Bureau of Energy, “Technical specifications of series
capacitor installation for 1000 kV system”, 2013
[12]. System Operability Framework 2014, [Online]. available:
https://www.nationalgrid.com/sites/default/files/documents/35435-
SOF%202014%20Final.pdf
[13]. Lesson Learned, “Sub-Synchronous Interaction between Series-Compensated
Transmission Lines and Generation”, published by NERC, July 26, 2011
[14]. M. Henderson, D. Bertagnolli, D. Ramey, “Planning HVDC and FACTS in
New England,” IEEE/PES Power Systems Conference and Exposition, 2009, PSCE
'09. pp. 1-3, 15-18 Mar. 2009.
[15]. M. Bongiorno, A. Petersson and E. Agneholm, “The impact of Wind Farms
on Subsynchronous Resonance in Power Systems”, April 2011

126
[16]. J. Adams, V. A. Pappu and A. Dixit, "Ercot experience screening for Sub-
Synchronous Control Interaction in the vicinity of series capacitor banks," 2012 IEEE
Power and Energy Society General Meeting, San Diego, CA, 2012, pp. 1-5.
[17]. A. S. Subburaj, et al. "Determination of Sub Synchronous Control Interaction
between Wind Turbines and Series Compensated Transmission Lines." International
Journal of Renewable Energy Research (IJRER) 6.3 (2016): 987-994.
[18]. Subsynchronous Torsional Interaction, [Online]. available:
http://www.tdworld.com/grill-grid-masters/subsynchronous-torsional-interaction
[19]. Y. Jiang-Hafner, et al. "Improvement of subsynchronous torsional damping
using VSC HVDC." Power System Technology, 2002. Proceedings. PowerCon 2002.
International Conference on. Vol. 2. IEEE, 2002.
[20]. Electric Power Research Institute, “HVDC Systems Control for Damping of
Subsynchronous Oscillations”, EPRI EL-2708, Final Report, October 1982.
[21]. H. Björklund, K.-E. Johansson and G. Liss, “Damping of Subsynchronous
Oscillations in Systems Containing Turbine Generators and HVDC Link”,
International Conference on Large High Voltage Electric Systems, Paris, 1980 Session,
August 27 – September 4.
[22]. Y. Wang, J. Meng, X. Zhang, L. Xu, "Control of PMSG-based wind turbines
for system inertial response and power oscillation damping", IEEE Transactions
Sustain. Energy, vol. 6, no. 2, pp. 565-574, Apr. 2015.
[23] E. Giraldo, A. Garces, "An adaptive control strategy for a wind energy
conversion system based on PWM-CSC and PMSG", IEEE Transactions on Power
Systems, vol. 29, no. 3, pp. 1446-1453, May 2014.

127
[24]. H. Liu et al., "Subsynchronous Interaction Between Direct-Drive PMSG
Based Wind Farms and Weak AC Networks," in IEEE Transactions on Power Systems,
vol. 32, no. 6, pp. 4708-4720, Nov. 2017.
[25]. C. Xia, J. Wang, and K. McMenemy, "Short, medium and long term load
forecasting model and virtual load forecaster based on radial basis function neural
networks", International Journal of Electrical Power & Energe Systems, Vol. 32, No.
7, pp. 743-750
[26]. K. Clark, "Overview of subsynchronous resonance related phenomena," PES
T&D 2012, Orlando, FL, 2012, pp. 1-3.
[27] IEEE Committee Report, "First benchmark model for computer simulation of
subsynchronous resonance," IEEE Transactions on Power Apparatus and Systems,
vol. 96, no. 5, pp. 1565-1572, Sept. 1977.
[28]. IEEE SSR Working Group, "Proposed Terms and Definitions for
Subsynchronous Oscillations," IEEE Transactions on Power Apparatus and Systems,
vol. PAS-99, no. 2, pp. 506-511, March 1980.
[29]. IEEE SSR Working Group, “Terms, Definitions and Symbols for
Subsynchronous Oscillations,” IEEE Transactions on Power Apparatus and Systems,
vol. PAS-104, no. 6, pp. 1326-1334, June 1985.
[30]. P. Kundur, Power system stability and control. Vol. 7. New York: McGraw-
hill, 1994. Chapter 15, pp. 1026-1060
[31]. P. M. Anderson, B. L. Agrawal, and J. E. Van Ness. Subsynchronous
resonance in power systems. Vol. 9. John Wiley & Sons, 1999, Chapter 1, pp 3-4

128
[32]. M. C. Jackson, et al. "Turbine-Generator Shaft Torques and Fatigue: Part I-
Simulation Methods and Fatigue Analysis." IEEE Transactions on Power Apparatus
and Systems 6 (1979): 2299-2307.
[33]. D. N. Walker, S. L. Adams, and R. J. Placek. "Torsional vibration and fatigue
of turbine-generator shafts." IEEE Transactions on Power Apparatus and Systems 11
(1981): 4373-4380.
[34]. R. Qual and A. C. Schwalb, discussion of reference 4, IEEE Transactions on
Power Apparatus and systems, Vol. PAS-94, No. 5, pp. 1887-1888, Sep/Oct 1975
[35]. D. N. Walker, et al. "Results of subsynchronous resonance test at
Mohave." IEEE Transactions on Power Apparatus and Systems.Vol. 94. No. 5 pp.
1878-1889, 1975.
[36]. D. G. Ramey, A. C. Sismour, and G. C. Kung. "Important parameters in
considering transient torques on turbine-generator shaft systems." IEEE Transactions
on Power Apparatus and Systems Vol. 1, pp. 311-317, 1980.
[37]. W. Watson, and M. E. Coultes. "Static exciter stabilizing signals on large
generators-mechanical problems." IEEE Transactions on Power Apparatus and
Systems Vol. 1 , pp. 204-211, 1973.
[38]. IEEE Committee Report, "Countermeasures to Subsynchronous Resonance,"
ibid, v. PAS-99, n. 5, Sept/Oct 1980, p. 1810-1817.
[39]. G. D. Jennings, R. G. Harley and D. C. Levy, "Subsynchronous resonance of
a power station with two identical generating units," IEEE Proceedings -Generation,
Transmission and Distribution, vol. 133, no. 1, pp. 33-43, January 1986.

129
[40]. B. L. Agrawal and R. G. Farmer, "Use of Frequency Scanning Techniques for
Subsynchronous Resonance Analysis," IEEE Transactions on Power Apparatus and
Systems, vol. PAS-98, no. 2, pp. 341-349, March 1979.
[41]. J. M. Undrill and T. E. Kostyniak, "Subsynchronous oscillations part 1 -
comprehensive system stability analysis," IEEE Transactions on Power Apparatus
and Systems, vol. 95, no. 4, pp. 1446-1455, July 1976
[42]. EPRI/DCG Report EL-7321, “Electromagnetic transients program – version
2: revised application guide,” Nov 1991
[43]. B. Porkar, etc., "Multi-port frequency-dependent network equivalent for
electromagnetic transient studies," Proceedings of the 37th Annual North American
Power Symposium, 2005, pp. 287-295.
r[44]. D. N. Walker, C. E. J. Bowler, R. L. Jackson, and D. A. Hodges, "Results of
subsynchronous resonance test at Mohave", IEEE Transactions on Power Apparatus
and Systems, vol. PAS-94, no. 5, Sep./Oct. 1975
[45]. B. L. Agrawal, R. G. Farmer, "Use of Frequency Scanning Techniques for
Subsynchronous Resonance Analysis", IEEE Transactions. on Power Apparatus and
Systems,Vol.PAS-98, No.2, pp.341-349, Mar./Apr. 1979.
[46]. Y. Cheng, M. Sahni, D. Muthumuni, and B. Badrzadeh, “Reactance Scan
Crossover-Based Approach for Investigating SSCI Concerns for DFIG-Based Wind
Turbines”, IEEE Transactions On Power Delivery, VOL. 28, NO. 2, pp. 742-751, Apr.
2011.

130
[47]. P. Belkin, “Event of 10-22-09,” presented at the CREZ Tech. Conference,
[Online]. Available: www.ercot.com/content/meetings/rpg
crez/keydocs/2010/0126/8Belkin_Event%20of%2010.ppt
[48]. J. Milanovic and A. Adrees, "Identifying Generators at Risk of SSR in Meshed
Compensated AC/DC Power Networks", IEEE Transactions On Power Systems, VOL.
28, NO. 4, pp. 4438-4437, Nov. 2013.
[49]. Y. Cheng, S. H. Huang, J. Rose, V. A. Pappu and J. Conto, "ERCOT
subsynchronous resonance topology and frequency scan tool development," 2016
IEEE Power and Energy Society General Meeting (PESGM), Boston, MA, 2016, pp.
1-5.
[50]. P. M. Anderson, B. L. Agrawal and J. E. Van Ness, "SSR Eigenvalue
Analysis- Subsynchronous Resonance in Power Systems”, 1, Wiley-IEEE Press, 1990,
pp.288-298
[51]. M. Ilic, J. Zaborsky, “Dynamics and control of large electric power systems”,
New York, US, John Wiley & Sons, Inc., 2000
[52]. J. G. Sllotweg, J. Persson, and A. V. Voorden, “A study of the eigenvalue
analysis capabilities of power system dynamics simulation software”, 14 th PSCC,
Sevilla, June 2002.
[53]. S. K. Gupta, A. K. Gupta and N. Kumar, "Damping subsynchronous resonance
in power systems," IEEE Proceedings - Generation, Transmission and Distribution,
vol. 149, no. 6, pp. 679-688, Nov 2002.
[54]. D. Y. Wong, G. J. Rogers, and B. Porretta, “Eigenvalue analysis of very large
power systems,” IEEE Transactions, Vol. PWRS-3, No. 2, May 1988

131
[55]. N. G. Hingorani, “A new scheme for sub-synchronous resonance damping of
torsional oscillations and transient torque – part 1,” IEEE Transactions, Vol. PAS-100,
pp. 1852-1855, April 1981
[56]. Z. Zhang, X. Xiao, “Analysis and Mitigation of SSR Based on SVC in Series
Compensated System”, International Conference on Energy and Environment
Technology, ICEET '09. Beijing, China, 16-18 Oct. 2009.
[57] D. Nazarpour, H. Ghahramani, “Novel Methods with Fuzzy Logic and ANFIS
Controller Based SVC for Damping Sub-Synchronous Resonance and Low-Frequency
Power Oscillation”,20th Iranian Conference on Electrical Engineering (ICEE), 15-17
May 2012.
[58] R. K. Varma and S. Auddy, “Mitigation of subsynchronous oscillations in a
series compensated wind farm using static var compensator,” IEEE Proceeding Power
Energy Soceity General Meeting Conference, 2006, pp. 1–7.
[59]. B. Li, H. Xie, M. M. de Oliveira, Carl Heyman, Mauro Monge, “Mitigation
of Subsynchronous Resonance in a DFIG Based Wind Power Plant Connected to
Series-Compensated Lines Using STATCOM”, in Proceeding 12th International
Workshop on Large-Scale Integration of Wind Power into Power Systems as well as
on Transmission Networks for Offshore Wind Power Plants, London, UK, 22-24 Oct.
2013
[60]. M. S. El-Moursi, B. Bak-Jensen, M. H. Abdel-Rahman, “Novel STATCOM
Controller for Mitigating SSR and Damping Power System Oscillations in a Series
Compensated Wind Park,” IEEE Transactions Power Delivery., vol. 25, no. 2, pp.
429–441, Feb 2010.

132
[61]. S. Golshannavaz, M.Mokhtari, and D.Nazarpour, “SSR Suppression via
STATCOM in Series Compensated Wind Farm Integrations”, Electrical Engineering
(ICEE), 2011 19th Iranian Conference
[62]. H. Khalilinia and J. Ghaisari, "Improve Sub-Synchronous Resonance (SSR)
damping using a STATCOM in the transformer bus," IEEE EUROCON 2009, St.-
Petersburg, 2009, pp. 445-450.
[63]. R. K. Varma, “Mitigation of subsynchronous oscillations in a series
compensated wind farm with Thyristor Controlled Series Capacitor (TCSC)”, Power
Systems Conference: Advanced Metering, Protection, Control, Communication, and
Distributed Resources, 2007.
[64]. A. Timbus, R. Teodorescu, F. Blaabjerg, and M. Liserre, "Synchronization
methods for three phase distributed power generation systems. an overview and
evaluation", Power Electronics Specialists Conference, 2005, pp. 2474-2481.
[65]. L. G. B. Rolim, D. R. da Costa, and M. Aredes, "Analysis and software
implementation of a robust synchronizing PLL circuit based on the pq theory", IEEE
Transactions on Industrial Electronics, vol. 53, no. 6, pp. 1919-1926, December 2006.
[66]. D. J. N. LIMEBEER, R. G. HARLEY, and S. M. SCHUCK, “Subsynchronous
resonance of the Koeberg turbo-generator and of a laboratory systems”, IEEE
Transactions on Power Apparatus and Systems , 1979, Vol. 70, pp. 278-297
[67]. D. J. N. Limebeer, R. G. Harley and M. A. Lahoud, "Suppressing
subsynchronous resonance with static filters," in IEEE Proceedings - Generation,
Transmission and Distribution, vol. 128, no. 1, pp. 33-44, January 1981.

133
[68]. X. Xie, P. Liu, K. Bai and Y. Han, "Applying Improved Blocking Filters to
the SSR Problem of the Tuoketuo Power System," in IEEE Transactions on Power
Systems, vol. 28, no. 1, pp. 227-235, Feb. 2013.
[69] Huakun Liu, Xiaorong Xie, Jingbo He, Hui Liu and Yunhong Li, "Damping
DFIG-associated SSR by adding subsynchronous suppression filters to DFIG
converter controllers," 2016 IEEE Power and Energy Society General Meeting
(PESGM), Boston, MA, 2016, pp. 1-5.
[70]. H. Liu, X. Xie, Y. Li, H. Liu and Y. Hu, "Mitigation of SSR by embedding
subsynchronous notch filters into DFIG converter controllers," in IET Generation,
Transmission & Distribution, vol. 11, no. 11, pp. 2888-2896, 8 3 2017.
[71]. B. S. Nagabhushana, Chandrasekharaiah, 'SSR analysis using artificial neural
networks', Proceedings ofthe International Conference on Intelligent Systems
Applications to Power Systems, IEEE, Feb 1996.
[72]. B. S. Nagabhushana, Chandrasekharaiah, L. L. Lai and D. Vujatovic, "Neural
network approach to identification and control of sub-synchronous resonance in series
compensated systems," Power Electronics and Drive Systems, 1999, pp. 683-687 vol.2.
[73]. C. E. J. Bowler, J. A. Demcko, L. Mankoff, W. C. Kotheimer and D. Cordray,
"The Navajo SMF Type Subsynchronous Resonance Relay," in IEEE Transactions on
Power Apparatus and Systems, vol. PAS-97, no. 5, pp. 1489-1495, Sept. 1978.
[74]. S. Rezaei, "Behavior of protective relays during Sub Synchronous
Resonance," 2017 IEEE International Conference on Environment and Electrical
Engineering and 2017 IEEE Industrial and Commercial Power Systems Europe
(EEEIC / I&CPS Europe), Milan, 2017, pp. 1-5.

134
[75]. G. Taylor, “Power quality hardware solutions for distribution systems:
Custom power”, IEEE Symposium on the Reliability, Security and Power Quality of
Distribution systems, April 1995, Durham, UK, pp. 11/1-11/9.
[76]. M. Iravani and etc, “Application of static phase shifter in power systems”,
IEEE Transaction on Power Delivery, Vol. 9, No. 3, July 1993, pp. 1600-1608.
[77]. IEEE/CIGRE: “FACTS overview”, IEEE Special Issue, Piscataway, NJ,
USA, 1995.
[78]. N. Christl, P. Luzelberger, and K. Sadek, “System studies and basic design for
and advanced series compensation scheme (ASC)”, Proceedings of IEEE International
Conferences on Advances in Power System Control, Operation and Management, Nov.
1991, HongKong, pp. 123-128.
[79]. E. Larsen, C. Borwler, B. Damsky, and S. Nilsson, “Benefits of thyristor
controlled series compensation”, CIGRE Session 1992, 14/37/38-04, Paris.
[80]. A. Edris, “FACTS technology development: an update”, IEEE Power
Engineering Review, March 2000, Vol. 20, No. 3, pp.4-9.
[81]. E. Larsen, K. Clark, S. Miske, and J. Urbanek, “Characteristic and rating
consideration of thyristor controlled series compensation”, IEEE Transactions on
Power Delivery, Vol. 9, No. 2, April 1994, pp. 992-1000.
[82]. B. K. Perkins and M. R. Iravani, “Dynamic Modeling of a TCSC with
Application to SSR Analysis Modular modeling,” IEEE Transactions on Power
systems, vol. 12, no. 4, pp. 1619–1625, 1997.
[83]. C. R. Fuerte-Esquivel, E. Acha, and H. Ambriz-PBrez, “A Thyristor
Controlled Series Compensator Model for the Power Flow Solution of Practical Power

135
Networks”, IEEE Transactions on Power Systems. vol. 15, no. 1, pp. 58- 64, February
2000.
[84]. J. Geng, L. Tong, Z. Wang, and J. Ge, “Mathematical Model for describing
characteristics of TCSC”, Power System Technology, 2002. Proceedings. PowerCon
2002. International Conference on.
[85]. S. Meikandasivam, R. K. Nema and S. K. Jain, "Selection of TCSC parameters:
Capacitor and inductor," India International Conference on Power Electronics 2010
(IICPE2010), New Delhi, 2011, pp. 1-5.
[86]. M. H. Abardeh and J. Sadeh, "Effects of TCSC parameters and control
structure on damping of sub-synchronous resonance," 2010 4th International Power
Engineering and Optimization Conference (PEOCO), Shah Alam, 2010, pp. 26-32.
[87]. N. G. Hingorani and L. Gyugyi, Understanding FACTS Concepts and
Technology of Flexible AC Transmission Systems, Wisley online library, 2000
[88]. S. J. GMey, W. A. Mittelstadt and R. W. Suhrbier Bonneviue, “Power
Administration, Test Results and Initial Operating Experience for the BPA 500 kV
Thyristor Controlled Series Capacitor Design, Operation, and Fault Test Results,”
Northcon 95. IEEE Technical Applications Conference and workshops Northcon95,
1995, pp 268 – 273.
[89]. K. Ahlgren, D. Holmberg, P. Halvarsson, and L. Ängquist, ‘Thyristor
Controlled Series Capacitor Used as a Means to Reduce Torsional Interaction
Subsynchronous Resonance’, Sweden.

136
[90]. TCSC in Brazil: power system interconnection, [Online]. Available:
http://www.modernpowersystems.com/features/featuretcsc-in-brazil-power-system-
interconnection/
[91]. C. Gama l. Ängquist, G. Ingeström, and M. Noroozian, “Commissioning and
operative experience of TCSC for damping power oscillation in the Brazilian North-
South interconnection,” CIGRE, Session 2000.
[92]. C. Gama , “Brazilian North-South interconnection - Control application and
operating experience with a TCSC,” IEEE Power Engineering Society Summer
Meeting, 1999. , pp 1103 – 1108.
[93]. M. Arunachalam, G. L. Rajiv, C. G. BHEL, “Performance verification of
TCSC control and protection equipment using RTDS”, 15th PSCC, Liege, pp 22-26.
[94] S. Subhash, A. K. Tripathy, and K. R. Padiyar, “SSR study for the Thyristor
Controlled Series Compensation application on the Kanpur-Ballabgarh 400kV line in
India,” International Conference on Power Systems Transients, , No. 05 – 043.
[95]. ABB, TCSC for stable transmission of surplus power from eastern to western
India, ABB power technologies, [Online]. Available: www.abb.com/powersystems.
[96]. K. Braun, etc, It’s a FACTS – India gets closer to completing its national grid,
Siemens PTD, Erlangen, Germany (2008), Transmission & Distribution.
[97]. Z. Yin, etc. "A study on the characteristics of TCSC based on digital
simulations and physical experiments," Power System Technology, Proceedings.
POWERCON '98. 1998 International Conference on, Beijing, 1998, pp. 328-332 vol.1.

137
[98]. J. Liang, J. Guo and X. Zhou, "Theory analysis and engineering study of
Yimin-Fengtun 500 kV TCSC transmission system," Power System Technology, 1998.
Proceedings. POWERCON '98. 1998 International Conference on, Beijing, 1998, pp.
377-381 vol.1.
[99]. X. Zhou, J. Guo, Q. Guo, EPSR (2000), “Studies on Application of TCSC in
power systems of China”, Power System Technology, 2000. Proceedings. PowerCon
2000. International Conference on, pp 387 – 390.
[100]. TCSC projects in China – TIANGUANG project, Simens, [online],
available:https://www.energyportal.siemens.com/static/de/de/products.../12805_1070
17_tian%20guan g%20tcsc%20in%20china.html.
[101]. Case studies Hutton 400kV Thyristor Controlled Series Compensation,
[Online]. Available: http://www.poweng.net/case-studies/index.php?id=13
[102]. J. C. Nambo-Martinez, K. Nieradzinska, and O. Anaya-Lara, “Dynamic
series compensation for the reinforcement of network connections with high wind
penetration”, EERA Deep Wind 2014, Norway
[103]. Y. Pipelzadeh, et al. "Role of smart grid technology and corrective control in
enhancing network capacity utilisation in great britain with HVDC links." CIGRE
Symposium HVDC System and Markets Integration. Lund, Sweden. 2015.
[104]. G. N. Taranto, J. H. Chow, ”A robust frequency domain optimisation
technique for tuning series compensation damping controllers”, IEEE Transactions on
Power Systems, 1995, Vol. 10, No. 3, pp. 1219-1225

138
[105]. G. N. Taranto, J. K. Shiau, and H. A. Othman, ”A robust decentralized
control design for damping controllers in FACTS applications”. Proceedings of the 4th
IEEE conference on Control applications, 1995, pp. 233-238
[106]. H. Othman, R. Vedam, and J. Finney, ”Robust supplementary control
controllers”. International symposium on Electric power engineering, Stockholm,
Sweden, 18-22 June 1995, pp. 244-249
[107]. M. Noroozian, G. Anderson, ”Damping of inter-area and local modes by use
of controllable components”, IEEE Transactions on Power Delivery, 1995, (4), pp.
2007-2012
[108]. X. R. Chen, etc, ”Controlled series compensation for improving the stability
of multi-machine power systems”, IEEE Proceedings - General Transmission
Distribution, 1995, 142, (4)
[109]. F. J. Swift and H. F. Wang, "Application of the controllable series
compensator in damping power system oscillations," in IEEE Proceedings -
Generation, Transmission and Distribution, vol. 143, no. 4, pp. 359-364, Jul 1996.
[110]. Q. Liu, V. Vittal and N. Elia, "LMI pole placement based robust
supplementary damping controller (SDC) for a thyristor controlled series capacitor
(TCSC) device," IEEE Power Engineering Society General Meeting, 2005, pp. 1381-
1386 Vol. 2.
[111]. H. Chen, G. Anderson, ”A versatile approach for the control of FACTS
equipment in multi-machine power systems”, Electrical Power Energy System, 1995,
17, (3),pp. 215-221

139
[112]. H. Chen, ”Enhancement of power system stability by controllable series
compensation“, Automation Electric Power Systems, 1996, 20, (1 0), pp. 1617
[113]. K. C. S. Thampatty, E. P. Cheriyan and M. P. Nandakumar, "Design of a
discrete Linear Quadratic Gaussian (DLQG) compensator for SSR damping using a
sample invariant discrete model of TCSC," TENCON 2009 - 2009 IEEE Region 10
Conference, Singapore, 2009, pp. 1-6.
[114]. W. Chetan, K. Jadhao, and K. Vadirajacharya, "Optimal placing of FACTS
devices to improve power system security," International Journal of Engineering
Research & Technology (IJERT), Vol. 4 Issue 05, May, 2015
[115]. Y. Manganuri, etc, "Optimal location of TCSC using sensitivity and stability
indices for reduction in losses and improving the voltage profile," 2016 IEEE 1st
International Conference on Power Electronics, Intelligent Control and Energy
Systems (ICPEICES), Delhi, 2016, pp. 1-4.
[116]. X. Zhou and J. Liang, "Overview of control schemes for TCSC to enhance
the stability of power systems," IEEE Proceedings - Generation, Transmission and
Distribution, vol. 146, no. 2, pp. 125-130, Mar 1999.
[117]. M. Abapour, M. R. Haghifam, ”On-line assessment of the transient instability
risk”, IET Generation, Transmission, and Distribution, 2013, 7, pp. 602–612
[118]. V. Vittal, etc. ”Transient instability risk assessment”. Power Engineering
Society Summer Meeting, 1999, pp. 206–211
[119]. M. K. Dosoglu, A. B. Arsoy, “Transient stability investigation of a power
system with multiple SVC and TCSC”, Energy Education Science and Technology
Part A: Energy Science and Research. 2012, 29, pp. 1445–1456
140
[120]. M. Abapour, P. Aliasghari and M. R. Haghifam, "Risk-based placement of
TCSC for transient stability enhancement," IET Generation, Transmission &
Distribution, vol. 10, no. 13, pp. 3296-3303, 10 6 2016.
[121]. B. Wang, D. Zou. “Design of Adaptive Terminal Sliding Mode Controller of
TCSC for Power System Stability Enhancement.” Proceeding of the CSU-EPSA, Vol.
4, No.5, 344-350, 2011.
[122]. L. Zhang, A. Zhang and J. Junfeng, "I&I stabilization based novel nonlinear
adaptive TCSC control algorithm for improving transient stability," The 26th Chinese
Control and Decision Conference (2014 CCDC), Changsha, 2014, pp. 1610-1615.
[123]. M. Hanyi and D. Chen, "Multi-objective Coordinated Design of TCSC and
SVC for Improving Transient Stability," 2015 Fifth International Conference on
Instrumentation and Measurement, Computer, Communication and Control (IMCCC),
Qinhuangdao, 2015, pp. 246-250.
[124]. X. M. Mao, Y. Zhang, L. Guan, and X. C.Wu, “Coordinated control of inter-
area oscillation in the China Southern power grid,” IEEE Transactions on Power
Systems, vol. 21, no. 2, pp. 845–852, May 2006.
[125]. Y. Zhang and A. Bose, “Design of wide-area damping controllers for inter-
area oscillations,” IEEE Transactions on Power Systems, vol. 23, no. 3, pp. 1136–1143,
Aug. 2008.
[126]. Y. Li, etc, "Wide-Area Robust Coordination Approach of HVDC and
FACTS Controllers for Damping Multiple Interarea Oscillations," in IEEE
Transactions on Power Delivery, vol. 27, no. 3, pp. 1096-1105, July 2012.

141
[127]. R. Zheng, G. Li and J. Liang, "Capability of TCSC on SSR Mitigation."
Journal of Power and Energy Engineering 3.04 (2015): 232-239.
[128]. R. Zheng, T. Joseph, S. Wang and J. Liang, "A control strategy for TCSC to
mitigate SSR with local measurements," 13th IET International Conference on AC and
DC Power Transmission (ACDC 2017), Manchester, 2017, pp. 1-6.
[129]. L. Piyasinghe, Z. Miao, J. Khazaei and L. Fan, "Impedance model-based
SSR analysis for TCSC compensated type-3 wind energy delivery systems," 2015
IEEE Power & Energy Society General Meeting, Denver, CO, 2015, pp. 1-1.
[130]. T. K. Oh, Z. Z. Mao, "Analysis on thyristor controlled series capacitor for
subsynchronous resonance mitigation," ISIE 2001. 2001 IEEE International
Symposium on Industrial Electronics Proceedings (Cat. No.01TH8570), Pusan, 2001,
pp. 1319-1323 vol.2.
[131]. H. A. Mohammadpour, A. Ghaderi, and E. Santi, “Analysis of
subsynchronous resonance in doubly-fed induction generator-based wind farms
interfaced with gate controlled series capacitor ,” IET Generation, Transmission &
Distribution, June 2014.
[132]. H. A. Mohammadpour, J. Siegers and E. Santi, "Controller design for TCSC
using observed-state feedback method to damp SSR in DFIG-based wind farms," 2015
IEEE Applied Power Electronics Conference and Exposition (APEC), Charlotte, NC,
2015, pp. 2993-2998.
[133]. S. R. Joshi, E. P. Cheriyan and A. M. Kulkarni, "Output feedback SSR
damping controller design based on modular discrete-time dynamic model of TCSC,"
in IET Generation, Transmission & Distribution, vol. 3, no. 6, pp. 561-573, June 2009.

142
[134]. X. Zheng, Z. Xu and J. Zhang, "A supplementary damping controller of
TCSC for mitigating SSR," 2009 IEEE Power & Energy Society General Meeting,
Calgary, AB, 2009, pp. 1-5.
[135]. F. Zhang; Z. Xu, "SSR damping study on a generator connected to TCSC,"
Power Systems Conference and Exposition. IEEE PES, pp. 673-678 vol.2, 10-13 Oct.
2004
[136]. R. J. iwko, C.A. egner, S.J. inney, J.D. Eden, "Subsynchronous resonance
performance tests of the Slatt thyristor-controlled series capacitor," Power Delivery,
IEEE Transactions on, vol.11, no.2, pp.1112-1119, Apr 1996
[137]. P. Vuorenpaa, T. Rauhala, and P. Jarventausta, “Applying TCSC frequency
response data derived using electromagnetic transient analysis in SSR frequency
scanning studies”, PowerTech, 2009 IEEE Bucharest., 2009: 1-6.
[138]. M. O. Hassan, Z. A. Zakaria, and S. J. Cheng, “Impact of TCSC on enhancing
power system stability”, Power and Energy Engineering Conference, 2009. APPEEC
2009. Asia-Pacific. IEEE, 2009: 1-6.
[139]. S. K. Kerahroudi, etc. “Investigating the impact of stability constraints on
the future GB transmission system”, Universities Power Engineering Conference
(UPEC), 2012 47th International. IEEE, 2012: 1-6.
[140]. J. Ling, Z. Guo and W. Feng, “Design of adaptive TCSC damping controller
based on oscillation energy analysis”, Transmission and Distribution Conference and
Exhibition: Asia and Pacific, 2005 IEEE/PES. IEEE, 2005: 1-5.

143
[141]. X. Tan, etc, “Characteristics and firing control of thyristor controlled series
compensation installations”, Power System Technology, 1998. Proceedings.
POWERCON'98. 1998 International Conference on. IEEE, 1998, 1: 672-676.
[142]. A. Kazemi, S. Jamali and H. Shater, "Measured impedance by distance relay
with positive sequence voltage memory in presence of TCSC." Power Systems
Conference and Exposition, 2009. PSCE'09. IEEE/PES, 2009.
[143]. K. Khosro, S. Henschel, and H. W. Dommel, "Resistive behavior of
thyristor-controlled series capacitors at subsynchronous frequencies." IEEE
transactions on Power Delivery 19.1 (2004): 374-379.
[144]. Y. Tang and Y. Qian, "Mechanism analysis of using thyristor controlled
serious compensation to mitigate Subsynchronous Resonance." IPEC, 2010
Conference Proceedings. IEEE, 2010.
[145]. Z. Hao, C. Dai and S. Wu, "Research on single-phase PLL for the
synchronization of thyristor controlled series capacitor." Power and Energy
Engineering Conference (APPEEC), 2012 Asia-Pacific. IEEE, 2012.
[146]. S. Meikandasivam, K. N. Rajesh, and K. J. Shailendra, "Performance of
installed TCSC projects." Power Electronics (IICPE), 2010 India International
Conference on. IEEE, 2011.
[147]: “Dynamic series compensation for the reinforcement of network connection
with high wind penetration”. [Online]. Available:
www.sciencedirect.com/science/article/pii/S1876610214010947.
[148]: “Overhead transmission lines and underground cables”. [Online]. Available:

144
www.tkne.net/downloads/power/transmissionlines1/transmission%20lines/overhe
ad.pdf. [Accessed: 2014]
[149]. “PAS series of 4-Quadrant Amplifiers”. [Online]. available:
http://www.spitzenberger.de/download.ashx?Weblink=1002/.
[150]: C. E. Loo Ugalde, J. Ekanayake and N. Jenkins, “Subsynchronous resonance
in a series-compensated Great Britain transmission network”, IEEE Generation,
Transmission and Distribution 7(3), pp. 209-217, 2013.
[151]: “MicroLabBox product information”. [Online]. Available:
http://www.dspace.com/shared/data/pdf/2017/dspace_microlabbox_product_infor
mation_2017-02_english_170413e.pdf.
[152]: “Real-time interface (RTI)”. [Online]. Available:
http://www.dspace.com/shared/data/pdf/2017/dspace_rti_catalog2017_e.pdf.
[Accessed: 2017]
[153]. Working Group, “Performance evaluation and applications review of
existing thyristor control series capacitor devices – TCSC”, CIGRE Report B4.49,
session 2013
[154]. A. S. Luiz Pilotto, et al. "Impact of TCSC control methodologies on
subsynchronous oscillations." IEEE Transactions on Power Delivery 18.1 (2003):
243-252.
[155]. A. Lennart. "Synchronous voltage reversal control of thyristor controlled
series capacitor." PhD diss., Elektrotekniska system, 2002.

145
[156]. T. Yi, R. Yu, and M. Yan, "Research on the synchronous voltage reversal
control model of TCSC." Power System Technology (POWERCON), 2010
International Conference on. IEEE, 2010.
[157]. P. Vuorenpaa, T. Rauhala, and P. Jarventausta, "Applying EMT analysis
based target function approach for designing SSDC implementation for
TCSC." Modern Electric Power Systems (MEPS), 2010 Proceedings of the
International Symposium. IEEE, 2010.
[158]. X. Xie, H. Liu, and Y. Han, "Coordinated Design of Supplementary
Excitation Damping Controller and Voltage-sourced Converter Based Generator
Terminal Subsynchronous Damping Controller for Subsynchronous Resonance
Suppression: A Case Study." Electric Power Components and Systems 44.5 (2016):
565-577.
[159]. X. Wu, et al. "An SSR multichannel damping control scheme for TCSC
considering multiple operating conditions." International Transactions on Electrical
Energy Systems 26.12 (2016): 2759-2773.
[160]. X. Wu, et al. "Mitigation of Sub-synchronous Oscillation Caused by
Thyristor Controlled Series Capacitor Using Supplementary Excitation Damping
Controller." Journal of international Conference on Electrical Machines and Systems.
Vol. 1. No. 2. Journal of International Conference on Electrical Machines and Systems,
2012.
[161]. K. S. Mecha, K. N. Shubhanga. "Design of a subsynchronous damping
controller using a dynamic phasor-based model of TCSC." Power and Energy Systems:

146
Towards Sustainable Energy (PESTSE), 2016 Biennial International Conference on.
IEEE, 2016.
[162]. C. Balarko, B. C. Pal, "Robust damping of multiple swing modes employing
global stabilizing signals with a TCSC." IEEE Transactions on Power Systems 19.1
(2004): 499-506.
[163]. K. R. Varma, A. Soubhik, and S. Ysni, "Mitigation of subsynchronous
resonance in a series-compensated wind farm using FACTS controllers." IEEE
Transactions on Power Delivery 23.3 (2008): 1645-1654.
[164]. Q. Liu, et al. "Using TCSC scheme for SSR mitigation in a radial transfer
corridor." Power System Technology, 2006. PowerCon 2006. International
Conference on. IEEE, 2006.
[165]. H. Xie and A. Lennart, "Synchronous Voltage Reversal control of TCSC–
impact on SSR conditions." Proceedings of the Nordic Workshop on Power and
Industrial Electronics (NORPIE). 2004.
[166]. K. Khosro, S. Henschel, and H. W. Dommel, "Resistive behaviour of
thyristor-controlled series capacitors at subsynchronous frequencies," IEEE
transactions on Power Delivery, no. 19, vol. 1, pp. 374-379, (2004)
[167]. K. Kabiri, et al. "A discrete state-space model for SSR stabilizing controller
design for TCSC compensated systems." IEEE Transactions on power delivery 20.1
(2005): 466-474.
[168]. Q. Liu, et al. "A novel active damping control of TCSC for SSR suppression
in a radial corridor." Electric Utility Deregulation and Restructuring and Power
Technologies, 2008. DRPT 2008. Third International Conference on. IEEE, 2008.

147
[169]. M. Bongiorno, S. Jan and A. Lennart, "On control of static synchronous
series compensator for SSR mitigation." IEEE Transactions on Power
Electronics 23.2 (2008): 735-743.
[170]. P. Anderson, B. Agrawal, J. V. Ness, Subsynchronous Resonance in Power
Systems, New York:IEEE Press, 1989.

148
Appendix I
IEEE First Benchmark system model
System ratings:
𝑆𝑏 = 892.4 MVA, 𝑉𝑏 = 500 kV, 𝑓𝑏 = 50 Hz, 𝜔𝑏 = 2𝜋𝑓0.
The following parameters are defined in per unit unless stated otherwise.
Parameters of the synchronous generator :
𝑅𝑎 = 0.0015, 𝑋𝑙 = 0.13, 𝑋𝑞 = 1.71, 𝑋𝑞′ = 0.228, 𝑋𝑞
′′ = 0.2, 𝑋𝑑 = 1.79,
𝑋𝑑′ = 0.169, 𝑋𝑑
′′ = 0.135, 𝑋𝑚𝑞 = 1.58, 𝑋𝑚𝑑 = 1.66, 𝑅𝑘𝑞1 = 0.0053,
𝑋𝑘𝑞1 = 1.695, 𝑅𝑘𝑞2 = 0.0182, 𝑋𝑘𝑞2 = 1.825, 𝑅𝑓𝑑 = 0.001, 𝑋𝑓𝑑 = 1.7,
𝑅𝑘𝑑 = 0.0037, 𝑋𝑘𝑑 = 1.666, 𝜏𝑑0′ = 4.3 s, 𝜏𝑞0
′ = 0.85 s, 𝜏𝑑0′′ = 0.032 s, 𝜏𝑞0
′′ = 0.05 s
Parameters of multi-mass shaft:
Inertias (in MWs/MVA):
𝐻𝐻 = 0.092897,𝐻𝐼 = 0.155589,𝐻𝐿𝐴 = 0.858670,𝐻𝐿𝐵 = 0.884215,
𝐻𝐺 = 0.868495, 𝐻𝑋 = 0.0342165.
Self and mutual damping coeffiecients (in per unit T/ per unit speed dev.):
𝐷𝐻 = 𝐷𝐼 = 𝐷𝐿𝐴 = 𝐷𝐿𝐵 = 0.1, 𝐷𝐺 = 𝐷𝑋 = 0,𝐷𝐻𝐼 = 𝐷𝐼𝐴 = 𝐷𝐴𝐵 = 𝐷𝐵𝐺 = 0.2
𝐷𝐺𝑋 = 0.005
Torsional stiffness (in per unit T/rad):
𝐾𝐻𝐼 = 19.303, 𝐾𝐼𝐴 = 34.929, 𝐾𝐴𝐵 = 52.038, 𝐾𝐵𝐺 = 70.858, 𝐾𝐺𝑋 = 2.822

149
Transformer and transmission line:
𝑅𝑇 = 0, 𝑋𝑇 = 0.14, 𝑅𝐿 = 0.02, 𝑋𝐿 = 0.5, 𝑋𝑆𝑌𝑆 = 0.06

150
Appendix II
pin
s Signal Description
pin
s Signal Description
1 Phase B Capacitor voltage 14 Analogic ground
2 Phase C capacitor voltage 15 Phase B thyristor current
3 Phase A to phase B voltage 16 Digital ground
4 Phase A capacitor voltage 17 Phase A thyristor triggering signal (0V – 5V)
5 Phase C input line current 18 Phase B thyristor triggering signal (0V – 5V)
6 Phase B to phase C voltage 19 Phase C thyristor triggering signal (0V – 5V)
7 Phase A input line current 20 Fans activation signal (0V: off – 5V: on)
8 Phase B input line current 21 Resistor switch control pulse (0V: open – 5V: closed)
9 Phase B capacitor current 22 Short-circuit reset pulse ((0V:nothing – 5V:open)
10 Phase C capacitor current 23 State of main circuit breaker (0V: closed – 5V: open)
11 Phase C thyristor current 24 State of the resistor switch (0V: closed – 5V: open)
12 Phase A capacitor current 25 State of short-circuit breaker (0V:closed – 5V:open)
13 Phase A thyristor current 26

151
Publications
Journal paper related to the thesis:
[1]. Zheng, Rui, Gen Li, and Jun Liang. "Capability of TCSC on SSR
Mitigation." Journal of Power and Energy Engineering3.04 (2015): 232-239.
Conference paper related to the thesis:
[2]. R. Zheng, T. Joseph, S. Wang and J. Liang, "A control strategy for TCSC to
mitigate SSR with local measurements," 13th IET International Conference on
AC and DC Power Transmission (ACDC 2017), Manchester, 2017, pp. 1-6.
Jounal paper not related to the thesis:
[3]. S. Wang, J. Guo, C. Li, S. Balasubramaniam, R. Zheng and J. Liang,
"Coordination of DC power flow controllers and AC/DC converters on optimising the
delivery of wind power," in IET Renewable Power Generation, vol. 10, no. 6, pp. 815-
823, 7 2016.