st. clair flats wildlife area annual report - michigan.gov€¦ · john darling, wildlife...
TRANSCRIPT

Pg. 1
2017 St. Clair Flats Wildlife Area Annual Report
Photo T.J. Dueweke

Pg. 2
Table of Contents 2017 St. Clair Flats Wildlife Area ..................................................................................... 1
1. INTRODUCTION ............................................................................................ 3 2. SCFWA GOALS AND MANAGEMENT EMPHASIS ....................................... 3 3. GPS ................................................................................................................ 4 4. MBFYB ........................................................................................................... 4 5. HARSEN ISLAND UNIT .................................................................................. 4 6. ST. JOHNS MARSH UNIT .............................................................................. 5 7. LAND ACQUISITION ...................................................................................... 5
WEATHER, WATER, AND HABITAT CONDITIONS: .................................................. 5 8. WEATHER ...................................................................................................... 5 9. WATER LEVELS ............................................................................................ 6 10. NESTING CONDITIONS AND WILDLIFE PRODUCTION ............................. 6 11. WILDLIFE PRODUCTION ON ST. CLAIR FLATS .......................................... 6 1. Number of breeding ducks = approximately 850 ............................................. 6
HABITAT WORK: ........................................................................................................ 7 12. UPLAND HABITAT ......................................................................................... 7 13. EAST MARSH................................................................................................. 7 14. WEST MARSH................................................................................................ 7 15. CROPLAND PROGRAM ................................................................................ 8 16. KRISPIN DRAIN PROJECT ............................................................................ 8 17. AREA MAINTENANCE ................................................................................... 8 18. DEER HUNTING ............................................................................................. 9 19. SMALL GAME AND TRAPPING ................................................................... 10 20. RECREATIONAL AND EDUCATIONAL ACTIVITIES ................................... 10
WATERFOWL HUNTING: ......................................................................................... 11 21. EARLY TEAL AND YOUTH SEASONS (10 days) ........................................ 12 22. REGULAR DUCK HUNTING SEASON ........................................................ 12 23. DECEMBER LATE SPLIT (2 days, December 30 and 31) ........................... 13 24. GOOSE HUNTING ....................................................................................... 13 25. MIGRATION AND WATERFOWL NUMBERS .............................................. 13
ST. JOHN’S MARSH UNIT: ....................................................................................... 14 26. WATERFOWL NUMBERS AND MIGRATION .............................................. 14 27. HUNTING SEASON ...................................................................................... 14 28. BANDING ..................................................................................................... 15
ECONOMIC IMPACTS: ............................................................................................. 16 29. TO LOCAL ECONOMY ................................................................................. 16
FUTURE RECOMMENDATIONS .............................................................................. 18 PROMINENT PARTNER GROUPS: .......................................................................... 19
Harsens Island Waterfowl Hunters Association ..................................................... 19 St. Clair Flats Waterfowlers, Inc. ............................................................................ 19 Michigan Duck Hunters Association, Blue Water Chapter ..................................... 19 Ducks Unlimited ..................................................................................................... 19 Waterfowl USA Chapter #1 .................................................................................... 19 MUCC District 8 ..................................................................................................... 19 Pheasants Forever ................................................................................................. 19
2017 SEASON HARVEST BY AREA ........................................................................ 25

Pg. 3
ST. CLAIR FLATS WILDLIFE AREA 2017 MANAGEMENT REPORT
John Darling, Wildlife Technician
1. INTRODUCTION The St. Clair Flats State Wildlife Area (SCFWA) is located at the southern tip of St. Clair County. The SCFWA contains the Harsens Island unit (including bottomlands and marshes associated with this island complex), the St. Johns Marsh Unit, and Dickinson Island.
The marshlands and islands within SCFWA are a river delta formation resulting from St. Clair River flow into Lake St. Clair. Located between the St. Clair and Detroit Rivers, Lake St. Clair has a total area of 430 mi2 and is a significant portion of the connecting waters between Lakes Huron and Erie. Approximately two-thirds of Lake St. Clair lies within Canadian boundaries. Waters of the Lake St. Clair / St. Clair River system are an annual ancestral migration route for thousands of ducks, geese, swans and various shore and wading birds.
SCFWA lands adjoining this river delta system provide habitat for numerous other terrestrial and aquatic species of wildlife. Healthy populations of white-tailed deer, ring-necked pheasants, raptors, coyotes, red foxes, squirrels, rabbits, muskrats, various amphibians and reptiles, and neo-tropical migrant songbirds are some of the wildlife species found within the SCFWA. The diverse habitat of this wetland delta system allows for suitable habitat for many different species. While SCFWA is widely known for its outstanding waterfowl hunting opportunities, there are many other values provided, from other recreational pursuits such as quality deer hunting, to critical habitat for rare, threatened and unique species. This includes sandhill cranes, glossy ibis, osprey, bald eagles, king rails, eastern fox snakes, American bittern, least bittern, cattle egret, green herons, black-crowned heron, loon, cormorant, short-eared owl, snowy owl, yellow spotted turtle and eastern bluebird. Harsens Island in particular has one of the highest populations of the threatened eastern fox snake. SCFWA provides an incredible amount of habitat value and recreational opportunities outside of its well-known waterfowl benefits.
2. SCFWA GOALS AND MANAGEMENT EMPHASIS Management goals and directions of the St. Clair Flats are guided by several commitments and documents. These range from the statewide level down to our local master plan. These are:
• Department of Natural Resources (DNR) mission statement and goals • Wildlife Division mission statement • Wildlife Division Guiding Principles and Strategies (GPS) • Wildlife Division More Bang for Your Buck (MBFYB) commitments • Southeast Region Operational Plan • St. Clair Flats Wildlife Area Master Plan
Pg. 4
Our local master plan details the direction of these documents as they relate to us and details what tasks and goals we will achieve to meet these directives. Additionally, it spells out the following sections of the GPS and our MBFYB commitments that focus on our managed wetland areas.
3. GPS In 2010, the Wildlife Division created a document detailing our division wide goals and priorities known as the Guiding Principles and Strategies (GPS) to better focus our efforts and allow us to more easily report our goals, objectives and accomplishments. After 5 years of use, the document was revised and updated in 2016. Our primary goals on the St. Clair Flats Wildlife area are to: • Manage game populations and provide hunting and trapping opportunities while
maintaining populations in balance with available habitat, land use practices, and stakeholder values (GPS Goal 1)
• Improve and preserve wetland habitat for game and non-game species (GPS Goal 2) • Provide a refuge and food supply for migrating waterfowl, shorebirds and wading
birds (GPS Goal 2) • Provide sportsmen/women with excellent hunting opportunities while maintaining
quality hunting experiences (GPS Goal 4) • Meet the Wildlife Division’s goal of providing statewide wildlife recreational
opportunities for the citizens of Michigan and visitors from other areas (GPS Goal 4) • Increase collaborations with conservation partners and volunteers to implement
wildlife goals (GPS Goal 5).
4. MBFYB As a result of the new license package in 2014, Wildlife Division developed “More Bang for your Buck” (MBFYB). This is a list of public benefits and “deliverables” that the Division stated would happen as a result of the new license package. The following are (but are not the only) ways in which MBFYB relates to the St. Clair Flats:
• Updating water control structures at managed waterfowl and wetland areas, so that more hunters can pursue more waterfowl.
• Improving hunter access to waterfowl hunting areas by deepening access channels to address low Great Lakes water levels.
• Expanding cooperative youth events with partners. • Increasing mentoring programs with conservation partners. • Expanding events at our “Wetland Wonders”, our 7 existing managed waterfowl
areas across the State. • Developing new managed waterfowl areas at high-quality wetlands near population
centers. • Fully implementing the Michigan Waterfowl Legacy Program. • Expanding hunting information through technology such as “Mi-Hunt”.
5. HARSEN ISLAND UNIT Land purchase on Harsens Island (HI) began in 1950. Original development of the HI management unit began in the late 1950’s and is a continuous operation. Currently, there are 10 diked agricultural units totaling 1150 acres; two diked marsh units, each approximately 800 acres; approximately 300 acres of marsh within the management unit on the Little Muscamoot bay shore (over which there is no water level control); and 305 acres of upland area.

Pg. 5
In early 2016, the status of the refuge on Harsens Island and several other refuges throughout southeast Michigan were changed to seasonal. The refuge is now closed to all entry from September 1st- January 1st and is open to access January 2nd- August 31st.
6. ST. JOHNS MARSH UNIT In 1976, the Michigan Natural Resources Commission approved and dedicated the 3,000-acre wetland/upland complex as the St. Johns Marsh Wildlife Area (SJMWA). It is located along the northeastern shoreline of Lake St. Clair (Anchor Bay), adjacent to Highway M-29 and four miles west of the city of Algonac.
The SJMWA has been recognized as an important ecological area, with many distinct habitat types. Upland areas support mixed stands of oak, hickory, white ash, aspen, cottonwood, and associated shrub species. Areas formerly under tillage support dense growths of old field succession-type shrubs and herbs. Areas subject to intermittent flooding have a cover of sedges, annual weeds, water tolerant grasses and lowland shrubs. A unique area of wet prairie-type vegetation exists along the southeast border of St. Johns Marsh.
Three units have been developed, and contain diked impoundments and a prairie-pothole wetland complex. The main marsh portions of this wetland are occupied by stands of Phragmites and narrow leaf cattail, bulrush, and buttonbush throughout. During wetter years submerged vegetation is abundant throughout the marsh and forms a continuous dense carpet in many areas.
7. LAND ACQUISITION One small developed parcel was divested on South Channel early this spring. No new lands were acquired.
WEATHER, WATER, AND HABITAT CONDITIONS:
8. WEATHER We had good weather conditions through the spring, with average rainfall and temperatures and no significant flooding issues. We missed most of the large storm cells that caused flooding at other areas. Weather during farming season was generally favorable, though a little cool, through the summer. Warmer summer temperatures hung on into September, with both the youth duck and youth deer hunts much warmer than usual. Luckily for us, the warm weather broke and we had an excellent fall for waterfowl weather, with cool temperatures and lots of northwest winds. The difference between the 2016 season and 2017 season weather-wise was night and day. We had hardly any ‘bluebird’ days with bright skies and no wind. This is reflected in our outstanding harvest this season. As it seems like always happens, we had a cold, nasty storm around Halloween. We had two short term freezes, the first November 10th and 11th when we formed about an inch of ice, the second around Thanksgiving. Both times we thawed out after only a couple days of limited opportunity. However, after the Thanksgiving freeze, hunting success slowed dramatically until just before our final freeze up starting on December 7th. From there we had cold temperatures through December and the refuge never thawed again.

Pg. 6
9. WATER LEVELS Lake St. Clair water levels were extremely high throughout the year, surpassing the 2016 high mark by April. At its highest point in July, Lake St. Clair was only 8 inches shy of the record high and was 19 inches higher than average according to the Army Corp of Engineers. Levels stayed high through December, when they were still approximately 18 inches over the long term average. For our purposes, this made flooding very easy, with a lot of our flooding in the diked units done exclusively through gravity feeding the fields. The downside came in December when we were dewatering, as it took much longer than usual to dewater the fields due to having to pump out almost everything instead of gravity draining.
10. NESTING CONDITIONS AND WILDLIFE PRODUCTION Nesting conditions were favorable for waterfowl on the Flats this year. While some other areas in the region had low nest success due to cool weather and rains, we missed the worst of it and overall had good duck and goose production. Wood duck production seems to have bounced back from 2016’s down year. This was especially evident during banding season in August when far more wood ducks were observed on bait stations than in years past. With the east marsh reflooded, significant wood duck production returned to the boxes there and goose nesting also rebounded. Mallard production around Harsens Island and St. Johns Marsh remained about average, but inland production was up as evidenced by large broods in many suburban areas and massive numbers of juvenile birds during banding operations.
With the change to a seasonal refuge status, many deer were pushed out of the refuge during the late winter and spring months. These deer moved into neighboring upland areas where casual observation of fawns was much more difficult. As the year progressed, observations of fawns in the refuge and surrounding areas were average to slightly below average, but it is difficult to say whether this was an actual decrease in numbers or just an observational bias from the deer moving to new locations. Pheasant numbers continue to barely hang on. No broods were observed during farming operations this year and few roosters were heard during the season. This makes two years in a row that pheasant numbers on the managed area appear to be decreasing.
11. WILDLIFE PRODUCTION ON ST. CLAIR FLATS 1. Number of breeding ducks = approximately 850
a. Number of young produced = approximately 1,400 2. Number of breeding geese = approximately 200
a. Number of young produced = approximately 750 3. Size of September 1st deer herd = approximately 300 4. Size of pheasant flock on September 1st = approximately 25
a. Other game = rabbit, squirrel, woodcock, jacksnipe, raccoon, fox, muskrat, coyote and mink. More rabbits were observed this year than years past, while furbearer numbers have remained stable.

Pg. 7
HABITAT WORK:
12. UPLAND HABITAT 16 acres of food plots were planted in our upland zones. Corn was planted where possible in the spring, but the high water table left many fields too wet for early season planting in the uplands. As the year went on and water levels dropped, we were able to plant wheat and a turnip mix in most remaining fields, but several remained too wet to work. If lake levels do not decrease, the 2018 planting season is going to be very difficult in the upland areas.
13. EAST MARSH 2017 was the first year back at full pool for the east marsh after a drawdown beginning in 2015. As we expected, waterfowl use was incredible during the spring, especially just after ice-out. An estimate of over 20,000 ducks in one count was recorded in March, primarily in zones 46 and 47. These birds were feeding on the smartweed and sedges that had grown up the previous growing season. These observations gave us confidence the project might be more successful than originally thought. However, as the season progressed, a lot of phragmites and reed canary grass had become firmly established in any opening. In response, we aerially treated all of our potholes and any large pockets of phrag. Initial observations show we had a very good kill and I expect good results into 2018. Afterwards, we took a marsh cutter boat into the ditches and zones to clear them of standing dead material and allow some open water for hunting and better access. Unfortunately, waterfowl usage during the fall did not match the exceptional numbers we saw in the spring and hunting success in the east marsh was again low in 2017.
14. WEST MARSH Conditions in the west marsh were normal, with water levels at about their average depth for the entirety of the season. Conditions were again mucky and difficult in most zones. After seeing a couple years of plant response in the east marsh, we are putting any similar draw down plans in the west marsh on hold until we can devise a better plan for preventing phragmite invasion.
Photo S. Smith
Pg. 8
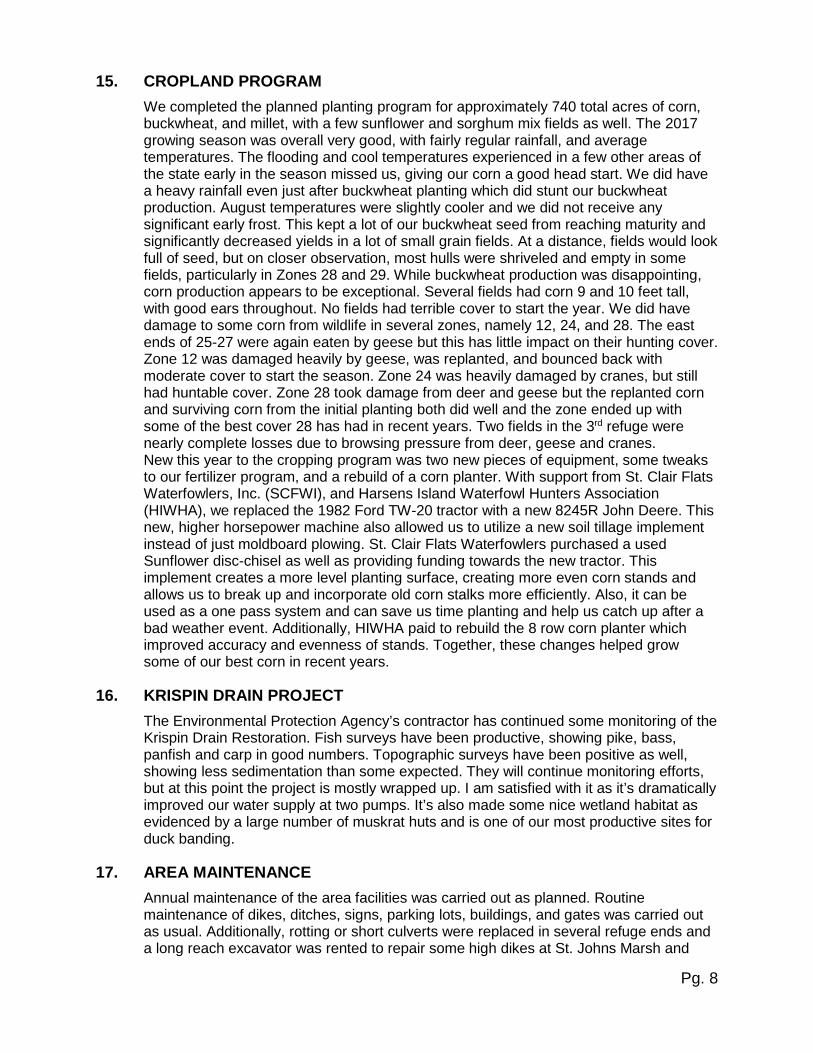
15. CROPLAND PROGRAM We completed the planned planting program for approximately 740 total acres of corn, buckwheat, and millet, with a few sunflower and sorghum mix fields as well. The 2017 growing season was overall very good, with fairly regular rainfall, and average temperatures. The flooding and cool temperatures experienced in a few other areas of the state early in the season missed us, giving our corn a good head start. We did have a heavy rainfall even just after buckwheat planting which did stunt our buckwheat production. August temperatures were slightly cooler and we did not receive any significant early frost. This kept a lot of our buckwheat seed from reaching maturity and significantly decreased yields in a lot of small grain fields. At a distance, fields would look full of seed, but on closer observation, most hulls were shriveled and empty in some fields, particularly in Zones 28 and 29. While buckwheat production was disappointing, corn production appears to be exceptional. Several fields had corn 9 and 10 feet tall, with good ears throughout. No fields had terrible cover to start the year. We did have damage to some corn from wildlife in several zones, namely 12, 24, and 28. The east ends of 25-27 were again eaten by geese but this has little impact on their hunting cover. Zone 12 was damaged heavily by geese, was replanted, and bounced back with moderate cover to start the season. Zone 24 was heavily damaged by cranes, but still had huntable cover. Zone 28 took damage from deer and geese but the replanted corn and surviving corn from the initial planting both did well and the zone ended up with some of the best cover 28 has had in recent years. Two fields in the 3rd refuge were nearly complete losses due to browsing pressure from deer, geese and cranes. New this year to the cropping program was two new pieces of equipment, some tweaks to our fertilizer program, and a rebuild of a corn planter. With support from St. Clair Flats Waterfowlers, Inc. (SCFWI), and Harsens Island Waterfowl Hunters Association (HIWHA), we replaced the 1982 Ford TW-20 tractor with a new 8245R John Deere. This new, higher horsepower machine also allowed us to utilize a new soil tillage implement instead of just moldboard plowing. St. Clair Flats Waterfowlers purchased a used Sunflower disc-chisel as well as providing funding towards the new tractor. This implement creates a more level planting surface, creating more even corn stands and allows us to break up and incorporate old corn stalks more efficiently. Also, it can be used as a one pass system and can save us time planting and help us catch up after a bad weather event. Additionally, HIWHA paid to rebuild the 8 row corn planter which improved accuracy and evenness of stands. Together, these changes helped grow some of our best corn in recent years.
16. KRISPIN DRAIN PROJECT The Environmental Protection Agency’s contractor has continued some monitoring of the Krispin Drain Restoration. Fish surveys have been productive, showing pike, bass, panfish and carp in good numbers. Topographic surveys have been positive as well, showing less sedimentation than some expected. They will continue monitoring efforts, but at this point the project is mostly wrapped up. I am satisfied with it as it’s dramatically improved our water supply at two pumps. It’s also made some nice wetland habitat as evidenced by a large number of muskrat huts and is one of our most productive sites for duck banding.
17. AREA MAINTENANCE Annual maintenance of the area facilities was carried out as planned. Routine maintenance of dikes, ditches, signs, parking lots, buildings, and gates was carried out as usual. Additionally, rotting or short culverts were replaced in several refuge ends and a long reach excavator was rented to repair some high dikes at St. Johns Marsh and

Pg. 9
along the west bayshore dike on Harsens. Pump #3 was pulled and sent in for routine maintenance and repairs this year.
18. DEER HUNTING Deer hunting success was truly terrible this year, with only 17 deer taken. We did not expect harvest to be this low as deer numbers around the island and in the refuge are similar to previous years. It is likely the high water levels significantly impacted deer behavior and hunter success on the managed area, considering two of the deer hunting areas (95-97 and 98-100) were flooded for the majority of the season. Additionally, many deer were again seen on private land north of the managed area, lands that have significantly less hunting pressure than the managed area. Hunter success was further limited by extremely hot weather during the youth hunt, which typically accounts for 8 or 10 deer harvested. This year, due to low hunter turnout and effort in the heat, only 2 deer were taken during the youth hunt. Due to the way duck season dates fell, opportunities to hunt the corn fields with muzzleloaders were very limited and the fields all had hanging ice in the corn, nearly eliminating opportunity during the late season which typically accounts for a large portion of our deer. While the extremely low harvest is concerning, there were enough variables to explain most of the decline. It will be interesting to monitor deer numbers through the winter when observations are easiest and monitor harvest in 2018 to see if success rebounds.
Deer Hunting Participation
Season Hunter Parties Deer
Harvested Youth Hunt 17 2 Archery 185 4 Firearm 157 6 Muzzleloader 113 5 Late Archery 19 0 Total Parties and Deer Harvest 491 17
DMU 174 Antlerless Licenses Sold 73
2017 Deer Harvest Data for DMU174-Managed Area
Age Female % of
Harvest Male % of
Harvest Total Total
% Fawn 2 12% 3 18% 5 29% 1.5 Years 0 0% 3 18% 3 18%
2.5 Years 0 0% 0 0% 0 0%
3.5 Years 0 0% 0 0% 0 0%
4.5+ Years 3 18% 0 0% 3 18%
A-Unaged 5 29% 1 6% 6 35%
Totals 10 7 17
Pg. 10
19. SMALL GAME AND TRAPPING While there are moderate small game populations on the island, the areas open to hunt these animals are limited. Few hunters take advantage of the limited areas available. Squirrels in particular are abundant, with multiple stands of oaks available to hunt in and prevalent corn fields nearby for feed. There are also a fair number of rabbits on the game area. Since the closing of the local pheasant hunting farm, the pheasant population has declined. While the flock is quite small, pheasant hunting opportunities are available each year. Pheasant brood numbers declined again and no roosters were harvested on the managed area this year. Few hunters went after pheasants this year. Trapping is a popular activity during the late fall and early winter, especially for muskrat. Seven trapping permits were issued for the area this year. Overall, less muskrats were taken in 2016 than in previous years, due to a collapse in the wild fur market in early 2016. While our usual trappers still put in some effort, it was much lower than normal. In addition to a valuable recreational activity and renewable natural resource, the efforts of muskrat trappers help us greatly in minimizing damage to our dikes from muskrats burrowing into them. Predator control is another important benefit, as a number of mink and raccoon are taken each year as well. While coyote trapping is not especially popular, some hunters do call coyotes during the winter. Observed coyote numbers were very similar to 2015. There are significant opportunities to take furbearing animals on the game area that not only provide the sportsperson with an opportunity to hunt and trap, but also provide valuable benefits to us as managers.
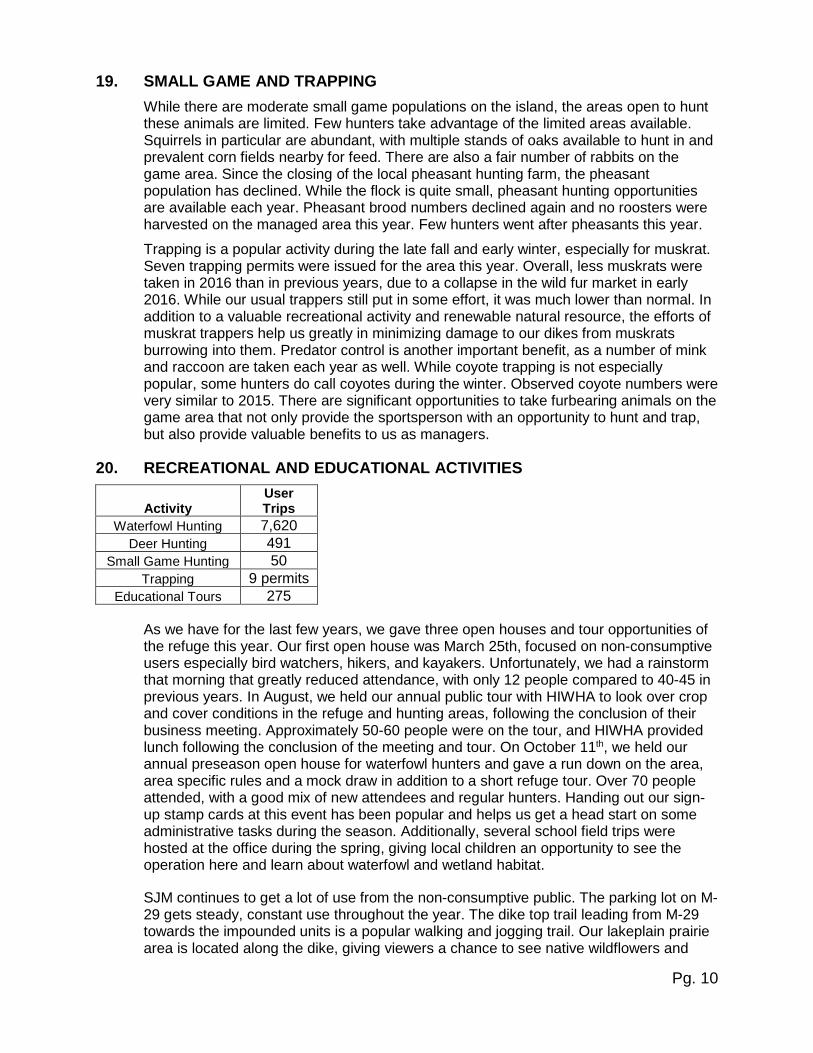
20. RECREATIONAL AND EDUCATIONAL ACTIVITIES
Activity User Trips
Waterfowl Hunting 7,620 Deer Hunting 491
Small Game Hunting 50 Trapping 9 permits
Educational Tours 275
As we have for the last few years, we gave three open houses and tour opportunities of the refuge this year. Our first open house was March 25th, focused on non-consumptive users especially bird watchers, hikers, and kayakers. Unfortunately, we had a rainstorm that morning that greatly reduced attendance, with only 12 people compared to 40-45 in previous years. In August, we held our annual public tour with HIWHA to look over crop and cover conditions in the refuge and hunting areas, following the conclusion of their business meeting. Approximately 50-60 people were on the tour, and HIWHA provided lunch following the conclusion of the meeting and tour. On October 11th, we held our annual preseason open house for waterfowl hunters and gave a run down on the area, area specific rules and a mock draw in addition to a short refuge tour. Over 70 people attended, with a good mix of new attendees and regular hunters. Handing out our sign-up stamp cards at this event has been popular and helps us get a head start on some administrative tasks during the season. Additionally, several school field trips were hosted at the office during the spring, giving local children an opportunity to see the operation here and learn about waterfowl and wetland habitat.
SJM continues to get a lot of use from the non-consumptive public. The parking lot on M-29 gets steady, constant use throughout the year. The dike top trail leading from M-29 towards the impounded units is a popular walking and jogging trail. Our lakeplain prairie area is located along the dike, giving viewers a chance to see native wildflowers and

Pg. 11
prairie songbirds. The canals throughout SJM and Harsens Island are popular kayaking and canoeing waterways that receive significant use from recreational users. With the improvements to the Krispin Drain and growing popularity of “Blueways of St. Clair” (local initiative to promote paddling paths in St. Clair County) with township and county governing bodies, kayaking and canoeing continues to grow in popularity locally.
While we do not actively manage for fishing opportunity, our lands do provide opportunities for the fishing public. The south channel parking lots on HI are popular shore fishing destinations and receive daily use throughout the summer. There is nearly daily fishing pressure throughout the summer months at these shore fishing locations. Several of our parking lots and boat ramps provide access to Lake St. Clair’s multiple bays and to the St. Clair River. Fishing is extremely popular on the Flats as a whole, with opportunities to catch everything from yellow perch to northern pike. Bow fishing for gar and carp is an increasingly popular sport on the Flats as well.
WATERFOWL HUNTING: The 2017 season was the 47th year of managed hunting on Harsens Island. The waterfowl season was 60 days in length for the 21st consecutive year. Again this year, there was a split season, with two days of the general season taking place on December 30th and 31st. The regular waterfowl season opened on October 14th and closed December 10th. The bag limit was a liberal 6 ducks, including no more than 4 mallards, two of which could be hens. The bag on black ducks was increased to 2 and pintails were reduced to one daily. This was the fifth year of the ban on spinning wing decoys in the managed area and the language of ‘no motion winged decoys’ (MWD) faced much less confusion and criticism this year compared to last. Similar to 2016, there were very few comments about the ban heard in the check station. This was year two where we only posted the order of zones picked instead of the daily harvest by zone, and it received very few comments as well.
Photo J. Frasier

Pg. 12
21. EARLY TEAL AND YOUTH SEASONS (10 days, Sept. 1-10 and 2 days, Sept 9 and 10)
This season, the early teal season was granted operational status by the Fish and Wildlife Service and was no longer considered experimental. The season was subsequently extended to 10 days to encompass two full weekends and we no longer were required to do spy blinds during the season. The teal season was almost a complete bust on the managed area with very few teal harvested and limited hunter trips. The temperatures were very warm during the ten day season. The September youth hunt also had lower than usual attendance, a combination of warm temperatures and a lower than usual turnout from the Huron Point Sportsman’s Club group on Saturday afternoon. The weather was not very conducive to duck hunting either day and resulted in the lowest hunting success that I’ve personally observed for this season. Overall we only had 25 hunter trips and 20 ducks taken during this hunt. Our youth hunt numbers are included in our annual totals, but the early teal and goose seasons are not as data is difficult to accurately collect during that time because we do not run the hunts through a managed draw system.
22. REGULAR DUCK HUNTING SEASON (58 days, October 14-December 10) The 2017 season just about made up for our struggles during the 2016 season. Our total duck harvest of 10,556 ducks is the 8th highest ever and our duck per hunter trip average of 1.39 is the 6th highest ever. Our total hunter trips and total number of parties in the draw were close to the average from the previous 4 years, though down from the high of 2015. We assigned 1,836 hunter stamp cards this year. The weather this season was very good for waterfowling, with lots of cool weather and cloud cover at night combined with regular winds that oftentimes were out of the northwest. In addition to the weather being kind to the hunters, the timing of migration activity was nearly perfect for hunting; some years, we get all of our birds in one or two big pushes, but this year we had new birds on the area almost daily through October and November. The seemingly high local production in mallards also gave us a big bump in success as our opening week was one of the best ever, taking almost 2,000 ducks in the first week compared to an average of 1,000-1,200. Observations elsewhere in the region match our success, with Point Mouillee having a record year as well, and the Canada Club just across South Channel reporting their best mallard season ever. While our crop and water conditions were very good, the weather and duck migration really played a big role in the difference between 2016 and 2017.
Mallards dominated the bag as always, jumping back up to 66.42% of the ducks harvested compared to 2016’s 61.96% and falls more in line with the average of 65%-70% in most years. Pintails were next highest again this year totaling an impressive 816 birds and 7.73% of the harvest, despite fact that hunters were only allowed one per day. They are expected to return to two per day in 2018. Greenwing teal and black duck harvest were very close at 5.36% and 5.11% respectively, while wigeon, wood ducks and gadwall each accounted for over 3% of the bag. Overall, most of our non-mallard species were close to their usual totals. Of our 7,011 mallards harvested, 60% were drakes and 40% were hens. This was the fourth year hunters were allowed a second hen in the bag and we again had very few reports of hens left in the fields and had many positive comments from hunters regarding the lack of “wasted” hens.

Pg. 13
23. DECEMBER LATE SPLIT (2 days, December 30 and 31) We remained completely frozen for the late split and had zero ducks harvested, though a total of 5 parties and 11 hunters came out for the weekend. The vast majority of ice on the area was thick enough to walk on and most zones had 3-12” of snow. During the week prior to Christmas, we still had 3,000-5,000 ducks coming into the area most afternoons to feed, but with the brutal cold between the holidays almost all of the Flats froze and pushed those birds out of the area.
24. GOOSE HUNTING We again had a very liberal goose season and complete overlap with duck season. Goose harvest was down considerably compared to previous years with only 86 geese taken. While some geese were seen coming into the area well after shooting hours and leaving before morning shooting time, casual observation showed far less than previous years. Interestingly, the October harvest of geese did not dominate the total, with only 40 geese taken during the month compared to 5 during the youth hunt and 41 the remainder of the season.
25. MIGRATION AND WATERFOWL NUMBERS The timing and quantity of duck migration this year was much better than 2016 and more in line with a normal year. While our peak refuge count did not reach the same high as 2016, that appeared to be because the ducks did not arrive in a single push and instead we had new birds arriving daily. Hunters reporting having flocks of mallards work decoys was a daily occurrence instead of a rare event. Refuge counts peaked between Halloween and the first week of November, our normal timeframe. The significant drop in refuge numbers the week of November 12th occurred during one of our short term freezes and likely doesn’t reflect a real change in refuge numbers as opposed to a temporary shift of birds roosting on the lake instead of the refuge. Duck numbers held strong until the last week of the season when we froze out for the final time, pushing the majority of ducks out of the area. A few thousand continued to roost on the lake and come into the refuge to feed during December, but even these were gone by Christmas. During the January waterfowl survey, Wildlife Biologist supervisor Terry McFadden reported no open water on the lake or Flats, with just a stretch of open water between St. Clair and Port Huron on the St. Clair River.

Pg. 14
Photo B. Bergen
ST. JOHN’S MARSH UNIT:
26. WATERFOWL NUMBERS AND MIGRATION St. John’s Marsh again benefitted from higher water levels this year. Staff was able to pump without any issues and all units had full pools of water by target dates. The high water has helped keep some areas free from phragmites, but habitat continues to be lost. Crops in the north unit did well, but corn was not able to be planted in the south unit due to high lake levels. Instead, last year’s standing corn was left and buckwheat was planted where possible. Any moist soil plants that came up in the extremely wet western end were left. Waterfowl counts in the refuge units at St. Johns were again low, peaking very early with 850 ducks on September 26th. The higher water levels have made it much easier to access the marsh and get close to the refuge. It is possible that hunter pressure around the boundaries of the refuge is pushing birds out, either to the refuge on Harsens Island or elsewhere on the lake. Similar to 2016, large numbers of wood ducks were seen coming and going from north of the managed are on Harsens Island, so it is possible a lot of wood ducks are trading back and forth between SJM and HI. These flights did appear smaller than in 2015 and 2016.
27. HUNTING SEASON All areas outside the refuge boundaries were again open to hunting. A portion of the impoundments in Units 1 and 2 are posted as refuge with signs reading "Wildlife Refuge - Do Not Enter, September 1 - End of Waterfowl Season". The 445 acre Blue Water Isles tract on the west side of M-29 remains posted as seasonal refuge with the same refuge dates. The refuge was opened to access starting December 11th, with signs posted at all entrances to the game area.
Pg. 15
Wood duck hunting is now likely the most popular waterfowl hunt at St. Johns Marsh, with heavy pressure in the flooded timber units almost daily. Hunting pressure at the north unit at Perch and Mayer roads was high early in the year, as usual, with hunters reporting some mallard success but, mostly wood ducks were taken there as well.
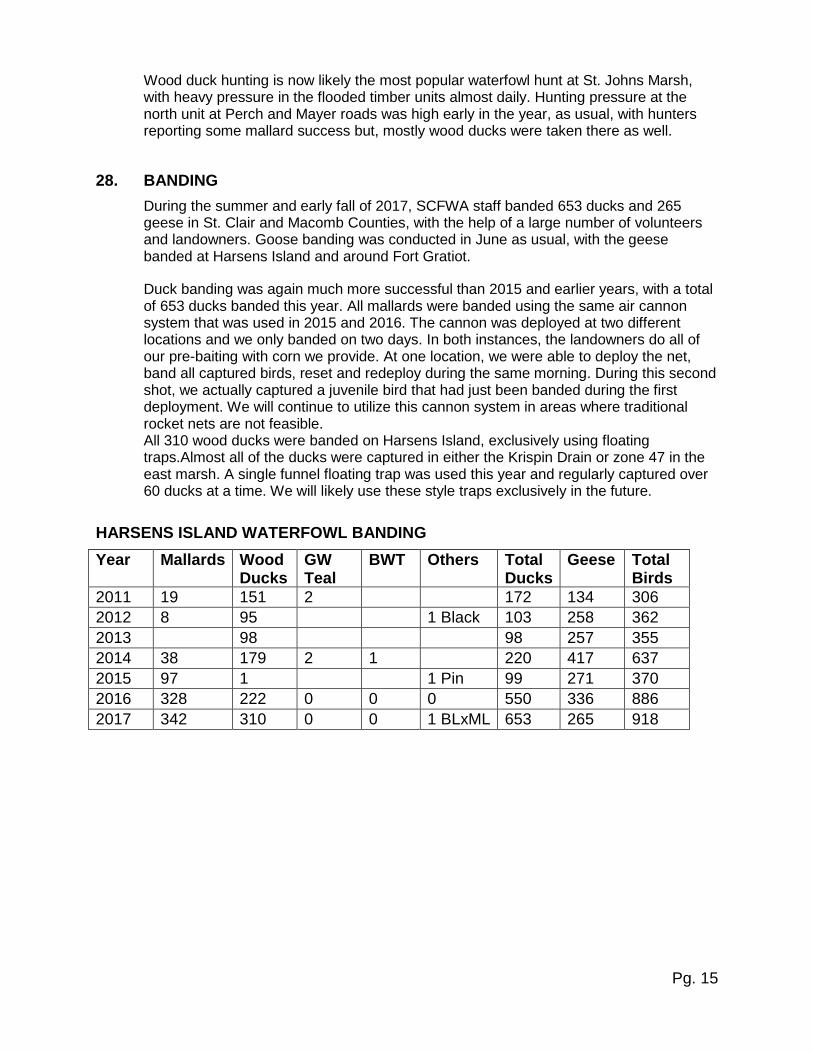
28. BANDING During the summer and early fall of 2017, SCFWA staff banded 653 ducks and 265 geese in St. Clair and Macomb Counties, with the help of a large number of volunteers and landowners. Goose banding was conducted in June as usual, with the geese banded at Harsens Island and around Fort Gratiot.
Duck banding was again much more successful than 2015 and earlier years, with a total of 653 ducks banded this year. All mallards were banded using the same air cannon system that was used in 2015 and 2016. The cannon was deployed at two different locations and we only banded on two days. In both instances, the landowners do all of our pre-baiting with corn we provide. At one location, we were able to deploy the net, band all captured birds, reset and redeploy during the same morning. During this second shot, we actually captured a juvenile bird that had just been banded during the first deployment. We will continue to utilize this cannon system in areas where traditional rocket nets are not feasible. All 310 wood ducks were banded on Harsens Island, exclusively using floating traps.Almost all of the ducks were captured in either the Krispin Drain or zone 47 in the east marsh. A single funnel floating trap was used this year and regularly captured over 60 ducks at a time. We will likely use these style traps exclusively in the future.
HARSENS ISLAND WATERFOWL BANDING Year Mallards Wood
Ducks GW Teal
BWT Others Total Ducks
Geese Total Birds
2011 19 151 2 172 134 306 2012 8 95 1 Black 103 258 362 2013 98 98 257 355 2014 38 179 2 1 220 417 637 2015 97 1 1 Pin 99 271 370 2016 328 222 0 0 0 550 336 886 2017 342 310 0 0 1 BLxML 653 265 918

Pg. 16
Photo V. Morfino
ECONOMIC IMPACTS:
29. TO LOCAL ECONOMY The town of Algonac and the community on Harsens Island rely on tourism dollars to drive the local economy. Many businesses thrive on the business brought in during the summer by boating and fishing enthusiasts. Instead of the economic flow slowing after the normal summer boating months end, the St. Clair Flats, St. Johns Marsh and the Harsens Island Managed Hunting Unit continues to draw in a regular stream of income to the local economy here. Our managed operation on the island alone sees 6,500-8,000 hunter trips a year, apart from the thousands of trips made by hunters on the surrounding St. Clair Flats area.

Pg. 17
All sportspersons are an important part of the local economy through their purchase of fuel, food, ammunition, sporting goods and other necessities, but our position on the island is especially unique. Several businesses on the island rely on the business of duck hunters during the fall to get them through the slow period of the year. Apart from duck hunters, these businesses do not experience much commerce from other sources outside the roughly 1,000 full time residents on the island. While it would be difficult to accurately total how much is spent, duck hunters are a regular, relied upon stream of business during October and November for Sans Souci Market. They report that sales spike in the evening (before the next day’s hunt) or immediately following our 11:30 draw as hunters pick up lunch and supplies for the day. The sandwiches, snacks and beverages that hunters purchase every day make up a substantial portion of their sales during the hunting season. Sans Souci Bar and the Schoolhouse Grille also see a regular flow of duck hunters, especially for breakfast. There are several cottages for rent on the island that see regular business during the summer tourism months that would see much less business during the fall if it were not for the regular and often repeat business of duck hunters coming to the island and the St. Clair Flats area. The ferry service also relies on the business from duck hunters. While they do not have a figure as to what is generated from duck hunters, it is possible to estimate. We regularly have 25-50 vehicles in our parking lot for each draw, each of which has to pay $10 to get onto the island and the $6 cost of bringing across a trailer. Each draw can easily generate $250 or more for the ferry service, which would be at least $500 a day, with weekends bringing in considerably more. Countless other businesses on the mainland also benefit from the traffic of duck hunters in the area. Lumberjack, a hardware store located just across the road from the ferry, does not have an estimate on sales generated by hunters, but they are the only source of ammo and sporting goods in the immediate local area and do see an increase in sporting goods sales during waterfowl season.

Pg. 18
FUTURE RECOMMENDATIONS What follows are several recommendations to improve habitat and recreational opportunity in the St. Clair Flats region.
• Develop water control over a larger portion of St. Johns Marsh. We are still working with Ducks Unlimited on a project to restore dikes at the old golf course location in St. Johns Marsh, giving us water control over more than 300 acres of degraded wetland areas. This will allow us to better combat invasive species and improve habitat conditions, as well as dramatically improving access into the central parts of the marsh. This will open up more and better hunting, trapping, and recreational use on the mainland.
• Continue to improve farming practices on Harsens Island. Improvements to equipment and the fertilizer program this year improved our farming operation tremendously. We will continue to look for ways to improve and experiment with different planting arrangements in some fields, including possible alternative small grains like milo or forage sorghum.
• Monitor response in the East Marsh. We will continue to monitor plant and waterfowl response in the east marsh. This will be especially important after the spraying and mowing work done this fall. It will be telling whether duck usage is again high this spring or if it drops to pre-2015 levels.
• Remain staffed throughout the waterfowl season. While the late hunt was a bust due to weather, hunters were appreciative that we could tell them we would for sure have staff here to run a draw. This eliminated some guesswork and concerns for hunters planning the final hunt of the year.
• Acquire a Marsh Master. We have transferred the Spryte to another unit. We can get by using the dozer for some projects and can rent a Marsh Master if need be, but acquiring a Marsh Master would open up some habitat management and monitoring options. Rentals will be fine short term, but acquiring one to have on hand would be great.
• Replace the Komatsu 220 excavator. We have been approved to purchase a new excavator in 2018, replacing the Komatsu. This will save us costs and time with repairs and make our time on the machine faster and more efficient as well.
• Evaluate changes to waterfowl migration and local behaviors. This should remain a priority. This is an issue much larger than just our location, but one that plays a big role in our local regulations and hunter success. We know that a bigger percentage of our mallards harvested are local birds compared to 20 or 30 years ago and that migration patterns have shifted in the prairie pothole region. Even in good years, our refuge counts are half or less than half of what they were in the 90’s, with over 75,000 ducks reported in the refuge in 1997 as an extreme example.
• Evaluate changes in deer numbers and hunter success. While deer hunting is secondary to waterfowl hunting on the island, it is still an important recreational opportunity. Consistently declining deer harvest while deer numbers remain stable is concerning to both us and the hunters. We should look for ways to increase deer hunting success without sacrificing our management goals.
• Monitor pheasant population on Harsens Island. Pheasant numbers continue to trend down. Can we find ways to improve pheasant habitat and numbers without sacrificing waterfowl goals?
Pg. 19
PROMINENT PARTNER GROUPS:
We would like to thank our many volunteers and partners for their assistance with habitat management, hunting access improvements, public events and youth hunts, and all the other help we receive at the Managed Waterfowl Area. We would also like to thank the many volunteers for their assistance with monitoring wildlife populations and bird banding. Without everyone pulling together, we would not be able to operate the way we do. The following is a list of organizations and agencies that have provided assistance in the past year to accomplish our management goals:
Harsens Island Waterfowl Hunters Association As our sharecropping partner, they provide equipment, equipment repairs and financial assistance for the cropping program. In addition, they provide funding for smaller projects such as water control structure repairs/replacements. They also provide a lot of volunteer hours with mute swan removal, goose and duck banding, and area maintenance. HIWHA has also provided supplemental funding to the DNR for additional hours to staff the afternoon and evening check station. They provided a large amount of financial support for purchasing the 8245R tractor this year.
St. Clair Flats Waterfowlers, Inc. Provides us with significant financial support, volunteer hours, and hosts the November youth duck hunt. They provide funding for equipment purchases, fertilizer, and other needs. They also assist with banding projects. This group provides lunch, free handouts (including a call, snacks, hat and dry box) and raffle prizes for our November youth duck hunt. SCFWI provided a large amount of financial support for the purchase of the 8245R and they purchased the disc-chisel outright as support for HIWHA’s sharecropping effort.
Michigan Duck Hunters Association, Blue Water Chapter Provides financial support and volunteer hours. Volunteers work on a variety of projects; primarily wood duck box building/repairing, goose banding, and duck trapping/banding.
Ducks Unlimited Provides us with significant funding in the form of grant support. Progress continues to be made on a large scale restoration project at SJM.
Waterfowl USA Chapter #1 Provides financial support and volunteer effort, primarily focused on St. Johns Marsh. Coordinate and sponsors the annual SJM spring cleanup which brings together citizens and groups from the local area to remove trash and debris from the marsh.
MUCC District 8 The Huron Point Conservation Club hosts the Saturday afternoon hunt during the early Federal September youth hunt. At an earlier outdoor fair, they sign up youths and their parents to go on the hunt. They pair them with one of the club members or volunteer who acts as guide for the hunt and provides a boat, decoys, and calling. They also provide lunch for all participants.
Pheasants Forever Work is ongoing to restore prairie areas at Port Huron state game area with the support of the St. Clair County chapter.
Pg. 20
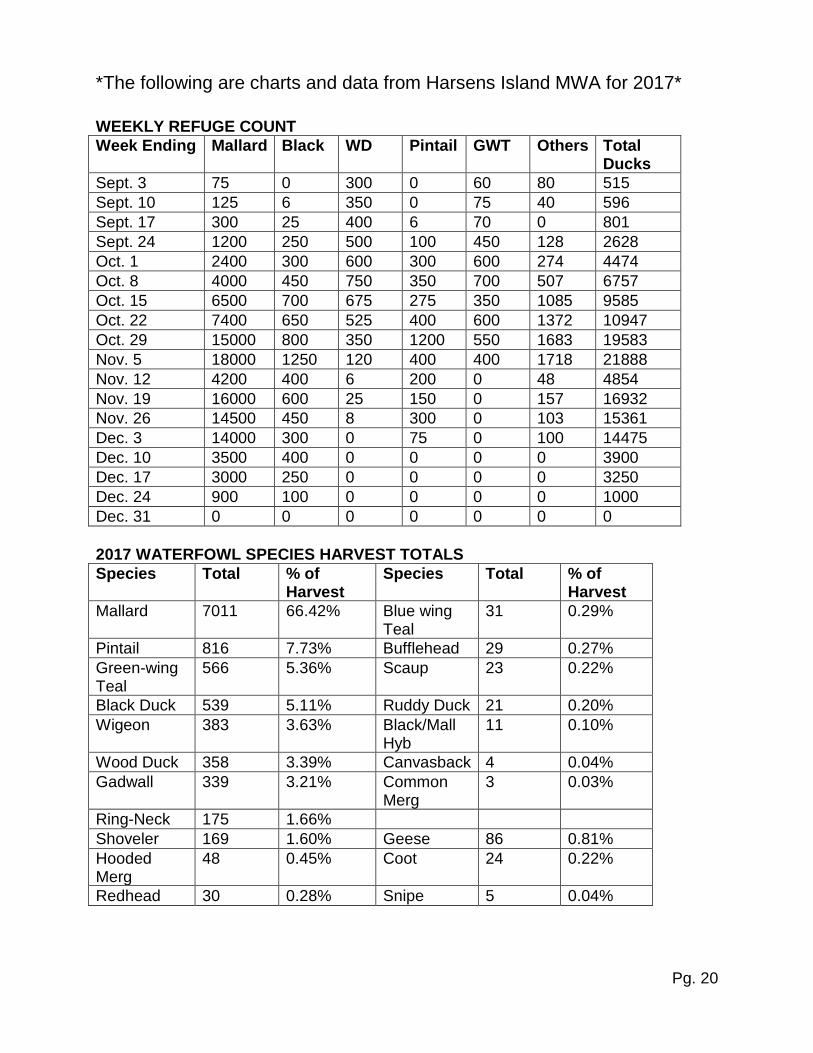
*The following are charts and data from Harsens Island MWA for 2017*
WEEKLY REFUGE COUNT Week Ending Mallard Black WD Pintail GWT Others Total
Ducks Sept. 3 75 0 300 0 60 80 515 Sept. 10 125 6 350 0 75 40 596 Sept. 17 300 25 400 6 70 0 801 Sept. 24 1200 250 500 100 450 128 2628 Oct. 1 2400 300 600 300 600 274 4474 Oct. 8 4000 450 750 350 700 507 6757 Oct. 15 6500 700 675 275 350 1085 9585 Oct. 22 7400 650 525 400 600 1372 10947 Oct. 29 15000 800 350 1200 550 1683 19583 Nov. 5 18000 1250 120 400 400 1718 21888 Nov. 12 4200 400 6 200 0 48 4854 Nov. 19 16000 600 25 150 0 157 16932 Nov. 26 14500 450 8 300 0 103 15361 Dec. 3 14000 300 0 75 0 100 14475 Dec. 10 3500 400 0 0 0 0 3900 Dec. 17 3000 250 0 0 0 0 3250 Dec. 24 900 100 0 0 0 0 1000 Dec. 31 0 0 0 0 0 0 0 2017 WATERFOWL SPECIES HARVEST TOTALS
Species Total % of Harvest
Species Total % of Harvest
Mallard 7011 66.42% Blue wing Teal
31 0.29%
Pintail 816 7.73% Bufflehead 29 0.27% Green-wing Teal
566 5.36% Scaup 23 0.22%
Black Duck 539 5.11% Ruddy Duck 21 0.20% Wigeon 383 3.63% Black/Mall
Hyb 11 0.10%
Wood Duck 358 3.39% Canvasback 4 0.04% Gadwall 339 3.21% Common
Merg 3 0.03%
Ring-Neck 175 1.66% Shoveler 169 1.60% Geese 86 0.81% Hooded Merg
48 0.45% Coot 24 0.22%
Redhead 30 0.28% Snipe 5 0.04%

Pg. 21
5 YEAR ANNUAL HARVEST AND USE COMPARISON
Year Parties in Draw
Hunter Trips Ducks Cripples Geese
Ducks/ Trip
2013 3558 6336 9198 1537 128 1.45 2014 3771 7036 9076 1628 128 1.29 2015 4576 8044 9172 1609 106 1.14 2016 4183 7541 7701 1521 113 1.02 2017 3997 7569 10556 1847 86 1.39
MONTHLY HARVEST AND PARTICIPATION STATISTICS
Month # of Days
Ducks Harvested
Hunter Trips
Ducks/ hunter trip
Ducks/Day
October 18 4518 2745 1.65 251 November 30 5126 3995 1.28 171 December 12 892 804 1.11 74
WEEKLY HARVEST AND PARTICIPATION STATISTICS Date Number
of Days Ducks Harvested
Hunter Trips
Ducks/ hunter trip
Ducks /day
Hunters /Day
Geese Harvested
9/9 and 9/10 2 20 25 0.80 10 13 5 10/14 - 10/20 7 1945 981 1.98 278 140 15 10/21 - 10/27 7 1307 1073 1.22 187 153 21 10/28 - 11/3 7 1914 1128 1.70 273 161 12 11/4 - 11/10 7 1684 1067 1.58 241 152 10 11/11 - 11/17 7 1404 954 1.47 201 136 10 11/18 - 11/24 7 933 992 0.94 133 142 3 11/25 - 12/1 7 515 595 0.87 74 85 7 12/2 - 12/8 7 817 665 1.23 117 95 0 12/9 - 12/10 2 17 78 0.22 9 39 3 12/30 - 12/31 2 0 11 0.00 0 6 0 Totals 60 10556 7569 1.39 176 126 86

Pg. 22
DAILY HARVEST AND PARTICIPATION STATISTICS
Date Parties Hunters Cumulative
Hunters Ducks Cumulative
Ducks Geese Cripples 9/9 A 10 10 10 13 13 3 5
P 4 9 19 3 16 0 3 9/10 A 5 6 25 4 20 2 8
P 0 0 25 0 20 0 0
Oct. 14 A 46 142 167 245 265 2 73
P 30 87 254 144 409 4 49 10/15 A 34 110 364 101 510 1 24
P 34 102 466 128 638 0 34 10/16 A 44 72 538 142 780 1 24
P 25 63 601 171 951 1 29 10/17 A 23 45 646 132 1083 2 25
P 22 54 700 208 1291 0 25 10/18 A 19 39 739 116 1407 0 14
P 15 43 782 165 1572 0 15 10/19 A 18 44 826 96 1668 2 8
P 19 56 882 150 1818 0 10 10/20 A 27 63 945 80 1898 2 17
P 22 61 1006 67 1965 0 8 10/21 A 60 98 1104 72 2037 1 15
P 34 84 1188 66 2103 1 9 10/22 A 60 104 1292 77 2180 1 6
P 45 82 1374 47 2227 0 5 10/23 A 33 69 1443 56 2283 0 11
P 35 90 1533 151 2434 1 29 10/24 A 42 70 1603 103 2537 1 33
P 53 101 1704 143 2680 6 32 10/25 A 39 61 1765 93 2773 6 10
P 35 75 1840 62 2835 0 10 10/26 A 18 45 1885 73 2908 3 15
P 20 40 1925 75 2983 0 16 10/27 A 37 72 1997 105 3088 0 17
P 44 82 2079 184 3272 1 19 10/28 A 84 103 2182 113 3385 0 17
P 65 126 2308 117 3502 0 21 10/29 A 71 91 2399 72 3574 0 18
P 44 86 2485 94 3668 0 12 10/30 A 26 55 2540 168 3836 3 29
P 44 78 2618 267 4103 0 35 10/31 A 32 65 2683 248 4351 1 28
P 34 87 2770 187 4538 0 33

Pg. 23
DAILY STATISTICS CONT.
Date Parties Hunters Cumulative
Hunters Ducks Cumulative
Ducks Geese Cripples Nov. 1 A 26 57 2827 123 4661 0 25
P 25 70 2897 174 4835 0 37 11/2 A 34 64 2961 134 4969 5 20
P 40 78 3039 50 5019 3 8 11/3 A 43 78 3117 74 5093 0 19
P 34 90 3207 93 5186 0 16 11/4 A 78 114 3321 125 5311 0 19
P 71 94 3415 218 5529 0 20 11/5 A 60 93 3508 96 5625 0 29
P 50 103 3611 152 5777 0 20 11/6 A 39 74 3685 61 5838 0 13
P 38 73 3758 91 5929 1 23 11/7 A 28 52 3810 78 6007 2 12
P 25 50 3860 97 6104 0 12 11/8 A 14 27 3887 52 6156 2 11
P 20 42 3929 68 6224 0 15 11/9 A 39 71 4000 107 6331 0 16
P 57 105 4105 299 6630 1 40 11/10 A 51 90 4195 81 6711 2 8
P 43 79 4274 159 6870 2 23 11/11 A 22 65 4339 7 6877 2 3
P 38 89 4428 65 6942 2 10 11/12 A 45 80 4508 55 6997 0 3
P 59 85 4593 146 7143 1 24 11/13 A 24 52 4645 95 7238 0 24
P 38 72 4717 140 7378 0 34 11/14 A 19 35 4752 60 7438 0 10
P 20 49 4801 113 7551 0 19 11/15 A 34 60 4861 91 7642 0 26
P 53 83 4944 212 7854 0 52 11/16 A 39 69 5013 127 7981 4 21
P 48 87 5100 168 8149 0 26 11/17 A 29 46 5146 37 8186 1 3
P 50 82 5228 88 8274 0 16 11/18 A 52 80 5308 30 8304 0 5
P 59 83 5391 44 8348 0 9 11/19 A 72 105 5496 79 8427 2 14
P 63 82 5578 100 8527 0 29 11/20 A 19 47 5625 66 8593 0 6
P 27 62 5687 76 8669 0 18 11/21 A 24 55 5742 83 8752 1 10
P 36 77 5819 61 8813 0 9

Pg. 24
DAILY STATISTICS CONT.
Date Parties Hunters Cumulative
Hunters Ducks Cumulative
Ducks Geese Cripples 11/22 A 28 46 5865 73 8886 0 16
P 30 64 5929 95 8981 0 17 11/23 A 43 77 6006 23 9004 0 7
P 24 57 6063 88 9092 0 8 11/24 A 29 61 6124 37 9129 0 4
P 73 96 6220 78 9207 0 10 11/25 A 40 54 6274 22 9229 0 5
P 65 86 6360 51 9280 0 4 11/26 A 25 53 6413 19 9299 0 1
P 39 57 6470 70 9369 0 11 11/27 A 7 16 6486 5 9374 0 0
P 15 30 6516 29 9403 1 8 11/28 A 19 37 6553 28 9431 0 5
P 32 52 6605 59 9490 0 9 11/29 A 13 30 6635 20 9510 1 5
P 18 39 6674 67 9577 0 9 11/30 A 13 24 6698 25 9602 4 2
P 38 67 6765 62 9664 1 13 Dec. 1 A 6 13 6778 19 9683 0 6
P 20 37 6815 39 9722 0 6 12/2 A 23 48 6863 12 9734 0 2
P 27 50 6913 14 9748 0 2 12/3 A 15 30 6943 10 9758 0 2
P 20 41 6984 32 9790 0 2 12/4 A 11 26 7010 16 9806 0 4
P 50 73 7083 51 9857 0 12 12/5 A 14 31 7114 84 9941 0 17
P 50 78 7192 162 10103 0 42 12/6 A 17 43 7235 53 10156 0 8
P 43 76 7311 227 10383 0 39 12/7 A 8 20 7331 36 10419 0 5
P 36 76 7407 104 10523 0 10 12/8 A 8 16 7423 3 10526 0 3
P 28 57 7480 13 10539 0 4 12/9 A 3 6 7486 2 10541 2 0
P 21 51 7537 7 10548 0 0 12/10 A 1 8 7545 3 10551 1 0
P 3 13 7558 5 10556 0 1
12/30 A 4 10 7568 0 10556 0 0 P 0 0 7568 0 10556 0 0
12/31 A 1 1 7569 0 10556 0 0 P 0 0 7569 0 10556 0 0

Pg. 25
2017 SEASON HARVEST BY AREA
CROPPED FIELDS-HARVEST BY AREA
Area Hunter Trips Ducks Cripples Other
Ducks/ Hunter
Trip
Cripples/ Hunter
Trip Cripples/
Duck
1 102 73 12 0.72 0.12 0.16 2 140 104 14 0.74 0.10 0.13 3 209 225 26 3 cg 1.08 0.12 0.12 4 245 315 58 1 cg 1.29 0.24 0.18 5 158 87 10 0.55 0.06 0.11 6 243 289 44 3 cg 1.19 0.18 0.15 7 274 466 63 9 cg, 1 ct 1.70 0.23 0.14 8 75 93 35 1.24 0.47 0.38 9 210 280 35 3 cg 1.33 0.17 0.13 10 209 205 28 2 cg, 2 ct 0.98 0.13 0.14 11 187 230 28 1 cg, 4 ct 1.23 0.15 0.12 12 102 46 12 1 cg, 7 ct 0.45 0.12 0.26 13 182 134 23 6 cg 0.74 0.13 0.17 14 296 573 79 6 cg, 2 sn 1.94 0.27 0.14 15 291 510 95 3 cg, 1 ct 1.75 0.33 0.19 16 274 547 81 2.00 0.30 0.15 17 257 411 73 1 cg 1.60 0.28 0.18 18 194 225 39 1 cg 1.16 0.20 0.17 20 30 14 5 0.47 0.17 0.36 21 236 186 30 0.79 0.13 0.16 22 289 408 76 3 cg, 1 sn 1.41 0.26 0.19 23 287 497 81 1.73 0.28 0.16
24 311 668 106 1 cg, 2 ct,
2 sn 2.15 0.34 0.16 25 294 692 104 5 cg, 1 ct 2.35 0.35 0.15 26 284 597 89 7 cg, 2 ct 2.10 0.31 0.15 27 276 329 71 7 cg, 2 ct 1.19 0.26 0.22 28 205 323 56 3 cg, 1 ct 1.58 0.27 0.17 29 231 456 74 2 cg 1.97 0.32 0.16 30 228 479 62 1 cg 2.10 0.27 0.13
TOTAL 6319 9462 1509 69 cg, 23 ct, 5 sn 1.50 0.24 0.16

Pg. 26
EAST MARSH-HARVEST BY AREA
Area Hunter Trips Ducks Cripples Other
Ducks/ Trip
Cripples/ Trip
Cripples/Duck
31 123 68 17 3 cg 0.55 0.14 0.25 33 31 26 7 1 cg 0.84 0.23 0.27 35 50 41 13 0.82 0.26 0.32 36 37 18 10 0.49 0.27 0.56 37 3 0 0 0.00 0.00 0.00 38 15 6 2 0.40 0.13 0.33 39 21 3 2 0.14 0.10 0.67 40 2 0 0 0.00 0.00 0.00 41 0 0 0 N/A N/A N/A 43 2 0 0 0.00 0.00 0.00 44 0 0 0 N/A N/A N/A 45 0 0 0 N/A N/A N/A 46 18 2 4 1 cg 0.00 0.00 2.00 47 5 0 0 0.00 0.00 0.00
TOTAL 307 164 55 5 cg 0.53 0.18 0.34
WEST MARSH-HARVEST BY AREA
Area Hunter Trips Ducks Cripples Other
Ducks/ Trip
Cripples/ Trip
Cripples/Duck
60 0 0 0 N/A N/A N/A 62 3 0 0 0.00 0.00 0.00 63 4 0 0 0.00 0.00 0.00 64 0 0 0 N/A N/A N/A 65 9 0 0 0.00 0.00 0.00 66 20 9 2 0.45 0.10 0.22 67 22 19 6 0.86 0.27 0.32 68 83 69 19 2 cg 0.83 0.23 0.28 70 73 45 16 1 cg, 1 ct 0.62 0.22 0.36 71 154 177 59 1 cg 1.15 0.38 0.33 72 98 89 26 1 cg 0.91 0.27 0.29 73 163 174 65 2 cg 1.07 0.40 0.37 74 172 256 56 4 cg 1.49 0.33 0.22 75 46 11 8 1 cg 0.24 0.17 0.73 76 22 28 6 1.27 0.27 0.21 80 64 39 16 0.61 0.25 0.41
TOTAL 933 916 279 12 cg, 1 ct 0.98 0.30 0.30

Pg. 27
UPLAND AREAS
Area Hunter Trips Ducks Cripples Other
90-92 0 0 0 0 95-97 0 0 0 0 98-100 10 14 4 0
102-104 0 0 0 0 TOTAL 10 14 4 0
GRAND TOTALS
Area Hunter Trips Ducks Cripples Geese
Ducks/ Trip
Cripples/ Duck
Crops 6319 9462 1509 69 1.50 0.16 West 933 916 279 12 0.98 0.30 East 307 164 55 5 0.53 0.34 Uplands 10 14 4 0 1.40 0.29 Totals 7569 10556 1847 86 1.39 0.17
BLACK DUCK AGE/SEX DATA Black Ducks 45 Total
A. Male A. Female J. Male J. Female Sample Totals 15 13 9 8 % of Total 33.33% 28.89% 20.00% 17.78%
MALLARD AGE/SEX DATA
Mallards 224 Total
A. Male A. Female J. Male J. Female Sample Totals 85 61 39 39 % of Total 37.95% 27.23% 17.41% 17.41%

Pg. 28
EQUIPMENT LIST
Two (2) outboard motors 10-yard dump truck 1979 2-1/2 ton truck 1977 9600 tractor 1978 4630 John Deere tractor 2012 6230 John Deere loader tractor CAT D4C dozer 1983 backblade 1987 16-ft. boat 2005 7320 John Deere tractor 2008 7430 John Deere tractor 2017 8245R John Deere tractor (new this year) 2008 17’4” John Deere disc 2011 150 gallon skid mount sprayer 15 ft. Meyers canoe 1977 6-bottom plow 16 ft. Go-Devil Boat w/motor 13’ 9” John deere disc 8-row corn planter 6-row corn planter 16-ft. disc 12-ft. grain drill 1978 Sprayer 1952 14-ft. boat 1990 batwing mower 6 ft. 3 pt. mower 2009 10 foot mower 16 ft. Glenco soil finisher 1988 Komatsu Excavator