st john’s school, newton, porthcawl · january 2020 st john’s school, newton, porthcawl 12...
TRANSCRIPT

St John’s School,Newton, Porthcawl
Transport Statement
JANUARY
Taylor Wimpey South Wales

Lime Transport Ltd5A Andrews Buildings Stanwell Rd Penarth, CF64 2AA
t: 02920 700924e: [email protected]
www.limetransport.com
Project no. 19112
Document ref. 19112.d1
Prepared by ECC
Checked by ABR
Status Draft
Date 29 January 2020

January 2020 St John’s School, Newton, Porthcawl Transport Statement (doc ref. 19112.d1)
Table of contents 1 Introduction ......................................................................................................................... 3
1.1 Background ................................................................................................................................. 3
1.2 Development proposals .............................................................................................................. 3
1.3 Purpose of this report ................................................................................................................. 4
2 Existing situation and accessibility ........................................................................................ 5
2.1 Site location ................................................................................................................................ 5
2.2 Accessibility ................................................................................................................................. 6
2.3 Local highway network ............................................................................................................... 9
2.4 Personal injury accident data .................................................................................................... 10
3 Development proposals ...................................................................................................... 12
3.2 Access ........................................................................................................................................ 14
3.3 On-site car and cycle parking provision .................................................................................... 16
3.4 Cycle parking provision ............................................................................................................. 17
3.5 Deliveries and servicing ............................................................................................................ 18
4 Trip generation ................................................................................................................... 19
4.1 Introduction .............................................................................................................................. 19
4.2 Trip generation .......................................................................................................................... 19
4.3 Distribution of development generated traffic ........................................................................ 21
4.4 Assignment of development generated traffic ......................................................................... 22
4.5 Background traffic growth ........................................................................................................ 23
4.6 Growth factors .......................................................................................................................... 23
4.7 Final future traffic flows ............................................................................................................ 24
5 Percentage impact analysis ................................................................................................. 25
5.1 Introduction .............................................................................................................................. 25
5.2 Percentage impact analysis ....................................................................................................... 25
5.3 Summary ................................................................................................................................... 26
6 Summary and conclusions ................................................................................................... 27
6.1 Summary ................................................................................................................................... 27
6.2 Development proposals ............................................................................................................ 27
6.3 Conclusions ............................................................................................................................... 28

January 2020 St John’s School, Newton, Porthcawl Transport Statement (doc ref. 19112.d1)
Figures
Figure 1.1 Site locationFigure 2.1 Local highway networkFigure 2.2 Local amenities within walking distanceFigure 2.3 Local public transport networkFigure 2.4 Location and severity of personal injury accidentsFigure 3.1 Development proposalsFigure 3.2 Access one – Birch WalkFigure 3.3 Access two – Bryneglwys Avenue
Appendices
Appendix A Swept path analysis – Birch WalkAppendix B Visibility splay along Birch WalkAppendix C Swept path analysis – Bryneglwys AvenueAppendix D Visibility splay along Bryneglwys AvenueAppendix E TRICS 7.6.1: Residential; Houses privately ownedAppendix F TRICS 7.6.1: Residential; Affordable dwellingsAppendix G Development generated trafficAppendix H 2019, 2021, 2025, 2030 and 2040 base traffic flows Appendix I Final future traffic flows – 2021, 2025, 2030 and 2040

January 2020 St John’s School, Newton, Porthcawl 3 Transport Statement (doc ref. 19112.d1)
1 Introduction
1.1 Background
1.1.1 Lime Transport has been commissioned by Taylor Wimpey South Wales to produce a Transport Statement in support of a planning application for up to 74 dwellings on the former St John’s School, Newton, Porthcawl.
1.1.2 The location of the site, which currently comprises the former disused buildings, school playing fields and hard landscaping, is shown in Figure 1.1 below.
Figure 1.1 Site location
1.2 Development proposals
1.2.1 As part of the re-development of the site, it is proposed to provide 74 dwellings with:
61 open market houses:
39 no. x 3-bedroom houses
22 no. x 4-bedroom houses
13 affordable dwellings:
12no. x 1-bedroom flats
One x 4-bedroom house

January 2020 St John’s School, Newton, Porthcawl 4 Transport Statement (doc ref. 19112.d1)
Together with 180 residents’ and visitor car parking spaces.
1.3 Purpose of this report
1.3.1 The purpose of this Transport Statement is to detail the likely transport characteristics of the proposed development and highlight any impact on the surrounding highway network.
1.3.2 Following this introductory section, the report is structured as follows:
Sections 2 identifies the accessibility of the site and reviews personal injury accident
data within the study area;
Section 3 describes the development proposals, including the proposed accesses to
the site and on-site car and cycle parking provision;
Section 4 predicts the likely travel characteristics of the proposed development;
Section 5 outlines the impact of the proposed development on the local highway
network; and,
Section 5 summarises the findings of the report.

January 2020 St John’s School, Newton, Porthcawl 5 Transport Statement (doc ref. 19112.d1)
2 Existing situation and accessibility
2.1 Site location
2.1.1 This section of the Transport Statement summarises the existing transport network within the vicinity of the site, detailing accessibility by walking, cycling and public transport, and provides a brief description of the local highway network.
2.1.2 The proposed development is located on the existing site of the former St Johns School site, Newton, approximately 2.8km (1.7 miles) west of Porthcawl Town Centre. The development site is bounded by:
St Clare’s Co-Educational day School to the north;
Birch Walk to the east;
Pedestrian footpath linking Bryneglwys Avenue and Birch Walk to the south; and,
Bryneglwys Avenue to the west
2.1.3 The location of the development site, together with the local highway network is shown in Figure 2.1 below.
Figure 2.1 Local highway network Contains Ordnance Survey data © Crown copyright and database right (2017)
January 2020 St John’s School, Newton, Porthcawl 6 Transport Statement (doc ref. 19112.d1)
2.2 Accessibility
2.2.1 Walking can provide health, economic and environmental benefits and can replace the use of private car, particularly for short journeys. It is considered that the site is accessible by walking, cycling and public transport as described in the following paragraphs.
Walking
2.2.2 There are pedestrian footways along one or both sides of the majority of roads within the vicinity of the site, including:
a footway along the western side of Bryneglwys Avenue, connecting Church Street
(to the north) and the residential properties along Bryneglwys Avenue (to the south);
and,
a continuous footway along the eastern edge of Birch Walk, together with a footway
along the western edge of Birch Walk (to the south of the existing gate serving the
school site).
2.2.3 There is also a PRoW that runs along the southern boundary of the site, providing a link between Bryneglwys Avenue (to the west) and Birch Walk (to the east) in the vicinity of the site.
2.2.4 The Chartered Institution of Highways and Transportation (CIHT) guidelines ‘Providing for Journeys on Foot’ indicates that the desirable walking distance for commuting and school journeys is 500m (0.3 miles), the acceptable walking distance is 1km (0.6 miles) and 2km (1.2 miles) is the preferred maximum.
2.2.5 The CIHT guidelines also indicate that the desirable walking distance for ‘Elsewhere’, including local amenities, is 400m (0.2 miles), the acceptable walking distance is 800m (0.5 miles) and 1.2km (0.7 miles) is the preferred maximum.
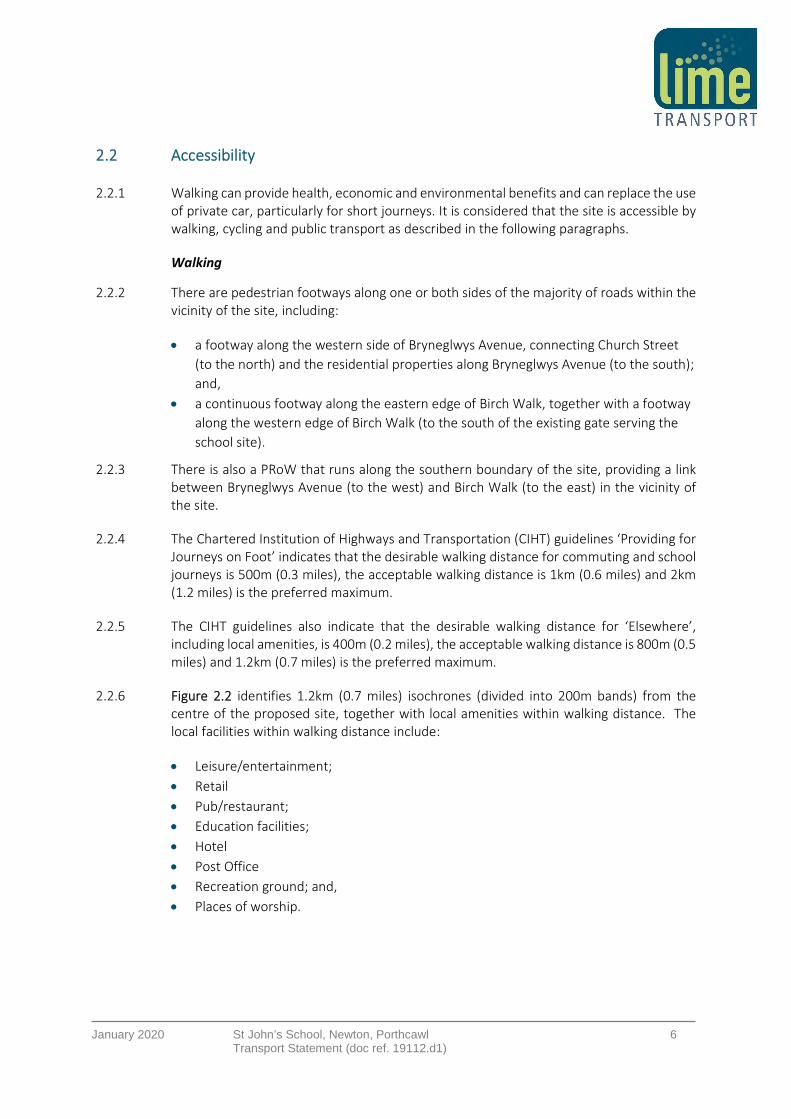
2.2.6 Figure 2.2 identifies 1.2km (0.7 miles) isochrones (divided into 200m bands) from the centre of the proposed site, together with local amenities within walking distance. The local facilities within walking distance include:
Leisure/entertainment;
Retail
Pub/restaurant;
Education facilities;
Hotel
Post Office
Recreation ground; and,
Places of worship.

January 2020 St John’s School, Newton, Porthcawl 7 Transport Statement (doc ref. 19112.d1)
Figure 2.2 Local amenities within walking distance
Cycling
2.2.7 There are no formal cycle facilities within the immediate vicinity of the site. However, there are plans to develop Route 88, which will form part of the National Cycle Network. This coastal route will run between Newport, Cardiff, Bridgend and Margam Country Park. Some sections of the route have been constructed, some are under construction, and other are still in planning. Once constructed, route 88 will be accessible via Beach Road to the south-west of the site.
2.2.8 The closest existing cycle route from the site is National Cycle Route (NCN) 885, located approximately 7 km (30 minute cycle) to the north-east of the site, and provides cycle routes throughout Bridgend.
Public Transport
2.2.9 This area of Porthcawl is reasonably well served by public transport, with regular scheduled bus services along Bridgend Road (to the north and west of the site). There is currently also a local service along Birch Walk and Church Street, connecting the site with Porthcawl Town Centre, however, it is understood that this service is soon to be withdrawn.
2.2.10 The closest bus stops to the site are located on Church Street (to the west) and Birch Walk/Laburnum Avenue (to the east), both of which are approximately 250m from the centre of the site.
Contains Ordnance Survey data © Crown copyright and database right (2017)
January 2020 St John’s School, Newton, Porthcawl 8 Transport Statement (doc ref. 19112.d1)
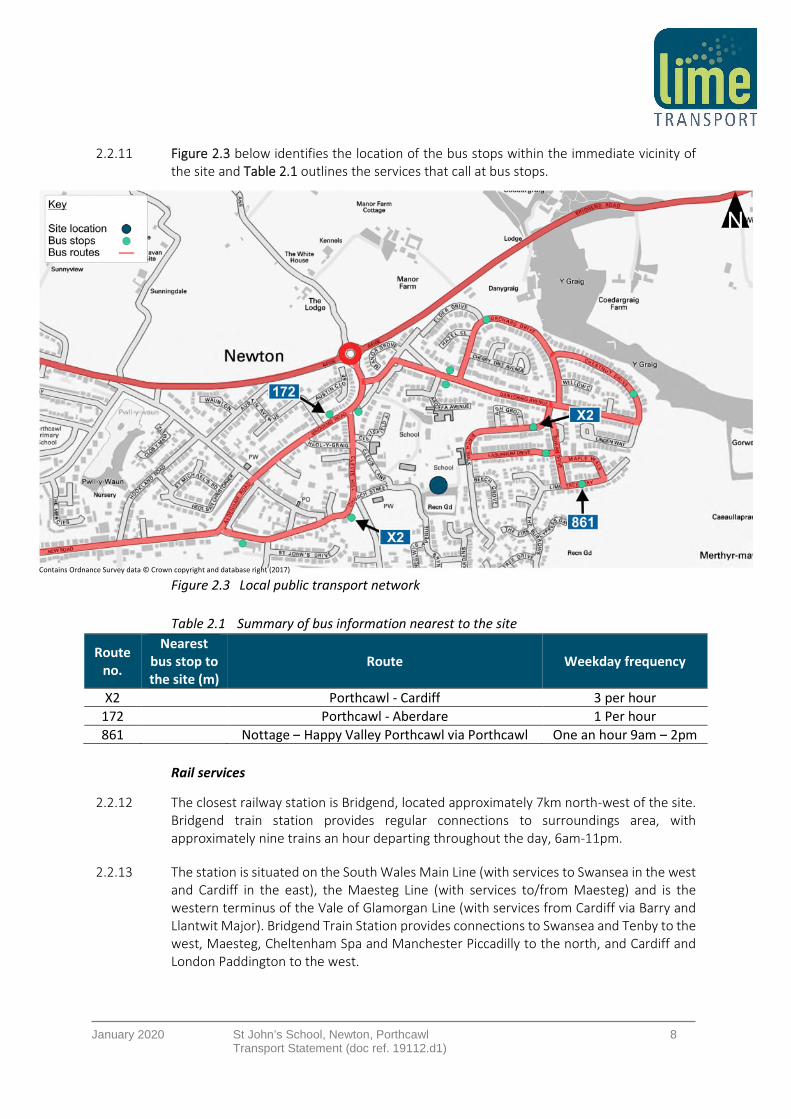
2.2.11 Figure 2.3 below identifies the location of the bus stops within the immediate vicinity of the site and Table 2.1 outlines the services that call at bus stops.
Figure 2.3 Local public transport network
Table 2.1 Summary of bus information nearest to the site
Route no.
Nearest bus stop to the site (m)
Route Weekday frequency
X2 Porthcawl - Cardiff 3 per hour
172 Porthcawl - Aberdare 1 Per hour
861 Nottage – Happy Valley Porthcawl via Porthcawl One an hour 9am – 2pm
Rail services
2.2.12 The closest railway station is Bridgend, located approximately 7km north-west of the site. Bridgend train station provides regular connections to surroundings area, with approximately nine trains an hour departing throughout the day, 6am-11pm.
2.2.13 The station is situated on the South Wales Main Line (with services to Swansea in the west and Cardiff in the east), the Maesteg Line (with services to/from Maesteg) and is the western terminus of the Vale of Glamorgan Line (with services from Cardiff via Barry and Llantwit Major). Bridgend Train Station provides connections to Swansea and Tenby to the west, Maesteg, Cheltenham Spa and Manchester Piccadilly to the north, and Cardiff and London Paddington to the west.
Contains Ordnance Survey data © Crown copyright and database right (2017)

January 2020 St John’s School, Newton, Porthcawl 9 Transport Statement (doc ref. 19112.d1)
2.2.14 The station has 102 car parking spaces, with three accessible spaces, which is operated by National Car Parks Ltd (NCP). There is also a set-down/pick-up facility, adjacent to the station building, and the station is accessible by a regular bus service (route X2).
2.3 Local highway network
2.3.1 A description of the local highway network is outlined in Table 2.2 below.
Table 2.2 Local highway network description
Description
Church Street/ Bryneglwys Avenue
Description This is a local access road providing a connection to Bridge Road to the west. There is a pedestrian footway on the western edge of the carriageway.
Width 5.6m
Speed limit 30mph
Street lighting Yes
Crossing facilities None
Bus route No
Character The road is predominantly residential in nature, and is also frontedby St John the Baptist Church and allotments along its southern and western edge (in the vicinity of the site).
On-street parking Double yellow lines located on both sides of the carriageway along the length of the road. No parking restrictions apply on either side of the carriageway within the vicinity of the site.
Birch Walk
Description A residential road providing access to a number of residential roads and culs-de-sac. The road has pedestrian footways on both sides of the carriageway.
Width Approximately 8m
Speed limit 30mph
Street lighting Yes
Crossing facilities None
Bus route Yes
Character Birch Walk forms part of a generally suburban road with residential frontages on both sides of the carriageway.
On-street parking There are no parking restrictions
Danygraig Avenue
Description
A residential road providing access to a number of residential roads and culs-de-sac (including Birch Walk). The road has footways on both sides of the carriageway. At the northern end of the road is the junction with Bridgend Road
Width 6m

January 2020 St John’s School, Newton, Porthcawl 10 Transport Statement (doc ref. 19112.d1)
2.4 Personal injury accident data
2.4.1 Personal injury accident data has been obtained for the most recent 5-year period (2014 to 2018 inclusive) for the area around the site. The study area (which includes key routes and junctions surrounding the site) together with the location and severity of accidents that occurred within it, is shown on Figure 2.4 below.
Figure 2.4 Location and severity of personal injury accidents
2.4.2 Table 2.3 below summarises the personal injury accidents that occurred within the study area by severity, number of casualties and by vulnerable user.
Speed limit 30mph
Street lighting Yes
Crossing facilities Dropped kerbs and tactile paving located at major road junctions
Bus route Yes
Character Danygraig Avenue is dominated by residential street frontage on both sides of the carriageway.
On-street parking There are no parking restrictions along the road, and during peak periods (particularly the AM Peak) the northern end of the road can be heavily parked with parents dropping children at the school.
Contains Ordnance Survey data © Crown copyright and database right (2017)

January 2020 St John’s School, Newton, Porthcawl 11 Transport Statement (doc ref. 19112.d1)
Table 2.3 summary of personal injury accident data
Personal injury No. of casualties
Vulnerable users
Fatal Serious Slight Pedestrians Child Cyclists Motorcycle
2014 0 1 3 9 1 0 0 0
2015 0 1 5 10 1 1 0 1
2016 0 0 2 6 0 1 0 0
2017 0 0 1 1 0 0 0 1
2018 0 0 1 1 0 0 0 0
Total 0 2 12 27 2 2 0 2
2.4.3 It can be seen from Table 2.3 above that a total of 14 accidents, resulting in 27 casualties, occurred within the vicinity of the site over the most recent five years, with:
Two accidents (14%) resulting in serious injuries being sustained;
12 accidents (86%) resulting in slight injuries being sustained;
Six accidents (43%) involved vulnerable road users:
14% (of total accidents) involved pedestrians;
14% (of total accidents) involved child casualties;
14% (of total accidents) involved a motorcyclists.
2.4.4 It is considered that, given the scale of the proposed development and the dispersed nature of the recorded personal injury accidents within the study area, the proposed development will have minimal impact on road safety.

January 2020 St John’s School, Newton, Porthcawl 12 Transport Statement (doc ref. 19112.d1)
3 Development proposals
3.1.1 As outlined in Section 1 above it is proposed to re-develop the site of the former St. John’s School, Newton, to provide a total of 74 residential dwellings.
3.1.2 The site is located within Newton, approximately 2.8km (1.7 miles) west of Porthcawl Town Centre.
3.1.3 It is anticipated that the proposed development will comprise:
61 open market houses:
39 no. 3-bedroom houses
22 no. 4-bedroom houses
13 affordable dwellings:
12 no. 1-bedroom flats; and,
One x 4-bedroom house
Car and cycle parking provision in accordance with the adopted parking standards;
Two vehicle accesses, with one via Birch Walk (to the east of the site) and a second
access on to Bryneglwys Avenue (to the west of the site); and,
A pedestrian/cycle route through the site, connecting Birch Walk with Bryneglwys
Avenue.
3.1.4 The development proposals are illustrated in Figure 3.1 below.

January 2020 St John’s School, Newton, Porthcawl 13 Transport Statement (doc ref. 19112.d1)
Figure 3.1 Development proposals

January 2020 St John’s School, Newton, Porthcawl 14 Transport Statement (doc ref. 19112.d1)
3.2 Access
Vehicles
3.2.1 As part of the development it is proposed to provide two vehicle accesses to the site, as outlined below and described un more detail in the following paragraphs:
A vehicle access off Birch Walk to the east of the site to serve 70 residential
dwellings; and
A second access, onto Bryneglwys Avenue to the west of the site, to serve four large
detached properties.
3.2.2 It should be noted that there will be no vehicle connection between the two access points.
Access one – Birch Walk
3.2.3 The proposed access onto Birch Walk is a simple priority junction, with a carriageway width of 5.5m, and a 2.0m footway on both sides of the carriageway. The proposed access is shown in Figure 3.2 below.
Figure 3.2 Access one – Birch Walk
3.2.4 A swept path analysis, presented in Appendix A, shows the range of vehicles likely to access the site, including 7.5t box van, 4.6t light van, 7.7m fire tender and Volkswagen Touran.

January 2020 St John’s School, Newton, Porthcawl 15 Transport Statement (doc ref. 19112.d1)
3.2.5 In order to determine the required visibility splays at the proposed access, an ATC Survey (which records vehicle speed as well as the volume of traffic) was undertaken along Birch Walk in the vicinity of the proposed access. The ATC was undertaken on 17th March 2029, and the results are summarised below:
27.6mph mph northbound – 39m Stopping Sight Distance (SSD)
25.7mph southbound – 35m SSD
3.2.6 The required visibility splay at the proposed access on to Birch Walk is shown in Appendix B, and it can be seen that the required visibility can be achieved at the access.
Access two - Bryneglwys Avenue
3.2.7 The proposed access onto Bryneglwys Avenue is a shared-surface private drive, with a total width of 5.5m, as shown in Figure 3.3 below.
Figure 3.3 Access Two – Bryneglwys Avenue
3.2.8 It is anticipated that the majority of deliveries to these four properties will be undertaken from the private driveway. However, it is anticipated that refuse will be collected from Bryneglwys Avenue, and therefore a bin collection has been provided adjacent to the junction.
3.2.9 A swept path analysis, presented in Appendix C, shows the range of vehicles likely to access the site, including 7.5t box van, 4.6t light van, 7.7m fire tender and Volkswagen Touran.

January 2020 St John’s School, Newton, Porthcawl 16 Transport Statement (doc ref. 19112.d1)
3.2.10 In order to determine the required visibility splays at the proposed access, an ATC Survey (which records vehicle speed as well as the volume of traffic) was undertaken along Bryneglwys Avenue in the vicinity of the proposed access. The ATC was undertaken on 17th
March 2029, and the results are summarised below:
20.7mph mph northbound – 27m SSD
19.3mph southbound – 25m SSD
3.2.11 The required visibility splay at the proposed access on to Birch Walk is shown in Appendix D, and it can be seen that the required visibility can be achieved at the access.
Pedestrians (PRoW)
3.2.12 The proposed access onto Birch Walk incorporates a 2.0m wide footway on both sides of the carriageway, which connect to the existing footway along the western edge of Birch Walk.
3.2.13 It should be noted that the existing footway terminates approximately __m north of the proposed access to the site, and it is therefore proposed to provide an informal crossing (with tactile paving and dropped kerbs) to allow pedestrians to cross to the footway on the eastern side of the carriageway (see Figure 3.2).
3.2.14 The proposed access onto Bryneglwys Avenue, which only serves four properties, has been designed as a shared surface. However, as part of the development it is proposed to provide a footway along the eastern edge of Bryneglwys Avenue (between the site access and the southern boundary of the property named Hafod). It is also proposed to provide an informal crossing (dropped kerbs and tactile paving) across Bryneglwys Avenue (see Figure 3.3).
3.2.15 Also, as part of the development, it is proposed to retain the existing boulevard of trees within the southern section of the site which are within the conservation area, and to provide a footpath/ cycleway through the woodland. This will provide a pedestrian and cycle link through the site between Birch Walk and Bryneglwys Avenue.
3.3 On-site car and cycle parking provision
3.3.1 As outlined above, it is proposed to provide a total of 180 car parking spaces on-site (as shown on Figure 3.1). Table 3.1 below sets out the car parking standards in accordance with the adopted Bridgend County Borough Council Parking Standards (March 2011).

January 2020 St John’s School, Newton, Porthcawl 17 Transport Statement (doc ref. 19112.d1)
Table 3.1 Car parking provision: Residential houses
Residential houses Parking standard
(Zone 4)
Maximumno. of parking
spaces required Provision (spaces)
Residential parking
12 no. 1-bed flat 1 space per bedroom (maximum
requirement 3 spaces)
12 12
39 no. 3-bed house 117 84
23 no. 4-bed house 69 69
Visitor parking
74 1 space per 5 units 15 151
Total 213 1801. Majority of spaces accommodated on street.
3.3.2 It can be seen from the table above that the proposed provision of 180 car parking spaces is within the maximum parking standards.
3.3.3 It is considered that the proposed level of parking is more than sufficient to accommodate the likely demand generated by the proposed development, as:
The proposed provision of parking is within the maximum parking standards;
The proposed development comprises 18% affordable units;
The site is in a reasonably sustainable location, and is within walking distance of a
range of local facilities and amenities;
The provision of 2.43 spaces per dwelling, is significantly greater than the average
car ownership rates:
for Bridgend County Borough Council of 1.22 cars per dwelling;
for Newton of 1.42 cars per dwelling; and,
The provision is in accordance with PPW10, which states that ‘Parking standards
should be applied flexibly and allow for the provision of lower levels of parking and
the creation of high quality places’.
3.3.4 In relation to visitor parking, it is anticipated that the majority of visitor parking spaces can be accommodated on street, throughout the development.
3.4 Cycle parking provision
3.4.1 In accordance with the adopted parking standards:
For the proposed apartments one cycle parking space is required for every five
bedrooms.
For residential houses cycle storage must be a factor of dwelling design.
3.4.2 It is therefore proposed to provide a communal, secure, covered cycle store with capacity for three bikes for the proposed flats. It is also anticipated that for the residential houses with a garage (27 no. of the dwellings) cycle parking can be accommodated within the garage. For the remaining 47 dwellings, it is anticipated that residents will be able to accommodate cycle parking within the rear gardens.

January 2020 St John’s School, Newton, Porthcawl 18 Transport Statement (doc ref. 19112.d1)
3.5 Deliveries and servicing
3.5.1 It is anticipated that for the residential dwellings accessed from Birch Walk residential refuse will be collected on-street, as part of an existing local authority collection. For the residential dwellings accessed from Bryneglwys Avenue, it is anticipated that the refuse will be collected as part of the existing local authority collection from Bryneglwys Avenue.
3.5.2 Furthermore, it is anticipated that all deliveries will be undertaken on-street within the development.
Swept-path analysis
3.5.3 A swept-path analysis (refer to Appendix A and Appendix C) has been undertaken of the range of vehicles likely to access the site including:
A medium sized car (based on a Volkswagen Touran);
A 3.5t panel van;
A 4.6t light van;
A 7.5t box van;
A 7.7m fire tender; and,
A large 11.2m refuse vehicle

January 2020 St John’s School, Newton, Porthcawl 19 Transport Statement (doc ref. 19112.d1)
4 Trip generation
4.1 Introduction
4.1.1 In order to assess the impact of the proposed development on the existing transport infrastructure, it is necessary to assess the number of person trips (by mode) generated by the proposals. This section of the Transport Statement, therefore, outlines the methodology used to predict person trip generation.
4.2 Trip generation
Open market dwellings
4.2.1 As outlined above, it is proposed to provide 61 private dwellings on site. The TRICS (v.7.6.1) trip generation database has been reviewed in order to predict the likely level of trips generated by the open market houses. Sites have been selected with the following parameters:
Land use: Residential; Houses privately owned;
Survey type: Multi-modal;
Survey days: Monday – Friday;
Number of dwellings selected: 7 to 805 (units);
Regions selected: Edge of town centre, Suburban area, Edge of town; and,
Locations: All, excluding Central London and Ireland (northern and the republic of
Ireland)
4.2.2 A total of 47 sites were selected, and therefore, 85th percentile trip rates have been obtained in order to provide a robust assessment. The daily arrival and departure profile for open market houses is set out in Appendix E and summarised in Table 4.1 below.

January 2020 St John’s School, Newton, Porthcawl 20 Transport Statement (doc ref. 19112.d1)
Table 4.1 Summary of person trip rates by mode: Private dwellings
Time period
Arrival trip rate
No. of arrivals
Depart trip rate
No. of departs
Total trip rate
Total movements
Total persons
8am–9am 0.225 14 1.2 73 1.425 87
5pm-6pm 0.972 59 0.299 18 1.271 78
7am-7pm 5.4 329 5.8 354 11.2 683
Pedestrians
8am–9am 0.118 7 0.333 20 0.451 28
5pm-6pm 0.167 10 0.167 10 0.334 20
7am-7pm 1.239 76 1.694 103 2.933 179
Cyclists
8am–9am 0.00 0 0.038 2 0.038 2
5pm-6pm 0.05 3 0 0 0.05 3
7am-7pm 0.143 9 0.143 9 0.286 17
Public transport users
8am–9am 0.00 0 0.05 3 0.05 3
5pm-6pm 0.02 1 0.02 1 0.04 2
7am-7pm 0.113 7 0.258 16 0.371 23
Vehicles
8am–9am 0.182 11 0.455 28 0.637 39
5pm-6pm 0.609 37 0.13 8 0.739 45
7am-7pm 2.917 178 3.083 188 6 366
4.2.3 It can be seen from the table above that the 61 privately owned houses could generate up to 366 vehicle movements (two-way) throughout the day, with up to 39 vehicle movements (two-way) in the AM peak and 45 in the PM peak period.
Affordable houses
4.2.4 As outlined above it is also proposed to provide a total of 13 affordable dwellings (mixture of house and flats). The TRICS (v.7.6.1) trip generation database has been reviewed in order to predict the likely level of trips generated by the affordable dwellings and sites have been selected with the following parameters:
Land use: Residential; Affordable/ Local authority houses;
Survey type: Multi-modal;
Survey days: Monday, Tuesday. Thursday;
Number of dwellings selected: 15 to 54 (units);
Regions selected: Edge of town centre, Suburban area, Edge of town; and,
Locations: All, excluding Central London and Ireland (northern and the republic of
Ireland)

January 2020 St John’s School, Newton, Porthcawl 21 Transport Statement (doc ref. 19112.d1)
4.2.5 A total of four sites were selected with the daily arrival and departure profile for these sites is set out in Appendix F and summarised in Table 4.2 below. It should be noted that average trip rates have been obtained as there are insufficient sites within the database to obtain 85th percentile trip rates.
4.2.6 However, it should also be noted that the following trip rates are based on affordable houses, not flats, which typically have a higher trip rate than flats.
Table 4.2 Summary of person trip rates by mode: Affordable dwellings
Time period
Arrival trip rate
No. of arrivals
Depart trip rate
No. of departs
Total trip rate
Total movements
Total persons
8am–9am 0.342 4 1.184 15 1.526 20
5pm-6pm 0.667 9 0.57 7 1.237 16
7am-7pm 5.52 72 6.201 81 11.721 152
Pedestrians
8am–9am 0.096 1 0.526 7 0.622 8
5pm-6pm 0.325 4 0.307 4 0.632 8
7am-7pm 2.315 30 2.727 35 5.042 66
Cyclists
8am–9am 0.009 0 0.026 0 0.035 0
5pm-6pm 0.009 0 0 0 0.009 0
7am-7pm 0.071 1 0.071 1 0.142 2
Public transport users
8am–9am 0 0 0.07 1 0.07 1
5pm-6pm 0.044 1 0 0 0.044 1
7am-7pm 0.168 2 0.159 2 0.327 4
Vehicles
8am–9am 0.175 2 0.351 5 0.526 7
5pm-6pm 0.211 3 0.175 2 0.386 5
7am-7pm 1.992 26 2.13 28 4.122 54
4.2.7 It can be seen from the table above that the 13 affordable dwellings could generate up to 54 vehicle movements (two-way) throughout the day, with up to seven vehicle movements (two-way) in the AM peak and five in the PM peak period.
4.3 Distribution of development generated traffic
4.3.1 As outlined above it is proposed to provide two accesses to the development, with one access via Birch Walk serving 70 residential units (95% of the development), and the other access via Bryneglwys Avenue serving four residential units (5% of the development).
4.3.2 Table 4.3 below outlines the likely number of person trips (by mode) generated at each access.

January 2020 St John’s School, Newton, Porthcawl 22 Transport Statement (doc ref. 19112.d1)
Table 4.3 Summary each site distribution
Time period
Birch Walk Church Street
No. ofarrivals
No. of departs
Total movements
No. of arrivals
No. of departs
Total movements
Total persons
8am–9am 17 84 101 1 5 6
5pm-6pm 64 24 89 4 1 5
7am-7pm 380 411 791 22 23 45
Pedestrians
8am–9am 8 26 34 0 1 2
5pm-6pm 14 14 27 1 1 1
7am-7pm 101 132 233 5 7 12
Cyclists
8am–9am 0 3 3 0 0 0
5pm-6pm 3 0 3 0 0 0
7am-7pm 9 9 18 1 1 1
Public transport users
8am–9am 0 4 4 0 0 0
5pm-6pm 2 1 3 0 0 0
7am-7pm 9 17 25 0 1 1
Vehicles
8am–9am 13 30 43 1 2 3
5pm-6pm 37 10 47 2 1 3
7am-7pm 192 203 396 12 12 24
4.3.3 It can be seen from the table above that it is likely the development will generate a total of 420 vehicle movements (two-way) throughout the day, with up to 46 vehicle movements (two-way) in the AM peak and 50 vehicle movements (two-way) in the PM peak period. Furthermore, it can also be seen from the table above that:
Vehicle trips represent 54% of daily total person trips; and,
Pedestrian trips represent 26%.
4.3.4 It can also be seen from the table that vehicle trips represent 50% of daily total person trips and pedestrian trips representing 29%.
4.4 Assignment of development generated traffic
4.4.1 The likely distribution of vehicles generated by the proposed development has been calculated using Journey to work data from the 2011 census. Table 4.4 below highlights the major population centre that residents of the proposed development are likely to travel to for work purposes.

January 2020 St John’s School, Newton, Porthcawl 23 Transport Statement (doc ref. 19112.d1)
Table 4.4 Likely locations of development generated traffic
Destination % of traffic
Bridgend 46
Porthcawl 23
Neath Port Talbot 10
Cardiff 9
Vale of Glamorgan 4
Other 9
4.4.2 It can be seen from the table above that 23% of the development generated traffic are likely to travel south towards Porthcawl town centre, with 77% of the traffic traveling north onto the A4106/Bridgend Road roundabout.
4.4.3 Table 4.5 presents the proposed routes that the development generated traffic is likely to take.
Table 4.5 Proposed routes for development generated traffic
Route Description % of traffic
A Bridgend Road - Aldenham Road 23
B Bridgend Road - Newton Nottage Road - Pyle Road 34
C Bridgend Road - A4106 - A48 44
4.4.4 The development generated traffic (refer to Appendix G) has therefore been distributed through the network based on the likely routes identified in Table 4.5.
4.5 Background traffic growth
4.5.1 The capacity analysis modelling of the highway network surrounding the application site considers the following scenarios:
2019 base;
2021 first occupation;
2025 full implementation;
2030 full implementation + 5 years; and,
2040 full implementation + 15 years.
4.6 Growth factors
4.6.1 In order to obtain the base traffic flows (i.e. with no development traffic) in 2021, 2025, 2030 and 2040, the surveyed flows (2019) have been factored using locally adjusted NTM growth factors. The factors to be applied to the base (surveyed) flows are identified in Table 4.6 below. These are based on the Bridgend 019 Middle Layer Super Output Area.

January 2020 St John’s School, Newton, Porthcawl 24 Transport Statement (doc ref. 19112.d1)
Table 4.6 NTM Growth Factors
4.6.2 It should be noted that the above growth factors take account of committed development within the local area, as the factors are based on the most recent planning data contained in the Local Plan.
4.6.3 The 2019, 2021, 2025, 2030 and 2040 base traffic flows are set out in Appendix H.
4.7 Final future traffic flows
4.7.1 The final future traffic flow have been determined by combining the base traffic flows with the development generated flows (as presented in Appendix I) as follows:
2021 final future flows;
2025 final future traffic flows;
2030 and 2040
Period NTM growth factors
2019 to 2021
Weekday AM 1.0232
Weekday PM 1.0255
2019 to 2025
Weekday AM 1.0458
Weekday PM 1.0556
2019 to 2030
Weekday AM 1.0797
Weekday PM 1.0915
2019 to 2040
Weekday AM 1.137
Weekday PM 1.155

January 2020 St John’s School, Newton, Porthcawl 25 Transport Statement (doc ref. 19112.d1)
5 Percentage impact analysis
5.1 Introduction
5.1.1 This section of the report considers the potential impact on the development proposals on the surrounding highway network and the capacity of the following junctions:
Junction 1: A4106/Bridgend Road roundabout; and,
Junction 2: Bridgend Road/Clevis Crescent priority junction;
5.1.2 A percentage impact analysis has been carried out at both junctions. The analysis has been undertaken for an AM peak period of 08:00-09:00 and a PM peak period of 17:00-18:00, based on the peak periods contained within the surveyed traffic flow data.
5.2 Percentage impact analysis
5.2.1 Table 5.1 below outlines the likely increases in traffic flows, as a result of the proposed development, at the A4106/ Bridgend Road roundabout junction, considering the impact the proposed development will have on the existing highway network
Table 5.1 Percentage Impact analysis- Junction 1 A4106/ Bridgend Road roundabout
Year
ARM ATyn Y-Caeau Lane
ARM BBridgend Road (east)
ARM CBridgend Road (south)
ARM DNewton Nottage Road
Base DevBase
+ Dev
% inc.
Base DevBase
+ Dev
% inc.
Base DevBase
+ Dev
% inc.
Base Dev Base
+ Dev
% inc.
2019 AM 13 1034 819 960
PM 10 1143 789 956
2021 AM 13 0 13 0.0 1058 20 1078 1.9 838 36 874 4.1 982 16 998 1.6
PM 10 0 10 0.0 1172 22 1194 1.8 809 39 848 4.6 980 17 997 1.7
2025 AM 14 0 14 0.0 1081 20 1101 1.8 857 36 892 4.0 1004 16 1020 1.5
PM 14 0 14 0.0 1207 22 1229 1.8 833 39 872 4.5 1009 17 1026 1.7
2030 AM 14 0 14 0.0 1116 20 1137 1.8 884 36 920 3.9 1037 16 1052 1.5
PM 11 0 11 0.0 1248 22 1270 1.7 861 39 900 4.3 1043 17 1061 1.6
2040 AM 15 0 15 0.0 1176 20 1196 1.7 931 36 967 3.7 1092 16 1107 1.4
PM 12 0 12 0.0 1320 22 1342 1.6 911 39 950 4.1 1104 17 1121 1.5
5.2.2 It can be seen from the table above that the proposed development will have a small impact at the A4106/ Bridgend Road junction, with a maximum increase in traffic of 4.6% on the Bridge Road (south) approach in the 2021 PM Peak.
5.2.3 Table 5.2 below outlines the likely increases in traffic flows, as a result of the proposed development, at the Bridgend Road/Clevis Crescent junction (Junction 2).

January 2020 St John’s School, Newton, Porthcawl 26 Transport Statement (doc ref. 19112.d1)
Table 5.2 Percentage Impact analysis- Junction 2 Bridgend Road/Clevis Crescent
Year
ARM ABridgend Road
ARM BClevis Crescent
ARM CAlderham Road
Base DevBase
+ Dev
% inc.
Base DevBase
+ Dev
% inc.
Base Dev Base
+ Dev
% inc.
2019 AM 569 202 387
PM 602 180 452
2021 AM 582 5 587 0.8 207 2 209 1.0 396 3 399 0.7
PM 617 15 632 2.3 185 2 187 1.1 464 9 472 1.8
2025 AM 595 5 600 0.8 211 2 213 0.9 405 3 408 0.7
PM 635 15 650 2.2 190 2 192 1.0 477 9 486 1.8
2030 AM 614 5 619 0.8 218 2 220 0.9 418 3 421 0.7
PM 657 15 672 2.2 196 2 198 1.0 493 9 502 1.7
2040 AM 647 5 652 0.8 230 2 232 0.9 440 3 443 0.7
PM 695 15 710 2.0 208 2 210 0.9 522 9 531 1.6
5.2.4 It can be seen from Table 5.2 that the proposed development will have a small impact at the A4106/ Bridgend Road junction, with a maximum increase in traffic of 2.3% on the Bridge Road (south) approach in the 2021 PM Peak.
5.3 Summary
5.3.1 It can be seen from the analysis above that the development will have a small impact on the local highway network, with a maximum increase of:
4.4% on the Bridgend Road (south) approach to Junction 1 in the 2021 PM peak;
2.2% of the Bridgend Road approach to Junction 2 in the 2021.
5.3.2 It should be noted that in the 2025, 2030 and 2040 scenarios, the percentage impact of the proposed development is reduced. In accordance with TAN 18, an increase in turning movements of over 5% would be considered as a material change, with a 5% increase of traffic using any link of the junction. It is therefore, considered that the proposed development will have a minimal impact on the operation of the highway network.

January 2020 St John’s School, Newton, Porthcawl 27 Transport Statement (doc ref. 19112.d1)
6 Summary and conclusions
6.1 Summary
6.1.1 Transport has been commissioned by Taylor Wimpey South Wales to produce a Transport Statement in support of a planning application for up to 74 dwellings on the former St John’s School, Newton, Porthcawl.
6.2 Development proposals
6.2.1 As part of the re-development of the site, it is proposed to provide 74 dwellings with:
61 open market houses:
39 no. 3-bedroom houses
22 no. 4-bedroom houses
13 affordable dwellings:
12no. 1-bedroom flats
One x 4-bedroom house
Together with 180 resident and visitor car parking spaces
Access
6.2.2 As part of the development it is proposed to provide two access to the site:
One access via Birch Walk to the east of the site to serve 70 dwellings; and
A second access route via Bryneglwys Avenue to the west of the site to serve four
large dwellings.
6.2.3 It is anticipated that pedestrians will be able to access the site via both vehicle accesses. In addition, it is proposed to provide a pedestrian/ cycle link through the site, to link the access via Birch Walk with Bryneglwys Avenue.
6.2.4 Swept path analysis have been carried out which show that a range of vehicles likely to access the site can successfully access the development and manoeuvre throughout the site.
6.2.5 As part of the re-development of the site, it is proposed to provide a total of 180 car parking spaces (with a mix of on-plot parking spaces and garages, and on and off-street parking spaces). It is also proposed to provide cycle parking provision in accordance with Bridgend County Borough Council Parking Standards.

January 2020 St John’s School, Newton, Porthcawl 28 Transport Statement (doc ref. 19112.d1)
Travel characteristics
6.2.6 It is anticipated that the development will generate a total of 420 vehicle movements (two-way) with:
A total of 396 vehicle movements (two-way) throughout the day onto Birch Walk,
192 vehicle movements (two-way) in the AM peak, 203 vehicle movements (two-
way) in the PM peak period; and,
24 vehicle movements (two-way) throughout the day onto Bryneglwys Avenue, with
three vehicle movements (two-way) in the AM peak and three vehicle movements
(two-way) in the PM peak period.
Likely impact
6.2.7 It can be seen from the percentage impact analysis that the development will have a small impact on the local highway network, with a maximum increase of:
4.6% on the Bridgend Road (south) approach to Junction 1 in the 2021 PM peak;
2.2% on the Bridgend Road approach to Junction 2 in the 2021.
6.2.8 It should be noted that in the 2025, 2030 and 2040 scenarios, the percentage impact of the proposed development is reduced.
6.2.9 In accordance with TAN 18, an increase in turning movements of over 5% would be considered as a material change, with a 5% increase of traffic using any link of the junction. It is therefore, considered that the proposed development will have a minimal impact on the operation of the highway network.
6.3 Conclusions
6.3.1 Based on the likely impact of the proposed development, it is considered that the proposed development will have a minimal impact on the operation of the local highway network.

Appendices

Appendix A

28 - 33
34 - 39
Bin
Sto
re1BF
1BF
Bin S
tore
28 - 33
34 - 39
Bin
Sto
re
1BF
1BF
Bin S
tore
Figure
Drawing No
Project No
Checked
Drawn
Scale
DateDrawing Status
Project
Title
Rev Date Drawn CheckDescription
THIS DRAWING MUST BE READ IN CONJUNCTION WITH ALL OTHER RELEVANT DRAWINGS. DO NOT SCALE FROM THIS DRAWING.
Revision
Penarth, CF64 2AA
Tel 029 2070 0924
www.limetransport.com
5A Andrews Buildings
GENERAL NOTES
1. This drawing to be read in conjunction with all relevant civilengineering drawings.
LEGENDN
ABR
HIS
1:100 @ A1
22/01/2020
Newton, Porthcawl
into parking space
Volkswagen Touran manoeuvring
Swept path analysis;
Newton, Porthcawl
St John's School;
PRELIMINARY
19112
Vehicle bodyEnvelope (forward)
Vehicle bodyEnvelope (reverse)
Vehicle Chassis, shown atstart & end of path andchange of direction(forward).
Vehicle Chassis, shown atstart & end of path andchange of direction(reverse).
Vehicle wheelswept path
Vehicle wheelswept path
4.527 0.007
0.978 2.646
Volkswagen TouranOverall Length 4.534mOverall Width 1.829mOverall Body Height 1.491mMin Body Ground Clearance 0.253mMax Track Width 1.734mLock to Lock Time 4.00sKerb to Kerb Turning Radius 5.042m

34 - 39
Bin
Sto
re
1BF
Bin S
tore
Figure
Drawing No
Project No
Checked
Drawn
Scale
DateDrawing Status
Project
Title
Rev Date Drawn CheckDescription
THIS DRAWING MUST BE READ IN CONJUNCTION WITH ALL OTHER RELEVANT DRAWINGS. DO NOT SCALE FROM THIS DRAWING.
Revision
Penarth, CF64 2AA
Tel 029 2070 0924
www.limetransport.com
5A Andrews Buildings
GENERAL NOTES
1. This drawing to be read in conjunction with all relevant civilengineering drawings.
LEGENDN
ABR
HIS
1:50 @ A1
22/01/2020
Newton, Porthcawl
manoeuvring past another Touran
Volkswagen Touran
Swept path analysis;
Newton, Porthcawl
St John's School;
PRELIMINARY
19112
Vehicle bodyEnvelope (forward)
Vehicle bodyEnvelope (reverse)
Vehicle Chassis, shown atstart & end of path andchange of direction(forward).
Vehicle Chassis, shown atstart & end of path andchange of direction(reverse).
Vehicle wheelswept path
Vehicle wheelswept path
4.527 0.007
0.978 2.646
Volkswagen TouranOverall Length 4.534mOverall Width 1.829mOverall Body Height 1.491mMin Body Ground Clearance 0.253mMax Track Width 1.734mLock to Lock Time 4.00sKerb to Kerb Turning Radius 5.042m

28 - 33
34 - 39
Bin
Sto
re1BF
1BF
Bin S
tore
28 - 33
34 - 39
Bin
Sto
re
1BF
1BF
Bin S
tore
Figure
Drawing No
Project No
Checked
Drawn
Scale
DateDrawing Status
Project
Title
Rev Date Drawn CheckDescription
THIS DRAWING MUST BE READ IN CONJUNCTION WITH ALL OTHER RELEVANT DRAWINGS. DO NOT SCALE FROM THIS DRAWING.
Revision
Penarth, CF64 2AA
Tel 029 2070 0924
www.limetransport.com
5A Andrews Buildings
GENERAL NOTES
1. This drawing to be read in conjunction with all relevant civilengineering drawings.
LEGENDN
ABR
HIS
1:100 @ A1
22/01/2020
Newton, Porthcawl
into parking space
Volkswagen Touran manoeuvring
Swept path analysis;
Newton, Porthcawl
St John's School;
PRELIMINARY
19112
Vehicle bodyEnvelope (forward)
Vehicle bodyEnvelope (reverse)
Vehicle Chassis, shown atstart & end of path andchange of direction(forward).
Vehicle Chassis, shown atstart & end of path andchange of direction(reverse).
Vehicle wheelswept path
Vehicle wheelswept path
4.527 0.007
0.978 2.646
Volkswagen TouranOverall Length 4.534mOverall Width 1.829mOverall Body Height 1.491mMin Body Ground Clearance 0.253mMax Track Width 1.734mLock to Lock Time 4.00sKerb to Kerb Turning Radius 5.042m

2
5
63
33
5
7
8BCP
2
5
63
33
5
7
8BCP
Figure
Drawing No
Project No
Checked
Drawn
Scale
DateDrawing Status
Project
Title
Rev Date Drawn CheckDescription
THIS DRAWING MUST BE READ IN CONJUNCTION WITH ALL OTHER RELEVANT DRAWINGS. DO NOT SCALE FROM THIS DRAWING.
Revision
Penarth, CF64 2AA
Tel 029 2070 0924
www.limetransport.com
5A Andrews Buildings
GENERAL NOTES
1. This drawing to be read in conjunction with all relevant civilengineering drawings.
LEGENDN
ABR
HIS
1:100 @ A1
22/01/2020
Newton, Porthcawl
into parking space
Volkswagen Touran manoeuvring
Swept path analysis;
Newton, Porthcawl
St John's School;
PRELIMINARY
19112
Vehicle bodyEnvelope (forward)
Vehicle bodyEnvelope (reverse)
Vehicle Chassis, shown atstart & end of path andchange of direction(forward).
Vehicle Chassis, shown atstart & end of path andchange of direction(reverse).
Vehicle wheelswept path
Vehicle wheelswept path
4.527 0.007
0.978 2.646
Volkswagen TouranOverall Length 4.534mOverall Width 1.829mOverall Body Height 1.491mMin Body Ground Clearance 0.253mMax Track Width 1.734mLock to Lock Time 4.00sKerb to Kerb Turning Radius 5.042m

GOSFORD(PA34)
26
27
28 - 33
34 - 39
2727
Bin
Sto
re
1BF
1BF
BinSto
re
Revision
Drawing No
Project No
Checked
Drawn
Scale
DateDrawing Status
Project
Title
Rev Date Drawn CheckDescription
THIS DRAWING MUST BE READ IN CONJUNCTION WITH ALL OTHER RELEVANT DRAWINGS. DO NOT SCALE FROM THIS DRAWING.
Client Project No
Penarth, CF64 2AA
Tel 029 2070 0924
www.limetransport.com
5A Andrews Buildings
GENERAL NOTES
1. This drawing to be read in conjunction with all relevant civilengineering drawings.
LEGEND
N
19112
PRELIMINARY
St John's School, Newton,
Porthcawl
Potential amendments to parking
layout at the north-east corner of
the site
NOT FOR CONSTRUCTION
22.01.2020
1:100@A1
HS
ABR

5
6
EXISTING BANK
3
5 5
7
7
7
6
6
11
12
13
14
11
SH
AR
ED
SU
RF
AC
E
5
6
EXISTING BANK
3
5 5
7
7
7
6
6
11
12
13
14
11
SH
AR
ED
SU
RF
AC
E
Figure
Drawing No
Project No
Checked
Drawn
Scale
DateDrawing Status
Project
Title
Rev Date Drawn CheckDescription
THIS DRAWING MUST BE READ IN CONJUNCTION WITH ALL OTHER RELEVANT DRAWINGS. DO NOT SCALE FROM THIS DRAWING.
Revision
Penarth, CF64 2AA
Tel 029 2070 0924
www.limetransport.com
5A Andrews Buildings
GENERAL NOTES
1. This drawing to be read in conjunction with all relevant civilengineering drawings.
LEGENDN
ABR
HIS
1:100 @A1
22/01/2020
NOT FOR CONSTRUCTION
manoeuvring at turning head
Dennis Sabre Fire Tender
Swept path analysis;
Newton, Porthcawl
St John's School;
PRELIMINARY
19112
Vehicle bodyEnvelope (forward)
Vehicle bodyEnvelope (reverse)
Vehicle Chassis, shown atstart & end of path andchange of direction(forward).
Vehicle Chassis, shown atstart & end of path andchange of direction(reverse).
Vehicle wheelswept path
Vehicle wheelswept path
7.7
1.382 4.2
Dennis Sabre Fire Tender (LWB)Overall Length 7.700mOverall Width 2.430mOverall Body Height 3.512mMin Body Ground Clearance 0.397mTrack Width 2.380mLock to Lock Time 5.00sKerb to Kerb Turning Radius 7.400m

EA
SE
DA
LE
PT
36 6365
66
66
67
68
69
70
71
71
72
BC
P
72
67
67
SHARED SURFACE
COLTFORD (NA 34)
COLTFORD (NA 34)
EA
SE
DA
LE
PT
36
66
66
68
69
6970
70
71
71
72
73
BC
P
72
72
67
67
SHARED SURFACE
COLTFORD (NA 34)
COLTFORD (NA 34)
Figure
Drawing No
Project No
Checked
Drawn
Scale
DateDrawing Status
Project
Title
Rev Date Drawn CheckDescription
THIS DRAWING MUST BE READ IN CONJUNCTION WITH ALL OTHER RELEVANT DRAWINGS. DO NOT SCALE FROM THIS DRAWING.
Revision
Penarth, CF64 2AA
Tel 029 2070 0924
www.limetransport.com
5A Andrews Buildings
GENERAL NOTES
1. This drawing to be read in conjunction with all relevant civilengineering drawings.
LEGENDN
ABR
HIS
1:100 @ A1
22/01/2020
NOT FOR CONSTRUCTION
manoeuvring at turning head
Dennis Sabre Fire Tender
Swept path analysis;
Newton, Porthcaw;
St John's School;
PRELIMINARY
19112
Vehicle bodyEnvelope (forward)
Vehicle bodyEnvelope (reverse)
Vehicle Chassis, shown atstart & end of path andchange of direction(forward).
Vehicle Chassis, shown atstart & end of path andchange of direction(reverse).
Vehicle wheelswept path
Vehicle wheelswept path
7.7
1.382 4.2
Dennis Sabre Fire Tender (LWB)Overall Length 7.700mOverall Width 2.430mOverall Body Height 3.512mMin Body Ground Clearance 0.397mTrack Width 2.380mLock to Lock Time 5.00sKerb to Kerb Turning Radius 7.400m

MID
FO
RD
(PA
44)
HIGHWAYS R/
MID
FO
RD
(PA
44)
MID
FO
RD
(PA
44)
4849
5354
54
HIGHWAYS R/GSHARED SURFACE
HIGHWAYS R/G
MID
FO
RD
(PA
44)
MID
FO
RD
(PA
44)
4849
5354
HIGHWAYS R/GSHARED SURFACE
Figure
Drawing No
Project No
Checked
Drawn
Scale
DateDrawing Status
Project
Title
Rev Date Drawn CheckDescription
THIS DRAWING MUST BE READ IN CONJUNCTION WITH ALL OTHER RELEVANT DRAWINGS. DO NOT SCALE FROM THIS DRAWING.
Revision
Penarth, CF64 2AA
Tel 029 2070 0924
www.limetransport.com
5A Andrews Buildings
GENERAL NOTES
1. This drawing to be read in conjunction with all relevant civilengineering drawings.
LEGENDN
ABR
HIS
1:100 @ A1
22/01/2020
NOT FOR CONSTRUCTION
manoeuvring at turning head
Dennis Sabre Fire Tender
Swept path analysis;
Newton, Porthcawl
St John's School;
PRELIMINARY
19112
Vehicle bodyEnvelope (forward)
Vehicle bodyEnvelope (reverse)
Vehicle Chassis, shown atstart & end of path andchange of direction(forward).
Vehicle Chassis, shown atstart & end of path andchange of direction(reverse).
Vehicle wheelswept path
Vehicle wheelswept path
7.7
1.382 4.2
Dennis Sabre Fire Tender (LWB)Overall Length 7.700mOverall Width 2.430mOverall Body Height 3.512mMin Body Ground Clearance 0.397mTrack Width 2.380mLock to Lock Time 5.00sKerb to Kerb Turning Radius 7.400m

5
6
EXISTING BANK
5 5
7 7
6
6
11
12
13
11
SH
AR
ED
SU
RF
A
5
6
EXISTING BANK
5 5
7 7
6
6
11
12
13
11
SH
AR
ED
SU
RF
A
Figure
Drawing No
Project No
Checked
Drawn
Scale
DateDrawing Status
Project
Title
Rev Date Drawn CheckDescription
THIS DRAWING MUST BE READ IN CONJUNCTION WITH ALL OTHER RELEVANT DRAWINGS. DO NOT SCALE FROM THIS DRAWING.
Revision
Penarth, CF64 2AA
Tel 029 2070 0924
www.limetransport.com
5A Andrews Buildings
GENERAL NOTES
1. This drawing to be read in conjunction with all relevant civilengineering drawings.
LEGENDN
ABR
HIS
1:100 @ A1
22/01/2020
Newton, Porthcawl
manoeuvring at turning head
Refuse vehicle
Swept path analysis;
Newton, Porthcawl
St John's School;
PRELIMINARY
19112
Vehicle bodyEnvelope (forward)
Vehicle bodyEnvelope (reverse)
Vehicle Chassis, shown atstart & end of path andchange of direction(forward).
Vehicle Chassis, shown atstart & end of path andchange of direction(reverse).
Vehicle wheelswept path
Vehicle wheelswept path
10.52
1.665 4.215 1.385
Phoenix 2-23W (with Elite 2 6x4 chassis)Overall Length 10.520mOverall Width 2.530mOverall Body Height 3.211mMin Body Ground Clearance 0.416mTrack Width 2.530mLock to Lock Time 4.00sKerb to Kerb Turning Radius 9.950m

EA
SE
DA
LE
PT
36
6
66
68
69
70
70
71
71
72
73
BC
P
72
72
67
67
SHARED SURFACE
COLTFORD (NA 34)
COLTFORD (NA 34)
74
EA
SE
DA
LE
PT
36
66
68
69
70
70
71
71
72
73
74B
CP
72
72
7
67
SHARED SURFACE
COLTFORD (NA 34)
COLTFORD (NA 34)
73
74
Figure
Drawing No
Project No
Checked
Drawn
Scale
DateDrawing Status
Project
Title
Rev Date Drawn CheckDescription
THIS DRAWING MUST BE READ IN CONJUNCTION WITH ALL OTHER RELEVANT DRAWINGS. DO NOT SCALE FROM THIS DRAWING.
Revision
Penarth, CF64 2AA
Tel 029 2070 0924
www.limetransport.com
5A Andrews Buildings
GENERAL NOTES
1. This drawing to be read in conjunction with all relevant civilengineering drawings.
LEGENDN
ABR
HIS
1:100 @ A1
22/01/2020
Newton, Porthcawl
at turning head
Refuse vehicle manoeuvring
Swept path analysis;
Newton, Porthcawl
St John's School;
PRELIMINARY
19112
Vehicle bodyEnvelope (forward)
Vehicle bodyEnvelope (reverse)
Vehicle Chassis, shown atstart & end of path andchange of direction(forward).
Vehicle Chassis, shown atstart & end of path andchange of direction(reverse).
Vehicle wheelswept path
Vehicle wheelswept path
10.52
1.665 4.215 1.385
Phoenix 2-23W (with Elite 2 6x4 chassis)Overall Length 10.520mOverall Width 2.530mOverall Body Height 3.211mMin Body Ground Clearance 0.416mTrack Width 2.530mLock to Lock Time 4.00sKerb to Kerb Turning Radius 9.950m

MID
FO
RD
(PA
44)
HIGHWAYS R/G
CO
LT
FO
RD
(NA
34)
MID
FO
RD
(PA
44)
MID
FO
RD
(PA
44)
50
53
53
54
5452
51
HIGHWAYS R/GSHARED SURFACE
MID
FO
RD
(PA
44)
HIGHWAYS R/G
CO
LT
FO
RD
(NA
34)
MID
FO
RD
(PA
44)
MID
FO
RD
(PA
44)
4849
53
53
54
5452
51
HIGHWAYS R/GSHARED SURFACE
Figure
Drawing No
Project No
Checked
Drawn
Scale
DateDrawing Status
Project
Title
Rev Date Drawn CheckDescription
THIS DRAWING MUST BE READ IN CONJUNCTION WITH ALL OTHER RELEVANT DRAWINGS. DO NOT SCALE FROM THIS DRAWING.
Revision
Penarth, CF64 2AA
Tel 029 2070 0924
www.limetransport.com
5A Andrews Buildings
GENERAL NOTES
1. This drawing to be read in conjunction with all relevant civilengineering drawings.
LEGENDN
ABR
HIS
1:100 @ A1
22/01/2020
Newton, Porthcawl
at turning head
refuse vehicle manoeuvring
Swept path analysis;
Newton, Porthcawl
St John's School;
PRELIMINARY
19112
Vehicle bodyEnvelope (forward)
Vehicle bodyEnvelope (reverse)
Vehicle Chassis, shown atstart & end of path andchange of direction(forward).
Vehicle Chassis, shown atstart & end of path andchange of direction(reverse).
Vehicle wheelswept path
Vehicle wheelswept path
10.52
1.665 4.215 1.385
Phoenix 2-23W (with Elite 2 6x4 chassis)Overall Length 10.520mOverall Width 2.530mOverall Body Height 3.211mMin Body Ground Clearance 0.416mTrack Width 2.530mLock to Lock Time 4.00sKerb to Kerb Turning Radius 9.950m

EASEDALE PT36
74
21
SW
AL
ES
EA
SE
DA
LE
PT
36
GO
SF
OR
D (P
A 3
4)
GO
SF
OR
D (P
A 3
4)
GO
SF
OR
D (P
A 3
4)
GO
SF
OR
D (P
A 3
4)
GOSFORD (PA 34)
GOSFORD (PA 34)
MIDFORD (PA 44)
19
1919
20 20
20
2222
22
23
2121
23
55
56
59
59
59
60
61
62
63
60
60
61
61
62
62
63
6364
71
71
72
72
72
73
7474
7373
Bir
ch W
alk
EASEDALE PT36
74
21
SW
AL
ES
EA
SE
DA
LE
PT
36
GO
SF
OR
D (P
A 3
4)
GO
SF
OR
D (P
A 3
4)
GO
SF
OR
D (P
A 3
4)
GO
SF
OR
D (P
A 3
4)
GOSFORD (PA 34)
GOSFORD (PA 34)
MIDFORD (PA 44)
19
1919
20 20
20
2222
22
23
2121
2323
55
56
59
59
59
60
61
62
6360
60
61
61
62
62
63
63
64
64
71
71
72
72
73
7474
7373
Bir
ch W
alk
Revision
Drawing No
Project No
Checked
Drawn
Scale
DateDrawing Status
Project
Title
Rev Date Drawn CheckDescription
THIS DRAWING MUST BE READ IN CONJUNCTION WITH ALL OTHER RELEVANT DRAWINGS. DO NOT SCALE FROM THIS DRAWING.
Client Project No
Penarth, CF64 2AA
Tel 029 2070 0924
www.limetransport.com
5A Andrews Buildings
GENERAL NOTES
1. This drawing to be read in conjunction with all relevant civilengineering drawings.
LEGENDN
19112
PRELIMINARY
St John's School, Newton,
Porthcawl
Swept-path analysis:
access on to Birch Walk
- 7.5 tonne box van
NOT FOR CONSTRUCTION
29.01.2020
1:200@A1
ECC
ABR

EASEDALE PT36
74
21
SW
AL
ES
EA
SE
DA
LE
PT
36
GO
SF
OR
D (P
A 3
4)
GO
SF
OR
D (P
A 3
4)
GO
SF
OR
D (P
A 3
4)
GO
SF
OR
D (P
A 3
4)
GOSFORD (PA 34)
GOSFORD (PA 34)
MIDFORD (PA 44)
19
1919
20 20
20
2222
22
23
2121
23
55
56
59
59
59
60
61
62
63
60
60
61
61
62
62
63
6364
71
71
72
72
72
73
7474
7373
Bir
ch W
alk
EASEDALE PT36
74
21
SW
AL
ES
EA
SE
DA
LE
PT
36
GO
SF
OR
D (P
A 3
4)
GO
SF
OR
D (P
A 3
4)
GO
SF
OR
D (P
A 3
4)
GO
SF
OR
D (P
A 3
4)
GOSFORD (PA 34)
GOSFORD (PA 34)
MIDFORD (PA 44)
19
1919
20 20
20
2222
22
23
2121
2323
55
56
59
59
59
60
61
62
6360
60
61
61
62
62
63
63
64
64
71
71
72
72
73
7474
7373
Bir
ch W
alk
Revision
Drawing No
Project No
Checked
Drawn
Scale
DateDrawing Status
Project
Title
Rev Date Drawn CheckDescription
THIS DRAWING MUST BE READ IN CONJUNCTION WITH ALL OTHER RELEVANT DRAWINGS. DO NOT SCALE FROM THIS DRAWING.
Client Project No
Penarth, CF64 2AA
Tel 029 2070 0924
www.limetransport.com
5A Andrews Buildings
GENERAL NOTES
1. This drawing to be read in conjunction with all relevant civilengineering drawings.
LEGENDN
19112
PRELIMINARY
St John's School, Newton,
Porthcawl
Swept-path analysis:
access on to Birch Walk
- 7.5 tonne box van
NOT FOR CONSTRUCTION
29.01.2020
1:200@A1
ECC
ABR

EASEDALE PT36
74
21
SW
AL
ES
EA
SE
DA
LE
PT
36
GO
SF
OR
D (P
A 3
4)
GO
SF
OR
D (P
A 3
4)
GO
SF
OR
D (P
A 3
4)
GO
SF
OR
D (P
A 3
4)
GOSFORD (PA 34)
GOSFORD (PA 34)
MIDFORD (PA 44)
1818
19
1919
20 20
20
2222
22
2121
59
60
61
62
6360
60
61
61
62
62
63
63
64
64
71
71
71
72
72
72
73
7474
7373
Bir
ch W
alk
EASEDALE PT36
74
21
SW
AL
ES
EA
SE
DA
LE
PT
36
GO
SF
OR
D (P
A 3
4)
GO
SF
OR
D (P
A 3
4)
GO
SF
OR
D (P
A 3
4)
GO
SF
OR
D (P
A 3
4)
GOSFORD (PA 34)
GOSFORD (PA 34)
MIDFORD (PA 44)
19
1919
20 20
20
2222
22
23
2121
2323
55
56
59
59
59
60
61
62
63
60
60
61
61
62
62
63
63
64
64
71
71
72
72
73
7474
7373
Bir
ch W
alk
Revision
Drawing No
Project No
Checked
Drawn
Scale
DateDrawing Status
Project
Title
Rev Date Drawn CheckDescription
THIS DRAWING MUST BE READ IN CONJUNCTION WITH ALL OTHER RELEVANT DRAWINGS. DO NOT SCALE FROM THIS DRAWING.
Client Project No
Penarth, CF64 2AA
Tel 029 2070 0924
www.limetransport.com
5A Andrews Buildings
GENERAL NOTES
1. This drawing to be read in conjunction with all relevant civilengineering drawings.
LEGENDN
19112
PRELIMINARY
St John's School, Newton,
Porthcawl
Swept-path analysis:
access on to Birch Walk - 3.5 tonne panel van
NOT FOR CONSTRUCTION
29.1.2020
1:200@A1
ECC
ABR
Vehicle bodyEnvelope (forward)
Vehicle bodyEnvelope (reverse)
Vehicle Chassis, shown atstart & end of path andchange of direction(forward).
Vehicle Chassis, shown atstart & end of path andchange of direction(reverse).
Vehicle wheelswept path
Vehicle wheelswept path
5.339
1.011 3.3
3.5t Panel VanOverall Length 5.339mOverall Width 1.986mOverall Body Height 2.565mMin Body Ground Clearance 0.338mTrack Width 1.986mLock to Lock Time 4.00sKerb to Kerb Turning Radius 6.400m

EASEDALE PT36
74
21
SW
AL
ES
EA
SE
DA
LE
PT
36
GO
SF
OR
D (P
A 3
4)
GO
SF
OR
D (P
A 3
4)
GO
SF
OR
D (P
A 3
4)
GO
SF
OR
D (P
A 3
4)
GOSFORD (PA 34)
GOSFORD (PA 34)
MIDFORD (PA 44)
1818
19
1919
20 20
20
2222
22
2121
59
60
61
62
6360
60
61
61
62
62
63
63
64
64
71
71
71
72
72
72
73
7474
7373
Bir
ch W
alk
EASEDALE PT36
74
21
SW
AL
ES
EA
SE
DA
LE
PT
36
GO
SF
OR
D (P
A 3
4)
GO
SF
OR
D (P
A 3
4)
GO
SF
OR
D (P
A 3
4)
GO
SF
OR
D (P
A 3
4)
GOSFORD (PA 34)
GOSFORD (PA 34)
MIDFORD (PA 44)
19
1919
20 20
20
2222
22
23
2121
2323
55
56
59
59
59
60
61
62
63
60
60
61
61
62
62
63
63
64
64
71
71
72
72
73
7474
7373
Bir
ch W
alk
Revision
Drawing No
Project No
Checked
Drawn
Scale
DateDrawing Status
Project
Title
Rev Date Drawn CheckDescription
THIS DRAWING MUST BE READ IN CONJUNCTION WITH ALL OTHER RELEVANT DRAWINGS. DO NOT SCALE FROM THIS DRAWING.
Client Project No
Penarth, CF64 2AA
Tel 029 2070 0924
www.limetransport.com
5A Andrews Buildings
GENERAL NOTES
1. This drawing to be read in conjunction with all relevant civilengineering drawings.
LEGENDN
19112
PRELIMINARY
St John's School, Newton,
Porthcawl
Swept-path analysis:access on to Birch Walk - 3.5 tonne panel van
NOT FOR CONSTRUCTION
29.1.2020
1:200@A1
ECC
ABR
Vehicle bodyEnvelope (forward)
Vehicle bodyEnvelope (reverse)
Vehicle Chassis, shown atstart & end of path andchange of direction(forward).
Vehicle Chassis, shown atstart & end of path andchange of direction(reverse).
Vehicle wheelswept path
Vehicle wheelswept path
5.339
1.011 3.3
3.5t Panel VanOverall Length 5.339mOverall Width 1.986mOverall Body Height 2.565mMin Body Ground Clearance 0.338mTrack Width 1.986mLock to Lock Time 4.00sKerb to Kerb Turning Radius 6.400m

EASEDALE PT36
74
21
SW
AL
ES
EA
SE
DA
LE
PT
36
GO
SF
OR
D (P
A 3
4)
GO
SF
OR
D (P
A 3
4)
GO
SF
OR
D (P
A 3
4)
GO
SF
OR
D (P
A 3
4)
GOSFORD (PA 34)
GOSFORD (PA 34)
MIDFORD (PA 44)
19
1919
20 20
20
2222
22
23
2121
2323
55
56
59
59
59
60
61
62
63
60
60
61
61
62
62
63
63
64
64
71
71
72
72
73
7474
7373
Bir
ch W
alk
EASEDALE PT36
74
21
SW
AL
ES
EA
SE
DA
LE
PT
36
GO
SF
OR
D (P
A 3
4)
GO
SF
OR
D (P
A 3
4)
GO
SF
OR
D (P
A 3
4)
GO
SF
OR
D (P
A 3
4)
GOSFORD (PA 34)
GOSFORD (PA 34)
MIDFORD (PA 44)
19
1919
20 20
20
2222
22
23
2121
2323
55
56
59
59
59
60
61
62
6360
60
61
61
62
62
63
63
64
64
71
71
72
72
73
7474
7373
Bir
ch W
alk
Revision
Drawing No
Project No
Checked
Drawn
Scale
DateDrawing Status
Project
Title
Rev Date Drawn CheckDescription
THIS DRAWING MUST BE READ IN CONJUNCTION WITH ALL OTHER RELEVANT DRAWINGS. DO NOT SCALE FROM THIS DRAWING.
Client Project No
Penarth, CF64 2AA
Tel 029 2070 0924
www.limetransport.com
5A Andrews Buildings
GENERAL NOTES
1. This drawing to be read in conjunction with all relevant civilengineering drawings.
LEGENDN
19112
PRELIMINARY
St John's School, Newton,
Porthcawl
Swept-path analysis:
access on to Birch Walk
- 4.6 tonne light van
NOT FOR CONSTRUCTION
29.01.2020
1:200@A1
ECC
ABR
Vehicle bodyEnvelope (forward)
Vehicle bodyEnvelope (reverse)
Vehicle Chassis, shown atstart & end of path andchange of direction(forward).
Vehicle Chassis, shown atstart & end of path andchange of direction(reverse).
Vehicle wheelswept path
Vehicle wheelswept path
5.885
0.72 3.7
4.6t Light VanOverall Length 5.885mOverall Width 2.000mOverall Body Height 2.526mMin Body Ground Clearance 0.299mTrack Width 1.765mLock to Lock Time 4.00sKerb to Kerb Turning Radius 6.000m

EASEDALE PT36
74
21
SW
AL
ES
EA
SE
DA
LE
PT
36
GO
SF
OR
D (P
A 3
4)
GO
SF
OR
D (P
A 3
4)
GO
SF
OR
D (P
A 3
4)
GO
SF
OR
D (P
A 3
4)
GOSFORD (PA 34)
GOSFORD (PA 34)
MIDFORD (PA 44)
19
1919
20 20
20
2222
22
23
2121
2323
55
56
59
59
59
60
61
62
63
60
60
61
61
62
62
63
63
64
64
71
71
72
72
73
7474
7373
Bir
ch W
alk
EASEDALE PT36
74
21
SW
AL
ES
EA
SE
DA
LE
PT
36
GO
SF
OR
D (P
A 3
4)
GO
SF
OR
D (P
A 3
4)
GO
SF
OR
D (P
A 3
4)
GO
SF
OR
D (P
A 3
4)
GOSFORD (PA 34)
GOSFORD (PA 34)
MIDFORD (PA 44)
19
1919
20 20
20
2222
22
23
2121
2323
55
56
59
59
59
60
61
62
6360
60
61
61
62
62
63
63
64
64
71
71
72
72
73
7474
7373
Bir
ch W
alk
Revision
Drawing No
Project No
Checked
Drawn
Scale
DateDrawing Status
Project
Title
Rev Date Drawn CheckDescription
THIS DRAWING MUST BE READ IN CONJUNCTION WITH ALL OTHER RELEVANT DRAWINGS. DO NOT SCALE FROM THIS DRAWING.
Client Project No
Penarth, CF64 2AA
Tel 029 2070 0924
www.limetransport.com
5A Andrews Buildings
GENERAL NOTES
1. This drawing to be read in conjunction with all relevant civilengineering drawings.
LEGENDN
19112
PRELIMINARY
St John's School, Newton,
Porthcawl
Swept-path analysis:
access on to Brich Walk
- large 10.52m refuse vehicle
NOT FOR CONSTRUCTION
29.01.2020
1:200@A1
ECC
ABR
10.52
1.665 4.332 1.318
Phoenix 2-23W (with Elite 2 6x2 RS chassis)Overall Length 10.520mOverall Width 2.530mOverall Body Height 3.211mMin Body Ground Clearance 0.416mTrack Width 2.530mLock to Lock Time 4.00sKerb to Kerb Turning Radius 7.500m
Vehicle bodyEnvelope (forward)
Vehicle bodyEnvelope (reverse)
Vehicle Chassis, shown atstart & end of path andchange of direction(forward).
Vehicle Chassis, shown atstart & end of path andchange of direction(reverse).
Vehicle wheelswept path
Vehicle wheelswept path

EASEDALE PT36
74
21
SW
AL
ES
EA
SE
DA
LE
PT
36
GO
SF
OR
D (P
A 3
4)
GO
SF
OR
D (P
A 3
4)
GO
SF
OR
D (P
A 3
4)
GO
SF
OR
D (P
A 3
4)
GOSFORD (PA 34)
GOSFORD (PA 34)
MIDFORD (PA 44)
19
1919
20 20
20
2222
22
23
2121
2323
55
56
59
59
59
60
61
62
63
60
60
61
61
62
62
63
63
64
64
71
71
72
72
73
7474
7373
Bir
ch W
alk
EASEDALE PT36
74
21
SW
AL
ES
EA
SE
DA
LE
PT
36
GO
SF
OR
D (P
A 3
4)
GO
SF
OR
D (P
A 3
4)
GO
SF
OR
D (P
A 3
4)
GO
SF
OR
D (P
A 3
4)
GOSFORD (PA 34)
GOSFORD (PA 34)
MIDFORD (PA 44)
19
1919
20 20
20
2222
22
23
2121
2323
55
56
59
59
59
60
61
62
6360
60
61
61
62
62
63
63
64
64
71
71
72
72
73
7474
7373
Bir
ch W
alk
Revision
Drawing No
Project No
Checked
Drawn
Scale
DateDrawing Status
Project
Title
Rev Date Drawn CheckDescription
THIS DRAWING MUST BE READ IN CONJUNCTION WITH ALL OTHER RELEVANT DRAWINGS. DO NOT SCALE FROM THIS DRAWING.
Client Project No
Penarth, CF64 2AA
Tel 029 2070 0924
www.limetransport.com
5A Andrews Buildings
GENERAL NOTES
1. This drawing to be read in conjunction with all relevant civilengineering drawings.
LEGENDN
19112
PRELIMINARY
St John's School, Newton,
Porthcawl
Swept-path analysis:
access on to Brich Walk
- large 10.52m refuse vehicle
NOT FOR CONSTRUCTION
29.01.2020
1:200@A1
ECC
ABR
10.52
1.665 4.332 1.318
Phoenix 2-23W (with Elite 2 6x2 RS chassis)Overall Length 10.520mOverall Width 2.530mOverall Body Height 3.211mMin Body Ground Clearance 0.416mTrack Width 2.530mLock to Lock Time 4.00sKerb to Kerb Turning Radius 7.500m
Vehicle bodyEnvelope (forward)
Vehicle bodyEnvelope (reverse)
Vehicle Chassis, shown atstart & end of path andchange of direction(forward).
Vehicle Chassis, shown atstart & end of path andchange of direction(reverse).
Vehicle wheelswept path
Vehicle wheelswept path

Appendix B

EASEDALE PT36
18
21
SW
ALE
S
SWALE
S
EA
SE
DA
LE
PT
36
GOSFORD(PA34)
GOSFORD(PA34)
GOSFORD(PA34)
MIDFORD (PA 44)
MIDFORD (PA 44)
1818
19
1919
20 20
20
2222
22
23
24
2121
2323
2424
9
59
7474
373
35m
39m
Bir
chW
alk
Revision
Drawing No
Project No
Checked
Drawn
Scale
DateDrawing Status
Project
Title
Rev Date Drawn CheckDescription
THIS DRAWING MUST BE READ IN CONJUNCTION WITH ALL OTHER RELEVANT DRAWINGS. DO NOT SCALE FROM THIS DRAWING.
Client Project No
Penarth, CF64 2AA
Tel 029 2070 0924
www.limetransport.com
5A Andrews Buildings
GENERAL NOTES
1. This drawing to be read in conjunction with all relevant civilengineering drawings.
LEGEND
N
19112
PRELIMINARY
St John's School, Newton,
Porthcawl
Required visibility splays at the
access on to Birch Walk
NOT FOR CONSTRUCTION
16.01.2020
1:1000@A1
ABR
ABR
Scale 1:100 @ A1

Appendix C

1
2
3
Bry
ne
glw
ys
Ave
nue
1
2
3
Bry
ne
glw
ys
Ave
nue
Revision
Drawing No
Project No
Checked
Drawn
Scale
DateDrawing Status
Project
Title
Rev Date Drawn CheckDescription
THIS DRAWING MUST BE READ IN CONJUNCTION WITH ALL OTHER RELEVANT DRAWINGS. DO NOT SCALE FROM THIS DRAWING.
Client Project No
Penarth, CF64 2AA
Tel 029 2070 0924
www.limetransport.com
5A Andrews Buildings
GENERAL NOTES
1. This drawing to be read in conjunction with all relevant civilengineering drawings.
LEGENDN
19112
PRELIMINARY
St John's School, Newton,
Porthcawl
Swept-path analysis:
access on to Bryneglyws Avenue
- 7.5 tonne box van
NOT FOR CONSTRUCTION
10 Jan' 2020
1:100@A1
HS
ABR

1
2
3
Bry
ne
glw
ys
Ave
nue
1
2
3
Bry
ne
glw
ys
Ave
nue
Revision
Drawing No
Project No
Checked
Drawn
Scale
DateDrawing Status
Project
Title
Rev Date Drawn CheckDescription
THIS DRAWING MUST BE READ IN CONJUNCTION WITH ALL OTHER RELEVANT DRAWINGS. DO NOT SCALE FROM THIS DRAWING.
Client Project No
Penarth, CF64 2AA
Tel 029 2070 0924
www.limetransport.com
5A Andrews Buildings
GENERAL NOTES
1. This drawing to be read in conjunction with all relevant civilengineering drawings.
LEGENDN
19112
PRELIMINARY
St John's School, Newton,
Porthcawl
Swept-path analysis:
access on to Bryneglyws Avenue
- 4.6 tonne light van
NOT FOR CONSTRUCTION
10 Jan' 2020
1:100@A1
HS
ABR
Vehicle bodyEnvelope (forward)
Vehicle bodyEnvelope (reverse)
Vehicle Chassis, shown atstart & end of path andchange of direction(forward).
Vehicle Chassis, shown atstart & end of path andchange of direction(reverse).
Vehicle wheelswept path
Vehicle wheelswept path
5.885
0.72 3.7
4.6t Light VanOverall Length 5.885mOverall Width 2.000mOverall Body Height 2.526mMin Body Ground Clearance 0.299mTrack Width 1.765mLock to Lock Time 4.00sKerb to Kerb Turning Radius 6.000m

1
2
3
Bry
ne
glw
ys
Ave
nue
1
2
3
Bry
ne
glw
ys
Ave
nue
Revision
Drawing No
Project No
Checked
Drawn
Scale
DateDrawing Status
Project
Title
Rev Date Drawn CheckDescription
THIS DRAWING MUST BE READ IN CONJUNCTION WITH ALL OTHER RELEVANT DRAWINGS. DO NOT SCALE FROM THIS DRAWING.
Client Project No
Penarth, CF64 2AA
Tel 029 2070 0924
www.limetransport.com
5A Andrews Buildings
GENERAL NOTES
1. This drawing to be read in conjunction with all relevant civilengineering drawings.
LEGENDN
19112
PRELIMINARY
St John's School, Newton,
Porthcawl
Swept-path analysis:
access on to Bryneglyws Avenue
- 3.5 tonne panel van
NOT FOR CONSTRUCTION
10 Jan' 2020
1:100@A1
HS
ABR
Vehicle bodyEnvelope (forward)
Vehicle bodyEnvelope (reverse)
Vehicle Chassis, shown atstart & end of path andchange of direction(forward).
Vehicle Chassis, shown atstart & end of path andchange of direction(reverse).
Vehicle wheelswept path
Vehicle wheelswept path
5.339
1.011 3.3
3.5t Panel VanOverall Length 5.339mOverall Width 1.986mOverall Body Height 2.565mMin Body Ground Clearance 0.338mTrack Width 1.986mLock to Lock Time 4.00sKerb to Kerb Turning Radius 6.400m

1
2
3
Bry
ne
glw
ys
Ave
nue
1
2
3
Bry
ne
glw
ys
Ave
nue
Revision
Drawing No
Project No
Checked
Drawn
Scale
DateDrawing Status
Project
Title
Rev Date Drawn CheckDescription
THIS DRAWING MUST BE READ IN CONJUNCTION WITH ALL OTHER RELEVANT DRAWINGS. DO NOT SCALE FROM THIS DRAWING.
Client Project No
Penarth, CF64 2AA
Tel 029 2070 0924
www.limetransport.com
5A Andrews Buildings
GENERAL NOTES
1. This drawing to be read in conjunction with all relevant civilengineering drawings.
LEGENDN
19112
PRELIMINARY
St John's School, Newton,
Porthcawl
Swept-path analysis:
access on to Bryneglyws Avenue
- VW Touran passing refuse veh.
NOT FOR CONSTRUCTION
10 Jan' 2020
1:100@A1
HS
ABR
10.52
1.665 4.332 1.318
Phoenix 2-23W (with Elite 2 6x2 RS chassis)Overall Length 10.520mOverall Width 2.530mOverall Body Height 3.211mMin Body Ground Clearance 0.416mTrack Width 2.530mLock to Lock Time 4.00sKerb to Kerb Turning Radius 7.500m
Vehicle bodyEnvelope (forward)
Vehicle bodyEnvelope (reverse)
Vehicle Chassis, shown atstart & end of path andchange of direction(forward).
Vehicle Chassis, shown atstart & end of path andchange of direction(reverse).
Vehicle wheelswept path
Vehicle wheelswept path
Vehicle bodyEnvelope (forward)
Vehicle bodyEnvelope (reverse)
Vehicle Chassis, shown atstart & end of path andchange of direction(forward).
Vehicle Chassis, shown atstart & end of path andchange of direction(reverse).
Vehicle wheelswept path
Vehicle wheelswept path
4.527 0.007
0.978 2.646
Volkswagen TouranOverall Length 4.534mOverall Width 1.829mOverall Body Height 1.491mMin Body Ground Clearance 0.253mMax Track Width 1.734mLock to Lock Time 4.00sKerb to Kerb Turning Radius 5.042m

Appendix D

1
2
1 1
22
3
33
Bry
ne
glw
ys
Ave
nue
25m
27m
Revision
Drawing No
Project No
Checked
Drawn
Scale
DateDrawing Status
Project
Title
Rev Date Drawn CheckDescription
THIS DRAWING MUST BE READ IN CONJUNCTION WITH ALL OTHER RELEVANT DRAWINGS. DO NOT SCALE FROM THIS DRAWING.
Client Project No
Penarth, CF64 2AA
Tel 029 2070 0924
www.limetransport.com
5A Andrews Buildings
GENERAL NOTES
1. This drawing to be read in conjunction with all relevant civilengineering drawings.
LEGEND
N
19112
PRELIMINARY
St John's School, Newton,
Porthcawl
Required visibility splays at the
access on to Bryneglwys Ave.
NOT FOR CONSTRUCTION
16.01.2020
1:1000@A1
ABR
ABR

Appendix E

TRICS 7.6.1 290419 B19.08 Database right of TRICS Consortium Limited, 2019. All rights reserved Tuesday 30/04/19
Page 1
Lime Transport Limited Stanwell Road Penarth Licence No: 258601
TRIP RATE CALCULATION SELECTION PARAMETERS:
Land Use : 03 - RESIDENTIAL
Category : A - HOUSES PRIVATELY OWNED
MULTI-MODAL VEHICLES
Selected regions and areas:
02 SOUTH EAST
ES EAST SUSSEX 3 days
HC HAMPSHIRE 3 days
KC KENT 3 days
SC SURREY 1 days
WS WEST SUSSEX 4 days
03 SOUTH WEST
DV DEVON 2 days
04 EAST ANGLIA
CA CAMBRIDGESHIRE 1 days
NF NORFOLK 3 days
SF SUFFOLK 1 days
05 EAST MIDLANDS
DS DERBYSHIRE 1 days
LN LINCOLNSHIRE 1 days
06 WEST MIDLANDS
SH SHROPSHIRE 2 days
ST STAFFORDSHIRE 1 days
WO WORCESTERSHIRE 1 days
07 YORKSHIRE & NORTH LINCOLNSHIRE
NE NORTH EAST LINCOLNSHIRE 2 days
NY NORTH YORKSHIRE 7 days
08 NORTH WEST
CH CHESHIRE 2 days
09 NORTH
CB CUMBRIA 1 days
DH DURHAM 1 days
10 WALES
PS POWYS 2 days
VG VALE OF GLAMORGAN 1 days
11 SCOTLAND
AG ANGUS 1 days
FA FALKIRK 1 days
HI HIGHLAND 1 days
PK PERTH & KINROSS 1 days
This section displays the number of survey days per TRICS® sub-region in the selected set

TRICS 7.6.1 290419 B19.08 Database right of TRICS Consortium Limited, 2019. All rights reserved Tuesday 30/04/19
Page 2
Lime Transport Limited Stanwell Road Penarth Licence No: 258601
Secondary Filtering selection:
This data displays the chosen trip rate parameter and its selected range. Only sites that fall within the parameter range
are included in the trip rate calculation.
Parameter: Number of dwellings
Actual Range: 7 to 805 (units: )
Range Selected by User: 6 to 805 (units: )
Parking Spaces Range: All Surveys Included
Percentage of dwellings privately owned: All Surveys Included
Public Transport Provision:
Selection by: Include all surveys
Date Range: 01/01/11 to 20/11/18
This data displays the range of survey dates selected. Only surveys that were conducted within this date range are
included in the trip rate calculation.
Selected survey days:
Monday 10 days
Tuesday 14 days
Wednesday 10 days
Thursday 8 days
Friday 5 days
This data displays the number of selected surveys by day of the week.
Selected survey types:
Manual count 47 days
Directional ATC Count 0 days
This data displays the number of manual classified surveys and the number of unclassified ATC surveys, the total adding
up to the overall number of surveys in the selected set. Manual surveys are undertaken using staff, whilst ATC surveys
are undertaking using machines.
Selected Locations:
Edge of Town Centre 4
Suburban Area (PPS6 Out of Centre) 20
Edge of Town 23
This data displays the number of surveys per main location category within the selected set. The main location categories
consist of Free Standing, Edge of Town, Suburban Area, Neighbourhood Centre, Edge of Town Centre, Town Centre and
Not Known.
Selected Location Sub Categories:
Residential Zone 45
No Sub Category 2
This data displays the number of surveys per location sub-category within the selected set. The location sub-categories
consist of Commercial Zone, Industrial Zone, Development Zone, Residential Zone, Retail Zone, Built-Up Zone, Village,
Out of Town, High Street and No Sub Category.
Secondary Filtering selection:
Use Class:
C 3 47 days
This data displays the number of surveys per Use Class classification within the selected set. The Use Classes Order 2005
has been used for this purpose, which can be found within the Library module of TRICS®.
Population within 1 mile:
1,000 or Less 1 days
1,001 to 5,000 7 days
5,001 to 10,000 9 days
10,001 to 15,000 17 days
15,001 to 20,000 13 days
This data displays the number of selected surveys within stated 1-mile radii of population.

TRICS 7.6.1 290419 B19.08 Database right of TRICS Consortium Limited, 2019. All rights reserved Tuesday 30/04/19
Page 3
Lime Transport Limited Stanwell Road Penarth Licence No: 258601
Secondary Filtering selection (Cont.):
Population within 5 miles:
5,001 to 25,000 10 days
25,001 to 50,000 5 days
50,001 to 75,000 6 days
75,001 to 100,000 13 days
100,001 to 125,000 2 days
125,001 to 250,000 11 days
This data displays the number of selected surveys within stated 5-mile radii of population.
Car ownership within 5 miles:
0.6 to 1.0 12 days
1.1 to 1.5 35 days
This data displays the number of selected surveys within stated ranges of average cars owned per residential dwelling,
within a radius of 5-miles of selected survey sites.
Travel Plan:
Yes 8 days
No 39 days
This data displays the number of surveys within the selected set that were undertaken at sites with Travel Plans in place,
and the number of surveys that were undertaken at sites without Travel Plans.
PTAL Rating:
No PTAL Present 47 days
This data displays the number of selected surveys with PTAL Ratings.

TRICS 7.6.1 290419 B19.08 Database right of TRICS Consortium Limited, 2019. All rights reserved Tuesday 30/04/19
Page 4
Lime Transport Limited Stanwell Road Penarth Licence No: 258601
LIST OF SITES relevant to selection parameters
1 AG-03-A-01 BUNGALOWS/DET. ANGUS
KEPTIE ROAD
ARBROATH
Suburban Area (PPS6 Out of Centre)
Residential Zone
Total Number of dwellings: 7
Survey date: TUESDAY 22/05/12 Survey Type: MANUAL
2 CA-03-A-04 DETACHED CAMBRIDGESHIRE
PETERBOROUGH
THORPE PARK ROAD
Suburban Area (PPS6 Out of Centre)
Residential Zone
Total Number of dwellings: 9
Survey date: TUESDAY 18/10/11 Survey Type: MANUAL
3 CB-03-A-05 DETACHED/TERRACED HOUSING CUMBRIA
MACADAM WAY
PENRITH
Edge of Town Centre
Residential Zone
Total Number of dwellings: 5 0
Survey date: TUESDAY 21/06/16 Survey Type: MANUAL
4 CH-03-A-08 DETACHED CHESHIRE
WHITCHURCH ROAD
CHESTER
BOUGHTON HEATH
Suburban Area (PPS6 Out of Centre)
Residential Zone
Total Number of dwellings: 1 1
Survey date: TUESDAY 22/05/12 Survey Type: MANUAL
5 CH-03-A-09 TERRACED HOUSES CHESHIRE
GREYSTOKE ROAD
MACCLESFIELD
HURDSFIELD
Edge of Town
Residential Zone
Total Number of dwellings: 2 4
Survey date: MONDAY 24/11/14 Survey Type: MANUAL
6 DH-03-A-01 SEMI DETACHED DURHAM
GREENFIELDS ROAD
BISHOP AUCKLAND
Suburban Area (PPS6 Out of Centre)
Residential Zone
Total Number of dwellings: 5 0
Survey date: TUESDAY 28/03/17 Survey Type: MANUAL
7 DS-03-A-02 MIXED HOUSES DERBYSHIRE
RADBOURNE LANE
DERBY
Edge of Town
Residential Zone
Total Number of dwellings: 3 7 1
Survey date: TUESDAY 10/07/18 Survey Type: MANUAL
8 DV-03-A-02 HOUSES & BUNGALOWS DEVON
MILLHEAD ROAD
HONITON
Suburban Area (PPS6 Out of Centre)
Residential Zone
Total Number of dwellings: 1 1 6
Survey date: FRIDAY 25/09/15 Survey Type: MANUAL

TRICS 7.6.1 290419 B19.08 Database right of TRICS Consortium Limited, 2019. All rights reserved Tuesday 30/04/19
Page 5
Lime Transport Limited Stanwell Road Penarth Licence No: 258601
LIST OF SITES relevant to selection parameters (Cont.)
9 DV-03-A-03 TERRACED & SEMI DETACHED DEVON
LOWER BRAND LANE
HONITON
Suburban Area (PPS6 Out of Centre)
Residential Zone
Total Number of dwellings: 7 0
Survey date: MONDAY 28/09/15 Survey Type: MANUAL
10 ES-03-A-02 PRIVATE HOUSING EAST SUSSEX
SOUTH COAST ROAD
PEACEHAVEN
Edge of Town
Residential Zone
Total Number of dwellings: 3 7
Survey date: FRIDAY 18/11/11 Survey Type: MANUAL
11 ES-03-A-03 MIXED HOUSES & FLATS EAST SUSSEX
SHEPHAM LANE
POLEGATE
Edge of Town
Residential Zone
Total Number of dwellings: 2 1 2
Survey date: MONDAY 11/07/16 Survey Type: MANUAL
12 ES-03-A-04 MIXED HOUSES & FLATS EAST SUSSEX
NEW LYDD ROAD
CAMBER
Edge of Town
Residential Zone
Total Number of dwellings: 1 3 4
Survey date: FRIDAY 15/07/16 Survey Type: MANUAL
13 FA-03-A-01 SEMI-DETACHED/TERRACED FALKIRK
MANDELA AVENUE
FALKIRK
Suburban Area (PPS6 Out of Centre)
Residential Zone
Total Number of dwellings: 3 7
Survey date: THURSDAY 30/05/13 Survey Type: MANUAL
14 HC-03-A-20 HOUSES & FLATS HAMPSHIRE
CANADA WAY
LIPHOOK
Suburban Area (PPS6 Out of Centre)
Residential Zone
Total Number of dwellings: 6 2
Survey date: TUESDAY 20/11/18 Survey Type: MANUAL
15 HC-03-A-21 TERRACED & SEMI-DETACHED HAMPSHIRE
PRIESTLEY ROAD
BASINGSTOKE
HOUNDMILLS
Edge of Town
Residential Zone
Total Number of dwellings: 3 9
Survey date: TUESDAY 13/11/18 Survey Type: MANUAL
16 HC-03-A-22 MIXED HOUSES HAMPSHIRE
BOW LAKE GARDENS
NEAR EASTLEIGH
BISHOPSTOKE
Edge of Town
Residential Zone
Total Number of dwellings: 4 0
Survey date: WEDNESDAY 31/10/18 Survey Type: MANUAL

TRICS 7.6.1 290419 B19.08 Database right of TRICS Consortium Limited, 2019. All rights reserved Tuesday 30/04/19
Page 6
Lime Transport Limited Stanwell Road Penarth Licence No: 258601
LIST OF SITES relevant to selection parameters (Cont.)
17 HI-03-A-14 SEMI-DETACHED & TERRACED HIGHLAND
KING BRUDE ROAD
INVERNESS
SCORGUIE
Suburban Area (PPS6 Out of Centre)
Residential Zone
Total Number of dwellings: 4 0
Survey date: WEDNESDAY 23/03/16 Survey Type: MANUAL
18 KC-03-A-03 MIXED HOUSES & FLATS KENT
HYTHE ROAD
ASHFORD
WILLESBOROUGH
Suburban Area (PPS6 Out of Centre)
Residential Zone
Total Number of dwellings: 5 1
Survey date: THURSDAY 14/07/16 Survey Type: MANUAL
19 KC-03-A-04 SEMI-DETACHED & TERRACED KENT
KILN BARN ROAD
AYLESFORD
DITTON
Edge of Town
Residential Zone
Total Number of dwellings: 1 1 0
Survey date: FRIDAY 22/09/17 Survey Type: MANUAL
20 KC-03-A-07 MIXED HOUSES KENT
RECULVER ROAD
HERNE BAY
Edge of Town
Residential Zone
Total Number of dwellings: 2 8 8
Survey date: WEDNESDAY 27/09/17 Survey Type: MANUAL
21 LN-03-A-03 SEMI DETACHED LINCOLNSHIRE
ROOKERY LANE
LINCOLN
BOULTHAM
Suburban Area (PPS6 Out of Centre)
Residential Zone
Total Number of dwellings: 2 2
Survey date: TUESDAY 18/09/12 Survey Type: MANUAL
22 NE-03-A-02 SEMI DETACHED & DETACHED NORTH EAST LINCOLNSHIRE
HANOVER WALK
SCUNTHORPE
Edge of Town
No Sub Category
Total Number of dwellings: 4 3 2
Survey date: MONDAY 12/05/14 Survey Type: MANUAL
23 NE-03-A-03 PRIVATE HOUSES NORTH EAST LINCOLNSHIRE
STATION ROAD
SCUNTHORPE
Edge of Town Centre
Residential Zone
Total Number of dwellings: 1 8 0
Survey date: TUESDAY 20/05/14 Survey Type: MANUAL
24 NF-03-A-01 SEMI DET. & BUNGALOWS NORFOLK
YARMOUTH ROAD
CAISTER-ON-SEA
Suburban Area (PPS6 Out of Centre)
Residential Zone
Total Number of dwellings: 2 7
Survey date: TUESDAY 16/10/12 Survey Type: MANUAL

TRICS 7.6.1 290419 B19.08 Database right of TRICS Consortium Limited, 2019. All rights reserved Tuesday 30/04/19
Page 7
Lime Transport Limited Stanwell Road Penarth Licence No: 258601
LIST OF SITES relevant to selection parameters (Cont.)
25 NF-03-A-02 HOUSES & FLATS NORFOLK
DEREHAM ROAD
NORWICH
Suburban Area (PPS6 Out of Centre)
Residential Zone
Total Number of dwellings: 9 8
Survey date: MONDAY 22/10/12 Survey Type: MANUAL
26 NF-03-A-03 DETACHED HOUSES NORFOLK
HALING WAY
THETFORD
Edge of Town
Residential Zone
Total Number of dwellings: 1 0
Survey date: WEDNESDAY 16/09/15 Survey Type: MANUAL
27 NY-03-A-06 BUNGALOWS & SEMI DET. NORTH YORKSHIRE
HORSEFAIR
BOROUGHBRIDGE
Suburban Area (PPS6 Out of Centre)
Residential Zone
Total Number of dwellings: 1 1 5
Survey date: FRIDAY 14/10/11 Survey Type: MANUAL
28 NY-03-A-08 TERRACED HOUSES NORTH YORKSHIRE
NICHOLAS STREET
YORK
Suburban Area (PPS6 Out of Centre)
Residential Zone
Total Number of dwellings: 2 1
Survey date: MONDAY 16/09/13 Survey Type: MANUAL
29 NY-03-A-09 MIXED HOUSING NORTH YORKSHIRE
GRAMMAR SCHOOL LANE
NORTHALLERTON
Suburban Area (PPS6 Out of Centre)
Residential Zone
Total Number of dwellings: 5 2
Survey date: MONDAY 16/09/13 Survey Type: MANUAL
30 NY-03-A-10 HOUSES AND FLATS NORTH YORKSHIRE
BOROUGHBRIDGE ROAD
RIPON
Edge of Town
No Sub Category
Total Number of dwellings: 7 1
Survey date: TUESDAY 17/09/13 Survey Type: MANUAL
31 NY-03-A-11 PRIVATE HOUSING NORTH YORKSHIRE
HORSEFAIR
BOROUGHBRIDGE
Edge of Town
Residential Zone
Total Number of dwellings: 2 3
Survey date: WEDNESDAY 18/09/13 Survey Type: MANUAL
32 NY-03-A-12 TOWN HOUSES NORTH YORKSHIRE
RACECOURSE LANE
NORTHALLERTON
Edge of Town Centre
Residential Zone
Total Number of dwellings: 4 7
Survey date: TUESDAY 27/09/16 Survey Type: MANUAL
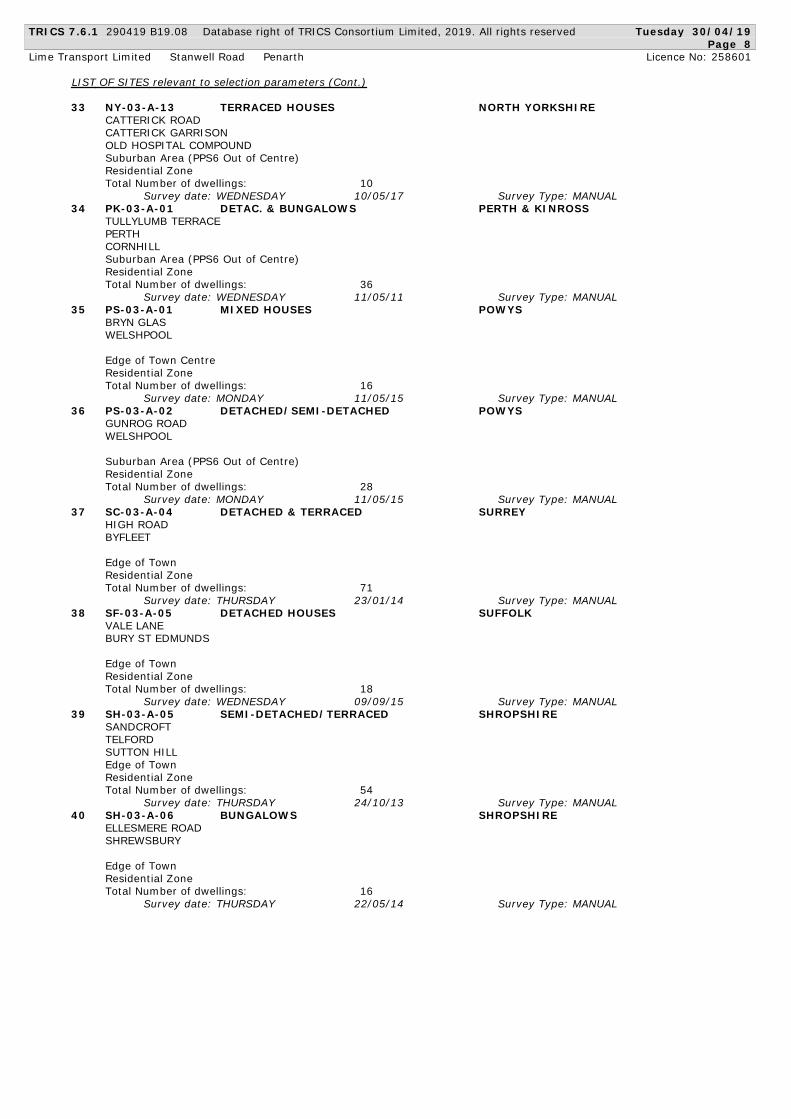
TRICS 7.6.1 290419 B19.08 Database right of TRICS Consortium Limited, 2019. All rights reserved Tuesday 30/04/19
Page 8
Lime Transport Limited Stanwell Road Penarth Licence No: 258601
LIST OF SITES relevant to selection parameters (Cont.)
33 NY-03-A-13 TERRACED HOUSES NORTH YORKSHIRE
CATTERICK ROAD
CATTERICK GARRISON
OLD HOSPITAL COMPOUND
Suburban Area (PPS6 Out of Centre)
Residential Zone
Total Number of dwellings: 1 0
Survey date: WEDNESDAY 10/05/17 Survey Type: MANUAL
34 PK-03-A-01 DETAC. & BUNGALOWS PERTH & KINROSS
TULLYLUMB TERRACE
PERTH
CORNHILL
Suburban Area (PPS6 Out of Centre)
Residential Zone
Total Number of dwellings: 3 6
Survey date: WEDNESDAY 11/05/11 Survey Type: MANUAL
35 PS-03-A-01 MIXED HOUSES POWYS
BRYN GLAS
WELSHPOOL
Edge of Town Centre
Residential Zone
Total Number of dwellings: 1 6
Survey date: MONDAY 11/05/15 Survey Type: MANUAL
36 PS-03-A-02 DETACHED/SEMI-DETACHED POWYS
GUNROG ROAD
WELSHPOOL
Suburban Area (PPS6 Out of Centre)
Residential Zone
Total Number of dwellings: 2 8
Survey date: MONDAY 11/05/15 Survey Type: MANUAL
37 SC-03-A-04 DETACHED & TERRACED SURREY
HIGH ROAD
BYFLEET
Edge of Town
Residential Zone
Total Number of dwellings: 7 1
Survey date: THURSDAY 23/01/14 Survey Type: MANUAL
38 SF-03-A-05 DETACHED HOUSES SUFFOLK
VALE LANE
BURY ST EDMUNDS
Edge of Town
Residential Zone
Total Number of dwellings: 1 8
Survey date: WEDNESDAY 09/09/15 Survey Type: MANUAL
39 SH-03-A-05 SEMI-DETACHED/TERRACED SHROPSHIRE
SANDCROFT
TELFORD
SUTTON HILL
Edge of Town
Residential Zone
Total Number of dwellings: 5 4
Survey date: THURSDAY 24/10/13 Survey Type: MANUAL
40 SH-03-A-06 BUNGALOWS SHROPSHIRE
ELLESMERE ROAD
SHREWSBURY
Edge of Town
Residential Zone
Total Number of dwellings: 1 6
Survey date: THURSDAY 22/05/14 Survey Type: MANUAL

TRICS 7.6.1 290419 B19.08 Database right of TRICS Consortium Limited, 2019. All rights reserved Tuesday 30/04/19
Page 9
Lime Transport Limited Stanwell Road Penarth Licence No: 258601
LIST OF SITES relevant to selection parameters (Cont.)
41 ST-03-A-07 DETACHED & SEMI-DETACHED STAFFORDSHIRE
BEACONSIDE
STAFFORD
MARSTON GATE
Edge of Town
Residential Zone
Total Number of dwellings: 2 4 8
Survey date: WEDNESDAY 22/11/17 Survey Type: MANUAL
42 VG-03-A-01 SEMI-DETACHED & TERRACED VALE OF GLAMORGAN
ARTHUR STREET
BARRY
Edge of Town
Residential Zone
Total Number of dwellings: 1 2
Survey date: MONDAY 08/05/17 Survey Type: MANUAL
43 WO-03-A-07 MIXED HOUSES WORCESTERSHIRE
TEASEL WAY
WORCESTER
CLAINES
Suburban Area (PPS6 Out of Centre)
Residential Zone
Total Number of dwellings: 1 4 6
Survey date: TUESDAY 26/06/18 Survey Type: MANUAL
44 WS-03-A-04 MIXED HOUSES WEST SUSSEX
HILLS FARM LANE
HORSHAM
BROADBRIDGE HEATH
Edge of Town
Residential Zone
Total Number of dwellings: 1 5 1
Survey date: THURSDAY 11/12/14 Survey Type: MANUAL
45 WS-03-A-06 MIXED HOUSES WEST SUSSEX
ELLIS ROAD
WEST HORSHAM
S BROADBRIDGE HEATH
Edge of Town
Residential Zone
Total Number of dwellings: 8 0 5
Survey date: THURSDAY 02/03/17 Survey Type: MANUAL
46 WS-03-A-08 MIXED HOUSES WEST SUSSEX
ROUNDSTONE LANE
ANGMERING
Edge of Town
Residential Zone
Total Number of dwellings: 1 8 0
Survey date: THURSDAY 19/04/18 Survey Type: MANUAL
47 WS-03-A-10 MIXED HOUSES WEST SUSSEX
TODDINGTON LANE
LITTLEHAMPTON
WICK
Edge of Town
Residential Zone
Total Number of dwellings: 7 9
Survey date: WEDNESDAY 07/11/18 Survey Type: MANUAL
This section provides a list of all survey sites and days in the selected set. For each individual survey site, it displays a
unique site reference code and site address, the selected trip rate calculation parameter and its value, the day of the
week and date of each survey, and whether the survey was a manual classified count or an ATC count.

TRICS 7.6.1 290419 B19.08 Database right of TRICS Consortium Limited, 2019. All rights reserved Tuesday 30/04/19
Page 10
Lime Transport Limited Stanwell Road Penarth Licence No: 258601
RANK ORDER for Land Use 03 - RESIDENTIAL/A - HOUSES PRIVATELY OWNED
MULTI-MODAL VEHICLES
Ranking Type: TOTALS Time Range: 08:00-09:00
15th Percentile = No. 40 CA-03-A-04 Tot: 0.333
85th Percentile = No. 8 CH-03-A-08 Tot: 0.637
Median Values Mean Values
Arrivals: 0.105 Arrivals: 0.138
Departures: 0.383 Departures: 0.365
Totals: 0.488 Totals: 0.503
Trip Rate (Sorted by Totals) Park Spaces
Rank Site-Ref Description Town/City Area DWELLS Day Date Arrivals Departures Totals Per Dwelling
1 PK-03-A-01 DETAC. & BUNGA PERTH PERTH & KINROSS 36 Wed 11/05/11 0.861 0.667 1.528 3.36
2 VG-03-A-01 S E M I - D E T A C H E D BARRY VALE OF GLAMORGAN 12 Mon 08/05/17 0.250 0.667 0.917 2.33
3 NY-03-A-13 TERRACED HOUSE CATTERICK GARRISON NORTH YORKSHIRE 10 Wed 10/05/17 0.200 0.700 0.900 1.90
4 KC-03-A-03 MIXED HOUSES & ASHFORD KENT 51 Thu 14/07/16 0.157 0.588 0.745 2.16
5 NY-03-A-10 HOUSES AND FLA RIPON NORTH YORKSHIRE 71 Tue 17/09/13 0.183 0.521 0.704 0.83
6 CB-03-A-05 DETACHED/TERRA PENRITH CUMBRIA 50 Tue 21/06/16 0.160 0.520 0.680 2.34
7 CH-03-A-09 TERRACED HOUSE MACCLESFIELD CHESHIRE 24 Mon 24/11/14 0.250 0.417 0.667 1.33
8 CH-03-A-08 DETACHED CHESTER CHESHIRE 11 Tue 22/05/12 0.182 0.455 0.637 4.73
9 ES-03-A-03 MIXED HOUSES & POLEGATE EAST SUSSEX 212 Mon 11/07/16 0.165 0.462 0.627 1.68
10 KC-03-A-07 MIXED HOUSES HERNE BAY KENT 288 Wed 27/09/17 0.240 0.385 0.625 3.09
11 WS-03-A-06 MIXED HOUSES WEST HORSHAM WEST SUSSEX 805 Thu 02/03/17 0.163 0.460 0.623 2.14
12 FA-03-A-01 SEMI-DETACHED/ FALKIRK FALKIRK 37 Thu 30/05/13 0.189 0.432 0.621 1.41
13 DV-03-A-03 TERRACED & SEM HONITON DEVON 70 Mon 28/09/15 0.086 0.529 0.615 1.66
14 KC-03-A-04 S E M I - D E T A C H E D AYLESFORD KENT 110 Fri 22/09/17 0.127 0.473 0.600 1.77
15 HI-03-A-14 S E M I - D E T A C H E D INVERNESS HIGHLAND 40 Wed 23/03/16 0.125 0.475 0.600 2.23
16 AG-03-A-01 BUNGALOWS/DET. ARBROATH ANGUS 7 Tue 22/05/12 0.286 0.286 0.572 2.71
17 NY-03-A-11 PRIVATE HOUSIN BOROUGHBRIDGE NORTH YORKSHIRE 23 Wed 18/09/13 0.000 0.565 0.565 6.26
18 HC-03-A-21 TERRACED & SEM BASINGSTOKE HAMPSHIRE 39 Tue 13/11/18 0.103 0.410 0.513 2.51
19 PS-03-A-02 DETACHED/SEMI- WELSHPOOL POWYS 28 Mon 11/05/15 0.179 0.321 0.500 2.32
20 SH-03-A-05 SEMI-DETACHED/ TELFORD SHROPSHIRE 54 Thu 24/10/13 0.130 0.370 0.500 1.17
21 NY-03-A-06 BUNGALOWS & SE BOROUGHBRIDGE NORTH YORKSHIRE 115 Fri 14/10/11 0.096 0.400 0.496 3.50
22 SC-03-A-04 DETACHED & TER BYFLEET SURREY 71 Thu 23/01/14 0.141 0.352 0.493 2.49
23 DS-03-A-02 MIXED HOUSES DERBY DERBYSHIRE 371 Tue 10/07/18 0.089 0.402 0.491 2.92
24 ST-03-A-07 DETACHED & SEM STAFFORD STAFFORDSHIRE 248 Wed 22/11/17 0.105 0.383 0.488 3.55
25 ES-03-A-02 PRIVATE HOUSIN PEACEHAVEN EAST SUSSEX 37 Fri 18/11/11 0.081 0.405 0.486 1.59
26 WS-03-A-08 MIXED HOUSES ANGMERING WEST SUSSEX 180 Thu 19/04/18 0.106 0.367 0.473 2.93
27 NF-03-A-02 HOUSES & FLATS NORWICH NORFOLK 98 Mon 22/10/12 0.122 0.347 0.469 2.24
28 HC-03-A-20 HOUSES & FLATS LIPHOOK HAMPSHIRE 62 Tue 20/11/18 0.081 0.371 0.452 2.19
29 NF-03-A-01 SEMI DET. & BU CAISTER-ON-SEA NORFOLK 27 Tue 16/10/12 0.148 0.296 0.444 2.37
30 PS-03-A-01 MIXED HOUSES WELSHPOOL POWYS 16 Mon 11/05/15 0.188 0.250 0.438 1.63
31 NE-03-A-03 PRIVATE HOUSES SCUNTHORPE NORTH EAST LINCOLNS 180 Tue 20/05/14 0.144 0.283 0.427 2.68
32 NE-03-A-02 SEMI DETACHED SCUNTHORPE NORTH EAST LINCOLNS 432 Mon 12/05/14 0.067 0.354 0.421 1.00
33 WS-03-A-04 MIXED HOUSES HORSHAM WEST SUSSEX 151 Thu 11/12/14 0.139 0.278 0.417 2.28
34 LN-03-A-03 SEMI DETACHED LINCOLN LINCOLNSHIRE 22 Tue 18/09/12 0.045 0.364 0.409 1.09
35 NY-03-A-12 TOWN HOUSES NORTHALLERTON NORTH YORKSHIRE 47 Tue 27/09/16 0.170 0.234 0.404 1.66
36 HC-03-A-22 MIXED HOUSES NEAR EASTLEIGH HAMPSHIRE 40 Wed 31/10/18 0.075 0.325 0.400 2.52
37 NY-03-A-09 MIXED HOUSING NORTHALLERTON NORTH YORKSHIRE 52 Mon 16/09/13 0.173 0.212 0.385 2.60
38 DV-03-A-02 HOUSES & BUNGA HONITON DEVON 116 Fri 25/09/15 0.103 0.241 0.344 2.25
39 NY-03-A-08 TERRACED HOUSE YORK NORTH YORKSHIRE 21 Mon 16/09/13 0.048 0.286 0.334 1.14

TRICS 7.6.1 290419 B19.08 Database right of TRICS Consortium Limited, 2019. All rights reserved Tuesday 30/04/19
Page 11
Lime Transport Limited Stanwell Road Penarth Licence No: 258601
Trip Rate (Sorted by Totals) Park Spaces
Rank Site-Ref Description Town/City Area DWELLS Day Date Arrivals Departures Totals Per Dwelling
40 CA-03-A-04 DETACHED PETERBOROUGH CAMBRIDGESHIRE 9 Tue 18/10/11 0.000 0.333 0.333 2.44
41 WS-03-A-10 MIXED HOUSES LITTLEHAMPTON WEST SUSSEX 79 Wed 07/11/18 0.089 0.241 0.330 2.41
42 SF-03-A-05 DETACHED HOUSE BURY ST EDMUNDS SUFFOLK 18 Wed 09/09/15 0.000 0.222 0.222 4.17
43 NF-03-A-03 DETACHED HOUSE THETFORD NORFOLK 10 Wed 16/09/15 0.100 0.100 0.200 3.70
44 ES-03-A-04 MIXED HOUSES & CAMBER EAST SUSSEX 134 Fri 15/07/16 0.052 0.134 0.186 1.91
45 DH-03-A-01 SEMI DETACHED BISHOP AUCKLAND DURHAM 50 Tue 28/03/17 0.020 0.140 0.160 1.74
46 WO-03-A-07 MIXED HOUSES WORCESTER WORCESTERSHIRE 146 Tue 26/06/18 0.062 0.075 0.137 4.32
47 SH-03-A-06 BUNGALOWS SHREWSBURY SHROPSHIRE 16 Thu 22/05/14 0.000 0.063 0.062 2.00
This section displays actual (not average) trip rates for each of the survey days in the selected set, and ranks them in
order of relative trip rate intensity, for a given time period (or peak period irrespective of time) selected by the user.
The count type and direction are both displayed just above the table, along with the rows within the table representing
the 85th and 15th percentile trip rate figures (highlighted in bold within the table itself).
The table itself displays details of each individual survey, alongside arrivals, departures and totals trip rates, sorted by
whichever of the three directional options has been chosen by the user. As with the preceeding trip rate calculation
results table, the trip rates shown are per the calculation factor (e.g. per 100m2 GFA, per employee, per hectare, etc).
Note that if the peak period option has been selected (as opposed to a specific chosen time period), the peak period
for each individual survey day in the table is also displayed.

TRICS 7.6.1 290419 B19.08 Database right of TRICS Consortium Limited, 2019. All rights reserved Tuesday 30/04/19
Page 21
Lime Transport Limited Stanwell Road Penarth Licence No: 258601
RANK ORDER for Land Use 03 - RESIDENTIAL/A - HOUSES PRIVATELY OWNED
MULTI-MODAL VEHICLES
Ranking Type: TOTALS Time Range: 17:00-18:00
15th Percentile = No. 40 NY-03-A-08 Tot: 0.334
85th Percentile = No. 8 NY-03-A-11 Tot: 0.739
Median Values Mean Values
Arrivals: 0.362 Arrivals: 0.342
Departures: 0.106 Departures: 0.164
Totals: 0.468 Totals: 0.506
Trip Rate (Sorted by Totals) Park Spaces
Rank Site-Ref Description Town/City Area DWELLS Day Date Arrivals Departures Totals Per Dwelling
1 PK-03-A-01 DETAC. & BUNGA PERTH PERTH & KINROSS 36 Wed 11/05/11 0.639 0.611 1.250 3.36
2 AG-03-A-01 BUNGALOWS/DET. ARBROATH ANGUS 7 Tue 22/05/12 0.571 0.571 1.142 2.71
3 KC-03-A-03 MIXED HOUSES & ASHFORD KENT 51 Thu 14/07/16 0.569 0.314 0.883 2.16
4 CH-03-A-08 DETACHED CHESTER CHESHIRE 11 Tue 22/05/12 0.545 0.273 0.818 4.73
5 CA-03-A-04 DETACHED PETERBOROUGH CAMBRIDGESHIRE 9 Tue 18/10/11 0.556 0.222 0.778 2.44
6 CH-03-A-09 TERRACED HOUSE MACCLESFIELD CHESHIRE 24 Mon 24/11/14 0.500 0.250 0.750 1.33
7 CB-03-A-05 DETACHED/TERRA PENRITH CUMBRIA 50 Tue 21/06/16 0.420 0.320 0.740 2.34
8 NY-03-A-11 PRIVATE HOUSIN BOROUGHBRIDGE NORTH YORKSHIRE 23 Wed 18/09/13 0.609 0.130 0.739 6.26
9 ES-03-A-03 MIXED HOUSES & POLEGATE EAST SUSSEX 212 Mon 11/07/16 0.434 0.217 0.651 1.68
10 HI-03-A-14 S E M I - D E T A C H E D INVERNESS HIGHLAND 40 Wed 23/03/16 0.425 0.200 0.625 2.23
11 DV-03-A-02 HOUSES & BUNGA HONITON DEVON 116 Fri 25/09/15 0.388 0.233 0.621 2.25
12 HC-03-A-22 MIXED HOUSES NEAR EASTLEIGH HAMPSHIRE 40 Wed 31/10/18 0.425 0.175 0.600 2.52
13 KC-03-A-07 MIXED HOUSES HERNE BAY KENT 288 Wed 27/09/17 0.444 0.149 0.593 3.09
14 VG-03-A-01 S E M I - D E T A C H E D BARRY VALE OF GLAMORGAN 12 Mon 08/05/17 0.333 0.250 0.583 2.33
15 NY-03-A-10 HOUSES AND FLA RIPON NORTH YORKSHIRE 71 Tue 17/09/13 0.479 0.099 0.578 0.83
16 SF-03-A-05 DETACHED HOUSE BURY ST EDMUNDS SUFFOLK 18 Wed 09/09/15 0.389 0.167 0.556 4.17
17 NF-03-A-01 SEMI DET. & BU CAISTER-ON-SEA NORFOLK 27 Tue 16/10/12 0.407 0.148 0.555 2.37
18 WS-03-A-06 MIXED HOUSES WEST HORSHAM WEST SUSSEX 805 Thu 02/03/17 0.364 0.166 0.530 2.14
19 HC-03-A-21 TERRACED & SEM BASINGSTOKE HAMPSHIRE 39 Tue 13/11/18 0.308 0.205 0.513 2.51
20 DS-03-A-02 MIXED HOUSES DERBY DERBYSHIRE 371 Tue 10/07/18 0.407 0.084 0.491 2.92
21 WS-03-A-08 MIXED HOUSES ANGMERING WEST SUSSEX 180 Thu 19/04/18 0.278 0.206 0.484 2.93
22 DV-03-A-03 TERRACED & SEM HONITON DEVON 70 Mon 28/09/15 0.371 0.100 0.471 1.66
23 NY-03-A-06 BUNGALOWS & SE BOROUGHBRIDGE NORTH YORKSHIRE 115 Fri 14/10/11 0.296 0.174 0.470 3.50
24 NY-03-A-12 TOWN HOUSES NORTHALLERTON NORTH YORKSHIRE 47 Tue 27/09/16 0.362 0.106 0.468 1.66
25 SC-03-A-04 DETACHED & TER BYFLEET SURREY 71 Thu 23/01/14 0.366 0.099 0.465 2.49
26 NY-03-A-09 MIXED HOUSING NORTHALLERTON NORTH YORKSHIRE 52 Mon 16/09/13 0.269 0.192 0.461 2.60
27 ST-03-A-07 DETACHED & SEM STAFFORD STAFFORDSHIRE 248 Wed 22/11/17 0.319 0.125 0.444 3.55
28 PS-03-A-01 MIXED HOUSES WELSHPOOL POWYS 16 Mon 11/05/15 0.250 0.188 0.438 1.63
29 HC-03-A-20 HOUSES & FLATS LIPHOOK HAMPSHIRE 62 Tue 20/11/18 0.387 0.048 0.435 2.19
30 NE-03-A-02 SEMI DETACHED SCUNTHORPE NORTH EAST LINCOLNS 432 Mon 12/05/14 0.257 0.162 0.419 1.00
31 WS-03-A-10 MIXED HOUSES LITTLEHAMPTON WEST SUSSEX 79 Wed 07/11/18 0.266 0.152 0.418 2.41
32 NF-03-A-03 DETACHED HOUSE THETFORD NORFOLK 10 Wed 16/09/15 0.400 0.000 0.400 3.70
33 NY-03-A-13 TERRACED HOUSE CATTERICK GARRISON NORTH YORKSHIRE 10 Wed 10/05/17 0.200 0.200 0.400 1.90
34 FA-03-A-01 SEMI-DETACHED/ FALKIRK FALKIRK 37 Thu 30/05/13 0.243 0.135 0.378 1.41
35 NF-03-A-02 HOUSES & FLATS NORWICH NORFOLK 98 Mon 22/10/12 0.235 0.143 0.378 2.24
36 WS-03-A-04 MIXED HOUSES HORSHAM WEST SUSSEX 151 Thu 11/12/14 0.252 0.119 0.371 2.28
37 SH-03-A-05 SEMI-DETACHED/ TELFORD SHROPSHIRE 54 Thu 24/10/13 0.241 0.130 0.371 1.17
38 ES-03-A-02 PRIVATE HOUSIN PEACEHAVEN EAST SUSSEX 37 Fri 18/11/11 0.351 0.000 0.351 1.59
39 KC-03-A-04 S E M I - D E T A C H E D AYLESFORD KENT 110 Fri 22/09/17 0.273 0.064 0.337 1.77

TRICS 7.6.1 290419 B19.08 Database right of TRICS Consortium Limited, 2019. All rights reserved Tuesday 30/04/19
Page 22
Lime Transport Limited Stanwell Road Penarth Licence No: 258601
Trip Rate (Sorted by Totals) Park Spaces
Rank Site-Ref Description Town/City Area DWELLS Day Date Arrivals Departures Totals Per Dwelling
40 NY-03-A-08 TERRACED HOUSE YORK NORTH YORKSHIRE 21 Mon 16/09/13 0.286 0.048 0.334 1.14
41 LN-03-A-03 SEMI DETACHED LINCOLN LINCOLNSHIRE 22 Tue 18/09/12 0.273 0.045 0.318 1.09
42 NE-03-A-03 PRIVATE HOUSES SCUNTHORPE NORTH EAST LINCOLNS 180 Tue 20/05/14 0.128 0.183 0.311 2.68
43 ES-03-A-04 MIXED HOUSES & CAMBER EAST SUSSEX 134 Fri 15/07/16 0.157 0.112 0.269 1.91
44 DH-03-A-01 SEMI DETACHED BISHOP AUCKLAND DURHAM 50 Tue 28/03/17 0.220 0.020 0.240 1.74
45 PS-03-A-02 DETACHED/SEMI- WELSHPOOL POWYS 28 Mon 11/05/15 0.107 0.071 0.178 2.32
46 WO-03-A-07 MIXED HOUSES WORCESTER WORCESTERSHIRE 146 Tue 26/06/18 0.089 0.048 0.137 4.32
47 SH-03-A-06 BUNGALOWS SHREWSBURY SHROPSHIRE 16 Thu 22/05/14 0.000 0.063 0.062 2.00
This section displays actual (not average) trip rates for each of the survey days in the selected set, and ranks them in
order of relative trip rate intensity, for a given time period (or peak period irrespective of time) selected by the user.
The count type and direction are both displayed just above the table, along with the rows within the table representing
the 85th and 15th percentile trip rate figures (highlighted in bold within the table itself).
The table itself displays details of each individual survey, alongside arrivals, departures and totals trip rates, sorted by
whichever of the three directional options has been chosen by the user. As with the preceeding trip rate calculation
results table, the trip rates shown are per the calculation factor (e.g. per 100m2 GFA, per employee, per hectare, etc).
Note that if the peak period option has been selected (as opposed to a specific chosen time period), the peak period
for each individual survey day in the table is also displayed.

TRICS 7.6.1 290419 B19.08 Database right of TRICS Consortium Limited, 2019. All rights reserved Tuesday 30/04/19
Page 32
Lime Transport Limited Stanwell Road Penarth Licence No: 258601
RANK ORDER for Land Use 03 - RESIDENTIAL/A - HOUSES PRIVATELY OWNED
MULTI-MODAL VEHICLES
Ranking Type: TOTALS Time Range: 07:00-19:00
15th Percentile = No. 40 NE-03-A-03 Tot: 2.916
85th Percentile = No. 8 CH-03-A-09 Tot: 6.000
Median Values Mean Values
Arrivals: 2.389 Arrivals: 2.205
Departures: 2.037 Departures: 2.312
Totals: 4.426 Totals: 4.518
Trip Rate (Sorted by Totals) Park Spaces
Rank Site-Ref Description Town/City Area DWELLS Day Date Arrivals Departures Totals Per Dwelling
1 PK-03-A-01 DETAC. & BUNGA PERTH PERTH & KINROSS 36 Wed 11/05/11 4.056 3.944 8.000 3.36
2 VG-03-A-01 S E M I - D E T A C H E D BARRY VALE OF GLAMORGAN 12 Mon 08/05/17 3.583 3.917 7.500 2.33
3 AG-03-A-01 BUNGALOWS/DET. ARBROATH ANGUS 7 Tue 22/05/12 3.143 4.286 7.429 2.71
4 CH-03-A-08 DETACHED CHESTER CHESHIRE 11 Tue 22/05/12 3.364 4.000 7.364 4.73
5 NY-03-A-13 TERRACED HOUSE CATTERICK GARRISON NORTH YORKSHIRE 10 Wed 10/05/17 3.100 3.400 6.500 1.90
6 NF-03-A-01 SEMI DET. & BU CAISTER-ON-SEA NORFOLK 27 Tue 16/10/12 3.074 3.148 6.222 2.37
7 KC-03-A-03 MIXED HOUSES & ASHFORD KENT 51 Thu 14/07/16 2.882 3.157 6.039 2.16
8 CH-03-A-09 TERRACED HOUSE MACCLESFIELD CHESHIRE 24 Mon 24/11/14 2.917 3.083 6.000 1.33
9 CB-03-A-05 DETACHED/TERRA PENRITH CUMBRIA 50 Tue 21/06/16 2.680 2.820 5.500 2.34
10 WS-03-A-08 MIXED HOUSES ANGMERING WEST SUSSEX 180 Thu 19/04/18 2.644 2.739 5.383 2.93
11 KC-03-A-07 MIXED HOUSES HERNE BAY KENT 288 Wed 27/09/17 2.844 2.510 5.354 3.09
12 SC-03-A-04 DETACHED & TER BYFLEET SURREY 71 Thu 23/01/14 2.662 2.676 5.338 2.49
13 ES-03-A-03 MIXED HOUSES & POLEGATE EAST SUSSEX 212 Mon 11/07/16 2.632 2.656 5.288 1.68
14 WS-03-A-06 MIXED HOUSES WEST HORSHAM WEST SUSSEX 805 Thu 02/03/17 2.452 2.540 4.992 2.14
15 HC-03-A-22 MIXED HOUSES NEAR EASTLEIGH HAMPSHIRE 40 Wed 31/10/18 2.425 2.500 4.925 2.52
16 HI-03-A-14 S E M I - D E T A C H E D INVERNESS HIGHLAND 40 Wed 23/03/16 2.350 2.550 4.900 2.23
17 NY-03-A-11 PRIVATE HOUSIN BOROUGHBRIDGE NORTH YORKSHIRE 23 Wed 18/09/13 2.435 2.348 4.783 6.26
18 NY-03-A-10 HOUSES AND FLA RIPON NORTH YORKSHIRE 71 Tue 17/09/13 2.366 2.408 4.774 0.83
19 NF-03-A-03 DETACHED HOUSE THETFORD NORFOLK 10 Wed 16/09/15 2.400 2.300 4.700 3.70
20 WS-03-A-10 MIXED HOUSES LITTLEHAMPTON WEST SUSSEX 79 Wed 07/11/18 2.367 2.329 4.696 2.41
21 NY-03-A-06 BUNGALOWS & SE BOROUGHBRIDGE NORTH YORKSHIRE 115 Fri 14/10/11 2.313 2.339 4.652 3.50
22 DV-03-A-02 HOUSES & BUNGA HONITON DEVON 116 Fri 25/09/15 2.319 2.302 4.621 2.25
23 HC-03-A-20 HOUSES & FLATS LIPHOOK HAMPSHIRE 62 Tue 20/11/18 2.210 2.274 4.484 2.19
24 SH-03-A-05 SEMI-DETACHED/ TELFORD SHROPSHIRE 54 Thu 24/10/13 2.389 2.037 4.426 1.17
25 DV-03-A-03 TERRACED & SEM HONITON DEVON 70 Mon 28/09/15 2.114 2.214 4.328 1.66
26 ST-03-A-07 DETACHED & SEM STAFFORD STAFFORDSHIRE 248 Wed 22/11/17 2.040 2.141 4.181 3.55
27 PS-03-A-02 DETACHED/SEMI- WELSHPOOL POWYS 28 Mon 11/05/15 2.107 2.071 4.178 2.32
28 NE-03-A-02 SEMI DETACHED SCUNTHORPE NORTH EAST LINCOLNS 432 Mon 12/05/14 1.972 2.153 4.125 1.00
29 PS-03-A-01 MIXED HOUSES WELSHPOOL POWYS 16 Mon 11/05/15 1.938 2.125 4.063 1.63
30 DS-03-A-02 MIXED HOUSES DERBY DERBYSHIRE 371 Tue 10/07/18 1.984 2.019 4.003 2.92
31 FA-03-A-01 SEMI-DETACHED/ FALKIRK FALKIRK 37 Thu 30/05/13 1.919 2.081 4.000 1.41
32 HC-03-A-21 TERRACED & SEM BASINGSTOKE HAMPSHIRE 39 Tue 13/11/18 1.872 2.103 3.975 2.51
33 WS-03-A-04 MIXED HOUSES HORSHAM WEST SUSSEX 151 Thu 11/12/14 1.748 2.020 3.768 2.28
34 NY-03-A-12 TOWN HOUSES NORTHALLERTON NORTH YORKSHIRE 47 Tue 27/09/16 2.000 1.702 3.702 1.66
35 KC-03-A-04 S E M I - D E T A C H E D AYLESFORD KENT 110 Fri 22/09/17 1.836 1.818 3.654 1.77
36 SF-03-A-05 DETACHED HOUSE BURY ST EDMUNDS SUFFOLK 18 Wed 09/09/15 1.722 1.889 3.611 4.17
37 NF-03-A-02 HOUSES & FLATS NORWICH NORFOLK 98 Mon 22/10/12 1.653 1.939 3.592 2.24
38 NY-03-A-09 MIXED HOUSING NORTHALLERTON NORTH YORKSHIRE 52 Mon 16/09/13 1.788 1.769 3.557 2.60
39 ES-03-A-04 MIXED HOUSES & CAMBER EAST SUSSEX 134 Fri 15/07/16 1.522 1.634 3.156 1.91

TRICS 7.6.1 290419 B19.08 Database right of TRICS Consortium Limited, 2019. All rights reserved Tuesday 30/04/19
Page 33
Lime Transport Limited Stanwell Road Penarth Licence No: 258601
Trip Rate (Sorted by Totals) Park Spaces
Rank Site-Ref Description Town/City Area DWELLS Day Date Arrivals Departures Totals Per Dwelling
40 NE-03-A-03 PRIVATE HOUSES SCUNTHORPE NORTH EAST LINCOLNS 180 Tue 20/05/14 1.283 1.633 2.916 2.68
41 LN-03-A-03 SEMI DETACHED LINCOLN LINCOLNSHIRE 22 Tue 18/09/12 1.318 1.591 2.909 1.09
42 CA-03-A-04 DETACHED PETERBOROUGH CAMBRIDGESHIRE 9 Tue 18/10/11 1.333 1.556 2.889 2.44
43 NY-03-A-08 TERRACED HOUSE YORK NORTH YORKSHIRE 21 Mon 16/09/13 1.476 1.381 2.857 1.14
44 ES-03-A-02 PRIVATE HOUSIN PEACEHAVEN EAST SUSSEX 37 Fri 18/11/11 1.405 1.378 2.783 1.59
45 DH-03-A-01 SEMI DETACHED BISHOP AUCKLAND DURHAM 50 Tue 28/03/17 1.260 1.380 2.640 1.74
46 SH-03-A-06 BUNGALOWS SHREWSBURY SHROPSHIRE 16 Thu 22/05/14 1.000 1.125 2.125 2.00
47 WO-03-A-07 MIXED HOUSES WORCESTER WORCESTERSHIRE 146 Tue 26/06/18 0.753 0.692 1.445 4.32
This section displays actual (not average) trip rates for each of the survey days in the selected set, and ranks them in
order of relative trip rate intensity, for a given time period (or peak period irrespective of time) selected by the user.
The count type and direction are both displayed just above the table, along with the rows within the table representing
the 85th and 15th percentile trip rate figures (highlighted in bold within the table itself).
The table itself displays details of each individual survey, alongside arrivals, departures and totals trip rates, sorted by
whichever of the three directional options has been chosen by the user. As with the preceeding trip rate calculation
results table, the trip rates shown are per the calculation factor (e.g. per 100m2 GFA, per employee, per hectare, etc).
Note that if the peak period option has been selected (as opposed to a specific chosen time period), the peak period
for each individual survey day in the table is also displayed.

TRICS 7.6.1 290419 B19.08 Database right of TRICS Consortium Limited, 2019. All rights reserved Tuesday 30/04/19
Page 1
Lime Transport Limited Stanwell Road Penarth Licence No: 258601
RANK ORDER for Land Use 03 - RESIDENTIAL/A - HOUSES PRIVATELY OWNED
MULTI-MODAL CYCLISTS
Ranking Type: TOTALS Time Range: 08:00-09:00
15th Percentile = No. 40 SH-03-A-05 Tot: 0.000
85th Percentile = No. 8 NY-03-A-09 Tot: 0.038
Median Values Mean Values
Arrivals: 0.000 Arrivals: 0.002
Departures: 0.000 Departures: 0.016
Totals: 0.000 Totals: 0.018
Trip Rate (Sorted by Totals) Park Spaces
Rank Site-Ref Description Town/City Area DWELLS Day Date Arrivals Departures Totals Per Dwelling
1 NY-03-A-08 TERRACED HOUSE YORK NORTH YORKSHIRE 21 Mon 16/09/13 0.000 0.190 0.190 1.14
2 CA-03-A-04 DETACHED PETERBOROUGH CAMBRIDGESHIRE 9 Tue 18/10/11 0.000 0.111 0.111 2.44
3 NY-03-A-10 HOUSES AND FLA RIPON NORTH YORKSHIRE 71 Tue 17/09/13 0.000 0.085 0.085 0.83
4 KC-03-A-04 S E M I - D E T A C H E D AYLESFORD KENT 110 Fri 22/09/17 0.073 0.009 0.082 1.77
5 WS-03-A-10 MIXED HOUSES LITTLEHAMPTON WEST SUSSEX 79 Wed 07/11/18 0.000 0.051 0.051 2.41
6 LN-03-A-03 SEMI DETACHED LINCOLN LINCOLNSHIRE 22 Tue 18/09/12 0.000 0.045 0.045 1.09
7 NY-03-A-11 PRIVATE HOUSIN BOROUGHBRIDGE NORTH YORKSHIRE 23 Wed 18/09/13 0.000 0.043 0.043 6.26
8 NY-03-A-09 MIXED HOUSING NORTHALLERTON NORTH YORKSHIRE 52 Mon 16/09/13 0.000 0.038 0.038 2.60
9 NF-03-A-02 HOUSES & FLATS NORWICH NORFOLK 98 Mon 22/10/12 0.000 0.031 0.031 2.24
10 ES-03-A-02 PRIVATE HOUSIN PEACEHAVEN EAST SUSSEX 37 Fri 18/11/11 0.000 0.027 0.027 1.59
11 WS-03-A-04 MIXED HOUSES HORSHAM WEST SUSSEX 151 Thu 11/12/14 0.000 0.020 0.020 2.28
12 KC-03-A-03 MIXED HOUSES & ASHFORD KENT 51 Thu 14/07/16 0.000 0.020 0.020 2.16
13 NY-03-A-06 BUNGALOWS & SE BOROUGHBRIDGE NORTH YORKSHIRE 115 Fri 14/10/11 0.017 0.000 0.017 3.50
14 NE-03-A-03 PRIVATE HOUSES SCUNTHORPE NORTH EAST LINCOLNS 180 Tue 20/05/14 0.006 0.011 0.017 2.68
15 DV-03-A-03 TERRACED & SEM HONITON DEVON 70 Mon 28/09/15 0.014 0.000 0.014 1.66
16 SC-03-A-04 DETACHED & TER BYFLEET SURREY 71 Thu 23/01/14 0.000 0.014 0.014 2.49
17 WS-03-A-08 MIXED HOUSES ANGMERING WEST SUSSEX 180 Thu 19/04/18 0.000 0.011 0.011 2.93
18 WS-03-A-06 MIXED HOUSES WEST HORSHAM WEST SUSSEX 805 Thu 02/03/17 0.001 0.007 0.008 2.14
19 WO-03-A-07 MIXED HOUSES WORCESTER WORCESTERSHIRE 146 Tue 26/06/18 0.000 0.007 0.007 4.32
20 NE-03-A-02 SEMI DETACHED SCUNTHORPE NORTH EAST LINCOLNS 432 Mon 12/05/14 0.000 0.005 0.005 1.00
21 ES-03-A-03 MIXED HOUSES & POLEGATE EAST SUSSEX 212 Mon 11/07/16 0.000 0.005 0.005 1.68
22 ST-03-A-07 DETACHED & SEM STAFFORD STAFFORDSHIRE 248 Wed 22/11/17 0.000 0.004 0.004 3.55
23 KC-03-A-07 MIXED HOUSES HERNE BAY KENT 288 Wed 27/09/17 0.000 0.003 0.003 3.09
24 SF-03-A-05 DETACHED HOUSE BURY ST EDMUNDS SUFFOLK 18 Wed 09/09/15 0.000 0.000 0.000 4.17
25 PK-03-A-01 DETAC. & BUNGA PERTH PERTH & KINROSS 36 Wed 11/05/11 0.000 0.000 0.000 3.36
26 NY-03-A-12 TOWN HOUSES NORTHALLERTON NORTH YORKSHIRE 47 Tue 27/09/16 0.000 0.000 0.000 1.66
27 NF-03-A-01 SEMI DET. & BU CAISTER-ON-SEA NORFOLK 27 Tue 16/10/12 0.000 0.000 0.000 2.37
28 HI-03-A-14 S E M I - D E T A C H E D INVERNESS HIGHLAND 40 Wed 23/03/16 0.000 0.000 0.000 2.23
29 HC-03-A-20 HOUSES & FLATS LIPHOOK HAMPSHIRE 62 Tue 20/11/18 0.000 0.000 0.000 2.19
30 ES-03-A-04 MIXED HOUSES & CAMBER EAST SUSSEX 134 Fri 15/07/16 0.000 0.000 0.000 1.91
31 DV-03-A-02 HOUSES & BUNGA HONITON DEVON 116 Fri 25/09/15 0.000 0.000 0.000 2.25
32 DS-03-A-02 MIXED HOUSES DERBY DERBYSHIRE 371 Tue 10/07/18 0.000 0.000 0.000 2.92
33 DH-03-A-01 SEMI DETACHED BISHOP AUCKLAND DURHAM 50 Tue 28/03/17 0.000 0.000 0.000 1.74
34 CH-03-A-09 TERRACED HOUSE MACCLESFIELD CHESHIRE 24 Mon 24/11/14 0.000 0.000 0.000 1.33
35 CH-03-A-08 DETACHED CHESTER CHESHIRE 11 Tue 22/05/12 0.000 0.000 0.000 4.73
36 CB-03-A-05 DETACHED/TERRA PENRITH CUMBRIA 50 Tue 21/06/16 0.000 0.000 0.000 2.34
37 AG-03-A-01 BUNGALOWS/DET. ARBROATH ANGUS 7 Tue 22/05/12 0.000 0.000 0.000 2.71
38 VG-03-A-01 S E M I - D E T A C H E D BARRY VALE OF GLAMORGAN 12 Mon 08/05/17 0.000 0.000 0.000 2.33
39 SH-03-A-06 BUNGALOWS SHREWSBURY SHROPSHIRE 16 Thu 22/05/14 0.000 0.000 0.000 2.00
40 SH-03-A-05 SEMI-DETACHED/ TELFORD SHROPSHIRE 54 Thu 24/10/13 0.000 0.000 0.000 1.17

TRICS 7.6.1 290419 B19.08 Database right of TRICS Consortium Limited, 2019. All rights reserved Tuesday 30/04/19
Page 2
Lime Transport Limited Stanwell Road Penarth Licence No: 258601
Trip Rate (Sorted by Totals) Park Spaces
Rank Site-Ref Description Town/City Area DWELLS Day Date Arrivals Departures Totals Per Dwelling
41 PS-03-A-02 DETACHED/SEMI- WELSHPOOL POWYS 28 Mon 11/05/15 0.000 0.000 0.000 2.32
42 PS-03-A-01 MIXED HOUSES WELSHPOOL POWYS 16 Mon 11/05/15 0.000 0.000 0.000 1.63
43 NY-03-A-13 TERRACED HOUSE CATTERICK GARRISON NORTH YORKSHIRE 10 Wed 10/05/17 0.000 0.000 0.000 1.90
44 NF-03-A-03 DETACHED HOUSE THETFORD NORFOLK 10 Wed 16/09/15 0.000 0.000 0.000 3.70
45 HC-03-A-22 MIXED HOUSES NEAR EASTLEIGH HAMPSHIRE 40 Wed 31/10/18 0.000 0.000 0.000 2.52
46 HC-03-A-21 TERRACED & SEM BASINGSTOKE HAMPSHIRE 39 Tue 13/11/18 0.000 0.000 0.000 2.51
47 FA-03-A-01 SEMI-DETACHED/ FALKIRK FALKIRK 37 Thu 30/05/13 0.000 0.000 0.000 1.41
This section displays actual (not average) trip rates for each of the survey days in the selected set, and ranks them in
order of relative trip rate intensity, for a given time period (or peak period irrespective of time) selected by the user. The
count type and direction are both displayed just above the table, along with the rows within the table representing the
85th and 15th percentile trip rate figures (highlighted in bold within the table itself).
The table itself displays details of each individual survey, alongside arrivals, departures and totals trip rates, sorted by
whichever of the three directional options has been chosen by the user. As with the preceeding trip rate calculation
results table, the trip rates shown are per the calculation factor (e.g. per 100m2 GFA, per employee, per hectare, etc).
Note that if the peak period option has been selected (as opposed to a specific chosen time period), the peak period for
each individual survey day in the table is also displayed.

TRICS 7.6.1 290419 B19.08 Database right of TRICS Consortium Limited, 2019. All rights reserved Tuesday 30/04/19
Page 3
Lime Transport Limited Stanwell Road Penarth Licence No: 258601
RANK ORDER for Land Use 03 - RESIDENTIAL/A - HOUSES PRIVATELY OWNED
MULTI-MODAL CYCLISTS
Ranking Type: TOTALS Time Range: 17:00-18:00
15th Percentile = No. 40 SH-03-A-05 Tot: 0.000
85th Percentile = No. 8 HI-03-A-14 Tot: 0.050
Median Values Mean Values
Arrivals: 0.000 Arrivals: 0.017
Departures: 0.002 Departures: 0.006
Totals: 0.002 Totals: 0.023
Trip Rate (Sorted by Totals) Park Spaces
Rank Site-Ref Description Town/City Area DWELLS Day Date Arrivals Departures Totals Per Dwelling
1 NY-03-A-08 TERRACED HOUSE YORK NORTH YORKSHIRE 21 Mon 16/09/13 0.095 0.095 0.190 1.14
2 NF-03-A-02 HOUSES & FLATS NORWICH NORFOLK 98 Mon 22/10/12 0.071 0.020 0.091 2.24
3 NY-03-A-11 PRIVATE HOUSIN BOROUGHBRIDGE NORTH YORKSHIRE 23 Wed 18/09/13 0.087 0.000 0.087 6.26
4 ES-03-A-02 PRIVATE HOUSIN PEACEHAVEN EAST SUSSEX 37 Fri 18/11/11 0.081 0.000 0.081 1.59
5 CB-03-A-05 DETACHED/TERRA PENRITH CUMBRIA 50 Tue 21/06/16 0.020 0.040 0.060 2.34
6 NY-03-A-09 MIXED HOUSING NORTHALLERTON NORTH YORKSHIRE 52 Mon 16/09/13 0.058 0.000 0.058 2.60
7 PK-03-A-01 DETAC. & BUNGA PERTH PERTH & KINROSS 36 Wed 11/05/11 0.056 0.000 0.056 3.36
8 HI-03-A-14 S E M I - D E T A C H E D INVERNESS HIGHLAND 40 Wed 23/03/16 0.050 0.000 0.050 2.23
9 LN-03-A-03 SEMI DETACHED LINCOLN LINCOLNSHIRE 22 Tue 18/09/12 0.045 0.000 0.045 1.09
10 KC-03-A-04 S E M I - D E T A C H E D AYLESFORD KENT 110 Fri 22/09/17 0.036 0.009 0.045 1.77
11 DV-03-A-03 TERRACED & SEM HONITON DEVON 70 Mon 28/09/15 0.029 0.014 0.043 1.66
12 NY-03-A-06 BUNGALOWS & SE BOROUGHBRIDGE NORTH YORKSHIRE 115 Fri 14/10/11 0.017 0.026 0.043 3.50
13 WS-03-A-04 MIXED HOUSES HORSHAM WEST SUSSEX 151 Thu 11/12/14 0.026 0.007 0.033 2.28
14 WS-03-A-06 MIXED HOUSES WEST HORSHAM WEST SUSSEX 805 Thu 02/03/17 0.016 0.017 0.033 2.14
15 NY-03-A-10 HOUSES AND FLA RIPON NORTH YORKSHIRE 71 Tue 17/09/13 0.028 0.000 0.028 0.83
16 WS-03-A-08 MIXED HOUSES ANGMERING WEST SUSSEX 180 Thu 19/04/18 0.022 0.006 0.028 2.93
17 ES-03-A-04 MIXED HOUSES & CAMBER EAST SUSSEX 134 Fri 15/07/16 0.007 0.015 0.022 1.91
18 ES-03-A-03 MIXED HOUSES & POLEGATE EAST SUSSEX 212 Mon 11/07/16 0.019 0.000 0.019 1.68
19 HC-03-A-20 HOUSES & FLATS LIPHOOK HAMPSHIRE 62 Tue 20/11/18 0.016 0.000 0.016 2.19
20 DS-03-A-02 MIXED HOUSES DERBY DERBYSHIRE 371 Tue 10/07/18 0.008 0.008 0.016 2.92
21 WO-03-A-07 MIXED HOUSES WORCESTER WORCESTERSHIRE 146 Tue 26/06/18 0.014 0.000 0.014 4.32
22 NE-03-A-03 PRIVATE HOUSES SCUNTHORPE NORTH EAST LINCOLNS 180 Tue 20/05/14 0.006 0.006 0.012 2.68
23 ST-03-A-07 DETACHED & SEM STAFFORD STAFFORDSHIRE 248 Wed 22/11/17 0.000 0.004 0.004 3.55
24 NE-03-A-02 SEMI DETACHED SCUNTHORPE NORTH EAST LINCOLNS 432 Mon 12/05/14 0.000 0.002 0.002 1.00
25 WS-03-A-10 MIXED HOUSES LITTLEHAMPTON WEST SUSSEX 79 Wed 07/11/18 0.000 0.000 0.000 2.41
26 SF-03-A-05 DETACHED HOUSE BURY ST EDMUNDS SUFFOLK 18 Wed 09/09/15 0.000 0.000 0.000 4.17
27 SC-03-A-04 DETACHED & TER BYFLEET SURREY 71 Thu 23/01/14 0.000 0.000 0.000 2.49
28 NY-03-A-12 TOWN HOUSES NORTHALLERTON NORTH YORKSHIRE 47 Tue 27/09/16 0.000 0.000 0.000 1.66
29 NF-03-A-01 SEMI DET. & BU CAISTER-ON-SEA NORFOLK 27 Tue 16/10/12 0.000 0.000 0.000 2.37
30 KC-03-A-07 MIXED HOUSES HERNE BAY KENT 288 Wed 27/09/17 0.000 0.000 0.000 3.09
31 KC-03-A-03 MIXED HOUSES & ASHFORD KENT 51 Thu 14/07/16 0.000 0.000 0.000 2.16
32 DV-03-A-02 HOUSES & BUNGA HONITON DEVON 116 Fri 25/09/15 0.000 0.000 0.000 2.25
33 DH-03-A-01 SEMI DETACHED BISHOP AUCKLAND DURHAM 50 Tue 28/03/17 0.000 0.000 0.000 1.74
34 CH-03-A-09 TERRACED HOUSE MACCLESFIELD CHESHIRE 24 Mon 24/11/14 0.000 0.000 0.000 1.33
35 CH-03-A-08 DETACHED CHESTER CHESHIRE 11 Tue 22/05/12 0.000 0.000 0.000 4.73
36 CA-03-A-04 DETACHED PETERBOROUGH CAMBRIDGESHIRE 9 Tue 18/10/11 0.000 0.000 0.000 2.44
37 AG-03-A-01 BUNGALOWS/DET. ARBROATH ANGUS 7 Tue 22/05/12 0.000 0.000 0.000 2.71
38 VG-03-A-01 S E M I - D E T A C H E D BARRY VALE OF GLAMORGAN 12 Mon 08/05/17 0.000 0.000 0.000 2.33
39 SH-03-A-06 BUNGALOWS SHREWSBURY SHROPSHIRE 16 Thu 22/05/14 0.000 0.000 0.000 2.00
40 SH-03-A-05 SEMI-DETACHED/ TELFORD SHROPSHIRE 54 Thu 24/10/13 0.000 0.000 0.000 1.17

TRICS 7.6.1 290419 B19.08 Database right of TRICS Consortium Limited, 2019. All rights reserved Tuesday 30/04/19
Page 4
Lime Transport Limited Stanwell Road Penarth Licence No: 258601
Trip Rate (Sorted by Totals) Park Spaces
Rank Site-Ref Description Town/City Area DWELLS Day Date Arrivals Departures Totals Per Dwelling
41 PS-03-A-02 DETACHED/SEMI- WELSHPOOL POWYS 28 Mon 11/05/15 0.000 0.000 0.000 2.32
42 PS-03-A-01 MIXED HOUSES WELSHPOOL POWYS 16 Mon 11/05/15 0.000 0.000 0.000 1.63
43 NY-03-A-13 TERRACED HOUSE CATTERICK GARRISON NORTH YORKSHIRE 10 Wed 10/05/17 0.000 0.000 0.000 1.90
44 NF-03-A-03 DETACHED HOUSE THETFORD NORFOLK 10 Wed 16/09/15 0.000 0.000 0.000 3.70
45 HC-03-A-22 MIXED HOUSES NEAR EASTLEIGH HAMPSHIRE 40 Wed 31/10/18 0.000 0.000 0.000 2.52
46 HC-03-A-21 TERRACED & SEM BASINGSTOKE HAMPSHIRE 39 Tue 13/11/18 0.000 0.000 0.000 2.51
47 FA-03-A-01 SEMI-DETACHED/ FALKIRK FALKIRK 37 Thu 30/05/13 0.000 0.000 0.000 1.41
This section displays actual (not average) trip rates for each of the survey days in the selected set, and ranks them in
order of relative trip rate intensity, for a given time period (or peak period irrespective of time) selected by the user. The
count type and direction are both displayed just above the table, along with the rows within the table representing the
85th and 15th percentile trip rate figures (highlighted in bold within the table itself).
The table itself displays details of each individual survey, alongside arrivals, departures and totals trip rates, sorted by
whichever of the three directional options has been chosen by the user. As with the preceeding trip rate calculation
results table, the trip rates shown are per the calculation factor (e.g. per 100m2 GFA, per employee, per hectare, etc).
Note that if the peak period option has been selected (as opposed to a specific chosen time period), the peak period for
each individual survey day in the table is also displayed.

TRICS 7.6.1 290419 B19.08 Database right of TRICS Consortium Limited, 2019. All rights reserved Tuesday 30/04/19
Page 5
Lime Transport Limited Stanwell Road Penarth Licence No: 258601
RANK ORDER for Land Use 03 - RESIDENTIAL/A - HOUSES PRIVATELY OWNED
MULTI-MODAL CYCLISTS
Ranking Type: TOTALS Time Range: 07:00-19:00
15th Percentile = No. 40 SH-03-A-05 Tot: 0.000
85th Percentile = No. 8 AG-03-A-01 Tot: 0.286
Median Values Mean Values
Arrivals: 0.083 Arrivals: 0.094
Departures: 0.042 Departures: 0.093
Totals: 0.125 Totals: 0.187
Trip Rate (Sorted by Totals) Park Spaces
Rank Site-Ref Description Town/City Area DWELLS Day Date Arrivals Departures Totals Per Dwelling
1 CA-03-A-04 DETACHED PETERBOROUGH CAMBRIDGESHIRE 9 Tue 18/10/11 0.667 0.667 1.334 2.44
2 NY-03-A-08 TERRACED HOUSE YORK NORTH YORKSHIRE 21 Mon 16/09/13 0.619 0.619 1.238 1.14
3 NY-03-A-09 MIXED HOUSING NORTHALLERTON NORTH YORKSHIRE 52 Mon 16/09/13 0.308 0.327 0.635 2.60
4 NY-03-A-11 PRIVATE HOUSIN BOROUGHBRIDGE NORTH YORKSHIRE 23 Wed 18/09/13 0.261 0.261 0.522 6.26
5 KC-03-A-04 S E M I - D E T A C H E D AYLESFORD KENT 110 Fri 22/09/17 0.191 0.191 0.382 1.77
6 NY-03-A-10 HOUSES AND FLA RIPON NORTH YORKSHIRE 71 Tue 17/09/13 0.183 0.183 0.366 0.83
7 NF-03-A-02 HOUSES & FLATS NORWICH NORFOLK 98 Mon 22/10/12 0.153 0.163 0.316 2.24
8 AG-03-A-01 BUNGALOWS/DET. ARBROATH ANGUS 7 Tue 22/05/12 0.143 0.143 0.286 2.71
9 SF-03-A-05 DETACHED HOUSE BURY ST EDMUNDS SUFFOLK 18 Wed 09/09/15 0.167 0.111 0.278 4.17
10 ES-03-A-02 PRIVATE HOUSIN PEACEHAVEN EAST SUSSEX 37 Fri 18/11/11 0.108 0.162 0.270 1.59
11 NE-03-A-03 PRIVATE HOUSES SCUNTHORPE NORTH EAST LINCOLNS 180 Tue 20/05/14 0.100 0.111 0.211 2.68
12 WS-03-A-08 MIXED HOUSES ANGMERING WEST SUSSEX 180 Thu 19/04/18 0.100 0.106 0.206 2.93
13 CB-03-A-05 DETACHED/TERRA PENRITH CUMBRIA 50 Tue 21/06/16 0.080 0.120 0.200 2.34
14 LN-03-A-03 SEMI DETACHED LINCOLN LINCOLNSHIRE 22 Tue 18/09/12 0.091 0.091 0.182 1.09
15 CH-03-A-08 DETACHED CHESTER CHESHIRE 11 Tue 22/05/12 0.091 0.091 0.182 4.73
16 DH-03-A-01 SEMI DETACHED BISHOP AUCKLAND DURHAM 50 Tue 28/03/17 0.080 0.080 0.160 1.74
17 WS-03-A-04 MIXED HOUSES HORSHAM WEST SUSSEX 151 Thu 11/12/14 0.079 0.079 0.158 2.28
18 DV-03-A-03 TERRACED & SEM HONITON DEVON 70 Mon 28/09/15 0.100 0.057 0.157 1.66
19 HI-03-A-14 S E M I - D E T A C H E D INVERNESS HIGHLAND 40 Wed 23/03/16 0.075 0.075 0.150 2.23
20 NY-03-A-06 BUNGALOWS & SE BOROUGHBRIDGE NORTH YORKSHIRE 115 Fri 14/10/11 0.078 0.070 0.148 3.50
21 NF-03-A-01 SEMI DET. & BU CAISTER-ON-SEA NORFOLK 27 Tue 16/10/12 0.074 0.074 0.148 2.37
22 KC-03-A-03 MIXED HOUSES & ASHFORD KENT 51 Thu 14/07/16 0.078 0.059 0.137 2.16
23 WS-03-A-06 MIXED HOUSES WEST HORSHAM WEST SUSSEX 805 Thu 02/03/17 0.056 0.075 0.131 2.14
24 CH-03-A-09 TERRACED HOUSE MACCLESFIELD CHESHIRE 24 Mon 24/11/14 0.083 0.042 0.125 1.33
25 HC-03-A-20 HOUSES & FLATS LIPHOOK HAMPSHIRE 62 Tue 20/11/18 0.081 0.032 0.113 2.19
26 SC-03-A-04 DETACHED & TER BYFLEET SURREY 71 Thu 23/01/14 0.056 0.056 0.112 2.49
27 PK-03-A-01 DETAC. & BUNGA PERTH PERTH & KINROSS 36 Wed 11/05/11 0.083 0.028 0.111 3.36
28 WS-03-A-10 MIXED HOUSES LITTLEHAMPTON WEST SUSSEX 79 Wed 07/11/18 0.038 0.063 0.101 2.41
29 ES-03-A-04 MIXED HOUSES & CAMBER EAST SUSSEX 134 Fri 15/07/16 0.045 0.052 0.097 1.91
30 ES-03-A-03 MIXED HOUSES & POLEGATE EAST SUSSEX 212 Mon 11/07/16 0.047 0.047 0.094 1.68
31 DS-03-A-02 MIXED HOUSES DERBY DERBYSHIRE 371 Tue 10/07/18 0.038 0.040 0.078 2.92
32 WO-03-A-07 MIXED HOUSES WORCESTER WORCESTERSHIRE 146 Tue 26/06/18 0.034 0.034 0.068 4.32
33 NY-03-A-12 TOWN HOUSES NORTHALLERTON NORTH YORKSHIRE 47 Tue 27/09/16 0.021 0.021 0.042 1.66
34 NE-03-A-02 SEMI DETACHED SCUNTHORPE NORTH EAST LINCOLNS 432 Mon 12/05/14 0.014 0.028 0.042 1.00
35 ST-03-A-07 DETACHED & SEM STAFFORD STAFFORDSHIRE 248 Wed 22/11/17 0.008 0.008 0.016 3.55
36 DV-03-A-02 HOUSES & BUNGA HONITON DEVON 116 Fri 25/09/15 0.000 0.009 0.009 2.25
37 KC-03-A-07 MIXED HOUSES HERNE BAY KENT 288 Wed 27/09/17 0.003 0.003 0.006 3.09
38 VG-03-A-01 S E M I - D E T A C H E D BARRY VALE OF GLAMORGAN 12 Mon 08/05/17 0.000 0.000 0.000 2.33
39 SH-03-A-06 BUNGALOWS SHREWSBURY SHROPSHIRE 16 Thu 22/05/14 0.000 0.000 0.000 2.00
40 SH-03-A-05 SEMI-DETACHED/ TELFORD SHROPSHIRE 54 Thu 24/10/13 0.000 0.000 0.000 1.17

TRICS 7.6.1 290419 B19.08 Database right of TRICS Consortium Limited, 2019. All rights reserved Tuesday 30/04/19
Page 6
Lime Transport Limited Stanwell Road Penarth Licence No: 258601
Trip Rate (Sorted by Totals) Park Spaces
Rank Site-Ref Description Town/City Area DWELLS Day Date Arrivals Departures Totals Per Dwelling
41 PS-03-A-02 DETACHED/SEMI- WELSHPOOL POWYS 28 Mon 11/05/15 0.000 0.000 0.000 2.32
42 PS-03-A-01 MIXED HOUSES WELSHPOOL POWYS 16 Mon 11/05/15 0.000 0.000 0.000 1.63
43 NY-03-A-13 TERRACED HOUSE CATTERICK GARRISON NORTH YORKSHIRE 10 Wed 10/05/17 0.000 0.000 0.000 1.90
44 NF-03-A-03 DETACHED HOUSE THETFORD NORFOLK 10 Wed 16/09/15 0.000 0.000 0.000 3.70
45 HC-03-A-22 MIXED HOUSES NEAR EASTLEIGH HAMPSHIRE 40 Wed 31/10/18 0.000 0.000 0.000 2.52
46 HC-03-A-21 TERRACED & SEM BASINGSTOKE HAMPSHIRE 39 Tue 13/11/18 0.000 0.000 0.000 2.51
47 FA-03-A-01 SEMI-DETACHED/ FALKIRK FALKIRK 37 Thu 30/05/13 0.000 0.000 0.000 1.41
This section displays actual (not average) trip rates for each of the survey days in the selected set, and ranks them in
order of relative trip rate intensity, for a given time period (or peak period irrespective of time) selected by the user. The
count type and direction are both displayed just above the table, along with the rows within the table representing the
85th and 15th percentile trip rate figures (highlighted in bold within the table itself).
The table itself displays details of each individual survey, alongside arrivals, departures and totals trip rates, sorted by
whichever of the three directional options has been chosen by the user. As with the preceeding trip rate calculation
results table, the trip rates shown are per the calculation factor (e.g. per 100m2 GFA, per employee, per hectare, etc).
Note that if the peak period option has been selected (as opposed to a specific chosen time period), the peak period for
each individual survey day in the table is also displayed.

TRICS 7.6.1 290419 B19.08 Database right of TRICS Consortium Limited, 2019. All rights reserved Tuesday 30/04/19
Page 1
Lime Transport Limited Stanwell Road Penarth Licence No: 258601
RANK ORDER for Land Use 03 - RESIDENTIAL/A - HOUSES PRIVATELY OWNED
MULTI-MODAL PEDESTRIANS
Ranking Type: TOTALS Time Range: 08:00-09:00
15th Percentile = No. 40 KC-03-A-07 Tot: 0.056
85th Percentile = No. 8 KC-03-A-03 Tot: 0.451
Median Values Mean Values
Arrivals: 0.000 Arrivals: 0.053
Departures: 0.143 Departures: 0.177
Totals: 0.143 Totals: 0.230
Trip Rate (Sorted by Totals) Park Spaces
Rank Site-Ref Description Town/City Area DWELLS Day Date Arrivals Departures Totals Per Dwelling
1 CA-03-A-04 DETACHED PETERBOROUGH CAMBRIDGESHIRE 9 Tue 18/10/11 0.000 0.778 0.778 2.44
2 HI-03-A-14 S E M I - D E T A C H E D INVERNESS HIGHLAND 40 Wed 23/03/16 0.100 0.650 0.750 2.23
3 PK-03-A-01 DETAC. & BUNGA PERTH PERTH & KINROSS 36 Wed 11/05/11 0.167 0.472 0.639 3.36
4 DV-03-A-03 TERRACED & SEM HONITON DEVON 70 Mon 28/09/15 0.157 0.471 0.628 1.66
5 NY-03-A-09 MIXED HOUSING NORTHALLERTON NORTH YORKSHIRE 52 Mon 16/09/13 0.096 0.442 0.538 2.60
6 KC-03-A-04 S E M I - D E T A C H E D AYLESFORD KENT 110 Fri 22/09/17 0.155 0.300 0.455 1.77
7 CH-03-A-08 DETACHED CHESTER CHESHIRE 11 Tue 22/05/12 0.000 0.455 0.455 4.73
8 KC-03-A-03 MIXED HOUSES & ASHFORD KENT 51 Thu 14/07/16 0.118 0.333 0.451 2.16
9 HC-03-A-20 HOUSES & FLATS LIPHOOK HAMPSHIRE 62 Tue 20/11/18 0.113 0.323 0.436 2.19
10 NY-03-A-11 PRIVATE HOUSIN BOROUGHBRIDGE NORTH YORKSHIRE 23 Wed 18/09/13 0.130 0.304 0.434 6.26
11 NE-03-A-03 PRIVATE HOUSES SCUNTHORPE NORTH EAST LINCOLNS 180 Tue 20/05/14 0.022 0.411 0.433 2.68
12 VG-03-A-01 S E M I - D E T A C H E D BARRY VALE OF GLAMORGAN 12 Mon 08/05/17 0.333 0.083 0.416 2.33
13 SF-03-A-05 DETACHED HOUSE BURY ST EDMUNDS SUFFOLK 18 Wed 09/09/15 0.167 0.167 0.334 4.17
14 AG-03-A-01 BUNGALOWS/DET. ARBROATH ANGUS 7 Tue 22/05/12 0.000 0.286 0.286 2.71
15 FA-03-A-01 SEMI-DETACHED/ FALKIRK FALKIRK 37 Thu 30/05/13 0.081 0.189 0.270 1.41
16 CB-03-A-05 DETACHED/TERRA PENRITH CUMBRIA 50 Tue 21/06/16 0.000 0.220 0.220 2.34
17 PS-03-A-02 DETACHED/SEMI- WELSHPOOL POWYS 28 Mon 11/05/15 0.071 0.143 0.214 2.32
18 NY-03-A-13 TERRACED HOUSE CATTERICK GARRISON NORTH YORKSHIRE 10 Wed 10/05/17 0.000 0.200 0.200 1.90
19 DV-03-A-02 HOUSES & BUNGA HONITON DEVON 116 Fri 25/09/15 0.017 0.181 0.198 2.25
20 NF-03-A-01 SEMI DET. & BU CAISTER-ON-SEA NORFOLK 27 Tue 16/10/12 0.111 0.074 0.185 2.37
21 WS-03-A-06 MIXED HOUSES WEST HORSHAM WEST SUSSEX 805 Thu 02/03/17 0.019 0.166 0.185 2.14
22 LN-03-A-03 SEMI DETACHED LINCOLN LINCOLNSHIRE 22 Tue 18/09/12 0.045 0.136 0.181 1.09
23 NY-03-A-12 TOWN HOUSES NORTHALLERTON NORTH YORKSHIRE 47 Tue 27/09/16 0.000 0.149 0.149 1.66
24 NY-03-A-08 TERRACED HOUSE YORK NORTH YORKSHIRE 21 Mon 16/09/13 0.000 0.143 0.143 1.14
25 DH-03-A-01 SEMI DETACHED BISHOP AUCKLAND DURHAM 50 Tue 28/03/17 0.060 0.080 0.140 1.74
26 SH-03-A-05 SEMI-DETACHED/ TELFORD SHROPSHIRE 54 Thu 24/10/13 0.056 0.074 0.130 1.17
27 HC-03-A-21 TERRACED & SEM BASINGSTOKE HAMPSHIRE 39 Tue 13/11/18 0.026 0.103 0.129 2.51
28 PS-03-A-01 MIXED HOUSES WELSHPOOL POWYS 16 Mon 11/05/15 0.125 0.000 0.125 1.63
29 CH-03-A-09 TERRACED HOUSE MACCLESFIELD CHESHIRE 24 Mon 24/11/14 0.000 0.125 0.125 1.33
30 ES-03-A-03 MIXED HOUSES & POLEGATE EAST SUSSEX 212 Mon 11/07/16 0.014 0.104 0.118 1.68
31 ES-03-A-04 MIXED HOUSES & CAMBER EAST SUSSEX 134 Fri 15/07/16 0.030 0.082 0.112 1.91
32 WS-03-A-08 MIXED HOUSES ANGMERING WEST SUSSEX 180 Thu 19/04/18 0.017 0.089 0.106 2.93
33 NY-03-A-06 BUNGALOWS & SE BOROUGHBRIDGE NORTH YORKSHIRE 115 Fri 14/10/11 0.026 0.078 0.104 3.50
34 WO-03-A-07 MIXED HOUSES WORCESTER WORCESTERSHIRE 146 Tue 26/06/18 0.068 0.034 0.102 4.32
35 NF-03-A-03 DETACHED HOUSE THETFORD NORFOLK 10 Wed 16/09/15 0.100 0.000 0.100 3.70
36 NF-03-A-02 HOUSES & FLATS NORWICH NORFOLK 98 Mon 22/10/12 0.010 0.082 0.092 2.24
37 HC-03-A-22 MIXED HOUSES NEAR EASTLEIGH HAMPSHIRE 40 Wed 31/10/18 0.000 0.075 0.075 2.52
38 SC-03-A-04 DETACHED & TER BYFLEET SURREY 71 Thu 23/01/14 0.028 0.042 0.070 2.49
39 NY-03-A-10 HOUSES AND FLA RIPON NORTH YORKSHIRE 71 Tue 17/09/13 0.000 0.070 0.070 0.83
40 KC-03-A-07 MIXED HOUSES HERNE BAY KENT 288 Wed 27/09/17 0.028 0.028 0.056 3.09

TRICS 7.6.1 290419 B19.08 Database right of TRICS Consortium Limited, 2019. All rights reserved Tuesday 30/04/19
Page 2
Lime Transport Limited Stanwell Road Penarth Licence No: 258601
Trip Rate (Sorted by Totals) Park Spaces
Rank Site-Ref Description Town/City Area DWELLS Day Date Arrivals Departures Totals Per Dwelling
41 ES-03-A-02 PRIVATE HOUSIN PEACEHAVEN EAST SUSSEX 37 Fri 18/11/11 0.000 0.054 0.054 1.59
42 WS-03-A-04 MIXED HOUSES HORSHAM WEST SUSSEX 151 Thu 11/12/14 0.013 0.026 0.039 2.28
43 NE-03-A-02 SEMI DETACHED SCUNTHORPE NORTH EAST LINCOLNS 432 Mon 12/05/14 0.007 0.021 0.028 1.00
44 WS-03-A-10 MIXED HOUSES LITTLEHAMPTON WEST SUSSEX 79 Wed 07/11/18 0.000 0.025 0.025 2.41
45 DS-03-A-02 MIXED HOUSES DERBY DERBYSHIRE 371 Tue 10/07/18 0.000 0.024 0.024 2.92
46 ST-03-A-07 DETACHED & SEM STAFFORD STAFFORDSHIRE 248 Wed 22/11/17 0.000 0.016 0.016 3.55
47 SH-03-A-06 BUNGALOWS SHREWSBURY SHROPSHIRE 16 Thu 22/05/14 0.000 0.000 0.000 2.00
This section displays actual (not average) trip rates for each of the survey days in the selected set, and ranks them in
order of relative trip rate intensity, for a given time period (or peak period irrespective of time) selected by the user. The
count type and direction are both displayed just above the table, along with the rows within the table representing the
85th and 15th percentile trip rate figures (highlighted in bold within the table itself).
The table itself displays details of each individual survey, alongside arrivals, departures and totals trip rates, sorted by
whichever of the three directional options has been chosen by the user. As with the preceeding trip rate calculation
results table, the trip rates shown are per the calculation factor (e.g. per 100m2 GFA, per employee, per hectare, etc).
Note that if the peak period option has been selected (as opposed to a specific chosen time period), the peak period for
each individual survey day in the table is also displayed.

TRICS 7.6.1 290419 B19.08 Database right of TRICS Consortium Limited, 2019. All rights reserved Tuesday 30/04/19
Page 3
Lime Transport Limited Stanwell Road Penarth Licence No: 258601
RANK ORDER for Land Use 03 - RESIDENTIAL/A - HOUSES PRIVATELY OWNED
MULTI-MODAL PEDESTRIANS
Ranking Type: TOTALS Time Range: 17:00-18:00
15th Percentile = No. 40 DV-03-A-02 Tot: 0.034
85th Percentile = No. 8 CH-03-A-09 Tot: 0.334
Median Values Mean Values
Arrivals: 0.056 Arrivals: 0.117
Departures: 0.056 Departures: 0.070
Totals: 0.112 Totals: 0.187
Trip Rate (Sorted by Totals) Park Spaces
Rank Site-Ref Description Town/City Area DWELLS Day Date Arrivals Departures Totals Per Dwelling
1 PK-03-A-01 DETAC. & BUNGA PERTH PERTH & KINROSS 36 Wed 11/05/11 0.528 0.389 0.917 3.36
2 VG-03-A-01 S E M I - D E T A C H E D BARRY VALE OF GLAMORGAN 12 Mon 08/05/17 0.167 0.667 0.834 2.33
3 AG-03-A-01 BUNGALOWS/DET. ARBROATH ANGUS 7 Tue 22/05/12 0.714 0.000 0.714 2.71
4 NY-03-A-11 PRIVATE HOUSIN BOROUGHBRIDGE NORTH YORKSHIRE 23 Wed 18/09/13 0.348 0.087 0.435 6.26
5 KC-03-A-03 MIXED HOUSES & ASHFORD KENT 51 Thu 14/07/16 0.118 0.255 0.373 2.16
6 NY-03-A-09 MIXED HOUSING NORTHALLERTON NORTH YORKSHIRE 52 Mon 16/09/13 0.327 0.019 0.346 2.60
7 HC-03-A-20 HOUSES & FLATS LIPHOOK HAMPSHIRE 62 Tue 20/11/18 0.242 0.097 0.339 2.19
8 CH-03-A-09 TERRACED HOUSE MACCLESFIELD CHESHIRE 24 Mon 24/11/14 0.167 0.167 0.334 1.33
9 CA-03-A-04 DETACHED PETERBOROUGH CAMBRIDGESHIRE 9 Tue 18/10/11 0.333 0.000 0.333 2.44
10 DV-03-A-03 TERRACED & SEM HONITON DEVON 70 Mon 28/09/15 0.271 0.043 0.314 1.66
11 NE-03-A-03 PRIVATE HOUSES SCUNTHORPE NORTH EAST LINCOLNS 180 Tue 20/05/14 0.233 0.067 0.300 2.68
12 HC-03-A-22 MIXED HOUSES NEAR EASTLEIGH HAMPSHIRE 40 Wed 31/10/18 0.000 0.275 0.275 2.52
13 DH-03-A-01 SEMI DETACHED BISHOP AUCKLAND DURHAM 50 Tue 28/03/17 0.180 0.080 0.260 1.74
14 ES-03-A-04 MIXED HOUSES & CAMBER EAST SUSSEX 134 Fri 15/07/16 0.187 0.067 0.254 1.91
15 CB-03-A-05 DETACHED/TERRA PENRITH CUMBRIA 50 Tue 21/06/16 0.140 0.080 0.220 2.34
16 NF-03-A-01 SEMI DET. & BU CAISTER-ON-SEA NORFOLK 27 Tue 16/10/12 0.148 0.037 0.185 2.37
17 LN-03-A-03 SEMI DETACHED LINCOLN LINCOLNSHIRE 22 Tue 18/09/12 0.045 0.136 0.181 1.09
18 KC-03-A-04 S E M I - D E T A C H E D AYLESFORD KENT 110 Fri 22/09/17 0.127 0.045 0.172 1.77
19 NY-03-A-12 TOWN HOUSES NORTHALLERTON NORTH YORKSHIRE 47 Tue 27/09/16 0.128 0.043 0.171 1.66
20 FA-03-A-01 SEMI-DETACHED/ FALKIRK FALKIRK 37 Thu 30/05/13 0.135 0.027 0.162 1.41
21 WS-03-A-06 MIXED HOUSES WEST HORSHAM WEST SUSSEX 805 Thu 02/03/17 0.067 0.058 0.125 2.14
22 SH-03-A-06 BUNGALOWS SHREWSBURY SHROPSHIRE 16 Thu 22/05/14 0.000 0.125 0.125 2.00
23 PS-03-A-01 MIXED HOUSES WELSHPOOL POWYS 16 Mon 11/05/15 0.063 0.063 0.124 1.63
24 SH-03-A-05 SEMI-DETACHED/ TELFORD SHROPSHIRE 54 Thu 24/10/13 0.056 0.056 0.112 1.17
25 ES-03-A-02 PRIVATE HOUSIN PEACEHAVEN EAST SUSSEX 37 Fri 18/11/11 0.081 0.027 0.108 1.59
26 ES-03-A-03 MIXED HOUSES & POLEGATE EAST SUSSEX 212 Mon 11/07/16 0.061 0.047 0.108 1.68
27 HC-03-A-21 TERRACED & SEM BASINGSTOKE HAMPSHIRE 39 Tue 13/11/18 0.026 0.077 0.103 2.51
28 WS-03-A-08 MIXED HOUSES ANGMERING WEST SUSSEX 180 Thu 19/04/18 0.072 0.028 0.100 2.93
29 HI-03-A-14 S E M I - D E T A C H E D INVERNESS HIGHLAND 40 Wed 23/03/16 0.050 0.050 0.100 2.23
30 CH-03-A-08 DETACHED CHESTER CHESHIRE 11 Tue 22/05/12 0.091 0.000 0.091 4.73
31 WS-03-A-04 MIXED HOUSES HORSHAM WEST SUSSEX 151 Thu 11/12/14 0.033 0.046 0.079 2.28
32 WO-03-A-07 MIXED HOUSES WORCESTER WORCESTERSHIRE 146 Tue 26/06/18 0.041 0.034 0.075 4.32
33 NY-03-A-06 BUNGALOWS & SE BOROUGHBRIDGE NORTH YORKSHIRE 115 Fri 14/10/11 0.035 0.026 0.061 3.50
34 NE-03-A-02 SEMI DETACHED SCUNTHORPE NORTH EAST LINCOLNS 432 Mon 12/05/14 0.037 0.023 0.060 1.00
35 SC-03-A-04 DETACHED & TER BYFLEET SURREY 71 Thu 23/01/14 0.028 0.028 0.056 2.49
36 NY-03-A-08 TERRACED HOUSE YORK NORTH YORKSHIRE 21 Mon 16/09/13 0.048 0.000 0.048 1.14
37 NY-03-A-10 HOUSES AND FLA RIPON NORTH YORKSHIRE 71 Tue 17/09/13 0.042 0.000 0.042 0.83
38 KC-03-A-07 MIXED HOUSES HERNE BAY KENT 288 Wed 27/09/17 0.035 0.007 0.042 3.09
39 NF-03-A-02 HOUSES & FLATS NORWICH NORFOLK 98 Mon 22/10/12 0.041 0.000 0.041 2.24
40 DV-03-A-02 HOUSES & BUNGA HONITON DEVON 116 Fri 25/09/15 0.034 0.000 0.034 2.25

TRICS 7.6.1 290419 B19.08 Database right of TRICS Consortium Limited, 2019. All rights reserved Tuesday 30/04/19
Page 4
Lime Transport Limited Stanwell Road Penarth Licence No: 258601
Trip Rate (Sorted by Totals) Park Spaces
Rank Site-Ref Description Town/City Area DWELLS Day Date Arrivals Departures Totals Per Dwelling
41 DS-03-A-02 MIXED HOUSES DERBY DERBYSHIRE 371 Tue 10/07/18 0.008 0.005 0.013 2.92
42 ST-03-A-07 DETACHED & SEM STAFFORD STAFFORDSHIRE 248 Wed 22/11/17 0.008 0.000 0.008 3.55
43 WS-03-A-10 MIXED HOUSES LITTLEHAMPTON WEST SUSSEX 79 Wed 07/11/18 0.000 0.000 0.000 2.41
44 SF-03-A-05 DETACHED HOUSE BURY ST EDMUNDS SUFFOLK 18 Wed 09/09/15 0.000 0.000 0.000 4.17
45 PS-03-A-02 DETACHED/SEMI- WELSHPOOL POWYS 28 Mon 11/05/15 0.000 0.000 0.000 2.32
46 NY-03-A-13 TERRACED HOUSE CATTERICK GARRISON NORTH YORKSHIRE 10 Wed 10/05/17 0.000 0.000 0.000 1.90
47 NF-03-A-03 DETACHED HOUSE THETFORD NORFOLK 10 Wed 16/09/15 0.000 0.000 0.000 3.70
This section displays actual (not average) trip rates for each of the survey days in the selected set, and ranks them in
order of relative trip rate intensity, for a given time period (or peak period irrespective of time) selected by the user. The
count type and direction are both displayed just above the table, along with the rows within the table representing the
85th and 15th percentile trip rate figures (highlighted in bold within the table itself).
The table itself displays details of each individual survey, alongside arrivals, departures and totals trip rates, sorted by
whichever of the three directional options has been chosen by the user. As with the preceeding trip rate calculation
results table, the trip rates shown are per the calculation factor (e.g. per 100m2 GFA, per employee, per hectare, etc).
Note that if the peak period option has been selected (as opposed to a specific chosen time period), the peak period for
each individual survey day in the table is also displayed.

TRICS 7.6.1 290419 B19.08 Database right of TRICS Consortium Limited, 2019. All rights reserved Tuesday 30/04/19
Page 5
Lime Transport Limited Stanwell Road Penarth Licence No: 258601
RANK ORDER for Land Use 03 - RESIDENTIAL/A - HOUSES PRIVATELY OWNED
MULTI-MODAL PEDESTRIANS
Ranking Type: TOTALS Time Range: 07:00-19:00
15th Percentile = No. 40 NF-03-A-02 Tot: 0.582
85th Percentile = No. 8 NE-03-A-03 Tot: 2.933
Median Values Mean Values
Arrivals: 0.815 Arrivals: 0.897
Departures: 0.778 Departures: 0.903
Totals: 1.593 Totals: 1.799
Trip Rate (Sorted by Totals) Park Spaces
Rank Site-Ref Description Town/City Area DWELLS Day Date Arrivals Departures Totals Per Dwelling
1 PK-03-A-01 DETAC. & BUNGA PERTH PERTH & KINROSS 36 Wed 11/05/11 2.444 2.611 5.055 3.36
2 NY-03-A-09 MIXED HOUSING NORTHALLERTON NORTH YORKSHIRE 52 Mon 16/09/13 1.981 2.038 4.019 2.60
3 VG-03-A-01 S E M I - D E T A C H E D BARRY VALE OF GLAMORGAN 12 Mon 08/05/17 1.833 2.083 3.916 2.33
4 CA-03-A-04 DETACHED PETERBOROUGH CAMBRIDGESHIRE 9 Tue 18/10/11 1.778 1.667 3.445 2.44
5 CH-03-A-09 TERRACED HOUSE MACCLESFIELD CHESHIRE 24 Mon 24/11/14 1.625 1.625 3.250 1.33
6 CH-03-A-08 DETACHED CHESTER CHESHIRE 11 Tue 22/05/12 1.636 1.545 3.181 4.73
7 HC-03-A-20 HOUSES & FLATS LIPHOOK HAMPSHIRE 62 Tue 20/11/18 1.532 1.629 3.161 2.19
8 NE-03-A-03 PRIVATE HOUSES SCUNTHORPE NORTH EAST LINCOLNS 180 Tue 20/05/14 1.239 1.694 2.933 2.68
9 HI-03-A-14 S E M I - D E T A C H E D INVERNESS HIGHLAND 40 Wed 23/03/16 1.450 1.450 2.900 2.23
10 AG-03-A-01 BUNGALOWS/DET. ARBROATH ANGUS 7 Tue 22/05/12 1.571 1.286 2.857 2.71
11 DH-03-A-01 SEMI DETACHED BISHOP AUCKLAND DURHAM 50 Tue 28/03/17 1.420 1.400 2.820 1.74
12 NY-03-A-13 TERRACED HOUSE CATTERICK GARRISON NORTH YORKSHIRE 10 Wed 10/05/17 1.300 1.500 2.800 1.90
13 ES-03-A-04 MIXED HOUSES & CAMBER EAST SUSSEX 134 Fri 15/07/16 1.328 1.410 2.738 1.91
14 DV-03-A-03 TERRACED & SEM HONITON DEVON 70 Mon 28/09/15 1.314 1.357 2.671 1.66
15 NF-03-A-01 SEMI DET. & BU CAISTER-ON-SEA NORFOLK 27 Tue 16/10/12 1.407 1.111 2.518 2.37
16 FA-03-A-01 SEMI-DETACHED/ FALKIRK FALKIRK 37 Thu 30/05/13 1.351 1.027 2.378 1.41
17 KC-03-A-04 S E M I - D E T A C H E D AYLESFORD KENT 110 Fri 22/09/17 1.136 1.055 2.191 1.77
18 KC-03-A-03 MIXED HOUSES & ASHFORD KENT 51 Thu 14/07/16 0.980 1.059 2.039 2.16
19 NY-03-A-11 PRIVATE HOUSIN BOROUGHBRIDGE NORTH YORKSHIRE 23 Wed 18/09/13 1.000 1.000 2.000 6.26
20 CB-03-A-05 DETACHED/TERRA PENRITH CUMBRIA 50 Tue 21/06/16 1.000 0.940 1.940 2.34
21 PS-03-A-01 MIXED HOUSES WELSHPOOL POWYS 16 Mon 11/05/15 0.938 0.938 1.876 1.63
22 NF-03-A-03 DETACHED HOUSE THETFORD NORFOLK 10 Wed 16/09/15 1.000 0.800 1.800 3.70
23 NY-03-A-12 TOWN HOUSES NORTHALLERTON NORTH YORKSHIRE 47 Tue 27/09/16 0.617 1.064 1.681 1.66
24 SH-03-A-05 SEMI-DETACHED/ TELFORD SHROPSHIRE 54 Thu 24/10/13 0.815 0.778 1.593 1.17
25 LN-03-A-03 SEMI DETACHED LINCOLN LINCOLNSHIRE 22 Tue 18/09/12 0.727 0.773 1.500 1.09
26 DV-03-A-02 HOUSES & BUNGA HONITON DEVON 116 Fri 25/09/15 0.750 0.733 1.483 2.25
27 SF-03-A-05 DETACHED HOUSE BURY ST EDMUNDS SUFFOLK 18 Wed 09/09/15 0.611 0.722 1.333 4.17
28 NY-03-A-06 BUNGALOWS & SE BOROUGHBRIDGE NORTH YORKSHIRE 115 Fri 14/10/11 0.687 0.635 1.322 3.50
29 HC-03-A-22 MIXED HOUSES NEAR EASTLEIGH HAMPSHIRE 40 Wed 31/10/18 0.600 0.675 1.275 2.52
30 WS-03-A-06 MIXED HOUSES WEST HORSHAM WEST SUSSEX 805 Thu 02/03/17 0.622 0.581 1.203 2.14
31 WS-03-A-04 MIXED HOUSES HORSHAM WEST SUSSEX 151 Thu 11/12/14 0.550 0.477 1.027 2.28
32 ES-03-A-03 MIXED HOUSES & POLEGATE EAST SUSSEX 212 Mon 11/07/16 0.505 0.491 0.996 1.68
33 WS-03-A-08 MIXED HOUSES ANGMERING WEST SUSSEX 180 Thu 19/04/18 0.500 0.494 0.994 2.93
34 PS-03-A-02 DETACHED/SEMI- WELSHPOOL POWYS 28 Mon 11/05/15 0.571 0.393 0.964 2.32
35 SH-03-A-06 BUNGALOWS SHREWSBURY SHROPSHIRE 16 Thu 22/05/14 0.438 0.375 0.813 2.00
36 NY-03-A-08 TERRACED HOUSE YORK NORTH YORKSHIRE 21 Mon 16/09/13 0.381 0.333 0.714 1.14
37 WO-03-A-07 MIXED HOUSES WORCESTER WORCESTERSHIRE 146 Tue 26/06/18 0.397 0.308 0.705 4.32
38 ES-03-A-02 PRIVATE HOUSIN PEACEHAVEN EAST SUSSEX 37 Fri 18/11/11 0.351 0.297 0.648 1.59
39 HC-03-A-21 TERRACED & SEM BASINGSTOKE HAMPSHIRE 39 Tue 13/11/18 0.179 0.410 0.589 2.51
40 NF-03-A-02 HOUSES & FLATS NORWICH NORFOLK 98 Mon 22/10/12 0.235 0.347 0.582 2.24

TRICS 7.6.1 290419 B19.08 Database right of TRICS Consortium Limited, 2019. All rights reserved Tuesday 30/04/19
Page 6
Lime Transport Limited Stanwell Road Penarth Licence No: 258601
Trip Rate (Sorted by Totals) Park Spaces
Rank Site-Ref Description Town/City Area DWELLS Day Date Arrivals Departures Totals Per Dwelling
41 SC-03-A-04 DETACHED & TER BYFLEET SURREY 71 Thu 23/01/14 0.310 0.268 0.578 2.49
42 NE-03-A-02 SEMI DETACHED SCUNTHORPE NORTH EAST LINCOLNS 432 Mon 12/05/14 0.278 0.271 0.549 1.00
43 NY-03-A-10 HOUSES AND FLA RIPON NORTH YORKSHIRE 71 Tue 17/09/13 0.225 0.225 0.450 0.83
44 KC-03-A-07 MIXED HOUSES HERNE BAY KENT 288 Wed 27/09/17 0.191 0.226 0.417 3.09
45 ST-03-A-07 DETACHED & SEM STAFFORD STAFFORDSHIRE 248 Wed 22/11/17 0.133 0.105 0.238 3.55
46 DS-03-A-02 MIXED HOUSES DERBY DERBYSHIRE 371 Tue 10/07/18 0.111 0.124 0.235 2.92
47 WS-03-A-10 MIXED HOUSES LITTLEHAMPTON WEST SUSSEX 79 Wed 07/11/18 0.089 0.089 0.178 2.41
This section displays actual (not average) trip rates for each of the survey days in the selected set, and ranks them in
order of relative trip rate intensity, for a given time period (or peak period irrespective of time) selected by the user. The
count type and direction are both displayed just above the table, along with the rows within the table representing the
85th and 15th percentile trip rate figures (highlighted in bold within the table itself).
The table itself displays details of each individual survey, alongside arrivals, departures and totals trip rates, sorted by
whichever of the three directional options has been chosen by the user. As with the preceeding trip rate calculation
results table, the trip rates shown are per the calculation factor (e.g. per 100m2 GFA, per employee, per hectare, etc).
Note that if the peak period option has been selected (as opposed to a specific chosen time period), the peak period for
each individual survey day in the table is also displayed.

TRICS 7.6.1 290419 B19.08 Database right of TRICS Consortium Limited, 2019. All rights reserved Tuesday 30/04/19
Page 1
Lime Transport Limited Stanwell Road Penarth Licence No: 258601
RANK ORDER for Land Use 03 - RESIDENTIAL/A - HOUSES PRIVATELY OWNED
MULTI-MODAL PUBLIC TRANSPORT USERS
Ranking Type: TOTALS Time Range: 08:00-09:00
15th Percentile = No. 40 NY-03-A-11 Tot: 0.000
85th Percentile = No. 8 HI-03-A-14 Tot: 0.050
Median Values Mean Values
Arrivals: 0.000 Arrivals: 0.000
Departures: 0.000 Departures: 0.022
Totals: 0.000 Totals: 0.022
Trip Rate (Sorted by Totals) Park Spaces
Rank Site-Ref Description Town/City Area DWELLS Day Date Arrivals Departures Totals Per Dwelling
1 KC-03-A-04 S E M I - D E T A C H E D AYLESFORD KENT 110 Fri 22/09/17 0.000 0.173 0.173 1.77
2 PK-03-A-01 DETAC. & BUNGA PERTH PERTH & KINROSS 36 Wed 11/05/11 0.000 0.167 0.167 3.36
3 HC-03-A-20 HOUSES & FLATS LIPHOOK HAMPSHIRE 62 Tue 20/11/18 0.000 0.145 0.145 2.19
4 WO-03-A-07 MIXED HOUSES WORCESTER WORCESTERSHIRE 146 Tue 26/06/18 0.014 0.075 0.089 4.32
5 VG-03-A-01 S E M I - D E T A C H E D BARRY VALE OF GLAMORGAN 12 Mon 08/05/17 0.000 0.083 0.083 2.33
6 KC-03-A-07 MIXED HOUSES HERNE BAY KENT 288 Wed 27/09/17 0.000 0.073 0.073 3.09
7 ES-03-A-02 PRIVATE HOUSIN PEACEHAVEN EAST SUSSEX 37 Fri 18/11/11 0.000 0.054 0.054 1.59
8 HI-03-A-14 S E M I - D E T A C H E D INVERNESS HIGHLAND 40 Wed 23/03/16 0.000 0.050 0.050 2.23
9 NY-03-A-08 TERRACED HOUSE YORK NORTH YORKSHIRE 21 Mon 16/09/13 0.000 0.048 0.048 1.14
10 ES-03-A-04 MIXED HOUSES & CAMBER EAST SUSSEX 134 Fri 15/07/16 0.000 0.045 0.045 1.91
11 DH-03-A-01 SEMI DETACHED BISHOP AUCKLAND DURHAM 50 Tue 28/03/17 0.000 0.040 0.040 1.74
12 ES-03-A-03 MIXED HOUSES & POLEGATE EAST SUSSEX 212 Mon 11/07/16 0.000 0.033 0.033 1.68
13 ST-03-A-07 DETACHED & SEM STAFFORD STAFFORDSHIRE 248 Wed 22/11/17 0.000 0.020 0.020 3.55
14 DV-03-A-03 TERRACED & SEM HONITON DEVON 70 Mon 28/09/15 0.000 0.014 0.014 1.66
15 WS-03-A-06 MIXED HOUSES WEST HORSHAM WEST SUSSEX 805 Thu 02/03/17 0.000 0.011 0.011 2.14
16 NF-03-A-02 HOUSES & FLATS NORWICH NORFOLK 98 Mon 22/10/12 0.000 0.010 0.010 2.24
17 WS-03-A-08 MIXED HOUSES ANGMERING WEST SUSSEX 180 Thu 19/04/18 0.000 0.000 0.000 2.93
18 WS-03-A-04 MIXED HOUSES HORSHAM WEST SUSSEX 151 Thu 11/12/14 0.000 0.000 0.000 2.28
19 SC-03-A-04 DETACHED & TER BYFLEET SURREY 71 Thu 23/01/14 0.000 0.000 0.000 2.49
20 PS-03-A-02 DETACHED/SEMI- WELSHPOOL POWYS 28 Mon 11/05/15 0.000 0.000 0.000 2.32
21 NY-03-A-13 TERRACED HOUSE CATTERICK GARRISON NORTH YORKSHIRE 10 Wed 10/05/17 0.000 0.000 0.000 1.90
22 NY-03-A-12 TOWN HOUSES NORTHALLERTON NORTH YORKSHIRE 47 Tue 27/09/16 0.000 0.000 0.000 1.66
23 NY-03-A-10 HOUSES AND FLA RIPON NORTH YORKSHIRE 71 Tue 17/09/13 0.000 0.000 0.000 0.83
24 NY-03-A-09 MIXED HOUSING NORTHALLERTON NORTH YORKSHIRE 52 Mon 16/09/13 0.000 0.000 0.000 2.60
25 NF-03-A-03 DETACHED HOUSE THETFORD NORFOLK 10 Wed 16/09/15 0.000 0.000 0.000 3.70
26 NF-03-A-01 SEMI DET. & BU CAISTER-ON-SEA NORFOLK 27 Tue 16/10/12 0.000 0.000 0.000 2.37
27 NE-03-A-02 SEMI DETACHED SCUNTHORPE NORTH EAST LINCOLNS 432 Mon 12/05/14 0.000 0.000 0.000 1.00
28 LN-03-A-03 SEMI DETACHED LINCOLN LINCOLNSHIRE 22 Tue 18/09/12 0.000 0.000 0.000 1.09
29 KC-03-A-03 MIXED HOUSES & ASHFORD KENT 51 Thu 14/07/16 0.000 0.000 0.000 2.16
30 HC-03-A-22 MIXED HOUSES NEAR EASTLEIGH HAMPSHIRE 40 Wed 31/10/18 0.000 0.000 0.000 2.52
31 HC-03-A-21 TERRACED & SEM BASINGSTOKE HAMPSHIRE 39 Tue 13/11/18 0.000 0.000 0.000 2.51
32 DV-03-A-02 HOUSES & BUNGA HONITON DEVON 116 Fri 25/09/15 0.000 0.000 0.000 2.25
33 DS-03-A-02 MIXED HOUSES DERBY DERBYSHIRE 371 Tue 10/07/18 0.000 0.000 0.000 2.92
34 CB-03-A-05 DETACHED/TERRA PENRITH CUMBRIA 50 Tue 21/06/16 0.000 0.000 0.000 2.34
35 WS-03-A-10 MIXED HOUSES LITTLEHAMPTON WEST SUSSEX 79 Wed 07/11/18 0.000 0.000 0.000 2.41
36 SH-03-A-06 BUNGALOWS SHREWSBURY SHROPSHIRE 16 Thu 22/05/14 0.000 0.000 0.000 2.00
37 SH-03-A-05 SEMI-DETACHED/ TELFORD SHROPSHIRE 54 Thu 24/10/13 0.000 0.000 0.000 1.17
38 SF-03-A-05 DETACHED HOUSE BURY ST EDMUNDS SUFFOLK 18 Wed 09/09/15 0.000 0.000 0.000 4.17
39 PS-03-A-01 MIXED HOUSES WELSHPOOL POWYS 16 Mon 11/05/15 0.000 0.000 0.000 1.63
40 NY-03-A-11 PRIVATE HOUSIN BOROUGHBRIDGE NORTH YORKSHIRE 23 Wed 18/09/13 0.000 0.000 0.000 6.26

TRICS 7.6.1 290419 B19.08 Database right of TRICS Consortium Limited, 2019. All rights reserved Tuesday 30/04/19
Page 2
Lime Transport Limited Stanwell Road Penarth Licence No: 258601
Trip Rate (Sorted by Totals) Park Spaces
Rank Site-Ref Description Town/City Area DWELLS Day Date Arrivals Departures Totals Per Dwelling
41 NY-03-A-06 BUNGALOWS & SE BOROUGHBRIDGE NORTH YORKSHIRE 115 Fri 14/10/11 0.000 0.000 0.000 3.50
42 NE-03-A-03 PRIVATE HOUSES SCUNTHORPE NORTH EAST LINCOLNS 180 Tue 20/05/14 0.000 0.000 0.000 2.68
43 FA-03-A-01 SEMI-DETACHED/ FALKIRK FALKIRK 37 Thu 30/05/13 0.000 0.000 0.000 1.41
44 CH-03-A-09 TERRACED HOUSE MACCLESFIELD CHESHIRE 24 Mon 24/11/14 0.000 0.000 0.000 1.33
45 CH-03-A-08 DETACHED CHESTER CHESHIRE 11 Tue 22/05/12 0.000 0.000 0.000 4.73
46 CA-03-A-04 DETACHED PETERBOROUGH CAMBRIDGESHIRE 9 Tue 18/10/11 0.000 0.000 0.000 2.44
47 AG-03-A-01 BUNGALOWS/DET. ARBROATH ANGUS 7 Tue 22/05/12 0.000 0.000 0.000 2.71
This section displays actual (not average) trip rates for each of the survey days in the selected set, and ranks them in
order of relative trip rate intensity, for a given time period (or peak period irrespective of time) selected by the user. The
count type and direction are both displayed just above the table, along with the rows within the table representing the
85th and 15th percentile trip rate figures (highlighted in bold within the table itself).
The table itself displays details of each individual survey, alongside arrivals, departures and totals trip rates, sorted by
whichever of the three directional options has been chosen by the user. As with the preceeding trip rate calculation
results table, the trip rates shown are per the calculation factor (e.g. per 100m2 GFA, per employee, per hectare, etc).
Note that if the peak period option has been selected (as opposed to a specific chosen time period), the peak period for
each individual survey day in the table is also displayed.

TRICS 7.6.1 290419 B19.08 Database right of TRICS Consortium Limited, 2019. All rights reserved Tuesday 30/04/19
Page 3
Lime Transport Limited Stanwell Road Penarth Licence No: 258601
RANK ORDER for Land Use 03 - RESIDENTIAL/A - HOUSES PRIVATELY OWNED
MULTI-MODAL PUBLIC TRANSPORT USERS
Ranking Type: TOTALS Time Range: 17:00-18:00
15th Percentile = No. 40 NY-03-A-11 Tot: 0.000
85th Percentile = No. 8 DH-03-A-01 Tot: 0.040
Median Values Mean Values
Arrivals: 0.000 Arrivals: 0.014
Departures: 0.000 Departures: 0.009
Totals: 0.000 Totals: 0.023
Trip Rate (Sorted by Totals) Park Spaces
Rank Site-Ref Description Town/City Area DWELLS Day Date Arrivals Departures Totals Per Dwelling
1 NY-03-A-13 TERRACED HOUSE CATTERICK GARRISON NORTH YORKSHIRE 10 Wed 10/05/17 0.000 0.200 0.200 1.90
2 VG-03-A-01 S E M I - D E T A C H E D BARRY VALE OF GLAMORGAN 12 Mon 08/05/17 0.083 0.083 0.166 2.33
3 PK-03-A-01 DETAC. & BUNGA PERTH PERTH & KINROSS 36 Wed 11/05/11 0.111 0.028 0.139 3.36
4 WO-03-A-07 MIXED HOUSES WORCESTER WORCESTERSHIRE 146 Tue 26/06/18 0.048 0.021 0.069 4.32
5 NF-03-A-02 HOUSES & FLATS NORWICH NORFOLK 98 Mon 22/10/12 0.051 0.010 0.061 2.24
6 ES-03-A-02 PRIVATE HOUSIN PEACEHAVEN EAST SUSSEX 37 Fri 18/11/11 0.054 0.000 0.054 1.59
7 NY-03-A-08 TERRACED HOUSE YORK NORTH YORKSHIRE 21 Mon 16/09/13 0.048 0.000 0.048 1.14
8 DH-03-A-01 SEMI DETACHED BISHOP AUCKLAND DURHAM 50 Tue 28/03/17 0.020 0.020 0.040 1.74
9 PS-03-A-02 DETACHED/SEMI- WELSHPOOL POWYS 28 Mon 11/05/15 0.000 0.036 0.036 2.32
10 KC-03-A-07 MIXED HOUSES HERNE BAY KENT 288 Wed 27/09/17 0.024 0.010 0.034 3.09
11 HC-03-A-20 HOUSES & FLATS LIPHOOK HAMPSHIRE 62 Tue 20/11/18 0.032 0.000 0.032 2.19
12 DV-03-A-03 TERRACED & SEM HONITON DEVON 70 Mon 28/09/15 0.029 0.000 0.029 1.66
13 ES-03-A-03 MIXED HOUSES & POLEGATE EAST SUSSEX 212 Mon 11/07/16 0.028 0.000 0.028 1.68
14 HC-03-A-22 MIXED HOUSES NEAR EASTLEIGH HAMPSHIRE 40 Wed 31/10/18 0.025 0.000 0.025 2.52
15 NY-03-A-09 MIXED HOUSING NORTHALLERTON NORTH YORKSHIRE 52 Mon 16/09/13 0.019 0.000 0.019 2.60
16 KC-03-A-04 S E M I - D E T A C H E D AYLESFORD KENT 110 Fri 22/09/17 0.018 0.000 0.018 1.77
17 WS-03-A-06 MIXED HOUSES WEST HORSHAM WEST SUSSEX 805 Thu 02/03/17 0.017 0.000 0.017 2.14
18 ST-03-A-07 DETACHED & SEM STAFFORD STAFFORDSHIRE 248 Wed 22/11/17 0.016 0.000 0.016 3.55
19 SC-03-A-04 DETACHED & TER BYFLEET SURREY 71 Thu 23/01/14 0.014 0.000 0.014 2.49
20 ES-03-A-04 MIXED HOUSES & CAMBER EAST SUSSEX 134 Fri 15/07/16 0.007 0.007 0.014 1.91
21 NE-03-A-02 SEMI DETACHED SCUNTHORPE NORTH EAST LINCOLNS 432 Mon 12/05/14 0.002 0.002 0.004 1.00
22 WS-03-A-08 MIXED HOUSES ANGMERING WEST SUSSEX 180 Thu 19/04/18 0.000 0.000 0.000 2.93
23 WS-03-A-04 MIXED HOUSES HORSHAM WEST SUSSEX 151 Thu 11/12/14 0.000 0.000 0.000 2.28
24 NY-03-A-12 TOWN HOUSES NORTHALLERTON NORTH YORKSHIRE 47 Tue 27/09/16 0.000 0.000 0.000 1.66
25 NY-03-A-10 HOUSES AND FLA RIPON NORTH YORKSHIRE 71 Tue 17/09/13 0.000 0.000 0.000 0.83
26 NF-03-A-03 DETACHED HOUSE THETFORD NORFOLK 10 Wed 16/09/15 0.000 0.000 0.000 3.70
27 NF-03-A-01 SEMI DET. & BU CAISTER-ON-SEA NORFOLK 27 Tue 16/10/12 0.000 0.000 0.000 2.37
28 LN-03-A-03 SEMI DETACHED LINCOLN LINCOLNSHIRE 22 Tue 18/09/12 0.000 0.000 0.000 1.09
29 KC-03-A-03 MIXED HOUSES & ASHFORD KENT 51 Thu 14/07/16 0.000 0.000 0.000 2.16
30 HI-03-A-14 S E M I - D E T A C H E D INVERNESS HIGHLAND 40 Wed 23/03/16 0.000 0.000 0.000 2.23
31 HC-03-A-21 TERRACED & SEM BASINGSTOKE HAMPSHIRE 39 Tue 13/11/18 0.000 0.000 0.000 2.51
32 DV-03-A-02 HOUSES & BUNGA HONITON DEVON 116 Fri 25/09/15 0.000 0.000 0.000 2.25
33 DS-03-A-02 MIXED HOUSES DERBY DERBYSHIRE 371 Tue 10/07/18 0.000 0.000 0.000 2.92
34 CB-03-A-05 DETACHED/TERRA PENRITH CUMBRIA 50 Tue 21/06/16 0.000 0.000 0.000 2.34
35 WS-03-A-10 MIXED HOUSES LITTLEHAMPTON WEST SUSSEX 79 Wed 07/11/18 0.000 0.000 0.000 2.41
36 SH-03-A-06 BUNGALOWS SHREWSBURY SHROPSHIRE 16 Thu 22/05/14 0.000 0.000 0.000 2.00
37 SH-03-A-05 SEMI-DETACHED/ TELFORD SHROPSHIRE 54 Thu 24/10/13 0.000 0.000 0.000 1.17
38 SF-03-A-05 DETACHED HOUSE BURY ST EDMUNDS SUFFOLK 18 Wed 09/09/15 0.000 0.000 0.000 4.17
39 PS-03-A-01 MIXED HOUSES WELSHPOOL POWYS 16 Mon 11/05/15 0.000 0.000 0.000 1.63
40 NY-03-A-11 PRIVATE HOUSIN BOROUGHBRIDGE NORTH YORKSHIRE 23 Wed 18/09/13 0.000 0.000 0.000 6.26

TRICS 7.6.1 290419 B19.08 Database right of TRICS Consortium Limited, 2019. All rights reserved Tuesday 30/04/19
Page 4
Lime Transport Limited Stanwell Road Penarth Licence No: 258601
Trip Rate (Sorted by Totals) Park Spaces
Rank Site-Ref Description Town/City Area DWELLS Day Date Arrivals Departures Totals Per Dwelling
41 NY-03-A-06 BUNGALOWS & SE BOROUGHBRIDGE NORTH YORKSHIRE 115 Fri 14/10/11 0.000 0.000 0.000 3.50
42 NE-03-A-03 PRIVATE HOUSES SCUNTHORPE NORTH EAST LINCOLNS 180 Tue 20/05/14 0.000 0.000 0.000 2.68
43 FA-03-A-01 SEMI-DETACHED/ FALKIRK FALKIRK 37 Thu 30/05/13 0.000 0.000 0.000 1.41
44 CH-03-A-09 TERRACED HOUSE MACCLESFIELD CHESHIRE 24 Mon 24/11/14 0.000 0.000 0.000 1.33
45 CH-03-A-08 DETACHED CHESTER CHESHIRE 11 Tue 22/05/12 0.000 0.000 0.000 4.73
46 CA-03-A-04 DETACHED PETERBOROUGH CAMBRIDGESHIRE 9 Tue 18/10/11 0.000 0.000 0.000 2.44
47 AG-03-A-01 BUNGALOWS/DET. ARBROATH ANGUS 7 Tue 22/05/12 0.000 0.000 0.000 2.71
This section displays actual (not average) trip rates for each of the survey days in the selected set, and ranks them in
order of relative trip rate intensity, for a given time period (or peak period irrespective of time) selected by the user. The
count type and direction are both displayed just above the table, along with the rows within the table representing the
85th and 15th percentile trip rate figures (highlighted in bold within the table itself).
The table itself displays details of each individual survey, alongside arrivals, departures and totals trip rates, sorted by
whichever of the three directional options has been chosen by the user. As with the preceeding trip rate calculation
results table, the trip rates shown are per the calculation factor (e.g. per 100m2 GFA, per employee, per hectare, etc).
Note that if the peak period option has been selected (as opposed to a specific chosen time period), the peak period for
each individual survey day in the table is also displayed.

TRICS 7.6.1 290419 B19.08 Database right of TRICS Consortium Limited, 2019. All rights reserved Tuesday 30/04/19
Page 5
Lime Transport Limited Stanwell Road Penarth Licence No: 258601
RANK ORDER for Land Use 03 - RESIDENTIAL/A - HOUSES PRIVATELY OWNED
MULTI-MODAL PUBLIC TRANSPORT USERS
Ranking Type: TOTALS Time Range: 07:00-19:00
15th Percentile = No. 40 NY-03-A-11 Tot: 0.000
85th Percentile = No. 8 HC-03-A-20 Tot: 0.371
Median Values Mean Values
Arrivals: 0.030 Arrivals: 0.102
Departures: 0.090 Departures: 0.109
Totals: 0.120 Totals: 0.211
Trip Rate (Sorted by Totals) Park Spaces
Rank Site-Ref Description Town/City Area DWELLS Day Date Arrivals Departures Totals Per Dwelling
1 PK-03-A-01 DETAC. & BUNGA PERTH PERTH & KINROSS 36 Wed 11/05/11 0.722 0.722 1.444 3.36
2 VG-03-A-01 S E M I - D E T A C H E D BARRY VALE OF GLAMORGAN 12 Mon 08/05/17 0.667 0.667 1.334 2.33
3 WO-03-A-07 MIXED HOUSES WORCESTER WORCESTERSHIRE 146 Tue 26/06/18 0.349 0.342 0.691 4.32
4 KC-03-A-04 S E M I - D E T A C H E D AYLESFORD KENT 110 Fri 22/09/17 0.318 0.318 0.636 1.77
5 NY-03-A-13 TERRACED HOUSE CATTERICK GARRISON NORTH YORKSHIRE 10 Wed 10/05/17 0.300 0.300 0.600 1.90
6 ES-03-A-02 PRIVATE HOUSIN PEACEHAVEN EAST SUSSEX 37 Fri 18/11/11 0.216 0.270 0.486 1.59
7 KC-03-A-07 MIXED HOUSES HERNE BAY KENT 288 Wed 27/09/17 0.174 0.198 0.372 3.09
8 HC-03-A-20 HOUSES & FLATS LIPHOOK HAMPSHIRE 62 Tue 20/11/18 0.113 0.258 0.371 2.19
9 DH-03-A-01 SEMI DETACHED BISHOP AUCKLAND DURHAM 50 Tue 28/03/17 0.180 0.160 0.340 1.74
10 DV-03-A-03 TERRACED & SEM HONITON DEVON 70 Mon 28/09/15 0.100 0.229 0.329 1.66
11 ES-03-A-03 MIXED HOUSES & POLEGATE EAST SUSSEX 212 Mon 11/07/16 0.156 0.170 0.326 1.68
12 KC-03-A-03 MIXED HOUSES & ASHFORD KENT 51 Thu 14/07/16 0.118 0.137 0.255 2.16
13 HI-03-A-14 S E M I - D E T A C H E D INVERNESS HIGHLAND 40 Wed 23/03/16 0.125 0.125 0.250 2.23
14 PS-03-A-02 DETACHED/SEMI- WELSHPOOL POWYS 28 Mon 11/05/15 0.107 0.107 0.214 2.32
15 NY-03-A-09 MIXED HOUSING NORTHALLERTON NORTH YORKSHIRE 52 Mon 16/09/13 0.096 0.096 0.192 2.60
16 NY-03-A-08 TERRACED HOUSE YORK NORTH YORKSHIRE 21 Mon 16/09/13 0.095 0.095 0.190 1.14
17 HC-03-A-21 TERRACED & SEM BASINGSTOKE HAMPSHIRE 39 Tue 13/11/18 0.128 0.051 0.179 2.51
18 HC-03-A-22 MIXED HOUSES NEAR EASTLEIGH HAMPSHIRE 40 Wed 31/10/18 0.075 0.100 0.175 2.52
19 ST-03-A-07 DETACHED & SEM STAFFORD STAFFORDSHIRE 248 Wed 22/11/17 0.085 0.085 0.170 3.55
20 NY-03-A-12 TOWN HOUSES NORTHALLERTON NORTH YORKSHIRE 47 Tue 27/09/16 0.064 0.106 0.170 1.66
21 NF-03-A-02 HOUSES & FLATS NORWICH NORFOLK 98 Mon 22/10/12 0.102 0.061 0.163 2.24
22 WS-03-A-08 MIXED HOUSES ANGMERING WEST SUSSEX 180 Thu 19/04/18 0.061 0.094 0.155 2.93
23 CB-03-A-05 DETACHED/TERRA PENRITH CUMBRIA 50 Tue 21/06/16 0.080 0.060 0.140 2.34
24 ES-03-A-04 MIXED HOUSES & CAMBER EAST SUSSEX 134 Fri 15/07/16 0.030 0.090 0.120 1.91
25 WS-03-A-06 MIXED HOUSES WEST HORSHAM WEST SUSSEX 805 Thu 02/03/17 0.058 0.052 0.110 2.14
26 NF-03-A-03 DETACHED HOUSE THETFORD NORFOLK 10 Wed 16/09/15 0.100 0.000 0.100 3.70
27 LN-03-A-03 SEMI DETACHED LINCOLN LINCOLNSHIRE 22 Tue 18/09/12 0.045 0.045 0.090 1.09
28 SC-03-A-04 DETACHED & TER BYFLEET SURREY 71 Thu 23/01/14 0.042 0.042 0.084 2.49
29 DS-03-A-02 MIXED HOUSES DERBY DERBYSHIRE 371 Tue 10/07/18 0.040 0.024 0.064 2.92
30 DV-03-A-02 HOUSES & BUNGA HONITON DEVON 116 Fri 25/09/15 0.009 0.043 0.052 2.25
31 NE-03-A-02 SEMI DETACHED SCUNTHORPE NORTH EAST LINCOLNS 432 Mon 12/05/14 0.028 0.016 0.044 1.00
32 NF-03-A-01 SEMI DET. & BU CAISTER-ON-SEA NORFOLK 27 Tue 16/10/12 0.000 0.037 0.037 2.37
33 NY-03-A-10 HOUSES AND FLA RIPON NORTH YORKSHIRE 71 Tue 17/09/13 0.014 0.014 0.028 0.83
34 WS-03-A-04 MIXED HOUSES HORSHAM WEST SUSSEX 151 Thu 11/12/14 0.007 0.007 0.014 2.28
35 WS-03-A-10 MIXED HOUSES LITTLEHAMPTON WEST SUSSEX 79 Wed 07/11/18 0.000 0.000 0.000 2.41
36 SH-03-A-06 BUNGALOWS SHREWSBURY SHROPSHIRE 16 Thu 22/05/14 0.000 0.000 0.000 2.00
37 SH-03-A-05 SEMI-DETACHED/ TELFORD SHROPSHIRE 54 Thu 24/10/13 0.000 0.000 0.000 1.17
38 SF-03-A-05 DETACHED HOUSE BURY ST EDMUNDS SUFFOLK 18 Wed 09/09/15 0.000 0.000 0.000 4.17
39 PS-03-A-01 MIXED HOUSES WELSHPOOL POWYS 16 Mon 11/05/15 0.000 0.000 0.000 1.63
40 NY-03-A-11 PRIVATE HOUSIN BOROUGHBRIDGE NORTH YORKSHIRE 23 Wed 18/09/13 0.000 0.000 0.000 6.26

TRICS 7.6.1 290419 B19.08 Database right of TRICS Consortium Limited, 2019. All rights reserved Tuesday 30/04/19
Page 6
Lime Transport Limited Stanwell Road Penarth Licence No: 258601
Trip Rate (Sorted by Totals) Park Spaces
Rank Site-Ref Description Town/City Area DWELLS Day Date Arrivals Departures Totals Per Dwelling
41 NY-03-A-06 BUNGALOWS & SE BOROUGHBRIDGE NORTH YORKSHIRE 115 Fri 14/10/11 0.000 0.000 0.000 3.50
42 NE-03-A-03 PRIVATE HOUSES SCUNTHORPE NORTH EAST LINCOLNS 180 Tue 20/05/14 0.000 0.000 0.000 2.68
43 FA-03-A-01 SEMI-DETACHED/ FALKIRK FALKIRK 37 Thu 30/05/13 0.000 0.000 0.000 1.41
44 CH-03-A-09 TERRACED HOUSE MACCLESFIELD CHESHIRE 24 Mon 24/11/14 0.000 0.000 0.000 1.33
45 CH-03-A-08 DETACHED CHESTER CHESHIRE 11 Tue 22/05/12 0.000 0.000 0.000 4.73
46 CA-03-A-04 DETACHED PETERBOROUGH CAMBRIDGESHIRE 9 Tue 18/10/11 0.000 0.000 0.000 2.44
47 AG-03-A-01 BUNGALOWS/DET. ARBROATH ANGUS 7 Tue 22/05/12 0.000 0.000 0.000 2.71
This section displays actual (not average) trip rates for each of the survey days in the selected set, and ranks them in
order of relative trip rate intensity, for a given time period (or peak period irrespective of time) selected by the user. The
count type and direction are both displayed just above the table, along with the rows within the table representing the
85th and 15th percentile trip rate figures (highlighted in bold within the table itself).
The table itself displays details of each individual survey, alongside arrivals, departures and totals trip rates, sorted by
whichever of the three directional options has been chosen by the user. As with the preceeding trip rate calculation
results table, the trip rates shown are per the calculation factor (e.g. per 100m2 GFA, per employee, per hectare, etc).
Note that if the peak period option has been selected (as opposed to a specific chosen time period), the peak period for
each individual survey day in the table is also displayed.

TRICS 7.6.1 290419 B19.08 Database right of TRICS Consortium Limited, 2019. All rights reserved Tuesday 30/04/19
Page 1
Lime Transport Limited Stanwell Road Penarth Licence No: 258601
RANK ORDER for Land Use 03 - RESIDENTIAL/A - HOUSES PRIVATELY OWNED
MULTI-MODAL TOTAL PEOPLE
Ranking Type: TOTALS Time Range: 08:00-09:00
15th Percentile = No. 40 SF-03-A-05 Tot: 0.611
85th Percentile = No. 8 HI-03-A-14 Tot: 1.425
Median Values Mean Values
Arrivals: 0.268 Arrivals: 0.221
Departures: 0.606 Departures: 0.763
Totals: 0.874 Totals: 0.984
Trip Rate (Sorted by Totals) Park Spaces
Rank Site-Ref Description Town/City Area DWELLS Day Date Arrivals Departures Totals Per Dwelling
1 PK-03-A-01 DETAC. & BUNGA PERTH PERTH & KINROSS 36 Wed 11/05/11 1.111 1.472 2.583 3.36
2 VG-03-A-01 S E M I - D E T A C H E D BARRY VALE OF GLAMORGAN 12 Mon 08/05/17 0.583 1.333 1.916 2.33
3 KC-03-A-04 S E M I - D E T A C H E D AYLESFORD KENT 110 Fri 22/09/17 0.382 1.500 1.882 1.77
4 CA-03-A-04 DETACHED PETERBOROUGH CAMBRIDGESHIRE 9 Tue 18/10/11 0.000 1.556 1.556 2.44
5 KC-03-A-07 MIXED HOUSES HERNE BAY KENT 288 Wed 27/09/17 0.451 1.073 1.524 3.09
6 NY-03-A-11 PRIVATE HOUSIN BOROUGHBRIDGE NORTH YORKSHIRE 23 Wed 18/09/13 0.130 1.348 1.478 6.26
7 KC-03-A-03 MIXED HOUSES & ASHFORD KENT 51 Thu 14/07/16 0.255 1.196 1.451 2.16
8 HI-03-A-14 S E M I - D E T A C H E D INVERNESS HIGHLAND 40 Wed 23/03/16 0.225 1.200 1.425 2.23
9 DV-03-A-03 TERRACED & SEM HONITON DEVON 70 Mon 28/09/15 0.243 1.157 1.400 1.66
10 CH-03-A-08 DETACHED CHESTER CHESHIRE 11 Tue 22/05/12 0.182 1.182 1.364 4.73
11 FA-03-A-01 SEMI-DETACHED/ FALKIRK FALKIRK 37 Thu 30/05/13 0.324 1.000 1.324 1.41
12 NY-03-A-10 HOUSES AND FLA RIPON NORTH YORKSHIRE 71 Tue 17/09/13 0.254 0.986 1.240 0.83
13 HC-03-A-20 HOUSES & FLATS LIPHOOK HAMPSHIRE 62 Tue 20/11/18 0.242 0.968 1.210 2.19
14 CH-03-A-09 TERRACED HOUSE MACCLESFIELD CHESHIRE 24 Mon 24/11/14 0.333 0.833 1.166 1.33
15 CB-03-A-05 DETACHED/TERRA PENRITH CUMBRIA 50 Tue 21/06/16 0.200 0.920 1.120 2.34
16 WS-03-A-06 MIXED HOUSES WEST HORSHAM WEST SUSSEX 805 Thu 02/03/17 0.202 0.904 1.106 2.14
17 ES-03-A-03 MIXED HOUSES & POLEGATE EAST SUSSEX 212 Mon 11/07/16 0.184 0.910 1.094 1.68
18 NE-03-A-03 PRIVATE HOUSES SCUNTHORPE NORTH EAST LINCOLNS 180 Tue 20/05/14 0.189 0.889 1.078 2.68
19 NY-03-A-09 MIXED HOUSING NORTHALLERTON NORTH YORKSHIRE 52 Mon 16/09/13 0.327 0.750 1.077 2.60
20 PS-03-A-02 DETACHED/SEMI- WELSHPOOL POWYS 28 Mon 11/05/15 0.357 0.643 1.000 2.32
21 ST-03-A-07 DETACHED & SEM STAFFORD STAFFORDSHIRE 248 Wed 22/11/17 0.145 0.839 0.984 3.55
22 NY-03-A-13 TERRACED HOUSE CATTERICK GARRISON NORTH YORKSHIRE 10 Wed 10/05/17 0.200 0.700 0.900 1.90
23 HC-03-A-21 TERRACED & SEM BASINGSTOKE HAMPSHIRE 39 Tue 13/11/18 0.154 0.744 0.898 2.51
24 SC-03-A-04 DETACHED & TER BYFLEET SURREY 71 Thu 23/01/14 0.268 0.606 0.874 2.49
25 WS-03-A-08 MIXED HOUSES ANGMERING WEST SUSSEX 180 Thu 19/04/18 0.133 0.739 0.872 2.93
26 AG-03-A-01 BUNGALOWS/DET. ARBROATH ANGUS 7 Tue 22/05/12 0.286 0.571 0.857 2.71
27 NF-03-A-01 SEMI DET. & BU CAISTER-ON-SEA NORFOLK 27 Tue 16/10/12 0.296 0.556 0.852 2.37
28 NY-03-A-08 TERRACED HOUSE YORK NORTH YORKSHIRE 21 Mon 16/09/13 0.048 0.762 0.810 1.14
29 NF-03-A-02 HOUSES & FLATS NORWICH NORFOLK 98 Mon 22/10/12 0.173 0.633 0.806 2.24
30 SH-03-A-05 SEMI-DETACHED/ TELFORD SHROPSHIRE 54 Thu 24/10/13 0.222 0.574 0.796 1.17
31 LN-03-A-03 SEMI DETACHED LINCOLN LINCOLNSHIRE 22 Tue 18/09/12 0.091 0.682 0.773 1.09
32 PS-03-A-01 MIXED HOUSES WELSHPOOL POWYS 16 Mon 11/05/15 0.375 0.375 0.750 1.63
33 DS-03-A-02 MIXED HOUSES DERBY DERBYSHIRE 371 Tue 10/07/18 0.105 0.636 0.741 2.92
34 ES-03-A-02 PRIVATE HOUSIN PEACEHAVEN EAST SUSSEX 37 Fri 18/11/11 0.108 0.622 0.730 1.59
35 NY-03-A-06 BUNGALOWS & SE BOROUGHBRIDGE NORTH YORKSHIRE 115 Fri 14/10/11 0.157 0.539 0.696 3.50
36 DV-03-A-02 HOUSES & BUNGA HONITON DEVON 116 Fri 25/09/15 0.129 0.534 0.663 2.25
37 NY-03-A-12 TOWN HOUSES NORTHALLERTON NORTH YORKSHIRE 47 Tue 27/09/16 0.213 0.447 0.660 1.66
38 HC-03-A-22 MIXED HOUSES NEAR EASTLEIGH HAMPSHIRE 40 Wed 31/10/18 0.075 0.575 0.650 2.52
39 WS-03-A-04 MIXED HOUSES HORSHAM WEST SUSSEX 151 Thu 11/12/14 0.172 0.457 0.629 2.28
40 SF-03-A-05 DETACHED HOUSE BURY ST EDMUNDS SUFFOLK 18 Wed 09/09/15 0.167 0.444 0.611 4.17

TRICS 7.6.1 290419 B19.08 Database right of TRICS Consortium Limited, 2019. All rights reserved Tuesday 30/04/19
Page 2
Lime Transport Limited Stanwell Road Penarth Licence No: 258601
Trip Rate (Sorted by Totals) Park Spaces
Rank Site-Ref Description Town/City Area DWELLS Day Date Arrivals Departures Totals Per Dwelling
41 NE-03-A-02 SEMI DETACHED SCUNTHORPE NORTH EAST LINCOLNS 432 Mon 12/05/14 0.079 0.507 0.586 1.00
42 WS-03-A-10 MIXED HOUSES LITTLEHAMPTON WEST SUSSEX 79 Wed 07/11/18 0.101 0.380 0.481 2.41
43 WO-03-A-07 MIXED HOUSES WORCESTER WORCESTERSHIRE 146 Tue 26/06/18 0.164 0.301 0.465 4.32
44 ES-03-A-04 MIXED HOUSES & CAMBER EAST SUSSEX 134 Fri 15/07/16 0.082 0.328 0.410 1.91
45 DH-03-A-01 SEMI DETACHED BISHOP AUCKLAND DURHAM 50 Tue 28/03/17 0.080 0.260 0.340 1.74
46 NF-03-A-03 DETACHED HOUSE THETFORD NORFOLK 10 Wed 16/09/15 0.200 0.100 0.300 3.70
47 SH-03-A-06 BUNGALOWS SHREWSBURY SHROPSHIRE 16 Thu 22/05/14 0.000 0.125 0.125 2.00
This section displays actual (not average) trip rates for each of the survey days in the selected set, and ranks them in
order of relative trip rate intensity, for a given time period (or peak period irrespective of time) selected by the user. The
count type and direction are both displayed just above the table, along with the rows within the table representing the
85th and 15th percentile trip rate figures (highlighted in bold within the table itself).
The table itself displays details of each individual survey, alongside arrivals, departures and totals trip rates, sorted by
whichever of the three directional options has been chosen by the user. As with the preceeding trip rate calculation
results table, the trip rates shown are per the calculation factor (e.g. per 100m2 GFA, per employee, per hectare, etc).
Note that if the peak period option has been selected (as opposed to a specific chosen time period), the peak period for
each individual survey day in the table is also displayed.

TRICS 7.6.1 290419 B19.08 Database right of TRICS Consortium Limited, 2019. All rights reserved Tuesday 30/04/19
Page 3
Lime Transport Limited Stanwell Road Penarth Licence No: 258601
RANK ORDER for Land Use 03 - RESIDENTIAL/A - HOUSES PRIVATELY OWNED
MULTI-MODAL TOTAL PEOPLE
Ranking Type: TOTALS Time Range: 17:00-18:00
15th Percentile = No. 40 NE-03-A-02 Tot: 0.609
85th Percentile = No. 8 KC-03-A-07 Tot: 1.271
Median Values Mean Values
Arrivals: 0.700 Arrivals: 0.628
Departures: 0.127 Departures: 0.306
Totals: 0.827 Totals: 0.934
Trip Rate (Sorted by Totals) Park Spaces
Rank Site-Ref Description Town/City Area DWELLS Day Date Arrivals Departures Totals Per Dwelling
1 PK-03-A-01 DETAC. & BUNGA PERTH PERTH & KINROSS 36 Wed 11/05/11 1.444 1.194 2.638 3.36
2 AG-03-A-01 BUNGALOWS/DET. ARBROATH ANGUS 7 Tue 22/05/12 1.429 0.571 2.000 2.71
3 VG-03-A-01 S E M I - D E T A C H E D BARRY VALE OF GLAMORGAN 12 Mon 08/05/17 0.750 1.083 1.833 2.33
4 KC-03-A-03 MIXED HOUSES & ASHFORD KENT 51 Thu 14/07/16 0.941 0.745 1.686 2.16
5 CH-03-A-09 TERRACED HOUSE MACCLESFIELD CHESHIRE 24 Mon 24/11/14 0.958 0.625 1.583 1.33
6 NY-03-A-11 PRIVATE HOUSIN BOROUGHBRIDGE NORTH YORKSHIRE 23 Wed 18/09/13 1.304 0.261 1.565 6.26
7 CB-03-A-05 DETACHED/TERRA PENRITH CUMBRIA 50 Tue 21/06/16 0.840 0.600 1.440 2.34
8 KC-03-A-07 MIXED HOUSES HERNE BAY KENT 288 Wed 27/09/17 0.972 0.299 1.271 3.09
9 CA-03-A-04 DETACHED PETERBOROUGH CAMBRIDGESHIRE 9 Tue 18/10/11 1.000 0.222 1.222 2.44
10 HC-03-A-20 HOUSES & FLATS LIPHOOK HAMPSHIRE 62 Tue 20/11/18 0.952 0.194 1.146 2.19
11 NY-03-A-09 MIXED HOUSING NORTHALLERTON NORTH YORKSHIRE 52 Mon 16/09/13 0.827 0.269 1.096 2.60
12 CH-03-A-08 DETACHED CHESTER CHESHIRE 11 Tue 22/05/12 0.818 0.273 1.091 4.73
13 ES-03-A-03 MIXED HOUSES & POLEGATE EAST SUSSEX 212 Mon 11/07/16 0.689 0.363 1.052 1.68
14 NF-03-A-01 SEMI DET. & BU CAISTER-ON-SEA NORFOLK 27 Tue 16/10/12 0.778 0.259 1.037 2.37
15 HI-03-A-14 S E M I - D E T A C H E D INVERNESS HIGHLAND 40 Wed 23/03/16 0.650 0.325 0.975 2.23
16 DV-03-A-02 HOUSES & BUNGA HONITON DEVON 116 Fri 25/09/15 0.603 0.362 0.965 2.25
17 HC-03-A-22 MIXED HOUSES NEAR EASTLEIGH HAMPSHIRE 40 Wed 31/10/18 0.475 0.475 0.950 2.52
18 DV-03-A-03 TERRACED & SEM HONITON DEVON 70 Mon 28/09/15 0.757 0.186 0.943 1.66
19 NY-03-A-10 HOUSES AND FLA RIPON NORTH YORKSHIRE 71 Tue 17/09/13 0.803 0.113 0.916 0.83
20 NY-03-A-13 TERRACED HOUSE CATTERICK GARRISON NORTH YORKSHIRE 10 Wed 10/05/17 0.300 0.600 0.900 1.90
21 ST-03-A-07 DETACHED & SEM STAFFORD STAFFORDSHIRE 248 Wed 22/11/17 0.677 0.214 0.891 3.55
22 SF-03-A-05 DETACHED HOUSE BURY ST EDMUNDS SUFFOLK 18 Wed 09/09/15 0.667 0.222 0.889 4.17
23 WS-03-A-06 MIXED HOUSES WEST HORSHAM WEST SUSSEX 805 Thu 02/03/17 0.568 0.311 0.879 2.14
24 KC-03-A-04 S E M I - D E T A C H E D AYLESFORD KENT 110 Fri 22/09/17 0.700 0.127 0.827 1.77
25 HC-03-A-21 TERRACED & SEM BASINGSTOKE HAMPSHIRE 39 Tue 13/11/18 0.436 0.359 0.795 2.51
26 WS-03-A-08 MIXED HOUSES ANGMERING WEST SUSSEX 180 Thu 19/04/18 0.461 0.328 0.789 2.93
27 NY-03-A-12 TOWN HOUSES NORTHALLERTON NORTH YORKSHIRE 47 Tue 27/09/16 0.596 0.191 0.787 1.66
28 ES-03-A-04 MIXED HOUSES & CAMBER EAST SUSSEX 134 Fri 15/07/16 0.478 0.276 0.754 1.91
29 ES-03-A-02 PRIVATE HOUSIN PEACEHAVEN EAST SUSSEX 37 Fri 18/11/11 0.703 0.027 0.730 1.59
30 NE-03-A-03 PRIVATE HOUSES SCUNTHORPE NORTH EAST LINCOLNS 180 Tue 20/05/14 0.406 0.322 0.728 2.68
31 NY-03-A-06 BUNGALOWS & SE BOROUGHBRIDGE NORTH YORKSHIRE 115 Fri 14/10/11 0.417 0.270 0.687 3.50
32 NF-03-A-02 HOUSES & FLATS NORWICH NORFOLK 98 Mon 22/10/12 0.480 0.204 0.684 2.24
33 DS-03-A-02 MIXED HOUSES DERBY DERBYSHIRE 371 Tue 10/07/18 0.558 0.116 0.674 2.92
34 NY-03-A-08 TERRACED HOUSE YORK NORTH YORKSHIRE 21 Mon 16/09/13 0.524 0.143 0.667 1.14
35 FA-03-A-01 SEMI-DETACHED/ FALKIRK FALKIRK 37 Thu 30/05/13 0.459 0.189 0.648 1.41
36 LN-03-A-03 SEMI DETACHED LINCOLN LINCOLNSHIRE 22 Tue 18/09/12 0.455 0.182 0.637 1.09
37 SH-03-A-05 SEMI-DETACHED/ TELFORD SHROPSHIRE 54 Thu 24/10/13 0.370 0.259 0.629 1.17
38 PS-03-A-01 MIXED HOUSES WELSHPOOL POWYS 16 Mon 11/05/15 0.375 0.250 0.625 1.63
39 SC-03-A-04 DETACHED & TER BYFLEET SURREY 71 Thu 23/01/14 0.465 0.155 0.620 2.49
40 NE-03-A-02 SEMI DETACHED SCUNTHORPE NORTH EAST LINCOLNS 432 Mon 12/05/14 0.368 0.241 0.609 1.00

TRICS 7.6.1 290419 B19.08 Database right of TRICS Consortium Limited, 2019. All rights reserved Tuesday 30/04/19
Page 4
Lime Transport Limited Stanwell Road Penarth Licence No: 258601
Trip Rate (Sorted by Totals) Park Spaces
Rank Site-Ref Description Town/City Area DWELLS Day Date Arrivals Departures Totals Per Dwelling
41 DH-03-A-01 SEMI DETACHED BISHOP AUCKLAND DURHAM 50 Tue 28/03/17 0.440 0.120 0.560 1.74
42 WS-03-A-04 MIXED HOUSES HORSHAM WEST SUSSEX 151 Thu 11/12/14 0.331 0.185 0.516 2.28
43 NF-03-A-03 DETACHED HOUSE THETFORD NORFOLK 10 Wed 16/09/15 0.500 0.000 0.500 3.70
44 WO-03-A-07 MIXED HOUSES WORCESTER WORCESTERSHIRE 146 Tue 26/06/18 0.315 0.144 0.459 4.32
45 WS-03-A-10 MIXED HOUSES LITTLEHAMPTON WEST SUSSEX 79 Wed 07/11/18 0.291 0.165 0.456 2.41
46 PS-03-A-02 DETACHED/SEMI- WELSHPOOL POWYS 28 Mon 11/05/15 0.179 0.107 0.286 2.32
47 SH-03-A-06 BUNGALOWS SHREWSBURY SHROPSHIRE 16 Thu 22/05/14 0.000 0.250 0.250 2.00
This section displays actual (not average) trip rates for each of the survey days in the selected set, and ranks them in
order of relative trip rate intensity, for a given time period (or peak period irrespective of time) selected by the user. The
count type and direction are both displayed just above the table, along with the rows within the table representing the
85th and 15th percentile trip rate figures (highlighted in bold within the table itself).
The table itself displays details of each individual survey, alongside arrivals, departures and totals trip rates, sorted by
whichever of the three directional options has been chosen by the user. As with the preceeding trip rate calculation
results table, the trip rates shown are per the calculation factor (e.g. per 100m2 GFA, per employee, per hectare, etc).
Note that if the peak period option has been selected (as opposed to a specific chosen time period), the peak period for
each individual survey day in the table is also displayed.

TRICS 7.6.1 290419 B19.08 Database right of TRICS Consortium Limited, 2019. All rights reserved Tuesday 30/04/19
Page 5
Lime Transport Limited Stanwell Road Penarth Licence No: 258601
RANK ORDER for Land Use 03 - RESIDENTIAL/A - HOUSES PRIVATELY OWNED
MULTI-MODAL TOTAL PEOPLE
Ranking Type: TOTALS Time Range: 07:00-19:00
15th Percentile = No. 40 WS-03-A-10 Tot: 5.899
85th Percentile = No. 8 NY-03-A-13 Tot: 11.200
Median Values Mean Values
Arrivals: 3.828 Arrivals: 4.056
Departures: 4.034 Departures: 4.229
Totals: 7.862 Totals: 8.285
Trip Rate (Sorted by Totals) Park Spaces
Rank Site-Ref Description Town/City Area DWELLS Day Date Arrivals Departures Totals Per Dwelling
1 PK-03-A-01 DETAC. & BUNGA PERTH PERTH & KINROSS 36 Wed 11/05/11 7.889 8.111 16.000 3.36
2 VG-03-A-01 S E M I - D E T A C H E D BARRY VALE OF GLAMORGAN 12 Mon 08/05/17 7.417 8.000 15.417 2.33
3 CH-03-A-08 DETACHED CHESTER CHESHIRE 11 Tue 22/05/12 5.818 6.364 12.182 4.73
4 AG-03-A-01 BUNGALOWS/DET. ARBROATH ANGUS 7 Tue 22/05/12 5.571 6.571 12.142 2.71
5 NF-03-A-01 SEMI DET. & BU CAISTER-ON-SEA NORFOLK 27 Tue 16/10/12 5.815 5.556 11.371 2.37
6 CH-03-A-09 TERRACED HOUSE MACCLESFIELD CHESHIRE 24 Mon 24/11/14 5.583 5.750 11.333 1.33
7 KC-03-A-07 MIXED HOUSES HERNE BAY KENT 288 Wed 27/09/17 5.854 5.437 11.291 3.09
8 NY-03-A-13 TERRACED HOUSE CATTERICK GARRISON NORTH YORKSHIRE 10 Wed 10/05/17 5.400 5.800 11.200 1.90
9 KC-03-A-03 MIXED HOUSES & ASHFORD KENT 51 Thu 14/07/16 5.020 5.647 10.667 2.16
10 HC-03-A-20 HOUSES & FLATS LIPHOOK HAMPSHIRE 62 Tue 20/11/18 5.258 4.968 10.226 2.19
11 CB-03-A-05 DETACHED/TERRA PENRITH CUMBRIA 50 Tue 21/06/16 4.920 4.880 9.800 2.34
12 KC-03-A-04 S E M I - D E T A C H E D AYLESFORD KENT 110 Fri 22/09/17 4.900 4.791 9.691 1.77
13 NY-03-A-09 MIXED HOUSING NORTHALLERTON NORTH YORKSHIRE 52 Mon 16/09/13 4.808 4.865 9.673 2.60
14 HI-03-A-14 S E M I - D E T A C H E D INVERNESS HIGHLAND 40 Wed 23/03/16 4.625 4.925 9.550 2.23
15 NY-03-A-11 PRIVATE HOUSIN BOROUGHBRIDGE NORTH YORKSHIRE 23 Wed 18/09/13 4.826 4.565 9.391 6.26
16 WS-03-A-08 MIXED HOUSES ANGMERING WEST SUSSEX 180 Thu 19/04/18 4.356 4.661 9.017 2.93
17 CA-03-A-04 DETACHED PETERBOROUGH CAMBRIDGESHIRE 9 Tue 18/10/11 4.333 4.444 8.777 2.44
18 ES-03-A-03 MIXED HOUSES & POLEGATE EAST SUSSEX 212 Mon 11/07/16 4.184 4.514 8.698 1.68
19 DV-03-A-03 TERRACED & SEM HONITON DEVON 70 Mon 28/09/15 4.171 4.486 8.657 1.66
20 ES-03-A-04 MIXED HOUSES & CAMBER EAST SUSSEX 134 Fri 15/07/16 3.970 4.373 8.343 1.91
21 SH-03-A-05 SEMI-DETACHED/ TELFORD SHROPSHIRE 54 Thu 24/10/13 4.259 3.852 8.111 1.17
22 ST-03-A-07 DETACHED & SEM STAFFORD STAFFORDSHIRE 248 Wed 22/11/17 3.944 4.145 8.089 3.55
23 NF-03-A-03 DETACHED HOUSE THETFORD NORFOLK 10 Wed 16/09/15 4.100 3.900 8.000 3.70
24 DV-03-A-02 HOUSES & BUNGA HONITON DEVON 116 Fri 25/09/15 3.828 4.034 7.862 2.25
25 WS-03-A-06 MIXED HOUSES WEST HORSHAM WEST SUSSEX 805 Thu 02/03/17 3.793 3.983 7.776 2.14
26 HC-03-A-22 MIXED HOUSES NEAR EASTLEIGH HAMPSHIRE 40 Wed 31/10/18 3.450 4.050 7.500 2.52
27 FA-03-A-01 SEMI-DETACHED/ FALKIRK FALKIRK 37 Thu 30/05/13 3.541 3.946 7.487 1.41
28 NY-03-A-10 HOUSES AND FLA RIPON NORTH YORKSHIRE 71 Tue 17/09/13 3.718 3.746 7.464 0.83
29 SC-03-A-04 DETACHED & TER BYFLEET SURREY 71 Thu 23/01/14 3.690 3.620 7.310 2.49
30 NE-03-A-03 PRIVATE HOUSES SCUNTHORPE NORTH EAST LINCOLNS 180 Tue 20/05/14 2.978 4.061 7.039 2.68
31 NY-03-A-06 BUNGALOWS & SE BOROUGHBRIDGE NORTH YORKSHIRE 115 Fri 14/10/11 3.539 3.487 7.026 3.50
32 PS-03-A-01 MIXED HOUSES WELSHPOOL POWYS 16 Mon 11/05/15 3.250 3.438 6.688 1.63
33 NY-03-A-12 TOWN HOUSES NORTHALLERTON NORTH YORKSHIRE 47 Tue 27/09/16 3.234 3.362 6.596 1.66
34 DH-03-A-01 SEMI DETACHED BISHOP AUCKLAND DURHAM 50 Tue 28/03/17 3.220 3.340 6.560 1.74
35 SF-03-A-05 DETACHED HOUSE BURY ST EDMUNDS SUFFOLK 18 Wed 09/09/15 3.000 3.389 6.389 4.17
36 PS-03-A-02 DETACHED/SEMI- WELSHPOOL POWYS 28 Mon 11/05/15 3.286 3.036 6.322 2.32
37 NE-03-A-02 SEMI DETACHED SCUNTHORPE NORTH EAST LINCOLNS 432 Mon 12/05/14 2.949 3.171 6.120 1.00
38 NF-03-A-02 HOUSES & FLATS NORWICH NORFOLK 98 Mon 22/10/12 2.765 3.316 6.081 2.24
39 HC-03-A-21 TERRACED & SEM BASINGSTOKE HAMPSHIRE 39 Tue 13/11/18 2.795 3.154 5.949 2.51
40 WS-03-A-10 MIXED HOUSES LITTLEHAMPTON WEST SUSSEX 79 Wed 07/11/18 2.975 2.924 5.899 2.41

TRICS 7.6.1 290419 B19.08 Database right of TRICS Consortium Limited, 2019. All rights reserved Tuesday 30/04/19
Page 6
Lime Transport Limited Stanwell Road Penarth Licence No: 258601
Trip Rate (Sorted by Totals) Park Spaces
Rank Site-Ref Description Town/City Area DWELLS Day Date Arrivals Departures Totals Per Dwelling
41 WS-03-A-04 MIXED HOUSES HORSHAM WEST SUSSEX 151 Thu 11/12/14 2.755 3.000 5.755 2.28
42 NY-03-A-08 TERRACED HOUSE YORK NORTH YORKSHIRE 21 Mon 16/09/13 2.857 2.762 5.619 1.14
43 DS-03-A-02 MIXED HOUSES DERBY DERBYSHIRE 371 Tue 10/07/18 2.790 2.806 5.596 2.92
44 LN-03-A-03 SEMI DETACHED LINCOLN LINCOLNSHIRE 22 Tue 18/09/12 2.545 2.955 5.500 1.09
45 ES-03-A-02 PRIVATE HOUSIN PEACEHAVEN EAST SUSSEX 37 Fri 18/11/11 2.865 2.405 5.270 1.59
46 WO-03-A-07 MIXED HOUSES WORCESTER WORCESTERSHIRE 146 Tue 26/06/18 2.158 1.979 4.137 4.32
47 SH-03-A-06 BUNGALOWS SHREWSBURY SHROPSHIRE 16 Thu 22/05/14 1.625 2.188 3.813 2.00
This section displays actual (not average) trip rates for each of the survey days in the selected set, and ranks them in
order of relative trip rate intensity, for a given time period (or peak period irrespective of time) selected by the user. The
count type and direction are both displayed just above the table, along with the rows within the table representing the
85th and 15th percentile trip rate figures (highlighted in bold within the table itself).
The table itself displays details of each individual survey, alongside arrivals, departures and totals trip rates, sorted by
whichever of the three directional options has been chosen by the user. As with the preceeding trip rate calculation
results table, the trip rates shown are per the calculation factor (e.g. per 100m2 GFA, per employee, per hectare, etc).
Note that if the peak period option has been selected (as opposed to a specific chosen time period), the peak period for
each individual survey day in the table is also displayed.

Appendix F

TRICS 7.6.1 290419 B19.08 Database right of TRICS Consortium Limited, 2019. All rights reserved Thursday 25/07/19
Page 1
Lime Transport Limited Stanwell Road Penarth Licence No: 258601
Calculation Reference: AUDIT-258601-190725-0717
TRIP RATE CALCULATION SELECTION PARAMETERS:
Land Use : 03 - RESIDENTIAL
Category : B - AFFORDABLE/LOCAL AUTHORITY HOUSES
MULTI-MODAL VEHICLES
Selected regions and areas:
07 YORKSHIRE & NORTH LINCOLNSHIRE
WY WEST YORKSHIRE 2 days
08 NORTH WEST
LC LANCASHIRE 1 days
MS MERSEYSIDE 1 days
This section displays the number of survey days per TRICS® sub-region in the selected set
Secondary Filtering selection:
This data displays the chosen trip rate parameter and its selected range. Only sites that fall within the parameter range
are included in the trip rate calculation.
Parameter: Number of dwellings
Actual Range: 15 to 54 (units: )
Range Selected by User: 14 to 280 (units: )
Parking Spaces Range: All Surveys Included
Percentage of dwellings privately owned: All Surveys Included
Public Transport Provision:
Selection by: Include all surveys
Date Range: 01/01/11 to 19/09/13
This data displays the range of survey dates selected. Only surveys that were conducted within this date range are
included in the trip rate calculation.
Selected survey days:
Monday 1 days
Tuesday 2 days
Thursday 1 days
This data displays the number of selected surveys by day of the week.
Selected survey types:
Manual count 4 days
Directional ATC Count 0 days
This data displays the number of manual classified surveys and the number of unclassified ATC surveys, the total adding
up to the overall number of surveys in the selected set. Manual surveys are undertaken using staff, whilst ATC surveys
are undertaking using machines.
Selected Locations:
Edge of Town Centre 1
Suburban Area (PPS6 Out of Centre) 1
Edge of Town 2
This data displays the number of surveys per main location category within the selected set. The main location categories
consist of Free Standing, Edge of Town, Suburban Area, Neighbourhood Centre, Edge of Town Centre, Town Centre and
Not Known.
Selected Location Sub Categories:
Residential Zone 3
Built-Up Zone 1
This data displays the number of surveys per location sub-category within the selected set. The location sub-categories
consist of Commercial Zone, Industrial Zone, Development Zone, Residential Zone, Retail Zone, Built-Up Zone, Village,
Out of Town, High Street and No Sub Category.
Secondary Filtering selection:
Use Class:
C 3 4 days
This data displays the number of surveys per Use Class classification within the selected set. The Use Classes Order 2005
has been used for this purpose, which can be found within the Library module of TRICS®.

TRICS 7.6.1 290419 B19.08 Database right of TRICS Consortium Limited, 2019. All rights reserved Thursday 25/07/19
Page 2
Lime Transport Limited Stanwell Road Penarth Licence No: 258601
Secondary Filtering selection (Cont.):
Population within 1 mile:
1,001 to 5,000 1 days
5,001 to 10,000 1 days
10,001 to 15,000 1 days
25,001 to 50,000 1 days
This data displays the number of selected surveys within stated 1-mile radii of population.
Population within 5 miles:
5,001 to 25,000 1 days
75,001 to 100,000 2 days
125,001 to 250,000 1 days
This data displays the number of selected surveys within stated 5-mile radii of population.
Car ownership within 5 miles:
0.6 to 1.0 3 days
1.1 to 1.5 1 days
This data displays the number of selected surveys within stated ranges of average cars owned per residential dwelling,
within a radius of 5-miles of selected survey sites.
Travel Plan:
No 4 days
This data displays the number of surveys within the selected set that were undertaken at sites with Travel Plans in place,
and the number of surveys that were undertaken at sites without Travel Plans.
PTAL Rating:
No PTAL Present 4 days
This data displays the number of selected surveys with PTAL Ratings.

TRICS 7.6.1 290419 B19.08 Database right of TRICS Consortium Limited, 2019. All rights reserved Thursday 25/07/19
Page 3
Lime Transport Limited Stanwell Road Penarth Licence No: 258601
LIST OF SITES relevant to selection parameters
1 LC-03-B-02 SEMI DETACHED/TERRACED LANCASHIRE
BILLINGE STREET
BLACKBURN
Edge of Town Centre
Residential Zone
Total Number of dwellings: 1 5
Survey date: MONDAY 10/06/13 Survey Type: MANUAL
2 MS-03-B-01 TERRACED MERSEYSIDE
TARBOCK ROAD
LIVERPOOL
SPEKE
Edge of Town
Residential Zone
Total Number of dwellings: 1 6
Survey date: TUESDAY 18/06/13 Survey Type: MANUAL
3 WY-03-B-02 MIXED HOUSES WEST YORKSHIRE
WHITEACRE STREET
HUDDERSFIELD
DEIGHTON
Edge of Town
Residential Zone
Total Number of dwellings: 5 4
Survey date: TUESDAY 17/09/13 Survey Type: MANUAL
4 WY-03-B-03 TERRACED HOUSES WEST YORKSHIRE
LINCOLN GREEN ROAD
LEEDS
Suburban Area (PPS6 Out of Centre)
Built-Up Zone
Total Number of dwellings: 2 9
Survey date: THURSDAY 19/09/13 Survey Type: MANUAL
This section provides a list of all survey sites and days in the selected set. For each individual survey site, it displays a
unique site reference code and site address, the selected trip rate calculation parameter and its value, the day of the
week and date of each survey, and whether the survey was a manual classified count or an ATC count.

TRICS 7.6.1 290419 B19.08 Database right of TRICS Consortium Limited, 2019. All rights reserved Thursday 25/07/19
Page 4
Lime Transport Limited Stanwell Road Penarth Licence No: 258601
TRIP RATE for Land Use 03 - RESIDENTIAL/B - AFFORDABLE/LOCAL AUTHORITY HOUSES
MULTI-MODAL VEHICLES
Calculation factor: 1 DWELLS
BOLD print indicates peak (busiest) period
ARRIVALS DEPARTURES TOTALS
No. Ave. Trip No. Ave. Trip No. Ave. Trip
Time Range Days DWELLS Rate Days DWELLS Rate Days DWELLS Rate
00:00 - 01:00
01:00 - 02:00
02:00 - 03:00
03:00 - 04:00
04:00 - 05:00
05:00 - 06:00
06:00 - 07:00
4 29 0.079 4 29 0.096 4 29 0.17507:00 - 08:00
4 29 0.175 4 29 0.351 4 29 0.52608:00 - 09:00
4 29 0.246 4 29 0.254 4 29 0.50009:00 - 10:00
4 29 0.167 4 29 0.184 4 29 0.35110:00 - 11:00
4 29 0.123 4 29 0.132 4 29 0.25511:00 - 12:00
4 29 0.167 4 29 0.149 4 29 0.31612:00 - 13:00
4 29 0.114 4 29 0.114 4 29 0.22813:00 - 14:00
4 29 0.175 4 29 0.158 4 29 0.33314:00 - 15:00
4 29 0.228 4 29 0.237 4 29 0.46515:00 - 16:00
4 29 0.140 4 29 0.184 4 29 0.32416:00 - 17:00
4 29 0.211 4 29 0.175 4 29 0.38617:00 - 18:00
4 29 0.167 4 29 0.096 4 29 0.26318:00 - 19:00
19:00 - 20:00
20:00 - 21:00
21:00 - 22:00
22:00 - 23:00
23:00 - 24:00
Total Rates: 1.992 2.130 4.122
This section displays the trip rate results based on the selected set of surveys and the selected count type (shown just
above the table). It is split by three main columns, representing arrivals trips, departures trips, and total trips (arrivals
plus departures). Within each of these main columns are three sub-columns. These display the number of survey days
where count data is included (per time period), the average value of the selected trip rate calculation parameter (per
time period), and the trip rate result (per time period). Total trip rates (the sum of the column) are also displayed at the
foot of the table.
To obtain a trip rate, the average (mean) trip rate parameter value (TRP) is first calculated for all selected survey days
that have count data available for the stated time period. The average (mean) number of arrivals, departures or totals
(whichever applies) is also calculated (COUNT) for all selected survey days that have count data available for the stated
time period. Then, the average count is divided by the average trip rate parameter value, and multiplied by the stated
calculation factor (shown just above the table and abbreviated here as FACT). So, the method is: COUNT/TRP*FACT. Trip
rates are then rounded to 3 decimal places.

TRICS 7.6.1 290419 B19.08 Database right of TRICS Consortium Limited, 2019. All rights reserved Thursday 25/07/19
Page 5
Lime Transport Limited Stanwell Road Penarth Licence No: 258601
The survey data, graphs and all associated supporting information, contained within the TRICS Database are published
by TRICS Consortium Limited ("the Company") and the Company claims copyright and database rights in this published
work. The Company authorises those who possess a current TRICS licence to access the TRICS Database and copy the
data contained within the TRICS Database for the licence holders' use only. Any resulting copy must retain all copyrights
and other proprietary notices, and any disclaimer contained thereon.
The Company accepts no responsibility for loss which may arise from reliance on data contained in the TRICS Database.
[No warranty of any kind, express or implied, is made as to the data contained in the TRICS Database.]
Parameter summary
Trip rate parameter range selected: 15 - 54 (units: )
Survey date date range: 01/01/11 - 19/09/13
Number of weekdays (Monday-Friday): 4
Number of Saturdays: 0
Number of Sundays: 0
Surveys automatically removed from selection: 0
Surveys manually removed from selection: 0
This section displays a quick summary of some of the data filtering selections made by the TRICS® user. The trip rate
calculation parameter range of all selected surveys is displayed first, followed by the range of minimum and maximum
survey dates selected by the user. Then, the total number of selected weekdays and weekend days in the selected set of
surveys are show. Finally, the number of survey days that have been manually removed from the selected set outside of
the standard filtering procedure are displayed.

TRICS 7.6.1 290419 B19.08 Database right of TRICS Consortium Limited, 2019. All rights reserved Thursday 25/07/19
Page 9
Lime Transport Limited Stanwell Road Penarth Licence No: 258601
TRIP RATE for Land Use 03 - RESIDENTIAL/B - AFFORDABLE/LOCAL AUTHORITY HOUSES
MULTI-MODAL CYCLISTS
Calculation factor: 1 DWELLS
BOLD print indicates peak (busiest) period
ARRIVALS DEPARTURES TOTALS
No. Ave. Trip No. Ave. Trip No. Ave. Trip
Time Range Days DWELLS Rate Days DWELLS Rate Days DWELLS Rate
00:00 - 01:00
01:00 - 02:00
02:00 - 03:00
03:00 - 04:00
04:00 - 05:00
05:00 - 06:00
06:00 - 07:00
4 29 0.000 4 29 0.000 4 29 0.00007:00 - 08:00
4 29 0.009 4 29 0.026 4 29 0.03508:00 - 09:00
4 29 0.009 4 29 0.018 4 29 0.02709:00 - 10:00
4 29 0.018 4 29 0.000 4 29 0.01810:00 - 11:00
4 29 0.000 4 29 0.000 4 29 0.00011:00 - 12:00
4 29 0.000 4 29 0.000 4 29 0.00012:00 - 13:00
4 29 0.000 4 29 0.000 4 29 0.00013:00 - 14:00
4 29 0.000 4 29 0.009 4 29 0.00914:00 - 15:00
4 29 0.026 4 29 0.009 4 29 0.03515:00 - 16:00
4 29 0.000 4 29 0.009 4 29 0.00916:00 - 17:00
4 29 0.009 4 29 0.000 4 29 0.00917:00 - 18:00
4 29 0.000 4 29 0.000 4 29 0.00018:00 - 19:00
19:00 - 20:00
20:00 - 21:00
21:00 - 22:00
22:00 - 23:00
23:00 - 24:00
Total Rates: 0.071 0.071 0.142
This section displays the trip rate results based on the selected set of surveys and the selected count type (shown just
above the table). It is split by three main columns, representing arrivals trips, departures trips, and total trips (arrivals
plus departures). Within each of these main columns are three sub-columns. These display the number of survey days
where count data is included (per time period), the average value of the selected trip rate calculation parameter (per
time period), and the trip rate result (per time period). Total trip rates (the sum of the column) are also displayed at
the foot of the table.
To obtain a trip rate, the average (mean) trip rate parameter value (TRP) is first calculated for all selected survey days
that have count data available for the stated time period. The average (mean) number of arrivals, departures or totals
(whichever applies) is also calculated (COUNT) for all selected survey days that have count data available for the
stated time period. Then, the average count is divided by the average trip rate parameter value, and multiplied by the
stated calculation factor (shown just above the table and abbreviated here as FACT). So, the method is:
COUNT/TRP*FACT. Trip rates are then rounded to 3 decimal places.

TRICS 7.6.1 290419 B19.08 Database right of TRICS Consortium Limited, 2019. All rights reserved Thursday 25/07/19
Page 13
Lime Transport Limited Stanwell Road Penarth Licence No: 258601
TRIP RATE for Land Use 03 - RESIDENTIAL/B - AFFORDABLE/LOCAL AUTHORITY HOUSES
MULTI-MODAL PEDESTRIANS
Calculation factor: 1 DWELLS
BOLD print indicates peak (busiest) period
ARRIVALS DEPARTURES TOTALS
No. Ave. Trip No. Ave. Trip No. Ave. Trip
Time Range Days DWELLS Rate Days DWELLS Rate Days DWELLS Rate
00:00 - 01:00
01:00 - 02:00
02:00 - 03:00
03:00 - 04:00
04:00 - 05:00
05:00 - 06:00
06:00 - 07:00
4 29 0.035 4 29 0.088 4 29 0.12307:00 - 08:00
4 29 0.096 4 29 0.526 4 29 0.62208:00 - 09:00
4 29 0.140 4 29 0.149 4 29 0.28909:00 - 10:00
4 29 0.140 4 29 0.175 4 29 0.31510:00 - 11:00
4 29 0.158 4 29 0.219 4 29 0.37711:00 - 12:00
4 29 0.246 4 29 0.158 4 29 0.40412:00 - 13:00
4 29 0.114 4 29 0.105 4 29 0.21913:00 - 14:00
4 29 0.184 4 29 0.246 4 29 0.43014:00 - 15:00
4 29 0.570 4 29 0.333 4 29 0.90315:00 - 16:00
4 29 0.132 4 29 0.228 4 29 0.36016:00 - 17:00
4 29 0.325 4 29 0.307 4 29 0.63217:00 - 18:00
4 29 0.175 4 29 0.193 4 29 0.36818:00 - 19:00
19:00 - 20:00
20:00 - 21:00
21:00 - 22:00
22:00 - 23:00
23:00 - 24:00
Total Rates: 2.315 2.727 5.042
This section displays the trip rate results based on the selected set of surveys and the selected count type (shown just
above the table). It is split by three main columns, representing arrivals trips, departures trips, and total trips (arrivals
plus departures). Within each of these main columns are three sub-columns. These display the number of survey days
where count data is included (per time period), the average value of the selected trip rate calculation parameter (per
time period), and the trip rate result (per time period). Total trip rates (the sum of the column) are also displayed at
the foot of the table.
To obtain a trip rate, the average (mean) trip rate parameter value (TRP) is first calculated for all selected survey days
that have count data available for the stated time period. The average (mean) number of arrivals, departures or totals
(whichever applies) is also calculated (COUNT) for all selected survey days that have count data available for the
stated time period. Then, the average count is divided by the average trip rate parameter value, and multiplied by the
stated calculation factor (shown just above the table and abbreviated here as FACT). So, the method is:
COUNT/TRP*FACT. Trip rates are then rounded to 3 decimal places.

TRICS 7.6.1 290419 B19.08 Database right of TRICS Consortium Limited, 2019. All rights reserved Thursday 25/07/19
Page 17
Lime Transport Limited Stanwell Road Penarth Licence No: 258601
TRIP RATE for Land Use 03 - RESIDENTIAL/B - AFFORDABLE/LOCAL AUTHORITY HOUSES
MULTI-MODAL PUBLIC TRANSPORT USERS
Calculation factor: 1 DWELLS
BOLD print indicates peak (busiest) period
ARRIVALS DEPARTURES TOTALS
No. Ave. Trip No. Ave. Trip No. Ave. Trip
Time Range Days DWELLS Rate Days DWELLS Rate Days DWELLS Rate
00:00 - 01:00
01:00 - 02:00
02:00 - 03:00
03:00 - 04:00
04:00 - 05:00
05:00 - 06:00
06:00 - 07:00
4 29 0.000 4 29 0.009 4 29 0.00907:00 - 08:00
4 29 0.000 4 29 0.070 4 29 0.07008:00 - 09:00
4 29 0.009 4 29 0.044 4 29 0.05309:00 - 10:00
4 29 0.000 4 29 0.009 4 29 0.00910:00 - 11:00
4 29 0.009 4 29 0.000 4 29 0.00911:00 - 12:00
4 29 0.009 4 29 0.000 4 29 0.00912:00 - 13:00
4 29 0.026 4 29 0.000 4 29 0.02613:00 - 14:00
4 29 0.009 4 29 0.009 4 29 0.01814:00 - 15:00
4 29 0.053 4 29 0.009 4 29 0.06215:00 - 16:00
4 29 0.000 4 29 0.009 4 29 0.00916:00 - 17:00
4 29 0.044 4 29 0.000 4 29 0.04417:00 - 18:00
4 29 0.009 4 29 0.000 4 29 0.00918:00 - 19:00
19:00 - 20:00
20:00 - 21:00
21:00 - 22:00
22:00 - 23:00
23:00 - 24:00
Total Rates: 0.168 0.159 0.327
This section displays the trip rate results based on the selected set of surveys and the selected count type (shown just
above the table). It is split by three main columns, representing arrivals trips, departures trips, and total trips (arrivals
plus departures). Within each of these main columns are three sub-columns. These display the number of survey days
where count data is included (per time period), the average value of the selected trip rate calculation parameter (per
time period), and the trip rate result (per time period). Total trip rates (the sum of the column) are also displayed at
the foot of the table.
To obtain a trip rate, the average (mean) trip rate parameter value (TRP) is first calculated for all selected survey days
that have count data available for the stated time period. The average (mean) number of arrivals, departures or totals
(whichever applies) is also calculated (COUNT) for all selected survey days that have count data available for the
stated time period. Then, the average count is divided by the average trip rate parameter value, and multiplied by the
stated calculation factor (shown just above the table and abbreviated here as FACT). So, the method is:
COUNT/TRP*FACT. Trip rates are then rounded to 3 decimal places.

TRICS 7.6.1 290419 B19.08 Database right of TRICS Consortium Limited, 2019. All rights reserved Thursday 25/07/19
Page 21
Lime Transport Limited Stanwell Road Penarth Licence No: 258601
TRIP RATE for Land Use 03 - RESIDENTIAL/B - AFFORDABLE/LOCAL AUTHORITY HOUSES
MULTI-MODAL TOTAL PEOPLE
Calculation factor: 1 DWELLS
BOLD print indicates peak (busiest) period
ARRIVALS DEPARTURES TOTALS
No. Ave. Trip No. Ave. Trip No. Ave. Trip
Time Range Days DWELLS Rate Days DWELLS Rate Days DWELLS Rate
00:00 - 01:00
01:00 - 02:00
02:00 - 03:00
03:00 - 04:00
04:00 - 05:00
05:00 - 06:00
06:00 - 07:00
4 29 0.132 4 29 0.254 4 29 0.38607:00 - 08:00
4 29 0.342 4 29 1.184 4 29 1.52608:00 - 09:00
4 29 0.509 4 29 0.570 4 29 1.07909:00 - 10:00
4 29 0.404 4 29 0.482 4 29 0.88610:00 - 11:00
4 29 0.316 4 29 0.395 4 29 0.71111:00 - 12:00
4 29 0.474 4 29 0.360 4 29 0.83412:00 - 13:00
4 29 0.281 4 29 0.254 4 29 0.53513:00 - 14:00
4 29 0.456 4 29 0.491 4 29 0.94714:00 - 15:00
4 29 1.132 4 29 0.746 4 29 1.87815:00 - 16:00
4 29 0.377 4 29 0.544 4 29 0.92116:00 - 17:00
4 29 0.667 4 29 0.570 4 29 1.23717:00 - 18:00
4 29 0.430 4 29 0.351 4 29 0.78118:00 - 19:00
19:00 - 20:00
20:00 - 21:00
21:00 - 22:00
22:00 - 23:00
23:00 - 24:00
Total Rates: 5.520 6.201 1 1.721
This section displays the trip rate results based on the selected set of surveys and the selected count type (shown just
above the table). It is split by three main columns, representing arrivals trips, departures trips, and total trips (arrivals
plus departures). Within each of these main columns are three sub-columns. These display the number of survey days
where count data is included (per time period), the average value of the selected trip rate calculation parameter (per
time period), and the trip rate result (per time period). Total trip rates (the sum of the column) are also displayed at
the foot of the table.
To obtain a trip rate, the average (mean) trip rate parameter value (TRP) is first calculated for all selected survey days
that have count data available for the stated time period. The average (mean) number of arrivals, departures or totals
(whichever applies) is also calculated (COUNT) for all selected survey days that have count data available for the
stated time period. Then, the average count is divided by the average trip rate parameter value, and multiplied by the
stated calculation factor (shown just above the table and abbreviated here as FACT). So, the method is:
COUNT/TRP*FACT. Trip rates are then rounded to 3 decimal places.

Appendix G

No. of arrivals
No. of departs
Total no. of trips
8am-9am 12 29 41 Arrivals Arrivals
From To AM Peak PM Peak 5pm-6pm 37 10 47 A Bridgend Road - Aldenham Road 23% 3 A Bridgend Road - Aldenham Road 23% 9
2019 2021 1.0232 1.0255 B Bridgend Road - Newton Nottage Road - Pyle Road (west)
34% 4 B Bridgend Road - Newton Nottage Road - Pyle Road (west)
34% 13
2019 2025 1.0458 1.0556 C Bridgend Road - A4106 - A48 east) 44% 6 C Bridgend Road - A4106 - A48 (east) 44% 162019 2030 1.0797 1.09152019 2040 1.137 1.155 Departures Departures
A Bridgend Road - Aldenham Road 23% 7 A Bridgend Road - Aldenham Road 23% 2
B Bridgend Road - Newton Nottage Road - Pyle Road (west)
34% 10 B Bridgend Road - Newton Nottage Road - Pyle Road (west)
34% 3
C Bridgend Road - A4106 - A48 (east) 44% 13 C Bridgend Road - A4106 - A48 (east) 44% 4Private
arrival rate
depart rate
Total rate
8am-9am 0.182 0.455 0.637 Arrivals Arrivals5pm-6pm 0.609 0.130 0.739 A Bridgend Road - Aldenham Road 23% 0 A Bridgend Road - Aldenham Road 23% 1
B Bridgend Road - Newton Nottage Road - Pyle Road
34% 0 B Bridgend Road - Newton Nottage Road - Pyle Road
34% 1
C Bridgend Road - A4106 - A48 44% 0 C Bridgend Road - A4106 - A48 44% 1Affordable
Departures DeparturesA Bridgend Road - Aldenham Road 23% 0 A Bridgend Road - Aldenham Road 23% 0
arrival rate
depart rate
Total rate BBridgend Road - Newton Nottage Road - Pyle
Road (west)34% 1 B
Bridgend Road - Newton Nottage Road - Pyle Road (west)
34% 0
8am-9am 0.175 0.351 0.526 C Bridgend Road - A4106 - A48 (east) 44% 1 C Bridgend Road - A4106 - A48 (east) 44% 05pm-6pm 0.211 0.175 0.386
Church Street 4 Birch Walk 70
Affordable 0 Affordable 13Private 4 Private 57
no. of arrivals
no of departs
Total vehsno. of
arrivalsno of
departsTotal vehs
8am-9am 1 2 3 8am-9am 13 30 435pm-6pm 2 1 3 5pm-6pm 37 10 47
Birch Road Access
AM PM
Church Street
Bridgend 019 Growth factors
AM PM
GROWTH FACTOR

No. Vehs
HGVS #### #### 0%% HGVS
########
0% 5
########
11 14 6 0%
0% 0% 0% 0%0% 13
0% 0%
1 10 0%31 0%
31
0% 0%24 0%
1 3 7 0%
0% 0% #### 0%
1
1 0%#### 0% 0% 0%
31
0% #### 0%0%0%
1 0%0% 0% 1
0% 0% 0% 0%
0% 0% 0% 31 130%
1
0 0% 1 0%0 0%
0% 0%
0% 0%0
1
0%0 0 0%
0% 0% 2 0%0%
0% 0%
Bridgend RoadNewton Nottage Road
Tyn
Y-Ca
eau
Lane
Brid
gend
Roa
d
Danygraig Avenue
Birc
h W
alk
Church Street
Clev
is
Clev
is La
ne
Alde
nham
Roa
d
SITE 170 Dwellings
SITE 24 Dwellings
Clevis Crescent
DEV AM

No. Vehs
HGVS #### #### 0%% HGVS
########
0% 14
########
3 4 18 0%
0% 0% 0% 0%0% 38
0% 0%
2 29 0%10 0%
10
0% 0%8 0%
9 2 0%
0% 0% #### 0%
2
4 0%#### 0% 0% 0%
92
0% #### 0%0%0%
4 0%0% 0% 4
0% 0% 0% 0%
0% 0% 0% 10 380%
2
0 0% 0 0%0 0%
0% 0%
0% 0%0
2
0%1 0 0%
0% 0% 1 0%0%
0% 0%
Bridgend RoadNewton Nottage Road
Tyn
Y-Ca
eau
Lane
Brid
gend
Roa
d
Danygraig Avenue
Birc
h W
alk
Church Street
Clev
is
Clev
is La
ne
Alde
nham
Roa
d
SITE 170 Dwellings
SITE 24 Dwellings
Clevis Crescent
DEV PM

Appendix H

No. Vehs
HGVS 0% 0% 0%% HGVS 0 0 0
0% 0 5 2 1 00% 3443% 5 156
4 0 0%239 7 3%
214 1 278 169 5 3%5 0 52% 0% 2% 0%
######## ####
0%####
#### 0%########
0% #### 4% 0%6 0
141 105
87 1 1%2 0 0% 0% #### 0%
236 87 03% 0% 0%
0%0%
####0% 0%
#### 0% #### 0%
0% #### ####0%
#### ########
0% 0%
0% ####0
0%####
0% #### ####0%
0% 0%
Bridgend RoadNewton Nottage Road
Tyn
Y-Ca
eau
Lane
Brid
gend
Roa
d
Danygraig Avenue
Birc
h W
alk
Church Street
Clev
is
Clev
is La
ne
Clevis Crescent
Alde
nham
Roa
d
SITE 170 Dwellings
SITE 24 Dwellings
Heol-Y-Graig
2019 AM PEAK 0800-0900

No. Vehs
HGVS 0% 0% 0%% HGVS 0 0 0
0% 0 2 4 3 00% 1 2790% 0 171
1 0 0%374 0 0%
126 0 219 270 3 1%0 0 30% 0% 1% 0%
######## ####
0%####
#### 0%########
0% #### 2% 0%4 0
214 109
56 0 0%6 0 0% 0% #### 0%
223 93 11% 11% 0%
0%0%
####0% 0%
#### 0% #### 0%
0% #### ####0%
#### ########
0% 0%
0% ####0
0%####
0% #### ####0%
0% 0%
Bridgend RoadNewton Nottage Road
Tyn
Y-Ca
eau
Lane
Brid
gend
Roa
d
Danygraig Avenue
Birc
h W
alk
Church Street
Clev
is
Clev
is La
ne
Alde
nham
Roa
d
SITE 170 Dwellings
SITE 24 Dwellings
Clevis Crescent
2019 PM PEAK 1700-1800

No. Vehs
HGVS 0% 0% 0%% HGVS 0 0 0
0% 0 5 2 1 00% 0 3523% 5 160
4 0 0%245 7 3%
219 1 284 173 5 3%5 0 52% 0% 2% 0%
######## ####
0%####
#### 0%########
0% #### 4% 0%6 0
144 107
89 1 1%2 0 0% 0% #### 0%
241 87 03% 0% 0%
0%0%
####0% 0%
#### 0% #### 0%
0% #### ####0%
#### ########
0% 0%
0% ####0
0%####
0% #### ####0%
0% 0%
Bridgend RoadNewton Nottage Road
Tyn
Y-Ca
eau
Lane
Brid
gend
Roa
d
Danygraig Avenue
Birc
h W
alk
Church Street
Clev
is
Clev
is La
ne
Clevis Crescent
Alde
nham
Roa
d
SITE 170 Dwellings
SITE 24 Dwellings
Heol-Y-Graig
2021 AM PEAK 0800-0900

No. Vehs
HGVS 0% 0% 0%% HGVS 0 0 0
0% 0 2 4 3 00% 1 2860% 0 175
1 0 0%384 0 0%
129 0 225 277 3 1%0 0 30% 0% 1% 0%
######## ####
0%####
#### 0%########
0% #### 2% 0%4 0
219 112
57 0 0%6 0 0% 0% #### 0%
229 93 11% 11% 0%
0%0%
####0% 0%
#### 0% #### 0%
0% #### ####0%
#### ########
0% 0%
0% ####0
0%####
0% #### ####0%
0% 0%
Bridgend RoadNewton Nottage Road
Tyn
Y-Ca
eau
Lane
Brid
gend
Roa
d
Danygraig Avenue
Birc
h W
alk
Church Street
Clev
is
Clev
is La
ne
Alde
nham
Roa
d
SITE 170 Dwellings
SITE 24 Dwellings
Clevis Crescent
2021 PM PEAK 1700-1800

No. Vehs
HGVS 0% 0% 0%% HGVS 0 0 0
0% 0 5 2 1 00% 0 3603% 5 163
4 0 0%250 7 3%
224 1 291 177 5 3%5 0 52% 0% 2% 0% 0
#### 0#### ####
0 00 0 0 0%
0 ####
0 0#### 0%
0 0 ####0 0 0 0 ####0 00% #### 4% 0%
6 0147 110
91 1 1%2 0 0% 0% #### 0%
247 87 03% 0% 0%
0%0%
####0% 0%
#### 0% #### 0%
0% #### ####0%
#### ########
0% 0%
0% ####0
0%####
0% #### ####0%
0% 0%
Bridgend RoadNewton Nottage Road
Tyn
Y-Ca
eau
Lane
Brid
gend
Roa
d
Danygraig Avenue
Birc
h W
alk
Church Street
Clev
is
Clev
is La
ne
Clevis Crescent
Alde
nham
Roa
d
SITE 170 Dwellings
SITE 24 Dwellings
Heol-Y-Graig
2025 AM PEAK 0800-0900

No. Vehs
HGVS 0% 0% 0%% HGVS 0 0 0
0% 0 2 4 3 00% 1 2950% 0 181
1 0 0%395 0 0%
133 0 231 285 3 1%0 0 30% 0% 1% 0%
######## ####
0%####
#### 0%########
0% #### 2% 0%4 0
226 115
59 0 0%6 0 0% 0% #### 0%
235 103 11% 11% 0%
0%0%
####0% 0%
#### 0% #### 0%
0% #### ####0%
#### ########
0% 0%
0% ####0
0%####
0% #### ####0%
0% 0%
Bridgend RoadNewton Nottage Road
Tyn
Y-Ca
eau
Lane
Brid
gend
Roa
d
Danygraig Avenue
Birc
h W
alk
Church Street
Clev
is
Clev
is La
ne
Alde
nham
Roa
d
SITE 170 Dwellings
SITE 24 Dwellings
Clevis Crescent
2025 PM PEAK 1700-1800

No. Vehs
HGVS 0% 0% 0%% HGVS 0 0 0
0% 0 5 2 1 00% 0 3713% 5.4 168
4 0 0%258 7.56 3%
231 1 300 182 5.4 3%5.4 0 5.42% 0% 2% 0% 0
#### 0#### ####
0 00 0 0 0%
0 ####
0 0#### 0%
0 0 ####0 0 0 0 ####0 00% #### 4% 0%
6 0152 113
94 1.08 1%2 0 0% 0% #### 0%
255 98 03% 0% 0%
0%0%
####0% 0%
#### 0% #### 0%
0% #### ####0%
#### ########
0% 0%
0% ####0
0%####
0% #### ####0%
0% 0%
Bridgend RoadNewton Nottage Road
Tyn
Y-Ca
eau
Lane
Brid
gend
Roa
d
Danygraig Avenue
Birc
h W
alk
Church Street
Clev
is
Clev
is La
ne
Clevis Crescent
Alde
nham
Roa
d
SITE 170 Dwellings
SITE 24 Dwellings
Heol-Y-Graig
2030 AM PEAK 0800-0900

No. Vehs
HGVS 0% 0% 0%% HGVS 0 0 0
0% 0 2 4 3 00% 1 3050% 0 187
1 0 0%408 0 0%
138 0 239 295 3 1%0 0 30% 0% 1% 0%
######## ####
0 00 0 0 0%
0 ####
#### 0%0 ####
0 0 0 ####0 00% #### 2% 0%
4 0234 119
61 0 0%7 0 0% 0% #### 0%
243 103 11% 11% 0%
0%0%
####0% 0%
#### 0% #### 0%
0% #### ####0%
#### ########
0% 0%
0% ####0
0%####
0% #### ####0%
0% 0%
Bridgend RoadNewton Nottage Road
Tyn
Y-Ca
eau
Lane
Brid
gend
Roa
d
Danygraig Avenue
Birc
h W
alk
Church Street
Clev
is
Clev
is La
ne
Alde
nham
Roa
d
SITE 170 Dwellings
SITE 24 Dwellings
Clevis Crescent
2030 PM PEAK 1700-1800

No. Vehs
HGVS 0% 0% 0%% HGVS 0 0 0
0% 0 6 2 1 00% 0 3913% 6 177
5 0 0%272 8 3%
243 1 316 192 6 3%6 0 62% 0% 2% 0% 0
#### 0#### ####
0 00 0 0 0%
0 ####
0 0#### 0%
0 0 ####0 0 0 0 ####0 00% #### 4% 0%
7 0160 119
99 1 1%2 0 0% 0% #### 0%
268 98 03% 0% 0%
0%0%
####0% 0%
#### 0% #### 0%
0% #### ####0%
#### ########
0% 0%
0% ####0
0%####
0% #### ####0%
0% 0%
Bridgend RoadNewton Nottage Road
Tyn
Y-Ca
eau
Lane
Brid
gend
Roa
d
Danygraig Avenue
Birc
h W
alk
Church Street
Clev
is
Clev
is La
ne
Clevis Crescent
Alde
nham
Roa
d
SITE 170 Dwellings
SITE 24 Dwellings
Heol-Y-Graig
2040 AM PEAK 0800-0900

No. Vehs
HGVS 0% 0% 0%% HGVS 0 0 0
0% 0 2 5 3 00% 1 3220% 0 198
1 0 0%432 0 0%
146 0 253 312 3.47 1%0 0 3.470% 0% 1% 0%
######## ####
0 00 0 0 0%
0 ####
#### 0%0 0 ####
0 0 0 0 ####0 00% #### 2% 0%
5 0247 126
65 0 0%7 0 0% 0% #### 0%
258 103 11% 11% 0%
0%0%
####0% 0%
#### 0% #### 0%
0% #### ####0%
#### ########
0% 0%
0% ####0
0%####
0% #### ####0%
0% 0%
Bridgend RoadNewton Nottage Road
Tyn
Y-Ca
eau
Lane
Brid
gend
Roa
d
Danygraig Avenue
Birc
h W
alk
Church Street
Clev
is
Clev
is La
ne
Alde
nham
Roa
d
SITE 170 Dwellings
SITE 24 Dwellings
Clevis Crescent
2040 PM PEAK 1700-1800

Appendix I

No. Vehs
HGVS 0% 0% 0%% HGVS 0 0 0
0% 0 5 2 1 00% 0 3523% 5.12 164
4 0 0%245 7.16 3%
230 1 299 179 5.12 3%5.12 0 5.12
2% 0% 2% 0% 0 00% 0 13
0% 0%0 01 10 0 0 0%
31 0 0%31 00 00% 0%
24 0 0%1 3 7 0 0%0 00% 0% 4% 0%
6.14 0144 108
90 1.02 1%2 0 0% 0% 0% 0%
244 8 0 0 07.16 0 1 0
3% 0% 0% 0 00% 0 00% 0 0
1 0 0%0 0 0% 0 0 0% 1 0
0 00% 0% 0% 0%
0 00% 0% 0% 0 31 13 00 0 0% 0 00 1
0 0 0% 1 0 0% 0 00 0 0% 0 0
0% 0%
0% 0%0 00 1
0 0 0%0 0 0 0 0%0 00% 0% 2 0 0%
0 0 0 0 0%0 00% 0%
Bridgend RoadNewton Nottage Road
Tyn
Y-Ca
eau
Lane
Brid
gend
Roa
d
Danygraig Avenue
Birc
h W
alk
Church Street
Clev
is
Clev
is La
ne
Clevis Crescent
Alde
nham
Roa
d
SITE 170 Dwellings
SITE 24 Dwellings
Heol-Y-Graig
2021 AM PEAK 0800-0900 + DEV

No. Vehs
HGVS 0% 0% 0%% HGVS 0 0 0
0% 0 2 4 3 00% 1 2860% 0 189
1 0 0%384 0 0%
133 0 229 294 3 1%0 0 30% 0% 1% 0% 0 0
0% 0 380% 0%0 02 29 0 0 0%
10 0 0%10 00 00% 0%
8 0 0%0 9 2 0 0%0 00% 0% 2% 0%
4 0219 114
61 0 0%6 0 0% 0% 0% 0%
237 9 0 0 03 1 0 2 01% 11% 0% 0 0
0% 0 00% 0 0
4 0 0%0 0 0% 0 0 0% 4 0
0 00% 0% 0% 0%
0 00% 0% 0% 0 10 38 00 0 0% 0 00 2
0 0 0% 0 0 0% 0 00 0 0% 0 0
0% 0%
0% 0%0 00 2
0 0 0%0 1 0 0 0%0 00% 0% 1 0 0%
0 0 0%0 00% 0%
Bridgend RoadNewton Nottage Road
Tyn
Y-Ca
eau
Lane
Brid
gend
Roa
d
Danygraig Avenue
Birc
h W
alk
Church Street
Clev
is
Clev
is La
ne
Alde
nham
Roa
d
SITE 170 Dwellings
SITE 24 Dwellings
Clevis Crescent
2021 PM PEAK 0800-0900 + DEV

No. Vehs
HGVS 0% 0% 0%% HGVS 0 0 0
0% 0 5 2 1 00% 0 3603% 5 168
4 0 0%250 7 3%
235 1 305 183 5 3%5 0 52% 0% 2% 0% 0 0
0% 0 130% 0%0 01 10 0 0 0%
31 0 0%31 00 00% 0%
24 0 0%1 3 7 0 0%0 00% 0% 4% 0%
6 0147 110
92 1 1%2 0 0% 0% 0% 0%
250 8 0 0 07 0 0 1 03% 0% 0% 0 0
0% 0 00% 0 0
1 0 0%0 0 0% 0 0 0% 1 0
0 00% 0% 0% 0%
0 00% 0% 0% 0 31 13 00 0 0% 0 00 1
0 0 0% 1 0 0% 0 00 0 0% 0 0
0% 0%
0% 0%0 00 1
0 0 0%0 0 0 0 0%0 00% 0% 2 0 0%
0 0 0 0 0%0 00% 0%
Bridgend RoadNewton Nottage Road
Tyn
Y-Ca
eau
Lane
Brid
gend
Roa
d
Danygraig Avenue
Birc
h W
alk
Church Street
Clev
is
Clev
is La
ne
Clevis Crescent
Alde
nham
Roa
d
SITE 170 Dwellings
SITE 24 Dwellings
Heol-Y-Graig
2025 AM PEAK 0800-0900+DEV
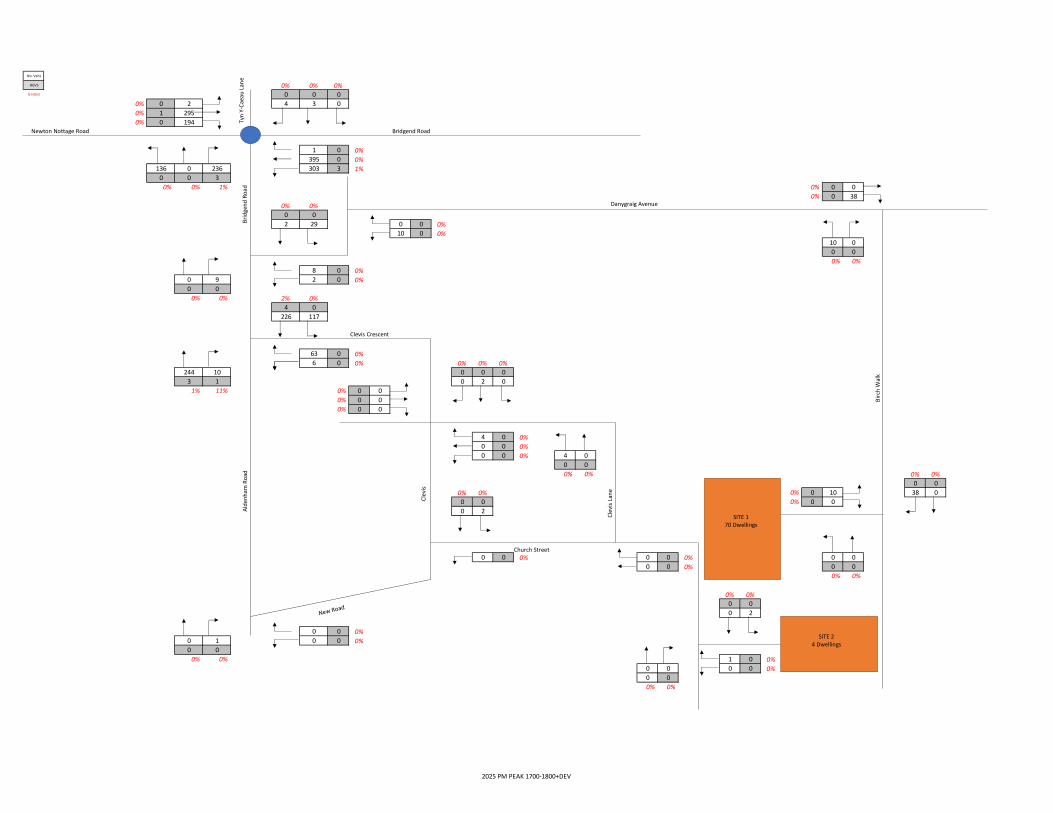
No. Vehs
HGVS 0% 0% 0%% HGVS 0 0 0
0% 0 2 4 3 00% 1 2950% 0 194
1 0 0%395 0 0%
136 0 236 303 3 1%0 0 3
0% 0% 1% 0% 0 00% 0 38
0% 0%0 02 29 0 0 0%
10 0 0%10 00 00% 0%
8 0 0%0 9 2 0 0%0 0
0% 0% 2% 0%4 0
226 117
63 0 0%6 0 0% 0% 0% 0%
244 10 0 0 03 1 0 2 0
1% 11% 0% 0 00% 0 00% 0 0
4 0 0%0 0 0% 0 0 0% 4 0
0 00% 0% 0% 0%
0 00% 0% 0% 0 10 38 00 0 0% 0 00 2
0 0 0% 0 0 0% 0 00 0 0% 0 0
0% 0%
0% 0%0 00 2
0 0 0%0 1 0 0 0%0 0
0% 0% 1 0 0%0 0 0 0 0%0 00% 0%
Bridgend RoadNewton Nottage Road
Tyn
Y-Ca
eau
Lane
Brid
gend
Roa
d
Danygraig Avenue
Birc
h W
alk
Church Street
Clev
is
Clev
is L
ane
Alde
nham
Roa
d
SITE 170 Dwellings
SITE 24 Dwellings
Clevis Crescent
2025 PM PEAK 1700-1800+DEV

No. Vehs
HGVS 0% 0% 0%% HGVS 0 0 0
0% 0 5 2 1 0 00% 0 3713% 5 173
4 0 0%258 8 3%
242 1 314 188 5 3%5 0 52% 0% 2% 0% 0 0
0% 0 130% 0%0 01 10 0 0 0%
30.8 0 0%31 0
0 0 00% 0%
24 0 0%1 3 7 0 0%0 0
0% 0% 4% 0%6 0
152 113.94
95 1 1%2 0 0% 0% 0% 0%
258 9 0 0 08 0 0 1 0
3% 0% 0% 0 00% 0 00% 0 0
1 0 0%0 0 0% 0 0 0% 1 0
0 00% 0% 0% 0%
0 00% 0% 0% 0 31 13 00 0 0% 0 00 1
0 0 0% 1 0 0% 0 00 0 0% 0 0
0% 0%
0% 0%0 00 1
0 0 0%0 0 0 0 0%0 0
0% 0% 2 0 0%0 0 0 0 0%0 00% 0%
Bridgend RoadNewton Nottage Road
Tyn
Y-Ca
eau
Lane
Brid
gend
Roa
d
Danygraig Avenue
Birc
h W
alk
Church Street
Clev
is
Clev
is La
ne
Clevis Crescent
Alde
nham
Roa
d
SITE 170 Dwellings
SITE 24 Dwellings
Heol-Y-Graig
2030 AM PEAK 0800-0900+DEV

No. Vehs
HGVS 0% 0% 0%% HGVS 0 0 0
0% 0 2 4 3 00% 1 3050% 0 200
1 0 0%408 0 0%
141 0 244 312 3 1%0 0 30% 0% 1% 0% 0 0
0% 0 380% 0%0 02 29 0 0 0%
10 0 0%10 00 00% 0%
8 0 0%0 9 2 0 0%0 00% 0% 2% 0%
4 0234 121
65 0 0%7 0 0% 0% 0% 0%
252 10 0 0 03 1 0 2 01% 11% 0% 0 0
0% 0 00% 0 0
4 0 0%0 0 0% 0 0 0% 4 0
0 00% 0% 0% 0%
0 00% 0% 0% 0 10 38 00 0 0% 0 00 2
0 0 0% 0 0 0% 0 00 0 0% 0 0
0% 0%
0% 0%0 00 2
0 0 0%0 1 0 0 0%0 00% 0% 1 0 0%
0 0 0 0 0%0 00% 0%
Bridgend RoadNewton Nottage Road
Tyn
Y-Ca
eau
Lane
Brid
gend
Roa
d
Danygraig Avenue
Birc
h W
alk
Church Street
Clev
is
Clev
is La
ne
Alde
nham
Roa
d
SITE 170 Dwellings
SITE 24 Dwellings
Clevis Crescent
2030 PM PEAK 1700-1800 +DEV

No. Vehs
HGVS 0% 0% 0%% HGVS 0 0 0
0% 0 6 2 1 00% 0 3913% 6 182
5 0 0%272 8 3%
254 1 330 198 6 3%6 0 62% 0% 2% 0% 0 0
0% 0 130% 0%0 01 10 0 0 0%
31 0 0%31 00 00% 0%
24 0 0%1 3 7 0 0%0 00% 0% 4% 0%
7 0160 120
100 1 1%2 0 0% 0% 0% 0%
271 9 0 0 08 0 0 1 03% 0% 0% 0 0
0% 0 00% 0 0
1 0 0%0 0 0% 0 0 0% 1 0
0 00% 0% 0% 0%
0 00% 0% 0% 0 31 13 00 0 0% 0 00 1
0 0 0% 1 0 0% 0 00 0 0% 0 0
0% 0%
0% 0%0 00 1
0 0 0%0 0 0 0 0%0 00% 0% 2 0 0%
0 0 0 0 0%0 00% 0%
Bridgend RoadNewton Nottage Road
Tyn
Y-Ca
eau
Lane
Brid
gend
Roa
d
Danygraig Avenue
Birc
h W
alk
Church Street
Clev
is
Clev
is La
ne
Clevis Crescent
Alde
nham
Roa
d
SITE 170 Dwellings
SITE 24 Dwellings
Heol-Y-Graig
2040 AM PEAK 0800-0900+DEV

No. Vehs
HGVS 0% 0% 0%% HGVS 0 0 0
0% 0 2 5 3 00% 1 3220% 0 211
1 0 0%432 0 0%
149 0 257 329 3 1%0 0 30% 0% 1% 0% 0 0
0% 0 380% 0%0 02 29 0 0 0%
10 0 0%10 00 00% 0%
8 0 0%0 9 2 0 0%0 00% 0% 2% 0%
5 0247 128
69 0 0%7 0 0% 0% 0% 0%
266 10 0 0 03 1 0 2 01% 11% 0% 0 0
0% 0 00% 0 0
4 0 0%0 0 0% 0 0 0% 4 0
0 00% 0% 0% 0%
0 00% 0% 0% 0 10 38 00 0 0% 0 00 2
0 0 0% 0 0 0% 0 00 0 0% 0 0
0% 0%
0% 0%0 00 2
0 0 0%0 1 0 0 0%0 00% 0% 1 0 0%
0 0 0 0 0%0 00% 0%
Bridgend RoadNewton Nottage Road
Tyn
Y-Ca
eau
Lane
Brid
gend
Roa
d
Danygraig Avenue
Birc
h W
alk
Church Street
Clev
is
Clev
is La
ne
Alde
nham
Roa
d
SITE 170 Dwellings
SITE 24 Dwellings
Clevis Crescent
2040 PM PEAK 1700-1800+DEV