st lucie nuclear plant,unit 1 reactor containment bldg
TRANSCRIPT

ST. LUCIE NUCLEAR PLANT UNIT 1
Jensen Beach, FloridaDocket Number 50-335
Reactor Containment BLIjidjngIntegrated Leakage Rate Test
ILRT AlR MASS3993 St. Lucie Unit P1 ILRT
Containment Alr Mass (LBS)676,000
675,800
.'irMass—Fitted Mas
675,600
675,400
675,200
675,0000 i 2 3 4 5 6 7 8
Time In Hours
ASGOAnZNSZRCHEngineeringand Construction Company
9308260374 930823PDR ADOCK 05000335P P,DR

A t

CONTAINMENT INTEGRATED LEAKAGE RATEFINAL COMPUTER GENERATED TEST REPORT
1993 ST. LUCIE UNIT 41 ILRT
Prepared for Florida Power and Light
Prepared by:K. Hartranft
Test EngineerApproved by:
DillonManager of Testing
Date of Test Completion: May 20, 3993

TABLE F CONTENTS
~Pa e
I. INTRODUCTIONAND SUMMARY
II. TEST DISCUSSION
A.
B.
Description of Containment
Description of ILRT Instrumentation
1.
2.3.4.5.
Temperature InstrumentationHumidity InstrumentationPressure InstrumentationFlow InstrumentationInstrument Selection Guide gSG) Calculation
C. Containment Pressurization Equipment
D. Description of the Computer Program
E. Description of the Testing Sequence
III. ANALYSISAND INTERPRETATION 12
A. Instrumentation System Performance
B. Temperature Stabilization Phase
C. Leakage Survey Phase
D.. Integrated Leakage Rate Phase
E. Verification Controlled Leakage Rate Phase
12
13
13
14
15
IV. FIGURES
RTD Location and VolumeRHD Location and VolumeFlow Diagram for Pressure Sensing and Controlled LeakageFlow Diagram for Pressurization SystemsFlow Diagram ILRT Data Collection, Storage, and Analysis

V APPENDICES
A. Tabulation of "As-Found" and "As-Left" ILRT Results
B. ILRT Computer-Generated Report
1.
2.3.45.
Test SequenceTemperature StabilizationIntegrated Leakage Rate TestVerification Controlled Leakage Rate TestNon-Test Period Data
C. Local Leakage Rate Testing Conducted Since the Last ILRT
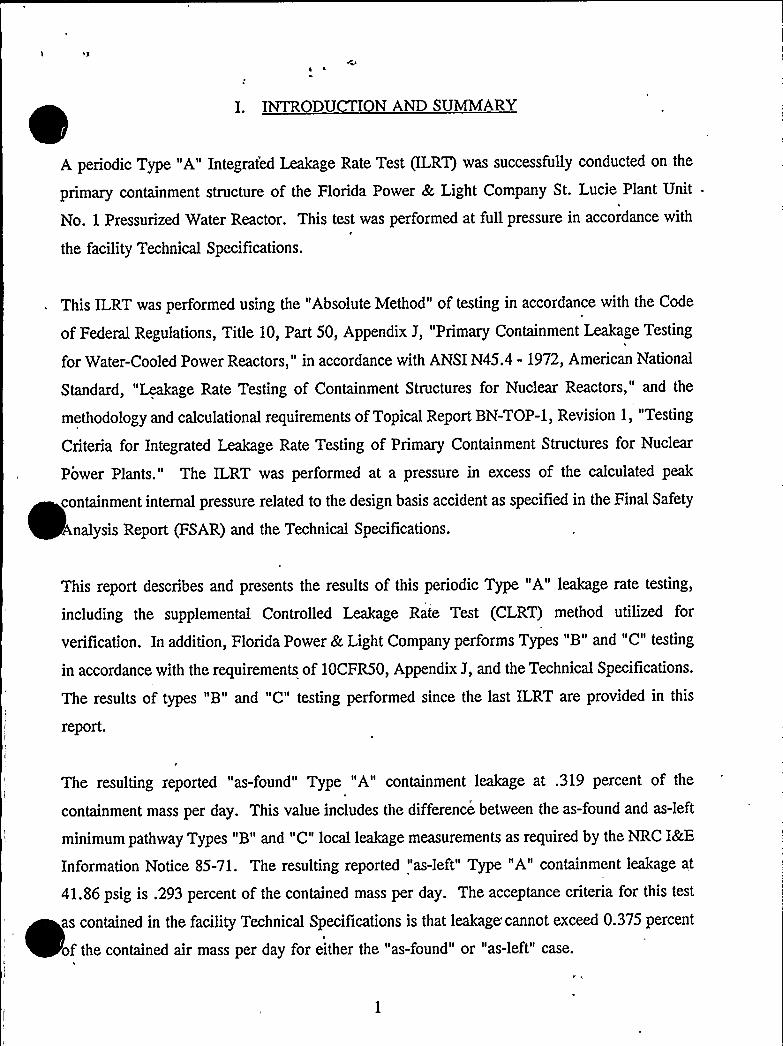
I. INTR DUCTION AND SUMMARY
A periodic Type "A" Integrat'ed Leakage Rate Test (ILRT) was successfully conducted on the
primary containment structure of the Florida Power & Light Company St. Lucie Plant Unit
No. 1 Pressurized Water Reactor. This test was performed at fullpressure in accordance with
the facility Technical Specifications.
This ILRT was performed using the "Absolute Method" of testing in accordance with the Code
of Federal Regulations, Title 10, Part 50, Appendix J, "Primary Containment Leakage Testing
for Water-Cooled Power Reactors," in accordance with ANSI N45.4 - 1972, American National
Standard, "Leakage Rate Testing of Containment Structures for Nuclear Reactors," and the
methodology and calculational requirements of Topical Report BN-TOP-1, Revision 1, "Testing
Criteria for Integrated Leakage Rate Testing of Primary Containment Structures for Nuclear
Power Plants." The ILRT was performed at a pressure in excess of the calculated peak
containment internal pressure related to the design basis accident as specified in the Final Safety
Analysis Report (FSAR) and the Technical Specifications.
This report describes and presents the results of this periodic Type "A" leakage rate testing,
including the supplemental Controlled Leakage Rate Test (CLRT) method utilized for
verification. In addition, Florida Power &Light Company performs Types "B" and "C" testing
in accordance with the requirements of 10CFR50, Appendix J, and the Technical Specifications.
The results of types "B" and "C" testing performed since the last ILRT are provided in this
report.
The resulting reported "as-found" Type "A" containment leakage at .319 percent of theI
containment mass per day. This value includes the difference between the as-found and as-left
minimum pathway Types "B" and "C" local leakage measurements as required by the NRC I&E
Information Notice 85-71. The resulting reported "as-left" Type "A" containment leakage at
41.86 psig is .293 percent of the contained mass per day. The acceptance criteria for this test
as contained in the facility Technical Specifications is that leakage cannot exceed 0.375 percent
of the contained air mass per day for either the "as-found" or "as-left" case.

II. TEST DISCUSSION
A. Descri tion of the ontainment
The containment vessel completely encloses the entire reactor and reactor coolant system to
ensure no leakage of radioactive materials to the environment in the unlikely event of a loss of
coolant accident.
The containment system incorporates a free-standing containment vessel surrounded by a low-
leakage concrete shield building. A four-foot annular space is provided between the outer wall
of the containment vessel and the inner wall of the shield building to allow filtration of
containment vessel leakage during accident conditions to minimize off-site doses.
The free-standing containment vessel is a two-inch thick hemispherical dome and two-inch thick
~
~
~ellipsoidal bottom. The overall vessel dimensions are 140-foot diameter by 232-foot high. The
essel wall thickness is increased to a minimum of four inches adjacent to all penetrations arid
openings. The vessel is fabricated of ASME-SA 516 Grade 70 fully killed pressure vessel
quality steel plate. The net free volume of the containment vessel is 2.5 x 10'ubic feet.
The containment vessel structure includes one personnel airlock, one emergency escape lock,
one fuel transfer tube, one equipment maintenance hatch and one seal-welded construction hatch.
All process piping and electrical penetrations are welded directly to the containment vessel
nozzles with the exception of the main steam, main feedwater, and fuel transfer tube
penetrations. These penetrations are provided with testable multiple ply expansion bellows to
allow for thermal growth or building differential motion.
The containment vessel is designed and constructed in accordance with the requirements for
Class MC vessels contained in Section IIIof the ASME Code (1971 Edition). The containment
vessel is code stamped for a design internal containment pressure of 44 psig at a temperature of
64'F. The containment vessel and all penetrations are designed to limit leakage to less than
0.5 percent by weight of the contained air per day at the above design conditions. The
culated peak accident pressure for the design basis accident for the St. Lucie Plant Unit No.
is 39.6 psig.
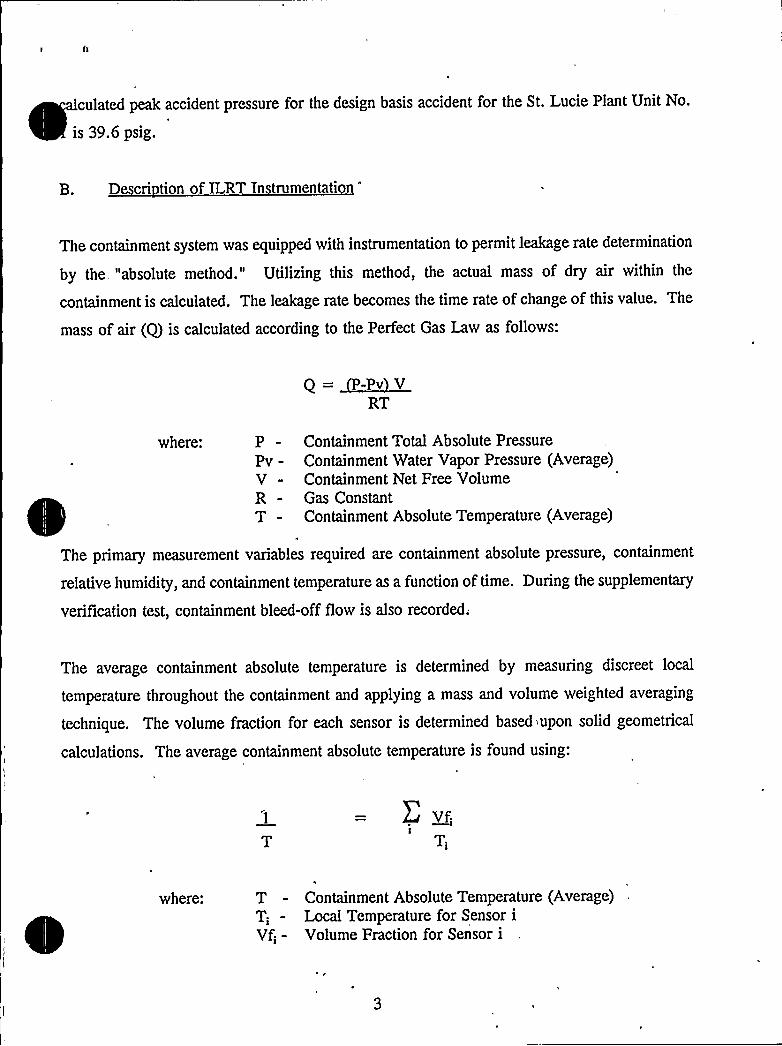
B. Descri tion of ILRT Instrumentation
The containment system was equipped with instrumentation to permit leakage rate determination
by the "absolute method." Utilizing this method, the actual mass of dry air within the
containment is calculated. The leakage rate becomes the time rate of change of this value. The
mass of air (Q) is calculated according to the Perfect Gas Law as follows:
Q=~Pv VRT
where: P - Containment Total Absolute Pressure
Pv - Containment Water Vapor Pressure (Average)V - Containment Net Free VolumeR - Gas ConstantT - Containment Absolute Temperature (Average)
The primary measurement variables required are containment absolute pressure, containment
relative humidity, and containment temperature as a function of time. During the supplementary
verification test, containment bleed-off flow is also recorded;
The average containment absolute temperature is determined by measuring discreet local
temperature throughout the containment and applying a mass and volume weighted averaging
technique. The volume fraction for each sensor is determined based iupon solid geometrical
calculations. The average containment absolute temperature is found using:
Vf;
where: T - Containment Absolute Temperature (Average)T; - Local Temperature for Sensor iVf; - Volume Fraction for Sensor i

verage containment water vapor pressure is determined by measuring discreet relative
umidities throughout the containment, converting this to local vapor pressures using local group
temperatures, steam tables, and applying a mass and volume weighted averaging technique. The
volume fractions for the relative humidity sensors are determined in the same manner as for the
temperature sensors above. The average containment water vapor pressure is determined by:
Pvj = (%RH)j—————x (Psat for TLocalj)100
Pvj VFjPv = TE
i TLocalj
where: PvPvjT"TLocalj
[%RH)j
Containment Water Vapor Pressure (Average)Calculated Local Vapor Pressure for Sensor ~
Volume Fraction for Sensor jContainment Absolute Temperature (Average)Local Group Average Temperature NearSensor jRelative Humidity for Sensor jSteam Table Saturation Pressure
The Instrument Selection Guide, or ISG, is used to determine the ability of the instrumentation
system to measure the leakage rate. The calculated ISG for this test met the acceptance criteria
for all test instrumentation systems.
1, Tem erature Instrumentation
Forty (40) precision Resistance Temperature Detectors (RTDs) were located throughout the
containment to allow measurement of the weighted average air temperature. The location of the
temperature detectors in the containment is depicted in Figure 1. Each RTD sensor was supplied
with a calibrated resistance versus temperature curve accurate to +0.5'F. The sensitivity and
repeatability of each RTD sensor is less than +0.01'F.
The signal conditioning circuit and readout for the RTD sensors was a Fluke data logger
perating in a constant current mode. The operating parameters for the RTD constant currentI
card are accuracy of +0.16'F and resolution of +0.01'F.

ch RTD was in-situ calibration checked after installation to verify correct operation, The data
ogger operating as a total loop with an RTD in the circuit had a repeatability of J0.02'F and
a resolution of +0.01'F.
2. Humidit Instrumentation
Ten (10) Resistance Humidity Detectors (RHDs) were located throughout the containment to
allow measurement of the weighted average containment vapor pressure. The location of the
RHDs in the containment is depicted in Figure 2. The calibrated accuracy of the RHDs is +2.5
percent RH, the repeatability of the RHDs is +0.25 percent RH, and the sensitivity, of the RHDs
is +0.1 percent RH.
The readout device used for the RHDs was a Fluke data logger. The repeatability of this device
is'0.01 percent RH while the resolution of the device is +0.01 percent RH.
ch RHD was in-situ calibration checked after installation to verify correct operation.
h
3. Pressure Instrumenta ion
Two Volumetrics precision pressure monitors measure containment absolute pressure. Figure 3
depicts the arrangement of the tubing connections between the monitors and the containment.
Either monitor could be used as the primary pressure sensor for leakage rate calculations with
the remaining sensor as a backup. The calibrated accuracy of the monitors is +0.015 percent
of reading. The sensitivity, repeatability, and resolution of the monitors is +0.001 psi. Binary
Coded Decimal (BCD) output from both monitors connects to the Fluke data logger.
4. Flow Instrumentation
A variable area float-type rotameter was used to superimpose leakage during the supplementary
~
~
CLRT. The piping connection between the rotameter and the containment is shown in Figure 3.

he accuracy, repeatability, and sensitivity for the rotameter in units of SCFM and converted
o equivalent leakage values is given below:
~SFMEquivalent~Leaka e
Peak Pressure Rotameter Accuracy +0.20Repeatability +0.05Sensitivity +0.05
+0.0031 %/day+0.0008 %/day+0.0008 %/day
5. Instrument election Guide S alculation
The Instrument Selection Guide is a method of compiling the instrumentation sensitivity and
resolution for each process measurement variable used during the ILRT and evaluating the total
instrumentation systems'bility to detect leakage rates in the range required. The ISG formula
is described in the American National Standard ANSI/ANS 56.8-1987. Although the ISG is a
very conservative measure of sensitivity, the general industry practice as for this test has been
o require sensitivity at least four times better than the containment allowable leakage or
ISG < 0.25La.
The calculated ISG for the instrumentation used for this test was .0027 percent per day, for an
8-hour test. The allowable value for this test is 0.25La or 0.125 percent per day, for an 8-hour
test. The ISG calculation met all recommended criteria and demonstrated the ability of the ILRT
instrumentation system to measure containment leakage with a sensitivity exceeding that required
by the appropriate industry standards.
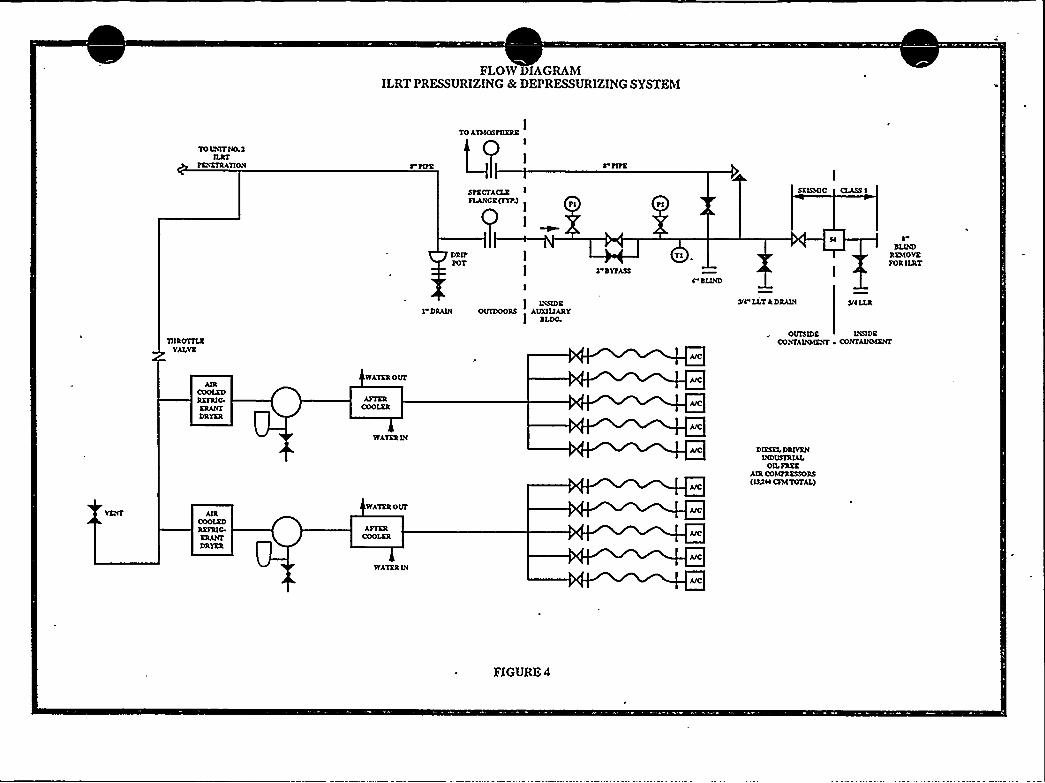
C. ntainment Pressurization ui ment
The equipment used to pressurize the containment is shown in Figure 4. The ten oil-free
industrial diesel-driven air compressors had a total nominal capacity of 13,200 ACFM. The
compressed air was then routed to water-cooled aftercoolers, moisture separators, and refrigerant
air dryers. This equipment assured that clean, and dry air was used to pressurize the~
~ontainment.
Descri tion of the Com uter Pro ram
The Ebasco ILRTcomputer program is an interactive program written specifically for fast, easy
utilization during all phases of the ILRT and CLRT. The program is written in a high level,
compiled, structured language and operated on an MS-DOS personal micro-computer. The
program has been verified and meets all requirements of the Ebasco Quality Assurance Program.
Normal data entry to the computer is automatic via the data logger, As necessary, data entry
and modifications are readily accomplished manually by the data acquisition team. Besides
providing extensive data verification routines, the program calculates total time and mass point
leakage rates and the 95 percent Upper Confidence Level for these leakage rate calculations.
Methodology and calculations in the program drive from American National Standards ANSI
N45.4-1972, American National Standard ANSI/ANS 56.8-1987, and Topical Report
BN-TOP-1, Revision 1. Containment air mass is determined from mass weighted sensor
readings as described in EPRI Report NP-2726, November 1982.
A given instrument may be deleted from the calculations ifa sensor malfunctions. The deletion
of a given instrument is performed on all samples in the data base. Volume fractions for the
remaining instruments of that type are then recalculated based upon the placement and the
amount of containment volume sensed'by these instruments.
,Data evaluations are enhanced by the flexible display of either sensor variables or various
computed values in tabular or graphical form on the computer screen or printer. Data is
recorded on magnetic media to prevent loss during the testing. All data is stored on the
computer system in use, with retrieval capability to any desired database throughout the testing.
Two computer systems are utilized, one for data acquisition and one for data analysis.'ne
computer can serve for both data acquisition and data analysis in the case of equipment
malfunction.
Data rejection based upon the Chauvenet criterion may be utilized in the analysis, ifrequired.

Ancillary portions of the computer program assist the user in determination of temperature
tabilization, determining the ILRT termination criteria, performing ISG calculations, performing
in-situ instrument loop performance calculations and determination of acceptable superimposed
CLRT leakage verifications.
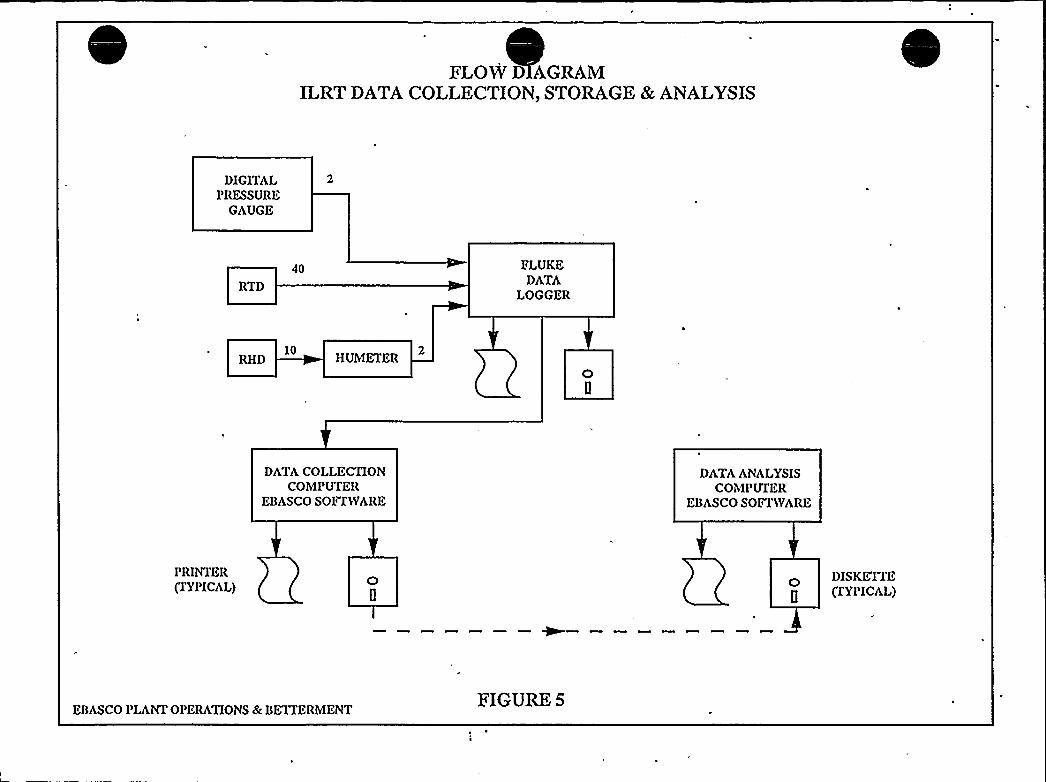
Temperature, pressure, and humidity data transmit from the ILRT instrumentation system to the
computer via an RS-232 link at 20 minute intervals. Figure 5 depicts the connection between
the ILRT instrumentation system and the computer analysis system.
E. Descri tion of the Testin S uence
The ILRT instrumentation system checks found RTD-33 recording eratically. RTD-33 was
declared inoperable prior to pressurization and deleted from the ILRT. The volume fractions
for the remaining RTD channels was recalculated following the deletion of RTD-33. All other
ILRT instrumentation was declared operable with performance within manufacturer's tolerances.
ressure sensor No. 2 was selected to be the primary pressure instrument, as it had exhibited
better repeatability and stability during the in-situ testing.
Two penetrations were required to be in service during the ILRT and were not lined up to
simulate accident conditions, P-52D gLRT Pressure Sensing Line) and P-52E gLRT Controlled
Bleedoff Line). These two ILRT penetrations are used to conduct the test and cannot be
positioned in the post-accident lineup. The minimum pathway leakage for those penetrations,
determined during Type "C" local testing, is added to the measured ILRT leakage to account
for these penetrations being in service during the test (refer to Appendix A).
Preparations to pressurize the containment for the conduct of the ILRT included internal and
external inspections of the containment structure; installation and checkout of the ILRT
instrumentation; Types "B" and "C" local leakage rate tests; alignment of valves and breakers
for test conditions; and the installation and checkout of the. temporary pressurization facilities.
These preparations were completed on May 19, 1993.
ressurization of the containment structure started at 0320 hours on May 19, 1993, at an average
ressurization rate of 4.5 psi/hr. Appendix B.1 presents a figure entitled "ILRT Testing
Sequence" that depicts the sequence of testing.
During the initial stages of pressurization, fan cooler units 1B and 1D were in service and
utilized to provide a better mixing ofpressurization air with the initial containment atmosphere.
Fan cooler 1D was removed from service at 0420 hours and 1B was removed at 0430 hours after
both reached 155 amps for operation.
Pressurization was secured at 12:39 hours on May 19, 1993, at a final pressure of 56.56 psia
(41.86 psig). This pressure is 2 psi above the minimum test pressure to account for the expected
pressure decrease due to temperature stabilization and to allow for some leakage margin during
the test sequence.
Data acquisition and analysis for the temperature stabilization phase was begun at 12:42 hours
n May 19, 1993. Plots of containment air mass versus time demonstrated that leakage might
exist above the "as found" ILRT acceptance criteria at a 95% upper confidence level. At 14:30
hours, the leakage survey teams found that the containment emergency sump suction isolation
valves MV-07-2Aand 2B were leaking air into the safety injection system. As these valves are
not containment leakage paths in accordance with the FSAR and technical specifications, a
decision was made to manually tighten these valves with no penalty to the "as-found" ILRT
values. These valves were manually tightened shortly after 14:45 hours on May 19, 1993, and
the stabilization phase was extended to monitor whether this correction was acceptable. The
containment stabilization was met at 16:42 hours on May 19, 1993, after four hours of data
acquisition to assure stabilization. Stabilization was extended and with air mass, temperature,
and pressure demonstrating smooth and expected behavior, all stabilization criteria contained in
Topical Report BN-TOP-1 were declared met.
Integrated leakage rate measurements were initiated at 18:25 hours on May 19, 1993. At 20:10
hours, the control room reported a pressurizer low level indication. Charging was initiated at
20:30 hours and completed at 21:10 hours, increasing the pressurizer level 20%, or 44 gallons

er minute for 48 minutes (2112 gallons or volume of 282.3 ft'). The decrease in pressurizer
vel was caused by an approximate 1.87 gpm reactor coolant leak in the shutdown cooling
system outside of containment. This leak could not be isolated without altering the ILRT valve
lineup. This net loss of RCS inventory was equivalent to a .004 %/day containment leak. The
decision was made to complete the ILRTwith this RCS leak present. Conducting the ILRTwith
this RCS leak gives an overly conservative representation of containment leakage.
It was determined that the change of 282.3 ft in volume provided by charging the pressurizer
would adversely affect leakage observations made thus far during the test. The addition of 2112
gallons provided a decrease in containment volume and was observed by the ILRT
instrumentation as a leak into containment. Thus the 48 minutes of "in leakage" analyzed with
the predictable trends observed from 18:25 to 21:10 on May 19, 1993 provided overall leakage
rates which might be suspect to CLRT acceptability.
The determination was to restart the test following the charging of the pressurizer to obtain test
ata which would provide a predictable trend and provide for a more solid assurance of CLRT
confirmation.
The ILRT was restarted at 21:05 hours on May 19, 1993 and after eight hours of ILRT data
accumulation, all Topical Report BN-TOP-1 acceptance criteria for the ILRT were met with
stable and predictable trends. The ILRT was officially terminated at 05:05 hours on May 20,
1993.
At 05:05 hours, a super-imposed flow equivalent to .293 %/day was initiated using the
rotameter. This flow was maintained during the required BN-TOP-1 controlled leakage rate test
(CLRT) stabilization period of approximately one hour.
At 06:05 hours, on May 20, 1993, the leakage rate measurements for the CLRT were initiated.
Stable and acceptable leakage rate measurements were observed for four hours. At 10:05 hours,
all Topical Report BN-TOP-1 criteria were met for the CLRT verification test, and the test was
eclared acceptable.
10
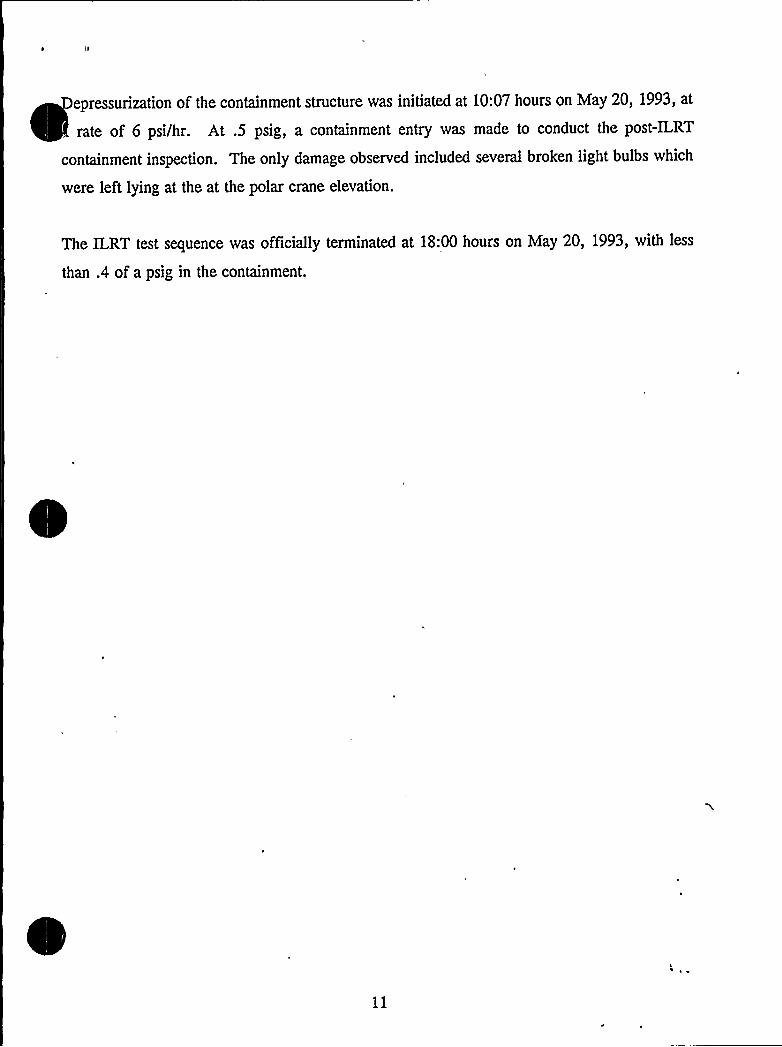
epressurization of the containment structure was initiated at 10:07 hours on May 20, 1993, at
rate of 6 psi/hr. At .5 psig, a containment entry was made to conduct the post-ILRT
containment inspection. The only damage observed included several broken light bulbs which
were left lying at the at the polar crane elevation.
The ILRT test sequence was officially terminated at 18:00 hours on May 20, 1993, with less
than .4 of a psig in the containment.
11

III. ANALYSIS AND INTERPRETATION
A. In trumentation S stem Performance
Only the RTD-33 temperature detector, which was deleted prior to the pressurization of the
containment, failed to perform properly. All of the remaining temperature detectors
performed as expected with no anomalous behavior detected by the Ebasco ILRT computer
program error checking routines. This computer program also determines the in-situ
temperature loop repeatability which consists of process measurement variations as well as
sensor noise. The average in-situ loop repeatability for the 39 operating temperature sensors was
.013'F, with the worst sensor exhibiting an in-situ loop repeatability of .041'F. This
performance compares well with the vendor-claimed temperature sensor loop repeatability,
excluding process variations, of 0.02'F as given in Section II.B.1.
~
~
~
~
Ten relative humidity sensors were installed in the containment for the ILRT. The ten operating
hannels for humidity operated as expected with no anomalous behavior detected by the ILRT
computer program error checking routines. The average in-situ loop repeatability for the relative
humidity sensors was .100 percent RH, with the worse sensor exhibiting an in-situ loop
repeatability of .229 percent RH. This performance is better than the vendor claimed humidity
sensor loop repeatability, excluding process variations, of 0.25 percent RH as given in Section
II.B.2.
Two pressure sensors were installed for the ILRT, with one utilized for testing and one
considered as a spare. Prior to containment pressurization, computer analysis demonstrated that
pressure sensor 1 was more stable over an eight-hour period than the other sensor. During the
ILRT, the in-situ pressure loop repeatability for both sensors was 0.0010 psi. This performance
compares well with the vendor-claimed pressure sensor loop repeatability, excluding process
variations, of 0.0015 psi as given in Section II.B.3.
The variable area rotameter performed as expected with no evidence of unstable readings, float
ticking, or moisture in the float tube.
12

In summary, all of the ILRT test documentation performed in an adequate manner to allow
etermination of containment leakage rates to the sensitivity required.
B. Tem rature Stabilizati n Pha e
Prior to pressurization of the containment, the atmosphere was very stable with an average
temperature of 85.53'F and a maximum spread of temperature from the highest reading sensor
to lowest reading sensor of 2.4'F. During pressurization, the heat of compression of the air
occurs mainly at the top of the containment with colder pressurization air being added at the
bottom. At the end of pressurization, the average temperature was 100.72'F with a maximum
spread of temperature from the highest reading sensor to lowest reading sensor of 26.46'F.
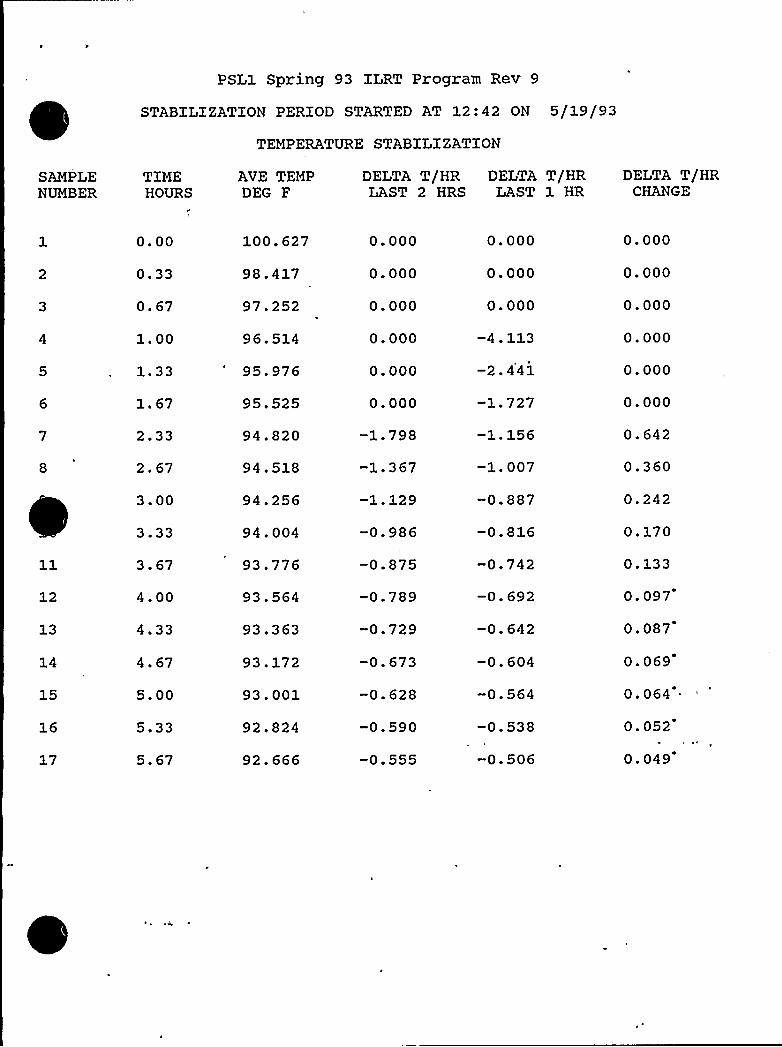
The results of the temperature stabilization phase are presented in Appendix B.2. The
acceptance criteria given in Topical Report BN-TOP-1, Revision 1, are described in Note 2 in
that appendix. The data presented shows that a smooth and predictable temperature stabilization
~
~
ccurred. At the end of stabilization, the average temperature was 92.6TF with a maximum
spread of temperature from the highest reading sensor to the lowest reading sensor of 11.2'F.
This demonstrates that the heat sinks of concrete and steel in the containment were quickly
returning the containment atmosphere to a stable condition.
C. Leaka e Surve Phase
As the containment began to stabilize, a preliminary review of leakage rate demonstrated
excessive leakage values. Leakage survey teams reported that a leak on both containment
emergency sump suction lines had been found by venting air from the outboard side of isolation
valves MV-07-2A and 2B. Observations by the leakage survey team allowed for the possibility
that these two emergency sump suction isolation valves were not fully closed.
These two isolation valves are not considered as potential leakage barriers in the Final Safety
Analysis Report (PSAR) Sections 6.2.4.2 and 6.2.4.4, as they willbe water covered in a Loss
fCoolant Accident and open during the recirculation phase of the transient. Any water leakage
13

through these valves in the closed position will be returned to the containment by the Safety
jection System pumps. No potential containment leakage or off-site dose is credible due to
seat leakage of these valves in the closed position.
These two isolation valves were then manually closed with subsequent containment leakage rates
reduced.
No other appreciable leakage was noted by the survey teams and the ILRT phase was initiated.
D. Inte rated Leaka e Rate Phase
Leakage measurements were started after stabilization and resolution ofpressurizer level changes
at 21:05 hours on May 19, 1993. As previously mentioned in Section II Part E, the charging
of the pressurizer was observed as "in leakage" during the test and, when coupled with the
predictable leakage data, warranted restart of the ILRT test sequence, The level change
decrease) over the period of the test, however, was not viewed as a problem. The slow and
gradual decrease in pressurizer level would be observed as a leak by the ILRT instrumentation
(because a decrease in level means a proportionate increase in containment volume). Therefore,
the leakage rate observed would be conservative in that it was accounting additionally for
pressurizer level decrease. It would be expected that this predictable trend would be confirmed
with the CLRT but may be low within the CLRT acceptability range.
Stable leakage rates were measured by both the total time method and mass point method. The
total time BN-TOP-1 results for eight hours of leakage measurements are presented in Appendix
B.3. A summary of the measured leakage by both methods after eight hours is:
BN-TOP-1Total Time
ANSI 56.8~Mass Pain
Simple Leakage Rate 0.116 %/dayFitted Leakage Rate 0.154 %/dayUpper Confidence Level 0.293 %/day
0.116 %/day0.123 %/day0.133 %/day
14

~
~
The higher upper confidence level of the BN-TOP-1 measurements is due to the nature of
rforming regression analysis on simple leakage rates instead of regression analysis on masses
and the more conservative statistics utilized by BN-TOP-1. The measured leakage rates and
upper confidence levels for both calculated methods were slowly decreasing with time.
As all acceptance criteria for a Reduced Duration BN-TOP-1 ILRT were met at eight hours as
presented in Appendix B.2, the ILRT was declared acceptable. Appendix A presents the
corrections to the measured ILRT leakage rates for local leakage rate measurements for both the
"as-found" and "as-left" cases. As a result of the Type "B" and "C" local leakage rate testing
and repairs performed during the refueling outage, additions to the "as-found" Type "A" ILRT
results were necessary to NRC Information Notice 85-71. These additions were for the
reduction in minimum pathway leakage due to repairs. These leakage reductions have been
corrected for uncertainties prior to being added to the measured ILRT values (refer to
Appendix A).
Verification ontrolled Leaka e Rate Phase
'ubsequentto the acceptance of the ILRT results, a superimposed leakage equivalent to 0.293
percent per day was added to the existing containment leakage using the variable area rotameter.
A one-hour stabilization period was allowed to lapse after addition of this leakage in accordance
with the requirements of Topical Report BN-TOP-1.
Leakage measurements were initiated to verify the results of the ILRT. The minimum duration
for the Controlled Leakage Rate Phase was determined to be four hours in accordance with
Topical Report BN-TOP-1. As presented in Appendix B.4, the leakage measurements met the
acceptance criteria for the verification phase. Leakage results for both the total time and mass
point method are:
BN-TOP-1Total Time
ANSI 56.8Mass Point
Simple Leakage RateFitted Leakage Rate
0.353 %/day0.328 %/day
0.353 %/day0.348 %/day

The acceptance criteria for this test is leakage between .322 and .572 percent per day. Results
ere expected to be low within this range due to pressurizer level change and the conservatism
of the measured leak as previously discussed in Section IIIPart D. The results of the CLRT are
acceptable.
16

szcnox cv

RTD LOCATION/VOLUMEST. LUCIEUNITNO. 1
FLORIDAPOWER 8c LIGHTCOMPANY
3 RTD'S ATEL194'OLUME
242,055 CU FTRTD 38-40
9 RTD'S ATELEVATION171'OLUME
453,235 CU FTRTD 29-37
10 RTD'S ATELEVATION130'OLUME
669,627 CU FTRTD 9-18
10 RTD'S ATELEVATION84'OLUME
600,926 CU FTRTD 19-28
8 RTD'S ATELEVATION40'OLUME
534,157 CU FTRTD 1-8
EBASCO PLANTOPERATIONS &, BEITERMENT
FIGURE 1

RHD LOCATION/VOLUMEST. LUCIEUNITNO. 1
FLORIDAPOWER 8c LIGHTCOMPANY
3 RHD'S ATELEVATION171'OLUME
1,049,347 CU FTRHD 8-10
4 RHD'S ATELEVATION
84'OLUME
900,640 CU FTRHD 4-7
3 RHD'S ATELEVATION40'OLUME
550,013 CU FTRHD 1-3
FIGURE 2
EBASCO PLANTOPERATIONS Ec BETTERMENT

X~'LOW D RAMILRTPRESSURE SENSING 4 CONT LED LEAKAGEINSTRUMENTS
INSIDECONTAINiVfHNT
OIJISIDECOYfAINMHN'I'I
3/8" 'fUBING 1Q" TUBING (TYP.)
P52H
DIGITALPRESSURE
GAUGE
TO ATMOS-
LLRTESTDIGITAL
PRESSUREGAUGE
VARIABLEAREAROTAMHTHR
1" PIPE1Q" DRAIN&TEST
Fl
P52D
LLRTEST—
SEISMIC CLASS 1~ V2" DRAIN&TEST
FIGURE 3
FLOW IAGRAMILRTPRESSURIZING & DEPRESSURIZING SYSTEM
TO i&ITM.1ILRT
PRNRIRA'IION
TO AIMOSPIIRRE
t9FLANCR (fYPJ
I
Pl
I
SEISMIC CLASS I
DRIPFOT
S" BYPASS
BLLiDREMOVEFOR ILRT
IllROTILEVALVE
LVVIDRI DRAIN OVIDOORS AVXIIIARY
BLDO
3(i"LLTR DRAIN
OVISIDR LNSIDRCOÃIAlhMLVf COVfAINMRNT
WAIXROVf
WAIXRLI
DIESEL DRIVENLKNKIRIAL
OILFREEADICOMPRRSSORS<ILIMCFM TOTAL)
WATER0Vf
WAIXRLI
FIGURE 4
FLOW D AGRAMILRTDATACOLLECTION, STORAGE R ANALYSIS
DIGITALPRESSURE
GAUGE
RTD
40 FLUKEDATA
LOGGER
RHD10
HUMETER2
O0
DATACOLLECTIONCOMPUTER
EBASCO SO&"I'WARE
DATAANALYSISCOMPUTER
EBASCO SOFTWARE
PRINTER(TYPICAL) O
0O0
DISKEPI'E(TYPICAL)
EBASCO PLANTOl'ERATIONS 8c BETTERMENTFIGURE 5

1
szerroi v
wrrmnrczs

APPENDXX A "
TABULATIONOP "AS-POUND" AND "AS-LEFT"
ILRT RESULTS

APPENDIX A
TABULATIONOF "AS-POUND" AND "AS-LEFT" ILRT RESULTS
Correction of ILRT Results for "As-Found" Case
In accordance with NRC ISAAC Information Notice 85-71, the following additions are required
to the ILRT results due to repairs and/or adjustments made due to local leakage rate testing
during the 1993 refueling outage. The corrections include only repairs or adjustments made to
containment leakage boundaries which were made prior to the ILRT. These corrections are the
difference between the pre-repair and post-repair leakages calculated in the minimum pathway
case and corrected for uncertainties in the measurements.
, ~Penetrati n
Minimum Pathway
Leaka e Difference gnncertaint .
ILRT
~orrection
P-11 Containment Purge Exhaust 42,000 sccm 1,900 sccm '3,900 sccm
P-52A Sample to Rad Monitor 830 sccm 11'.5 sccm 841.5 sccm
P-52B Sample to Rad Monitor 870 sccm 11.5 sccm 881.5 sccm
P-52C Rad Monitor Return 30 sccm 1.6 sccm 31.6 sccm
P-54 ILRT Press. Station 300 sccm 98.1 sccm 398.1 sccm
P-68 Cont. Vacuum Relief 1100 sccm 98.1 sccm 1198.1 sccm
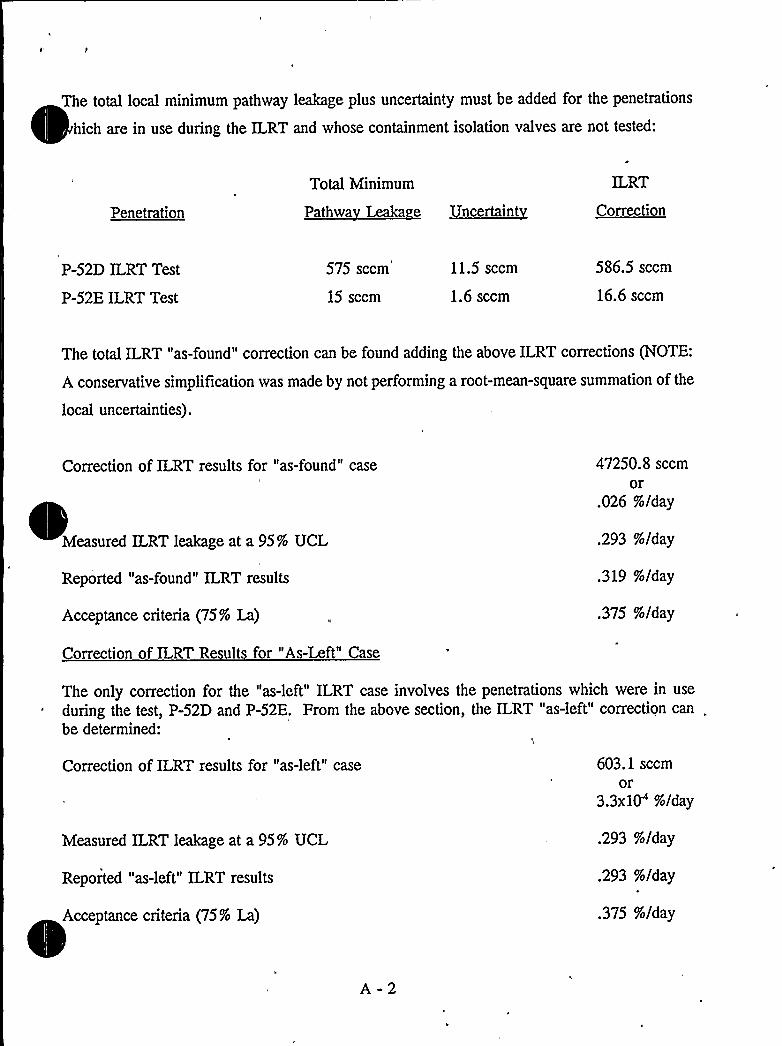
The total local minimum pathway leakage plus uncertainty must be added for the penetrations
hich are in use during the ILRT and whose containment isolation valves are not tested:
Penetration
Total Minimum ILRT
Correction
P-52D ILRT Test
P-52E ILRT Test
575 sccm
15 sccm
11.5 sccm
1.6 sccm
586.5 sccm
16.6 sccm
The total ILRT "as-found" correction can be found adding the above ILRT corrections (NOTE:
A conservative simplification was made by not performing a root-mean-square summation of the
local uncertainties).
Correction of ILRT results for "as-found" case 47250. 8 sccmor
.026 %/day
Measured ILRT leakage at a 95% UCL
Reported "as-found" ILRT results
Acceptance criteria (75% La)
.293 %/day
.319 %/day
.375 %/day
Correction of ILRT Results for "As-Left" Case
The only correction for the "as-left" ILRT case involves the penetrations which were in use
during the test, P-52D and P-52E. From the above section, the ILRT "as-left" correction can
be determined:
Correction of ILRT results for "as-left" case 603.1 sccmor
3.3x10'/day
Measured ILRT leakage at a 95% UCL
Reported "as-left" ILRT results
Acceptance criteria (75% La)
.293 %/day
.293 %/day
.375 %/day
A-2
APPENDIX B
ILRT COMPVTER-GENERATED REPORT

ILRT TEST SEQUENCE
1993 ST. LUCIE UNIT 1 PERIODIC TEST
Sequence Started 03:19, 5/19/93Sequence Ended 19:10, 5/20/93
EBASCO SERVICES INC.Plant Operations A Betterment Dept.
ILRT TEST SERVICES
APPENDIX B.1

ILRT TESTING SEQUENCE1998 St. Lucie Unit P1 ILRT
Pressure In Pslg
D
30
20
A - Pressurization--- B - Stabilization
C - ILRTD - CLRT
E - Depressurization
10
00 5 10 $ 5 20 25 30
Time ln Hours
EBASCO Rant Operdfae 4 Betterment

l
11
I~
I
i.i
r-J C
I
'q'"i
a
~N 4
'I
lW
i I I
lll~ I
1

TEMPERATURE STABILIZATIONMODE
1993 ST. LUCIE UNIT 1 PERIODIC TEST
Sequence Started 12:42, 5/19/93Sequence Ended 18:22, 5/19/93
EBASCO SERVICES INC.Plant Operations A Betterment Dept.
P
ILRT TEST SERVICES
APPENDIX B.2
0PSL1 Spring 93 ILRT Program Rev 9
STABILIZATION PERIOD STARTED AT 12:42 ON 5/19/93
TEMPERATURE STABILIZATION
SAMPLENUMBER
TIMEHOURS
AVE TEMPDEG F
DELTA T/HR DELTA T/HR DELTA T/HRLAST 2 HRS LAST 1 HR CHANGE
12
15
16
0. 00
0.33
0.67
1.00
1.33
1.67
2.33
2.67
3.00
3.33
3.67
4.00
4.33
4. 67
5.00
5.33
5.67
100.627
98.417
97.252
96.514
95.976
95.525
94.820
94.518
94.256
94.004
93.776
93.564
93.363
93.172
93.001
92.824
92.666
0.000
0.000
0.000
0.000
0.000
0.000
-1.798
-1.367
-1.129
-0.986
-0.875
-0.789
-0.729
-0.673
-0.628
-0.590
-0.555
0.000
0.000
0.000
-4.113
-2.441
1 ~ 727
-1.156
-1.007
-0.887
-0.816
-0.742
-0.692
-0. 642
-0.604
-0.564
-0.538
-0.506
0.000
0.000
0.000
0.000
0.000
0.000
0.642
0.360
0.242
0.170
0.133
0.097
0.087
0.069
0.064
0.052
0.049
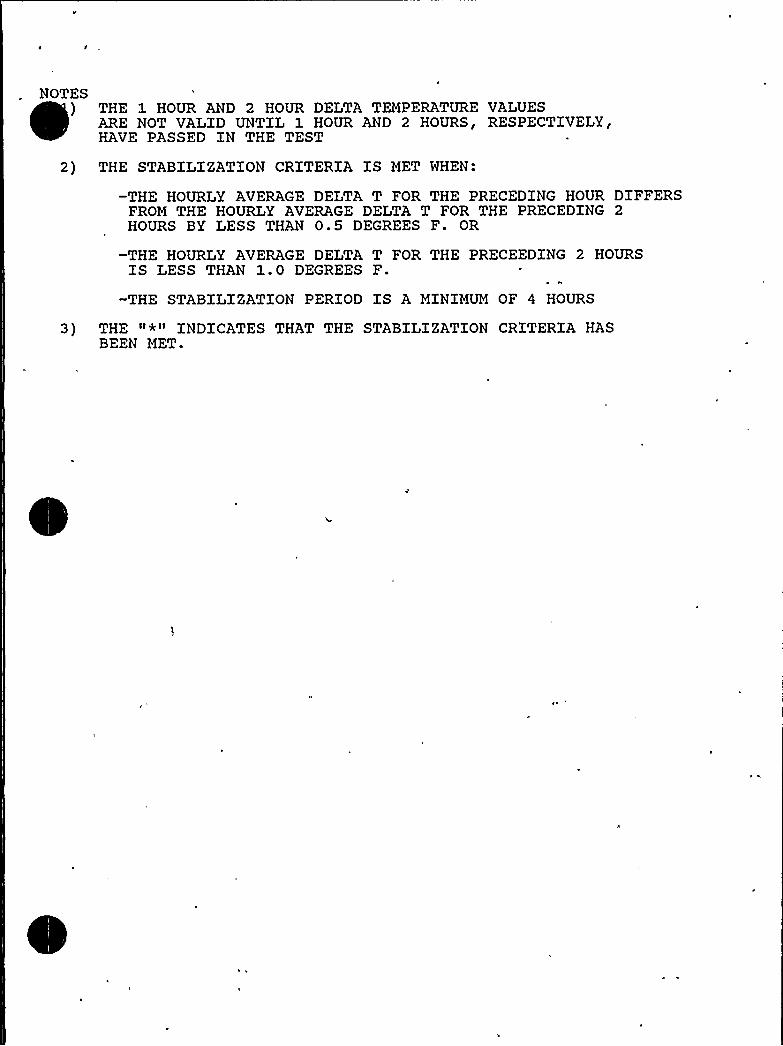
NOTES) THE 1 HOUR AND 2 HOUR DELTA TEMPERATURE VALUES
ARE NOT VALID UNTIL 1 HOUR AND 2 HOURS~RESPECTIVELY'AVE
PASSED IN THE TEST
2) THE STABILIZATION CRITERIA IS MET WHEN:
-THE HOURLY AVERAGE DELTA T FOR THE PRECEDING HOUR DIFFERSFROM THE HOURLY AVERAGE DELTA T FOR THE PRECEDING 2HOURS BY LESS THAN 0.5 DEGREES F. OR
-THE HOURLY AVERAGE DELTA T FOR THE PRECEEDING 2 HOURSIS LESS THAN 1.0 DEGREES F.
-THE STABILIZATION PERIOD IS A MINIMUM OF 4 HOURS
3) THE "*" INDICATES THAT THE STABILIZATION CRITERIA HASBEEN MET.


TEMPERATURE STABIILIIZA7IIGM1993 St. Lucia Unit P1 ILRT
102Ternpmdure fn Degrees F
94
920 0.5 1 1.5 2 2.6 3 3.5 4 4.6 6 6.5 6
Time tn Hours

ILRT TEST MODE
1993 ST. LUCIE UNIT 1 PERIODIC TEST
Sequence Started 21:05, 5/19/93Sequence Ended 05:05, 5/20/93
EBASCO SERVICES INC.Plant Operations 8c Betterment Dept.
ILRT TEST SERVICES
APPENDIX B.3

4 I

PSL1 Spring 93 ILRT Program Rev 9
CONTAINMENT INTEGRATED LEAKAGE RATE TEST
LEAKAGE RATE IS MEASURED USING THE ABSOLUTE METHOD AND ISCOMPUTED USING THE TOTAL TIME METHOD IN STRICT ACCORDANCE WITHTOPICAL REPORT BN-TOP-1 ( REV 1 )
TEST PERIOD STARTED AT 21:05 HOURS ON 5/19/93TEST CONDUCTED FOR 8.00 HOURS
FREESPACE VOLUME OF CONTAINMENT IS 2500000 CU FTCONTAINMENT WAS PRESSURIZED TO 55.57 PSIA
FITTED TOTAL TIME ILRT LEAKAGE RATE LamUPPER LIMIT OF 954 CONFIDENCE LEVEL UCLCONTAINMENT DESIGN LEAKAGE RATE LaILRT ACCEPTANCE CRITERIA 7 5~o La
0.1540.2930.5000.375
/DAY/DAY
~o /DAY/DAY
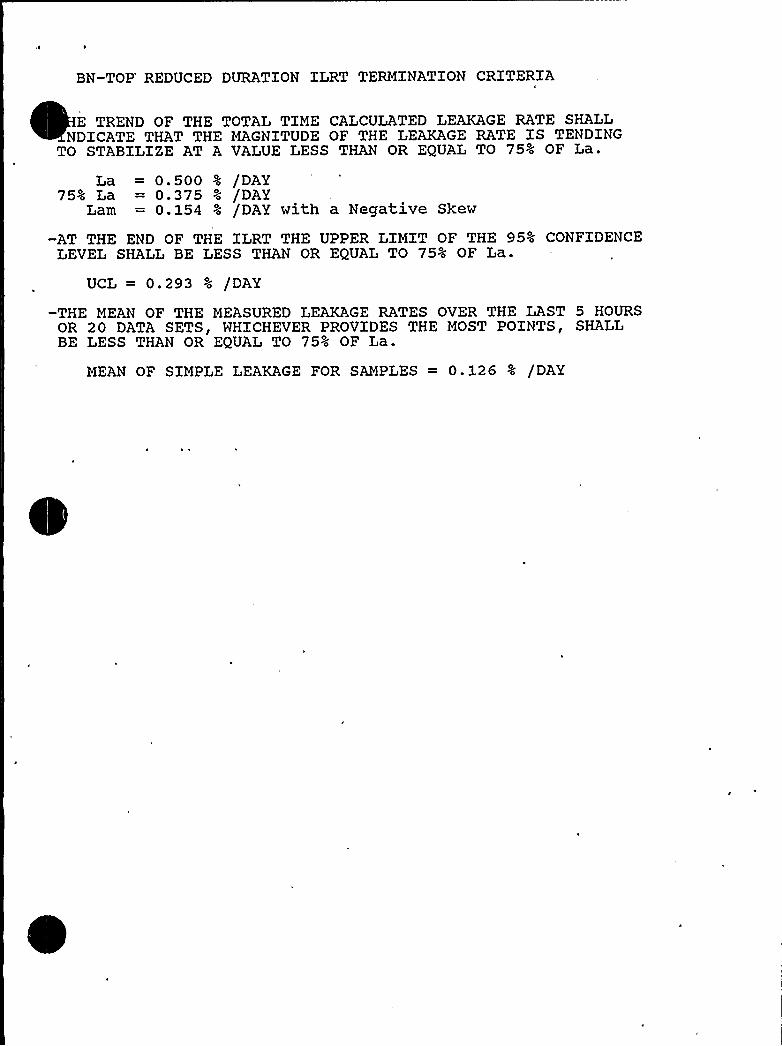
BN-TOP'EDUCED DURATION ILRT TERMINATION CRITERIA
E TREND OF THE TOTAL TIME CALCULATED LEAKAGE RATE SHALLNDICATE THAT THE MAGNITUDE OF THE LEAKAGE RATE IS TENDING
TO STABILIZE AT A VALUE LESS THAN OR EQUAL TO 75% OF La.
La = 0.500 % /DAY75% La = 0.375 % /DAY
Lam = 0.154 : /DAY with a Negative Skew
AT THE END OF THE ILRT THE UPPER LIMIT OF THE 95~o CONFIDENCELEVEL SHALL BE LESS THAN OR EQUAL TO 75% OF La.
UCL = 0 293 ~o /DAY
-THE MEAN OF THE MEASURED LEAKAGE RATES OVER THE LAST 5 HOURSOR 20 DATA SETS'HICHEVER PROVIDES THE MOST POINTS~ SHALLBE LESS THAN OR EQUAL TO 75% OF La.
MEAN OF SIMPLE LEAKAGE FOR SAMPLES = 0 126 ~o /DAY
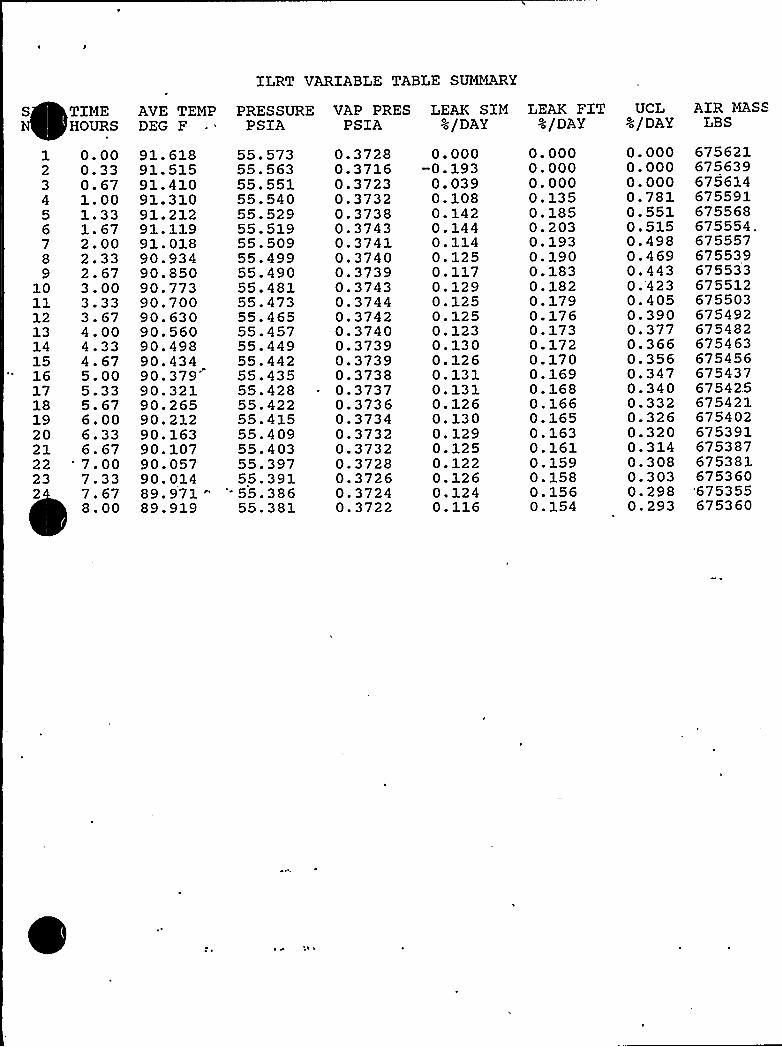
ILRT VARIABLE TABLE SUMMARY
S TIMEHOURS
AVE TEMPDEG F
PRESSUREPSIA
VAP PRESPSIA
LEAK SIM4/DAY
LEAK FIT~o/DAY
UCL~o /DAY
AIR MASSLBS
123456789
10111213141516171819202122232
0. 000.330.671.001.331.672.002.332.673.003.333.674.004.334.675.005.335.676.006.336.677.007.337.678.00
91. 61891.51591.41091.31091.21291.11991.01890.93490.85090.77390.70090.63090.56090.49890.43490.37990.32190.26590.21290.16390.10790.05790.01489.971
'9.919
55.57355.56355.55155.54055.52955.51955.50955.49955.49055.48155.47355.46555.45755.44955.44255.43555.42855.42255.41555.40955.40355.39755.39155.38655.381
0.37280.37160.37230.37320.37380.37430.37410.37400.37390.37430.37440.37420.37400.37390.37390.37380.37370.37360.37340.37320.37320.37280.37260.37240.3722
0.000-0.193
0.0390.1080. 1420. 1440. 1140. 1250. 1170. 1290. 1250. 1250. 1230. 1300. 1260. 1310. 1310. 1260. 1300. 1290. 1250. 1220.1260.1240.116
0. 0000. 0000.0000.1350.1850.2030.1930.1900.1830.1820.1790. 1760. 1730.1720. 1700. 1690. 1680.1660.1650.1630.1610.1590.1580.1560.154
0.0000.0000.0000.7810.5510.5150.4980.4690.4430.4230.4050.3900.3770.3660.3560.3470.3400.3320.3260.3200.3140.3080.3030.2980.293
675621675639675614675591675568675554.67555767553967553367551267550367549267548267546367545667543767542.5675421675402675391675387675381675360"675355675360

lllLRT AlllR MASS1993 St. Lucie Unit P1 ILRT
678,000
875,800
Air Mass—Fitted M
675,800
675,400
675,200
675,0000 'j 2 3 4 5 6 7 8
Thne ln Houm

1993 St. Lucie Unit 41 ILRT
0.2
0.$
%.2 Simple Leakage Rate
+ ed e Rata
0 1 2 3 4 5 6 7 8
HRSCO Rant Operithmi 4 Bethrrnont

IILRY LEAKAGE RAYES REILAYIIVEYG LIIMIIYS1993 St. Lucis Unit P1 ILRT
0.
0.6
Rtted Leakage Rate
+UCL
Deign Leakage (La)
"-Allovrable Leakage
0.4
0.2
2 3 4 5 6 ? 8
EBA8CO Rant Opera5one 4 Betterment

ILRT WEIGHTED AVERAGE TEMPERATURE1993 St. Lucie Unit P1 ILRT
92empsrature ln Degrees F
9'1.8
91.69'|.49'1.2
91
90.8
90.6
90.4
90.2
90
89.80 2 3 4 5 6 7 8
Time fn Hours

- ~i i
l
C
r,
h
1
/
g'
~ 'l
4
r,
II I
" ll 7
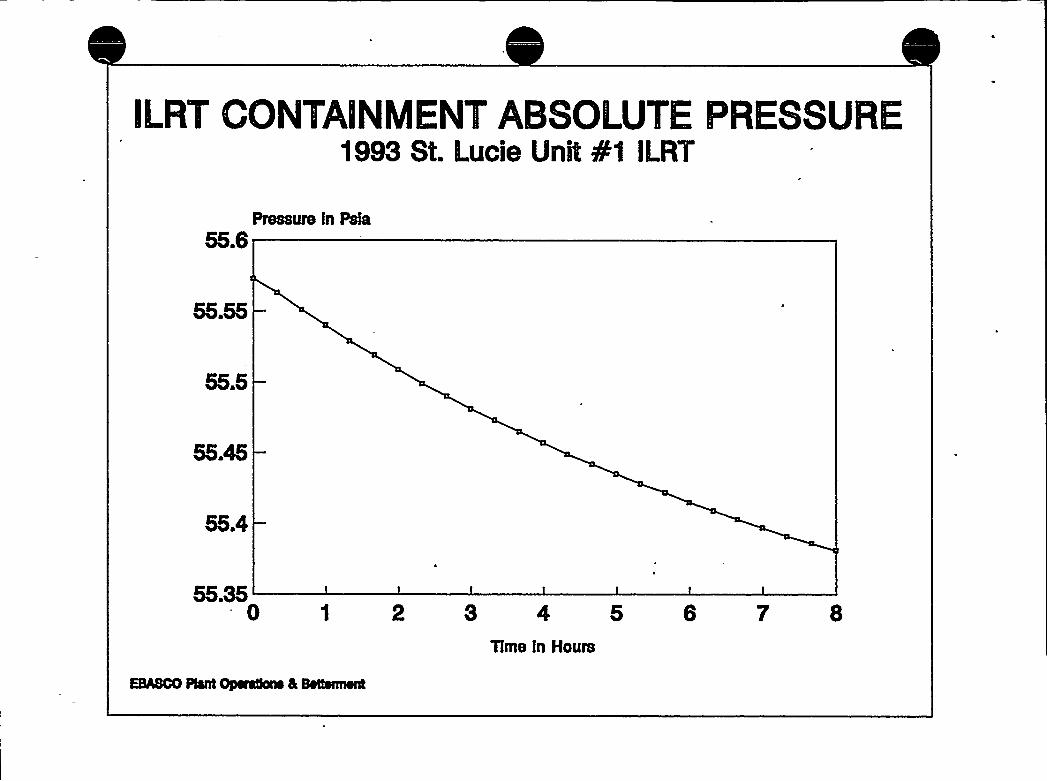
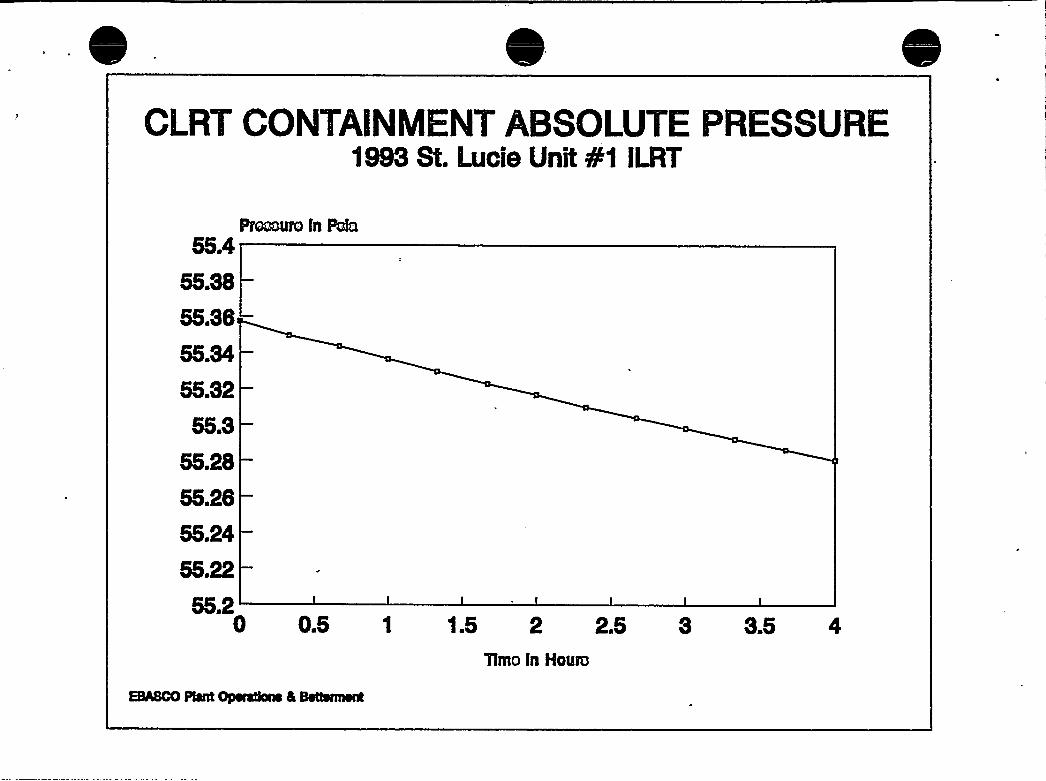
ILRT CONTAINMENTABSOLUTE PRESSURE1993 St. Lucis Unit P1 ILRT
Pressure tn Psfa
55.8
55.350
EBASCO Rant Operdhee 5 Betterment
2 3 4 5 8 7 8Toms In Hours

f
~ .
'E 0
I

ILRT WEIGHTED AVERAGE VAPOR PRESSURE1993 St. Lucie Unit 41 ILRT
Press
0.4ure In Psfa
0.395
0.39
0.385
0.38
0.375
0.37
0.365
0.36
0.355
0.350 1 2 3 4 5 6 7 8
Time ln Hours

r ~
CI
M
I
G%C,
cv4
P,
~ .]
l I
~'
-'IA
I
'7
h
i
L
-J L
i
C
,,d
L

SENSOR VOLUME FRACTIONS
TEMPERATURE SENSORS
6 to 1011 to 1516 to 2021 to 2526 to 3031 to 3536 to 40
0.0267080.0267080.0267850.0267850.0240370.0240370.0226620.022662
,0. 0267080.0267080.0267850.0267850.0240370.0240370.0226620.022662
0.0267080.0267080.0267850.0267850.0240370.0240370.0000000.032274
0. 0267080.0267850.0267850.0240370.0240370.0226620.0226620.032274
0.0267080.0267850.0267850.0240370.0240370.0226620.0226620.032274
HUMIDITY/DP SENSORS
1 to 5 0.0733356 to 10 0.090064
0.0733350.090064
0.0733350.139913
0.0900640.139913
0.0900640.139913
NOTE: VALUE OF ZERO INDICATES A DELETED SENSOR.

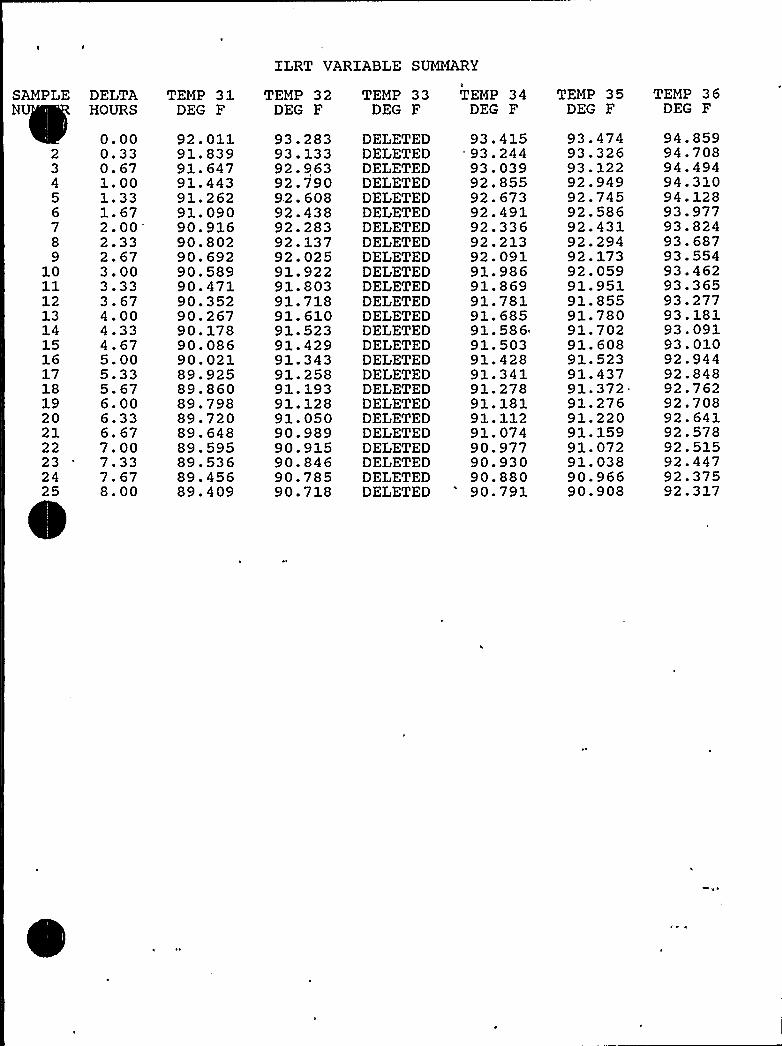
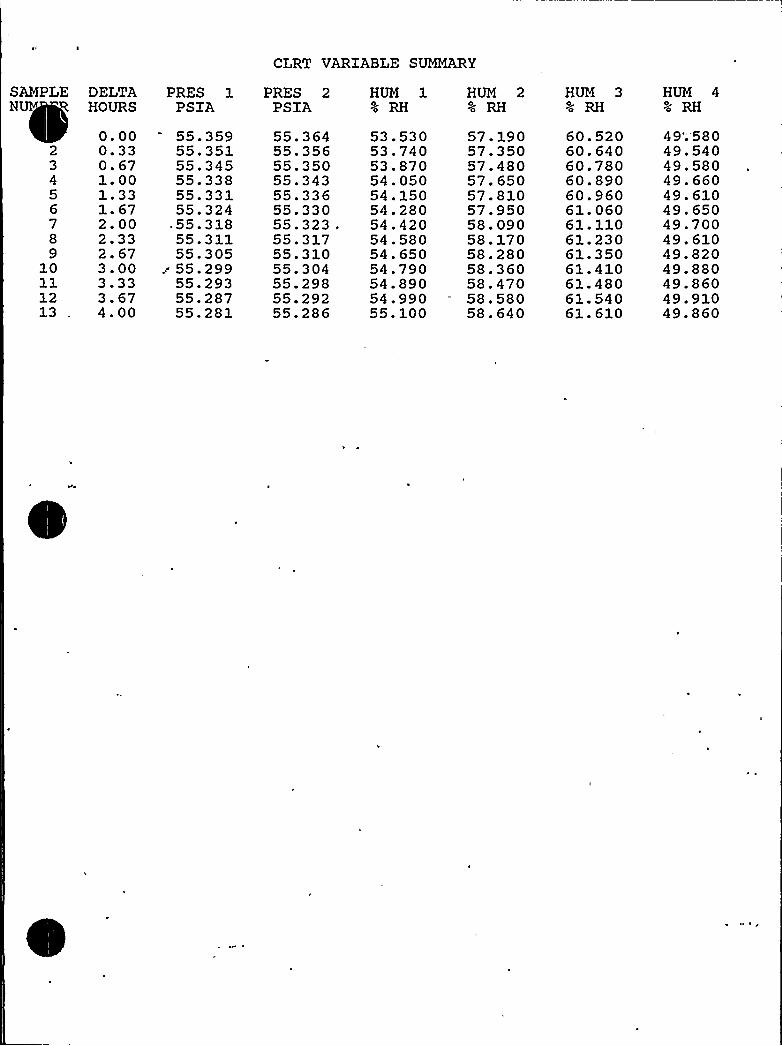
ILRT VARIABLE SUMMARY
SAM LEN
23456789
101112131415161718192021222324
5
DELTAHOURS
0. 000.330.671.001.331.672.002.332.673.003.333.674.004.334.675.005.335.676.006.336.677.007.337.678.00
TEMP 1DEG F
86. 60286.59186.60286.58086.58686.57786.58086.55986.57186.57186.57186.57786.55986.53586.54886.55986.55986.59186.58086.56686.58086.58086.59786.58086.591
TEMP 2DEG F
87.24687.24687.23587.23587.21987.21987.20387.19287.18187.19287.16187.15687.15087.14587.13887.10787.13887.08487.10787.09187.06487.08487.06987.04287.031
TEMP 3DEG F
86.92586.92586.89486.92586.93286.90186.90586.90586.89486.88386.89486.92186.90586.91086.91486.89486.91486.93786.90586.91086. 91486.90586.91086.91486.914
TEMP 4DEG F
86. 17786. 20086. 17786. 17786.18486.17386.18886.18886.18886.17786.16686.17386.17786.21586.16686.18886.17786.20086.20086.16286.17786.20086.18486.20986.200
TEMP 5DEG F
85.55085.56185.55085.53885.54585.55685.55085.56185.55085.52785.55085.56885.55085.55685.53885.56185.56185.57085.56185.57785.58185.58185.57785.59285.570
TEMP 6DEG F
85.70585.73985.72885.74885.75585.74385.73985.72885.72885.71785.70585.72385.71785.71285.70585.70585.70585.69485.68585.68185.66385.65185.64785.64385.643
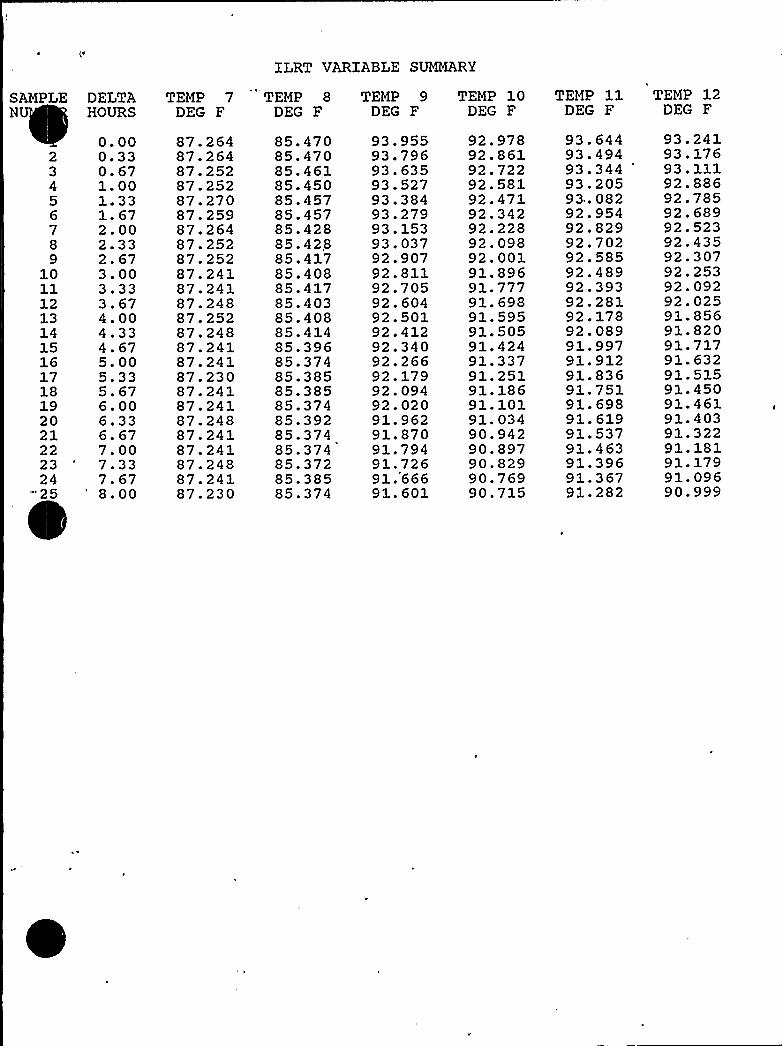
ILRT VARIABLE SUMMARY
SAMPLEN
DELTAHOURS
TEMP 7 TEMP 8DEG F DEG F
TEMP 9DEG F
TEMP 10DEG F
TEMP 11DEG F
TEMP 12DEG F
23456789
101112131415161718192021222324
'25
0.000.330.671.001.331. 672.002.332.673.003.333.674.004.334.675.005.335.676.006.336. 677. 007.337.678.00
87. 26487. 26487.25287.25287.27087.25987.26487.25287.25287.24187.24187.24887.25287.24887.24187.24187.23087.24187.24187.24887.24187.24187.24887.24187.230
85.47085.47085.46185.45085.45785.45785.42885. 42,885.41785.40885.41785.40385.40885.41485.39685.37485.38585.38585.37485.39285.37485.37485.37285.38585.374
93.95593.79693.63593.52793.38493.27993.15393.03792.90792.81192.70592.60492.50192.41292.34092.26692.17992.09492.02091.96291.87091.79491.72691.66691.601
92.97892.86192.72292.58192.47192.34292.22892.09892.00191.89691.77791.69891.59591.50591.42491.33791.25191.18691.10191.03490.94290.89790.82990.76990.715
93.64493.49493.34493.20593.08292.95492.82992.70292.58592.48992.39392.28192.17892.08991.99791.91291.83691.75191.69891.61991.'53791. 46391.39691. 36791.282
93.24193.17693.11192.88692.78592.68992.52392.43592.30792.25392.09292.02591.85691.82091. 71791. 63291. 51591.45091.46191. 40391.32291. 18191. 17991. 09690.999
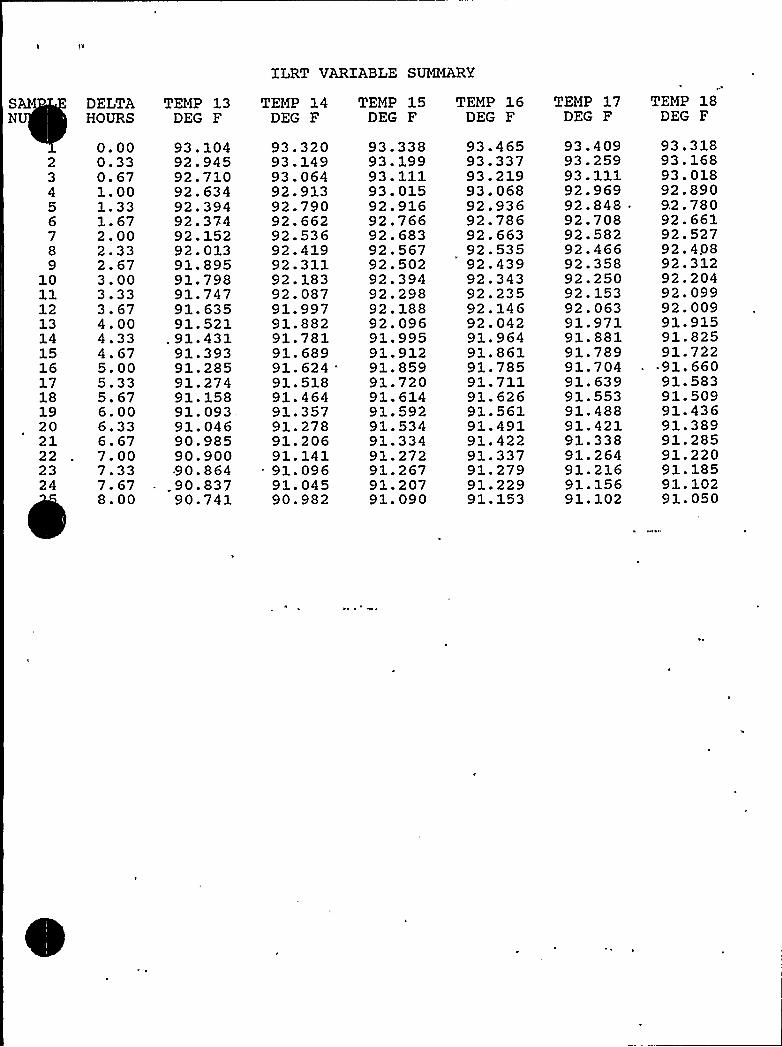
ILRT VARIABLE SUMMARY
SN
DELTA TEMP 13 TEMP 14HOURS DEG F DEG F
TEMP 15DEG F
TEMP 16DEG F
TEMP 17DEG F
TEMP 18DEG F
23456789
101112131415161718192021222324
0. 000.330. 671.001.331.672.002.332.673.003.333.674.004.334.675.005.335.676.006.336.677.007.337.678.00
93.10492.94592.71092.63492.39492.37492.15292.01391.89591.79891.74791.63591.521
.91.43191.39391.28591.27491.15891.09391.04690.98590.90090.864
.90.83790.741
93.32093.14993.06492.91392.79092.66292.53692.41992.31192.18392.08791.99791.88291.78191.68991.62491.51891.46491.35791.27891.20691. 14191.09691. 04590.982
93.33893.19993.11193.01592.91692.76692.68392.56792.50292.39492.29892.18892.09691.99591.91291.85991.72091.61491.59291.53491.33491.27291.26791.20791.090
93.46593.33793.21993.06892.93692.78692.66392.53592.43992.34392.23592.14692.04291.96491.86191.78591.71191.62691.56191.49191.42291.33791.27991.22991.153
93.40993.25993.11192.96992.84892.70892.58292.46692.35892.25092.15392.06391.97191.88191.78991.70491.63991.55391.48891.42191.33891.26491.21691.15691.102
93.31893.16893.01892.8909.2. 78092.66192.52792.40892.31292.20492.09992.00991.91591.82591.72291.66091.58391.50991.43691.38991.28591.22091.18591.10291.050

ILRT VARIABLE SUMMARY
SAM E. DELTAN HOURS
TEMP 19DEG F
TEMP 20DEG F
TEMP 21DEG F
TEMP 22DEG F
TEMP 23DEG F
TEMP 24DEG F
23456789
101112131415161718192021222324
0. 000.330.671.001.331.672.002.332.673.003.333.674.004.334.675.005.335.676.006.336.677.007.337.678.00
'2:29392.24092.15492.06792.00091.97791.89791.83291.76991.68491.66191.57291 '1191.44491.42691.37291. 27691.24491.16891.14491.07291.02990.96290.91390.922
92.59192.51792.45292.40992.33592.24892.20392.15192.07392.01291.96991.89591.87391.80691.75491.66991.63791.58491.51891.49491.48791.43391.37791.40291.343
92.54592.49492.41792.37592.29892.22492.17792.15092.10391.98991.95591.88191.83991.77191.72091 '5791.60391 '16 .
91.47391.38591.35691.31491.24491.18491. 128
92.50692.43292.36892.29492.20992.14492.06592.01491.94791.88691.82191.759
'91.71691.64791.59791.53291.45991.39491.35191.30491.24491.20191.14591.09491.038
92.93692.86292.80992.73592.67092.60592.49592.44492.38892.31692.26292.18892.11292.06791.99691.95191.87791.80391.75991.70391.66291.60091.54191.49291.445
92.64992.56292.49992.42392.34992.28492.21792.14592.07892.02791.95391.88891.82391.76791.70691.64191.59991.52391.46091.40291.36391.31091.24291.18091.124


ILRT VARIABLE SUMMARY
23456
, 789
10111213141516171819202122232425
DELTAHOURS
0. 000.330.671.001.331.672.002.332.673.003.333.674.004.334.675.005.335.676.006.336.677.007.337.678.00
TEMP 25DEG F
92.41292.31592.25192.17792.08992.03891.94891.89791.84191.78091.73891.66291.61991.55291.50091.43891.38491.31991.25691.19891.13891.08491.03790.96590.932
TEMP 26DEG F
91. 87091.77391.70891.62391.52691.48391.42791.36491.28891.25991.17191.12991.08690.99690.93690.91590.86290.77490.73190.65390.615,90.57290.50290.43190.386
TEMP 27DEG F
90.62390.54790.46290.385.90.30090.25890.19190.13090.04089.98089.93889.86189.81989.76389.71189.64989.58489.54189.47689.45289.39189.35889.32489.26189.237
TEMP 28DEG F
92.48892.43692.37192.26492.21092.12592.05892.00691.92891.84791.82591.76091.71791.65091.55691.62191.52591.52591.42991.39391.29091.26791.21191.16091.115
TEMP 29DEG F
93.54893.36493 '7192.97892.78592.65892.47292.35792.22592.11192.01491.91891.81091.73291.66091.57591.49091.41391.35191.26191.20991.12491.07791.05090.949
TEMP 30DEG F
93.38793.20593.00192.80892.62792.47692.31392.19892.06691.96091.85591.75891.66291.57291.48991.41591.32891.25491.18991.12191.05090.98590.91790.86890.790
ILRT VARIABLE SUMMARY
23456789
10111213141516171819202122232425
DELTAHOURS
0.000.330.671.001.331.672.002.332.673.003.333.674.004.334.675.005.335.67,6. 006.336.677.007.337.678.00
TEMP 31DEG F
92.01191.83991.64791.44391.26291.09090.91690.80290.69290.58990.47190.35290.26790.17890.08690.02189.92589.86089.79889.72089.64889.59589.53689.45689.409
TEMP 32DEG F
93.28393.13392.96392.79092.60892.43892.28392.13792.02591.92291.80391.71891.61091.52391.42991.34391.25891.19391.12891.05090.98990.91590.84690.78590.718
TEMP 33DEG F
DELETEDDELETEDDELETEDDELETEDDELETEDDELETEDDELETEDDELETEDDELETEDDELETEDDELETEDDELETEDDELETEDDELETEDDELETEDDELETEDDELETEDDELETEDDELETEDDELETEDDELETEDDELETEDDELETEDDELETEDDELETED
TEMP 34DEG F
93.415"93.24493.03992.85592.67392.49192.33692.21392.09191.98691.86991.78191.68591.58691.50391.42891.34191.27891.18191.11291.07490.97790.93090.88090.791
TEMP 35DEG F
93.47493.32693.12292.94992.74592.58692.43192.29492. 17392.05991.95191.85591.78091.70291.60891.52391.43791.372-91.27691.22091.15991.07291.03890.96690.908
TEMP 36DEG F
94.85994.70894.49494.31094.12893.97793.82493.68793.55493.46293.36593.27793.18193.09193.01092.94492.84892.76292.70892.64192.57892.51592.44792.37592.317

ILRT VARIABLE SUMMARY
SAM LEN
23456789
10111213
"1415161718192021222324
5
DELTAHOURS
0. 000.330.671.001.331.672.002.332.673.003.333.674.004.334.675.005.335.676.006.336.677.007.337.678.00
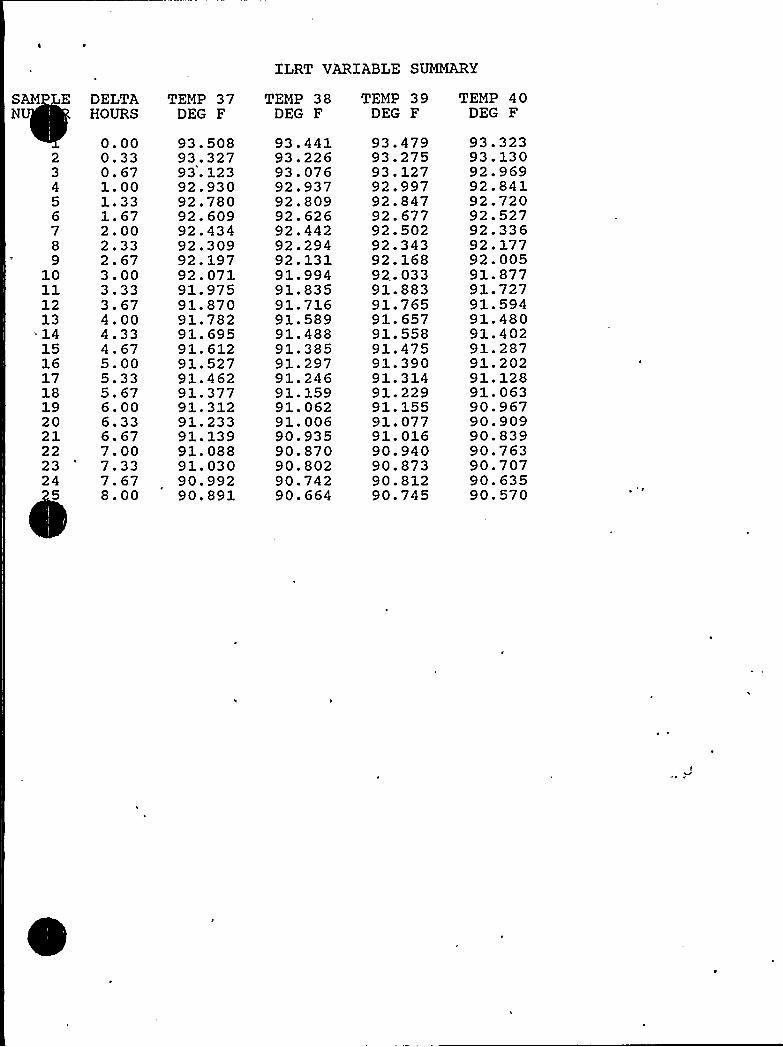
TEMP 37DEG F
93.50893.32793.12392.93092.78092.60992.43492.30992.19792.07191.97591.87091.78291.69591.61291.52791.46291.37791.31291.23391.13991.08891.03090.99290.891
TEMP 38DEG F
93.44193.22693.07692.93792.80992.62692.44292.29492.13191.99491.83591.71691.58991.48891.38591.29791.24691.15991.06291.00690.93590.87090.80290.74290.664
TEMP 39DEG F
93.47993.27593.12792.99792.84792.67792.50292.34392.16892..03391.88391.76591.65791.55891.47591.39091.31491.22991.15591.07791.01690.94090.87390.81290.745
TEMP 40DEG F
93.32393.13092.96992.84192.72092.52792.33692.17792.00591.87791.72791.59491.48091.40291.28791.20291.12891. 06390. 96790.90990.83990.76390.70790.63590.570

ILRT VARIABLE SUMMARY
SAMP E DELTAN HOURS
PRES 1PSIA
PRES 2PSIA
HUM 1~o RH
'UM 2>o RH
HUM 3% RH.
HUM 44 RH
23456789
10ll1213141516171819202122232425
0. 000.330.671.001.331.672.002.332.673.003.333.674.004.334.675.005.335.676.006.33.6. 677.007.337.678.00
55.57355.56355.55155.54055.52955.51955.50955.49955.49055.48155.47355.46555.45755.44955.44255.43555.42855.42255.41555.40955.40355.39755.39155.38655.381
55.57955.56855.55755.54555.53555.52455.51455.50555.49555.48655.47855.47055.46255.45455.44755.44055.43355.42755.42055.41455.40855.40255.39755.39155.386
44.29044.63045.11045.59045.96046.42046.85047.33047.70048.12048.66049.08049.35049.86050. 13050.49050.79051.19051.47051.75052.06052.21052.51052.80052.970
49.71050.09050.45050.87051.21051.58051.97052.35052.74053.10053.42053.77054.08054.35054.66054.94055.20055.43055.64055.85056.06056.25056.44056.55056.740
52.35052.73053.10053.55053.88054.36054.74055.10055.63055.95056.22056.63056.91057.24057.55057.95058.29058.58058.88058.98059.36059.51059.64059.88060.090
46.18046.67047.22047.67048.13048.38048.68048.69048.89049.08049.21049.23049.31049.31049.37049.42049.45049.46049.46049.47049.58049.38049.48049.33049.250
SAM E' DELTAHOURS
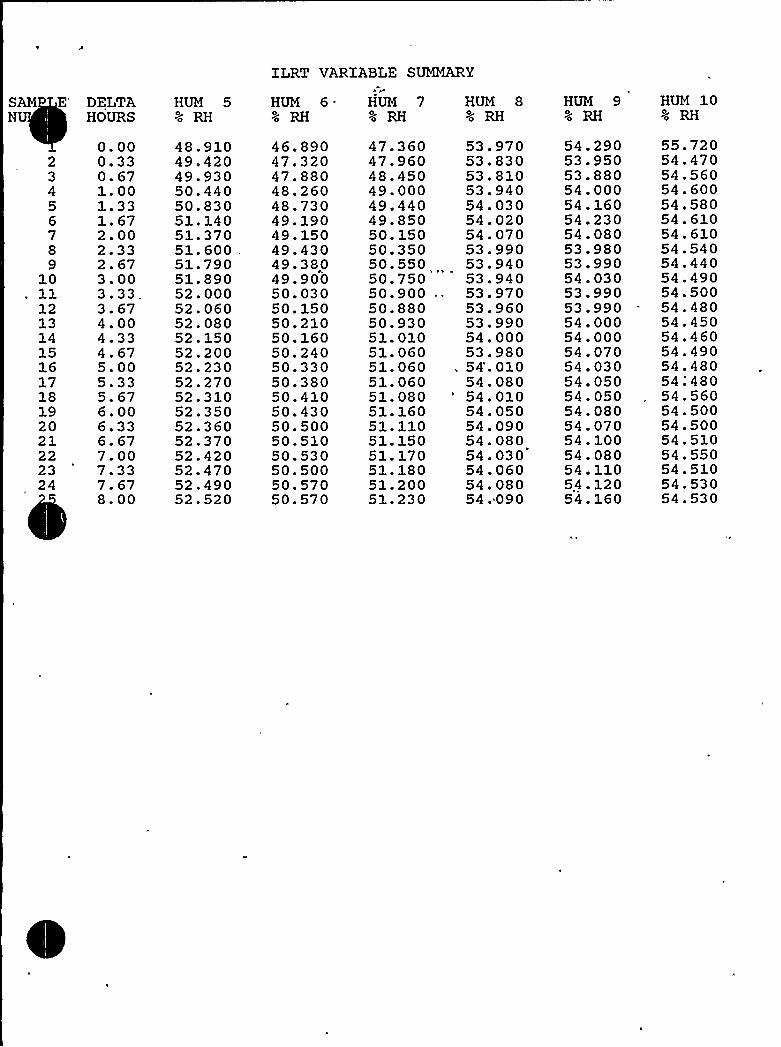
HUM 5~o RH
XLRT VARIABLE SUMMARY
HUM 6 HUM 7 HUM 8~o RH ~o RH ~o RH
HUM 9~o RH
HUM 10>o RH
23
56789
101112131415161718192021222324
0.000.330.671.001.331.672.002.332.673.003.333.674.004.334.675.005.335.676.006.336. 677. 007.337.678.00
48.91049.42049.93050.44050.83051.14051.37051.600 .
51.79051.89052.00052.06052.08052.15052.20052.23052.27052.31052.35052.36052.37052.42052.47052.49052.520
46.89047.32047.88048.26048.73049.19049.15049.43049.38049.90050.03050.15050.21050.16050.24050.33050.38050.41050.43050.50050.51050.53050.50050.57050.570
47.36047.96048.45049.00049.44049.85050.15050.35050.55050.75050.90050.88050.93051.01051.060'51.06051.06051.08051.16051.11051.15051.17051.18051.20051.230
53.97053.83053.81053.94054.03054.02054.07053.99053.94053.94053.97053.96053.99054.00053.98054'.01054.08054.01054.05054.09054.08054.03054.06054.08054.090
54.29053.95053.88054.00054.16054.23054.08053.98053.99054.03053.99053.99054.00054.00054.07054.03054.05054.05054.08054.07054.10054.08054.1105.4. 12054.160
55.72054.47054.56054.60054.58054.61054.61054.54054.44054.49054.50054.48054.45054.46054.49054.48054:48054.56054.50054.50054.51054.55054.51054.53054.530

CLRT TEST MODE
1993 ST. LUCIE UNIT 1 PERIODIC TEST
Sequence Started 06:05, 5/20/93Sequence Ended 10:05, 5/20/93
EBASCO SERVICES INC.Plant Operations A Betterment Dept.
ILRT TEST SERVICES
APPENDIX B.4

PSL1 Spring 93 ILRT Program Rev 9
CONTAINMENT INTEGRATED LEAKAGE RATE TESTSUPPLEMENTAL VERIFICATION TEST
LEAKAGE RATE IS MEASURED USING THE ABSOLUTE METHOD AND ISCOMPUTED USING THE TOTAL TIME METHOD IN STRICT ACCORDANCE WITHTOPICAL REPORT BN-TOP-1 ( REV 1 )
TEST PERIOD STARTED AT 06:05 HOURS ON 5/20/93TEST CONDUCTED FOR 4.00 HOURS
FREESPACE VOLUME OF CONTAINMENT IS 2500000 CU FTCONTAINMENT WAS PRESSURIZED TO 55.36 PSIA
FITTED TOTAL TIME ILRT LEAKAGE RATE LamCONTAINMENT DESIGN LEAKAGE RATE LaSUPERIMPOSED CLRT LEAKAGE RATE LoFITTED CLRT TOTAL TIME LEAKAGE RATE Lc
0 154 ~o /DAY0.500 4 /DAY0.293 ~o /DAY0.328 ~o /DAY
1 Lo + Lam — La/4 <= Lc <= Lo + Lam + La/4
0.293 + 0.154 — 0.125 <= 0.328 <= 0.293 + 0.154 + 0.125
0.322 <= 0.328 <= 0.572
AVE TEMP
PRESSURE
VAPOR PRES
LEAK SIM
LEAK FIT
95a UCL
AIR MASS
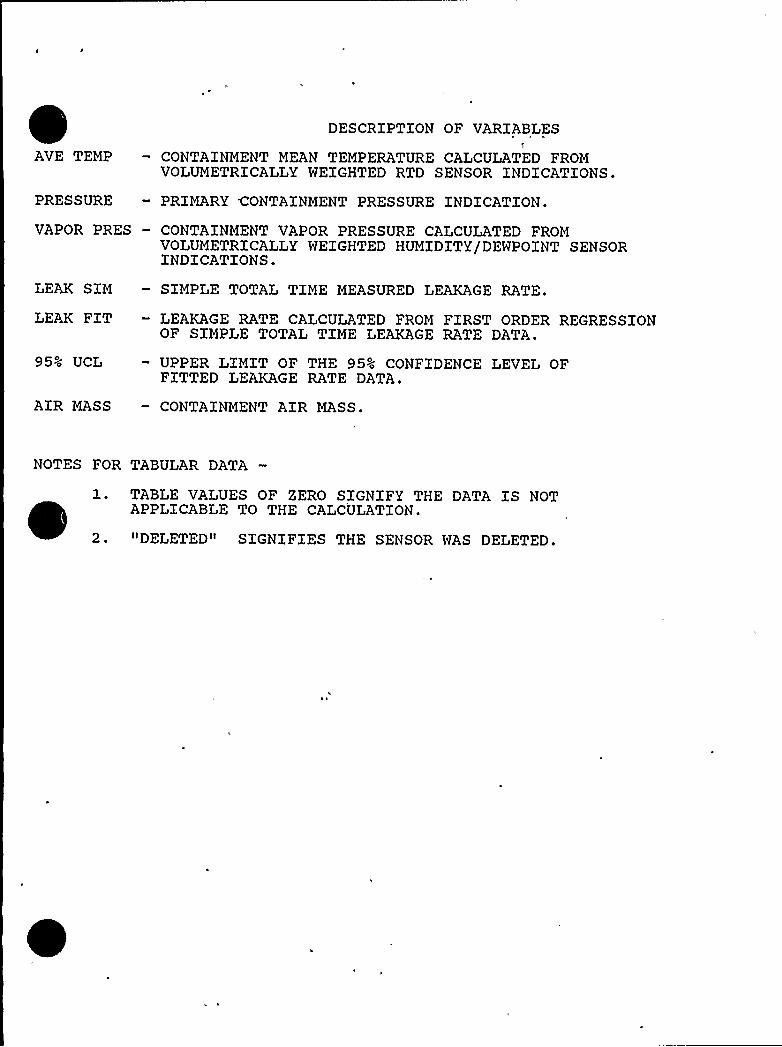
DESCRXPTION OF VARIABLES
CONTAINMENT MEAN TEMPERATURE CALCULATED FROMVOLUMETRICALLYWEXGHTED RTD SENSOR INDICATIONS.
PRIMARY CONTAINMENT PRESSURE XNDICATION.
CONTAINMENT VAPOR PRESSURE CALCULATED FROMVOLUMETRICALLYWEIGHTED HUMIDITY/DEWPOINT SENSORINDICATIONS.
SXMPLE TOTAL TIME MEASURED LEAKAGE RATE.
LEAKAGE RATE CALCULATED FROM FIRST ORDER REGRESSIONOF SIMPLE TOTAL TIME LEAKAGE RATE DATA.
UPPER LXMIT OF THE 95~o CONFIDENCE LEVEL OFFITTED LEAKAGE RATE DATA.
CONTAINMENT AXR MASS.
NOTES FOR TABULAR DATA
1. TABLE VALUES OF ZERO SIGNIFY THE DATA XS NOTAPPLICABLE TO THE CALCULATXON.
2. "DELETEDII SIGNIFIES THE SENSOR WAS DELETED.

CLRT VARIABLE TABLE SUMMARY
S TIME AVE TEMPN HOURS DEG F
PRESSUREPSIA
VAP PRESPSIA
LEAK SIM4/DAY
LEAK FIT4/DAY
UCL4/DAY
AIR MASSLBS
0.002 0.333 0.674 1.005 1.336 1.677 2.008 2.339 2.67
10 3.00ll 3 '312 3.6713 4.00
89.78489.74789.70489.66389.61989.58589.54789.51289.47889.43889.41289.38089.345
55.35955.35155.34555.33855.33155.32455.31855.31155.30555.29955.29355.28755.281
0.37180.37170.37150.37140.37100.37090.37070.37050.37060.37040.37020.37000.3700
0. 0000.5560.3780.3730.3520.3720.3550.3670.3630.3500.3570.3560.353
0.0000.0000.0000.3440.3220.3270.3230.3280.3290.3260.3270.3280.328
0.0000.0000.0001.0280.6400.5820.5300.5120.4960.4770.4670.4600.452
675262675209675191675157675129675087675062675021674989674967674927674894674864

CLRT AIR MASS1993 St. Lucie Unit P1 ILRT
675,400
675,300
675,200
675,'100
675,000
674,900
Contalnmsnt Nr Mass (LBS)
Air Mass—Fitted Ma
674,8000 0.5 1.5 2.5
'Hme tn Houm
3.5
EBASCO Phnt Operations 8 Betterment

t
~ E
~ *~
' l
I I
p-
'
0 '
r-i~
'J
I
lN

CLRT COMPUTED LEAKAGE RATES1993 St. Lucie Unit P1 ILRT
Plat par Goy Sy Raaht0.8
0.6
Simple Leakage
+'itted Leakage
0.4
0.3
0.20 0.5 1.5 2.6 3.5
EBISCO Plaat Opera5one 4 Bettoaneot

4 iIL I
it
1
i
I
,~
1 1$
I
'.t,t
t
C
f
it
IU u
iC.
qf
P

CLRT LEAKAGE RATES RELATIVETO LIMITS199$ St. LUcie Unit 41 ILRT
0.6Percent par Day By%cfght
0.55
0.5
OA6
0.4
—Nnhnum Aooeptable—Madmum Accaptabie Leo
+Rttad Uakago
0.
0.30 0.6 '1.6 2 2.5 3 3.6 4 4.5 5
Time fn Houra
EBA8CO Piant Opera5ona 4 SNennent

7
M
C ~
ll
0

CLRT WEIGHTED AVERAGE TEMPERATURE1993 St. Lucie Unit P1 ILRT
TcmpersNuro In Degrees F
89.9
89.7
89.6
89.4
.30 0.5 1.5
Time tn Houro
2.6 3.6

~ E.
IP
CLRT CONTAINMENTABSOLUTE PRESSURE1993 St. Lucie Unit rir1 ILRT
65.38
55.32
55.3
65.28
55.28
55.24
.20 0.5 1.5
Tlmo In Hauro
2.5 3.5
EBAKCO Rant Oporaticrre 5 BittermorN

\
I
1
1 a
1 IJ

CLRT WEIGHTED AVERAGE VAPOR PRESSURE1993 St. Lucis Unit 41 ILRT
0.38Pressure tn Psla
0.375
0.37
0.385
0.380 0.5
Time tn Hours
2.5 3.5
\
L,
Il hL
l
C
I"4 ~'I
4
k
I
Vq0 t'
lt
I I~/''
C
f

SENSOR VOLUME FRACTIONS
TEMPERATURE SENSORS
5o 10
11 to 1516 to 2021 to 2526 to 3031 to 3536 to 40
0. 0267080.0267080.0267850.0267850.0240370.0240370.0226620.022662
0. 0267080.0267080.0267850.0267850.0240370.0240370.0226620.022662
0.0267080.0267080.0267850.0267850.0240370.0240370.0000000.032274
0. 0267080.0267850.0267850.0240370.0240370.0226620.0226620.032274
0.0267080.0267850.0267850.0240370.0240370.0226620.0226620.032274
HUMIDITY/DP SENSORS
1 to 5 0.073335 0.073335 0.073335 0.090064 0.0900646 to 10 0.090064 0.090064 0.139913 0.139913 0.139913
NOTE: VALUE OF ZERO INDICATES A DELETED SENSOR.


CLRT VARIABLE SUMMARY
SAMPLEN
23456789
10ll1213
DELTAHOURS
0.000.330.671.001.33
'.67
2.002.332.673.003.333.674.00
TEMP 1DEG F
86.58086.59786.59786.59186.58086.59186.59186.60286.59186.58086.60286.59186.602
TEMP 2DEG F
87.01986.99586.97286.96886.95786.95786.96886.94586.92386.93486.94586.92386.923
TEMP 3DEG F
86.93786.94386.94386.91486.93786.90586.91486.91486.91486.92586.90586.92586.925
TEMP 4DEG F
86.20986.22786.23886.23186.23186.22086.23186.24286.24286.22086.25386.25386.231
TEMP 5DEG F
85.58185.57785.58885.58185.60485.59285.61285.59285.61285.61285.60485.61285.624
TEMP 6DEG F
85.59885.60485.59585.58985.57785.57785.55585.56685.55585.54685.53585.52485.512

CLRT VARIABLE SUMMARY
SAMPLENUM R
DELTAHOURS
TEMP 7DEG F
TEMP 8DEG F
TEMP 9DEG F
TEMP 10DEG F
TEMP 11 ~ TEMP 12DEG F DEG F
3456789
10111213
0.000.330.671.001.331.672.002.332.673.003.333.674.00
87.24187.24887.24887.24187.24187.24187.24187.24187.25287.24187.24187.25287.241
85.35485.37285.34985.35485.35485.35485.34385.34385.33185.34385.34385.33185.331
91. 43191. 37391. 31091. 26191.21891.16491.11191.05791.01490.98190.93890.89690.842
90.52290.49790.44390.38390.37290.29790.24490.212"90.15890.08290.05190.00889.986
91.07891.05490.98990.908'0.897
90.86690.77090.74790.65190.64090.60990.53390.490
90.80690.75090.70690.65690.52890.49790.40990.40090.29390.29390.25090.23990.154

CLRT VARIABLE SUMMARY
SAMPLENUM
DELTAHOURS
TEMP 13DEG F
TEMP 14DEG F
TEMP 15DEG F
TEMP 16 TEMP 17DEG F DEG F
TEMP 18DEG F
3456789
10111213
0. 000.330.671.001.331.672.002.332.673.003.333.674.00
90.55790.52290.45990.43090.36590.33490.29190.24890.20690.15290.11090.07690.033
90.76690.76290.68790.60790.55390.54190.47690.42290.37190.32690.30690.25290.220
90.99490.88290.81790.82190.73690.68290.65190.68290.58690.52190.53290.45890.405
90.97290.93690.87190.82290.75990.72690.67290.62990.57690.52490.50290.47090.417
90.89790.86290.80890.75890.69590 '4190.61090.55690.50290.44890.40690.38390.340
90. 86790. 81990.76890.69690.69690.62090.58990.53590.50490.43990.39690.38590.331


CLRT VARIABLE SUMMARY
SAMPLEN
2345678 „
910111213
DELTAHOURS
0.000.330. 671. 001 '31.672.002.332 '73.003 '33.674.00
TEMP 19DEG F
90.77290.74790.71690.64490.60190.55990.51690.49490.44090.40990.32490.33590.281
TEMP 20DEG F
91.18691.13391.07991.03690.96290.87590.88490.73590.80190.75390.72490.66190.639
TEMP 21DEG F
90.95990.92690.87490.84090.76690.73390.66690.64890.60590.53890.53190.47790.432
TEMP 22DEG F
90.90190.85990.79490.77490.70990.66690.61090.58190.53990.49290.45190.42090.377
TEMP 23DEG F
'91.28891 '5791 '1491.15091.09691.05391.01790 '6890.93590.89090.86190.80790.753
TEMP 24DEG F
90.97890.91390.87190.80690.77490.73290.67390.62490.59190.57790.52890.48590.441
CLRT VARIABLE SUMMARY
SAMPLE DELTAN HOURS
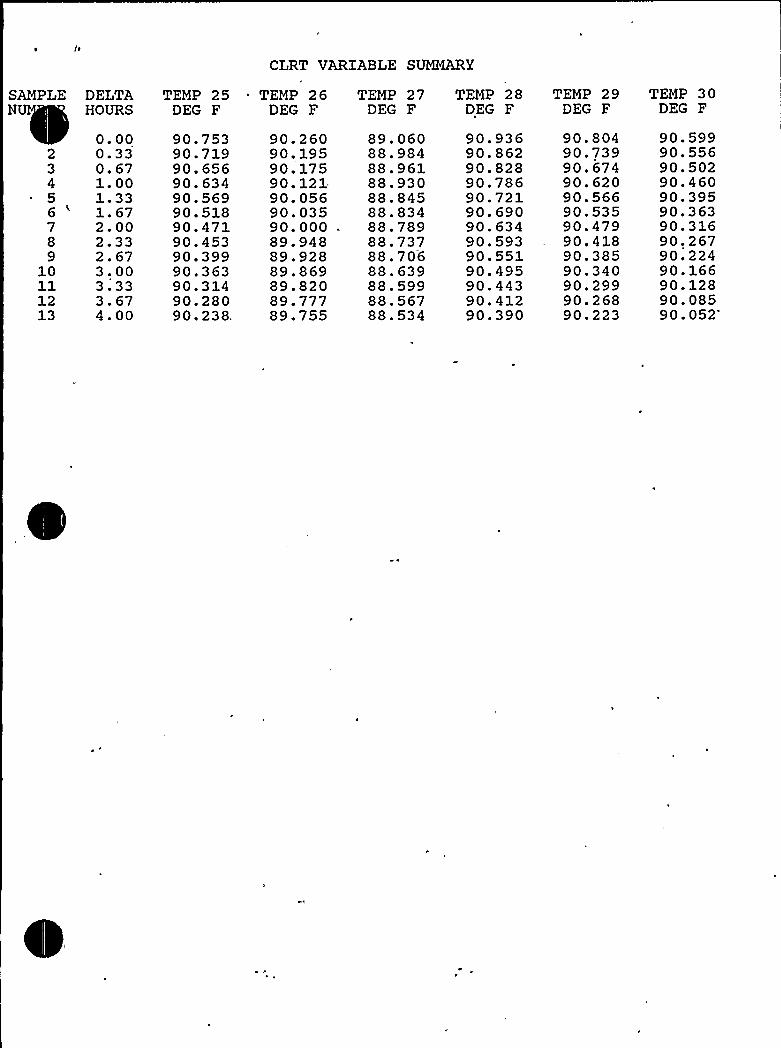
TEMP 25 TEMP 26DEG F DEG F
TEMP 27DEG F
TEMP 28DEG F
TEMP 29DEG F
TEMP 30DEG F
2345
789
10ll1213
0. 000.330.671.001.33l. 672.002.332.673.003.333.674.00
90.75390.71990.65690.63490.56990.51890.47190.45390.39990.36390.31490.28090.238,
90.26090.19590. 17590. 121.90.05690.03590.000-89.94889.92889.86989.82089.77789.755
89.06088.98488.96188.93088.84588.83488.78988.73788.70688.63988.59988.56788.534
90.93690.86290.82890.78690.72190.69090.63490.59390.55190.49590.44390.41290.390
90.80490.73990.67490.62090.56690.53590.47990.41890.38590.34090.29990.26890.223
90.59990.55690.50290.46090.39590.36390.31690.26790.22490.16690.12890.08590.052'

SAMPLE DELTA TEMP 31N HOURS DEG F
CLRT VARIABLE SUMMARY
TEMP 32 TEMP 33 TEMP 34DEG F DEG F DEG F
TEMP 35DEG F
TEMP 36DEG F
23456789
10ll1213
0.000.330.671.001.331.672.002.332.673.003.333. 674.00
89.21089.17789.12389.07188.98488.97588.92888.87788.83588.76888.75088.68588.654
90.55090.49690.44290.35790;31490.27290.24790.16490.14290.07490.04590.01489.938
DELETEDDELETEDDELETEDDELETEDDELETEDDELETEDDELETEDDELETEDDELETEDDELETEDDELETEDDELETEDDELETED
90. 63390.55790.514
~ 90.46090.40690.36490.30890.27890.23690.17790.15090.11790.052
90.72090.65590.61290.55890.50490.46290.40390.35490.33290.26490.23590.18190.150
92.14892.09492.04091.98691.95591.90191.85691.81691.77391.71491. 68791. 65491.600
f ~
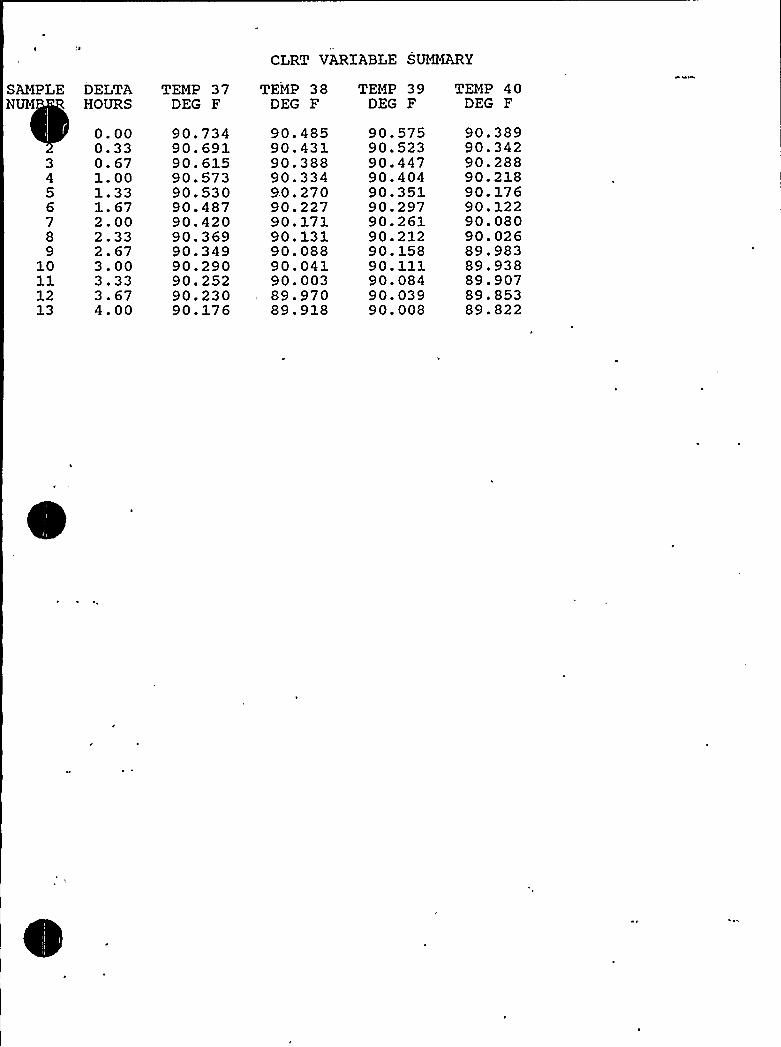
CLRT VARIABLE SUMMARY
SAMPLENUM
3456789
10111213
DELTAHOURS
0.000.330. 671. 001.331.672.002.332.673.003.333.674.00
TEMP 37DEG F
90.73490.69190.61590.57390.53090.48790.42090.36990.34990.29090.25290.23090.176
TEMP 38DEG F
90.48590.43190.38890.33490.27090.22790. 17190. 13190.08890.04190.00389.97089.918
TEMP 39DEG F
90.57590.52390.44790.40490.35190.29790.26190.21290.15890.11190.08490.03990.008
TEMP 40DEG F
90.38990.34290.28890.21890.17690.12290.08090.02689.98389.93889.90789.85389.822
CLRT VARIABLE SUMMARY
SAMPLENUY
23456789
10111213
DELTAHOURS
0. 000.330.671.001.331.672.002.332.673.003.333.674.00
PRES 1PSXA
55.35955.35155.34555.33855.33155.324
~ 55.31855.31155.305
: 55.29955.29355.28755.281
PRES 2PSIA
55.36455.35655.35055.34355.33655.33055.323 .
55.31755.31055.30455.29855.29255.286
HUM 1~o RH
53.53053.74053.87054.05054.15054.28054.42054.58054.65054.79054.89054.99055.100
HUM 2~o RH
57. 19057.35057.48057.65057.81057.95058.09058.17058.28058.36058.47058.58058.640
HUM 34 RH
60.52060.64060.78060.89060.96061.06061.11061.23061.35061.41061.48061.54061.610
HUM 44 RH
49'8049.54049.58049.66049.61049.65049.70049.61049.82049.88049.86049.91049.860

CLRT VARlABLE SUMMARY
SAMPLEN
23456789
10111213
DELTAHOURS
0.000.330.671.001.331.672.002.332.673.003.333.674.00
HUM 5% RH
52. 57'052.63052.63052.68052.68052.70052.76052.79052.79052.82052.85052.86052.940
HUM 64 RH
50.68050.67050.69050.73050.77050.80050.66050.77050.75050.77050.78050.90050.940
HUM 74 RH
51.31051.31051.34051.35051.38051.39051.42051.44051.49051.51051.52051.53051.550
HUM 8~o
RH'4.160
54.18054.17054.21054.19054.19054.23054.25054.25054.26054.27054.24054.240
HUM 9% RH
54. 15054.25054.27054.33054.25054.24054.32054.35054.34054.42054.41054.35054.480
HUM 10~o RH
54.57054.63054.64054.60054.63054.65054.67054.66054.72054.71054.75054.74054.820
APPENDIX C
LOCALLEAKAGERATE TESTING
CONDUCTED SINCE THE LAST ILRT


REFUELING OUTAGE TYPE B TESTINGSINCE LAST ILRT
1991 REFUELING OUTAGE
';.',PENETRATION„"<„>g~~+«SERVICE>',.'.":.','.,.
F~~VALVgi-~:.'.> N UMBE R <,'-..,''- 'gjTEST,-','.>
.ja'>gj?Q"q j
:;.jDATE:i'<)
',AS:;FO,UND ~<
'i>gSCCM~i";.:i'"„,MIN~PATH .
('>AS:. LEFTY)",:
,DMIN.",PATHm
~'„:;AS',LEFT~'j::
~I~ S CCM'j';jii'::MAX!
PATH!!,'AIN
STEAM BELL1A
MAIN STEAM BELL18
FEEDWATER BELL1A
FEEDWATER BELL18
TAP ¹1TAP ¹2
TAP ¹1TAP ¹2
TAP ¹1TAP ¹2
TAP ¹1TAP ¹2
88
88
88
88
10/21/9110/21/91
10/21/9110/21/91
10/21/9110/21/91
10/21/9110/21/91
2020
2020
2020
2020
2020
2020
2020
2020
2020
2020
2020
2020
2020
2020
2020
2020
25
E-4
FUELTRANS BELL TAP ¹1
GASKETOUTAGE AUX. PEN. INTERSPACE
11/27/91
12/13/91
20
20
20
20
20
20
20
20
A-1 THRU E-10
MAINT.HATCH
FUELTRANSFER
ELEC. PEN.
GASKETINTERSPACE
GASKETINTERSPACE
N/A
12/13/91
12/06/91
10/29/91
20
20
20
20
20
20
20
20
20
20
20
20
TOTALTYPE 8
KAGE
260 260 260 260
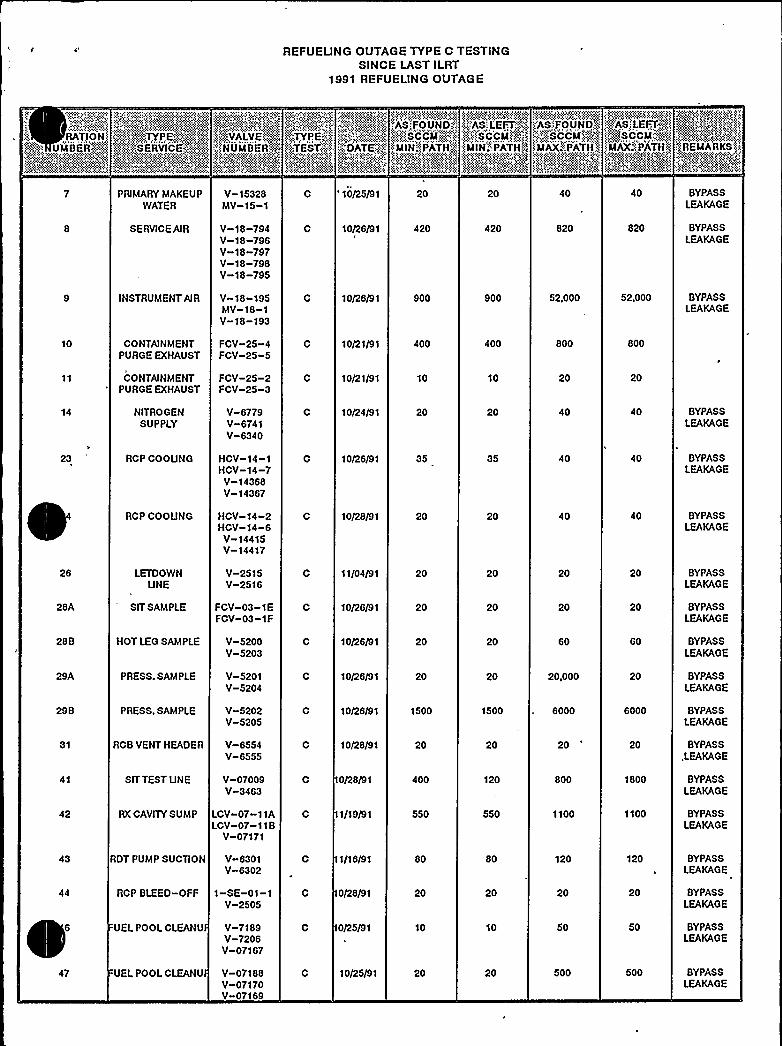
REFUELING OUTAGE TYPE C TESTINGSINCE LAST ILRT
1991 REFUELING OUTAGE
RATION':UMBER":::N"'x::;;,;a:,'SERVICE'':::5ai 'NUMBERY4«
'jTYP,E„"::,'.,"TEST;
P ;;:::DATE': ',';
AS:,FOUND'<;<:„<.>,S C C M<'~i"''p
:I MIN;",PATH/
$KN: '<4<:"..< x«:".<:N
"~"SCCMP> <~
MAX~/'ATH >MAX':.PATH'j ",REMARKS)»
10
14
23
PRIMARYMAKEUPWATER
SERVICE AIR
INSTRUMENTAIR
CONTAINMENTPURGE EXHAUST
CONTAINMENTPURGE EXHAUST
NITROGENSUPPLY
RCP COOUNG
RCP COOUNG
V-15328MV-15-1
V-18-794V-18-796V-18-797V-18-798V-18-795
V-18-195MV-18-1V-18-193
FCV-25-4FCV-25-5
FCV-25-2FCV-25-3
V-6779V-6741V-6340
HCV-14-1HCV-14-7V-14368V-14367
HCV-14-2HCV-14-6V-14415V-14417
'0/25/91
10/26/91
10/26/91
10/21/91
10/21/91
10/24/91
10/26/91
10/28/91
20
420
900
400
10
20
35
20
20
420
900
400
10
20
35
20
40
820
52,000
800
20
40
40
40
40
820
52,000
800
20
40
40
40
BYPASSLEAKAGE
BYPASSLEAKAGE
BYPASSLEAKAGE
BYPASSLEAKAGE
BYPASSLEAKAGE
BYPASSLEAKAGE
28A
288
29A
298
31
41
42
43
44
47
LETDOWNUNE
SIT SAMPLE
HOT LEG SAMPLE
PRESS. SAMPLE
PRESS. SAMPLE
RCB VENT HEADER
SIT TEST UNE
RX CAVllYSUMP
RDT PUMP SUCTION
RCP BLEED-OFF
UEL POOL CLEANU
UEL POOL CLEANU
V-2515V-2516
FCV-03-1EFCV-03-1F
V-5200V-5203
V-5201V-5204
V-5202V-5205
V-6554V-6555
V-07009V-3463
LCV-07-11ALCV-07-118
V-07171
V-6301V-6302
1-SE-01-1V-2505
V-7189V-7206V-07167
V-07188V-07170V-07169
C
C
C
11/04/91
10/26/91
10/26/91
10/26/91
10/26/91
10/28/91
0/28/91
1/19/91
1/16/91
0/28/91
0/25/91
10/25/91
20
20
20
20
1500
20
400
550
80
20
10
20
20
20
20
20
1500
20
120
550
80
20
10
20
20
20
60
20,000
6000
20
800
1100
120
20
50
500
20
20
60
20
6000
20
1800
1100
120
20
50
500
BYPASSLEAKAGE
BYPASSLEAKAGE
BYPASSLEAKAGE
BYPASSLEAKAGE
BYPASSLEAKAGE
BYPASS.LEAKAGE
BYPASSLEAKAGE
BYPASSLEAKAGE
BYPASSLEAKAGE
BYPASSLEAKAGE
BYPASSLEAKAGE
BYPASSLEAKAGE


REFUE LING OUTAGE TYPE C TESTINGSINCE LAST ILRT
1991 REFUELING OUTAGE
?>
RATIONXC~? NUMBERgjgj,",
i?P~~~:;VALVE::jig!:;.
',+~'.,jjc pQ>'PNy&KWy
.
+TESTgp~j,
AS',FOUND~,,'::..'„'<i
S COME<'„'.,'>
MIN;''PATHIS
<PAS LEFT/<>>?:.>~.'>? S C C M) '4g?,,
?'MIN�
)PATH""
FAS FOUND,)""
!MAX. PATH'
''.:AS,', LEFTY;;;.;g.,;.;SCCM?,".~@
,'MAX'';PATH.'' gREMAAKS.)
48A H2 SAMPLE FSE-27-1FSE-27-2FSE-27-3FSE-27-04FSE-27-08
0/23/91 20 20 80 80
48C
51A
51C
52A
52B
'2C
„54
56
57
58
67
68
H2 SAMPLE
H2 SAMPLE
H2 SAMPLE
RCB ATMOSRAD MONITORS-
RCB ATMOSRAD MONITORS
RCB ATMOSRAD MONITORS
ILRTTESTCONNECllON
ILRTTESTCONNECllON
ILRTTESTCONNECTION
HYDROGENPURGE MAKEUP
HYDROGEN PURGETO FILTER
HYDROGEN PURGEFILTER BYPASS
CONTAINMENTVACUUMREUEF
CONTAINMENTVACUUMREUEF
V-27-101FSE-27-11
V-27-102FSE-27-11
FSE-27-5FSE-27-6FSE-27-7FSE-27-9
FCV-26-1FCV-26-2
FCV-26-3FCV-26-4
FCV;26-5FCV-26-6
V-00140V-00143V-00142
V-00139V-00144V-00141
V-00101
V-25-11V-25-12
V-25-13V-25-14
V-25-15V-25-16
V-25-20FCV-25-7
V-25-21FCV-25-8
C
0/23/91
0/23/91
0/22/91
0/22/91
0/22/91
0/23/91
0/22/91
0/22/91
0/20/91
0/21/91
0/21/91
0/21/91
1/11/91
1/1 1/91
20
20
20
1100
1240
90
600
10
1100
35
47.5
200
750
180
20
20
20
1100
1240
90
600
10
0
35
47.5
200
750
180
8900
40
60
1300
1500
1100
1200
20
2200
70
95
400
2000
1500
8900
40
60
'300
1500
1100
1200
20
2100
70
95
400
2000
1500
BYPASSLEAKAGE
BYPASSLEAKAGE
BYPASSLEAKAGE
BYPASSLEAKAGE
BYPASSLEAKAGE
BYPASSLEAKAGE
BYPASSLEAKAGE
BYPASSLEAKAGE
BYPASSLEAKAGE
TOTALTYPE CNON- BYPASS
LEAKAGE1,420 1,420 13,400 6,200
TOTALTYPE CBYPASS
LEAKAGE8,517.5 7,137.5 89,655 71,675
OTAL, TYPE CYPASS
KAGE9.937.5 e,SS7.S 103,055 77,875
PLANT UMIT544,786 SCCM

~ I
REFUELING OUTAGE TYPE B TESTINGSINCE LAST ILRT
1993 REFUELING OUTAGE
»';:;;i@NUM8 E R~»';:.;:»:,'j~g:,.SERVICE:;-';-:i;':.;.:g;:~!NUM8 E 8:~i l
/gal
~"»~ A . Mz,g»..,$ ." „%'',~;:...:.y,';%j<; j"» '.Pq~,.yg
kTYPEi",",„'TEST,;;",;.
4:: "-':'-':::"::i': .'/AS FOUND:»,':':."."AS'jL'EF~T,::,g'MIN)PATH,'',
>ASiFO,UNDY~.g"„::.'.S C CM'(;",',".iMAX'":PATH
AS!LEF~T;:»
:;::~gj,:SCCMIqj'gc MA»X~PATH)> :.;REMARKS ':
MAINSTEAM BELL1A
MAINSTEAM BELL18
FEEDWATER BELL1A
FEEDWATER BELL18
TAP ¹1TAP ¹2
TAP ¹1TAP ¹2
TAP ¹1TAP ¹2
TAP ¹1TAP ¹2
88
88
88
88
3/31/933/31/93
3/31/933/31/93
3/31/933/31/93
3/31/933/31/93
2020
2020
2020
2020
2020
2020
2020
2020
2020
2020
2020
2020
2020
2020
2020
2020
25
E-4
FUELTRANS BELL TAP ¹1
GASKETOUTAGE AUX. PEN. INTERSPACE
4/8/93
3/31/93
20
20
20
20
20
20
20
20
A-1 THRU E-~
MAINT.HATCH
F U EL TRAN SF E R
ELEC. PEN.
GASKETINTERSPACE
GASKETINTERSPACE
N/A
8
8
8
3/31/93
4/3/93
4/5/93
40
20
17.9
115
20
17.9
40
20
17.9
115
20
17.9
277.9 352.9 277.9 352.9
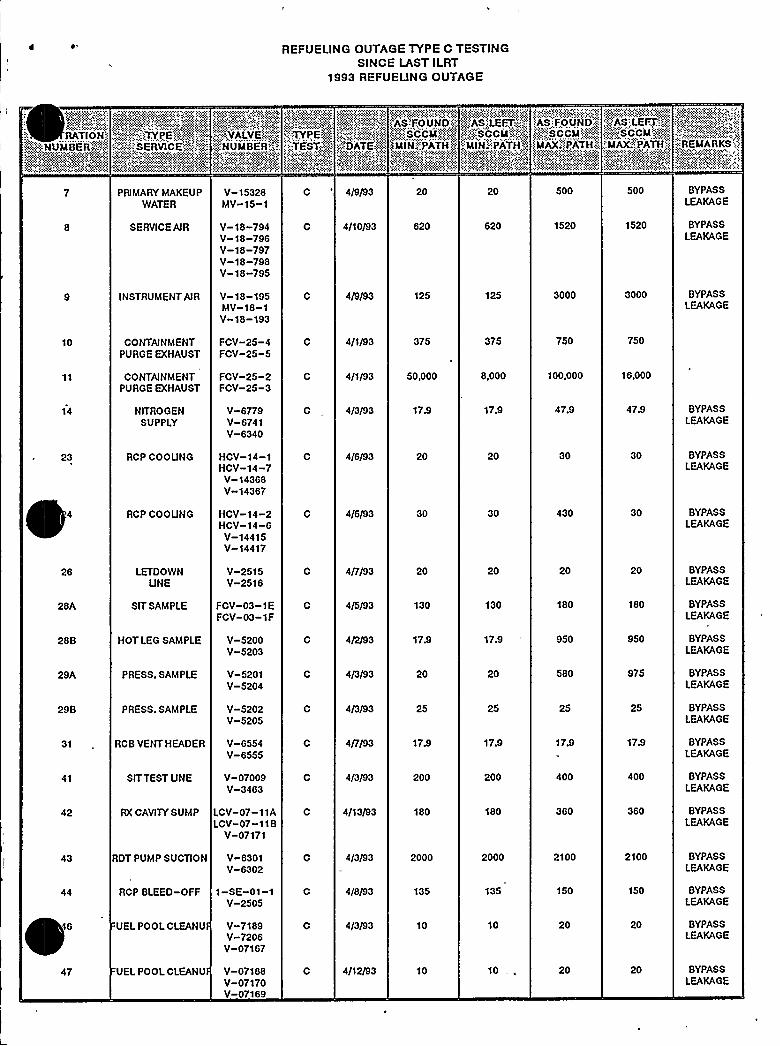
REFUELING OUTAGE TYPE C TESTINGSINCE LAST ILRT
1993 REFUELING OUTAGE
RATION!«i':>;::, NUM
BEE;i".'",.,.','::::::".::;gY, PEP::4'".";:".'«
': i;"-.'SERVICE(i;-;:::,:c. <:.,'.'NUMBER';.",.
i-.'.oTY PE'„.: y:
: ''TESTgj';.':DATE)%j
:,:"AS:FOUND'':;!g<,!„':SCCA'j>g:>MIN "PATHi)
«.:."..6':i;.'N:Ail)'.!
<i~'A'S!LEFT::;.."
;;;.;,SCCM';;;>'" MINX'.PATH;5
'AS!FOUND:.„". ;:i«AS'EFT,::;::~i
'.'REMARKS':;«
10
14
23
PRIMARY MAKEUPWATER
SERVICE AIR
INSTRUMENTAIR
CONTAINMENTPURGE EXHAUST
CONTAINMENTPURGE EXHAUST
NITROGENSUPPLY
RCP COOUNG
RCP COOUNG
V-15328MV-15-1
V-18-794V-18-796V-18-797V-18-798V-18-795
V-18-195MV-18-1V-18-193
FCV-25-4FCV-25-5
FCV-25-2FCV-25-3
V-6779V-6741V-6340
HCV-14-1HCV-14-7V-14368V-14367
HCV-14-2HCV-14-6V-14415V-14417
C '/9/93
4/10/93
4/9/93
4/1/93
4/1/93
4/3/93
4/6/93
4/6/93
20
620
125
375
50,000
17.9
20
30
20
620
125
375
8,000
17.9
20
30
500
1520
3000
750
100,000
47.9
30
430
500
1520
3000
750
16,000
47.9
30
30
BYPASSLEAKAGE
BYPASSLEAKAGE
BYPASSLEAKAGE
BYPASSLEAKAGE
BYPASSLEAKAGE
BYPASSLEAKAGE
26
28A
28B
29A
29B
31
41
42
43
44
47
LETDOWNUNE
SIT SAMPLE
HOT LEG SAMPLE
PRESS. SAMPLE
PRESS. SAMPLE
RCB VENT HEADER
SIT TEST UNE
RX CAVITYSUMP
RDT PUMP SUCTION
RCP BLEED-OFF
UEL POOL CLEANU
UEL POOL CLEANU
V-2515V-2516
FCV-03-1EFCV-03-1F
V-5200V-5203
V-5201V-5204
V-5202V-5205
V-6554V-6555
V-07009V-3463
LCV-07-11ALCV-07-11 9
V-07171
V-6301V-6302
1-SE-01-1V-2505
V-7189V-7206V-07167
V-07188V-07170V-07169
C
C
4P/93
4/5/93
4/2/93
4/3/93
4/3/93
4P/93
4/3/93
4/13/93
4/3/93
4/8/93
4/3/93
4/1 2/93
20
130
17.9
20
25
17.9
200
180
2000
135
10
10
20
130
17.9
20
25
17.9
200
180
2000
135
10
10
20
180
950
580
25
17.9
400
360
2100
150
20
20
20
180
950
975
25
17.9
400
360
2100
150
20
20
BYPASSLEAKAGE
BYPASSLEAKAGE
BYPASSLEAKAGE
BYPASSLEAKAGE
BYPASSLEAKAGE
BYPASSLEAKAGE
BYPASSLEAKAGE
BYPASSLEAKAGE
BYPASSLEAKAGE
BYPASSLEAKAGE
BYPASSLEAKAGE
BYPASSLEAKAGE

REFUELING OUTAGE TYPE C TESTINGSINCE LAST ILRT
1993 REFUELING OUTAGE
:FNUMBER~>;..'~»TYP E','-'.."-':,'TEST;i@ MDATEY'>:j
!YAS;FOUND))!..'P'~ S C CM I>:,"j<
i'; MIN"PATH '.
$R'<'»" >4%<4~>.',:,'hS)F>OUNO~.>>Ni;.,S C CM'AX:"''PATH „".':
;..;;%IV:~;.» ..«»:,j'j'AS'.LEFT„"'::;l
''MAX"PATH,'i jREMARKS I
48A
48C
51A
51C
52A
52B
52C
„54
56
57
58
67
68
H2 SAMPLE
H2 SAMPLE
H2 SAMPLE
H2 SAMPLE
ROB ATMOSRAD MONITORS
ROB ATMOSRAD MONITORS,
RCB ATMOSRAD MONITORS
ILRTTESTCONNECTION
ILRTTESTCONNECTION
ILRTTESTCONNECTION
HYDROGENPURGE MAKEUP
HYDROGEN PURGETO FILTER
HYDROGEN PURGEFILTER BYPASS
CONTAINMENTVACUUM REUEF
CONTAINMENTVACUUMREUEF
FSE-27-1FSE-27-2FSE-27-3FSE-27-04FSE-27-08
V-27-101FSE-27-11
V-27-102FSE-27-11
FSE-27-5FSE-27-6FSE-27-7FSE-27-9
FCV-26-1FCV-26-2
FCV-26-3FCV-26-4
FCV-26-5FCV-26-6
V-00140V-00143V-00142
V-00139V-00144V-00141
V-00101
V-25-11V-25-12
V-25-13V-25-14
V-25-15V-25-16
V-25-20FCV-25-7
V-25-21FCV-25-8
C
4P/93
4P/93
4/8/93
4/8/93
4/6/93
4/6/93
4/6/93
3/31/93
3/31/93
3/31/93
3/31/93
3/31/93
3/31/93
4/12/93
, 4/12/93
30
20
40
20
950
1000
50
575
15
1200
32.5
47.5
150
500
1500
30
20
40
20
120
130
20
575
15
900
32.5
47.5
150
2600
400
80
9100
40
90
1000
1200
950
1150
30
2400
95
300
2600
1600
80
20
40
57.9
3000
9800
700
1150
30
1800
65
95
300
3500
1600
BYPASSLEAKAGE
BYPASSLEAKAGE
BYPASSLEAKAGE
BYPASSLEAKAGE
BYPASSLEAKAGE
BYPASSLEAKAGE
BYPASSLEAKAGE
BYPASSLEAKAGE
BYPASSLEAKAGE
TOTALTYPE CNON-BYPASS
LEAKAGE52,485.00 11,485.00 114,260.00 22,047.90
TOTALTYPE CBYPASS
LEAKAGE7,618.70 5,588.70 17,540.80 27,285.80
OTAL.TYPE CYPASS
KAGE60,103.70 17,073.70 131,800.80 49,333.70
PLANT UMIT544.786 SCCM