st quarter 2014 - ir.chartnexus.comir.chartnexus.com/thplantation/doc/presentation/thp - 1q14 -...
TRANSCRIPT
1 TH PLANTATIONS BERHAD
(Company No: 12696-M)
1st Quarter 2014 Analyst/Investor Briefing 21 May 2014 2.30pm
TH PLANTATIONS BERHAD
(Company No: 12696-M) Presented by: Radin Rosli Radin Suhadi Plantations Director
Aizzura Ab Rahim Investor Relations

2 TH PLANTATIONS BERHAD
(Company No: 12696-M)
1Q14 highlights
+18%
Mature Area
4.48 mt/ha
FFB Yield
+8%
FFB Production
+37%
FFB Processed
+214%
FFB Purchased
19.93%
OER
+34%
CPO Production
+23%
CPO ASP
4.43%
KER
+39%
Revenue
+49%
Gross Profit
+37%
Cost of Sales
+42%
EBITDA
+90%
Operating Profit
+33%
Profit After Tax

3 TH PLANTATIONS BERHAD
(Company No: 12696-M)
Area Statement (including recently-acquired PT PKP)
Peninsular Sabah Sarawak Indonesia Total
Oil Palm
Mature 11,771 7,056 19,588 38,415
Immature 5,417 1,514 15,070 22,001
Total planted 17,188 8,570 34,659 60,416
Total planted (%) 28% 14% 58% 100%
In-course of planting 1,244 736 2,217 4,197
Greenfield 4,710 11,380 16,090
Rubber
Immature 2,982 2,982
In-course of planting 3,200 3,200
Greenfield 3,248 3,248
Teak 5,129 5,129
Infrastructure & Unplantable 1,567 1,779 10,605 - 13,951
Total land bank 19,998 25,644 52,191 11,380 109,213
Total land bank (%) 18% 24% 48% 10% 100%

4 TH PLANTATIONS BERHAD
(Company No: 12696-M)
Area Statement (including recently-acquired PT PKP)
Mature Oil Palm 35%
Immature Oil Palm 20%
Immature Rubber 3%
Immature Teak 4%
In-course of planting
7%
Greenfield 18%
Infra & Others 13%
Total land bank: 109,213 Ha
>25 years (Old
Mature) 10%
20 - 25 (Old
Mature) 15%
10 - 19 (Prime
Mature) 24%
4 - 9 (Young
Mature) 51%
Average age: 13 years

5 TH PLANTATIONS BERHAD
(Company No: 12696-M)
A closer look at revenue
Avg Mature Area (ha) 3
2,5
40
38
,41
5
1Q13 1Q14
+18%
FFB Production (MT)
15
9,0
36
17
2,0
02
1Q13 1Q14
+8%
CPO Production (MT)
29
,55
8
39
,61
8
1Q13 1Q14
+34%
FFB Processed (MT)
14
5,3
62
19
8,7
42
1Q13 1Q14
+40%
CPO Sales (MT)
32
,94
0
39
,09
6
1Q13 1Q14
+19%
PK Production (MT)
7,3
83
8,8
03
1Q13 1Q14
+19%

6 TH PLANTATIONS BERHAD
(Company No: 12696-M)
Bigger contribution of younger estates seen
FFB Yield (MT/ha) 4
.89
4.4
8
1Q13 1Q14
KER (%) 5
.08
4.4
3
1Q13 1Q14
-0.65 ppt
OER (%)
20
.33
19
.93
1Q13 1Q14
-0.40 ppt
-8% Estates FFB Cont Yields
Sg Arip 2% 3.02
Merbok 3% 3.48
Tg Lilin 3% 3.48
Raja Udang 5% 3.86
Enggang 5% 3.96
Estates FFB Cont Yields
Sg Tenegang 2% 6.02
Sg Merchong 2% 5.61
Sg Koyah 2% 5.35
Mamahat 6% 5.29
Gedong 5% 4.99
Prolonged dry spell in late 1Q – forced ripening
Industry-wide OER and KER downtrend
Note: 1st year harvesting: 7,484ha @ 20% of mature area
OER & KER seen improving in April onwards
Additional contributing factors:

7 TH PLANTATIONS BERHAD
(Company No: 12696-M)
4.51 4.66
5.76
7.22
4.89
5.41
6.92 6.61
4.48
0.0
1.0
2.0
3.0
4.0
5.0
6.0
7.0
8.0
-
50,000
100,000
150,000
200,000
250,000
1Q12 2Q12 3Q12 4Q12 1Q13 2Q13 3Q13 4Q13 1Q14
Lower yield due to bigger contribution of younger estates FF
B P
rod
uct
ion
(M
T)
Post major acquisitions
FFB Y
ield
/he
ctare (MT/H
a)
8 TH PLANTATIONS BERHAD
(Company No: 12696-M)
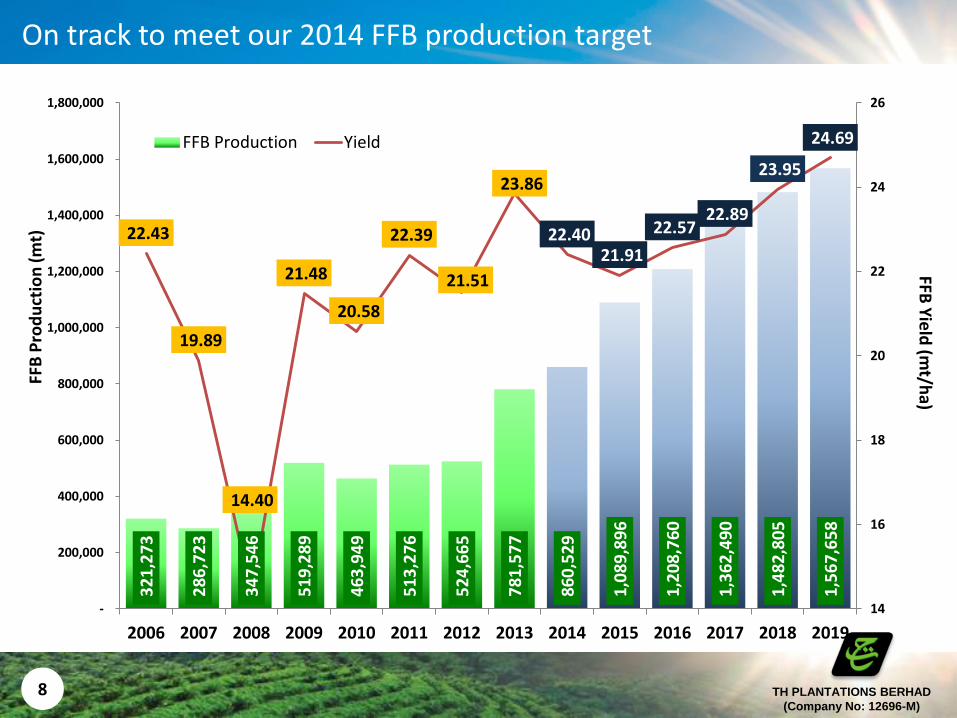
On track to meet our 2014 FFB production target
32
1,2
73
28
6,7
23
34
7,5
46
51
9,2
89
46
3,9
49
51
3,2
76
52
4,6
65
78
1,5
77
86
0,5
29
1,0
89
,89
6
1,2
08
,76
0
1,3
62
,49
0
1,4
82
,80
5
1,5
67
,65
8
22.43
19.89
14.40
21.48
20.58
22.39
21.51
23.86
22.40 21.91
22.57 22.89
23.95
24.69
14
16
18
20
22
24
26
-
200,000
400,000
600,000
800,000
1,000,000
1,200,000
1,400,000
1,600,000
1,800,000
2006 2007 2008 2009 2010 2011 2012 2013 2014 2015 2016 2017 2018 2019
FFB Production Yield
FFB
Pro
du
ctio
n (
mt)
FFB
Yie
ld (m
t/ha)

9 TH PLANTATIONS BERHAD
(Company No: 12696-M)
Stronger CPO prices seen in 1Q of the year
Group 1Q14 1Q13
CPO RM2,507 RM2,035
PK RM1,918 RM1,115
FFB RM626 RM346
Sabah Sarawak
Sales Tax 7.5% 5%
Discount RM40-100
+23%
+72%
+81%
CPO Prices MPOB Reference
Price
Average Trading
Price
Average Selling Price
(before sales tax)
Average Selling Price
(after sales tax)
Sales Volume
(%)
Peninsular 2,658 2,642 2,621 - 30%
Sarawak 2,604 2,607 2,588 2,464 50%
Sabah 2,640 2,619 2,559 2,358 20%

10 TH PLANTATIONS BERHAD
(Company No: 12696-M)
1,1
29
1,4
92
1Q13 1Q14
CPO Production Cost (RM/MT)
Higher costs attributed to younger estates
Ave
rage
19
9 24
4
1Q13 1Q14
Estate Production Cost (RM/MT)
49
46
1Q13 1Q14
Mill Manufacturing Cost (RM/MT)
*excl depreciation *excl depreciation
*excl depreciation
+32%
+22%
-5%
11 TH PLANTATIONS BERHAD
(Company No: 12696-M)
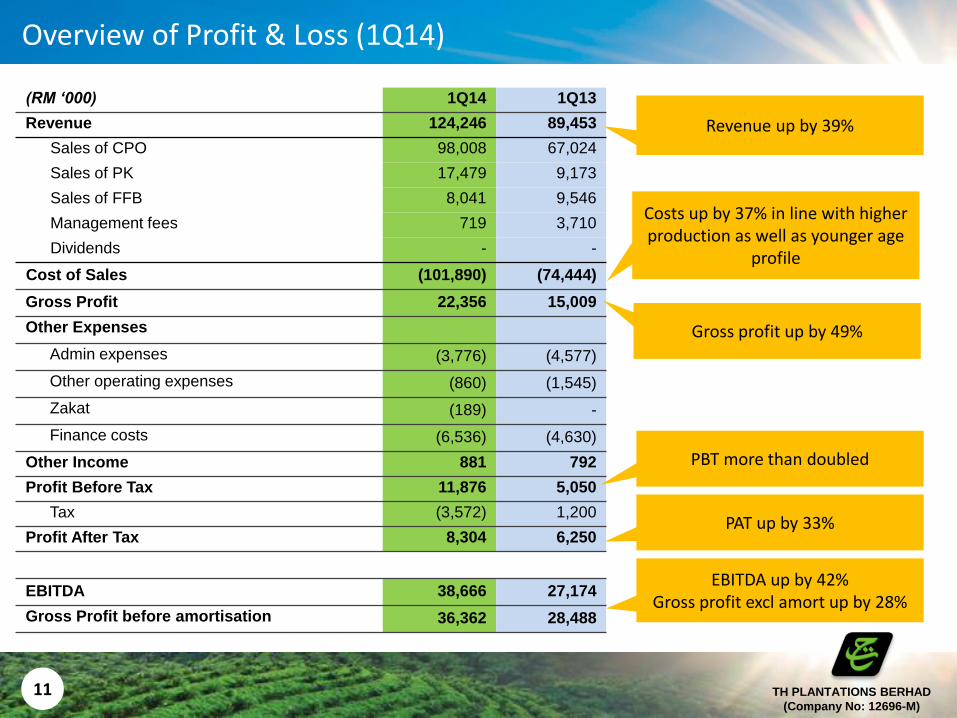
Overview of Profit & Loss (1Q14)
(RM ‘000) 1Q14 1Q13
Revenue 124,246 89,453
Sales of CPO 98,008 67,024
Sales of PK 17,479 9,173
Sales of FFB 8,041 9,546
Management fees 719 3,710
Dividends - -
Cost of Sales (101,890) (74,444)
Gross Profit 22,356 15,009
Other Expenses
Admin expenses (3,776) (4,577)
Other operating expenses (860) (1,545)
Zakat (189) -
Finance costs (6,536) (4,630)
Other Income 881 792
Profit Before Tax 11,876 5,050
Tax (3,572) 1,200
Profit After Tax 8,304 6,250
EBITDA 38,666 27,174
Gross Profit before amortisation 36,362 28,488
Revenue up by 39%
EBITDA up by 42% Gross profit excl amort up by 28%
Gross profit up by 49%
PBT more than doubled
PAT up by 33%
Costs up by 37% in line with higher production as well as younger age
profile

12 TH PLANTATIONS BERHAD
(Company No: 12696-M)
A closer look at costs
Cost of Sales 1Q14 1Q13 Variance (%) Remarks
Estate Production Cost 41,973 31,604 +33% Higher production and higher costs associated with younger palms
Overhead 6,641 5,349 +24% In line with acquisitions
FFB Purchases 21,774 6,051 +260% RUPOM commissioned in July 2013 as well as initiatives to increase utilisation at other mills
Mill Manufacturing Cost 12,581 8,832 +42% Higher production and new mill
Depreciation – Estates 2,136 1,594 +34% In line with major acquisitions
Depreciation – Mill 3,882 2,124 +83% In line with major acquisitions
Amortisation 14,007 13,478 +4% In line with guidance
Other Costs 1Q14 1Q13 Variance (%) Remarks
Admin Expenses 3,776 4,577 -17% Lower costs related to acquisitions
Other operating expenses 630 1,248 -50% Lower costs related to acquisitions
Depreciation 231 297 -22% -
Zakat 189 - +100% Net current assets > net current liabilities
Finance Cost 6,536 4,630 +41% Additional debt drawdown in April and Dec 2013

13 TH PLANTATIONS BERHAD
(Company No: 12696-M)
Progress Update

14 TH PLANTATIONS BERHAD
(Company No: 12696-M)
Sibu
Tawau
Kota Kinabalu
Sandakan
Kuching
Bintulu
Miri
Lahad
Datu
Seremban
Johor Bahru
Kuantan
Kuala Terengganu
Kota Baharu
Ladang Londah
Ladang Klagan 2
Ladang Klagan 4
Ladang Jatimas
Ladang Sungai Kerian
Ladang Sungai Rasau
Ladang Kepayang
Ladang Semalatong
Ladang Sungai Merchong
Ladang Bukit Lawiang
Ladang Gunung Sumalayang
Ladang Sungai Tenegang
Ladang Sungai Koyah
Ladang Sungai Arip
2014 development programme
Ladang Sungai Buan
OP new planting 2,217 ha
OP replanting 1,980 ha
Rubber new planting 3,200 ha

15 TH PLANTATIONS BERHAD
(Company No: 12696-M)
2010 Age Profile – 19 Years
3,205 Ha 9%
8,050 Ha 21%
8,217 Ha 22%
3,069 Ha 8%
> 25 (Old Mature) 20-25 (Mature) 10 - 19 (Prime Mature) 4 - 9 (Young Mature)
1,113 Ha 2%
3,148 Ha 4%
25,118 Ha 34%
32,282 Ha 43%
2017 Age Profile – 10 Years
Average age to be optimised in 5 years
3,944 Ha 10%
5,846 Ha 15%
9,028 Ha 24%
19,597 Ha 51%
2014 Age Profile – 13 Years
Immature: 14,943 ha
Immature: 26,198 ha
Immature: 15,645 ha

16 TH PLANTATIONS BERHAD
(Company No: 12696-M)
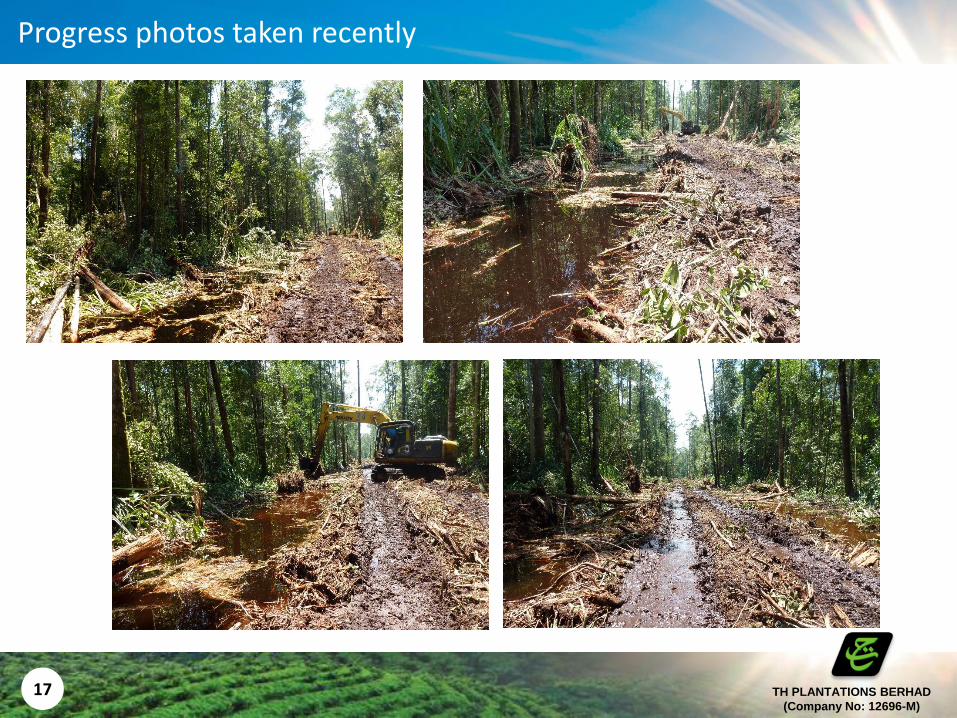
PT PKP: Progress Update
• Acquisition completed on 11 January 2014 • Approx 11,380 hectares of land bank • About 30 ha have been cleared for nursery site – first batch of seeds
expected to arrive mid June • Planting expected to commence in 2Q15
17 TH PLANTATIONS BERHAD
(Company No: 12696-M)
Progress photos taken recently

18 TH PLANTATIONS BERHAD
(Company No: 12696-M)
Progress photos taken recently

19 TH PLANTATIONS BERHAD
(Company No: 12696-M)
Outlook Production on track so far Weather may impact production Prices expected to be volatile
20 TH PLANTATIONS BERHAD
(Company No: 12696-M)
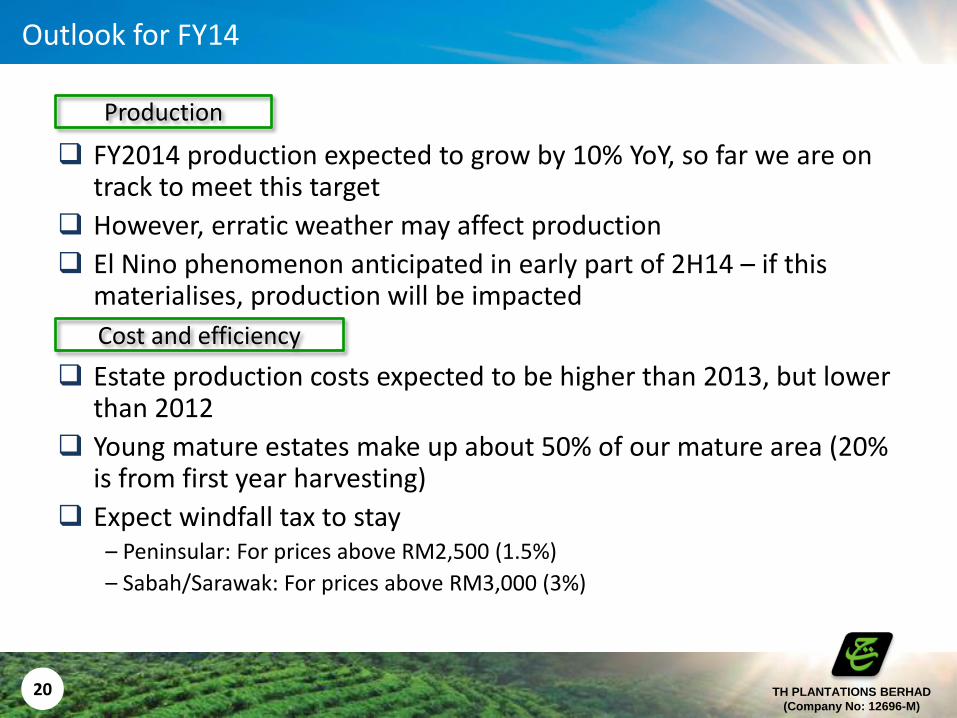
Outlook for FY14
FY2014 production expected to grow by 10% YoY, so far we are on track to meet this target
However, erratic weather may affect production
El Nino phenomenon anticipated in early part of 2H14 – if this materialises, production will be impacted
Estate production costs expected to be higher than 2013, but lower
than 2012
Young mature estates make up about 50% of our mature area (20% is from first year harvesting)
Expect windfall tax to stay – Peninsular: For prices above RM2,500 (1.5%)
– Sabah/Sarawak: For prices above RM3,000 (3%)
Production
Cost and efficiency

21 TH PLANTATIONS BERHAD
(Company No: 12696-M)
Outlook for FY14
CPO prices are expected to be volatile for the rest of the year
Higher stockpiles
Increase in near-term production
Lower growth in China
Strengthening MYR
Increased demand of palm oil for biodiesel
Anticipation of El Nino
30% (long-term): 30% (forward) : 40% (spot) practised depending on prevailing prices
Marketing Strategy
CPO Price
22 TH PLANTATIONS BERHAD
(Company No: 12696-M)
Thank You
Our vision is to be an integrated and sustainable plantation player
with global recognition, promising premium quality products
For further information/queries, please email [email protected]
TH PLANTATIONS BERHAD
(Company No: 12696-M)