stability margin analysis of gas cooled reactor design models
TRANSCRIPT
Mathematical Theory and Modeling www.iiste.org
ISSN 2224-5804 (Paper) ISSN 2225-0522 (Online)
Vol.3, No.8, 2013
133
Stability Margin Analysis of Gas-Cooled Reactor Design Models
A.I. Oludare1, M.N. Agu2 and P.O. Akusu3 1Nigerian Defence Academy, Department of Physics, Kaduna
2 Nigeria Atomic Energy Commission, Abuja 3 Nigeria Atomic Energy Commission, Abuja and Ahmadu Bello University, A.B.U., Zaria, Nigeria
Abstract
To determined the safety margin of different Gas-Cooled Reactor Design, linear regression analysis is applied on three typical Gas-Cooled Nuclear Reactor design models, viz Gas-Cooled Reactor Design I (GCRD I), Gas-cooled Reactor Design II (GCRD II) and Gas-cooled Reactor Design III (GCRD III). Empirical expressions are obtained for GCRD I model, GCRD II model and GCRD III model. The results of the statistical analyses on these three types of nuclear reactor models reveal that the GCRD III promises to be most stable and therefore safer. The implication of this research effort to Nigeria’s nuclear power project is discussed. Keywords: Linear Regression Analysis, Gas-Cooled Reactor Design Models, Safety Margin, Safety Factor, Ỳ, Optimization, Stability Margin in Nuclear Power Reactor Design Models. Corresponding author: email: [email protected]
INTRODUCTION
Safety margin of operating reactors is defined as the difference or ratio in physical units between the limiting value of an assigned parameter the surpassing of which leads to the failure of a system or component, and the actual value of that parameter in the plant. The existence of such margins assures that nuclear power plants (NPPs) operate safely in all modes of operation and at all, and the unit of measurement is in per unit square (s-1). Reactor Stability is ability of a reactor to remain unchanged or to remain in operation over time under stated or reasonably expected conditions. Maintaining safety in the design and operation of nuclear power plants (NPPs) is a very important task under the conditions of a challenging environment, affected by the deregulated electricity market and implementation of risk informed regulations. Typically, safety margins are determined with use of computational tools for safety analysis [1]. A gas-cooled reactor (GCR) uses graphite as a neutron moderator, nitrogen, carbon dioxide, sodium, lead, hydrogen or helium as coolant. Although there are many other types of reactor cooled by gas, the terms GCR are particularly used to refer to this type of reactor. The design of a gas–cooled reactor such as Pebble Bed Modular Reactor (PBMR) is characterised by inherently safe features, which mean that no human error or equipment failure can cause an accident that would harm the public [2]. This type of reactor is claimed to be passively safe; that is, it removes the need for redundant, active safety systems [3]. Further literature review reveal that the design of PBMR’s uses helium gas as coolant and the design is not as complex as other gas-cooled reactors, it is found to be simple, the PBMR’s has lower power density, naturally safe fuel and would have no significant radiation release in accident unlike water-cooled reactors. The moderator used in these types of PBMR’s is Graphite which offers the advantage of being stable under conditions of high radiation as well as high temperature or pressure nor when the velocity of the coolant reduced to zero, these are great advantage over water- cooled reactors. The gas- cooled reactors are any more or less economic or reliable than the water-cooled reactors. Why because technology is evolving as in the case of PBMR’s. In safety studies of High Temperature Gas-Cooled Reactor (HTGR), a failure of a standpipe at the top of the reactor vessel or a fuel loading pipe may be one of the most critical design- base accidents. Once the pipe rupture accident occurs, helium blows up through the breach immediately [4]. A loss-of-coolant accident (LOCA) is a mode of failure for a nuclear reactor [5]. LOCAs have occurred in light water and heavy water reactors as well as gas cooled and liquid metal cooled ones. Experience have shown that while nuclear power plants operate under strict safety codes and emergency procedures, there is no way to fully protect them from natural disasters, terrorist attacks or mere human error. Therefore, a study of a loss-of-coolant accident (LOCA) is very significant in the design and operation of any nuclear power reactor, since there have been several report analysis on the safety of the GCR’s taking into account the specific design features of these reactors and loss-of-coolant accident in these reactors, these include ‘Accident analysis for nuclear power plants with modular High temperature gas cooled reactors’ [6], ‘Nuclear Plant Risk Studies: Failing the Grade’ and Overview Gas-cooled Reactor Problems’ [7], ‘Evaluation of system reliability with common-cause failures, by a pseudo-environments model’[8]. ‘Reliability and Safety Analysis Methodology in the Nuclear Programs[9], ‘nuclear power futures, costs and benefits’[10] and several reports analysis on the cost of failure on these GCR’s, this include; ‘A preliminary assessment of major energy accidents’[11]. Failure may be recognized by measures of risks which include performance, design fault, obsolete components,
Mathematical Theory and Modeling www.iiste.org
ISSN 2224-5804 (Paper) ISSN 2225-0522 (Online)
Vol.3, No.8, 2013
134
human errors and accident. These risks can be defined and quantified as the product of the probability of an occurrence of failure and a measure of the consequence of that failure. Since the objective of engineering is to design and build things to meet requirements, apart from cost implication, it is important to consider risk along with performance, and technology selections made during concept design. Engineering council guidance on risk for the engineering profession defined “Engineering Risk” as “the chance of incurring a loss or gain by investing in an engineering project” and defined ‘risk’ as the possibility of an adverse outcome [12]. Similar definitions are given by Modarres [13], Molak [14] and Blanchard [15], that risk is a measure of the potential loss occurred due to natural or human activities. In this work, Ordinary Least Square (OLS) methodology, which is largely used in nuclear industry for modeling safety, is employed. Some related previous works on the application of regression analysis technique include: ‘Investigation of Fundamental Thermal- Hydraulic Phenomena in Advanced Gas-Cooled Reactors’ [16], ‘Quantitative functional failure analysis of a thermal-hydraulic passive system by means of bootstrapped Artificial Neural Networks’[17],‘Fuel cycle studies on minor Actinide burning in gas cooled Fast reactors’[18], ‘Counter-current flow limitations during hot leg injection in Gas-cooled reactors with a multiple linear
regression model’[19] ‘Experimental study of a trickle-bed reactor operating at high pressure: two-phase pressure drop and liquid saturation using regression analyses techniques’[20],‘Posts about Gas-cooled
reactors’[21],‘Stochastic Modeling of Deterioration in Nuclear Power Plants Components’[22] and “Optimization of The Stability Margin for Nuclear Power Reactor Design Models Using Regression Analyses Techniques”[23]. This work provides a mathematical expression for predicting “Safety Factor”, Ỳ, (dependent variable) given the values of independent variables(coolant) or input parameters(coolant) for a typical Gas-cooled reactor design model. Furthermore, the mathematical expression can be used to determine the contribution of coolant flow rates (which is the independent variables) to the nuclear reactor stability, given the value of dependent variable. A comparative analysis of three Gas-Cooled Reactor Design Model via the use of RAT was carried out. THE RESEARCH OBJECTIVES:
To apply the linear regression technique on Gas-Cooled Reactors for the determination of their Safety Factor in terms of their coolant which in turn is a measure of the reactor’s stability and to carry out a comparative analysis of three different GCR design models.
RESEARCH DESIGN/APPROACH
Theory and experience has shown that, for nuclear power plants, coolants (which is gas in this case study) plays significant role in the safety of the reactor during operation in preventing reactor damage during accident. Hence, in this work, in assessment of some typical gas-cooled reactor designs, the input parameter considered is the coolant (which is the gas flow rate in the reactor during operation). The typical nuclear reactor designs are coded as GCRD I, GCRD II and GCRD III which stands for Gas-Cooled Reactor Design I, Gas-cooled Reactor Design II and Gas-cooled Reactor Design III. The data used are those for typical Gas-cooled reactor similar to: (a) Design Input Parameters Data Sheet of Twin Unit PBMR-Cogeneration of Nuclear Power Plant –
GCRD I (b) Design Input Parameters of the Massachusetts Institutes of Technology (MIT) PBR in USA, Chinese
PBMRs (HTR-10) and PBMR in South Africa – GCRD II. (c) Design Input Parameters of the MIT, Chinese PBMRs (HTR-10) and the PBM in South Africa – GCRD
III. With the input data of each of these different design models, a linear regression analysis technique is applied using, Number Cruncher Statistical Software (NCSS). The results give a model equation for each of the different design models which can be used to make prediction on the reactor stability. In Tables 1, 2 and 3, the values of design input parameters similar to those of the Twin Unit PBMR-Cogeneration plant, PBMR in South Africa, Chinese PBMRs (HTR-10) and the MIT PBMR in USA. The results obtained in form of model equations for each different design were analysed and used to determine the reactor stability.

Mathematical Theory and Modeling www.iiste.org
ISSN 2224-5804 (Paper) ISSN 2225-0522 (Online)
Vol.3, No.8, 2013
135
Table 1: Design Input Parameters of A Typical Gas-Cooled Reactor (GCR) Similar to Design Input Parameters Data Sheet of Twin Unit PBMR-Cogeneration of Nuclear Power Plant Nos. of trial (j) Safety factor Coolant (gas) flow rate in kg/s GCRD I
1 1.30 100 2 1.35 105 3 1.40 110 4 1.45 115 5 1.50 120 6 1.55 125 7 1.60 130 8 1.65 135 9 1.70 140 10 1.75 145 11 1.80 150 12 1.70 155 13 1.72 160
Source: [24]
Table 2: Design Input Parameters of A Typical Gas-cooled Reactor (GCR) Similar to MIT in USA, Chinese PBMRs (HTR-10) and PBR in South Africa Nos. of trial (j) Safety factor Coolant (gas) flow rate in kg/s GCRD II
1 1.30 100
2 1.35 105
3 1.40 110
4 1.45 115
5 1.50 120
6 1.55 125
7 1.60 130
8 1.65 135
9 1.71 140
10 1.73 145
11 1.75 150
12 1.77 155
13 1.79 160
Source: [25]
Mathematical Theory and Modeling www.iiste.org
ISSN 2224-5804 (Paper) ISSN 2225-0522 (Online)
Vol.3, No.8, 2013
136
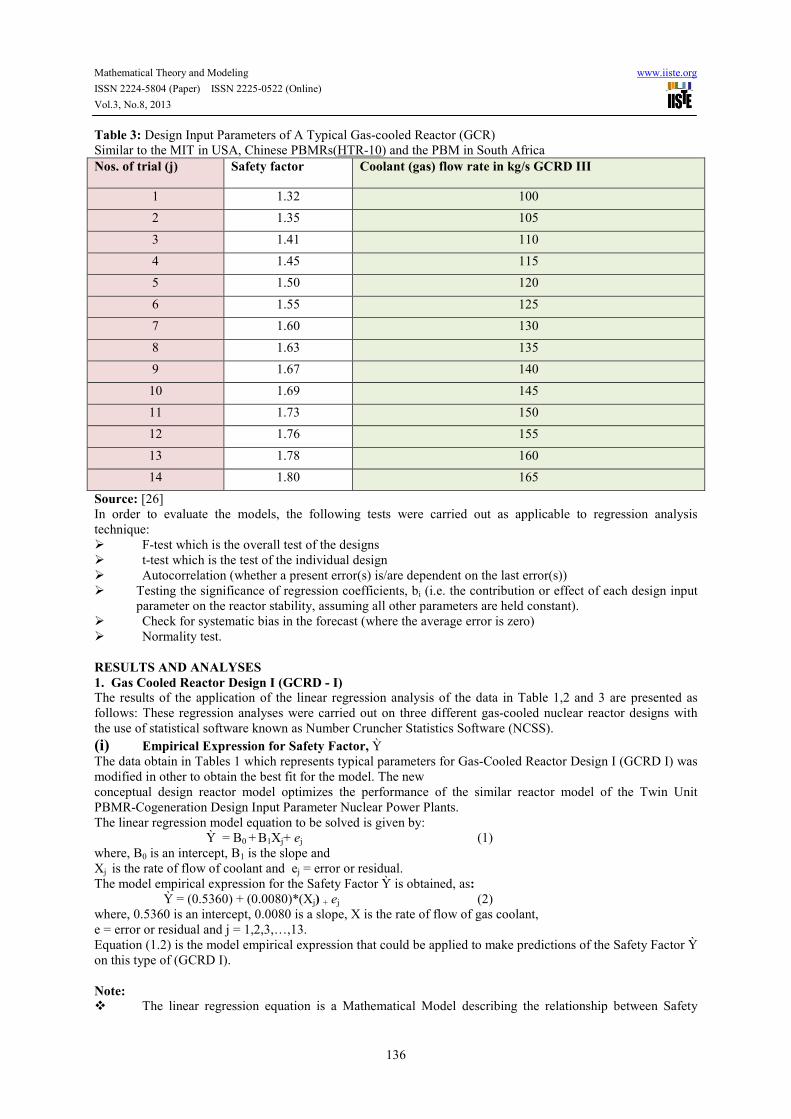
Table 3: Design Input Parameters of A Typical Gas-cooled Reactor (GCR) Similar to the MIT in USA, Chinese PBMRs(HTR-10) and the PBM in South Africa
Nos. of trial (j) Safety factor Coolant (gas) flow rate in kg/s GCRD III
1 1.32 100
2 1.35 105
3 1.41 110
4 1.45 115
5 1.50 120
6 1.55 125
7 1.60 130
8 1.63 135
9 1.67 140
10 1.69 145
11 1.73 150
12 1.76 155
13 1.78 160
14 1.80 165
Source: [26] In order to evaluate the models, the following tests were carried out as applicable to regression analysis technique: � F-test which is the overall test of the designs � t-test which is the test of the individual design � Autocorrelation (whether a present error(s) is/are dependent on the last error(s)) � Testing the significance of regression coefficients, bi (i.e. the contribution or effect of each design input
parameter on the reactor stability, assuming all other parameters are held constant). � Check for systematic bias in the forecast (where the average error is zero) � Normality test.
RESULTS AND ANALYSES
1. Gas Cooled Reactor Design I (GCRD - I)
The results of the application of the linear regression analysis of the data in Table 1,2 and 3 are presented as follows: These regression analyses were carried out on three different gas-cooled nuclear reactor designs with the use of statistical software known as Number Cruncher Statistics Software (NCSS). (i) Empirical Expression for Safety Factor, Ỳ The data obtain in Tables 1 which represents typical parameters for Gas-Cooled Reactor Design I (GCRD I) was modified in other to obtain the best fit for the model. The new conceptual design reactor model optimizes the performance of the similar reactor model of the Twin Unit PBMR-Cogeneration Design Input Parameter Nuclear Power Plants. The linear regression model equation to be solved is given by: Ỳ = B0 + B1Xj+ ej (1) where, B0 is an intercept, B1 is the slope and Xj is the rate of flow of coolant and ej = error or residual. The model empirical expression for the Safety Factor Ỳ is obtained, as: Ỳ = (0.5360) + (0.0080)*(Xj) + ej (2) where, 0.5360 is an intercept, 0.0080 is a slope, X is the rate of flow of gas coolant, e = error or residual and j = 1,2,3,…,13. Equation (1.2) is the model empirical expression that could be applied to make predictions of the Safety Factor Ỳ on this type of (GCRD I).
Note:
� The linear regression equation is a Mathematical Model describing the relationship between Safety
Mathematical Theory and Modeling www.iiste.org
ISSN 2224-5804 (Paper) ISSN 2225-0522 (Online)
Vol.3, No.8, 2013
137
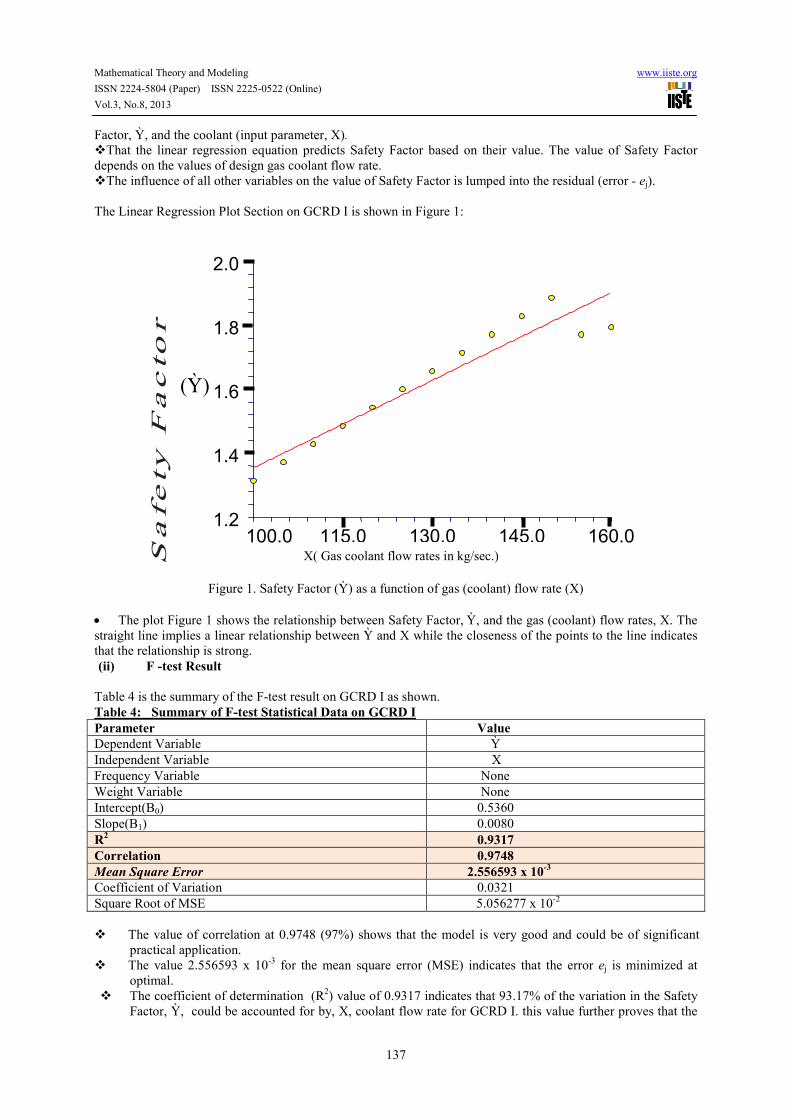
Factor, Ỳ, and the coolant (input parameter, X). � That the linear regression equation predicts Safety Factor based on their value. The value of Safety Factor depends on the values of design gas coolant flow rate. � The influence of all other variables on the value of Safety Factor is lumped into the residual (error - ej). The Linear Regression Plot Section on GCRD I is shown in Figure 1:
Sa
fe
ty F
ac
tor
Figure 1. Safety Factor (Ỳ) as a function of gas (coolant) flow rate (X) • The plot Figure 1 shows the relationship between Safety Factor, Ỳ, and the gas (coolant) flow rates, X. The straight line implies a linear relationship between Ỳ and X while the closeness of the points to the line indicates that the relationship is strong. (ii) F -test Result
Table 4 is the summary of the F-test result on GCRD I as shown. Table 4: Summary of F-test Statistical Data on GCRD I
Parameter Value
Dependent Variable Ỳ Independent Variable X Frequency Variable None Weight Variable None Intercept(B0) 0.5360 Slope(B1) 0.0080 R
2 0.9317
Correlation 0.9748
Mean Square Error 2.556593 x 10⁻³
Coefficient of Variation 0.0321 Square Root of MSE 5.056277 x 10⁻² � The value of correlation at 0.9748 (97%) shows that the model is very good and could be of significant
practical application. � The value 2.556593 x 10⁻³ for the mean square error (MSE) indicates that the error ej is minimized at
optimal. � The coefficient of determination (R2) value of 0.9317 indicates that 93.17% of the variation in the Safety
Factor, Ỳ, could be accounted for by, X, coolant flow rate for GCRD I. this value further proves that the
1.2
1.4
1.6
1.8
2.0
100.0 115.0 130.0 145.0 160.0
(Ỳ)
X( Gas coolant flow rates in kg/sec.)
Mathematical Theory and Modeling www.iiste.org
ISSN 2224-5804 (Paper) ISSN 2225-0522 (Online)
Vol.3, No.8, 2013
138
model is good;
2. Gas-Cooled Reactor Design II (GCRD II)
We also considered sample from Gas-cooled reactor (GCR) in GCRD II, by performing experiment on GCRD II taken input parameters from reactor Similar to the reactor model of the MIT in USA, Chinese PBMRs (HTR-10) and PBR in South Africa Design Input Parameter Nuclear Power Plants. The data was modified in other to obtain the best fit for the model. (i) Empirical Expression for Safety Factor, Ỳ
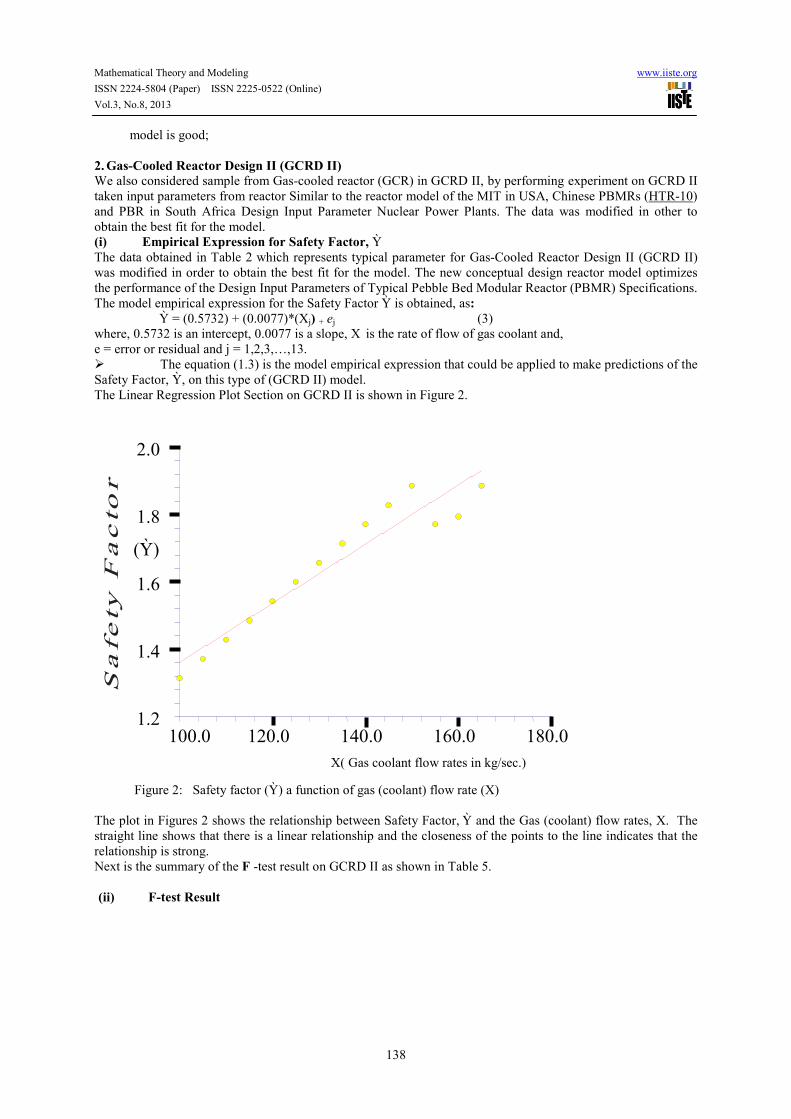
The data obtained in Table 2 which represents typical parameter for Gas-Cooled Reactor Design II (GCRD II) was modified in order to obtain the best fit for the model. The new conceptual design reactor model optimizes the performance of the Design Input Parameters of Typical Pebble Bed Modular Reactor (PBMR) Specifications. The model empirical expression for the Safety Factor Ỳ is obtained, as: Ỳ = (0.5732) + (0.0077)*(Xj) + ej (3) where, 0.5732 is an intercept, 0.0077 is a slope, X is the rate of flow of gas coolant and, e = error or residual and j = 1,2,3,…,13. � The equation (1.3) is the model empirical expression that could be applied to make predictions of the Safety Factor, Ỳ, on this type of (GCRD II) model. The Linear Regression Plot Section on GCRD II is shown in Figure 2.
Figure 2: Safety factor (Ỳ) a function of gas (coolant) flow rate (X) The plot in Figures 2 shows the relationship between Safety Factor, Ỳ and the Gas (coolant) flow rates, X. The straight line shows that there is a linear relationship and the closeness of the points to the line indicates that the relationship is strong. Next is the summary of the F -test result on GCRD II as shown in Table 5.
(ii) F-test Result
1.2
1.4
1.6
1.8
2.0
100.0 120.0 140.0 160.0 180.0
(Ỳ)
X( Gas coolant flow rates in kg/sec.)
Sa
fe
ty F
ac
tor
Mathematical Theory and Modeling www.iiste.org
ISSN 2224-5804 (Paper) ISSN 2225-0522 (Online)
Vol.3, No.8, 2013
139
The F-test result on GCRD II is shown in Table 5 Table 5: Summary of F-test Statistical Data on GCRD II
Parameter Value
Dependent Variable Ỳ Independent Variable X Frequency Variable None Weight Variable None Intercept (B0) 0.5732 Slope (B1) 0.0077 R
2 0.9571
Correlation 0.9877
Mean Square Error 2.525604 x 10⁻³
Coefficient of Variation 0.2109 Square Root of MSE 5.025539 x 10⁻²
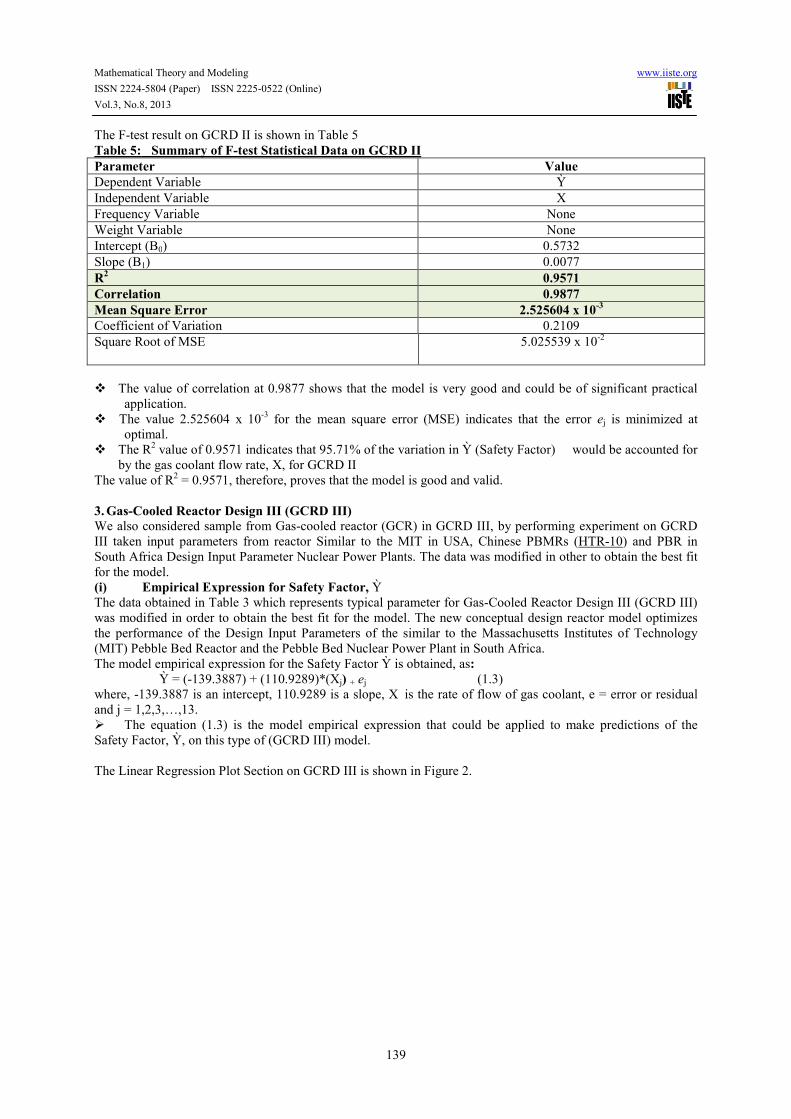
� The value of correlation at 0.9877 shows that the model is very good and could be of significant practical
application. � The value 2.525604 x 10⁻³ for the mean square error (MSE) indicates that the error ej is minimized at
optimal. � The R2 value of 0.9571 indicates that 95.71% of the variation in Ỳ (Safety Factor) would be accounted for
by the gas coolant flow rate, X, for GCRD II The value of R2 = 0.9571, therefore, proves that the model is good and valid.
3. Gas-Cooled Reactor Design III (GCRD III)
We also considered sample from Gas-cooled reactor (GCR) in GCRD III, by performing experiment on GCRD III taken input parameters from reactor Similar to the MIT in USA, Chinese PBMRs (HTR-10) and PBR in South Africa Design Input Parameter Nuclear Power Plants. The data was modified in other to obtain the best fit for the model. (i) Empirical Expression for Safety Factor, Ỳ
The data obtained in Table 3 which represents typical parameter for Gas-Cooled Reactor Design III (GCRD III) was modified in order to obtain the best fit for the model. The new conceptual design reactor model optimizes the performance of the Design Input Parameters of the similar to the Massachusetts Institutes of Technology (MIT) Pebble Bed Reactor and the Pebble Bed Nuclear Power Plant in South Africa. The model empirical expression for the Safety Factor Ỳ is obtained, as: Ỳ = (-139.3887) + (110.9289)*(Xj) + ej (1.3) where, -139.3887 is an intercept, 110.9289 is a slope, X is the rate of flow of gas coolant, e = error or residual and j = 1,2,3,…,13. � The equation (1.3) is the model empirical expression that could be applied to make predictions of the Safety Factor, Ỳ, on this type of (GCRD III) model. The Linear Regression Plot Section on GCRD III is shown in Figure 2.
Mathematical Theory and Modeling www.iiste.org
ISSN 2224-5804 (Paper) ISSN 2225-0522 (Online)
Vol.3, No.8, 2013
140
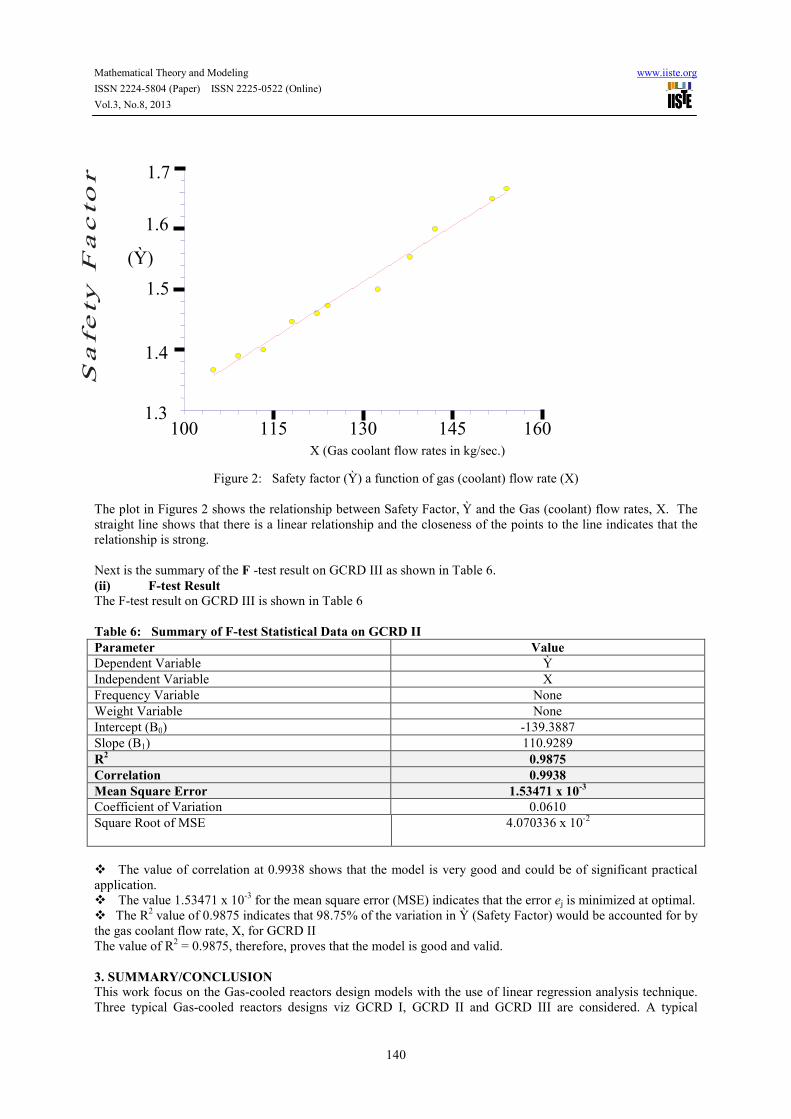
Figure 2: Safety factor (Ỳ) a function of gas (coolant) flow rate (X)
The plot in Figures 2 shows the relationship between Safety Factor, Ỳ and the Gas (coolant) flow rates, X. The straight line shows that there is a linear relationship and the closeness of the points to the line indicates that the relationship is strong. Next is the summary of the F -test result on GCRD III as shown in Table 6. (ii) F-test Result
The F-test result on GCRD III is shown in Table 6
Table 6: Summary of F-test Statistical Data on GCRD II
Parameter Value
Dependent Variable Ỳ Independent Variable X Frequency Variable None Weight Variable None Intercept (B0) -139.3887 Slope (B1) 110.9289 R
2 0.9875
Correlation 0.9938
Mean Square Error 1.53471 x 10⁻³
Coefficient of Variation 0.0610 Square Root of MSE 4.070336 x 10⁻²
� The value of correlation at 0.9938 shows that the model is very good and could be of significant practical application. � The value 1.53471 x 10⁻³ for the mean square error (MSE) indicates that the error ej is minimized at optimal. � The R2 value of 0.9875 indicates that 98.75% of the variation in Ỳ (Safety Factor) would be accounted for by the gas coolant flow rate, X, for GCRD II The value of R2 = 0.9875, therefore, proves that the model is good and valid.
3. SUMMARY/CONCLUSION
This work focus on the Gas-cooled reactors design models with the use of linear regression analysis technique. Three typical Gas-cooled reactors designs viz GCRD I, GCRD II and GCRD III are considered. A typical
1.3
100 115 130 145 160
1.4
1.5
1.6
1.7
(Ỳ)
X (Gas coolant flow rates in kg/sec.)
Sa
fe
ty F
ac
tor
Mathematical Theory and Modeling
ISSN 2224-5804 (Paper) ISSN 2225-0522 (Online)
Vol.3, No.8, 2013
example of GCRD I is to the reactor model Nuclear Plants secondly, the MIT PBMR in typical of GCRD II and thirdly the MIT PBtypical examples of GCRD III. The empirical expressions for the optimization of nuclear reactor Safety Factor (rate for “Gas-Cooled nuclear reactor design models” (GCNRDM) are obtained as(i) Ỳ = (0.5360) + (0.0080)*(X(ii) Ỳ = (0.5732) + (0.0077)*(X(iii) Ỳ = (-139.3887) + (110.9289)*(X These are the model equations that could be applied to make predictions of the safety factor, Gas-cooled reactor design models. The empirical expressions may also be used for the calculation of the Safety Factor of the reactorsis a measure of the reactor’s stability.The t-test carried out on these model equations gives a promising level of acceptability or validity. Also, the empirical formulae derived can be used to determine the contribution of coolant to the sThe Table 7 highlights the summary results on coolant effects on gas reactors.Table 7. Summary Results on Coolant Effects on Gas ReactorsTypes of Nuclear Power
Reactor Design Model
Gas Coolant Reactors
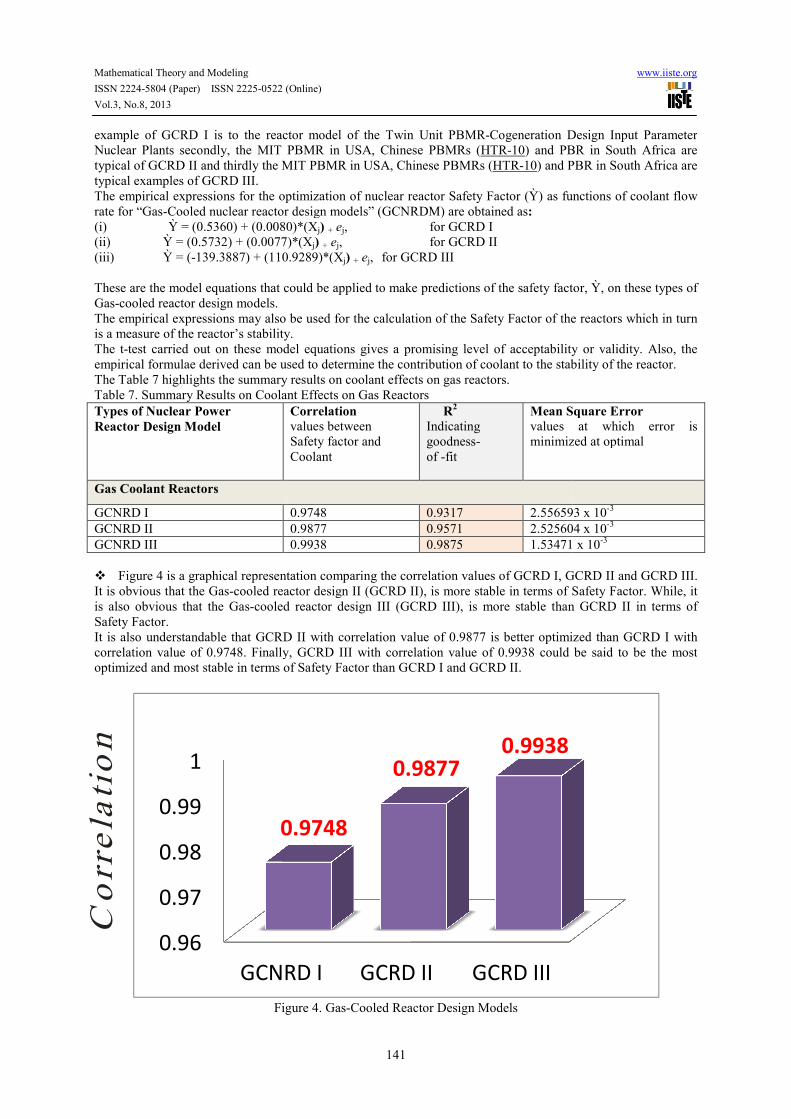
GCNRD I GCNRD II GCNRD III � Figure 4 is a graphical representation comparing the correlation values of GCRD I, GCRD II and GCRD III. It is obvious that the Gas-cooled reactor design II (GCRD II), is more stable in terms of Safety Factor. While, it is also obvious that the Gas-cooled Safety Factor. It is also understandable that GCRD II with correlation value of correlation value of 0.9748. Finally, GCRD III with correlatioptimized and most stable in terms of Safety Factor than GCRD I and GCRD II.
Figure 4. Gas
0.96
0.97
0.98
0.99
1
GCNRD I
0.9748
Co
rre
lati
on
nd Modeling
0522 (Online)
141
reactor model of the Twin Unit PBMR-Cogeneration Design Input ParameterNuclear Plants secondly, the MIT PBMR in USA, Chinese PBMRs (HTR-10) and PBR in South Africa are
MIT PBMR in USA, Chinese PBMRs (HTR-10) and PBR in South Africa are
The empirical expressions for the optimization of nuclear reactor Safety Factor (Ỳ) as functions of cCooled nuclear reactor design models” (GCNRDM) are obtained as:
= (0.5360) + (0.0080)*(Xj) + ej, for GCRD I = (0.5732) + (0.0077)*(Xj) + ej, for GCRD II
139.3887) + (110.9289)*(Xj) + ej, for GCRD III
These are the model equations that could be applied to make predictions of the safety factor,
The empirical expressions may also be used for the calculation of the Safety Factor of the reactorsis a measure of the reactor’s stability.
test carried out on these model equations gives a promising level of acceptability or validity. Also, the empirical formulae derived can be used to determine the contribution of coolant to the stability of the reactor. The Table 7 highlights the summary results on coolant effects on gas reactors. Table 7. Summary Results on Coolant Effects on Gas Reactors
Correlation values between Safety factor and Coolant
R2
Indicating goodness- of -fit
Mean Square Error
values at which error is minimized at optimal
0.9748 0.9317 2.556593 x 100.9877 0.9571 2.525604 x 100.9938 0.9875 1.53471 x 10
Figure 4 is a graphical representation comparing the correlation values of GCRD I, GCRD II and GCRD III. cooled reactor design II (GCRD II), is more stable in terms of Safety Factor. While, it
cooled reactor design III (GCRD III), is more stable than GCRD II in terms of
It is also understandable that GCRD II with correlation value of 0.9877 is better optimized than GCRD I with . Finally, GCRD III with correlation value of 0.9938 could be said to be the most
optimized and most stable in terms of Safety Factor than GCRD I and GCRD II.
Figure 4. Gas-Cooled Reactor Design Models
GCNRD I GCRD II GCRD III
0.9748
0.9877
0.9938
www.iiste.org
Cogeneration Design Input Parameter PBR in South Africa are
PBR in South Africa are
as functions of coolant flow
These are the model equations that could be applied to make predictions of the safety factor, Ỳ, on these types of
The empirical expressions may also be used for the calculation of the Safety Factor of the reactors which in turn
test carried out on these model equations gives a promising level of acceptability or validity. Also, the tability of the reactor.
Mean Square Error
values at which error is minimized at optimal
2.556593 x 10⁻³ 2.525604 x 10⁻³ 1.53471 x 10⁻³
Figure 4 is a graphical representation comparing the correlation values of GCRD I, GCRD II and GCRD III. cooled reactor design II (GCRD II), is more stable in terms of Safety Factor. While, it
reactor design III (GCRD III), is more stable than GCRD II in terms of
is better optimized than GCRD I with 0.9938 could be said to be the most
Mathematical Theory and Modeling
ISSN 2224-5804 (Paper) ISSN 2225-0522 (Online)
Vol.3, No.8, 2013
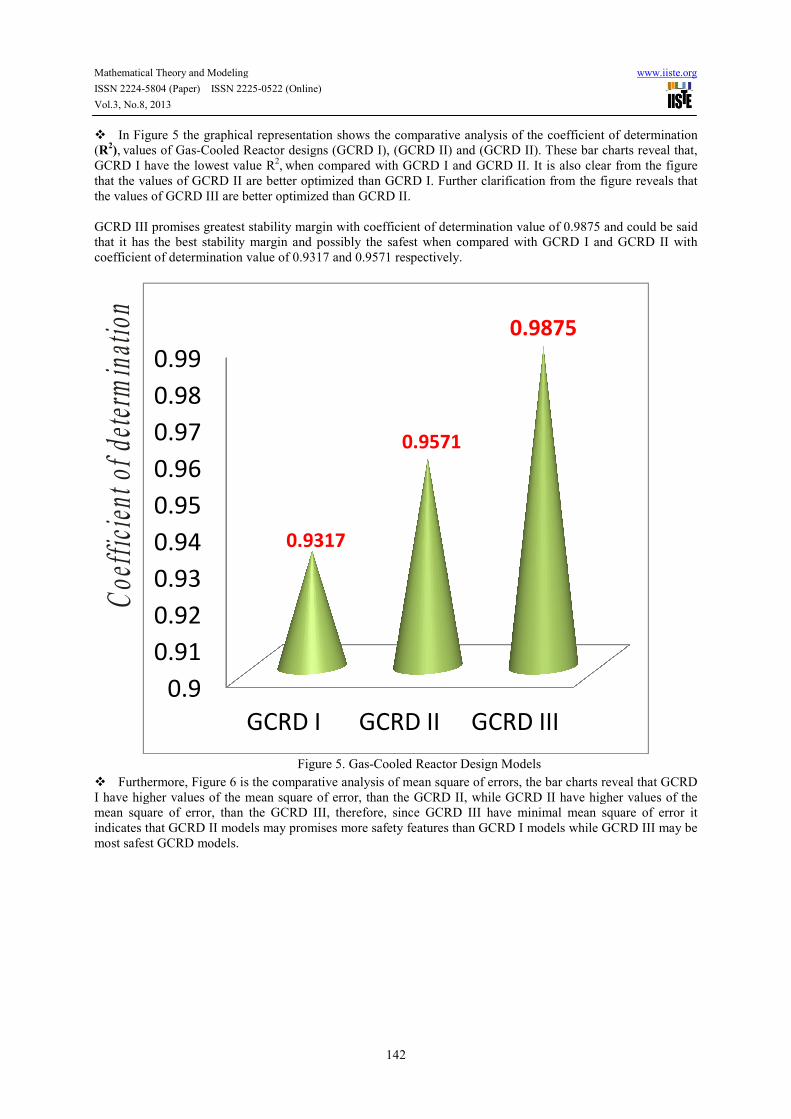
� In Figure 5 the graphical representation shows (R2
), values of Gas-Cooled Reactor designs (GCRD I), (GCRD II) and (GCRD II). These bar charts reveal that, GCRD I have the lowest value R2, when compared with GCRD I and GCRD II. It is also cleathat the values of GCRD II are better optimized than GCRD I. Further clarification from the figure reveals that the values of GCRD III are better optimized than GCRD II. GCRD III promises greatest stability margin with coefficient of dthat it has the best stability margin and possibly the safest when compared with GCRD I and GCRD II with coefficient of determination value of
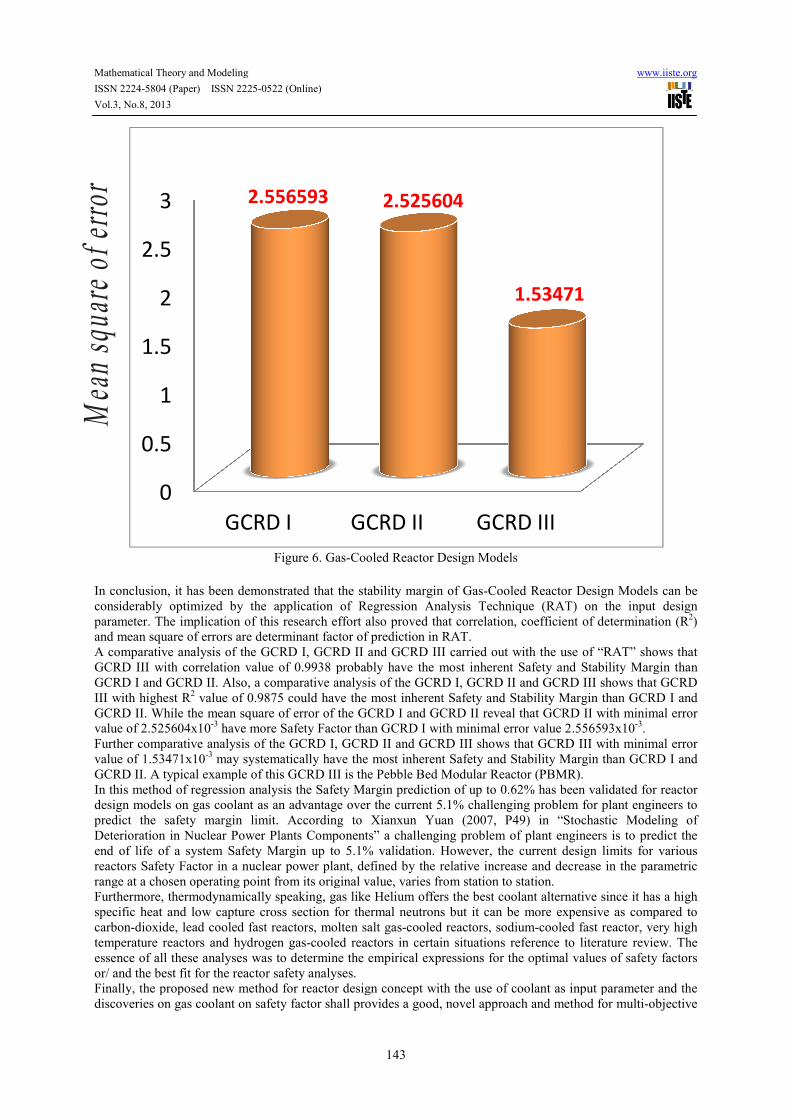
� Furthermore, Figure 6 is the comparative analysis of mean square of errors, the bar charts reveal that GCRD I have higher values of the mean square of error, than the GCRD II, while GCRD II have higher values of the mean square of error, than the GCRD III, therefore,indicates that GCRD II models may promises more safety features than GCRD I models while GCRD III may be most safest GCRD models.
0.9
0.91
0.92
0.93
0.94
0.95
0.96
0.97
0.98
0.99
GCRD I
Coef
ficie
nt o
f det
erm
inat
ion
nd Modeling
0522 (Online)
142
In Figure 5 the graphical representation shows the comparative analysis of the coefficient of determination Cooled Reactor designs (GCRD I), (GCRD II) and (GCRD II). These bar charts reveal that,
when compared with GCRD I and GCRD II. It is also cleathat the values of GCRD II are better optimized than GCRD I. Further clarification from the figure reveals that the values of GCRD III are better optimized than GCRD II.
GCRD III promises greatest stability margin with coefficient of determination value of 0.that it has the best stability margin and possibly the safest when compared with GCRD I and GCRD II with coefficient of determination value of 0.9317 and 0.9571 respectively.
Figure 5. Gas-Cooled Reactor Design Models , Figure 6 is the comparative analysis of mean square of errors, the bar charts reveal that GCRD
I have higher values of the mean square of error, than the GCRD II, while GCRD II have higher values of the mean square of error, than the GCRD III, therefore, since GCRD III have minimal mean square of error it indicates that GCRD II models may promises more safety features than GCRD I models while GCRD III may be
GCRD I GCRD II GCRD III
0.9317
0.9571
0.9875
www.iiste.org
the comparative analysis of the coefficient of determination Cooled Reactor designs (GCRD I), (GCRD II) and (GCRD II). These bar charts reveal that,
when compared with GCRD I and GCRD II. It is also clear from the figure that the values of GCRD II are better optimized than GCRD I. Further clarification from the figure reveals that
0.9875 and could be said that it has the best stability margin and possibly the safest when compared with GCRD I and GCRD II with
, Figure 6 is the comparative analysis of mean square of errors, the bar charts reveal that GCRD I have higher values of the mean square of error, than the GCRD II, while GCRD II have higher values of the
since GCRD III have minimal mean square of error it indicates that GCRD II models may promises more safety features than GCRD I models while GCRD III may be
0.9875
Mathematical Theory and Modeling
ISSN 2224-5804 (Paper) ISSN 2225-0522 (Online)
Vol.3, No.8, 2013
Figure 6. Gas In conclusion, it has been demonstrated that the stability margin of Gasconsiderably optimized by the application of Regression Analysis Technique (RAT) on the input design parameter. The implication of this research effort also proved that correlation, coefficient of determination (Rand mean square of errors are determinant factor of prediction in RAT. A comparative analysis of the GCRD I, GCRD II and GCRD III carried out with the use of “RATGCRD III with correlation value of GCRD I and GCRD II. Also, a comparative analysis of the GCRD I, GCRD II and GCRD III shows that GCRD III with highest R2 value of 0.9875 GCRD II. While the mean square of error of the GCRD I and GCRD II reveal that GCRD II with minimal error value of 2.525604x10⁻³ have more Safety Factor than GCRD I with minimal errorFurther comparative analysis of the GCRD I, GCRD II and GCRD III shows that GCRD III with minimal error value of 1.53471x10⁻³ may systematically have the most inherent Safety and Stability Margin than GCRD I and GCRD II. A typical example of this GCRD III is the Pebble Bed Modular Reactor (PBMR).In this method of regression analysis the Safety Margin prediction of up to 0.62% has been validated for reactor design models on gas coolant as an advantage over the current 5.1% challengingpredict the safety margin limit. Deterioration in Nuclear Power Plants Components” a challenging problem of plant engineers is to predict the end of life of a system Safety Margin up to 5.1% validationreactors Safety Factor in a nuclear power plant, defined by the relative increase and decrease in the parametric range at a chosen operating point from its original Furthermore, thermodynamically speaking, gas like Helium offers the best coolant alternative since it has a high specific heat and low capture cross section for thermal neutrons but it can be more expensive as comparecarbon-dioxide, lead cooled fast reactortemperature reactors and hydrogen gasessence of all these analyses was to or/ and the best fit for the reactor safety analyses.Finally, the proposed new method for reactor dediscoveries on gas coolant on safety factor shall provides a good, novel approach and method for multi
0
0.5
1
1.5
2
2.5
3
GCRD I
2.556593
Mea
n sq
uare
of e
rror
nd Modeling
0522 (Online)
143
Figure 6. Gas-Cooled Reactor Design Models
In conclusion, it has been demonstrated that the stability margin of Gas-Cooled Reactor Design Models can be considerably optimized by the application of Regression Analysis Technique (RAT) on the input design
tion of this research effort also proved that correlation, coefficient of determination (Rand mean square of errors are determinant factor of prediction in RAT. A comparative analysis of the GCRD I, GCRD II and GCRD III carried out with the use of “RATGCRD III with correlation value of 0.9938 probably have the most inherent Safety and Stability Margin than
a comparative analysis of the GCRD I, GCRD II and GCRD III shows that GCRD could have the most inherent Safety and Stability Margin than GCRD I and
While the mean square of error of the GCRD I and GCRD II reveal that GCRD II with minimal error have more Safety Factor than GCRD I with minimal error value 2.556593x10
Further comparative analysis of the GCRD I, GCRD II and GCRD III shows that GCRD III with minimal error may systematically have the most inherent Safety and Stability Margin than GCRD I and ample of this GCRD III is the Pebble Bed Modular Reactor (PBMR).
In this method of regression analysis the Safety Margin prediction of up to 0.62% has been validated for reactor design models on gas coolant as an advantage over the current 5.1% challenging problem for predict the safety margin limit. According to Xianxun Yuan (2007, P49) in “Stochastic Modeling of Deterioration in Nuclear Power Plants Components” a challenging problem of plant engineers is to predict the
system Safety Margin up to 5.1% validation. However, the current design limits for various reactors Safety Factor in a nuclear power plant, defined by the relative increase and decrease in the parametric range at a chosen operating point from its original value, varies from station to station. Furthermore, thermodynamically speaking, gas like Helium offers the best coolant alternative since it has a high specific heat and low capture cross section for thermal neutrons but it can be more expensive as compare
lead cooled fast reactors, molten salt gas-cooled reactors, sodium-cooled fast reactors and hydrogen gas-cooled reactors in certain situations reference to literature review. The
essence of all these analyses was to determine the empirical expressions for the optimal values of safety factors or/ and the best fit for the reactor safety analyses. Finally, the proposed new method for reactor design concept with the use of coolant as input parameter and the
gas coolant on safety factor shall provides a good, novel approach and method for multi
GCRD I GCRD II GCRD III
2.556593 2.525604
1.53471
www.iiste.org
Cooled Reactor Design Models can be considerably optimized by the application of Regression Analysis Technique (RAT) on the input design
tion of this research effort also proved that correlation, coefficient of determination (R2)
A comparative analysis of the GCRD I, GCRD II and GCRD III carried out with the use of “RAT” shows that probably have the most inherent Safety and Stability Margin than
a comparative analysis of the GCRD I, GCRD II and GCRD III shows that GCRD could have the most inherent Safety and Stability Margin than GCRD I and
While the mean square of error of the GCRD I and GCRD II reveal that GCRD II with minimal error 2.556593x10⁻³.
Further comparative analysis of the GCRD I, GCRD II and GCRD III shows that GCRD III with minimal error may systematically have the most inherent Safety and Stability Margin than GCRD I and ample of this GCRD III is the Pebble Bed Modular Reactor (PBMR).
In this method of regression analysis the Safety Margin prediction of up to 0.62% has been validated for reactor problem for plant engineers to in “Stochastic Modeling of
Deterioration in Nuclear Power Plants Components” a challenging problem of plant engineers is to predict the . However, the current design limits for various
reactors Safety Factor in a nuclear power plant, defined by the relative increase and decrease in the parametric
Furthermore, thermodynamically speaking, gas like Helium offers the best coolant alternative since it has a high specific heat and low capture cross section for thermal neutrons but it can be more expensive as compared to
cooled fast reactor, very high cooled reactors in certain situations reference to literature review. The
determine the empirical expressions for the optimal values of safety factors
sign concept with the use of coolant as input parameter and the gas coolant on safety factor shall provides a good, novel approach and method for multi-objective
1.53471
Mathematical Theory and Modeling www.iiste.org
ISSN 2224-5804 (Paper) ISSN 2225-0522 (Online)
Vol.3, No.8, 2013
144
decision-making based on six dissimilar objectives attributes: evolving technology, effectiveness, efficiency, cost, safety and failure. It is therefore suggested that for countries wishing to include nuclear energy for the generation of electricity, like Nigeria, the parameters of the selected nuclear reactor should undergo analysis via RAT for optimization and choice.
Acknowledgments
We thank Nigeria Atomic Energy Commission (NAEC) Abuja and Department of physics Nigerian Defence Academy (NDA) Kaduna for human and the material support during the research work.
References
[1] International Atomic Energy Agency (IAEA) 2003, Safety margins of operating reactors Analysis of uncertainties and implications for decision making, published by Safety Assessment Section International Atomic Energy Agency Wagramer Strasse 5 P.O. Box 100 A-1400 Vienna, Austria. [2] http://www.world-nuclear-news.org/NN-PBMR_postponed-1109092.html World Nuclear News 11 September 2009 [3] Steve Thomas (1 April 2009). "PBMR: hot or not?". Nuclear Engineering International. Retrieved 2009-04-02. [4] IAEA, VIENNA, 2000 IAEA – TECDOC – 1163, Heat Transport and Afterheat Removal for Gas Cooled Reactors Under Accident Conditions. The originating Section of this publication in the IAEA was: Nuclear Power Technology Development Section International Atomic Energy Agency Wagramerstrasse 5 P.O. Box 100 A-1400 Vienna, Austria [5] IAEA Technical Committee Meeting on “Gas Turbine Power Conversion Systems for Modular HTGRs”, held from 14–16 November 2000 in Palo Alto, California. International Atomic Energy Agency, Vienna (Austria). Technical Working Group on Gas-Cooled Reactors. [6] IAEA safety reports series No. 54 2008, Accident analysis for nuclear power plants with modular High temperature gas cooled reactors. Published by International atomic energy agency Vienna, 2008. [7] David Lochbaum 2000, ‘Nuclear Plant Risk Studies: Failing the Grade’ and Overview: Gas-cooled Reactor Problems 2013, ‘Nuclear Power’ Published in Union of Concerned Scientists Citizen and Scientists for Environmental Solutions and National Headquarters 2 Brattle Square, Cambridge, MA 02138-3780 UK. http://www.ucsusa.org/nuclear_power/nuclear_power_technology/overview-pressurized-gas.html [8] Yuan, J.; Lai, M.-T.; Ko, K.-L. "Evaluation of system reliability with common-cause failures, by a pseudo-environments model", Reliability, IEEE Transactions on, On page(s): 328 - 332 Volume: 38, Issue: 3, Aug 1989. [9] Hannum, W.H.; Gavigan, F.X.; Emon, D.E. "Reliability and Safety Analysis Methodology in the Nuclear Programs of ERDA", IEEE Transactions on Reliability, Volume.r-25, Issue.3, pp.140, 1976, ISSN: 00189529. [10] Nigel Evans, Chris Hope (1994), NUCLEAR POWER futures, costs and benefits published by press syndicate Cambridge University press 1994, the Pitt building Trumpingtong street Cambridge CB2 1RP 32 East 57th Street, New York NY 10022 USA. http://books.google.com.ng [11] Benjamin K. Sovacool 2008, The costs of failure: A preliminary assessment of major energy accidents, 1907–2007. Published by Energy Policy Volume 36, Issue 5, May 2008, Pages 1802–1820. Energy Governance Program, Centre on Asia and Globalisation, Lee Kuan Yew School of Public Policy, National University of Singapore, Singapore. http://www.sciencedirect.com/science/article/pii/S0301421508000529 [12] Guidance on Risk for the Engineering Profession Published March 2011. www.engc.org.uk/risk. [13] M. Modarres 2010. Risk Assessment Approaches to Managing Weather Extremes in Energy Systems Events 19-23 April 2010 in Vulnera ICTP-IAEA Workshop. [14] V. Molak 1997. Fundamentals of Risk AC press, Lewis Publishers, Boca Raton. [15] B.S. Blanchard, 1998. System Engineering Management, John Wiley & Sons, New York. [16] Donald M. McEligot, Glenn E. McCreery, Richard R. Schultz, Jeongik Lee, Pavel Hejzlar, Peter Stahle and Pradip Saha (2006), Investigation of Fundamental Thermal- Hydraulic Phenomena in Advanced Gas-Cooled Reactors. Published by Idaho National Laboratory (INL) a U.S. Department of Energy National Laboratory operated by Battelle Energy Alliance INL/EXT-06-11801MIT-GFR-042, September, 2006. [17] E. Zio, G. E. Apostolakis, N. Pedroni (2010), Quantitative functional failure analysis of a thermal-hydraulic passive system by means of bootstrapped Artificial Neural Networks. Published by Annals of Nuclear Energy 37, 5 (2010) 639-649" DOI: 10.1016/j.anucene.2010.02.012 [18] Mate szieberth, mate halasz, sandor feher, tibor reiss (2013), Fuel cycle studies on minor Actinide burning in gas cooled Fast reactors. Published by Budapest University of Technology and Economics (BME) Institute of Nuclear Techniques (NTI) Budapest, Hungary March 2013. [19] M. Gargallo, T. Schulenberg, L.Meyer, E. Laurien 2005, Counter-current flow limitations during hot leg
Mathematical Theory and Modeling www.iiste.org
ISSN 2224-5804 (Paper) ISSN 2225-0522 (Online)
Vol.3, No.8, 2013
145
injection in Gas-cooled reactors with a multiple linear regression model, published by Nuclear Engineering and Design 235 (2005) 785–804 Karlsruhe, Germany. University of Stuttgart, Institute for Nuclear Technology and Energy Systems (IKE) Pfaffenwaldring 31, D-70569 Stuttgart, Germany. Website: www.sciencedirect.com [20] F. Larachi, A. Laurent, N. Midoux, G. Wild (1991), Experimental study of a trickle-bed reactor operating at high pressure: two-phase pressure drop and liquid saturation using regression analyses techniques. Published by Chemical Engineering Science Volume 46, Issues 5–6, 1991, Pages 1233–1246, rue Grandville, 54001 Nancy cédex, France. [21] Posts about Gas-cooled reactors written by Eco-Perspectives data with Komanoff, 2010, reanalyzed using linear regression analysis. News of the French Nuclear Industry January 22, 2010. Website www. francenuc.wordpress.com/tag/pressurized-gas-reactors/
[22] X. Yuan, 2007. ‘Stochastic Modeling of Deterioration in Nuclear Power Plants Components’. A thesis presented to the University of Waterloo in fulfillment of the thesis requirement for the degree of Doctor of Philosophy in Civil Engineering Waterloo, Ontario, Canada, 2007. [23] Oludare, Agu and Akusu [2013]. Optimization of the Stability Margin for Nuclear Power Reactor Design Models Using Regression Analyses Techniques”, Journal of Nuclear and Particle Physics 2013, 3(3): 29-35 DOI: 10.5923/j.jnpp.20130303.01. [24] International Atomic Energy Agency (IAEA) 2011, Status Report for Advanced Nuclear Reactor Designs - Report 70, Published 10th August, 2011 [25] Argonne National Laboratory July, 14, 2004 [26] Argonne National Laboratory July, 14, 2004
This academic article was published by The International Institute for Science,
Technology and Education (IISTE). The IISTE is a pioneer in the Open Access
Publishing service based in the U.S. and Europe. The aim of the institute is
Accelerating Global Knowledge Sharing.
More information about the publisher can be found in the IISTE’s homepage:
http://www.iiste.org
CALL FOR PAPERS
The IISTE is currently hosting more than 30 peer-reviewed academic journals and
collaborating with academic institutions around the world. There’s no deadline for
submission. Prospective authors of IISTE journals can find the submission
instruction on the following page: http://www.iiste.org/Journals/
The IISTE editorial team promises to the review and publish all the qualified
submissions in a fast manner. All the journals articles are available online to the
readers all over the world without financial, legal, or technical barriers other than
those inseparable from gaining access to the internet itself. Printed version of the
journals is also available upon request of readers and authors.
IISTE Knowledge Sharing Partners
EBSCO, Index Copernicus, Ulrich's Periodicals Directory, JournalTOCS, PKP Open
Archives Harvester, Bielefeld Academic Search Engine, Elektronische
Zeitschriftenbibliothek EZB, Open J-Gate, OCLC WorldCat, Universe Digtial
Library , NewJour, Google Scholar