stability of an embankment on - dspace@mit home
TRANSCRIPT
~'r"'o."-~
STABILITY OF AN EMBANKMENT ON
A PARTIALLY CONSOLIDATED FOUNDATI01~ - It~TERSTATE 95
by
FRANCISCO §ILVA - TULLABS, Universi~y of Illinois
(1971)
Submitted in partial fulfillment
of the requirements for the degree of
Master of Science in Civil Engineering
at the
Massachusetts Institute of TechnologyFebruary, 1975
Signature of Author .... •• ,. •• •-. -•• ;-;-;~. rr"• •• .-.-~ ---;-.~ •• :- ~-; .•••••••Dep~rtment of Civil Engineering,22 January 1975
Certified by ••••••••-••••••• ~ •• .,.r.- ....... e ••• ~,..........••••••••••••••••••
Thesis Supervisor
Accepted by •••••••• .".. T • .. •-r; •• ~ • r ~':"""':' •r. . .. . .Chairman, Departmental Cornrnitt~ on Graduate Students of theDepartment of Civil Engineering
ABSTRACT
STABILITY OF AN EMBANKMENTON A PARTIALLY CONSOLIDATED
FOUNDATION - INTERSTATE 95
by
FRANCISCO SILVA-TULLA
-2-
Submitted to the Department of Civil Engineering on 22 January1975 in partial fulfillment of the requirements for the degreeof Master of Science in Civil Engineering.
A test fill was built on a section of the I-95 embankment north of Boston in an effort to resolve the uncertaintiesinvolved in selecting strength parameters of Boston Blue Clay.for stability analyses. Predictions of the fill elevation tocause failure, made before the field test began, are basedon Unconfined Compression, Unconsolidated Undrained triaxial,field vane and SHANSEF (Stress History and Normalized Soil Engineering Properties) undrained strength. The Simplified Bishopand the Morgenstern-Price procedures of stability analyses areutilized for the predictions which are compared with the actualfield test results.
The test fill failed at an elevation of +56.5 feet,after placing 18.7 feet of additional fill on an embankmentwhich had been in place for five years. The field instrumentation was not as successful in warning against impending failureas was expected. The only consistent but very conservativesign of instability was provided by the settlement plates. Theuncorrected field vane and SHANSEP yielded the most accuratepredictions. The field vane prea.iction was 52.5 feet (7.1%underestimate) and the SF~NSEP prediction was 60.7 feet 17.4%overestimate). The UC and UU strength were much too low, underestimating the failure elevation by 33%.
Thesis Supervisor: T. William Lambe
'ritle: Edmund K. Turner Professor of Civi-l Engineering

-3-
ACKNOWLEDGEMENT
The Author wishes to thank the following persons
and organizations:
- Professor T. William Lambe and Dr. W. Allen
Marr, my thesis supervisors, for thei~ interest
and guidance in my professional development.
- Professor Charles C. Ladd for his assistance
dttring the preparation of the prerlictions.
- Tlle Massachus etts Departrnen t of Public Works
ano the Department of Transportation, sponsors
of the 1-95 research project that supported my
studies.
- All the members of the 1-95 test fill project
team who worked in the field and in the laboratory
collecting the d~ta that made this thesis possible.
I am specially grateful to my wife, Arlyn, for her
patience and invaluable support'during my graduate work.

•
1.
TABLE OF CONTENTS
Title Page
Abstract
Acknowledgement
Table of Contents
List of Tables
I~ist of Figures
List of Symbols
Introduction
-4-
2
3
4
7
8
10
12
1.1 The Failure at the 1-95 Test Embankment 12
1.2 Background Information on the 1-95 14Research Project
1.3 Outline of Present Investigation 15
2 • Stability Analyses of the 1-95 Test Section 20
2.1 Subsurface Conditions and Soil Properties 20
2.1.1 Geologic History of the A.rea
2.1.2 Soil Properties
20
21
2.2 Methods of Stability Analyses Utilized 23
2.2.1 Simplified Bishop Method 23.
2.2.2 Morgenstern and Price's Method 26
2.2.3 Procedure for Predicting Maximum 27Embankment Height with LimitingEquilibrium Analysis
2.3 Analysis with Unconfined Compression 28Strengths
2.4 Analysis with Unconsolidated Undrained 29Strengths
2.5 Field Vane Analysis 30
•
2.5.1 Uncorrected Field Vane Analysis
2.5.2 Corrected Field Vane Analysis
-530
31
2.5.2.1
2.5.2.2
Bjerrum Correction
1.1 x Field Vane Su
31
31
3 •
2.6 SHANSEP Analysis
2.6.1 Simplified Bishop Analysis
2.6.2 Morgenstern Price Analysis
Performance of the Station 263 Test Section
32
35
35
65
3.1 Field Instrumentation and Exploration 65at the Test Section
3.2 Field Test Construction Sequence 66
3.3 Field Measurements 67
4 •
3.3.1. Pore Pressures
3.3.2 Settlement and Heave
3.4 Failure
Comparison of Predictions and ObservedPerformance
67
67
67
85
4.1 Factors Contributing to Inaccuracies 85in All Predictions
5.
4.1.1 Properties of Sand Fill
4.1. 2 Mode of Failure
4.1.3 Time Effects
4.2 U.C. and U.U. Case
4.3 Field Vane Analyses
4.4 SHANSEP Analysis
Post Failure Analyses
5.1 Field Vane Analyses
5. 2 SHANSEP Analyses
85
86
87
87
88
88
93
93
95
•
6.
5.3 Effective Stress Analyses
5.4 Effectiveness of Field Measurementsas Indication of Impending Failure
5.4.1 Pore Pressures
5.4.2 Settlements and Heave
5.4.3 Summary
Conclusions
-696
97
98
99
100
109
•
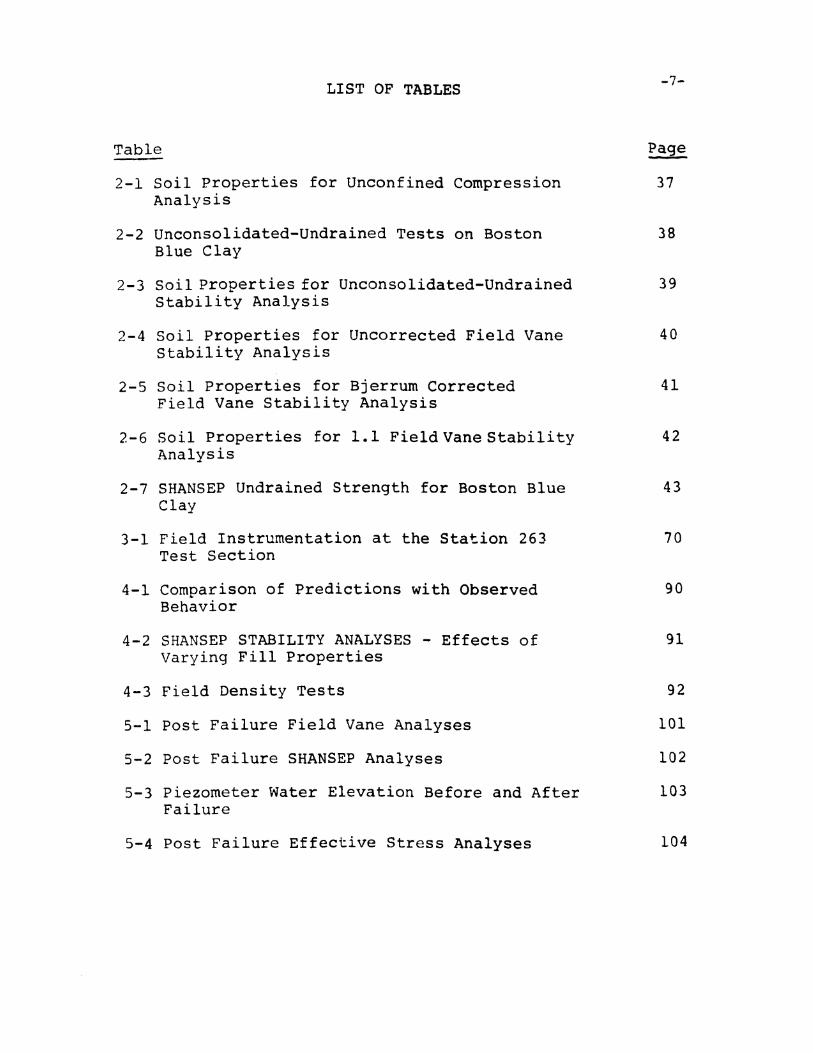
LIST OF TABLES
Table
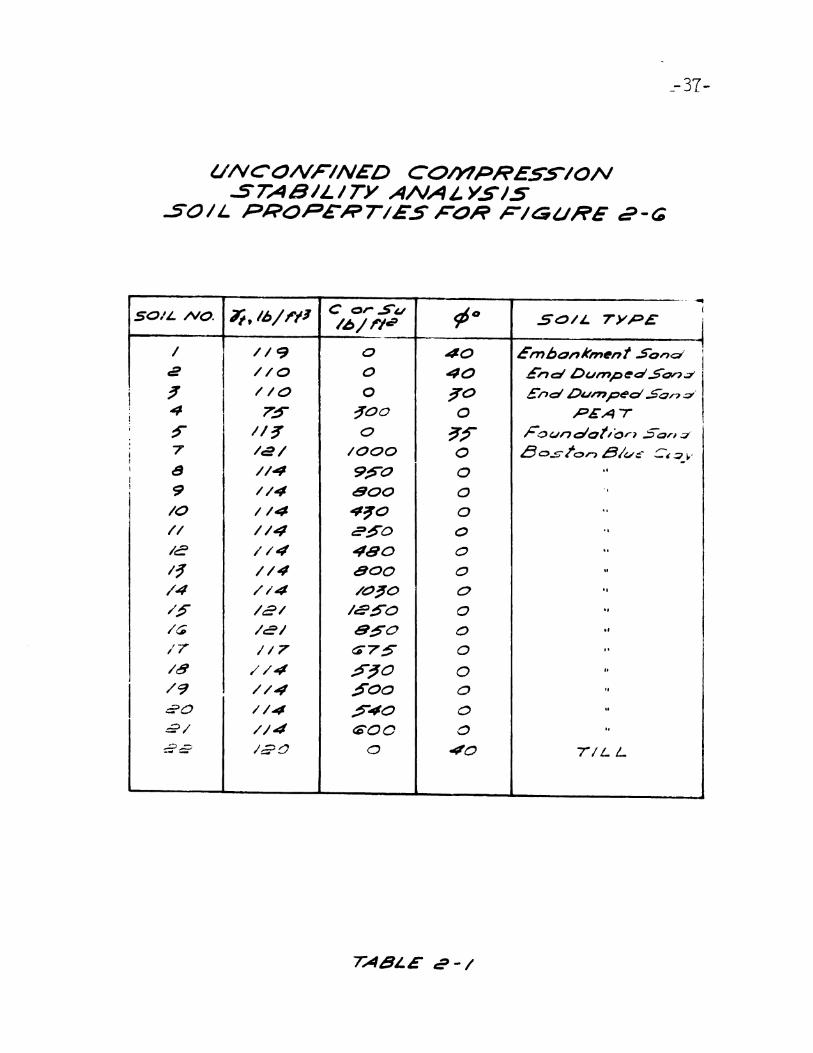
2-1 Soil Properties for Unconfined CompressionAnalysis
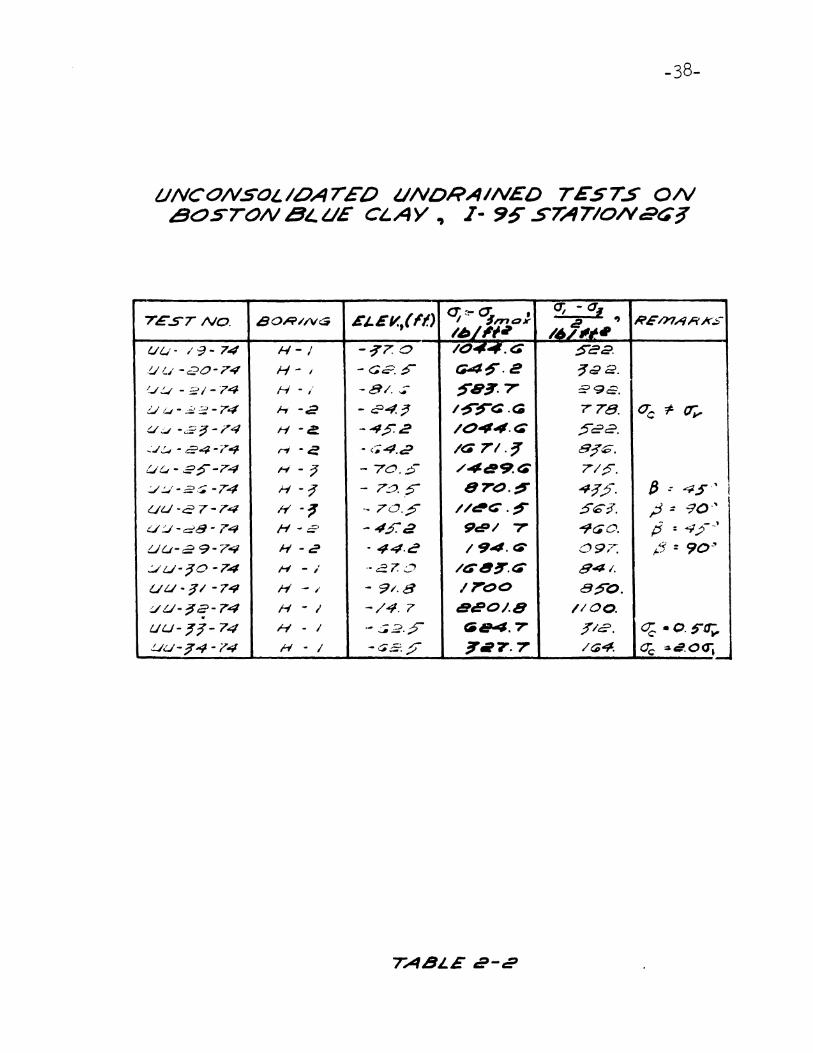
2-2 Unconsolidated-Undrained Tests on BostonBlue Clay
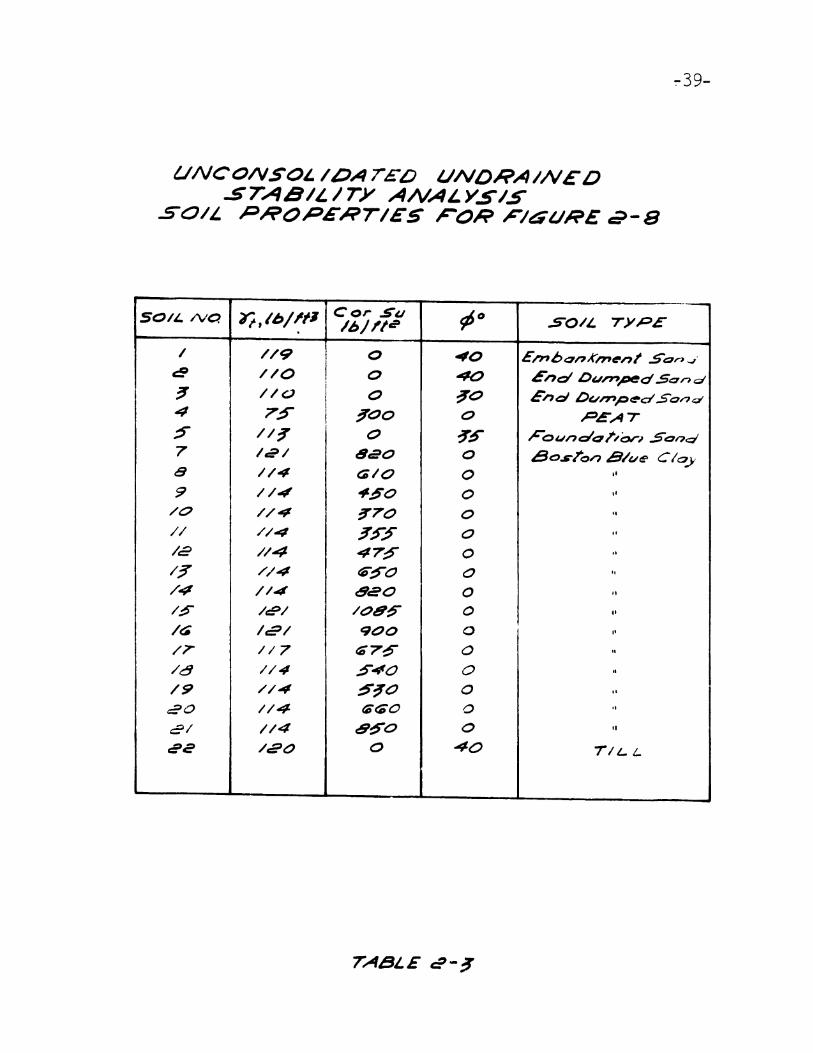
2-3 Soil Properties for Unconsolidated-UndrainedStability Analysis
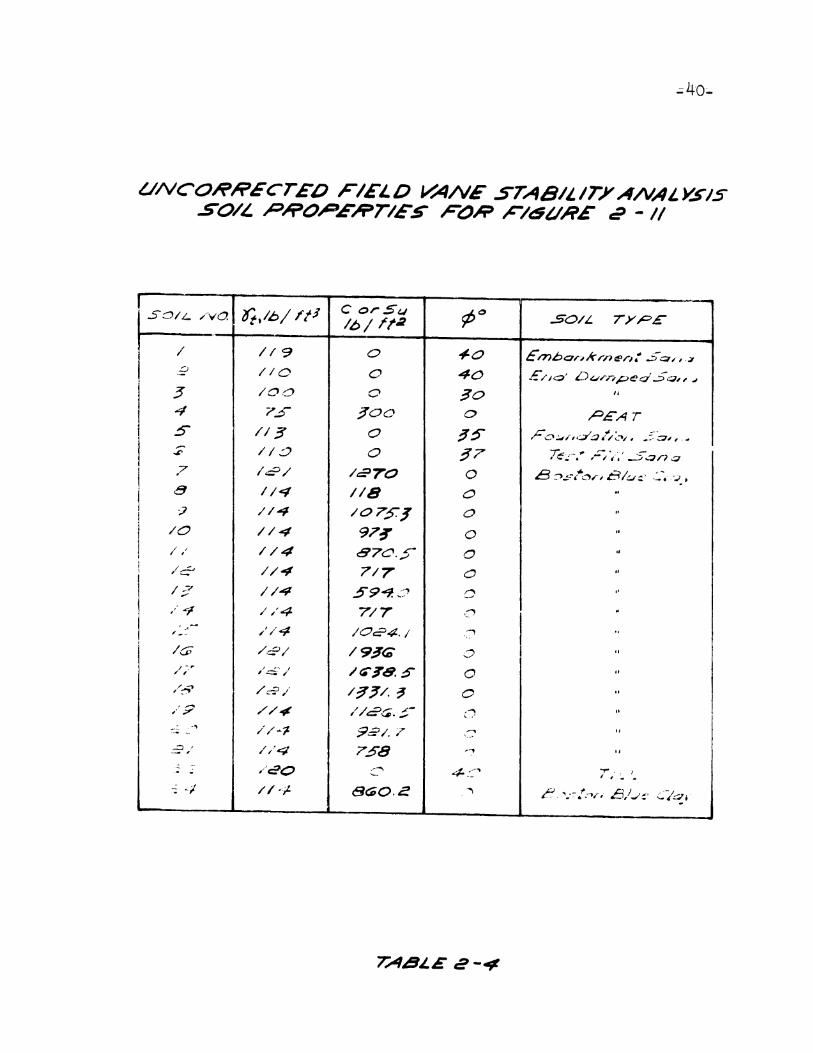
2-4 Soil Properties for Uncorrected Field VaneStability Analysis
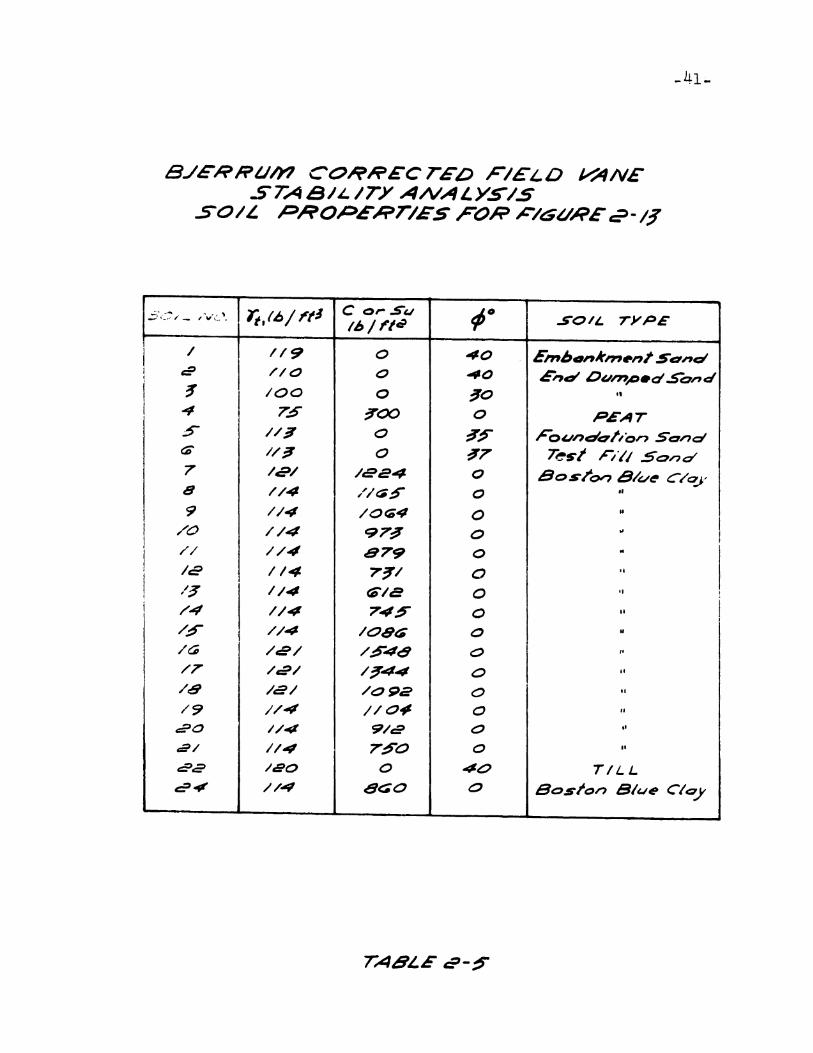
2-5 Soil Properties for Bjerrum CorrectedField Vane Stability Analysis
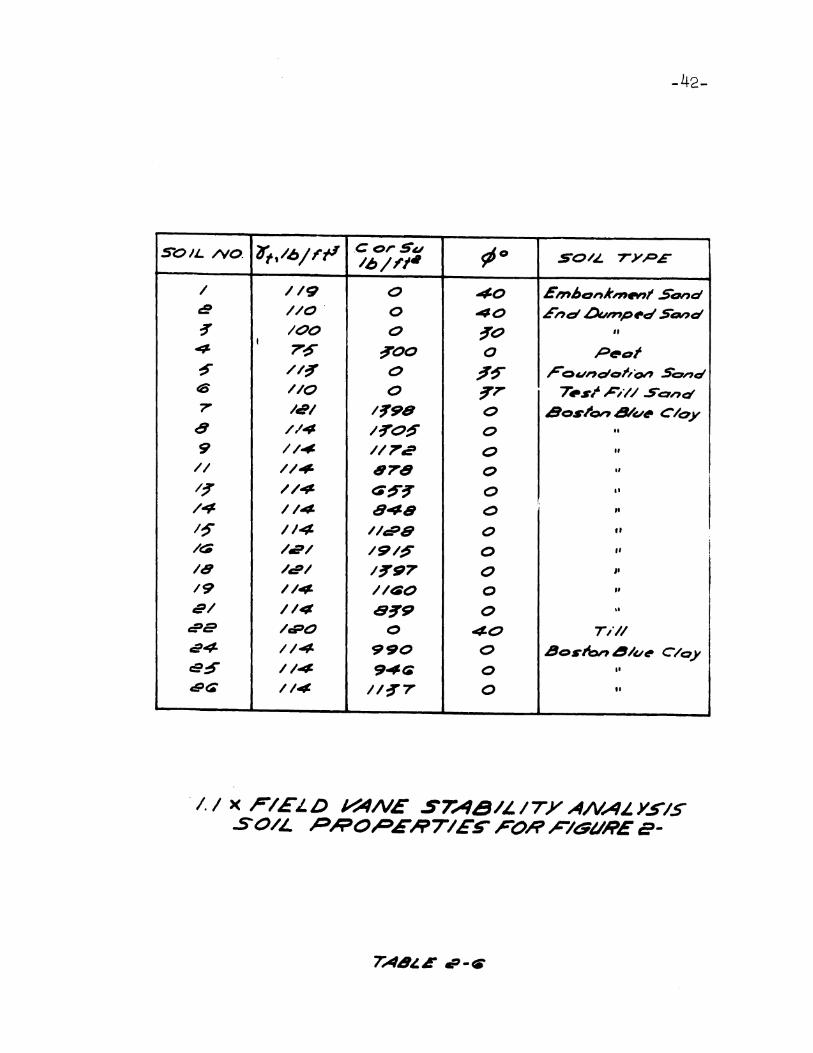
2-6 Soil Properties for 1.1 Field Vane StabilityAnalysis
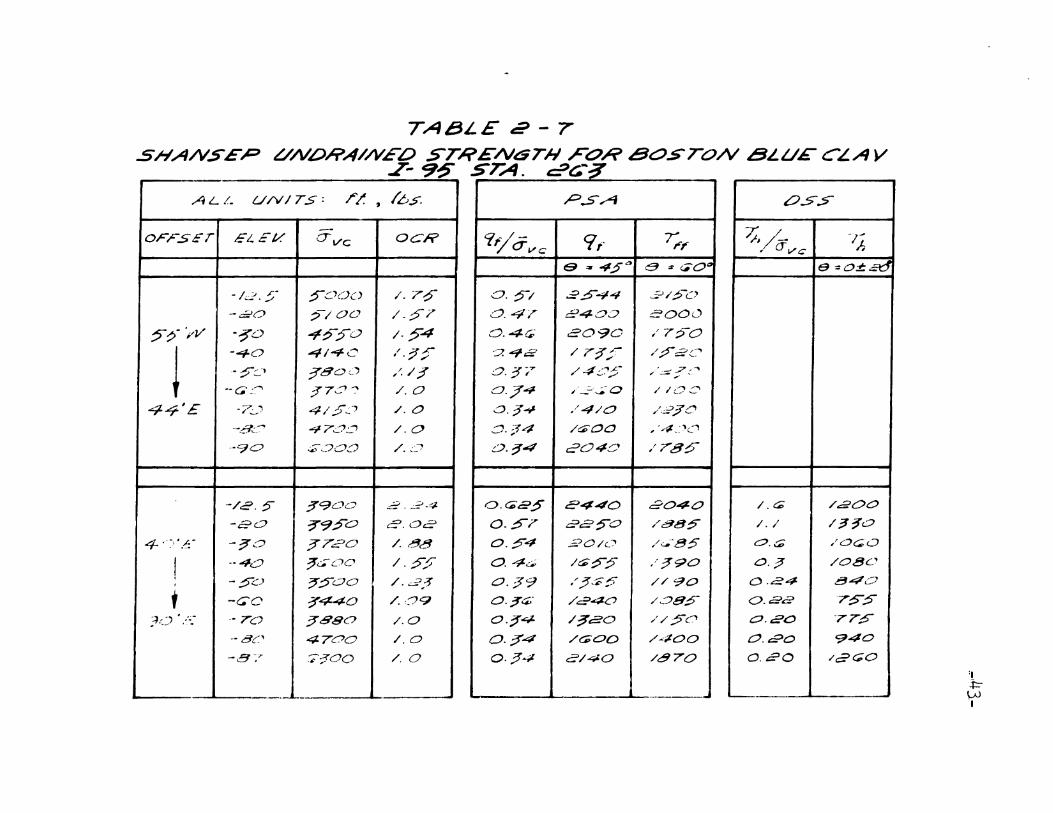
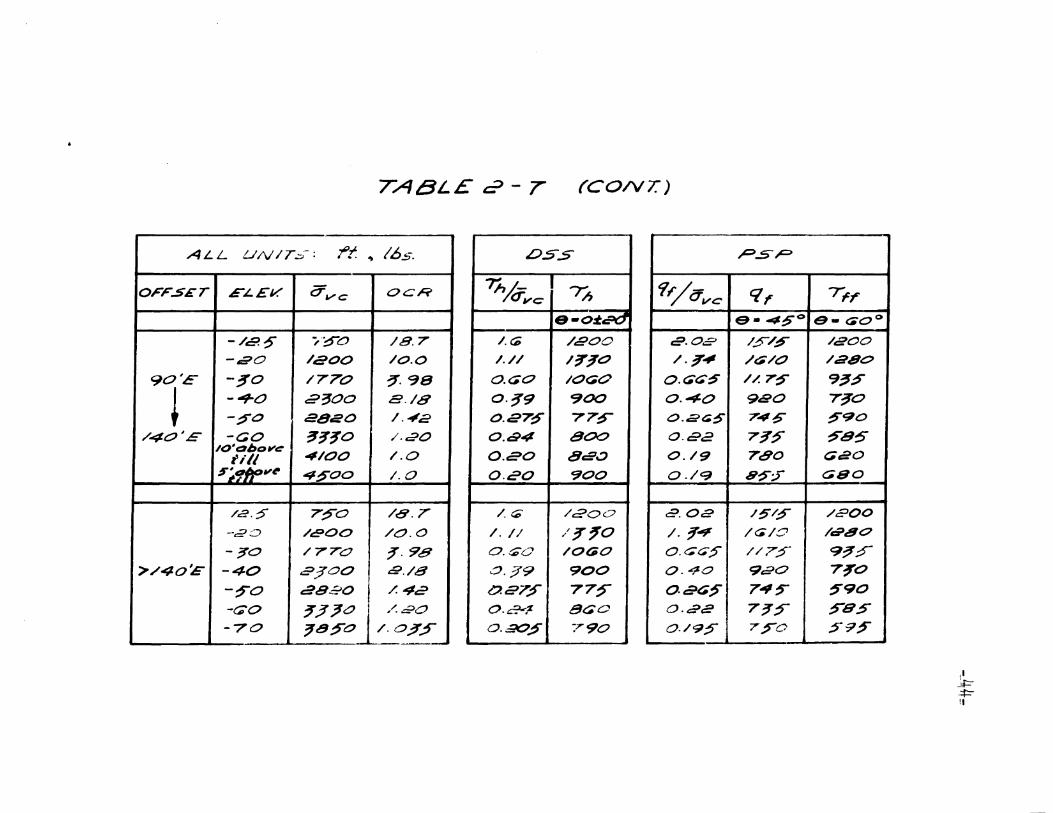
2-7 SHANSEP Undrained Strength for Boston BlueClay
3-1 Field Instrumentation at the Station 263Test section
4-1 Comparison of Predictions with ObservedBehavior
4-2 SHANSEP STABILITY ANALYSES - Effects ofVarying Fill Properties
4-3 Field Density Tests
5-1 Post Failure Field Vane Analyses
5-2 Post Failure SHANSEP Analyses
5-3 Piezometer Water Elevation Before and AfterFailure
5-4 Post Failure Effective Stress Analyses
-7-
37
38
39
40
41
42
43
70
90
91
92
101
102
103
104
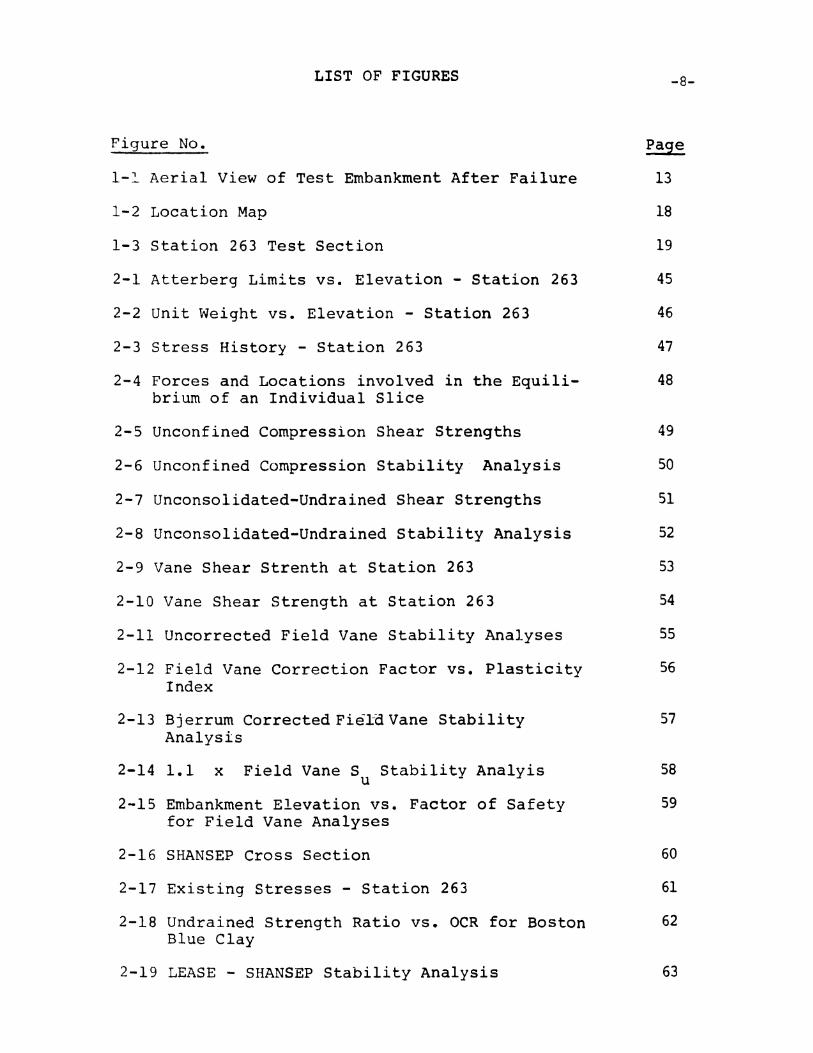
LIST OF FIGURES
Figure No.
1-1 Aerial View of Test Embankment After Failure
1-2 Location Map
1-3 Station 263 Test Section
2-1 Atterberg Limits vs. Elevation - Station 263
2-2 unit Weight vs. Elevation - Station 263
2-3 stress History - Station 263
2-4 Forces and Locations involved in the Equilibrium of an Individual Slice
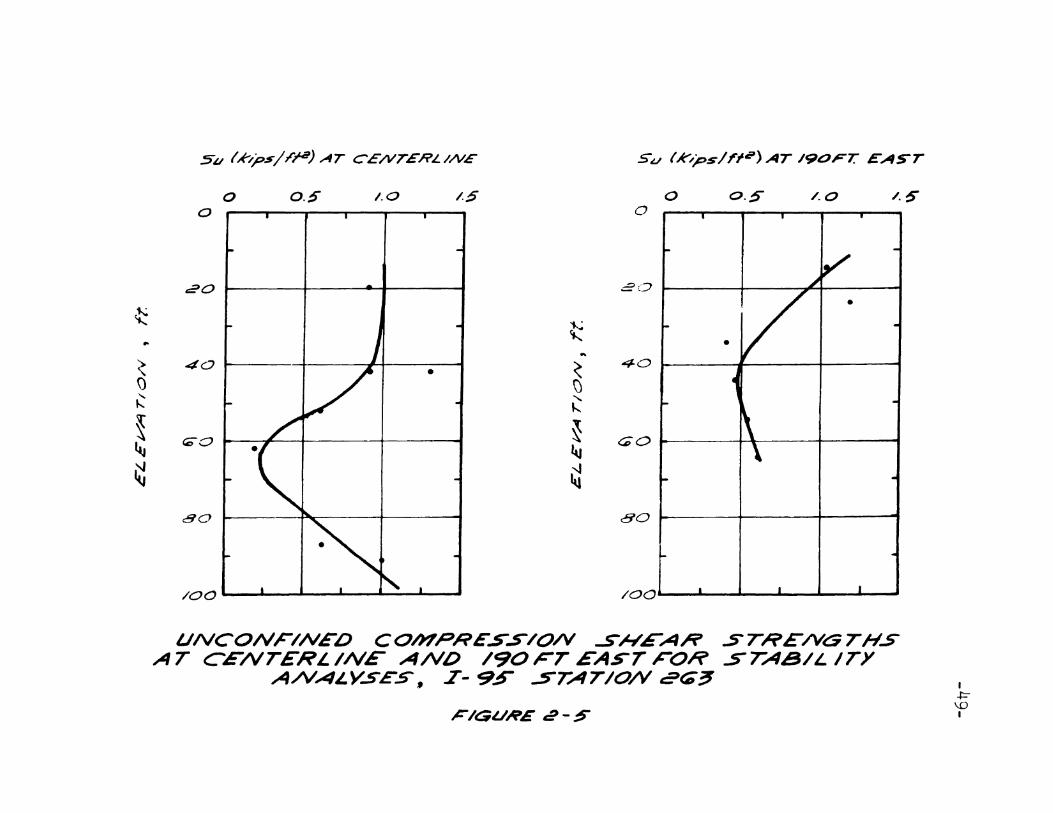
2-5 Unconfined Compression Shear Strengths
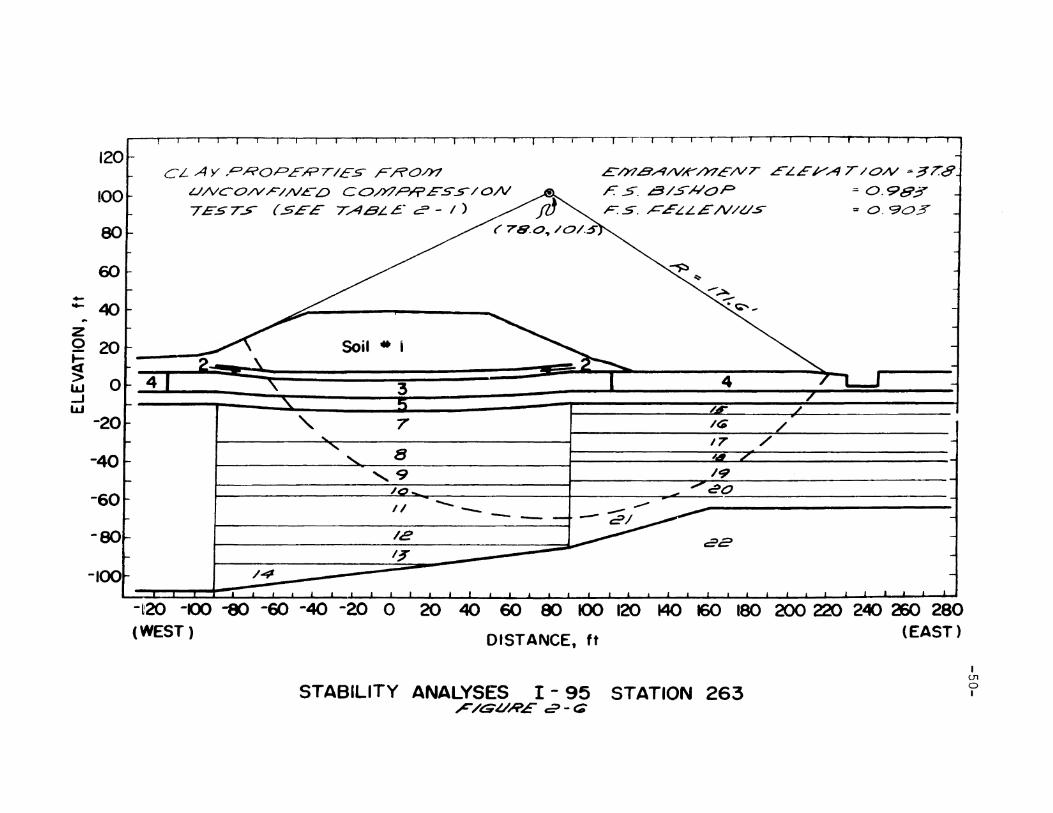
2-6 Unconfined Compression Stability· Analysis
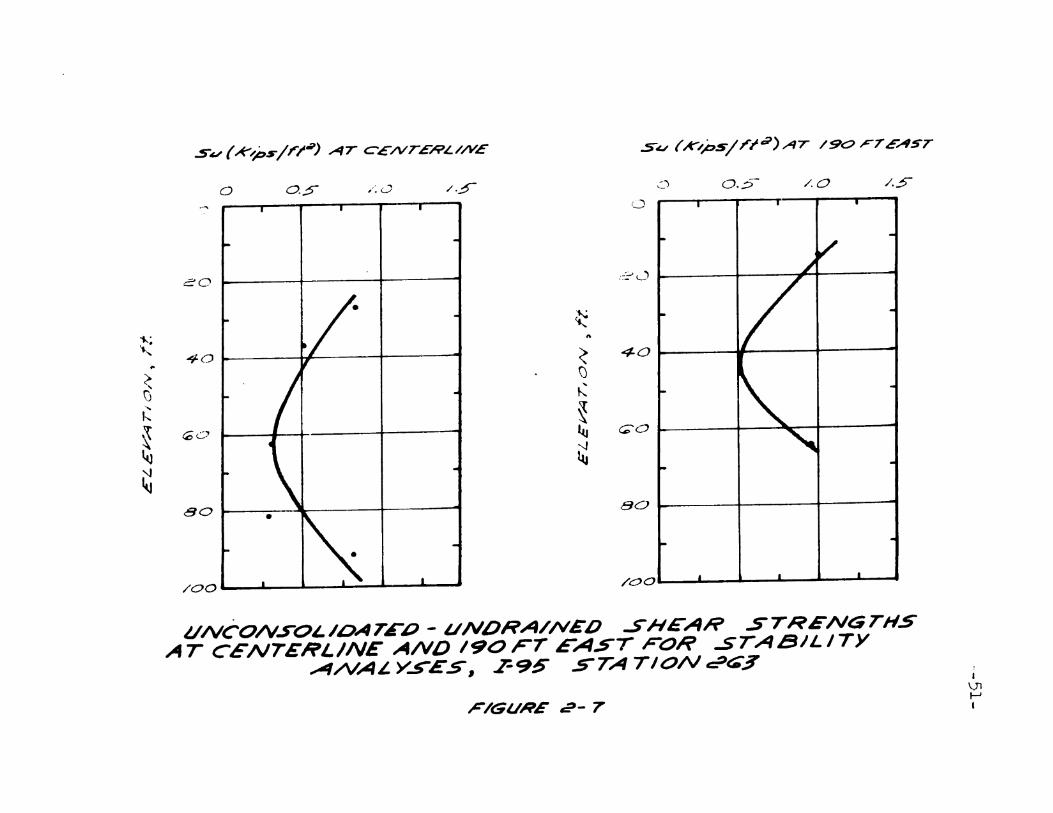
2-7 Unconsolidated-Undrained Shear Strengths
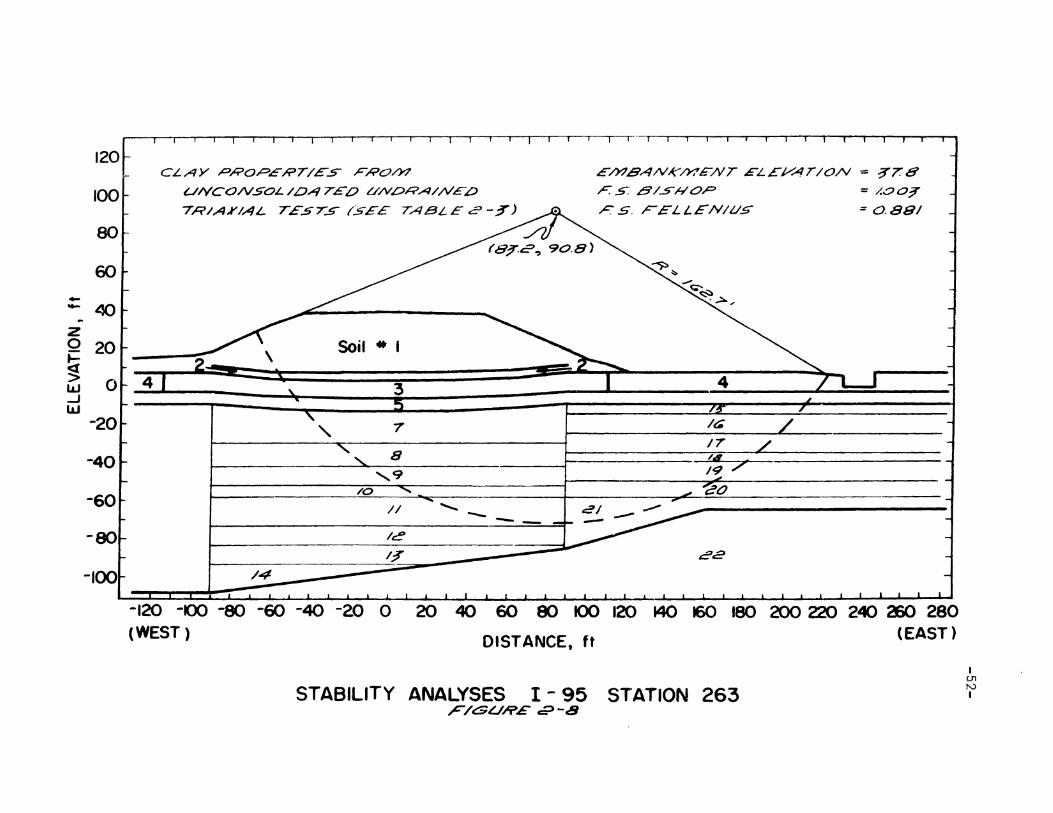
2-8 Unconsolidated-Undrained Stability Analysis
2-9 Vane Shear Strenth at Station 263
2-10 Vane Shear Strength at Station 263
2-11 Uncorrected Field Vane Stability Analyses
2-12 Field Vane Correction Factor vs. PlasticityIndex
2-13 Bj errurn Corrected FieLa Vane StabilityAnalysis
2-14 1.1 x Field Vane S Stability Analyisu
2-15 Embankment Elevation vs. Factor of Safetyfor Field Vane Analyses
2-16 SHANSEP Cross Section
2-17 Existing Stresses - Station 263
2-18 Undrained Strength Ratio vs. OCR for BostonBlue Clay
2-19 LEASE - SHANSEP Stability Analysis
-8-
Page
13
18
19
45
46
47
48
49
50
51
52
53
54
55
56
57
58
59
60
61
62
63
•
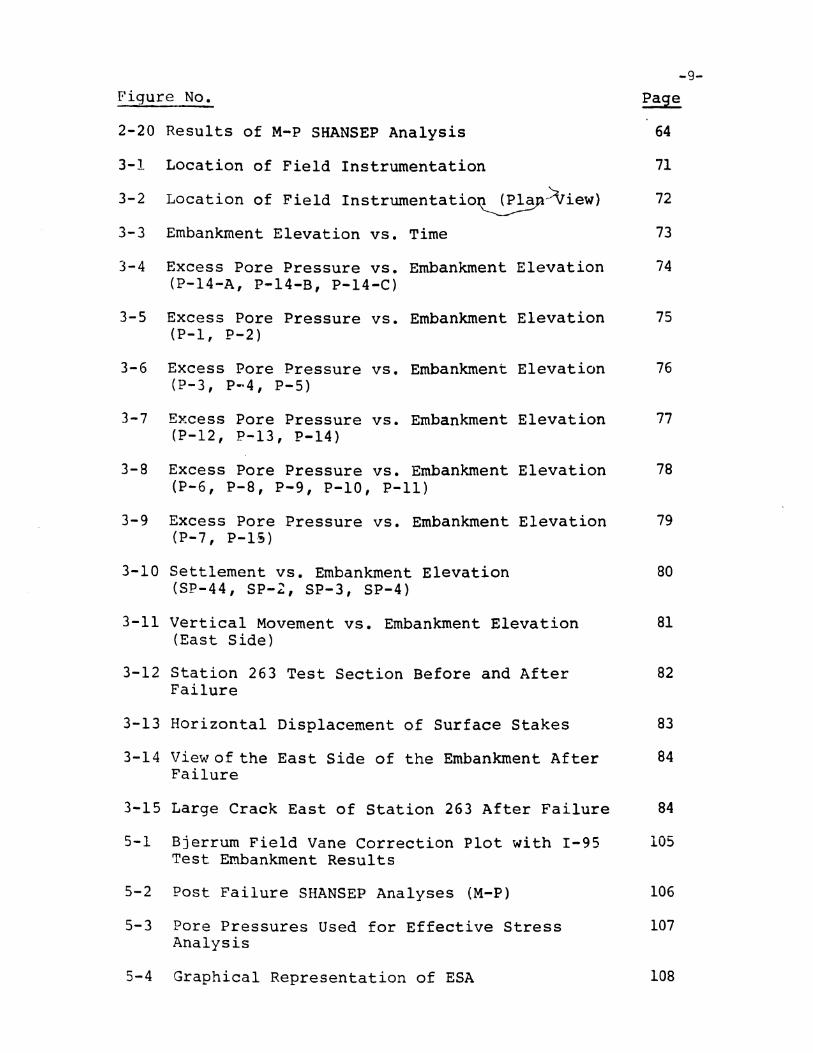
Figure No.
2-20 Results of M-P SHANSEP Analysis
-9
Page
64
3-1 Location of Field Instrumentation 71
3-2 Location of Field Instrumentatio~~ieW) 72
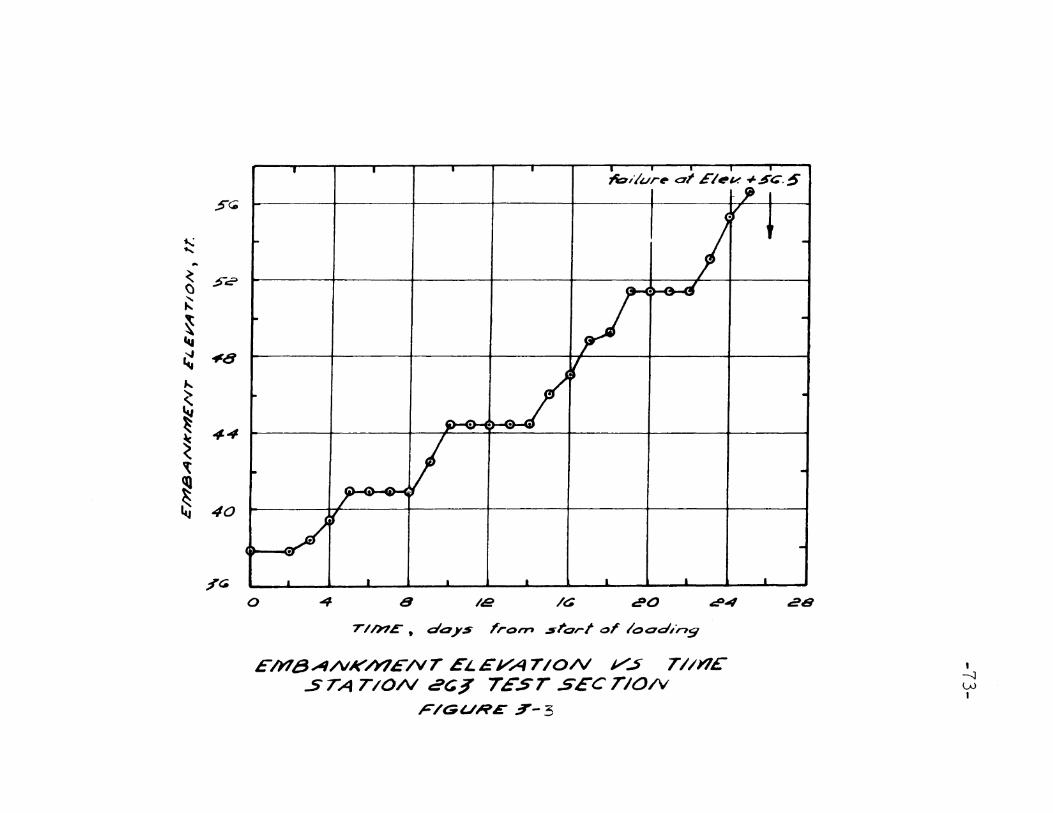
3-3 Embankment Elevation vs. Time 73
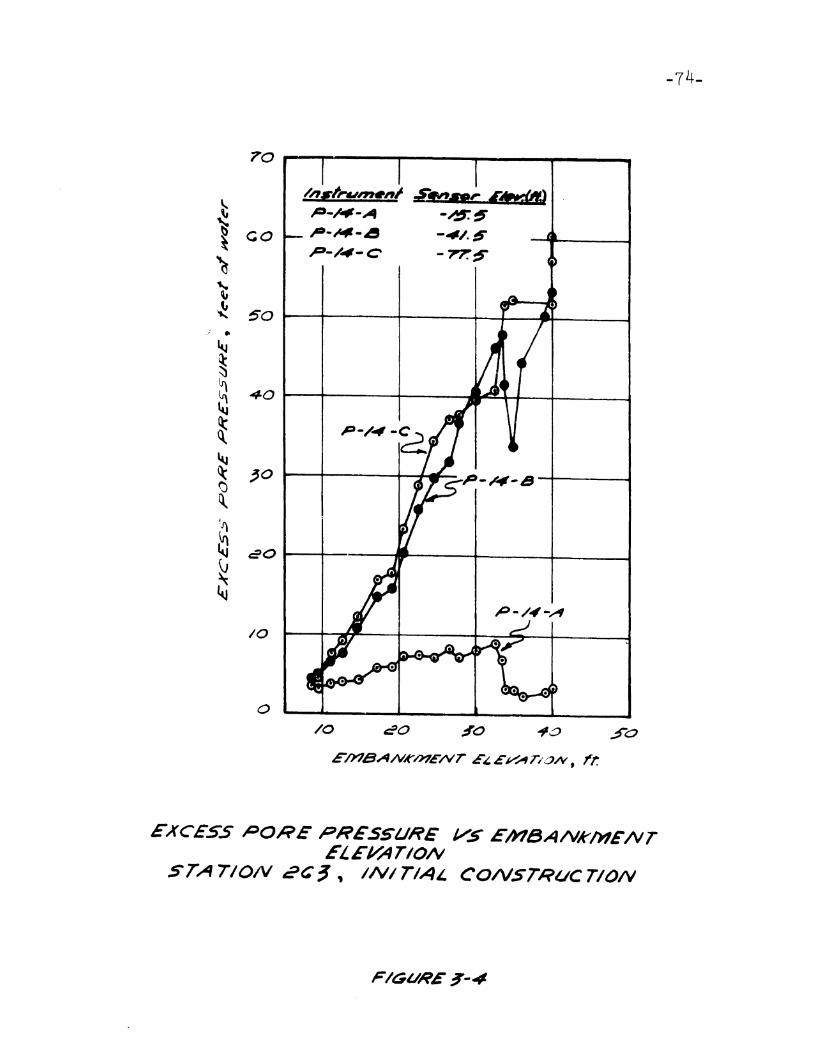
3-4 Excess Pore Pressure vs. Embankment Elevation 74(P-14-A, P-14-B, P-14-C)
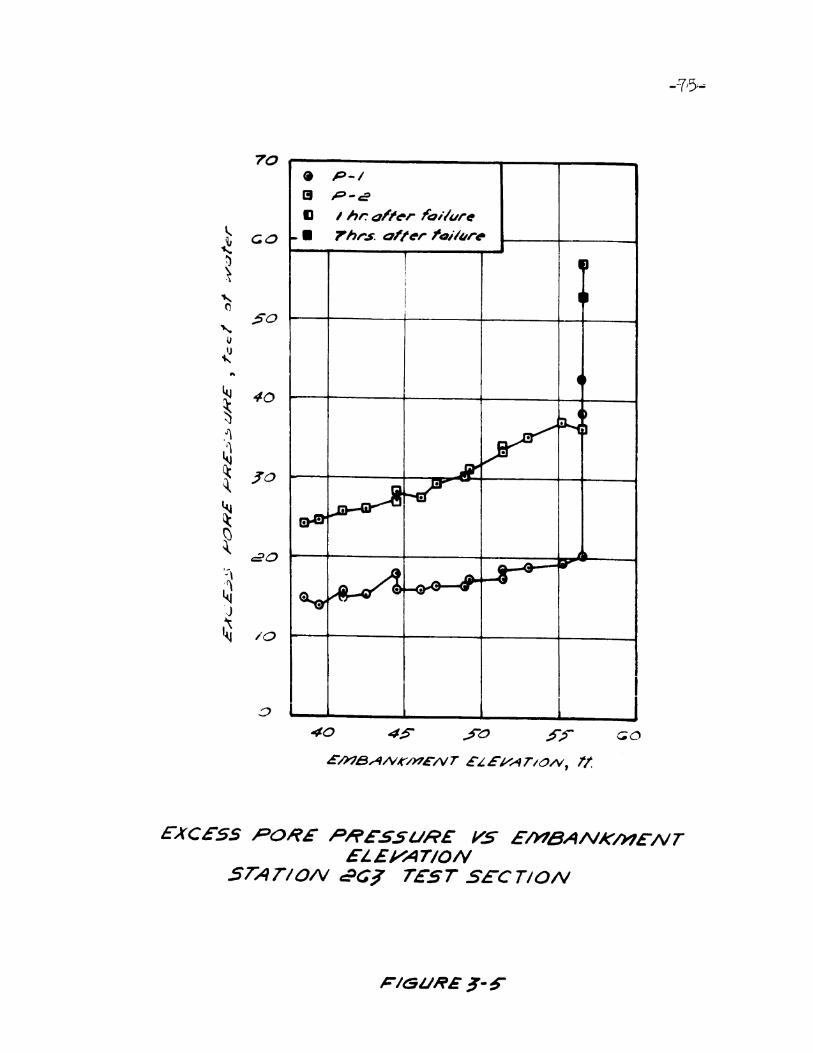
3-5 Excess Pore Pressure vs. Embankment Elevation 75(P-l, P-2)
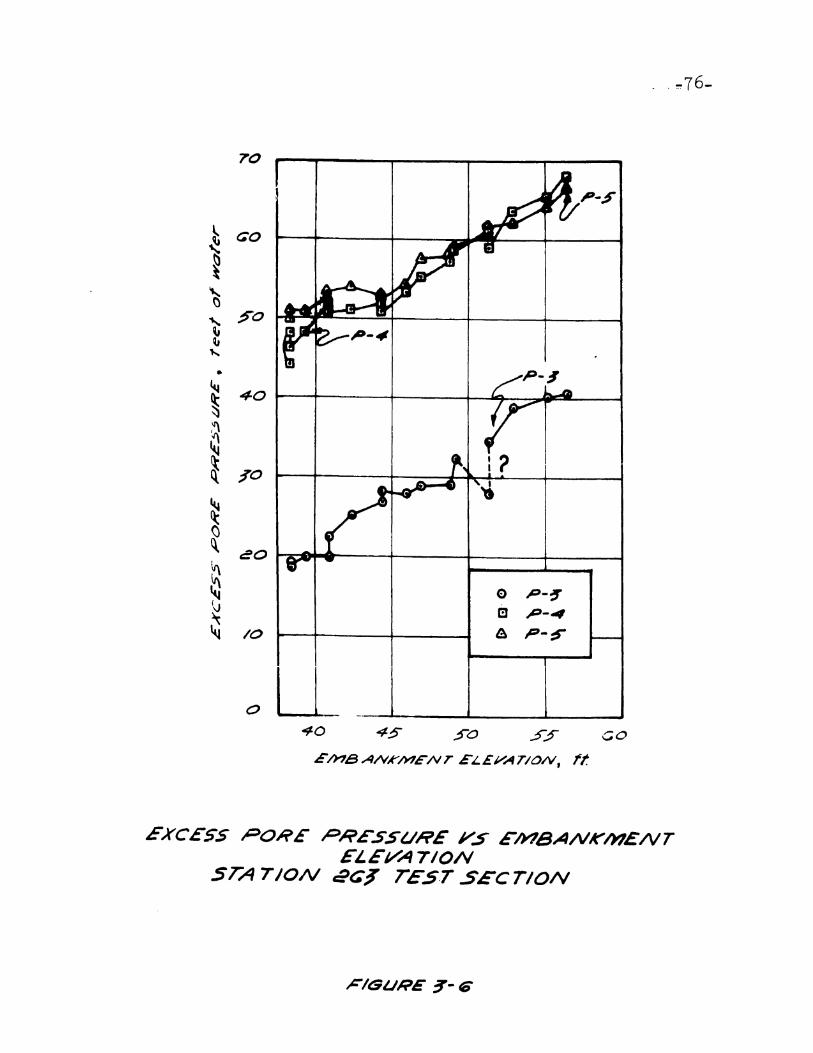
3-6 Excess Pore Pressure vs. Embankment Elevation 76(P-3, P--4, P-5)
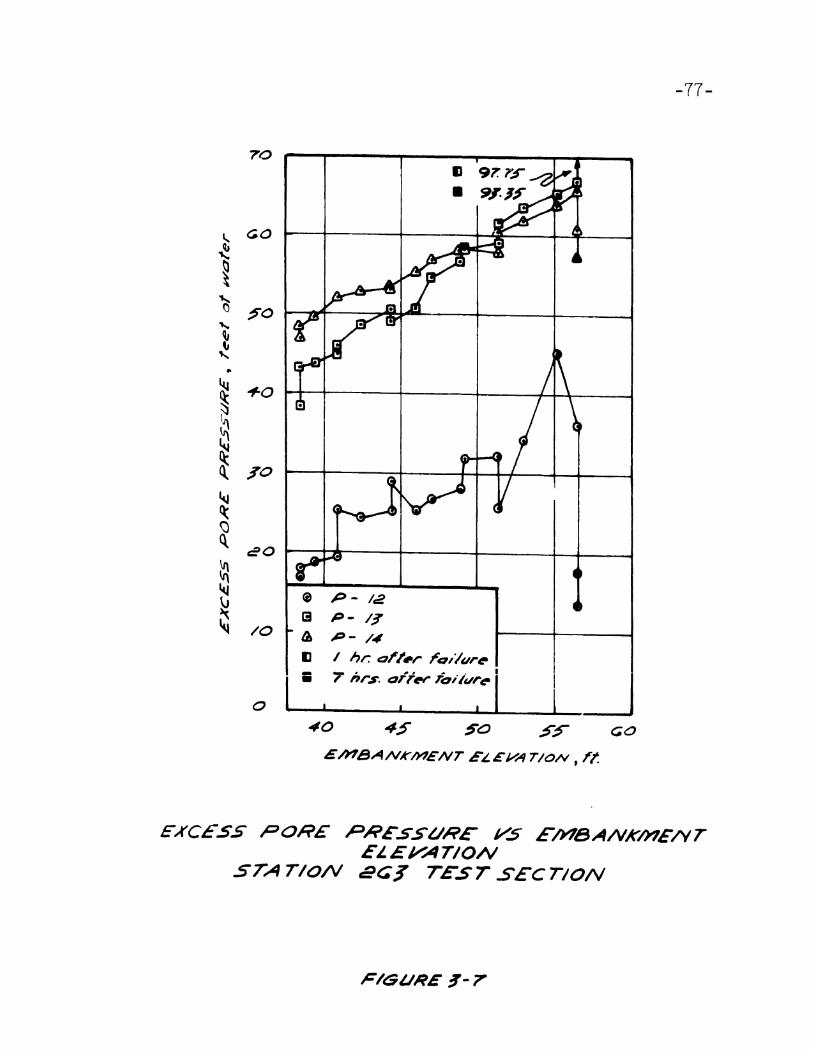
3-7 Excess Pore Pressure vs. Embankment Elevation 77(P-12, P-13, P-14)
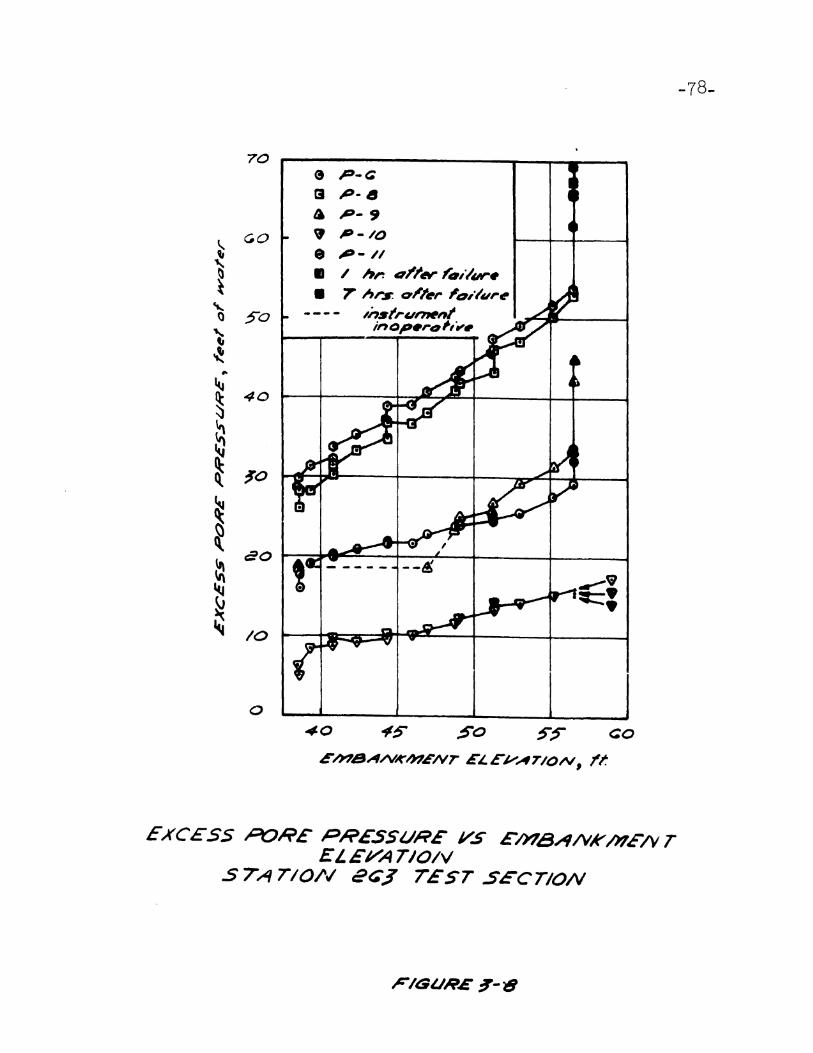
3-8 Excess Pore Pressure vs. Embankment Elevation 78(P-6, P-8, P-9, P-lO, P-ll)
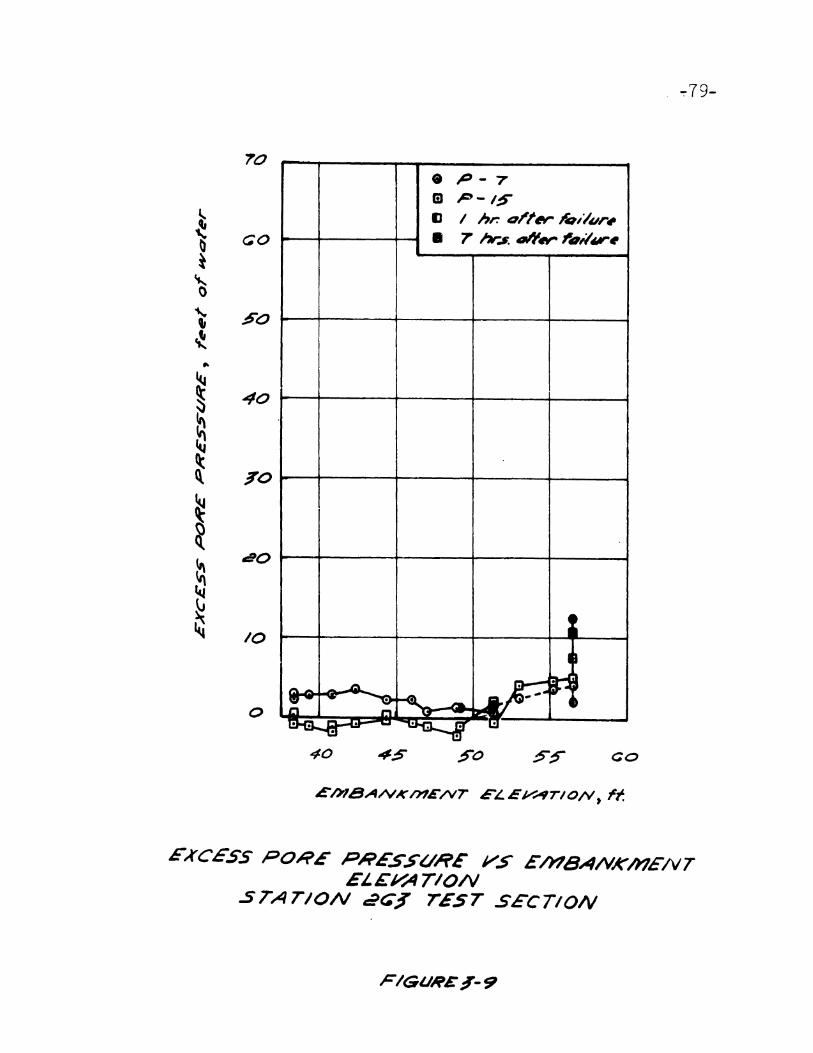
3-9 Excess Pore Pressure vs. Embankment Elevation 79(P-7, P-l·S)
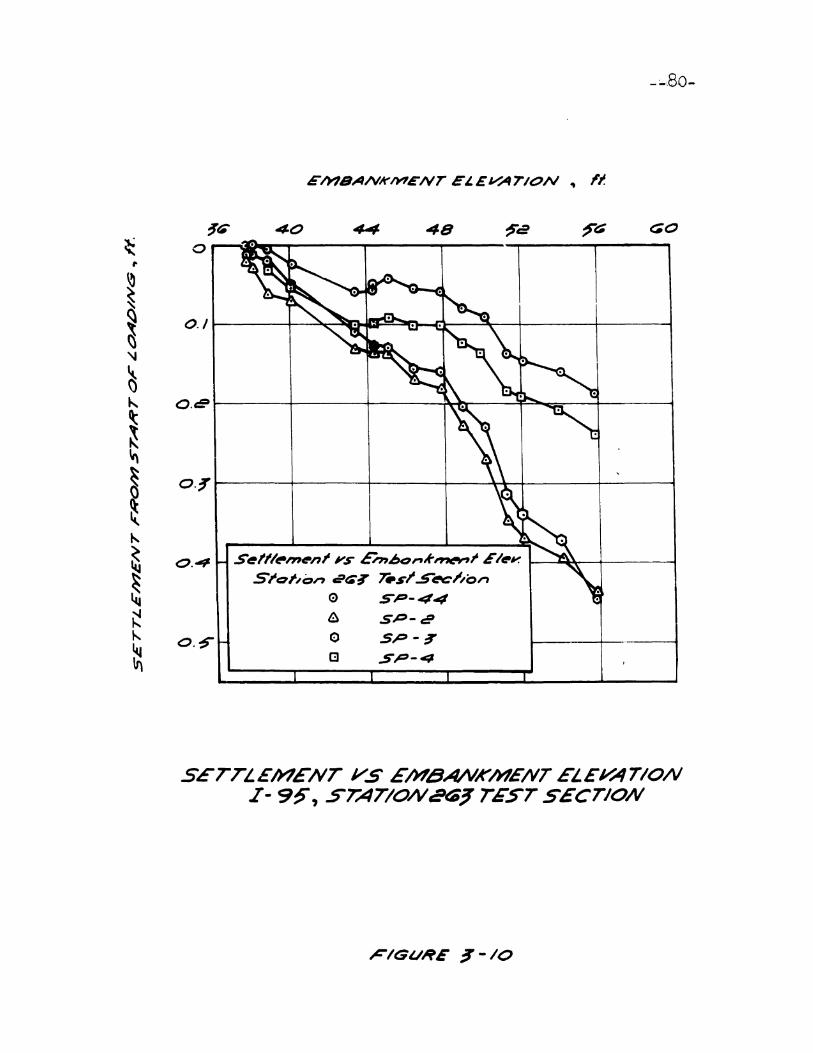
3-10 Settlement vs. Embankment Elevation 80(SP-44, SP-~, SP-3, SP-4)
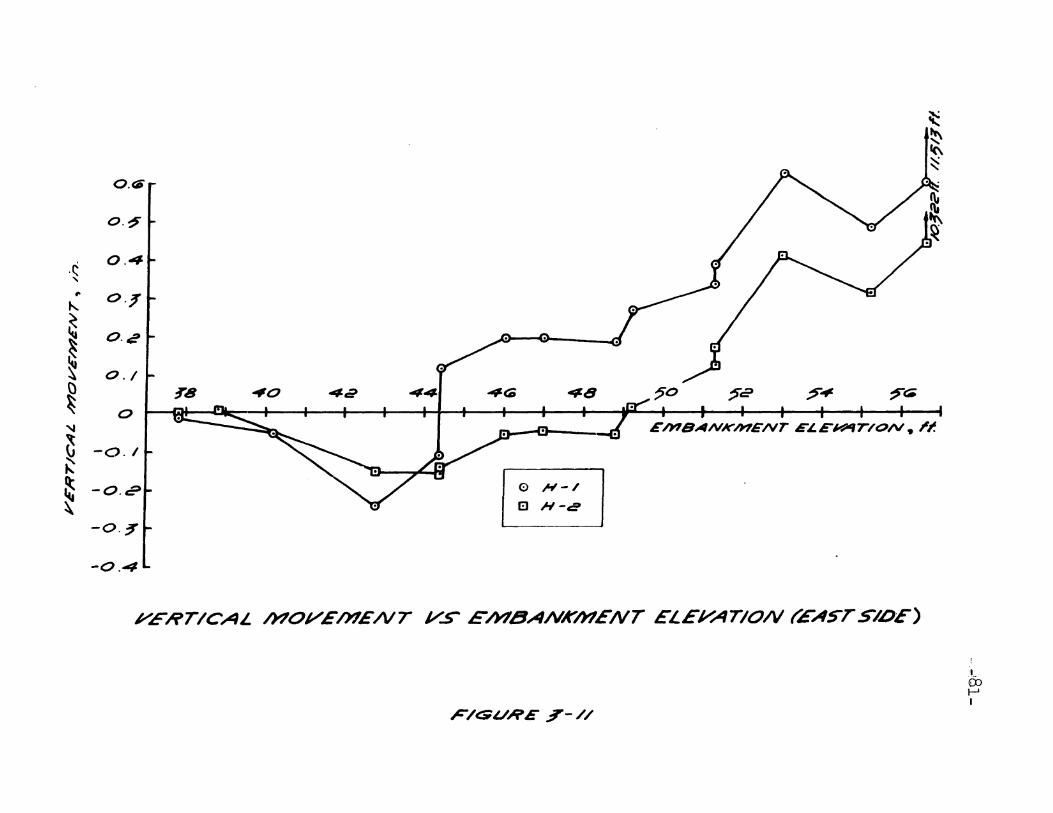
3-11 Vertical Movement vs. Embankment Elevation 81(East Side)
3-12 Station 263 Test Section Before and After 82Failure
3-13 Horizontal Displacement of Surface Stakes 83
3-14 View of the East Side of the Embankment After 84Failure
3-15 Large Crack East of Station 263 After Failure 84
5-1 Bjerrum Field Vane Correction Plot with r-95 105Test Embankment Results
5-2 Post Failure SHANSEP Analyses (M-P) 106
5-3 Pore Pressures Used for Effective Stress 107Analysis
5-4 Graphical Representation of ESA 108
•
a
-c
CIU
DSS
ESA
E.J
FS
f (x)
~g
ht
K0
ka:
N
OCR
P - 1
PI
PSA
PSP
r
S
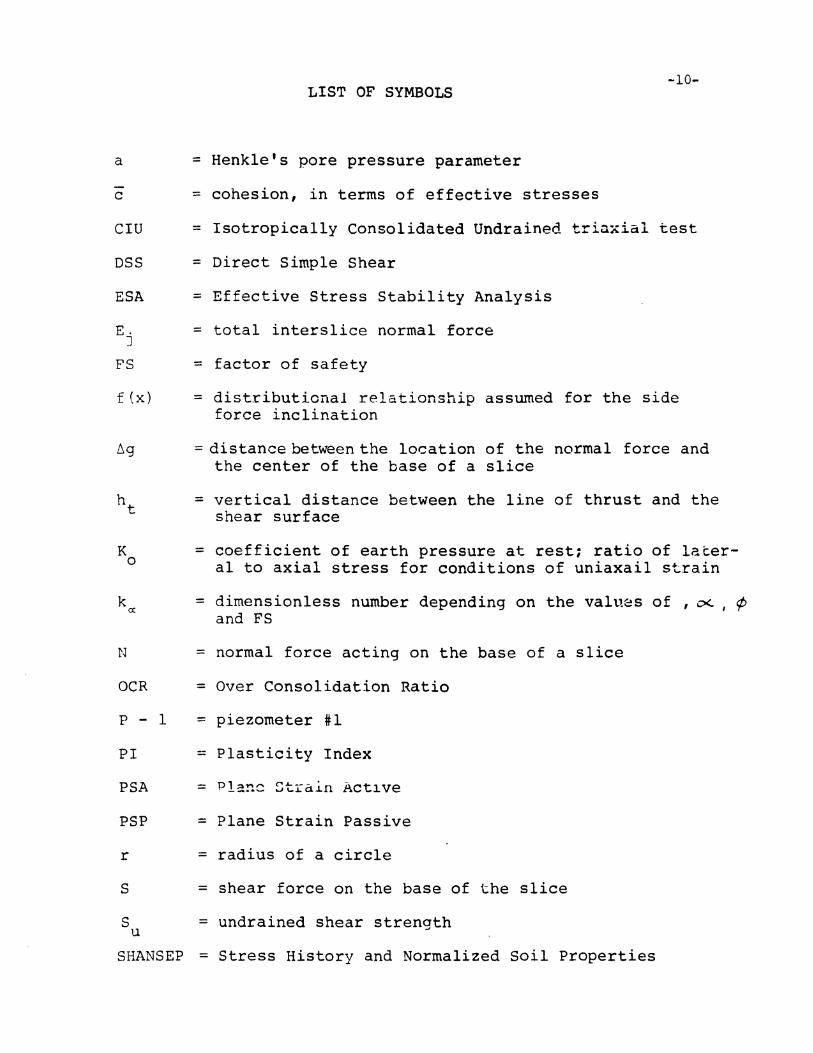
-10-LIST OF SYMBOLS
= Henkle's pore pressure parameter
= cohesion, in terms of effective stresses
= Isotropically Consolidated Undrained triaxial test
= Direct Simple Shear
= Effective Stress Stability Analysis
= total interslice normal force
= factor of safety
= distributional relationship assumed for the sideforce inclination
= distance between the location of the normal force andthe center of the base of a slice
= vertical distance between the line of thrust and theshear surface
= coefficient of earth pressure at rest; ratio of lateral to axial stress for conditions of uniaxail strain
= dimensionless number depending on the values of , ~ I ¢and FS
= normal force acting on the base of a slice
= Over Consolidation Ratio
= piezometer #1
- Plasticity Index
= Pl~n~ St~C1.i.n Act1ve
= Plane Strain Passive
= radius of a circle
= shear force on the base of the slice
s = undrained shear strengthu
SHANSEP = Stress History and Normalized Soil Properties
-11-
81 - 1 = Sope Indicator #1: inclinometer
TSA = Total Stress Stability Analysis
DC = Unconfined Compression test
UTJ = Unconsolidated Undrained triaxial test
~u = excess pore pressure
w =weight of an individual slice
w = water content
x.)
~x
= liquid limit
= natural water content
= plastic limit
= shear force between slices
= width of a slice
Yt
= Y coordinate of the line of thrust
a = angle of inclination of the base of a slice measuredin a clockwise direction from the horizontal
A = scaling factor for side force inclinations
cr = initial vertical effective stressvo
a = maximum vertical effective stressvm
= major principal stress
= minor principal stress
= total unit weight
= angle of internal friction for a soil in terms oftotal stresses
¢ = angle of internal friction for a soil in terms ofeffective stresses
-12-1. INTRODUCTION
1.1 THE FAILURE OF THE 1-95 TEST EMBANKMENT
Early in the morning of 20 September 1974 a failure
of extraordinary proportions occurred on a test fill located
on the Interstate 95 embankment north of Boston. Within min
utes, a simultaneous failure to both sides of the emBankment
caused the crest to drop about 30 feet and the sides to heave
as much as 14 feet. An aerial view of the slide areaas shown in
Figure 1-1. Unfortunately, no one was present to witness the
failure take place since no advance warning was noticed. The
fill never cracked at the surface nor was any clear indication
of impending failure obtained from the field instrumentation
at the site. The tes~ Section failed at an elevation of 56.5
feet, after placing 18.7 feet of additional filion an em
bankrnen~ which had been in place for five years.
The test fill was planned on an effort to resolve the
uncertainties involved in selecting strength parameters for
use in stability analyses of embankments on Boston Blue Clay.
The I-95 test fill problem was further complicated by h~ving
a partially consolidated foundation under the embankment.
The construction of full scale test embankments for the
solution of engineering problems is by no means uncommon. In
his state-of-the-art report, "Embankments on Soft Ground",
Bjerrum (1972) discusses 11 embankment failures of which 8
were test fills. La Rochelle, et. al (1974) report the results
of a more recent test fill located in Canada. The test fills
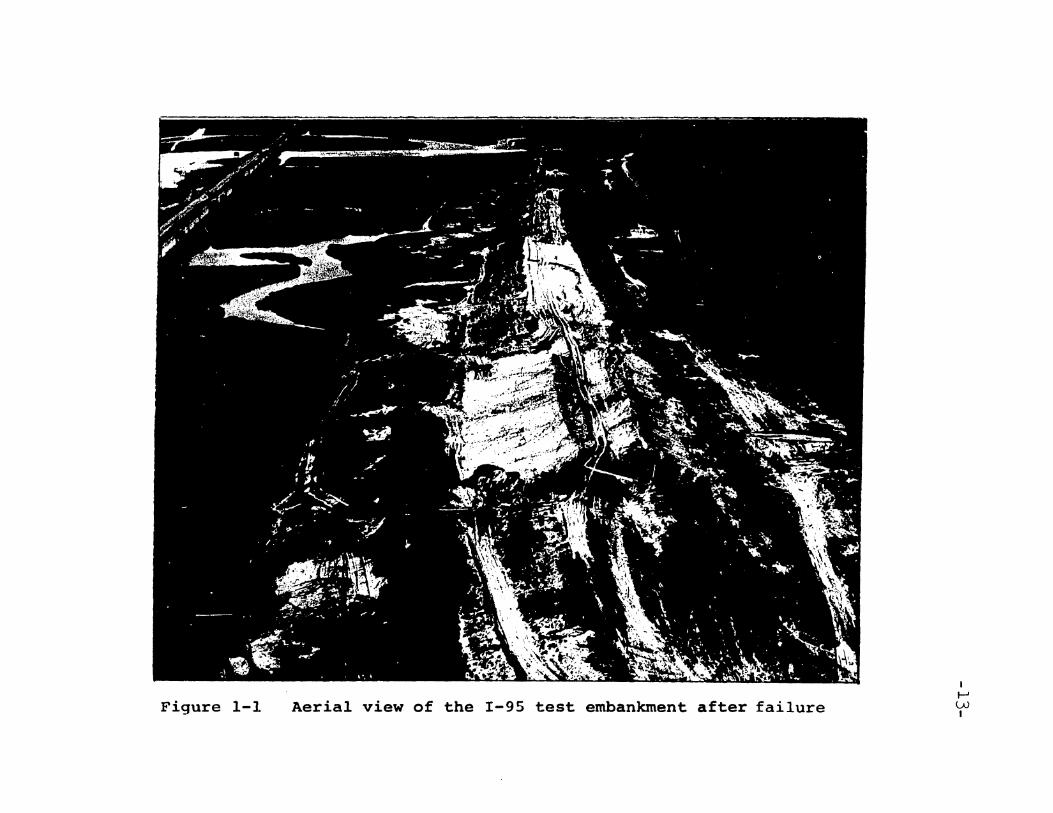
Figure 1-1 Aerial view of the 1-95 test embankment after failure
If-ILV,
•
•
-14are selected because they are the only test whi.ch models
precisely the site conditions (soil properties and state of
stress). Results form these full size field tests are very
useful in the interpretation of the routinely performed la-
boratory and field strength tests.
This thesis is a study of the stability of ihe 1-95 test
embankment. The objective is to evaluate prediction tech-
niques by comparing the predictions with the measured field per-
formance. Predictions of the embankment elevation at failure
were made based on Unconfined Compression tests (UC) , Unconsol-- - -idated Undrained triaxial tests (UU), Field Vane shear tests
(with and without corrections), and Stress History And Normal-- - -ized Soil ~roperties (SHANSEP) undrained strengths. The Simpli
fied Bishop and the Morgenstern-Price procedures of stability
analyses were utilized. The predictions varied from 39.7 ft
(zero ft of additional fill) for the UC and 61.1 ft for the
field vane with a correction factor of 1.1. The uncorrected
field vane, on the low side, anj the SHANSEP approach, on the
high side, yielded the most accurate predictions. The stability
methods utilized were unsuccessful in predicting the location of
tl-£e failure surface.
Based on the results presented in this thesis, a stabilty
analysis with field vane shear strengths and the Simplified
Bishop procedure should yield a prediction within 10% of the
actual value for embankments on Boston Blue Clay. To investi-
gate the stability of an emb.ankment on a partially consolidated
foundation (e.g. an embankment built in various stages) analyses
•
-15based on SHANSEP strengths should be used. With SHANSEP the
increase in strength with consolidation is easily evaluated
without performing additional tests and the results obtained
should also be within 10% of the actual value.
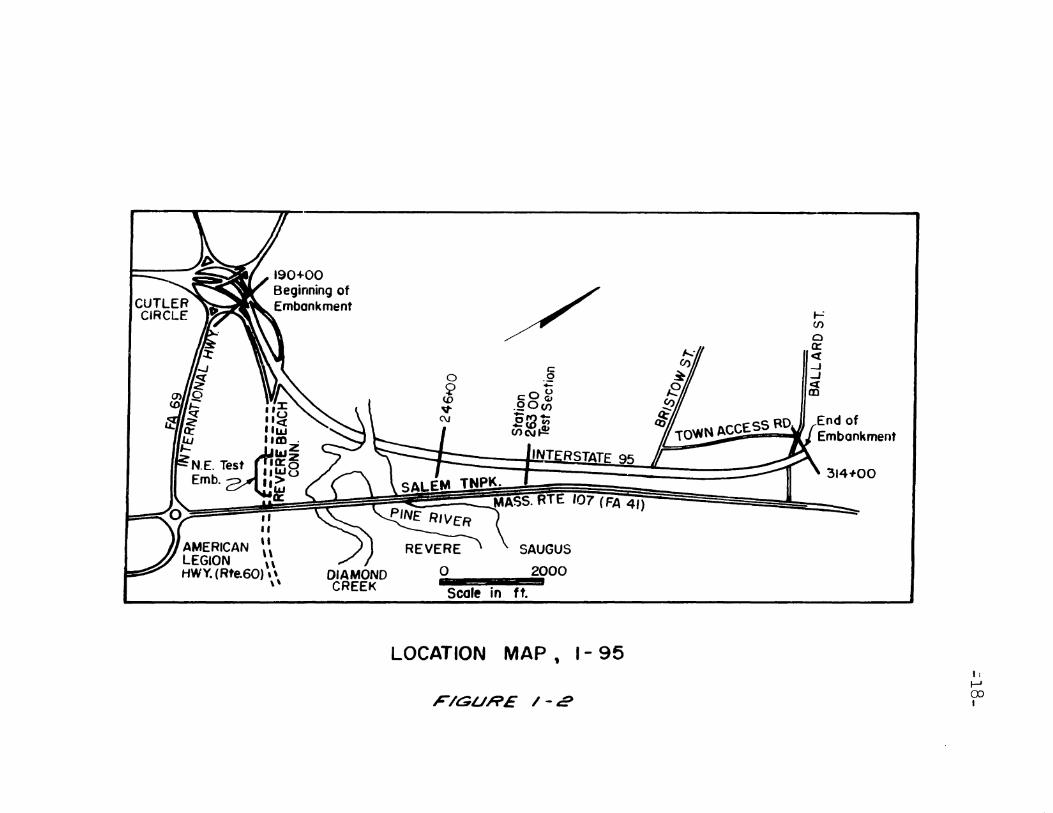
1.2 BACKGROUND INFORMATION ON THE I-95 RESEARCH PROJECT
The Interstate 95 research project was begun in Septern-
ber 1965 with preconstruction activities for a 2.4 mile section
of the highway north of Boston. Much of the section required
construction of a high embankment across a low tidal marsh in
the Revere-Saugus area (Fig. 1-2). The marsh was covered with
peat and underlain with a thick deposit of a medium to soft
clay called Boston Blue Clay.
construction operations began in August 1967 with removal
of the top layer of silt and peat and placement of a ten foot
thick sand and gravel working mat. By July 1969, when filling
was completed, the embankment crest elevation ranged from +25
to + 40 feet. Fill above elevation +18 feet represented a sur-
charge placed to accelerate consolidation deformations.
An extensively instrumented section was established by
M.I.T. and the Massachusetts Department of Public Works (MDPW)
at Station 246 of the highway embankment. The study of theM.I.T.
MDPW test section was focused at predicting, measuring and eval-
uating the deformations and pore pressure performance during con-
struction, after construction and upon removal of the surcharge in
1973. However, final surcharge removal and paving was cancelled.
To complete the objectives of the research program at Sta-
tion 246, M.I.T. and the MDPW planned to remove the surcharge
•
-16from a 300 foot long section of the embankment at the M.I.T.-
MDPW test section. During planning for surcharge removal, the
research participants realized that substantial field perfor-
rnance information regarding stability of the clay foundation
could be obtained at little extra cost by placing the removed
surcharge fill as an additional fill on another section of the
embankment until a stability failure occurred. Accordingly, a
construction and instrumentation program was developed to load
a 300 foot section of embankment to failure.
1.3 OUTLINE OF PRESENT INVESTIGATION
Station 263 was selected as the new test section for the
loading operation which was scheduled for the summer of
1974. At this location, lateral movements in the foundation
of up to 10 inches on the west side and 8 inches on the east.
side were measured during initial construction. These move-
rnents were larger than those measured at any other station and
lead the project engineer to recommend the installation of a
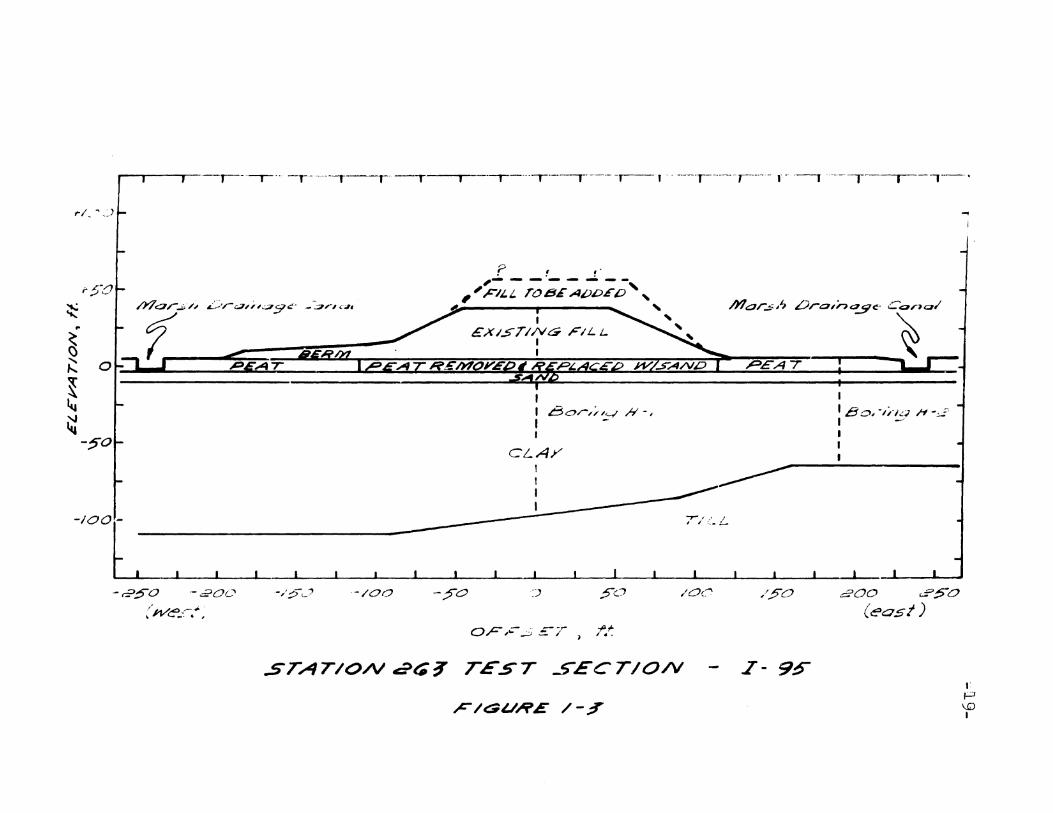
stabilizing berm on the west side as shown in Figure 1-3.
The geometry for the placement of additional fill, also
shown in Fig. 1-3, was designed to force the failure to occur
to the east side to minimize disturbance of the marsh area
on the west side. A wider embankment crest needed to accomodate
construction equipment during the later stages of loading re-
quired steepening of the east slope. Fill was to be dumped from
the crest of the original embankment until the east slope was
equal to the angle of repose of the sand. Then fill was to be
•
-17placed in even lifts for the entire 300 feet length of the
test section. No compaction, other than that provided by the
construction equipment, was planned.
In his Rankine lecture, Lambe (1973) classified predic
tions into three types. A "Type A" is made before the eVE~nt
to be predicted takes place. A "Type B" prediction is made as
the event is taking place and a "Type en prediction after the
event has occurred. Type A predictions are the most useful in
civil engineering projects since they are the only means to
prove that a prediction technique is correct. Furthermore,
design decisions are alwaya based on Taype A predictions.
The predictions of height of fill required to cause
failure, presented in Chapter 2, were all made before the
event, thus falling into Lambe's category of "Type A". The per
formance of the test section is given in Chapter 3, and Chap
ter 4 compares predicted and obs8rved behavior. After failure
occurred, analyses considering the best estimate of the failure
surface were done in order to gain further insight into the
various methods and soil parameters used. Results from these
post-failure stability analyses and a short evaluation of the
field measurements are the subject of Cahpter 5. Conclusions
from the study are presented in Chapter 6.
,,II,,
LEGION \\HWY. (Rte.60) ,\
\\DIAMONDCREEK
RSTATE 95
REVERE \ 'SAUGUS
o 2000
Scale in ft.
LOCATION MAP, I - 95
FIGURE 1-2
.-=enoa:<f--J~
~tIl
314+00
IIJ-IenI
•
•
~1r-~~IIrI'-Iji10-I!~I..l!I~I~tr~t-II!iI...I;LI
~I,
•
•
-20-2. STABILITY ANALYSES OF THE 1-95 TEST SECTION
2.1 SUBSURFACE CONDITIONS AND SOIL PROPERTIES
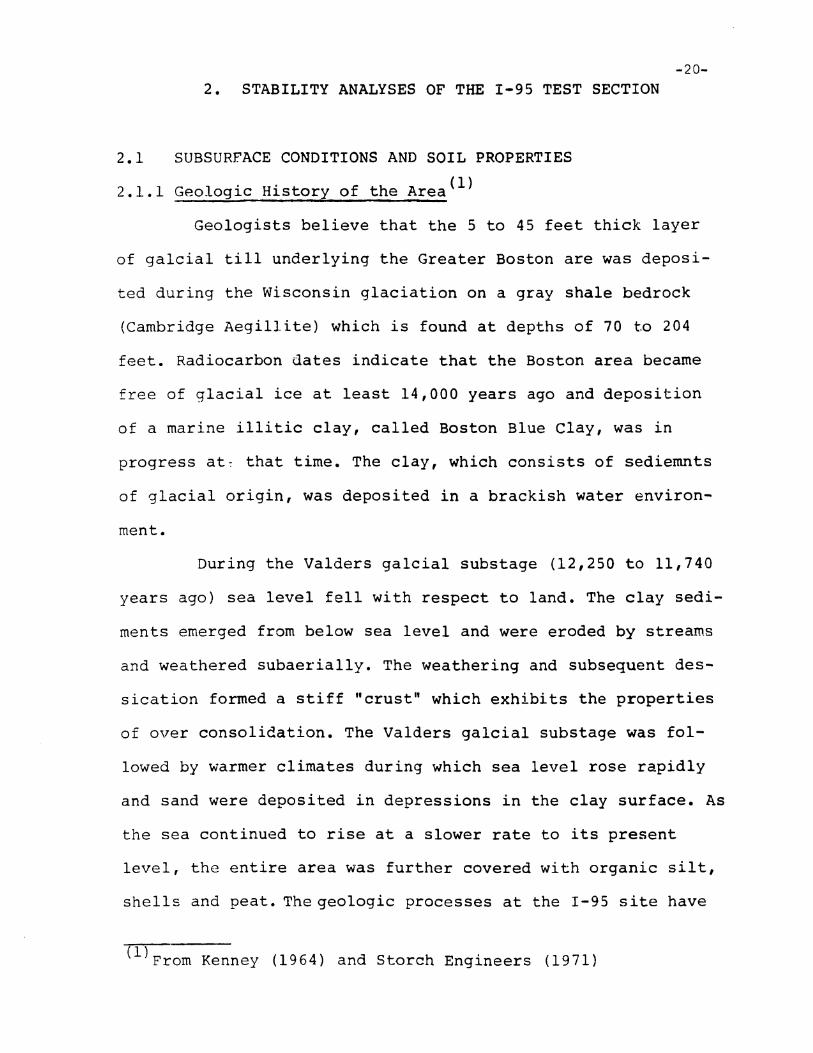
2.1.1 Geologic History of the Area(1)
Geologists believe that the 5 to 45 feet thick layer
of galcial till underlying the Greater Boston are was deposi
ted during the Wisconsin glaciation on a gray shale bedrock
(Cambridge Aegillite) which is found at depths of 70 to 204
feet. Radiocarbon dates indicate that the Boston area became
free of glacial ice at least 14,000 years ago and deposition
of a marine illitic clay, called Boston Blue Clay, was in
progress at: that time. The clay, which consists of sediemnts
of glacial origin, was deposited in a brackish water environ
ment.
During the Valders galcial substage (12,250 to 11,740
years ago) sea level fell with respect to land. The clay sedi
ments emerged from below sea level and were eroded by streams
and weathered subaerially. The weathering and subsequent des
sication formed a stiff "crust" which exhibits the properties
of over consolidation. The Valders galcial substage was fol
lowed by warmer climates during which sea level rose rapidly
and sand were deposited in depressions in the clay surface. As
the sea continued to rise at a slower rate to its present
level, the entire area was further covered with organic silt,
shells and peat. The geologic processes at the 1-95 site have
(1)From Kenney (1964) and Storch Engineers (1971)

•
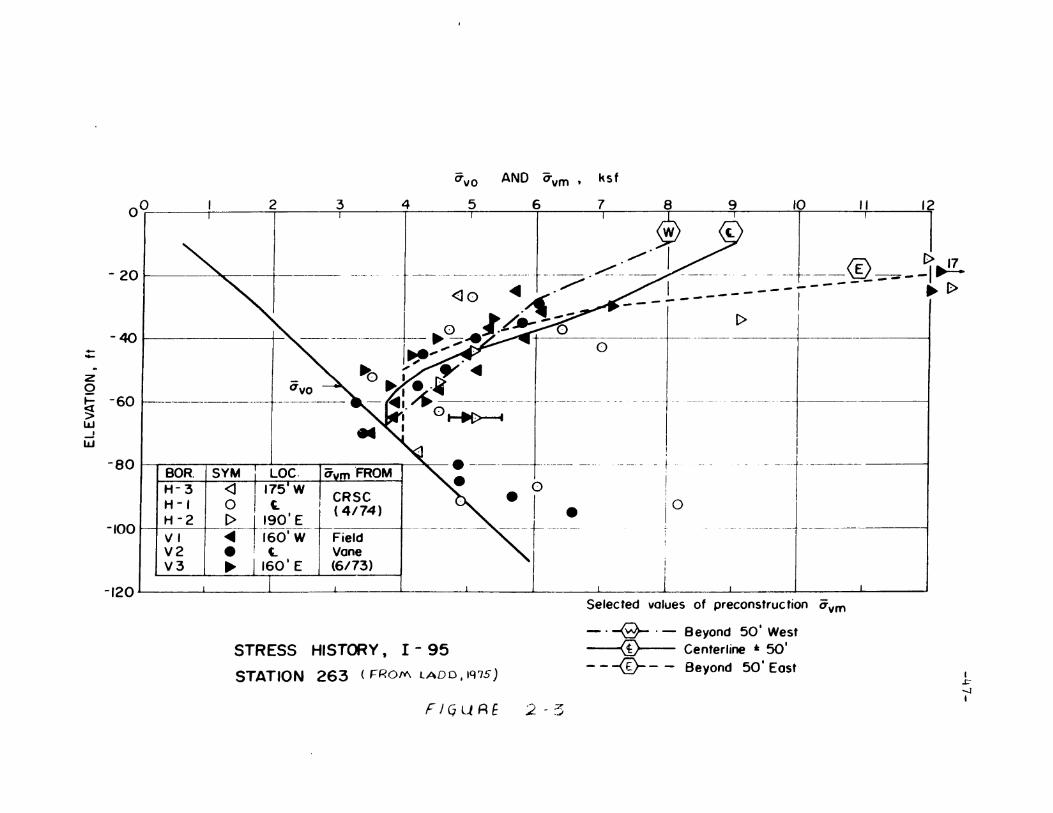
-21produced a deposit with a very complex stress history. The
stiff crust is underlain by a clay layer of varying but gen-
erally decreasing overconsolidation with depth. As shown in
Fig. 2-3, the clay becomes normally consolidated at around
elevation -70 ft. A g2neralized soil profile at Station 263 is
shown in Figure 1-3 together with a cross secti.on of the ori-
gina1 40 feet high embankment.
2.1.2 Soil Properties
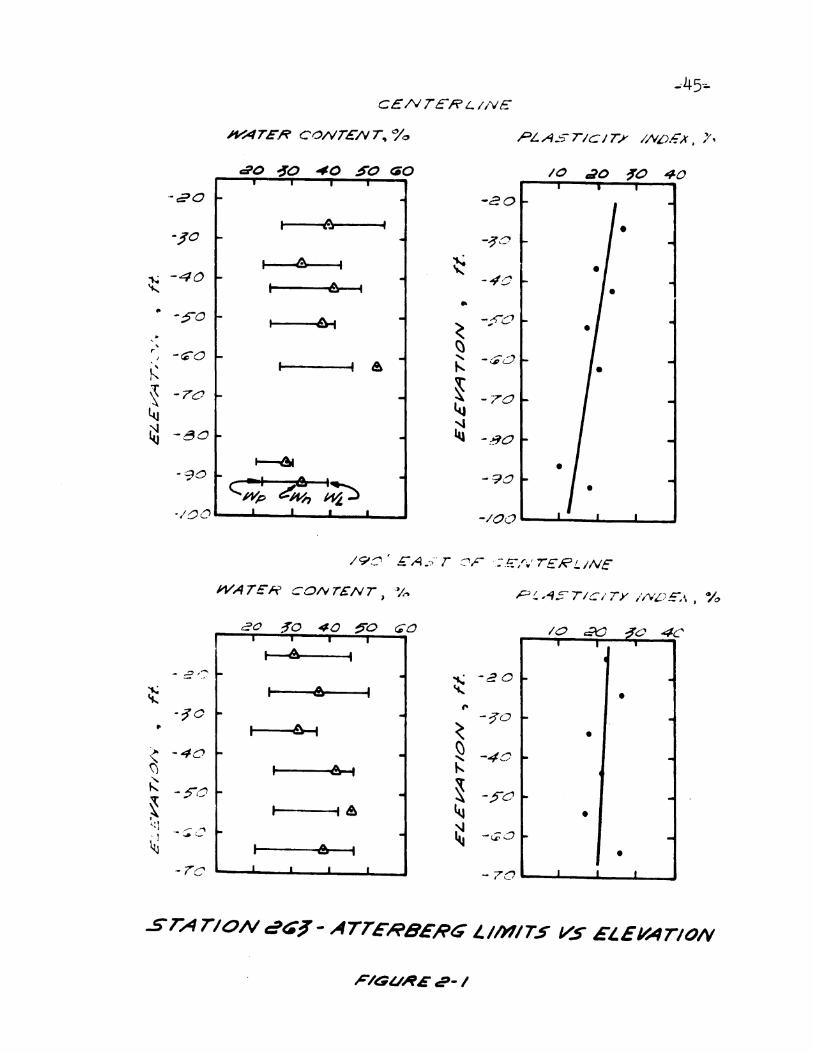
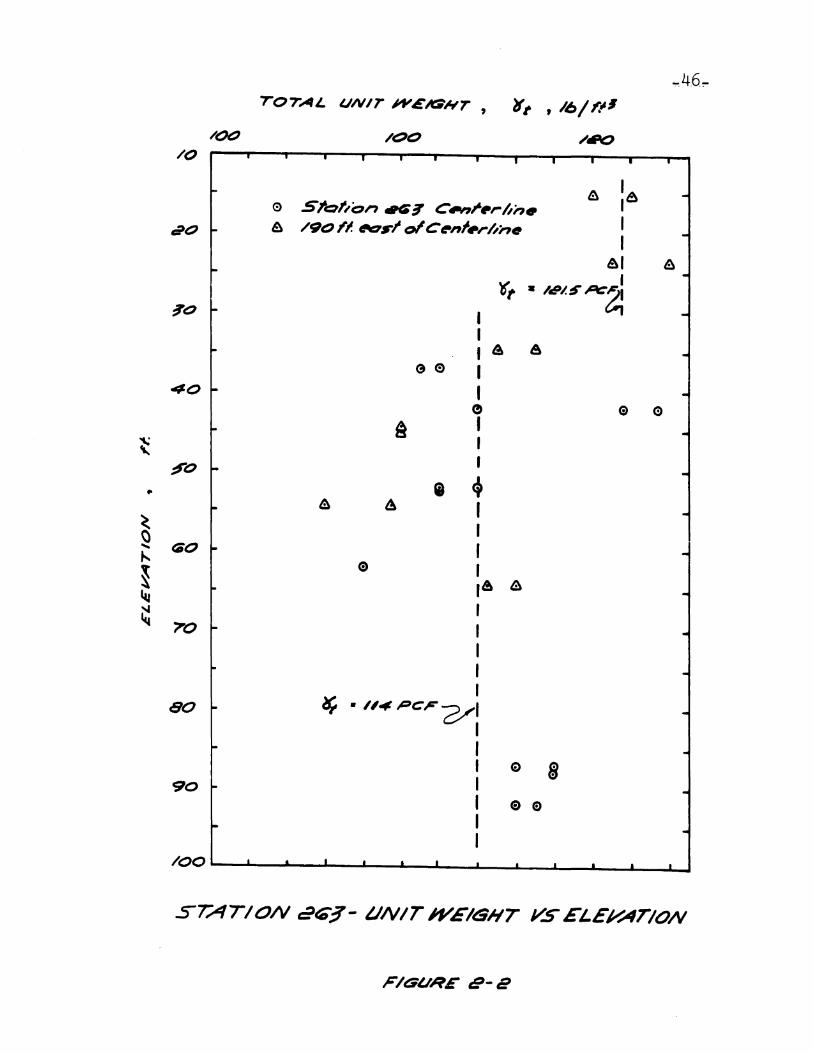
Boston Blue Clay Figures 2-1 and 2-2 present plots
of Atterberg Limits, water content (w) and total unit weight
(Yt
) with depth. Tests were performed on samples obtained from
borings at the centerline of the embankment (boring H-!) and
at 190 ft right of the centerline (boring H-2) as shown in
Figure 1-3. Thesarnpleswere taken during April 1974, about 5
months prior to the start of loading. Average total unit weight
values of 121 e 5 ib/ft3 for clay above elevation -30 ft and 114.0
ib/ft 3 for that below -30 ft were used in all the stability
analyses performed. The maximum past pressure of the clay de-
posit,determined from the April 1974 samples, is presented in
Fi!ure 2-3. The M.I.T. constant rate of strain consolidometer
(Wissa et aI, 1971) was used for the consolidation tests and
maximum past pressures were obtained by the Casagrande method.
Detailed information on the strength characteristics of the
clay are given in subsequent sections where the different
types of stability analyses are discussed.
•
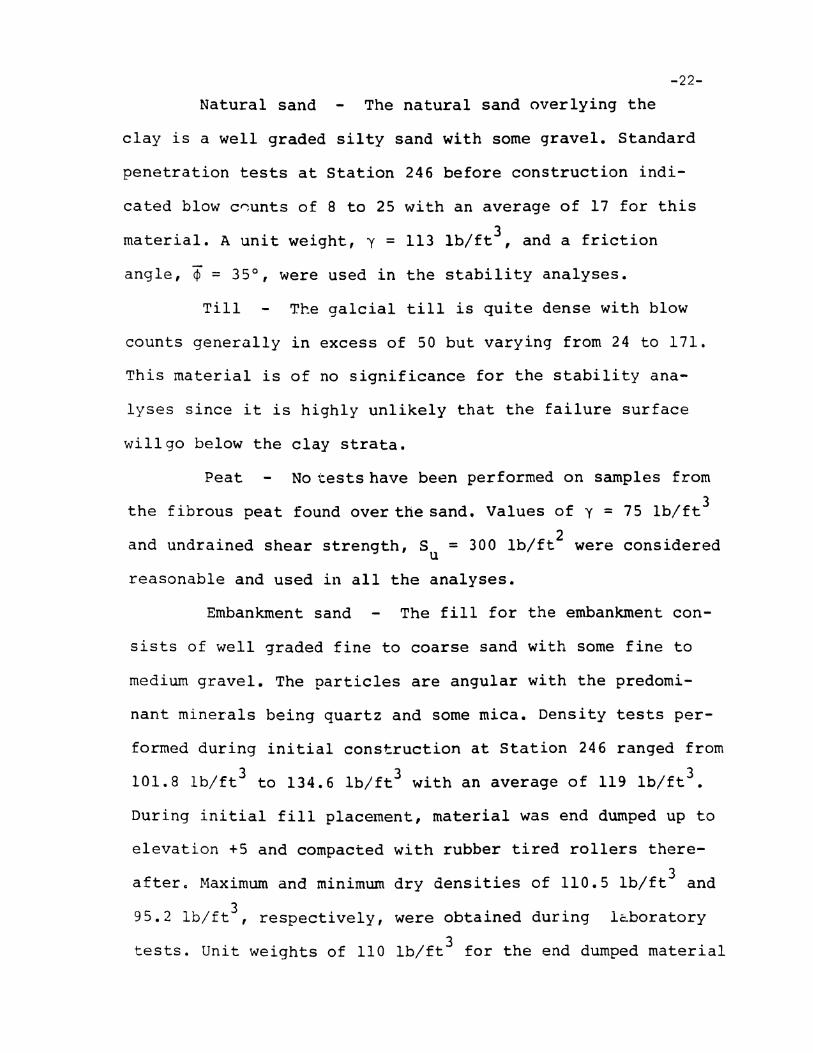
Natural sand The natural sand overlying the
-22-
clay is a well graded silty sand with some gravel. Standard
penetration tests at Station 246 before construction indi-
cated blow c~unts of 8 to 25 with an average of 17 for this
material. A unit weight, y = 113 Ib/ft3 , and a friction
angle, ¢ = 35°, were used in the stability analyses.
Till T~e galcial till is quite dense with blow
counts generally in excess of 50 but varying from 24 to 171.
This material is of no significance for the stability ana-
lyses since it is highly unlikely that the failure surface
willgo below the clay strata.
Peat No tests have been performed on samples from
the fibrous peat found over the sand. Values of y = 75 Ib/ft3
and undrained shear strength, S = 300 Ib/ft2
were consideredu
reasonable and used in all the analyses.
Embankment sand The fill for the embankment con-
sists of well graded fine to coarse sand with some fine to
medium gravel. The particles are angular with the predomi-
nant minerals being quartz and some mica. Density tests per-
formed during initial construction at Station 246 ranged from
101.8 lb/ft3 to 134.6 1b/ft3 with an average of 119 Ib/ft3 •
During initial fill placement, material was end dumped up to
elevation +5 and compacted with rubber tired rollers there
after. Maximum and minimum dry densities of 110.5 Ib/ft3 and
95.2 Ib/ft3 , respectively, were obtained during l~boratory
tests. Unit weights of 110 Ib/ft3 for the end dumped material
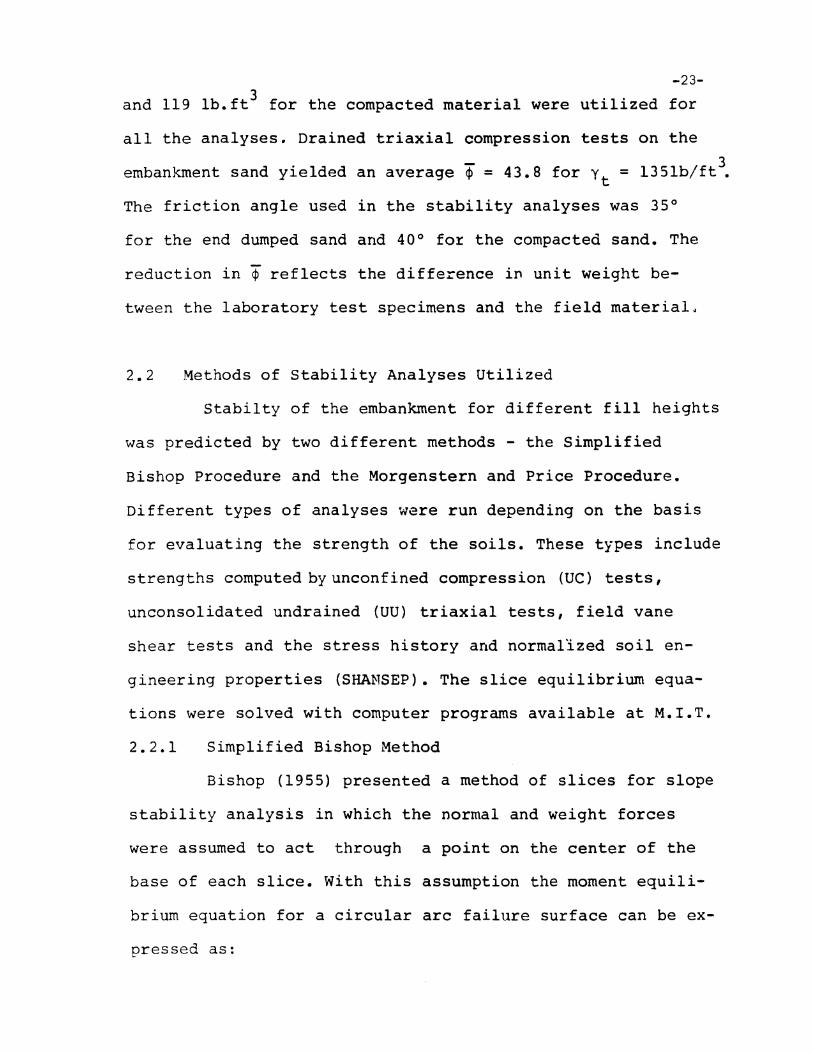
-23-3and 119 lb.ft for the compacted material were utilized for
all the analyses. Drained triaxial compression tests on the
embankment sand yielded an average ~ = 43.8 for Yt = 135lb/ft~
The friction angle used in the stability analyses was 35°
for the end dumped sand and 40° fo~ the compacted sand. The
reduction in ¢ reflects the difference in unit weight be-
tween the laboratory test specimens and the field material~
2.2 Methods of Stability Analyses Utilized
Stabilty of the embankment for different fill heights
was predicted by two different methods - the Simplified
Bishop Procedure and the Morgenstern and Price Procedure.
Different types of analyses were run depending on the basis
for evaluating the strength of the soils. These types include
strengths computed by unconfined compression (UC) tests,
unconsolidated undrained (UU) triaxial tests, field vane
shear tests and the stress history and normalIzed soil en-
gineering properties (SHANSEP). The slice equilibrium equa-
tions were solved with computer programs available at M.I.T.
2.2.1 Simplified Bishop Method
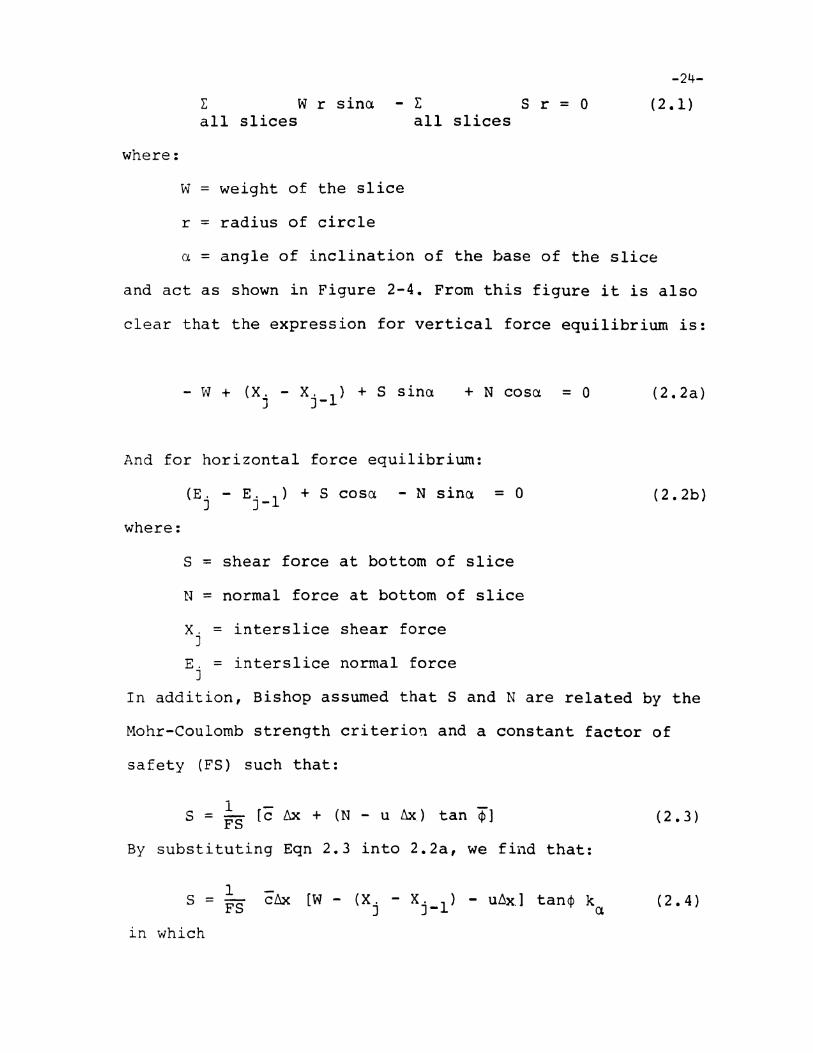
Bishop (1955) presented a method of slices for slope
stability analysis in which the normal and weight forces
were assumed to act through a point on the center of the
base of each slice. With this assumption the moment equili-
brium equation for a circular arc failure surface can be ex-
pressed as:
•
where:
~ W r sinaall slices
L S r = 0all slices
-24
(2.1 )
W = weight of the slice
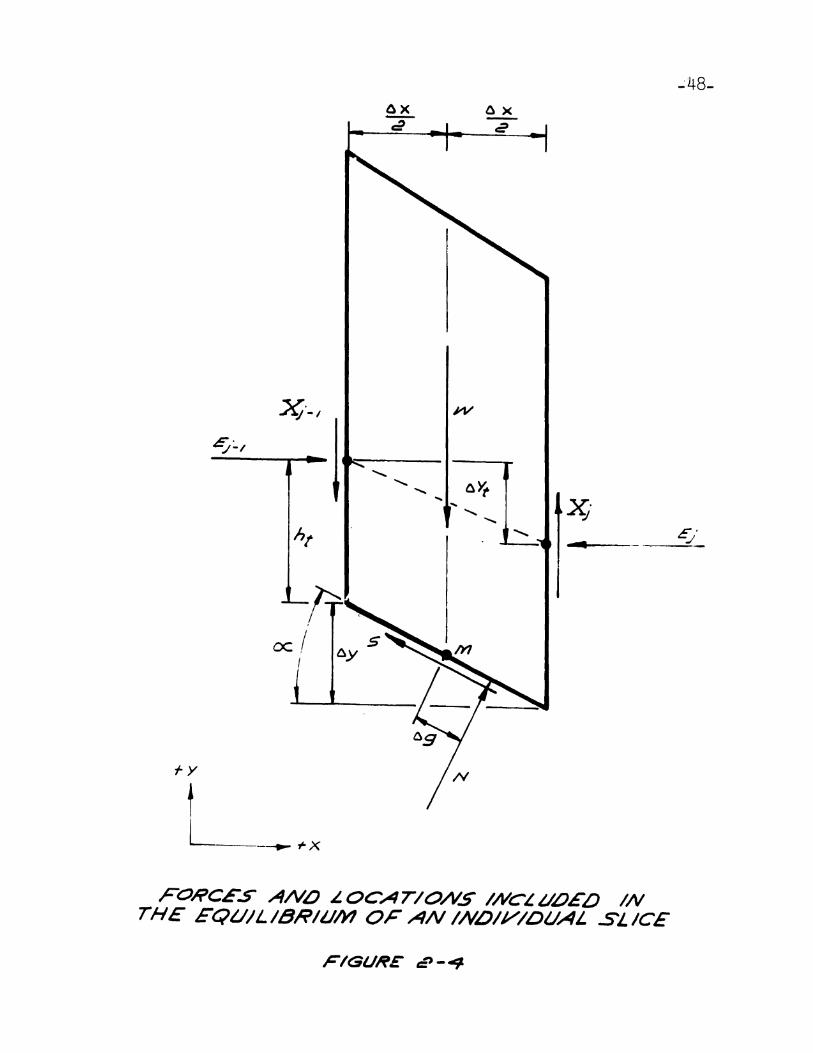
r = radius of circle
a = angle of inclination of the base of the slice
and act as shown in Figure 2-4. From this figure it is also
clear that the expression for vertical force equilibrium is:
- W + (XI - X. 1) + S sinnJ J-
+ N easa = a (2.2a)
And for horizontal force equilibrium:
(E. - EI 1) + S cosa - N sina = 0J J-
where:
S = shear force at bottom of slice
N = normal force at bottom of slice
(2.2b)
X. = interslice shear force]
E. = interslice normal force]
In addition, Bishop assumed that Sand N are related by the
Mohr-Coulomb strength criterion and a constant factor of
safety (FS) such that:
s = 1 [c /:,x + (N - u ~) tan ¢]FS
By substituting Eqn 2.3 into 2.2a, we find that:
(2.3)
1S = FS
in which
(2 • 4)
k secCl=1 + tana. tan<p
FS
-25-
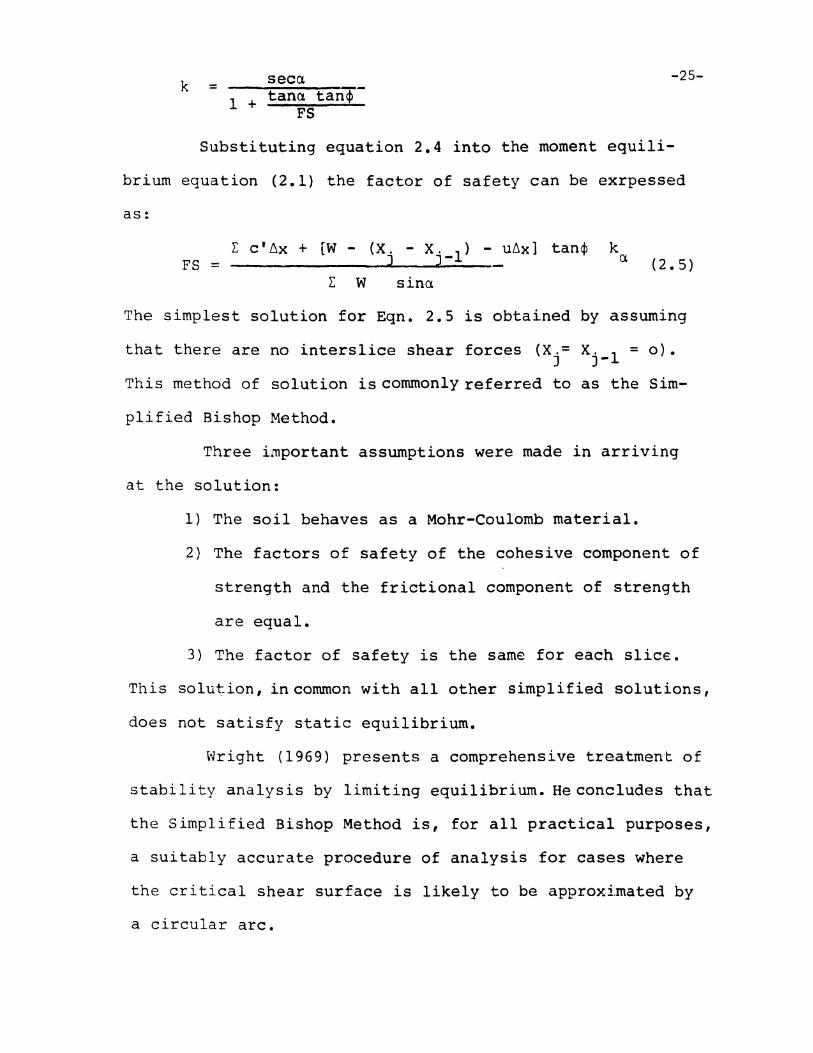
Substituting equation 2.4 into the moment equili-
briurn equation (2.1) the factor of safety can be exrpessed
as:
FS =L c'~x + [W - (X. - x. 1) - u~x] tan~
) J-
L W sina
k(),
(2 • 5)
The simplest solution for Eqn. 2.5 is obtained by assuming
that there are no interslice shear forces (X.= X. 1 = 0).J J-
This method of solution is commonly referred to as the Sim-
plified Bishop Method.
Three important assumptions were made in arriving
at the solution:
1) The soil behaves as a Mohr-Coulomb material.
2) The factors of safety of the cohesive component of
strength and the frictional component of strength
are equal.
3} The factor of safety is the same for each slice.
This solu~ion, in common with all other simplified solutions,
does not satisfy static equilibrium.
Wright (1969) presents a comprehensive treatment of
stability analysis by limiting equilibrium. He concludes that
the Simplified Bishop Method is, for all practical purposes,
a suitably accurate procedure of analysis for cases where
the cri tical shear surface is likely to be approxi.rnated by
a circular arc.
•
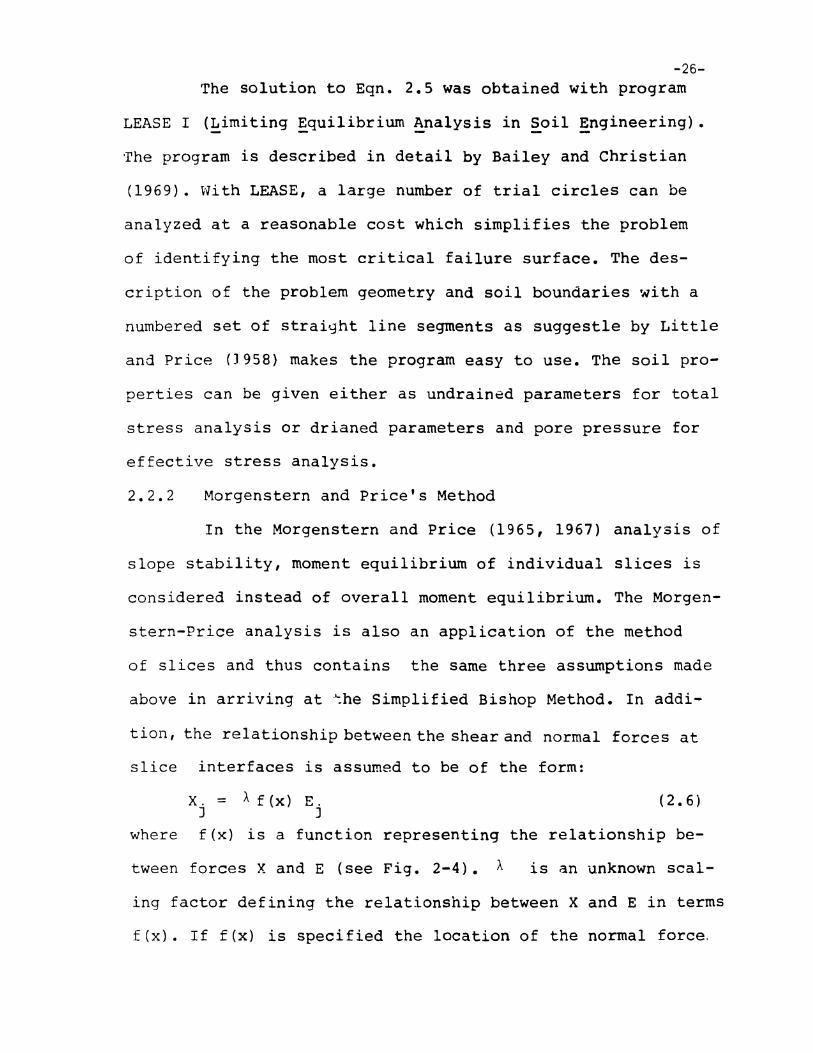
-26The solution to Eqn. 2.5 was obtained with program
LEASE I (~imiting ~quilibrium Analysis in Soil Engineering).
Irhe program is described in detail by Bailey and Christian
(1969). With LEASE, a large number of trial circles can be
analyzed at a reasonable cost which simplifies the problem
of identifying the most critical failure surface. The des-
cription of the problem geometry and soil boundaries with a
numbered set of straight line segments as suggestle by Little
and Price (1958) makes the program easy to use. The soil pro-
perties can be given either as undrained parameters for total
stress analysis or drianed parameters and pore pressure for
effective stress analysis.
2.2.2 Morgenstern and Price's Method
In the Morgenstern and Price (1965, 1967) analysis of
slope stability, moment equilibrium of individual slices is
considered instead of overall moment equilibrium. The Morgen-
stern-Price analysis is also an application of the method
of slices and thus contains the same three assumptions made
above in arriving at ~he Simplified Bishop Method. In addi-
tion, the relationship between the shear and normal forces at
slice interfaces is assumed to be of the form:
X. = Af(x) E. (2.6)J J
where f(x) is a function representing the relationship be-
tween forces X and E (see Fig. 2-4). A is an unknown scal-
ing factor defining the relationship between X and E in terms
f(x). If f(x) is specified the location of the normal force.

-27
on the base of each slice is fixed and the problem becomes
statically determinate. A and the factor of safety with re-
spect to shear strength, FS, are then found from a solution
of the differential equations that satisfy the appropriate
boundary conditions.
From Fig. 2-4, the moment equilibrium equation about
point Mis:
Xj _1 ~X + (X j - Xj_l)~X + Ej _1 ~Yt
~y+ (E j - E j _1 ) (ht + ~Yt + ~
+ (NL1g) = 0
Eqn. 2 w 7 can be expressed as:
(2 • 7)
-x =: E dYt + htdX
dE
dX(2 • 8)
The soluLion to this differential equation for moment equili-
brium and to the force equilibrium equations (Eqn.2.2j yielu5
the required answer.
The advantage of the Morgenstern and Price Method
is that the analysis of non circular failure surfaces is made
much simpler ~y considering the moment equilibrium of each
individual sli~e. Several examples of analysis of non-cir-
cular surfaces will be presented in section 2.6.2. These were
analyzed with the aid of computer program MGSTRN (Madera 1969).
2.2.3 Procedure for Predicting Maximum Embankment Height
with Limiting Equilibrium Analysis
The approach to predicting the maximum embankment
height is the same with either LEASE or MGSTRN. Both programs
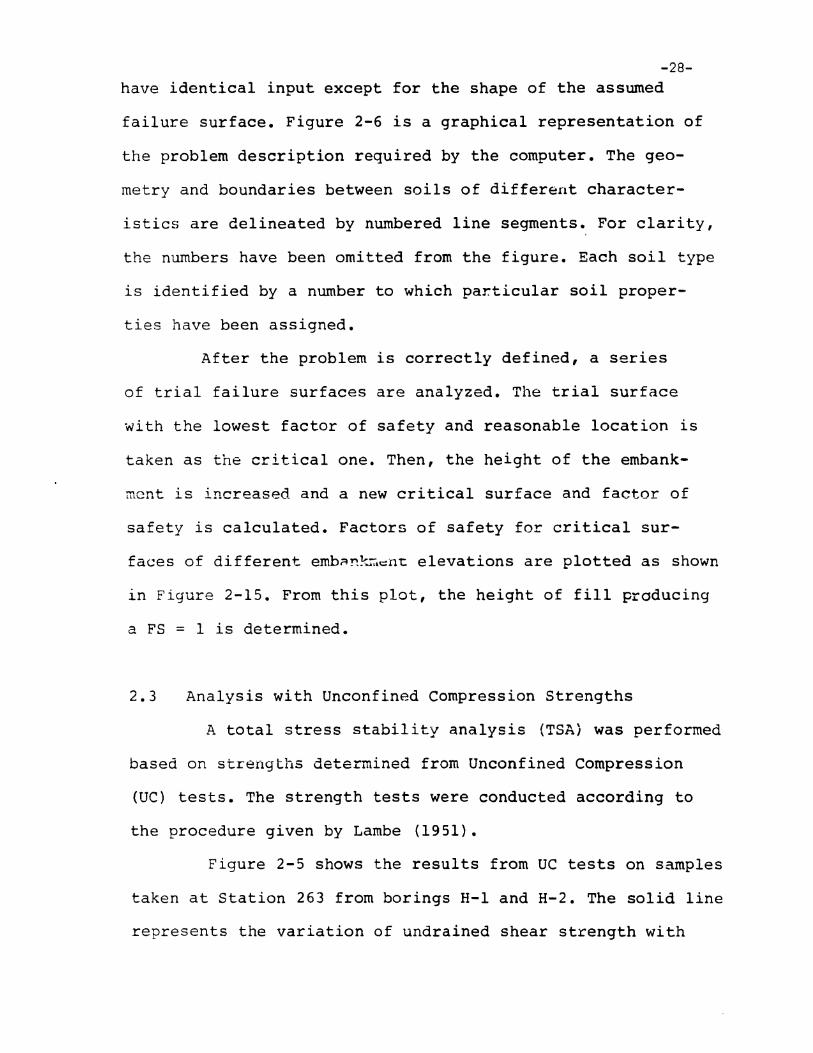
-28have identical input except for the shape of the assumed
failure surface. Figure 2-6 is a graphical representation of
the problem description required by the computer. The geo-
metry and boundaries between soils of different character-
istics are delineated by numbered line segments. For clarity,
the numbers have been omitted from the figure. Each soil type
is identified by a number to which particular soil proper-
ties have been assigned.
After the problem is correctly defined, a series
of trial failure surfaces are analyzed. The trial surface
with the lowest factor of safety and reasonable location is
taken as the critical one. Then, the height of the embank-
mcnt is increased and a new critical surface and factor of
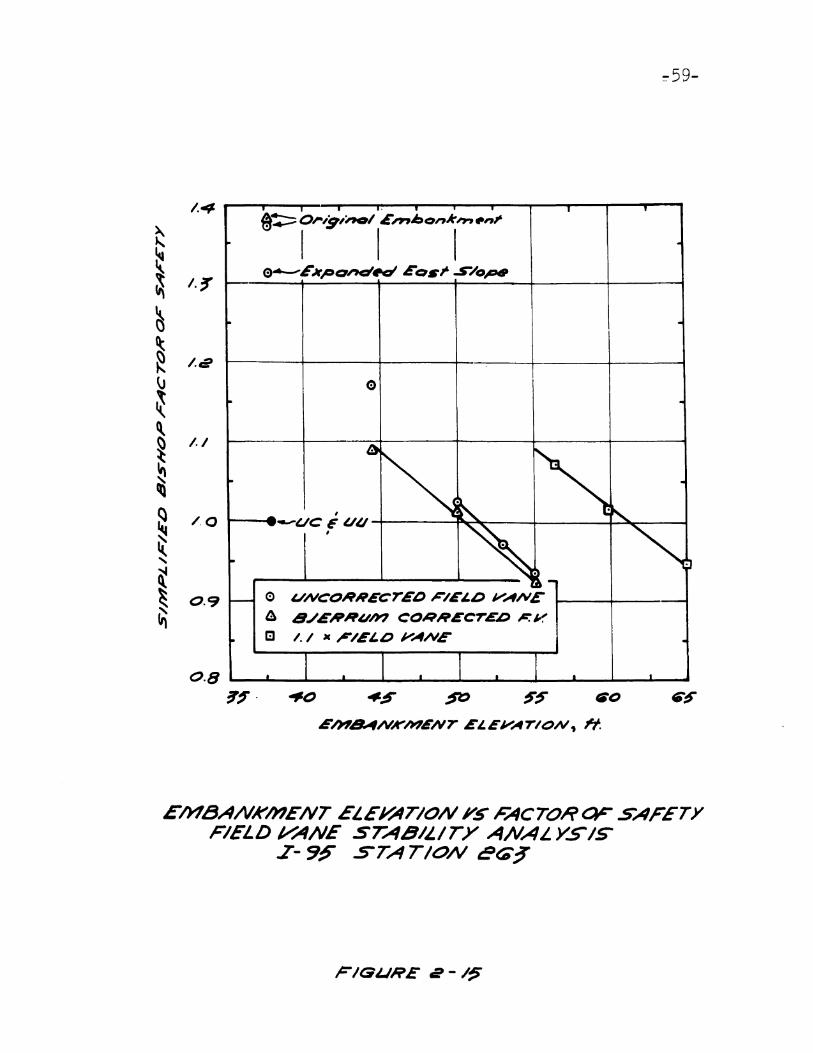
safety is calculated. Factors of safety for critical sur-
faces of different emb~~~~,~nt elevations are plotted as shown
in Figure 2-15. From this plot, the height of fill producing
a FS = 1 is determined.
2.3 Analysis with Unconfined Compression Strengths
A total stress stability analysis (TSA) was performed
based on strengths determined from Unconfined Compression
(UC) tests. The strength tests were conducted according to
the procedure given by Lambe (1951).
Figure 2-5 shows the results from UC tests on samples
taken at Station 263 from borings H-l and H-2. The solid line
represents the variation of undrained shear strength with
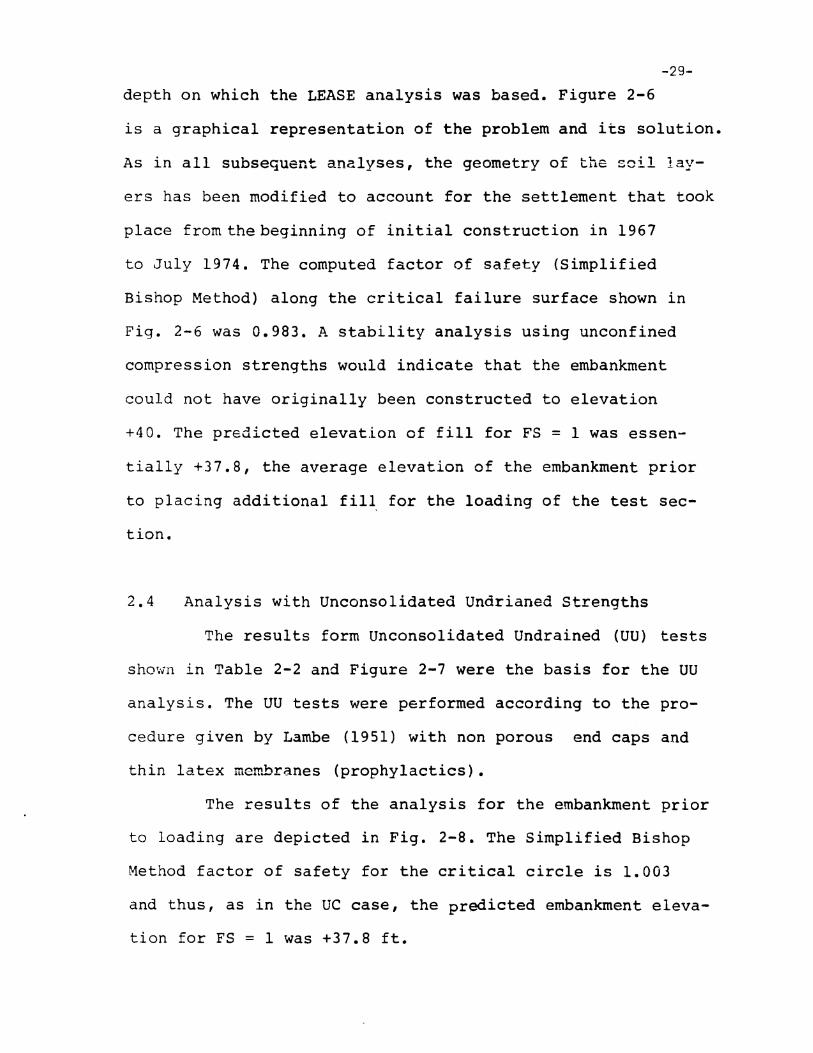
-29
depth on which the LEASE analysis was based. Figure 2-6
is a graphical representation of the problem and its solution.
As in all subsequent analyses, the geometry of the soil lay
ers has been modified to account for the settlement that took
place from the beginning of initial construction in 1967
to July 1974. The computed factor of safety (Simplified
Bishop Method) along the critical failure surface shown in
Fig. 2-6 was 0.983. A stability analysis using unconfined
compression strengths would indicate that the embankment
could not have originally been constructed to elevation
+40. The predicted elevation of fill for FS = 1 was essen
tially +37.8, the average elevation of the embankment prior
to placing additional fill for the loading of the test sec
tion.
2.4 Analysis with Unconsolidated Undrianed Strengths
The results form Unconsolidated Undrained (UU) tests
shown in Table 2-2 and Figure 2-7 were the basis for the UU
analysis. The UU tests were performed according to the pro
cedure given by Lambe (1951) with non porous end caps and
thin latex membranes (prophylactics).
The results of the analysis for the embankment prior
to loading are depicted in Fig. 2-8. The Simplified Bishop
Method factor of safety for the critical circle is 1.003
and thus, as in the UC case, the predicted embankment eleva
tion for FS = 1 was +37.8 ft.
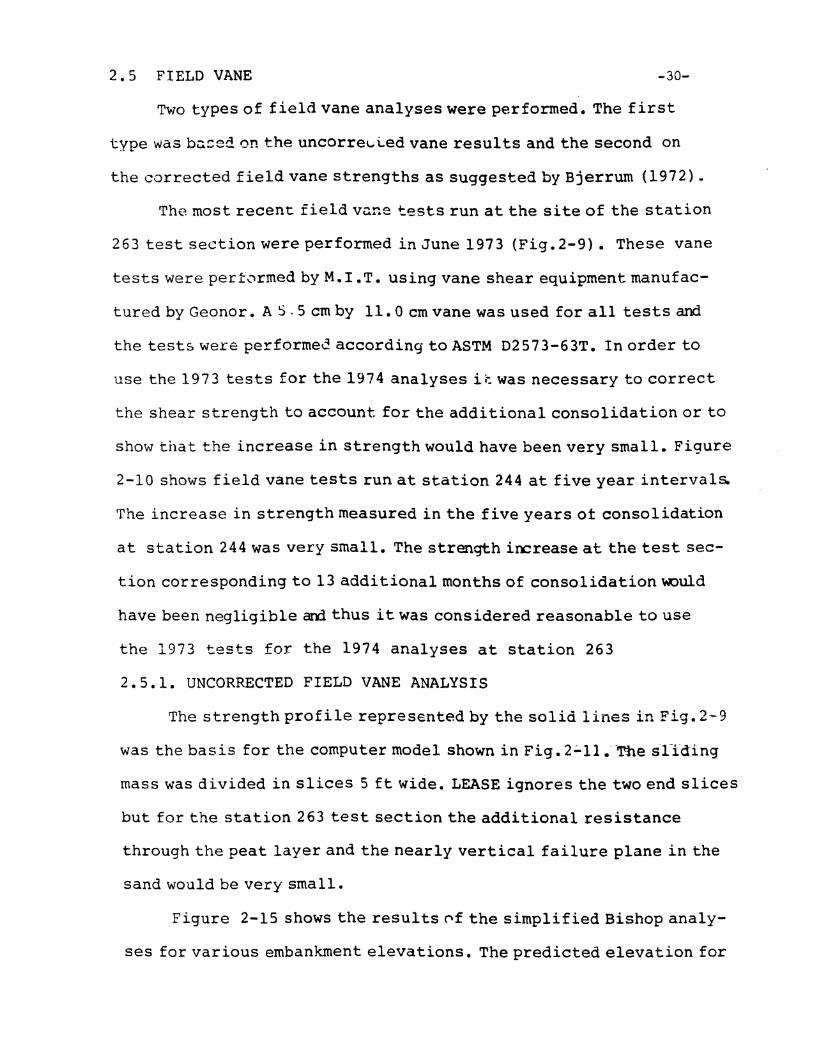
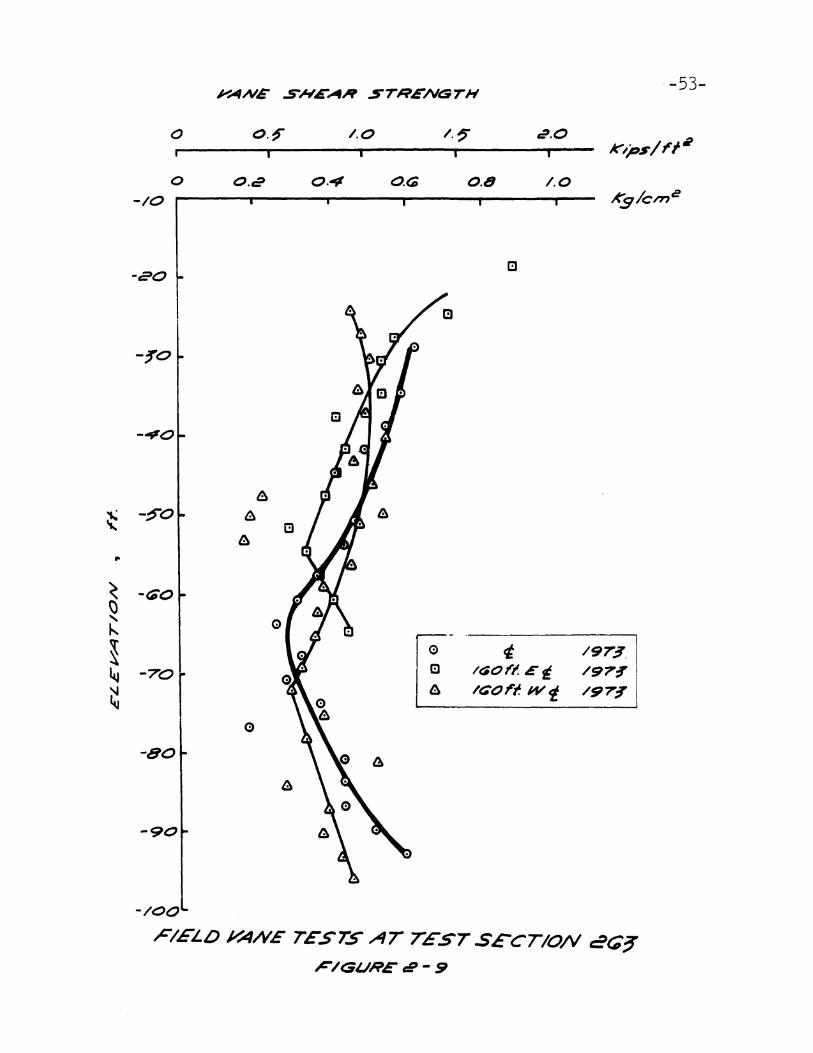
2.5 FIELD VANE -30-
Two types of field vane analyses were performed. The first
type was bc.::ed on the uncorre\;\';'ed vane results and the second on
the corrected field vane strengths as suggested by Bjerrum (1972) •
The most recent field VClne tests run at the site of the station
263 test section were performed in June 1973 (Fig.2-9). These vane
tests were pert<0rmed by M. I •T. using vane shear equipment manufac
tured by Geono~. AS, 5 em by 11. 0 em vane was used for all tests and
the tests were performed according to ASTM D2573-63T. In order to
use the 1973 tests for the 1974 analyses it was necessary to correct
the shear strength to account for the additional consolidation or to
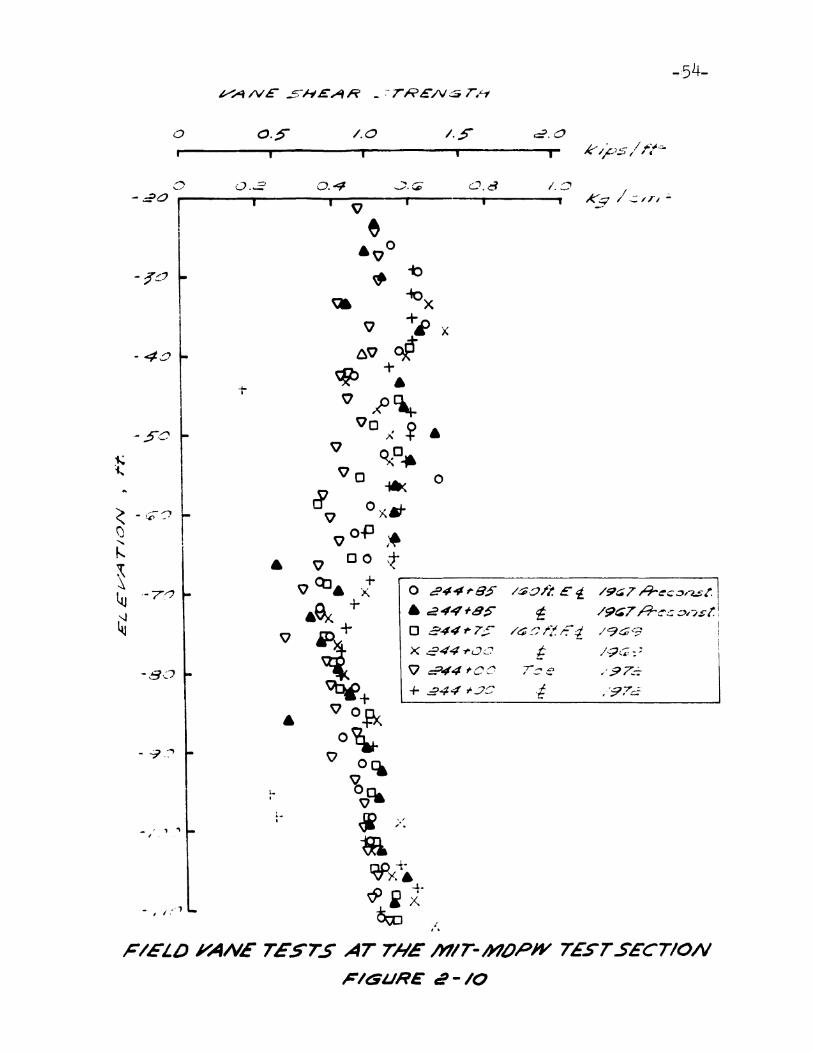
show that the increase in strength would have been very small. Figure
2-10 shows field vane tests run at station 244 at five year intervals.
The increase in strength measured in the five years ot consolidation
at station 244 was very small. The strength iI¥::rease at the test sec
tion corresponding to 13 additional months of consolidation Y«)uld
have been negligible arrl thus it was considered reasonable to use
the 1973 tests for the 1974 analyses at station 263
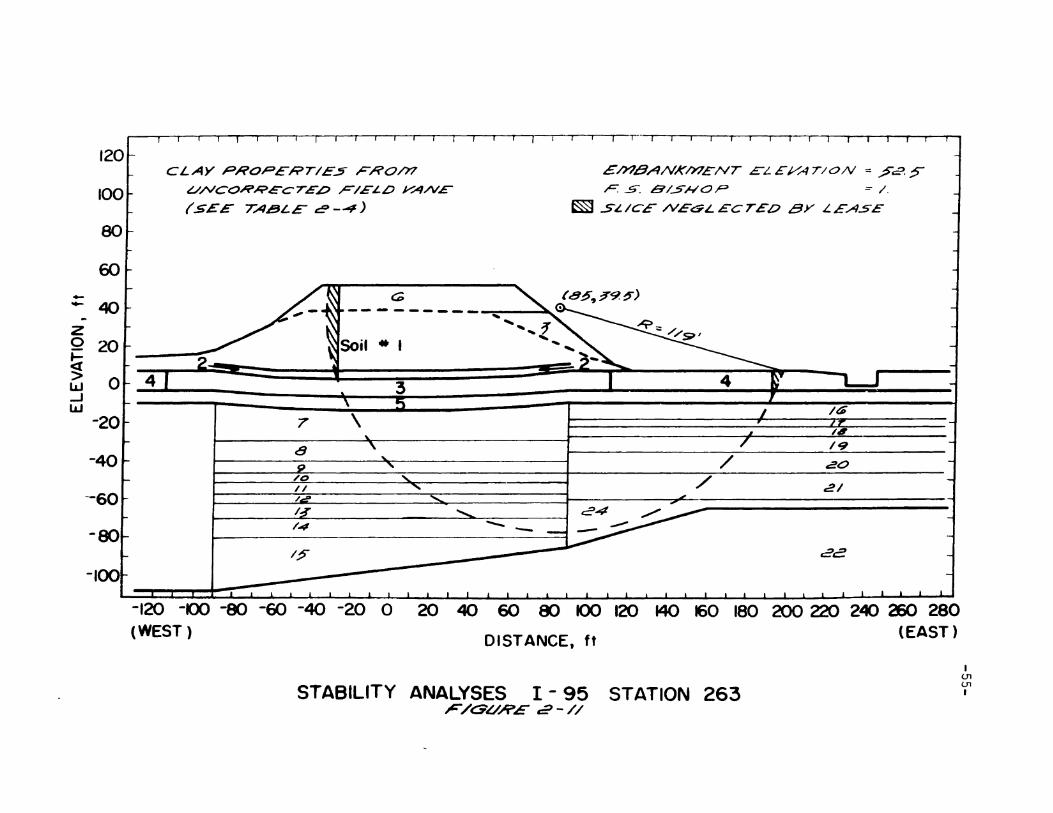
2.5.1. UNCORRECTED FIELD VANE ANALYSIS
The strength profile represented by the solid lines in Fig. 2~9
was the basis for the computer model shown in Fig. 2;'ll.~-The s'l~i'd:ing
mass was divided in slices 5 ft wide. LEASE ignores the two end slices
but for the station 263 test section the additional resistance
through the peat layer and the nearly vertical failure plane in the
sand would be very small.
Figure 2-15 shows the results ('f the simplified Bishop analy
ses for various embankment elevations. The predicted elevation for
-31FS=l is 52.5 ft with the failure surface shown in Figure 2-11.
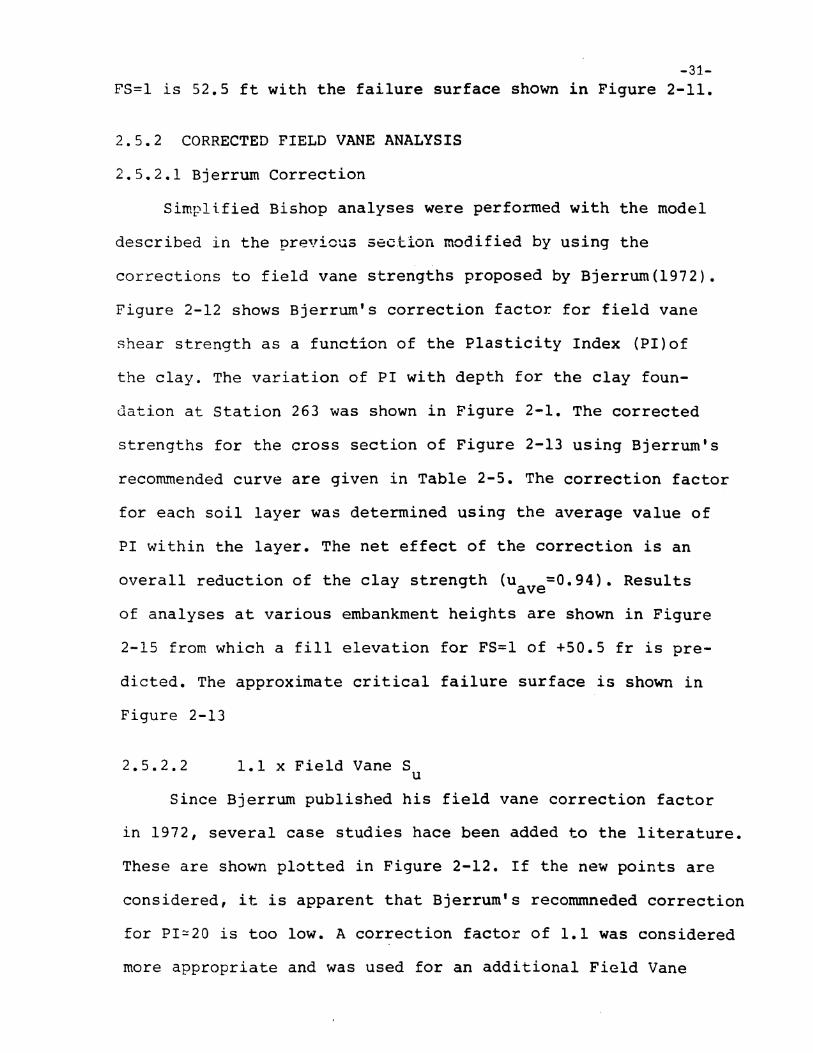
2.5.2 CORRECTED FIELD VANE ANALYSIS
2.5.2.1 Bjerrum Correction
Simplified Bishop analyses were performed with the model
described in the previous seciion modified by using the
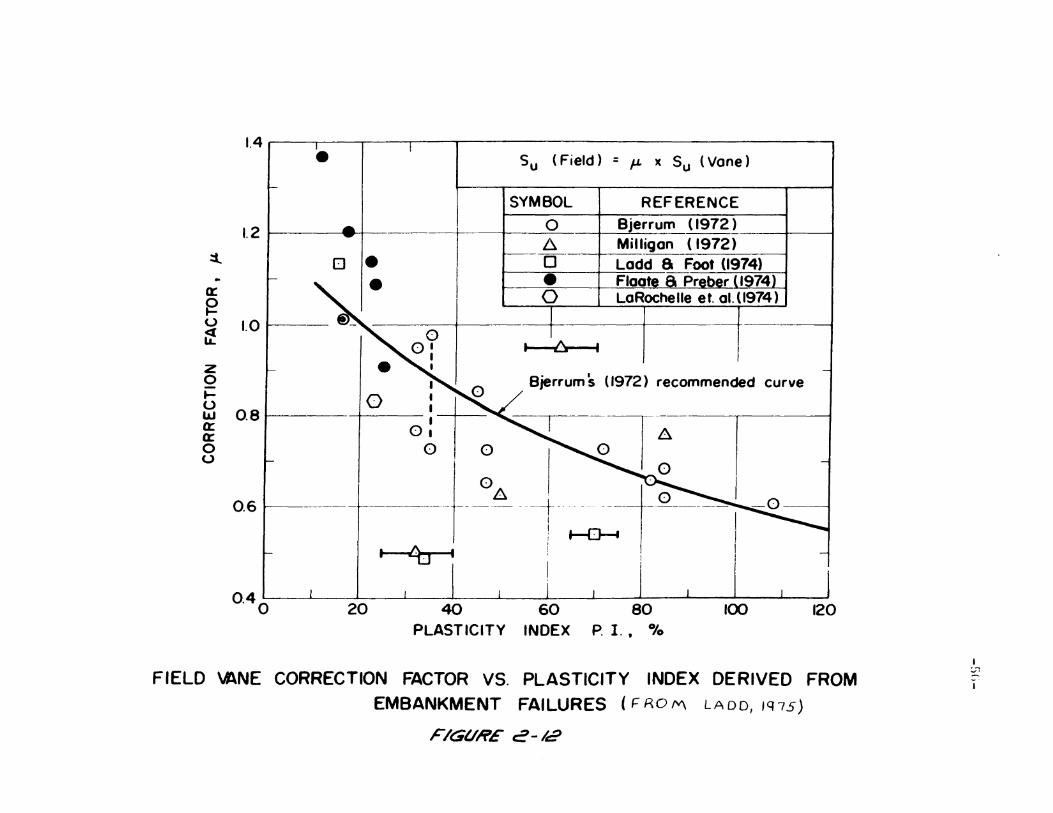
corrections to field vane strengths proposed by Bjerrum(1972).
Figure 2-12 shows Bjerrum's correction factor for field vane
shear strength as a function of the Plasticity Index (PI)of
the clay. The variation of PI with depth for the clay foun-
dation at station 263 was shown in Figure 2-1. The corrected
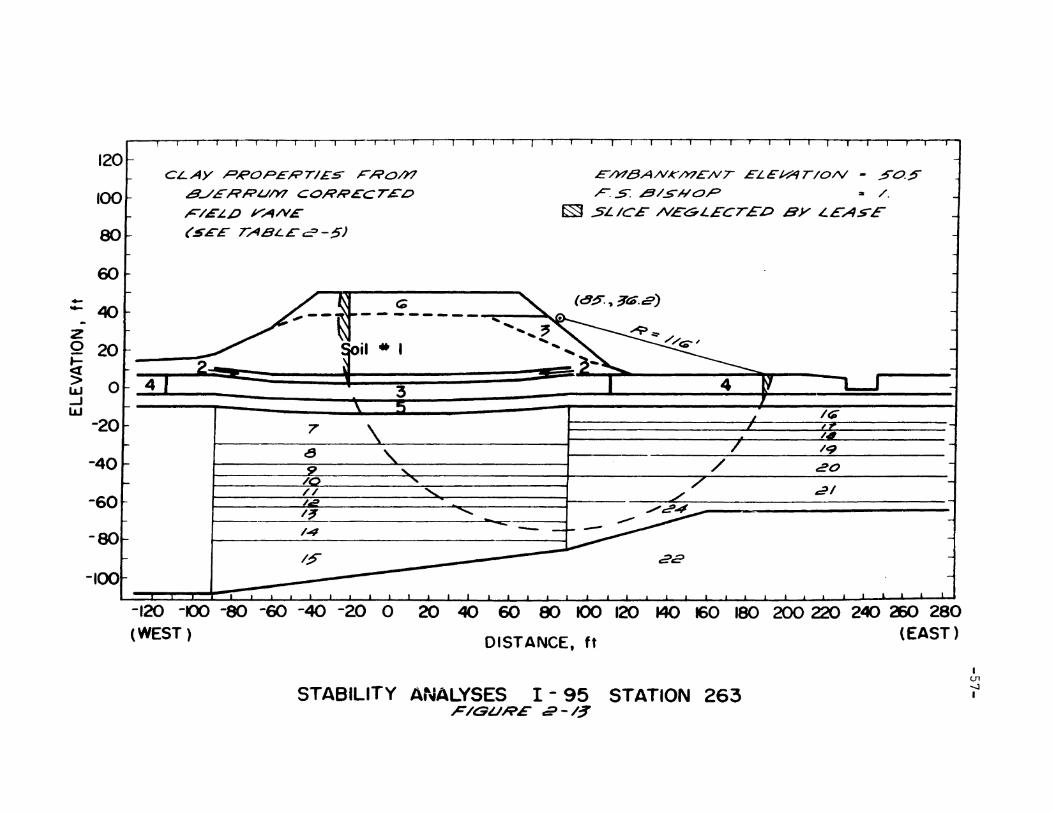
strengths for the cross section of Figure 2-13 using Bjerrum's
recommended curve are given in Table 2-5. The correction factor
for each soil layer was determined using the average value of
PI within the layer. The net effect of the correction is an
overall reduction of the clay strength (u =0.94). Resultsave
of analyses at various embankment heights are shown in Figure
2-15 from which a fill elevation for FS=l of +50.5 fr is pre-
dieted. The approximate critical failure surface is shown in
Figure 2-13
2.5.2.2 1.1 x Field Vane Su
Since Bjerrum published his field vane correction factor
in 1972, several case studies hace been added to the literature.
These are shown plotted in Figure 2-12. If the new points are
considered, it is apparent that Bjerrum's recommneded correction
for PI~20 is too low. A correction factor of 1.1 was considered
more appropriate and was used for an additional Field Vane
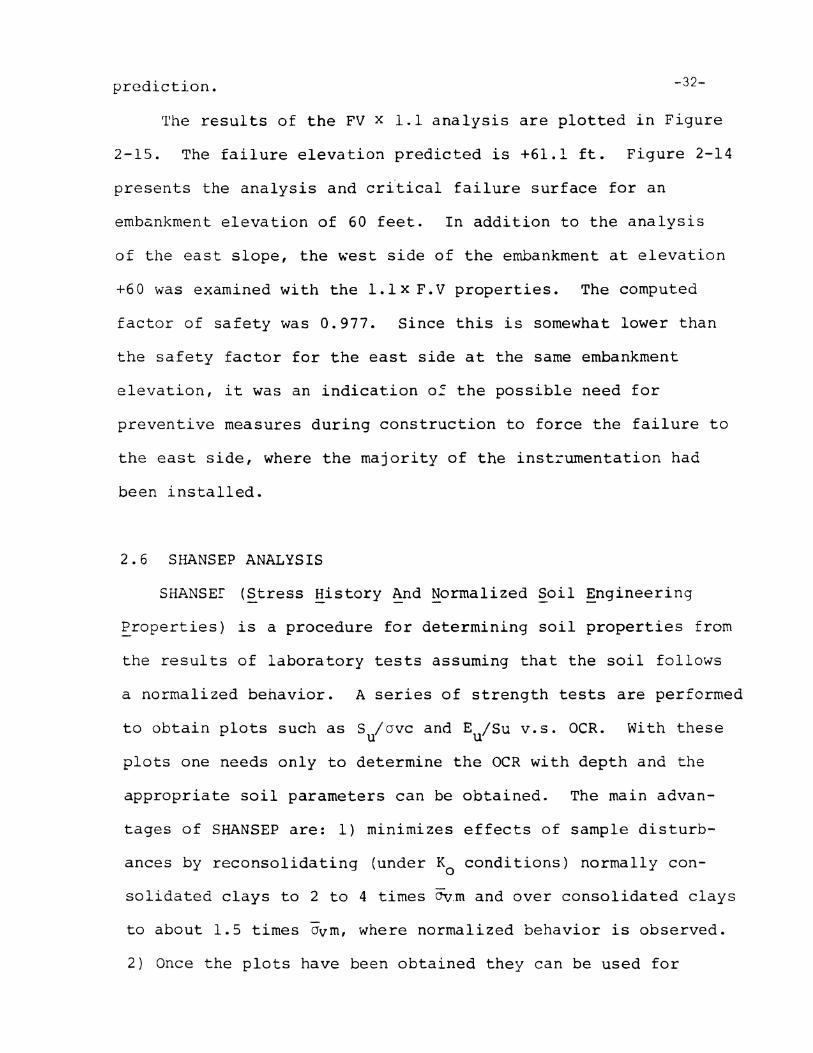
•
prediction. -32-
-
Ii
I
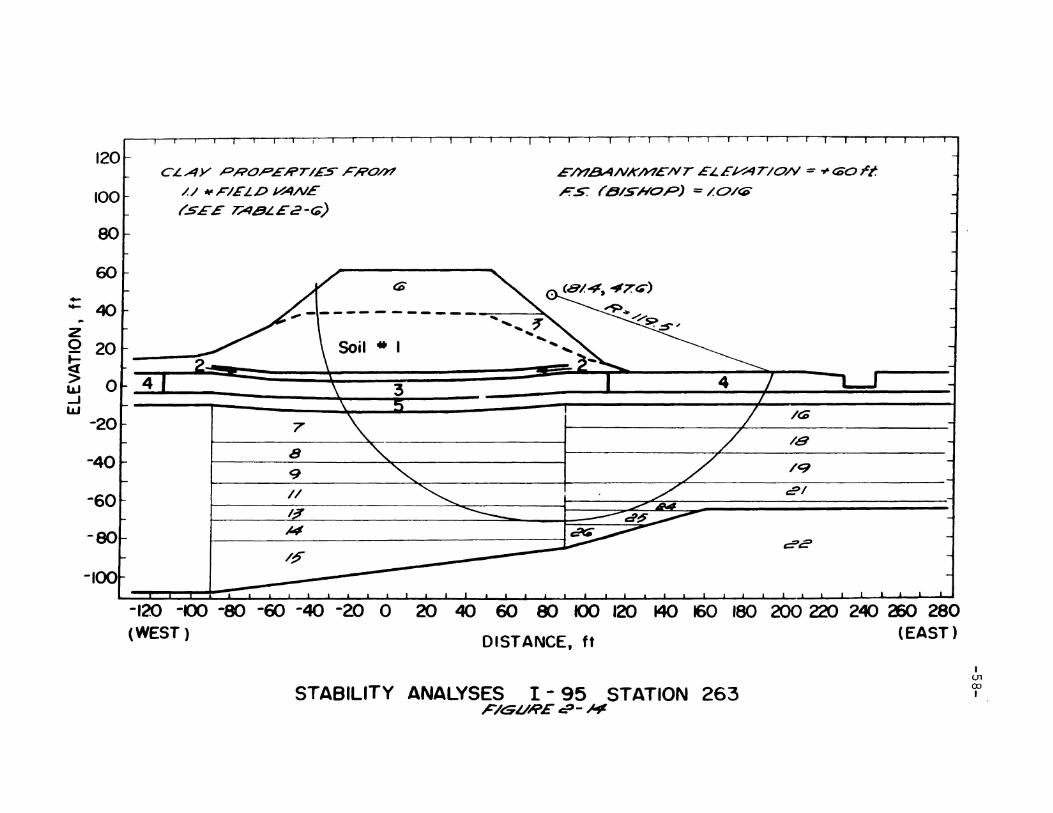
The results of the FV x 1.1 analysis are plotted in Figure
2-15. The failure elevation predicted is +61.1 ft. Figure 2-14
presents the analysis and cri"tical failure surface for an
emb~nkment elevation of 60 feet. In addition to the analysis
of the east slope, the ~est side of the embankment at elevation
+60 was examined with the l.lx F.V properties. The computed
factor of safety was 0.977. Since this is somewhat lower than
the safety factor for the east side at the same embankment
elevation, it was an indication o~ the possible need for
preventive measures during construction to force the failure to
the east side, where the majority of the inst=umentation had
been installed.
2.6 SHANSEP ANALYSIS
SHANSEI (Stress ~istory And Normalized Soil ~ngineering
~roperties) is a procedure for determining soil properties from
the results of laboratory tests assuming that the soil follows
a normalized behavior. A series of strength tests are performed
to obtain plots such as S lave and E /Su v.s. OCR. With theseu u
plots one needs only to determine the OCR with depth and the
appropriate soil parameters can be obtained. The main advan-
tages of SHANSEP are: 1) minimizes effects of sample disturb-
ances by reconsolidating (under Ko conditions) normally con
solidated clays to 2 to 4 times OV.rn and over consolidated clays
to about 1.5 times avm, where normalized behavior is observed.
2) Once the plots have been obtained they can be used for
•
-33
similar deposits in the area. 3) Provides a rational way of
estimating increase in strength with consolidation.
The disadvantages of the SHANSEP approach are: 1) An
accurate determination of the maximum past pressure is essential
since everything is based on OCR (the in situ effective vertical
stress (~vo) can generally be determined accurately). 2) For
clays with a lot of structure (e.g., quick clays) the consolida
tion beyond av~m will destroy the structure and the test results
will not be reliable. 3) In order to simulate actual field
conditions the strength tests require equipment not generally
found in commercial laboratories. SHANSEP should be complement
ed with a good strength index test, such as field vane, to
provide an idea of the variability of properties through the
soil deposit and to help in determining the stress history.
SHANSEP is described in detail by Ladd (1971).
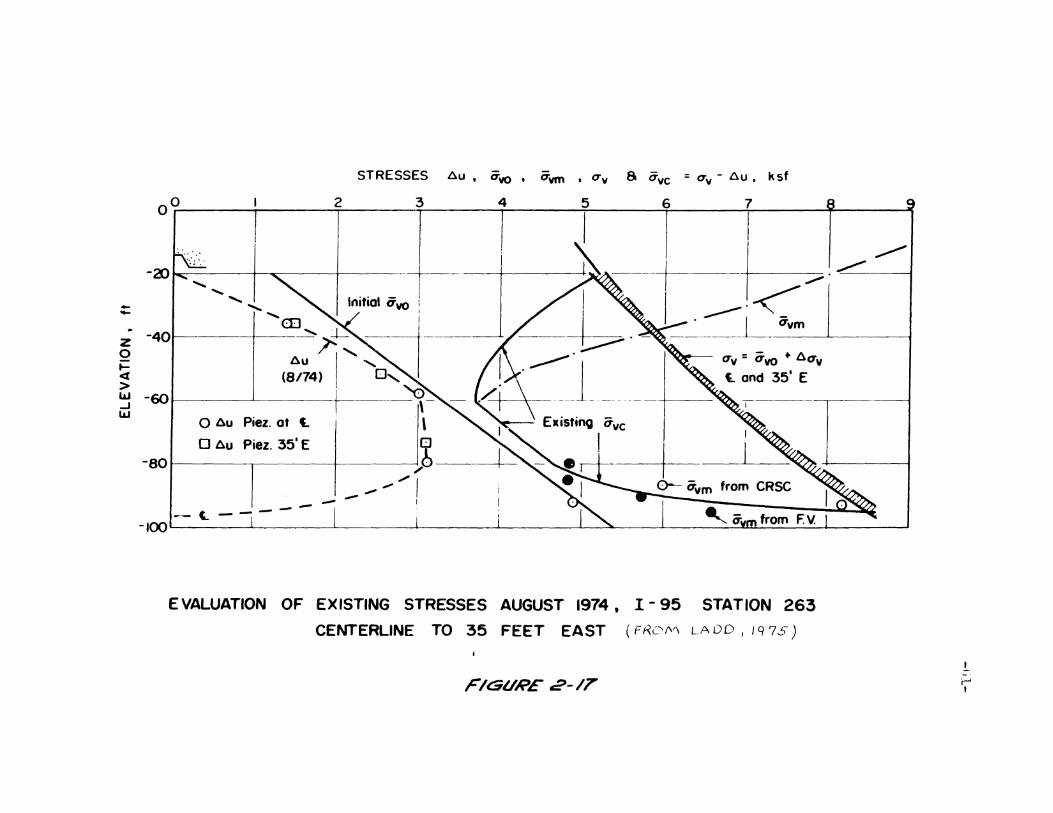
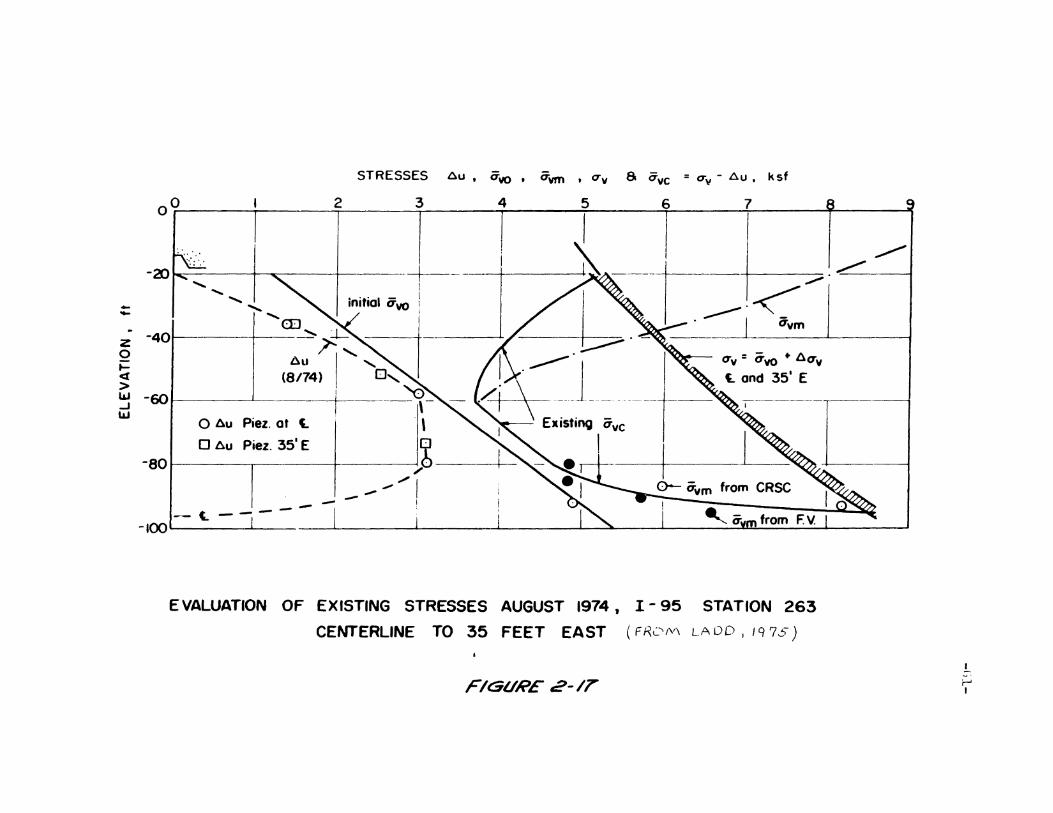
The soil parameters for the SHANSEP analyses were derived
by Ladd (1975) from normalized properties plots for Plane Strain
Active (PSA), Direct Simple Shear (DSS) and Plane Strain Passive
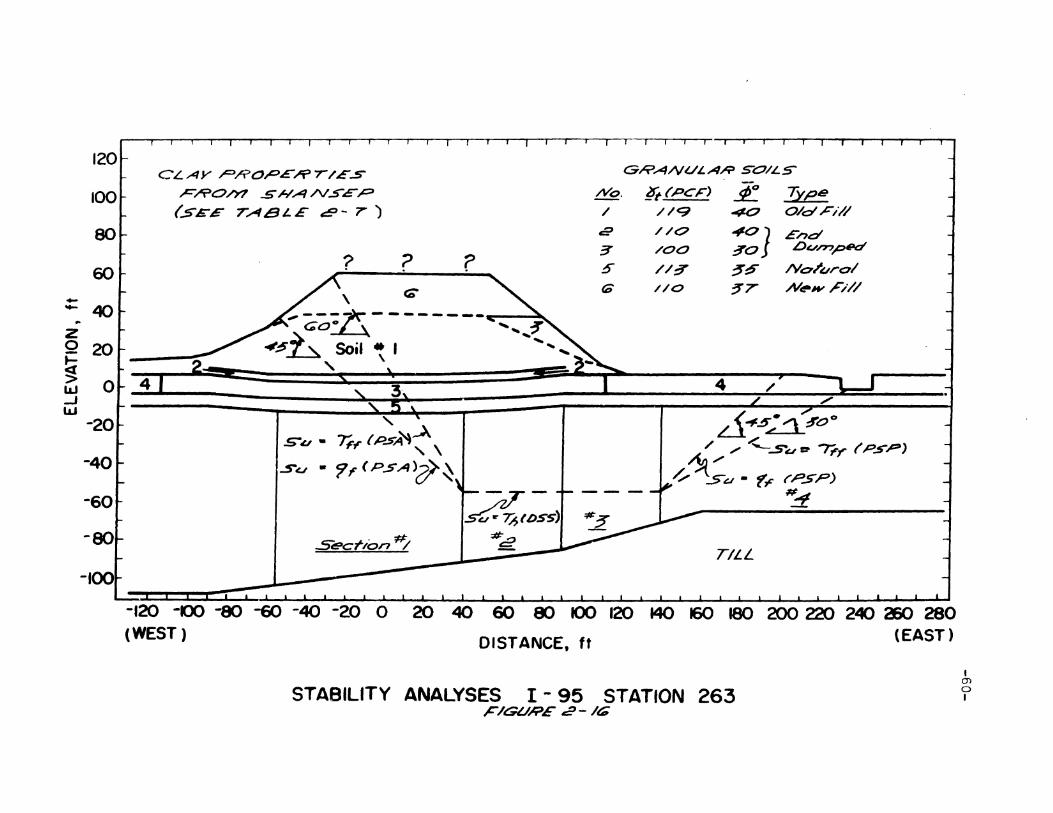
(PSP) conditions for resedimented Boston Blue Clay. The
embankment cross-section shown in Figure 2-16 was divided into
four sections (55' West to 40' East, 40'E to 90' E, 90'E to 140'
E and East of 140' E) based on the magnitude and orientation of
the existing effective stresses. The total stresses induced by
the construction of the original embankment (+40 ft elevation)
were computed with program FEECON, a finite element -program for
analysis of embankment construction, described by Simon et al
(1972). The details of the FEECON analysis of the r-95 test
embankment are presented by Hawkes (1975). To find the -34-
existing effective stresses, pore pressures measured in the
field were subtracted from the total stresses computed by
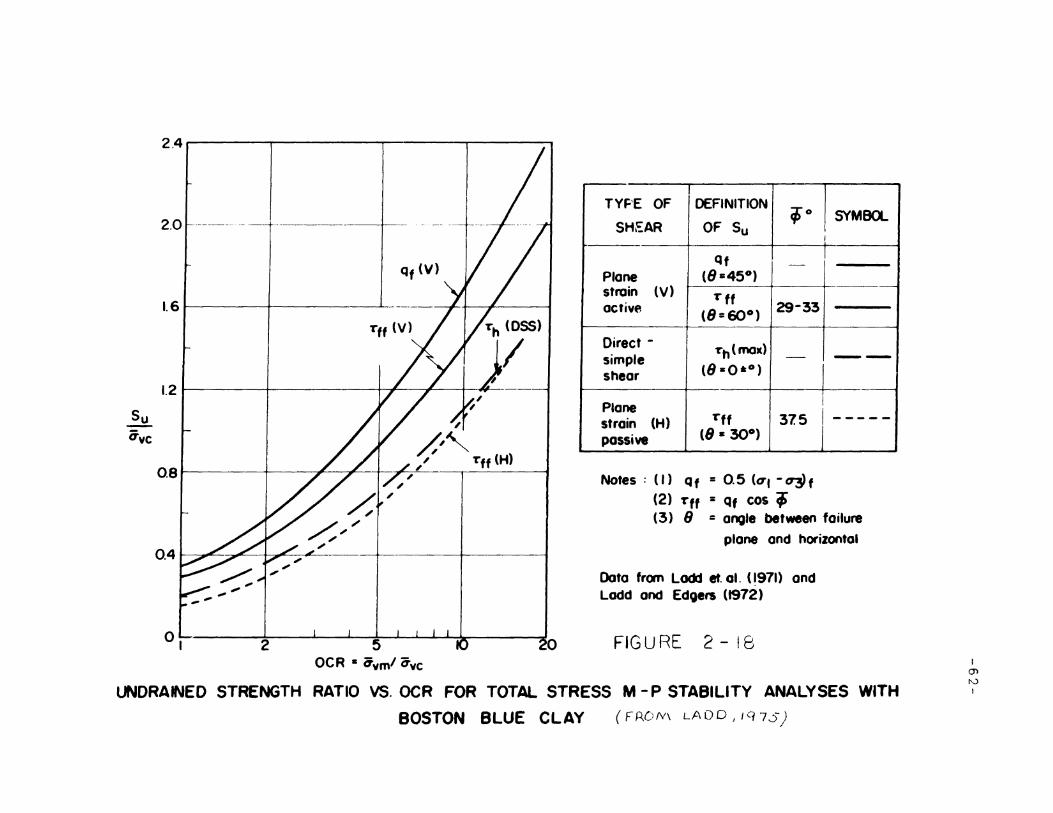
FEECON, as shown in Figure 2-17. With the maximum past
pressure shown in figure 2-3 and the magnitude of the existi~g
stresses the present Over Consolidation Ratio (OCR) was
computed. The undrained strength was then determined from the
plots shown in Figure 2-17.
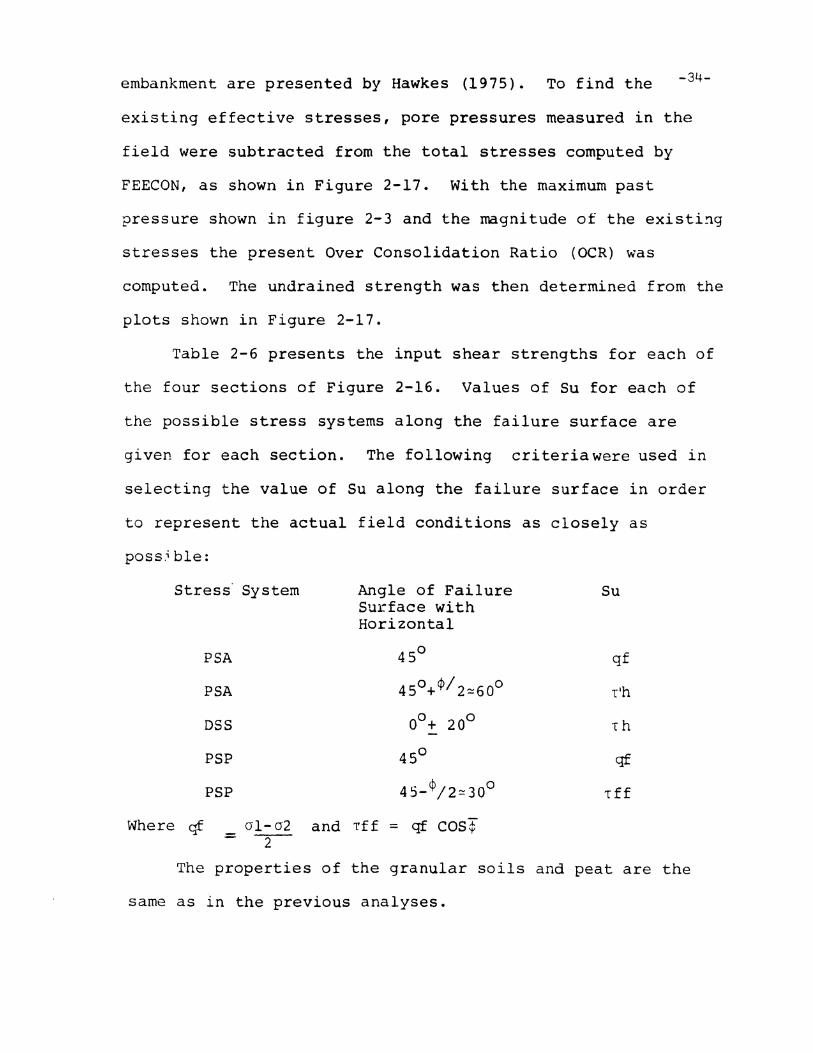
Table 2-6 presents the input shear strengths for each of
the four sections of Figure 2-16. Values of Su for each of
the possible stress systems along the failure surface are
given for each section. The following criteria were used in
selecting the value of Su along the failure surface in order
to represent the actual field conditions as closely as
poss.ible:
Stress System Angle of Failure SuSurface withHorizontal
PSA 45° qf
PSA 450+<P/2~60o T'h
DSS 0°+ 20° -rh
PSP 45° qf
PSP 45-<P/2~30o tff
Where qf al-a2 and Tff = qf cosT- -2-
The properties of the granular soils and peat are the
same as in the previous analyses.
•
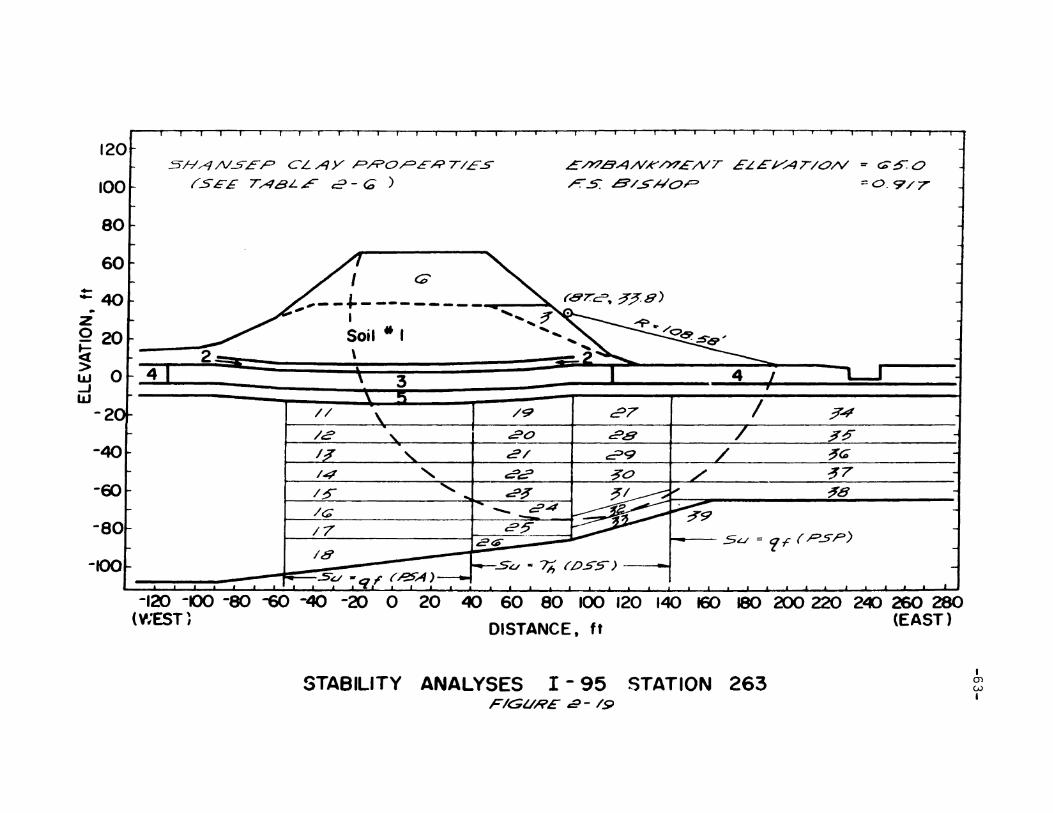
-35-2.6.1 Simplified Bishop Analysis
The result of the LEASE-SHANSEP analysis for the embank
ment at elevation +65 feet is shown in Figure 2-19. The factor
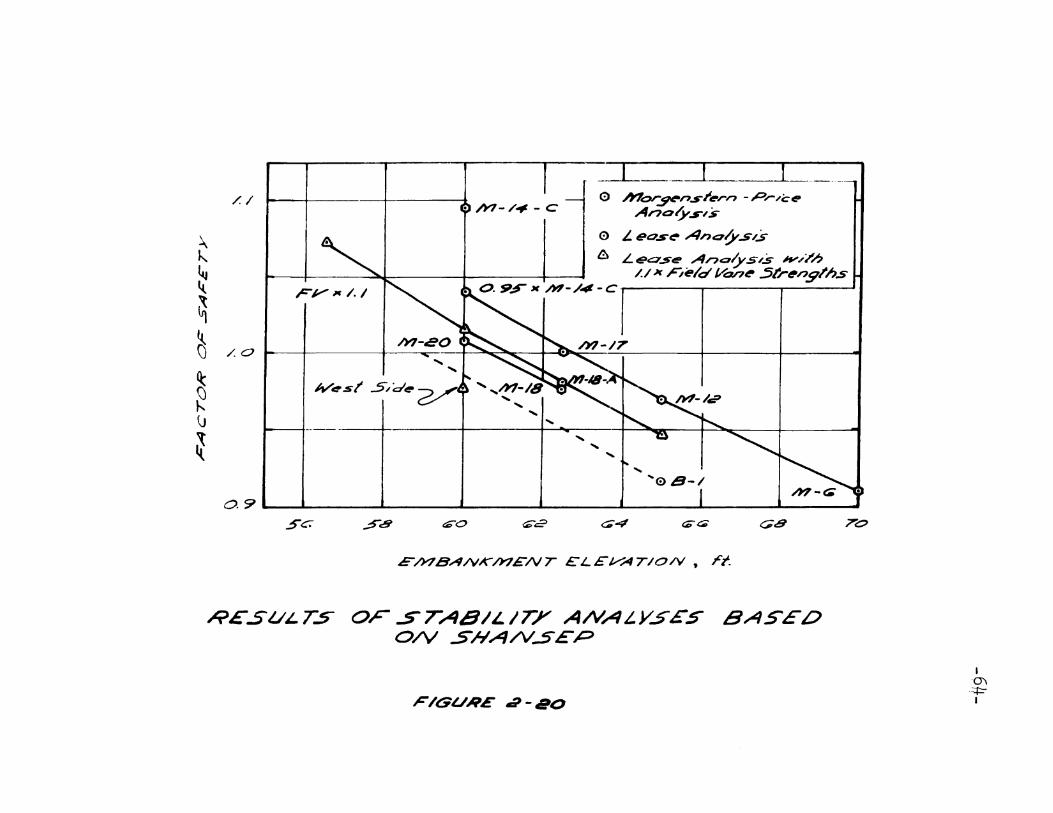
0f safety computed was 0.917. As shown in Figure 2-20, the fill
elevation for FS=l was estimated to be 59 feet using only the
analysis at +65 fe£t. A formal prediction was not made using
the LEASE-SHANSEP approach for two reasons: 1) the analyses
would involve a time consuming trial and error procedure to
obtain the correct value of Su on the different segments of
the critical surface. 2) Since the problem geometry suggests a
non circular failure surface, the more sophisticated Morgenstern
Price analysis was considered to be suitable to use with the
more sophisticated SHANSEP approach.
2.6.2 Morgenstern-Price Analysis
The results of the MGSTRN analyses are presented in Appendix
A. Unlike LEASE, each MGSTRN run represents the analysis of only
one assumed failure surface. The user has the option of
specifying any arbitrary function f(x) (see equation 2.6). The
value of A compatible with the f(x) assumed is computed by the
program. Run M-17, shows that the difference between the three
basic f(x) assumptions (constant, sine and bell) described by
Whitman and Bailey, (1967), is very small. Consequently, only
the sine assumption was used for the majority of the analyses.
The results of selected runs are plotted in Figure 2-20.
Initially runs M-6,M-12 and M-14-C were plotted. These runs
-36were selected because of their similar geometry. However,
it was necessary to adjust run M-14-C to reflect the decrease
in F.S. caused by lowering the failure surface from -60ft to
-70ft. The analyses indicated that the deeper failure surface
was more critical. The adjustment was made by multiplying
FSm-12FS(rn-14-c) by the ratio FSm-l-A= 0.95. (see appendix A for runs
M~12 and M-l-A). Secondly, the FVx 1.1 results from section
2.5.2 were plotted and finally the most critical runs at
elevation +62.5 and +65 (runs M-18 and M-20) were plotted. In
Figure 2-19, the lines joining the three sets of M-P analyses
are approximately parallel.
The fill elevation for FS=l predicted from Figure 2-20 is
+60.7 feet.
UNCONFINED COMPRESSIONSTABILITY ANALYSIS
.sOIL PROPER'TIES FOR ,c-IGURE ~-G
__ 37-
._.~
7i. 1h/,,1 C o,-$u ¢o (SOli. /\/0.
I~/ ,./CI SO/i.. TYPE j/ //9 0 40 Embank""t!'nf Sona' 1
I2 //0 0 40 En e:::I DlJl'77pe-d.san.::T~ //0 0 ~o £ncl DUn7ptec/Sa/7:j"4 i',::F ~OO 0 PEAl~ II~ 0 ~:' FOG,lndot,or1 Sarl:;T'
7 /t:f2 / 1000 0 Boston BI,,~,,-
! -t ,J_~'
l 8 //4 9;!J0 0 ..II 9 1/4 800 0 "I
/0 1/4 4~O 0 "
/1 //4 e:~O 0 ..Ie //4 480 0 .,
1'1 1/4 800 0 ../4 //4 /O~o 0 It
/~ /tE/ /6'50 0 I,
/~ /t::/ e~o 0 "/7 //7 ~75 0 I'
/8 //4 ~~O 0 It
I/9 //4 ~OO 0 II
ao //4 :fj40 0 ..='/ //4 (GOO 0 II
aa I~O 0 40 riLL
TA8LE ':-1
•
-38-
t.lNCONSOLIOArEO UNDRAINED TESTS ON80STON8t..UE CLAY., J- 9~ S7A710N2~?
TEST IVO. £/.£11:,(It) a;~"i ' a; - a,80~/N~ mo¥
/67'~'4) NF/J'7ARK.;;;-
/b/,t"UI...I- /9- 74 1-1- / -~7. 0 10.,.,.(;; :sc2..~t..1-20-?4 H - , - C.:::. ~ c:;4~. e ~Q}a.
0'!-I - =21 - '74- H .. i -8/. ..;; ~8~7 29S.
u ~ -.:2~ -74 1-1 -2 - &4.? I~~C.G 778. ~ 1:- 0;.t./.::.J -2~-74 H-~ -4~2 /04".t::; 5'22.
.:.I~ - 24-74- H-'; - c-;4.,g /G 7/.;' 8j'~.
t...It.J- £Jp-T4 H' - ~ -70.5 /4~9.t; Tip.
:../~/-2:~ -74 H-? - 7~..~ e70.~ 4~p-. ~ .: 4S'" iULl-a7-74 H-" - 7C1.p //4't: .~ 5reif. ;3= 90·"
U:J-d8-74 H .. ~l -4.fa 9di'1 *7 ~60. ti : -4p- ~l
uu-a 9-74 Hoot: - 44·,e /94.1$ 09T. ,.'3 = 90-"
JU-?O-74 H - , .- 27 D /e:;-1I~. r;- 841.
UL./"~I -74 H - I - 9/.8 I rc::>o 8~O.
::./1-1-~~-74 H .. I -/4.7 8tE'0/.8 1100.
UU-~?-74 H - I -::;,2.? ~B4.7 J'/8. ~ • o. S-a;,!.JU-~4 -74 H - I - C65i'.::; '''7.7 /C;4. OC ~~O~
TABLE 2-tEI
•
UNCONSOLIDATED UNDRAINEDS7ASIt.ITY ANAL.YSIS
SOIL. PHOPGRrlES ~OIT> FIGURE t:?-S
~39-
50/'- ;va YtJ'b/~tlCor Su ¢o 50/'- TYPE/"I,/-r
I //9 0 40 E/"TIhanK"'f4'nt SQrI oJ'
~ //0 0 40 &no' D"""pedSand~ / / <:,)
I0 ~O £nd Du",.,p~dSand
4 7~ ~OO 0 PEA'~ /I~ 0 ~~ FOtJndar~Or~ Sand7 12/ 820 0 8osTon 8/ue C/o.>'8 1/4 GIO 0 ,-9 //4 4f.,50 0 .'/0 //4 ~70 0 "// //4 ~f~ 0 tf
/6J //4 47~ 0 II
/~ //4 tG:::rO 0 I,
/4 //4 8':0 0 "
/:!i" /t:9/ /08f) 0 II
/6 11£'/ 900 0 I'
/r 117 t;7~ 0 "
/a //4 S40 0"
/9 //4 ::$~O 0 "20 1/4- ($~O 0 .,
t:3/ //4 6'~O 0 ..,£12 /20 0 40 TIl-/..
,ABLE &'-~
UNCORRECTEO FIELO VANE STA8/'-IT~ANALYSISSO/La P,I?OP£HTI£S F()H ,r-/6UH£ CJ - II
C 0,.5"fbi rttR ..50/L TYPE:
/
34
S
78
-:7
/0
" II ,
I -..~,. ~
--5;1 /
//9
/10
/0.0
7.;)
/1 3'/ I :.)
//4
//4
1/4
//4
//4
1/4
/ ~/4
,'/4
/,-G'/
/2,t'
//~
//oOtL~
//'4
,-'c?O
/ I ..~;L
ooo~OO
oo
/='70//B
/075:~
9?~
870.~
7/7
59-'i! ..'?
7/7
1024./
/9~~
/~T8.~
/?~/. ~
92/.7
7.58
8cgo.e
~o
40
~O
o~:s
ff?ooooCJ
CJ
I~
ooo
..-,'--
"'1
Embar)krn~rJt5Q;·,.~
£/101
L)W''''np~dSa"J
P£AT
~," II , "•.•
•
B./ERRI.//YI CORH£C TED F/EL.D v:4NESTABILITY ANAlYSIS
.sOIL PROP£~TI£SFOI? ,c'16UR£~·/3'
-41~
.:5',c_--: ;' __ , \,'c'. 't,t,,/ ,tl C 0'" s" (J0 .sOIL TYPEIh/ '/~
I / 1/9 0 40 £""b."Ir"".,,; Seine/I CJ //0 0 40 £"td DUn7,D.ctSon0'
I ~ /00 0 ~O "
-4 7S ~OO 0 PEATS //~ 0 ~~ FoundC7l,on Sana'a; //~ 0 ~7 T~st FI"I Sand7 /119/ /&'24- 0 Bosr0'7 8/t:/~ C/a.):'8 //4 ,'/~~ 0 If
9 //4 /O~4 0 ..I /0 //4 97? 0 " II // //4 879 0 ..I la 1/4- 7~/ 0 '1
I ,/~ 1/4 fE/a 0 II
ii /4 //4 74~ 0 II
/~ //4 /O8~ 0 "/c; /,e/ /~48 0 II
/7 /~/ /~44 0 If
/8 /a/ /092 0 "/9 1/4 //O~ 0 "~o 1/4 9/C' 0 "
2/ //4 r::Fo 0 ..t::?~ /80 0 40 TILLa4ft' //4 8GO 0 Boston BI(.,/e Cloy
TA8'-E~-~
-42-
SOIL NO_ 'If./h/F-P .CorSu ¢o SO/~ TYPE161,,11I 1/9 0 40 E"'bonkn"W'lt StfNlde //0 . 0 40 End Lk"",p*,d' SeN)d~ /00 0 ~O "
4-t
7~ 0 PtIltDI~OO
~ //~ 0 :'~ r oundo/,0t7 Sont:¥tIS //0 0 ,r 7.1/ A-// Sand7" ICI/ /~98 0 8o$~0'18/v;lt Cloy
8 //4 I~O~ 0 II
9 //4 //72 0 ../1 //..,. 878 0 " I/~ / /.;f. (;~~ 0 al
/4 //4- 848 0 II
/~ 114 /lcP8 0 fI
/t::; /,el /9/~ 0 "I
/8 /4'/ 1~97 0 II
/9 1/4- IIt:JiO 0 II
e/ 1/4 S~9 0 "ee /ePC 0 40 T,'//84- //4- 990 0 80S-Ion ~/ut!* C/o)'r9~ //4 94e; 0 ..0'<:; 1/4- 11-.1'7 0 II
'1./)( FIEL.D PANE S7AB/~/TYANA'-YS/5SO/£ PRJOPGHTIGS- FOR FIGURE e-
~
TABLE 2 - 7
SHANSEP UNORA//VEO STR£N6TH FOR BosroN BLUE CLAVJ-9~
•
ALL_ VA/ITS: ~/. , /b5.
OFFSET EL £J;( CTvc OCR
-/2.:;- :)C1CJC) /.7~
-20 ~-/ OG' /.;::)7
?~- 'yV -~o 4~;)O 1.~4
~-40 4140 /·fJ~._~:.--, 3'80(~) ,~ /;!
"-G..:~ ?7~;e /.0
44'£ _;-7",:,-J 4/5':'1 /.0
-8L~ .., 7.:.-"/:---' /.0
--90 ~(70Q / . .::..-'
-/B.~ 3'9uc? .2' . ..:.?~4
-20 ~9.PO c.02
4- ~·~.I·.~- -~O ;?720 /.88
I --40 ~~L~O /·~5,
-§c) ?~OO / . .2,;;I
f -CO ~440 /. ::79
}.::' .. ~'~: --TO i?8BO /.0
-Be' 4700 /.0
-8~'r ~'3'OO /.0
.-..l~_
P.s,.-:i
9t/c- 9,' r;,ervce :2 45~ e :Z ~OO
o.?/ 2p44 2/pc)
0. 4~T 8400 ~oaL'
O.4~; 2090 /7:;;>0
'24-d / T:fp /pac-:'
0.;;;'7 /4.:--:'p- /.~:?:.~
0.74 /~::-'~-o / / L:" C
Q.;;4 ,/4/0 ,'·~7C'
:::Y. ;';4 /~oo , '.-'~,:,~ )c..-'1
O.~4 204(;) /785
O,~B5 8440 2040
O.~7 aC:?~o /'88~
O.~4 ;?O/L~ ./~·85
O.4~~ /~::>5 ,";f90
0.3'9 #/~.:~5 //90
o.~~- /240 /..:J8p
O.:J'4 /~ao //5C'
0.;;1'4 /GiOO /..:wtoo
O.jJ4 e/40 /870
OS$
~/,1 -l~
,., J vc he -= o:t: £t:1
/.~ /dilOO
/./ /;1~O
O. -::; /Oc.o
o.~ /08c}
0.24 840
0.a2 ·71;)5
0.20 -7T~
0.&90 940
O. EO /t:5>~O
:..t::~
•
TABL£a-r (CON~)
•
ALL UNITS: ;Pi ~ 16s.
OFFSET ~LEv( cTvc OCR
-/B~ ;'~O /8.7
-C/IO /200 /0.0
90'£ -ffO /770 ~.98
~-4-0 ~300 8./8
-:::F0 2820 /."a/40'E" -GO ~~~O /.c20
10·t::IbQ II'~4/00 /.0iii'
S;'1Ir'''l!' 4~OO /.0
/a.'1> 7P-O /8.7
-20 /6'00 /0.0
-~O /770 ~.98
",/40'£ -40 t:??,OO &9./8
-~O t:l28C?O /.42-c;-o ~3'~a ,/. .:PO
-70 ~8~O /.O~~.-
DSS
7h~- 7ht:rvC'
e-o~~
/.CD /200
/.// /~~O
O.~O lOGO
O·~9 900O.27~ 77~
O.t:94 800O.teO 8C:.::J
0.20 900
/. ~ /200
/. II ,/~~O
O.~O /OGO
O.?f9 900
aa7:' 77~
O.~~ 8~o
O.~~ 790
P.s-~
r,y~ q, 'r'vc
e- 4!i'° 8-<:;0°
tiP. 02 /§/§ /200
/.~~ /&;/0 /280
O.C;(;"~ //. 7~ 9~~
0.40 920 7~O
O.2GS 74~ ~90
0.192 7~~ ~85
0./9 780 (;;20
0./9 a~;) GSO
B.OC!? /!i/~ /CJOo
/. ~., /(;/0 /1:980
O.~C;~ //,7;:;- 9~~
O.4.'jJO 9~O 7~O
o.a(;~ 74~ ~90
o.al£' 7~~ ~8S
O./9;P 7~O :>9~
II~-+:!I
CE/\/TERLIIVE
~ATE.R CO/vT£N T., 'Yo
-20
-:j(J
~-4{)
..~
-~O
~
" -:;;0~
~ -70~~lq -80
_·?O
-/OcJ
~--.......I &!.
-;C)O ----......- ......--....-....._~
·_,go
.....
p~ ,~:=T/c/ TY //W'L)e,\ , ~"
20 40
~ 6- ~I''''''''....... .... ~
~ e.~
-"C.. 4H.~ -40~ 6-f~
-~'J
~ -1&,l't.... J -,-.--",
~.... '-
6
-Ie
~-ao
t-
~-?o
()-40"~
~ -';-C'~
~ -~O
-70
•
•
•
•
.sTA TION e>(';'~- ATTE/i'BERG LIMITS VS EL.EVATION
;C/GUA£ 1lP-1
•
~4.6~
TOTAL UNIT WeIGHT, 'Nt', 16/f'~1
/0
~ 'e0 510/""o,,..,.~ C~~.,.h;'. I~o ~ /9t:J'-1. tI'tt::I"t 01C ~"I.,.hn" I
I~I ~
'1ftI
• /1IP1.~.A:'2:~o I
Ilea a
a e I40 I
(!) e ea I
~ I~
I'0.. i +~ G I
~ I0~o I......
~ e I~ I~ ~~
~ I70 I
III
80 bt .1'~PCF3/1
III G)
~90 I
I E) coII
/00
S7;4TION e::~3'- UNIT WEIGHT YS ELEV'AT/ON
FIGURE e-e
•
CTVO AND O'vm' ksf
_ _" -'--TC- C__® C> 17- -- ---- - -- -- --I~I -.l>
~~~ --~ --~-- ~ - I Iavo
BOR. SYM ' LOC. (j m -FROM
'"-~-- ---~~ - t - - - ~ ~-.-~~~
IH-3 <] 175 W
CRSC0
H-I 0 t. e, 0H-2 [> I 190' E t(4/74) eVI
I.... I 160' W Field
V2 e ' c... VaneV3 .... I 160 I E (6/73)
o9 ~ i r 1 1 ~ ~ f{ ~ '? ',I I~
- 20 I "".. --+-----~
-IOQI I I
-1201 1 I , I 1 I I I I I I J
-404-~..zQ
ti -60>UJ..Jw
-80
STRESS HISTORY, I - 95
STATION 263 (FROM lADO,tQ75)
FJC/URE 2-3
Selected values of preconstruction CTvm
_. -@- . - Beyond 50' West
---®---- Centerline ' SOl- - -@-- - Beyond 50' East
lr-JI
•
~48-
X;'-I
c;:./.............
"' o>t.................
X;'..................
..........
ht E'",. 'J_
ITex!
f
FORCES ANLJ L OCAT/O/VS INCL ULJEL) INTHE EQUILI8RIUM OF AN INL:J/YIDUAL. SLICE
FIGURE t=#)-'"
•
-49-
"'n
IJ\,
~~
,,~~
~~~
()
~"
l.j~"~
~~~~
'<\q,
0~'"
~~
~~~.~
~0
~l\C\J~~
C)CJ
0\>
C)
~~~qJ
't~
~
"l~i:::;.:1
CI\/O
I.L~A37;
~~~~I
~~'"l\J~
~~~
~'Q\~~
~'<\
~~~
'-l"
~
~~
"~
•(j~~
~C>
V~~
~"
(j~~
"-~~~
,'<\
~~~t
0,
~~~
~.~
()~~'-...:
0~G
~\)
\)\)
tJ\)
Q~
~19
~~
::3"~:.l~
,1
\/0I.L
1:?',"1.37~
•
~h7.L7/4/V/f'/)7E/VT ~LEj/'AT /0/\1" ;:~T8
F.5. a/..s-~op> =: 0.983'
fiJ~FS. ~ELL£N/U.s = 0.905
(' 78.0., /0/.5
~~
........,::...
~
...-.
Soil • I
~
3
"4
7
CL A Y ,Pn'O~E~T/ES FRO/Y7
U/\Ico/vF//V.t:.,-D CCJ/Y7,PR.E'S".5/0N
7EST..> (SEE 7A.BL~- c? - I)
120
100
80
60
..."'40..zQ20~> 01- 4w...Jw
-20
-40
-60
-eo
-100
DISTANCE, ft
-~2O -00 -eo -60 -40 -20 0(WEST)
20 40 60 EK> 100 120 140 160 180 200 220 240 260 280(EAST)
STABILITY ANALYSES I - 95 STATION 263r-/G"UHE c?-t::;
IUloI
..s~ (k~s/r~") AT CE/VTE/ilL..//VE .54,/ (K/pS/;I'd) AT /90 aFTEAST
/.s/.0o.s..:..jI~' , • I i I i
/00' I , , I • •
/.~,<uO.So
/00' , ! I , • ,
eo r I r 1::-?u
/.~,
"i..,.
~ 40 ~ 40~
~\)
"\) "" ~"~ t:C c' ~ ~O
~"-J
~llJ
80 1 ___\1 l J 80
UNCONSO£IOAT£O - uNORA/NED SHEAR ,STRENGTHSAT CENTERLINE AND 190FT EAST FOR STABILITY
ANAL.YSES, 1=95' STATIONcP<::,J'
~/GUR£ ~-7
I\.llt-.JI
f ' ill I I I I I I I I I I I I I r----.-.--TTl r I
120r CLAY PROPERT/ES FROh7 Eh1BANKh7£/VT ELEt/AT/ON = -3'78IOO~ t.../NCO/V.sOL/D~7EOUNORA//VELJ .F S. 6'/.5#OP = ~oo?
7R/A¥/AL TEST'S- ISE£ TABLE c-~) --La .,c: S. F"£LLEN/US :: 0.8B/
80
60....... 4Q..Zo 201- ~
,Soil • I
~..
~ O~~!
I 4, 3....Jw
-201- I,
/6
" 7/7'
-401- I "B /8
,9 /9 7'..,
-60/0 "' - --" ~o
II
-80 /~
/~
-100 ---
DISTANCE, ft
-120 -00 -80 -60 -40 -2.0 0(WEST)
20 40 60 80 100 120 140 160 180 200 220 240 260 280(EAST)
STABILITY ANALYSES 1-95 STATION 263F/c;£Ifi>£ cP-8
ICJlrvI
•
~A/VE S~EAR STRENGTH--53-
o o.? 1.0 /.~ ti'.o
o O.C' 0.8 /.0-/0
-20
-40
e.
~-~O .!:.\ G
t:J~
..
~ -(;'00" G)~
~ 0 <t /97~.
I!I /t:JO'1. £ i /97~~ -70
~e. /(;0'1: /IV t /97;T
e-eo
~
&
-90
-/00
.,c/ELD YAH£" rESTS AT rEST S£CTION t:Et;~
F /Gi.lHE ,e - 9
•
o 0.1) /.0 I.~ d.O
~ I .."3 / '::'/F' -
I.~CI.d0.4
...
0.2
- ' , "\, .
-- , i :'1
.- so
E/Y1BANK/Y7E/\IT £L EJ,/AT/ON :: pc?:>F..s: B/.5#OP := /.
~ SLiCE /VE6L£CTEO BY LEASE
~I
//
cD
-,--------_ a
7
/,
8
II/0
CLAY PROPEh>TIE5 FROh7
VAlCORRE'C7'E,b ~/ELL:J YA/V£
(SEE TA.8L~ C>-4)
120
100
80
60+-"-40
...z°20!ci> 01- 4w...Jw
-20
-40
--60
-80
-100
DISTANCE, ft
-120 -100 -eo -60 -40 -20 0(WEST)
20 40 60 ~ 100 120 140 160 180 200 220 240 260 280(EAST)
STABILITY ANALYSES 1-95 STATION 263F/GUHE ~-//
IUl01I
1.4. i i f i i- Su (Field) = J-L x Su (Vane)
SYMBOL I REFERENCE
120100
o I LaRochelle et. 01.(1974)
Bjerrum 5 (1972) recommended curve
~
40 60 80PLASTICITY INDEX P. I., °/0
20
o ,e
1.2 I _ I I I 0 Bjerrum (19721 I I
~ Milligan (1972)--- I
o Ladd 8 Foot (1974)- Flaate a Preber (1974
1.0 I---
0.40
:t.
a:::~o~
Z I~.o It.... 0 IU Iw 0.8 0 I
~ 0 00:
8 I 0
8. _( ~__ ~ _+- ._~--0.6 I I ~ - --~--~-- ---- I ~
I
!
FIELD \ANE CORRECTION FACTOR V5. PLASTICITY INDEX DERIVED FROMEMBANKMENT FAILURES (FROM LADO/ q75)
F/GUHE e-kP
I~.,
I
•
/9
,eo
~I
/
//c?4.__-----------------
(c!/~, 3't;.e)
.E/Y7BANK/Y7£NT ELEJ;?'./ T/O/\/ - 50.;;~ s: e//SNOP :a /.
~ SLICE /\/£<GLEcrE£J BY LEASE
-------- £ a,<;;
il • 1
CLAY PROPERTIES FROh7
61-/ERPt.//>7 cOR~ECrEO
~/£.L.£) YAN£
(SEE TABL£c=?-SJ
120
100
80
60.......... 40
...z°20
~ 01- 4w...Jw
-20
-40
-60
-80
-100
DISTANCE, ft
-120 -00 -80 -60 -40 -20 0(WEST)
20 40 60 80 100 120 140 160 180 200 220 240 260 280(EAST)
STABILITY ANALYSES I - 95 STATION 263P/GLIHE 2-/~
I(Jl
......,JI
•
~h78ANKh?£Nr ELEV"AT/O/Y == ""GOrl:.F5: (B/SHO~) :; /.O/<ifi'
($'
Soil • I
7-8-9-1/
~:::::::........
c:C'
If'
,14
/?
CLAY PROPERTIES FHO/)?
/./ t¥ FIELD J/A/VE
"SEE 7;48LE2-G)
120
100
80
60
..."'-40...zo 20~~ 01- 4-JILl
-20
-40
-60
-80
-100
DISTANCE, ft
-120 -00 -80 -60 -40 -20 0(WEST)
20 40 60 80 100 120 140 160 180 200 220 240 260 280(EAST)
STABILITY ANALYSES 1-95 STATION 263~/GUHEC'-H
I(Jl
OJI
~59-
o V/vCORAECr£D P-/EJ.D V'A/VE 1---_.......- .......~ S,,/£HRUh1 CORRECTED F: J,'!'
[!J I. I x P/Ei.O J'A/VE
,/.0 ..-.-_..,.uc ~ UU -+----~~-~~--....._......__r__-.._.ot,
1.4"--~-"""'-.-..II...---....-..........-r--~-~~r-----r"-~--'8::=:o"'9,nol £",bo"k",.,.,,;
I I Ie......,.GJtpond~ E061' -r/op.d'
0.9
1./
t."
0.8 .......---_.........---I~ ........._...a..-._'--___a.._...a____..It..._ _..__
~~. ~o
£MBA/VKh'1£NT EI.E"'ATION, flo
EMBANKMENT ELEYAT/ON P'S FACTORCJr SAFETYFIEI.D PANE STA81LITY ANALYSIS
z- 9~ STATION e~:ff
F I GUHE ,£' - /~
•
,/
TILL
4
d~.5~;J"oa
~,...,... <-~u=- "1'" /PSP)
~ 'Su - fr rPSP)#.-t1
G'?A/VI./LAR SO/LS
~ (PC,c-) £. rype/ /9 40 0/01 ;Ci//
//0 1'0) End/00 3'0 LJU/7?ped
/ /:IT ~~ No;t./ral//0 ~'T N~wh"//
/\1'0.
/
2
:f5G
p?
,Su. -".,. (psA'l~" \su • '11' (P.sA)~~
Sect-/on~
\ r;;:
~ ;;;;;=1\.- - ------~:5h Soil • I, \
?
CLAY ~/?Or:'E'/Pr/E.s
r/'rO/'Y1 ..s~A/V.s~;O
(SEE rAB/..E CJ- 7 )
120
100
80
60..."40..z°20~
~ oJ- 4w-Jw
-20
-40
-60
-80
-I
DISTANCE, ft
-120 -00 -eo -6Q -40 -20 0(WEST)
20 40 60 80 100 120 140 160 180 200 220 240 260 280(EAST)
STABILITY ANALYSES I - 95 STATION 263,c-/GU~E C' - It;
ImaI
STRESSES 6u, c7VO' Uvm • O'v 8 uvc = O'v - 6u. ksf
~
(Tv = UVQ + 6CTv
'- and 35' E
.",,"1---.- ~ ----- --- I
-100' ! I 1 ! I >! .,.... t ,
..
09 ~ f ~ 1 59? T ~
'.'
....-
'.. I I i---aJ, ' _,~:'" In.ilial u~ I
(I],,-- _I ""-.. -+--- """-. IZ -40L------t--- J'. "-o 6u 1 '~ (8174) I 0,'0~ -60 I - --_ \ - 'OR. -
~ I 0 6u Piez. at t. ,
• 006u Piez. 35 E _ 0--+-80 I I '"
EVALUATION OF EXISTING STRESSES AUGUST 1974 t 1-95 STATION 263
CENTERLINE TO 35 FEET EAST (FKC"(V\ LA OD , J q 76-)
FIGURER-ITt
rt
or.~"
-20
..lit-
.-40z
0t-<[
>w -60...Jw o 6u Piez. at l.
o 6u Piez. 351 E
-solI __
'- ---- --100
EVALUATION OF EXISTING STRESSES AUGUST 1974. 1-95 STATION 263
CENTERLINE TO 35 FEET EAST (FKL""'/V\ LA 00 J J q 76- )
F/GURE~-/T
I
l-J,
Su
ave
2.4' , , , •
2.0 t---------- ----+-- I - -._. __ . ~
1.61 , I
Ttt (V)
1.2 I I '« « '«.
0.8 1." •
0.4 I=-...... ,...... - , I I
I I~
TYFIE OF DEFINITION Clio , SYMBCl..SHEAR OF Su
I ---qt - --
Plane (8=45°)-(v) ~strain T'lf
29-33 -active (8=60°)--
Direct - Th(max) - --simple(8-0*°)shear
--~
PlaneTtf
315 I----~strain (H)(8· 30°)
L passive I
Notes : (I) q f = 0.5 (a, -~ f
(2) TIt = qf COS ~(3) 8 = angle between failure
plane and horizontal
Data frem LeJOj et. 01. (~971) andLodd and EdQers (1972)
•
UNDRAINED STRENGTH RATIO VS. OCR FOR TOTAL STRESS M - P STABILITY ANALYSES WITH
BOSTON BLUE CLAY (FRON' LAOO J Jq 75)
°1 2 5OCR • tivml CTyC
FIGURE 2 - 18I
01l'Jt
40 60 80 100 120 140 160 180 200 220 24) 260 280DISTANCE, ft (EAST)
~8
ffp~~
~7
/ jT-4
I • SL/ = 'l-F ( P5P)
t:?7
E/J'7.6'A/VA""'/??'E/VT ELEJ/AT/O/\/ =- C;;:S: 0
F:S .5'/,.SH'OFJ =0.9/7
~/
t:E>o
/9
c:??c::?~
---..... &?4
c>~_._--~C't& _
co
,--~---------- ,,ISoil .. I\2
5h',-L//v-SEP CLAY F>fi=>O~ERT/E.s
(SEE T,4BLE 2- CO )
120
100
80
60.."-40-z°20~~ 01- 4..Jw
-2
-40
-60
-80
-100
STABILITY ANALYSES I - 95 STATION 263FIGURE 2- /9
I(J)
wI
___ .__-L. ~
""'""
o .Mor~n.s.l~r" -~r/ceAno/ys's
o L eo.s~ Ana(ys/s(1) LeC7.s~ Analys/s W"//h
/./ ,)( Fjeld I/onf!' 5trt!'ng/h.sell o. 9F" h'-/4-C ' , .FI" x /./
/./
/.0
09.· , · · · , .
~~
~~
~((
~~
~
,SC ..;:>8 ~o r;-2 <:;4 t4>c; C;8 70
~/nBA/VK/YI£/VT£L£V'AT/O/Y, ft.
RESLl,T.5 OF STA8/LIT)" ANAL.YSES BASEDON SHAN..5£P
I-0'\.~
IF/GL/R£ ';-80
•
•
3. PERFORMANCE OF THE STATION 263 TEST SECTION -65-
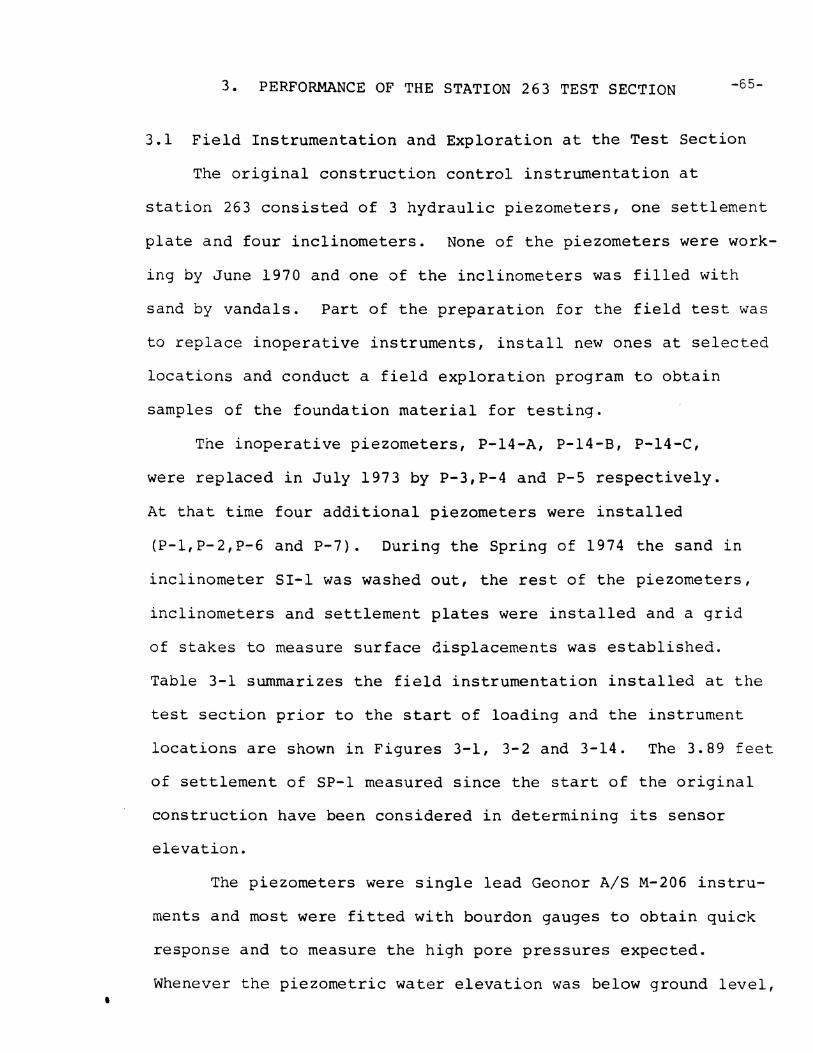
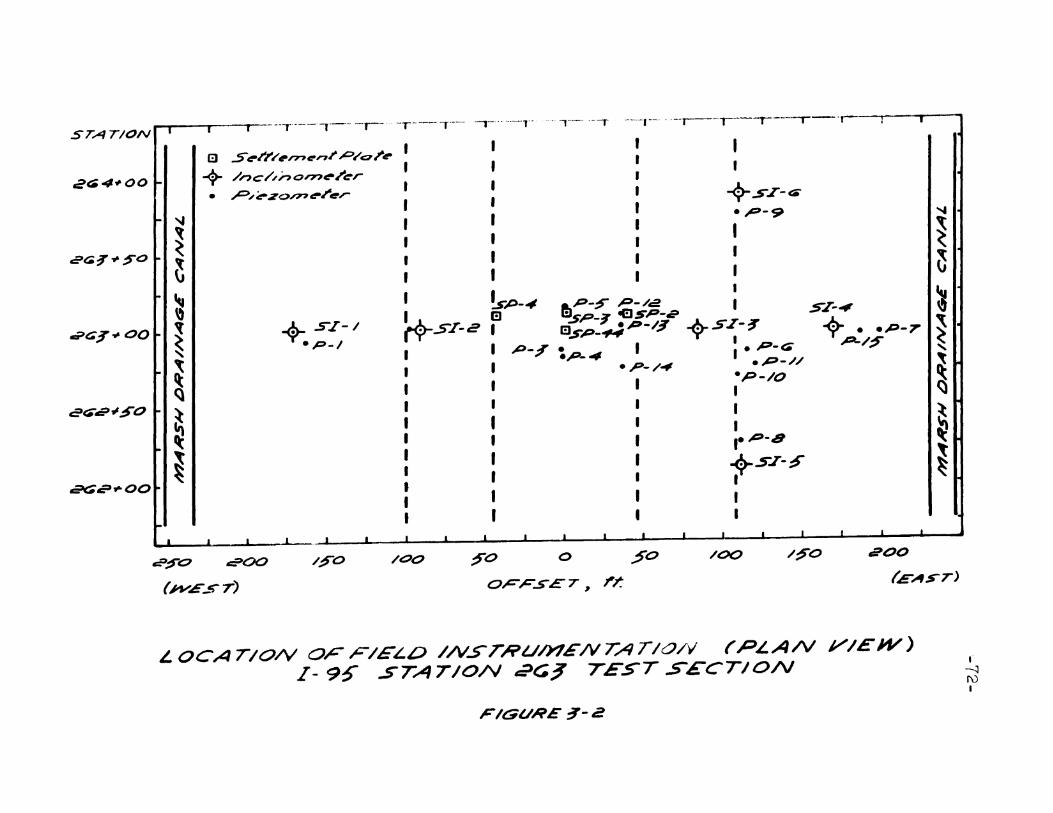
3.1 Field Instrumentation and Exploration at the Test Section
The original construction control instrumentation at
station 263 consisted of 3 hydraulic piezometers, one settlement
plate and four inclinometers. None of the piezometers were work
ing by June 1970 and one of the inclinometers was filled with
sand by vandals. Part of the preparation for the field test was
to replace inoperative instruments, install new ones at selected
locations and conduct a field exploration program to obtain
samples of the foundation material for testing.
The inoperative piezometers, P-14-A, P-14-B, P-14-C,
were replaced in July 1973 by P-3,P-4 and P-5 respectively.
At that time four additional piezometers were installed
(P-l,P-2,P-6 and P-7). During the Spring of 1974 the sand in
inclinometer 81-1 was washed out, the rest of the piezometers,
inclinometers and settlement plates were installed and a grid
of stakes to measure surface displacements was established.
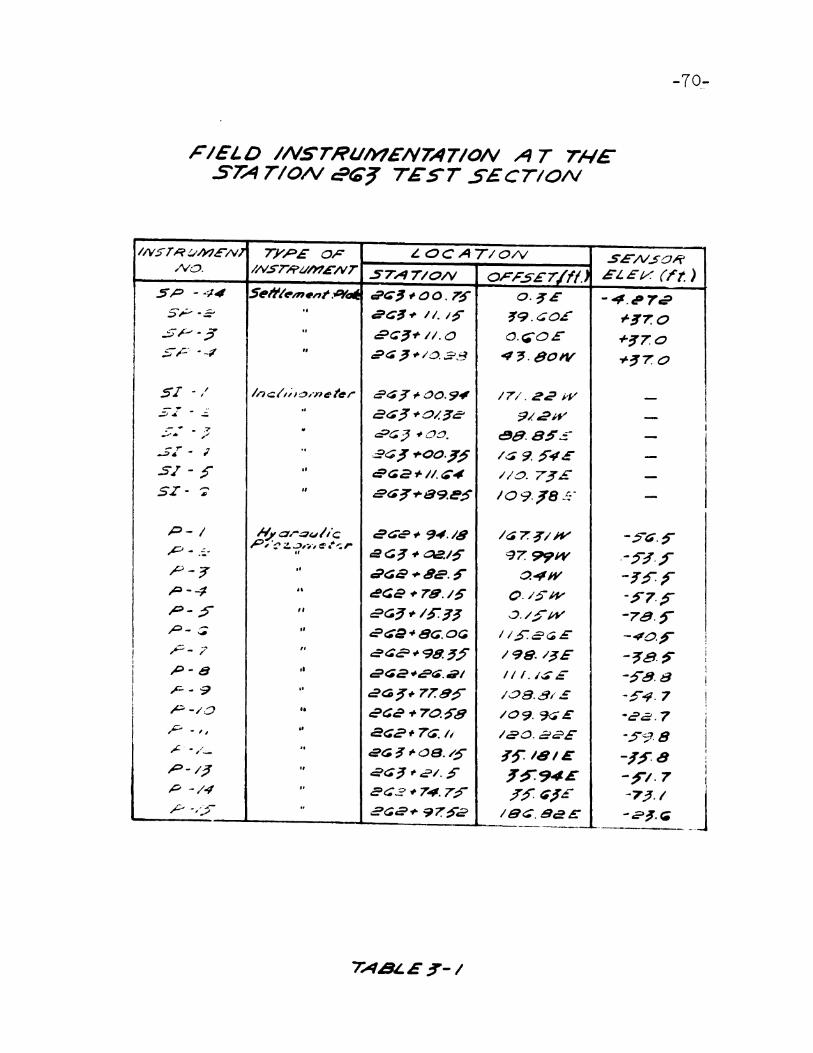
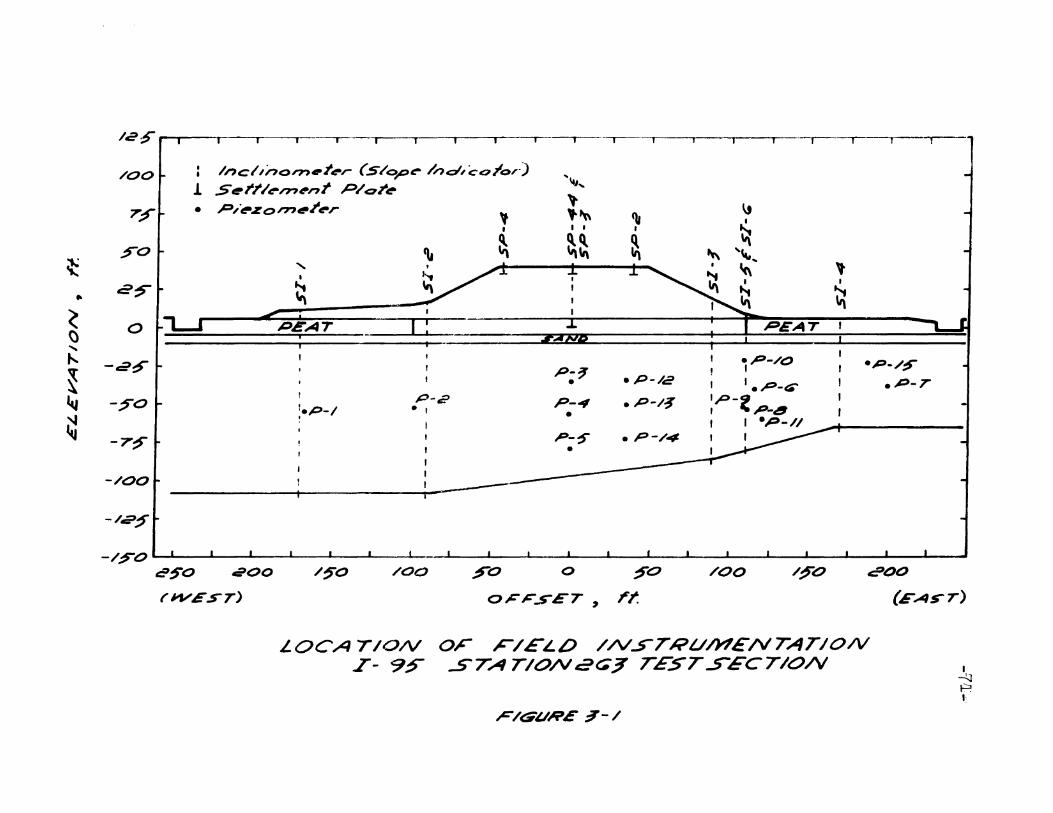
Table 3-1 summarizes the field instrumentation installed at the
test section prior to the start of loading and the instrument
locations are shown in Figures 3-1, 3-2 and 3-14. The 3.89 feet
of settlement of SP-l measured since the start of the original
construction have been considered in determining its sensor
elevation.
The piezometers were single lead Geonor A/S M-206 instru
ments and most were fitted with bourdon gauges to obtain quick
response and to measure the high pore pressures expected.
Whenever the piezometric water elevation was below ground level,
-66readings were obtained with capillary or electric probes. The
piezometers were read twice daily through the field test. The
inclinometers were aluminum Wilson Slope Indicators. They were
read with a Wilson Manual torpedo and with the Beaver System,
an automatic recording accelerometer developed at M.I.T. and
described by Bromwell et al (1971). The stakes for the surface
grid were set in concrete about 2 feet into the peat layer. As
with the settlement plates, readings were obtained by optical
surveys performed by the Massachusetts Department of Public
Works.
In April, 1974, 5 inch fixed piston samples were obtained
from borings H-l and H-2 shown in Figure 1-3. Atterberg Limits,
UC and CRSC tests reported in this thesis were run on the
samples from H-l and H-2. Additionally, boring H-2 provided
one more determination of the till surface. The known elevations
for the top of the till are as follows:
Location
81-151-281-351-451-55r-6Boring H-2
Elevation (ft).
-109-108
-87-65-87-79.5-68
3.2 Field Test Construction Sequence
The loading operation began on 26th of August, 1974 with
the steepening of the embankment east slope to an angle of 40°
The embankment was then raised in lifts of about one feet. Fil.l
was carried by trucks from station 246 and spread by bulldozer
-67on rubber tired loader at the test section. The only compaction
was that provided by the construction equipment. Figure 3-3
shows the progress of the fill movement which proceded at an
average rate of 1.5 feet per day, excluding weekends.
3.3 FIELD MEASUREMENTS
3.3.1 Pore Pressures
Pore Pressure data for the initial ernbakment construction
(crest elevation = +40 feet) are shown in figure 3-4. Figures
3-5 through 3-9 present the data obtained during the field test.
The computation of excess pore pressure is based on a water
table elevation of +2.5 feet and an artesian pressure in the
till of 5 feet of water as reported by Whittle (1974).
3.3.2 Settlements and Heave
Figure 3-10 is a plot of settlement v.s. embankment
elevation for the four settlement plates located at station
263. Since the surveys were conducted around the middle of the
working day, the embankment elevation selected for the settle-
rnent and heave plots was the average elevation during the day
of the measurement.
Figure 3-11 shows the vertical movement of two heave points
at Station 263. The offset for H-l was 130 feet east and for
H-2 183 feet east.
3.4 Failure
Failure occurred on Friday, 20 September, 1974 at about
6:30 A.M. Unfortunately, no one was present to observe the
failure take place. Figure 1-1 shows the massive lateral and
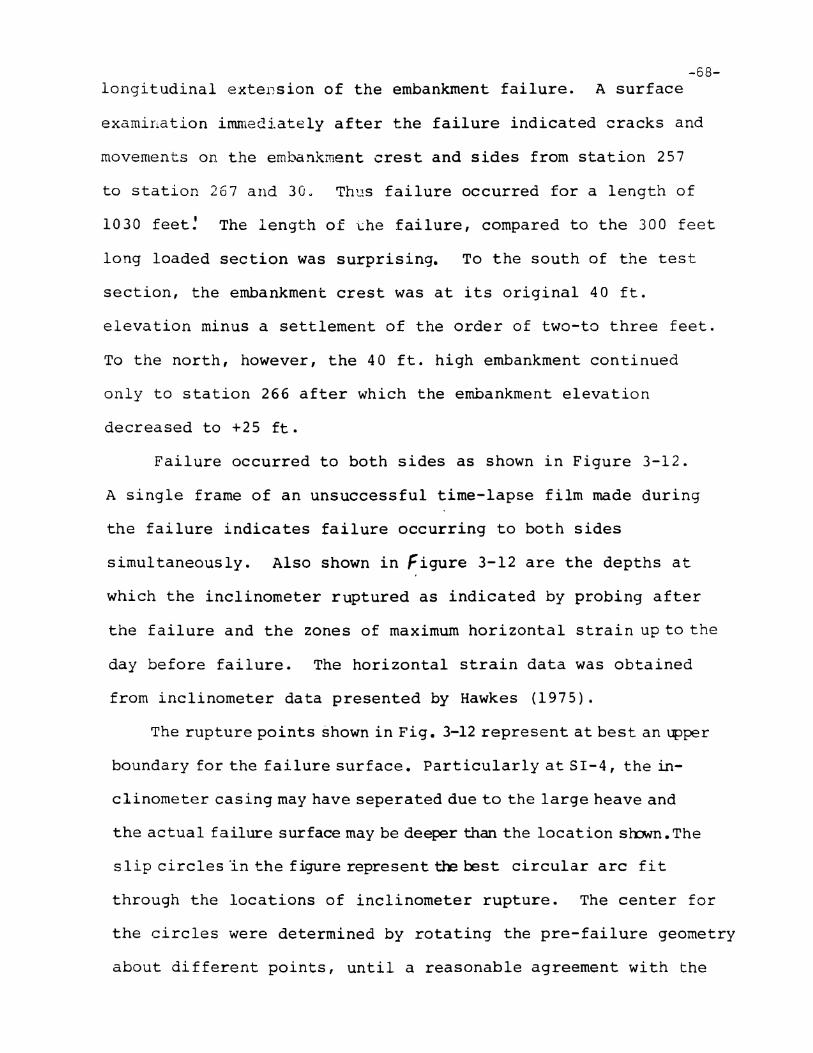
-68longitudinal extension of the embankment failure. A surface
examiriation illunedi.ately after the failure indicated cracks and
movements on the embankment crest and sides from station 257
to station 267 aIld 30 ~ Ttlt1S failure occurred for a length of
1030 feet: The length of ~he failure, compared to the 300 feet
long loaded section was surprising. To the south of the test
section, the embankment crest was at its original 40 ft.
elevation minus a settlement of the order of two-to three feet.
To the north, however, the 40 ft. high embankment continued
only to station 266 after which the embankment elevation
decreased to +25 ft.
Failure occurred to both sides as shown in Figure 3-12.
A single frame of an unsuccessful time-lapse film made during
the failure indicates failure occurring to both sides
simultaneously. Also shown in Figure 3-12 are the depths at
which the inclinometer ruptured as indicated by probing after
the failure and the zones of maximum horizontal strain up to the
day before failure. The horizontal strain data was obtained
from inclinometer data presented by Hawkes (1975).
The rupture points shown in Fig. 3-12 represent at best an upper
boundary for the failure surface. Particularly at 5I-4, the in
clinometer casing may have seperated due to the large heave and
the actual failure surface may be deeper than the location stoNn. The
slip circles ·in the figure represent tle rest circular arc fit
through the locations of inclinometer rupture. The center for
the circles were determined by rotating the pre-failure geometry
about different points, until a reasonable agreement with the
-69-surface of the failed embankment was obtained.
At station 263, the top of the embankment dropped a
maximum of about 30 feet. A heave of 14 feet was measured on
the east side and 10 feet on the west side. The movements to
the east side of the embankment were very uniform as shown in
Figure 3-14. A very large crack (14 ft. wide at the top and
8 ft. deep) formed on the east side as shown in the photo-
graphs of Figures 3-15 and 3-16 and schematically in Figure 3-14.
More detailed information of the failure including the
surveys before and after failure will appear in an M.I.T.
Department of Civil Engineering Report to be published in 1975.
FIELD INSTRUMENTATION A T 71-1E57:4 T/ON ~t;~ TEST SEeTION
,
J
IN5TRt,,/YIEN7 TYPE OF L. OCA7/0/V SE/V.sOR/YO. /NsrRVh7£NT S7A7/0/V OFFS£7/fl.J GL.Et/: (rt.)
SP -44 Seh/fI'm.", ."'YQIf ~t::~~oo. 7~ O.~E-"'.'7~
5p·~It
2C~~ II. 11i ~9.~O£ -I-~7. 05P"~ " t9(;"~+ 11.0 Q.,.OE +~7.0S~~· ·4 " ~~~-I'/O.~B 4~. 8011,' +~7.0
Sf -,/ /ncll;,o"T/~tt:r a~~-JooO.9~ /7"/. 2~ J'P --. - ..a6~+O~~t:: 9L2JY -,;;..; -
I.- .. _ .7 .cPt;:J '" O~• de. 85.!3: - I
.;,. .. ,.,1
-r ; .1
ac;~"I-oo.~~ /~ 9. ~~~ - !-::l4 -
SJ -~ ItC'Ga-l-II.~4 I/O. 7~£ -
sz- ~ II2~~+a9.e5 I09.J'8::" -$
P-I ~C1raul,·c e~tP~ 94.18 1<;;7:~/Jf/ -~(;.~,&oJ _.': .. p~'-:;- ZJ,,-, ~~~,.
=G~"" o.e./~ 97. 99JIY ·-:Y:!·f"p-? It
~(;S~8e.~ o.-4W -~:'.F,&'-4 " teG':.,. 79./~ O. /~J4,' -~7.~p-~ " ='G~"'/~~~ ~./~VY -78.~p-; " ~C::2 -# 8~. ot;; /1.s-.a~E -40·F j
IP-7 " a~~~98.~~ /98. /~E -"8.~II
I
!I
-S-8.8I P-s .e
t:i?t:;2·~t;;.al III.'~£ !ti P-9 I'
~G~.,. 77:81J 108.8/£ -~.,. 7!
II
I p-/Q '& e:t;a+7a~8 /09.9<4£ 4tE'ti:.7 IP -', If
2<:i?'" 7~ II laO.a~E -~9·8 i,tC.. - / II
eG~~OB./~ ~~/8IE -~~8~..:.-
p-/;? t,a~~ ., t:?/. ~ J'~94E -~/.7
p -/4 " e~2"'74.T:' ~~<;~E -7~.1
?"/5 ..~G2'" 97:~2 18~.8C~ -.?~.c;
'~-~-~. --
7A8LE~-1
~-7
11.-"
"~~
~~~
B'-
.j
••
Cl'\J
~•
~-rs
--
......-..~-
\),....
~i:::~
~~
~,
~~
~q:
('i
"I
~~~
•C\-
.--
Nt--
0I
~~C\
~~~
~~
~~
~~I
,I
~~
~C
"-d
SQ.
~tt
'i\"-
••
,~~
" I
~f\
~«\J'"
Ir-d
S~
~~
~
~,.3'
/IJ-~-d
S,-
(-ct-
0
~~
~~~
~~
~)::.~
...~
~,~
"'-
dS
~0
~~.\1
~~
~ru
~t
to-~-~-------
~~"
•~
~~~
,.~
a~~
~~
~G
~~
~"-I
,~~
Q.,
C)E
\"
I-rs_
__~
_!t___
__.
___
o~
e'"
.t~
()0
,,~
~~
\I"
.~ClJ
'""-~lI'tq:
'"--
-f
•
o~
~'-
~()
~~
~0
~~
~0
~~
~~
q,tlJ
~1
I~
,I
If
I
jl.,ic
NO
I.Lf?
"A.3
7$
200
(EAS"r)
~
~~~
s.r--." I"+ . .P-7 ~~/~ "
~~
~~
~
/~o/00
II
-¢-.sr-4i"• ,&:'-9IIII
I..L" p- /.:! .:I
P-7 tElSP-2 AS.r-"IIsp
-J' .P-/~y I p_<;
l!J.sp-~ I I • • p_ ,N
P-;T :P-4 .p-/4 .p-/o
I II II
I P-8I-I +SJ-~I II II II
IIIIIIII
~p-4tBIIIII
IIIIII
~o 0 ;$0
OP-;::-.S'~7, I'~
IIIIIIIIIIHrSI-2
IIIIIIII,II
/00/~o
-+-: SI-I.p-/
~-T'----"'---I-" -T-- T----.-··. --~·T- _. -- .,---- --, .. _---.--- - --.,------.--.-------.--.
a ..s~r;/'fl'7~r7~ ~t"C7~~
-$- /nc//;,o'"~r~r
• P/;':'ZO/77~r~r
"~~
~'(
~
~Q
~"=~
c::'~O .:>00
(~£_crT)
2~4"'OO
STATION
~.p..oo
cZ>(,;~'"00
aG~~~O
~~~~~o
L.OCATION OFF/ELO /N5TRU/YIENTAT/O/Y (PLAN Y/£W)I- 95" STAT/ON ~G~ TEST SECTION
I'~f\)I
FIGURE ~-ie
-73
-
Cf\~
~~~
~~
~~
.~~
~
"~
i"~
~tJ
~C\a
~~~
""-l'" ()
\J"-
~~~
~~~
'"
tf)~
~,
~~
~()
~~
~'"~
~~
~~~~
"'"
~~
«ij~
(b..~~
~~~
~~~
't,"~tI)
0~
~~
~~
~
~'t-
't
:,1/C
NO
I.J.V
A;?
j..J../'../.7~~/\/"'f;u/.i'
70
//I,I,...,,,,.nl S:.",.,. 4:~~ P-H-A -~~~ CO p-~-.s -4/.6~ P-/4-C -7'7':~
~
""q,
~ 50;/ ..~~:::s
~ 40~
~
~ '0(J
~!J)
~ ~O
~~
10
o
EXCESS PORE PRESSURE t/S EMBANkMENTELEYATION
STATION ~~~, IN/TIAi. CONSTRUCTION
-74-
70<I P-I
B p-,e
II I hr: o/~~r ;Q;lur~
" GO II 7hrs. o'lt:Ar '-QilurtIA~~
~
"C$0,
iJ
~
~ 40~,IJ,I,~ ~O~
~~
t:201:\'I)
~.J
~ /0
40 fO
£h18AN,rh?£/VT EL.EV"ATION, tl
EXCESS PORE PRESSURE /1'5 E/YIBANKM£NTEL.£YATION
STATION t:9Cj' TEST SECTION
FIGUR£~-~
- ,~76-
70
p-§
~ ~O
~~
~;;'0,
~q,
""•~ 40~~
~~ :/'0
~()~ eo~
<:> p-~t.jIV
I:l P-4
~ /0 e. p-~
o
co
EXCESS PORE PRESSURE YS £MBANK'h'/ENTELEVATION
STA TION 2Cj' TES·7 SECTION
•
-77-
so410
e p- /2[i p- /~
& p- /~
m I hr: a,t.r rQ,'/ur~
o 1...._1i.........7_n_rs._._Q....~_#t.,._~_a_;~_~....~~-.jI__.......L_---..;;
)'0
+0
t:EO~-""'''''''''---+--------+----6---''--_'''''''
70
" GO~
~"0 ~o I---~--...,.. .........-..--__+_--_+___-_........"'-.
~"
£h1t3A/\/KIY1£Nr £~£J,/'A710Nt r/
FA'CESS PORE PNEsSUR£ Y5 EMBANKMENTELEYATION
STA T/ON ecj' TEST SEer/ON
FIGURE ~-7
70e P-Cti P-IJ
4 p-,GO 9 P-/o
~ e ,4:'- /1
~ II / h~ ~l'tflV' '.,"lur.~ II 7 hrs. a~t.,. '1:I,·lu,.~
" §o ~;'$trunM'nt()
incp."o""''',~..~
40~~~
~O«~~~ ~9
~ ~99
~ 10
o
-78-
-40 co
EXCESS PORE P;?ESSl.IRE' 1/5 £h'l8ANKhlEIYTEI.EYATIO/V
S7AT/OI'./ e~J' TEST SECTION
rIGUR£~--e
70e P-7m P .... /~
~ IJ I hr: Dl't". _,"lur41
~ C;O II 7 hr.s. ~"... '4ItI~~
~~0
"'- P-O"~~
~ 40~~~ TO
~~
~.eo
~~ 10
o
co
£h1BA/VKh1E/V7 FL.EV"""rloN, It:
EA'CESS PORE PRESSURE YS EMBANKh7ENTEL.£YATION
.sTA TION ,2C;-,J' rGS7 SECTION
FIGUHE'-9
EMBA/Vkl)'1£NT EJ.£VA7/0N • ,1.
GO48
o.~.-------+------t------+-----+-~---+__-___t
~ S~tlltte",t!'nll"sE"'hQ"'K~1ElI!'I': 1-0--....-..-.--.-------1O.-rSl'ot~Q" CIt;' r.stStftCl',on
o SP-44~ SP-,e
O.~ Q SP-~
[!J SP-4
,.
SETTLEMENT YS EMBANKMENT EL£YA710NI- 9~, STAT/ON~~rEST S£CTION
FIGURE ~-/O
--.~181-
~~
"~
..~
~~
~
'"I
~Iq
~~t-..
~~~
~~~~
~
~~~~
,ClJ
§~I
,,
~~
:t:t
tq<.:>
I::J
~~
~~
~'(
'"~~~~~Q~~\9
,."-
q,~
l~
'(\~
\"
()0
()0
0()
~Q
0()
0,
II
,.L(~
...L
NJP
C/.S
'AO
U/
711'.::>/,.L.,w
3A
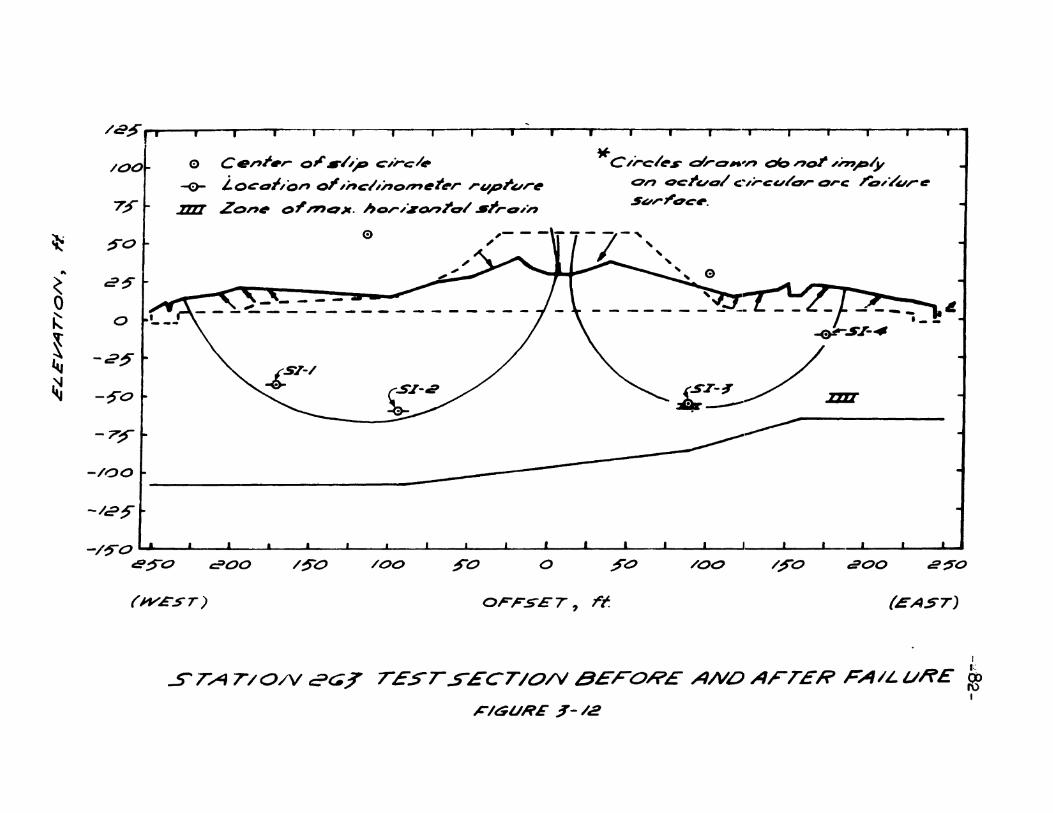
/a:/S*
/00
7:f
~~O~
~
~ a~
0~ 0
~-2~
~
~ -~O
-7?
-/00
Q Cenr.,.. 0;./~p c:,rc/.
-e- ;"ocff:lt,Qn J ,;'tJ:I,;"o'"~ttI-r ,.uprur~
.m:r Zo,,~ 0""'Q,JIt. ho,.,zonl'o/ sl'ro,:"
*'c /rc:It!'S' d"t::7~'" abn~"mp~on OCrUQ/ C~';-CU/D"Q'-C .l"D'/urd'Suri'Dctr.
~~
4,
-/c>~
2~O/~o ~oo/00ffOo~o/00/~o~oo
-/~o ' • , , , , , , I I I , , • I , I , I I , "
e:;)o
(J+'£ST) OFFSET, rf. (EAST)
r
S TA r /O/V 2G.J" rEST5ECT/ON BEFORE AND AFTER FAIL vR£ ;»I\)I
,c-/GURE ~- /2
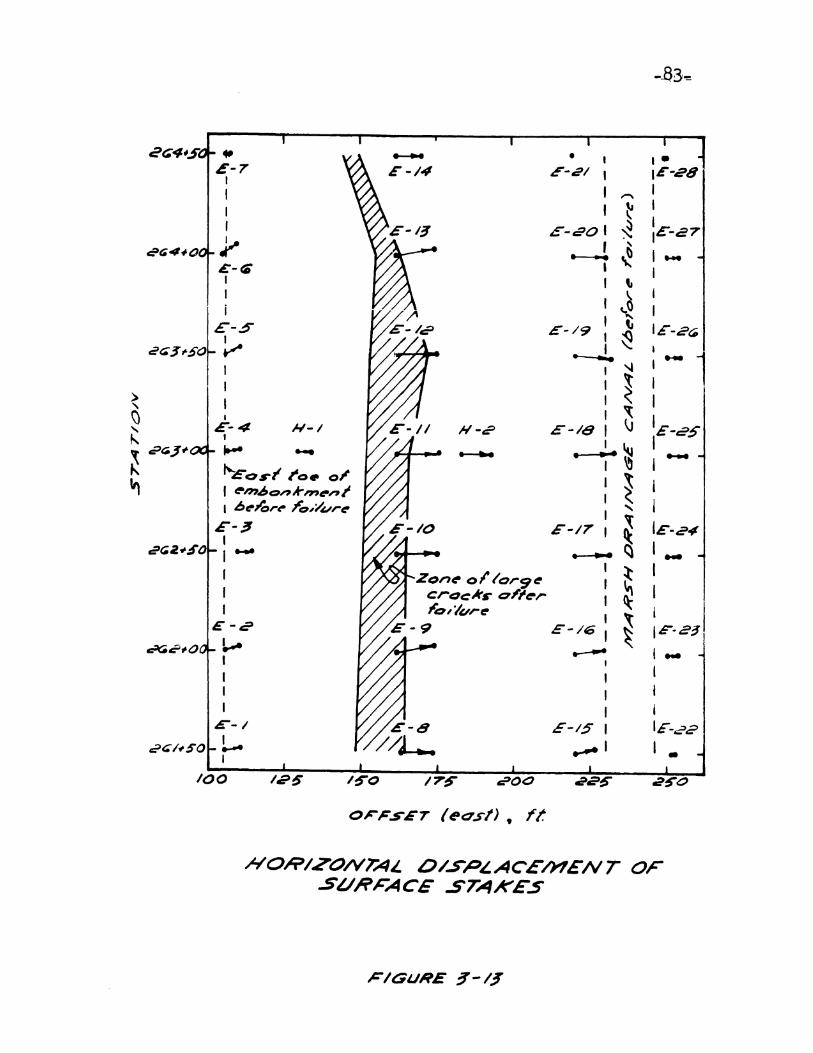
•
2~4'S4 .- ......... • I .-£-7 E -14 £-21 I IE-28I
I II ~,~
IIIr £-~Ol ~ IE -27
~ I,
C'~4.,.(), -..... ~ I ....£-fG ,
II ,"I~
,Ii~
I£-$ £-/9 ' IE-2U;
I I ~~~~;.SO ~ .----.l. ,
:'-1I I ~
I t ~> I : ~ I"\) I
£-/8 f ~ IE-as" £-4 1-1-1 N-tF
",
~~I
~ t9~~.; I-- .... ..--.... • , ....J\ ~£os-' 1'0. 01' I
~ I"l I ~m,J,Q~k,"~,,1 ,1I 6~lOr~ ;oJ';I'vr~
I "£-~ £-/7 , ~ tE-~~
,:Jr;~-I>~OI
~ I ...I .... .-.-....I
~II ZOrlt!' ollo"9~ I
I crt::lclrs- a't~r I ~I
I ;o,1ur~I
~ :F-eifl£-~ £-9 £-/6 ,
~~.,o !.--e ..---.. I ...I ,II ,
I , II I
,,,:- I £-1.5" I IE-2C>
c?~/.,SO ~ ....... 1 I •I
100 /25 /~o I~~ cPOa .a21j 2~O
O':-FSET (east) • it
HOHIZONrAi. O/SPL-ACEh1£N T OFSl./R~ACE .srAKES
FIGURE ~-/~
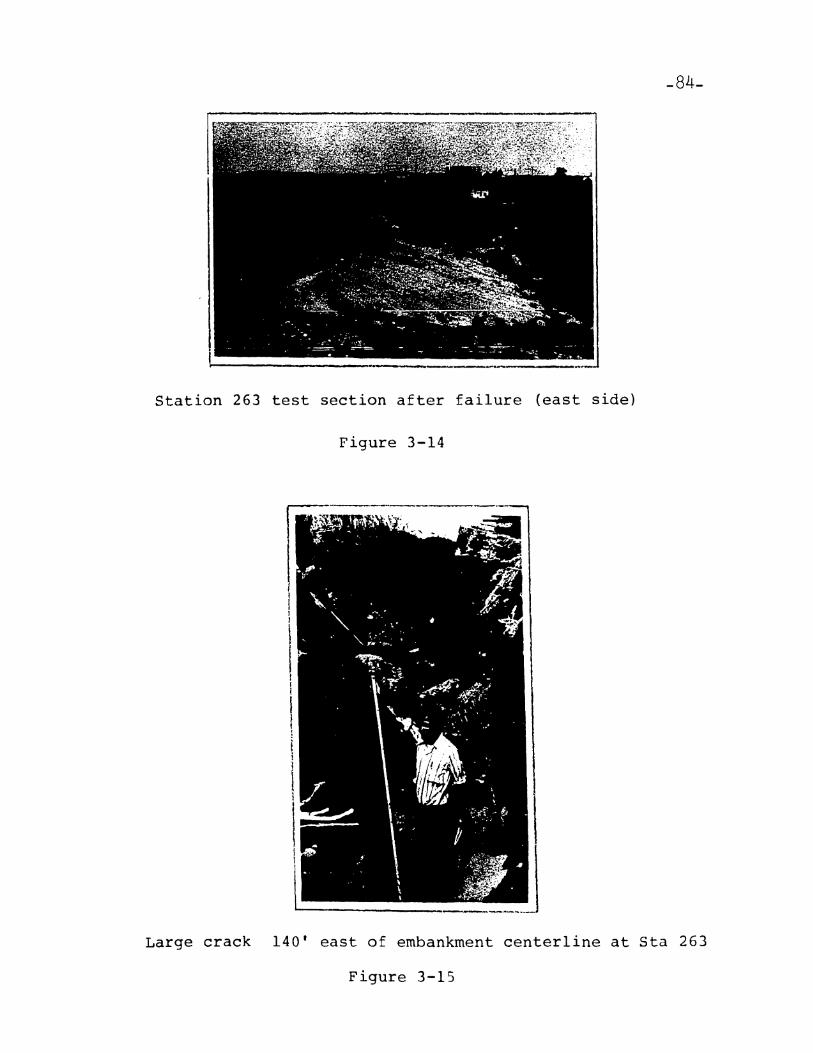
-84-
Station 263 test section after failure (east side)
Figure 3-14
Large crack 140' east of embankment centerline at Sta 263
Figure 3-15
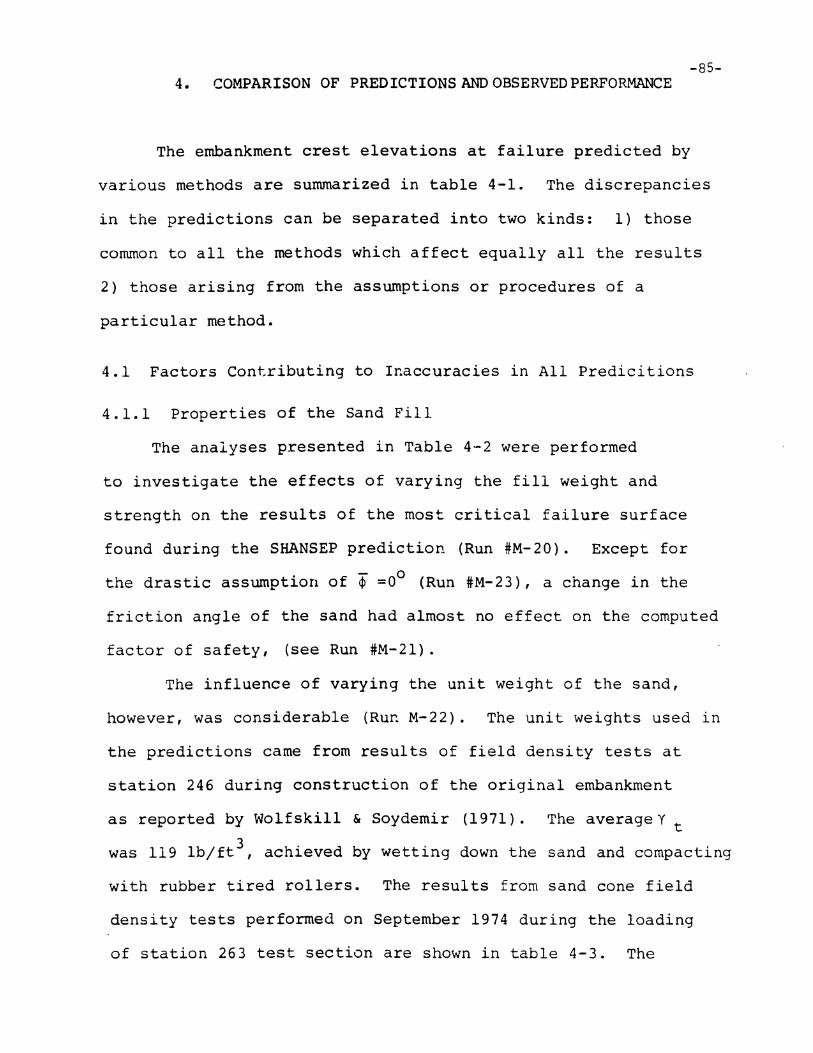
-85-4. COMPARISON OF PREDICTIONSANDOBSERVEDPERFORMANCE
The embankment crest elevations at failure predicted by
various methods are summarized in table 4-1. The discrepancies
in the predictions can be separated into two kinds: 1) those
common to all the methods which affect equally all the results
2) those arising from the assumptions or procedures of a
particular method.
4.1 Factors Contributing to Inaccuracies in All Predicitions
4.1.1 Properties of the Sand Fill
The analyses presented in Table 4-2 were performed
to investigate the effects of varying the fill weight and
strength on the results of the most critical failure surface
found during the SHANSEP prediction (Run #M-20). Except for
the drastic assumption of ¢ =0° (Run #M-23), a change in the
friction angle of the sand had almost no effect on the computed
factor of safety, (see Run #M-21).
The influence of varying the unit weight of the sand,
however, was considerable (Run M-22). The unit weights used in
the predictions came from results of field density tests at
station 246 during construction of the original embankment
as reported by Wolfskill & Soydemir (1971). The averageY t
was 119 1b/ft3 , achieved by wetting down the sand and compacting
with rubber tired rollers. The results from sand cone field
density tests performed on September 1974 during the loading
of station 263 test section are shown in table 4-3. The
3average yt was 122 Ib/ft •-86
The additional fill placed on the
station 263 test section during loading was not systematically
compacted as was the sand for the original 40 ft. high embank-
mente Therefore, it is reasonable to assume that the density of
the original embankment was at least the same as that of the
additional fill placed on the test section. The sand unit
weights shown in table 4.2 for Run #M-24 are believed to
represent better the actual field conditions and were used in
all subsequent stability analyses.
4.1.2 Mode of Failure
The failure of the embankment was unusual both in its
surprising length and in that it occurred to both sides of the
embankment probably simultaneously. The stability analyses
provided solutions for two dimensional problems and it would have
been impossible to predict the longitudinal extent of the failure.
The failure involved embankment sections of three different elevations
and was probably propagated by a vertical shear mechanism. Its
effect on the factor of safety as computed by two dimensional
limiting equilibrium is not obvious. It is expected, however,
that the computed factor of safety at failure would be less
than one due to end effects. The magnitude of these end effects
was estimated to be 6% from a series of progressively
shallower slip surfaces.
The simultaneous failure to both sides was also impossible
to predict by the methods employed. Chapter 2 showed that the
factors of safety for both sides were essentially the same,
-:87-al though'o'.slightly lower to the west than to the east. The
similar factors of safety indicated an equal chance for failure
to either side but all the slip surfaces considered assumed
failure to' one side only. With an incorrect failure surface
close agreement between predicted and observed elevation at
failure would be fortituous.
4.1.3 Time Effects
The loading of the test embankment was completed in about
four weeks. Duncan, (1974), has found creep in samples from
station 263 to be significant but loss in strength due to creep
was not considered in the analyses performed. The undrained
shear strength should had been decreased slightly to correct for
time effects. The effect of neglecting creep, however, is
probably small when compared to the effects of the incorrect
weight of fill and incorrect failure surface.
4.2 U.C. and U.U. Case
The predictions based on Unconfined Compression and U.U.
tests were both much too low, in agreement with results obtained
by 0 I Appolonia, et al (1971). The actual elevation at failure was
under estimated by 33%. Ladd (1971) attributes the low strengths
in DC and UU tests to the loss in strength from sample distur
bance. He estimated that UC and UU may underestimate undrained
strengths by 20 to 50% for Boston Blue Clay. Clearly, the
resul ts from this field test indicate that the strengths ~asured
do not provide a reliable estimate of the factor of safety in
Boston Blue Clay, UC and UU test could be used only as strength
index tests or as a very conservative estimate of strength. -88-
4.3 Field Vane Analyses
The uncorrected Field Vane most closely predicted the
embankment elevation at failure. with field vane strengths the
failure elevation was under estimated by only 7 .1%. The
correction suggested by Bjerrum (figure 2-12) was in the wrong
direction for the I-95 embankment and the correction based on
the new data (~=l.l) was too high, but they both were within
10% of the right answer.
The field vane stability analyses show that the field vane
is superior to the UC or UU tests as a strength index test for
stability analyses.
4.4 SHANSEP Analysis
The SHANSEP prediction was the only one based on Morgenstern-
Price analyses and was as good as the Field Vane but on the high
side (+7.4% error). The main disadvantage in using M-P is the
difficulty in locating the most critical failure surface. Unlike
LEASE, where a large number of slip circles are analyzed in each
run, M-P failure surfaces must be analyzed individually. Run
M-24 in table 4.2 shows that, with the correct sand densities,
the most critical failure surface found (M-20) yielded a factor
of safety of 1.016 at the actual failure elevation. The error
is only +1.6% which constitutes a very good prediction.
Unfortunately, this would be a type "c" prediction, made after
the results are known.
The use of the incorrect unit weight of sand together with
-89-the possible inability to locate the most critical failure
surface are believed to be the major contributors to the
+7.4% error in the SHANSEP prediction. SHANSEP was the only
method which could estimate the increase in strength of the
partially consolidated foundation, without requiring additional
field or laboratory strength tests. This capability makes
SHANSEP particularly applicable to problems of embankments on
partially consolidated foundations.
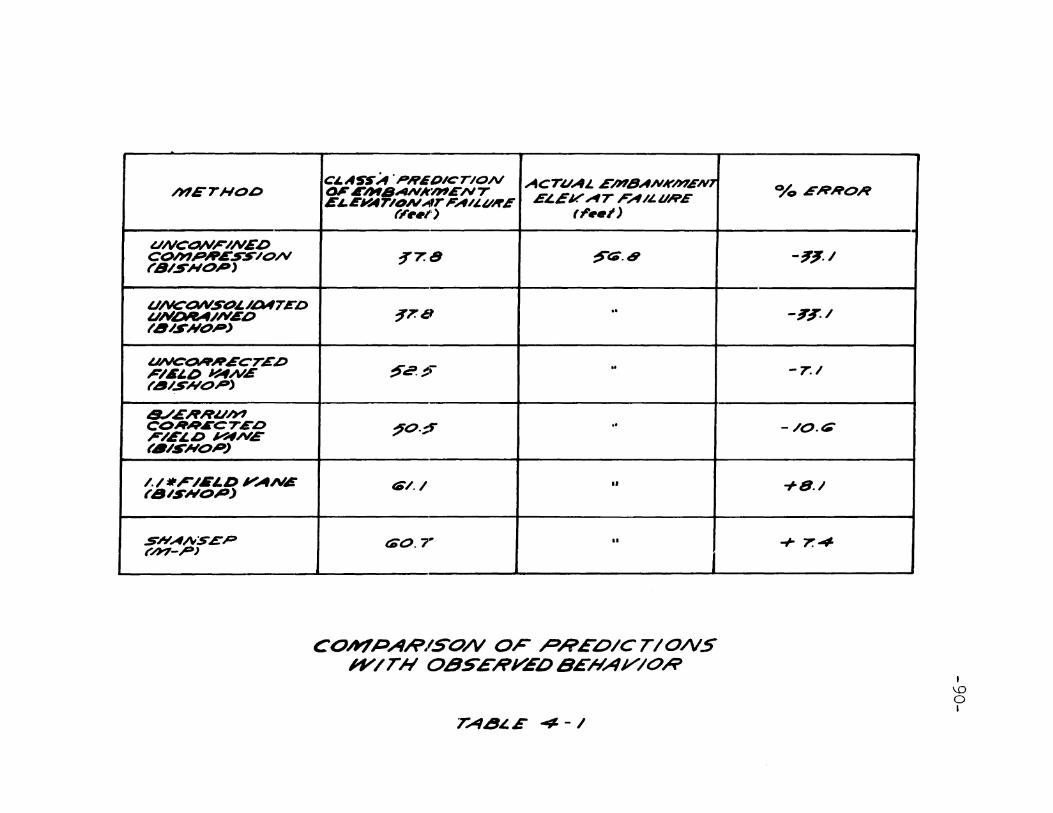
~~"
"~
"l
!t\~
"-~
tt\ti\
~~
Cl)~
'#.I
I,
1--~
I
~~~~~
~~
Cb~~~
~:
::
::
~~~
~~~
~~'-
~~
\I~~~~
O~~
:-;.~~
t~~~I~~
'b~
1-'"
,~
'\\\
""
~l~~~
~~
~~
~I~
~~
~
:'I§~,,~\j~~
~~
~~
"Q
~~~~
~~
a~~
~~~i
~~~~~\
~tl~~\
~"
~i()Ii!I~~
t~QO
~~~""
~~i~
Q~
~~~~~~
~~
~~~~~~.
~O~i~~
~~~Q~
~~
~~o
l(\:IJ\~
-90
-,I
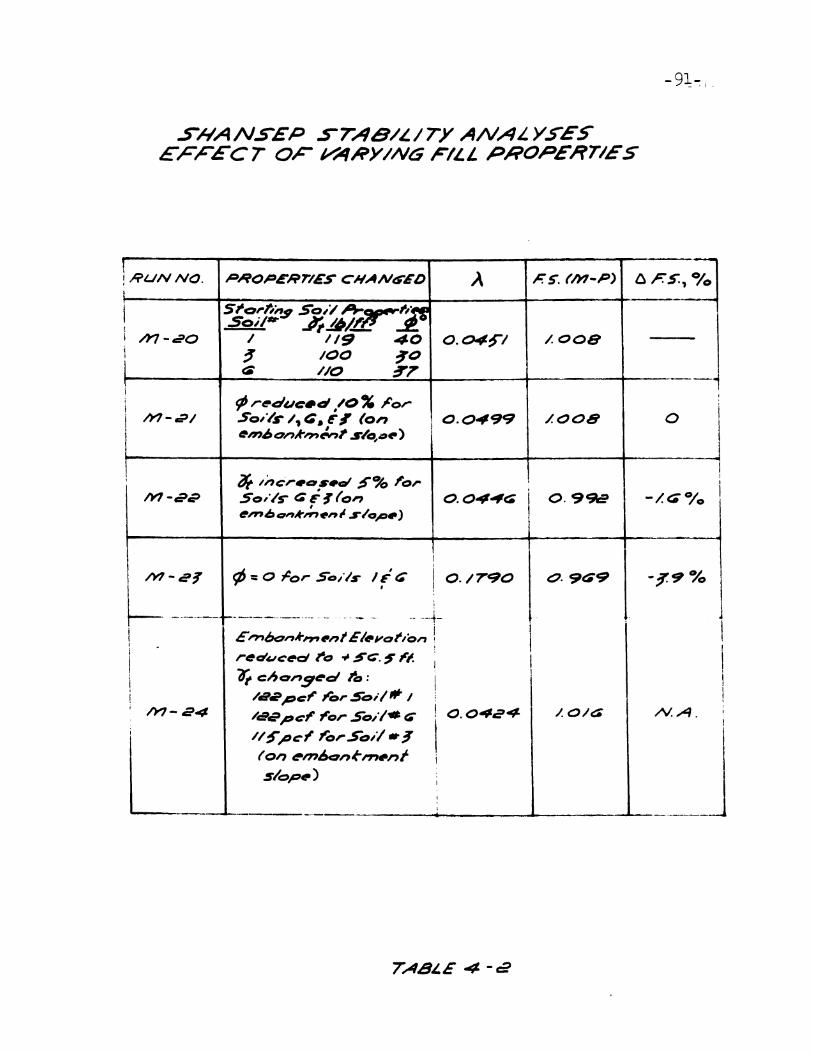
SNANSEP SrAS/LITYANALY5ES£FFECr OF ""ANY/Nt,; FIL.L. PROPERTIES
-91-- • I -
lRIJNNo. PROPERTIES CNAN~GD A ,c:s. (/'i'1-P) Ii r:s., 0;0t, 5~o,t;"'$ So// A-rl,'!fI So;," .ift.&tttL ~i h1-cPO I 1/9 40 O.~'I /.0081 ~ 100 ~o
t t; /10 :r7r
_...i ¢ ,..~duc.d .~O% ~o,.
~
Ith'/--='I .so,·lr /,~. ~I' (0" 0.0.,99 /.C08 0
Jea",J,onk""Jv." ..."o,~tII)
I ~ /;'C,..o...o' ~% 'or1I
j
/Y/ -aC' So,/s- (; i-~(o" O.O.,,4t:; 0.998 -~G"%I
~""bQ",k,".,,~ S~Gp.)
II
I
/Y!- C'~ ¢ = 0 .,cor So/Is 1£ t::; I 0./790 0·9(;9 -~9%,
~-_ .._--- ~-._-_._.~ ~-- -- ~.- ~ --- -_.~-i £,"1:10,.,,+,,,,,.,,1GltI'lI'ot/on ! ! II
~ I I
I"~duc~d 1'0 ~ St::. ~ 'l- I 1 I~ c:ho"~~d l'et:
I ,! I1 /8,rpc'" ,ror .so;/ JIll- J I! 1! /YI- 24 /,gepc' ~or So~·I- ($ 0.0424 /.O/~ /\I. A. I
II
i/I~pt:~ 'o,.Soll.~
(on ~1'1760n~,.,.,."f islop.) :
I
~I
-~-'-
TA8L.E 4- -1:2
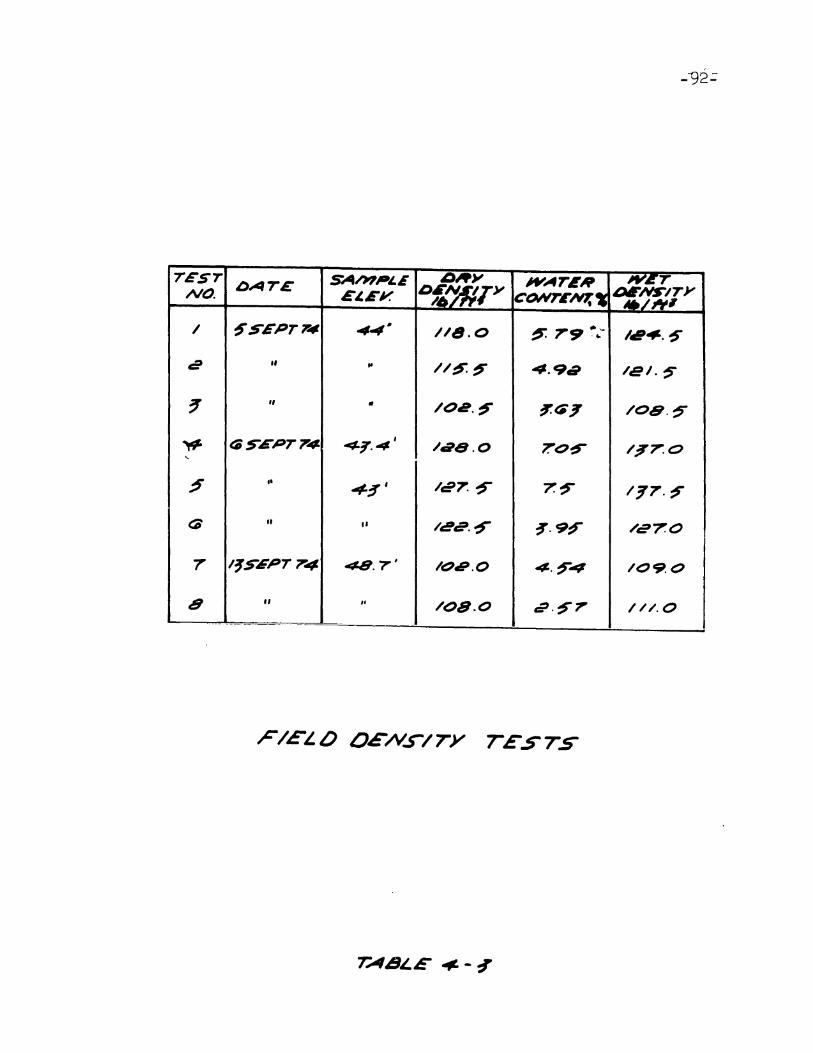
•
TEST SAh'lJII'££ D~Y wArE" ",6TNO. DATE
E~EV: Df,,'1RT>' CONrc~, DI~/TY./,.",
I ~SEPr1¥ 4"'- 118.0 ~ 7" *:...'- IC'~.~
,e II ..//~~ 4.98 /el.~
~II • /o,e.~ ~<:;J' /O8.~
t:8S-EP774,
7:0~ /~7.0.",. 4-1'.4 /.8.0,
::s- ,.4~' /C'7. ~ 7:~ 1~7.~
a " " /,ee.~ ~.9~ /te70
7' 1~S-GPT74 48.7' 1t::Jef'.O 4.~4 /09.0
8 II II /08.0 ,;J.~ 1'" 1//.0-._- ._-
~/EL.O OGNf/7Y rESTS
TA8LE .". - ~
.>
5. POST FAILURE ANALYSES
Following the succesful loading to failure, stability
-93-
~nalyses were made using the best estimate of the actual field
slip surface. Three posibilities were considered; 1) a circular
arc failure surface through the locations at which the
inclinometers sheared. 2) A non-circular failure surface through
the same location. 3) A non-circular surface through the location
of maximum horizontal strain before failure. No post failure
analyses were perforrnec:'. wi th UC or UU strength data since, as
shown earlier, the strengths are much too low.
5.1 Field Vane Analyses
Results of Simplified Bishop analyses with the slip
circles shown in Figure 3-13 are shown in table 5.1. Surprisingly
for both the east and west sides the computed factors of safety
using.the uncorrected field vane are higher than one. A
was computed in Chapter 2 for a slip, surface campatible
FS= 1
failure to one direction atan embankment elevation 4 feet lower.
The Bjerrum correction factor produced a reduction in the
computer factor of safety of about 3% with the correction being
in the right direction this time.
Two conclusions can be drawn from table 5.1 and Figure 3-13;
first, the circles drawn in Figure 3-13 are at best an upper
bound to the failure surfaces, if the failure surfaces were
circular. In both sides, the most critical arc with the center
as shown in Figure 3-13 passed below the location at which the
inclinometers ruptured. Secondly, the failure mechanism appears
I,
-94-to have had a great influence in the embankment factor of
safety. The Class A predictions indicated that the field
vane yielded a factor of safety which was too low but the post
failure analyses suggest that a field vane correction factor
less than one should be used. This contradiction can only be
explained by noting that the failure surface used for the
predictions was not correct. The failure did not occur
through the most critical surface for a one sided slide.
Based on the post failure field vane analyses,
the appropriate correction factor (~) for the east slide is
0.94 and for the west sl~de 0.92. These factors have been
plotted in figure 5-1 for comparison but their meaning should
be evaluated carefully. Bjerrum (1972;, in suggesting his
correction factor, assumed full mobilization of the shear
strength in the sand fill if no cracks had been observed prior
to failure. If cracks were present, the strength of the fill
was ignored. No cracks were observed at the I-95 test embank
ment up to 13 hours before failure. Based onBj~'s criteria
the analyses should include the shear strength of the sand, but
Figure 2-11 indicates that most of the embankment sand is in the
slice ignored by LEASE. The same is true for the circles shown
in Figure 3-13. However, the arc through the fill is essen
tially vertical which makes the contribution of the
sand to the resisting movement very small and probably
n€gligible.
Perhaps more important than the fill strength ased"is the
fact that all of the cases cited by Bjerrum started from
-95-geostatic conditions. The additional fill for the station 263
test section was placed an an embankment with a partially
consolidated foundation. Thenan-K conditions existing ato
the site, combined with the fact that all the other cases
reported involved failures to only one side of the embankment
make the interpretation of the two new -~points in Figure 5-1
very difficult.
5.2 SHANSEP ANALYSES
The post-failure SHANSEP ANALYSES are presented in Table
5-2. Runs No. B-3 serve to compare the field vane and
SHANSEP analyses of the assumed slip circle. The SHANSEP-
LEASE results are essentially equal to theFV results, after
applying Bjerrum's correction to the field vane strengths.
Again, a failure surface deeper than the circle shown in Fig-
ure 3-13 is suggested.
The Morgenstern-Price analyses are illustrated in Figure
5-2. The failure surface through the zones of maximum computed
horizontal strain (M-26) yields a factor of safety much too
high, indicating that the failure surface did not follow the
zones of maximum horizontal strain. A _inite element analy-
sis of the test embankment made by Hawkes (1975) using pro-
gram FEECON predicted the pattern of horizontal deformations
successfully. However, FEECON failed to predict the Plane
Strain Passive section of the failure surface.
The minimum factor of safety obtained (run Mn 27) was about
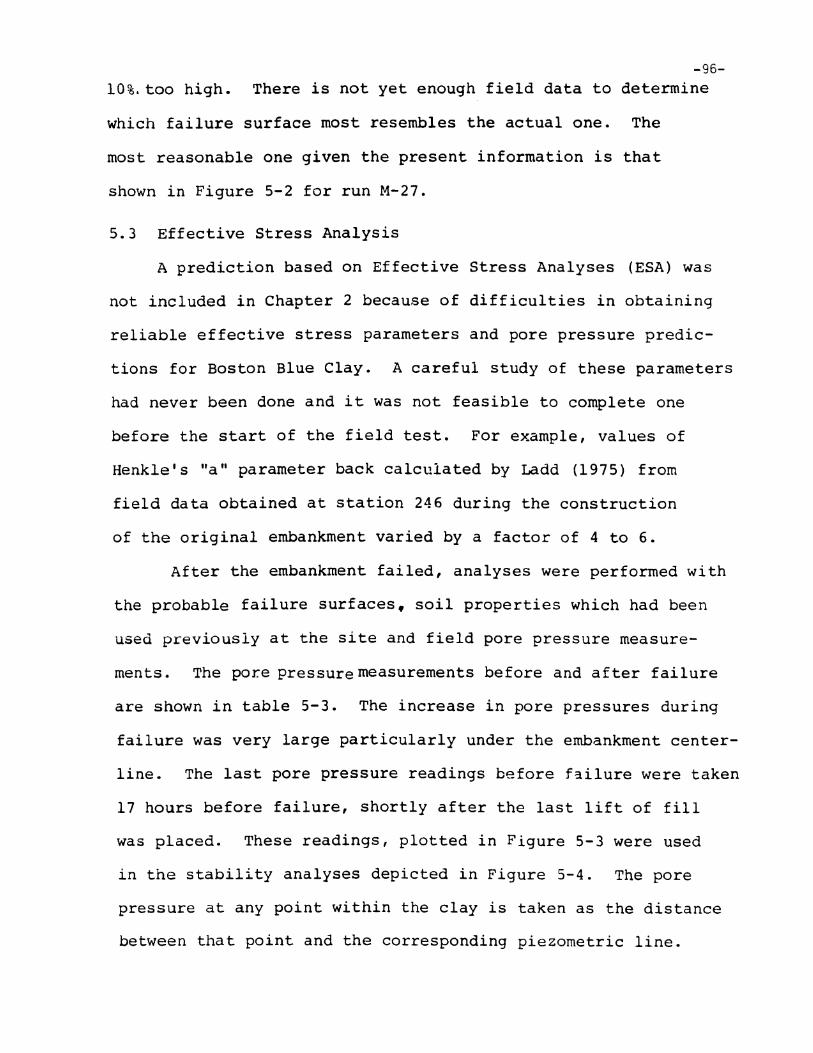
-9610%. too high. There is not yet enough field data to determine
which failure surface most resembles the actual one. The
most reasonable one given the present information is that
shown in Figure 5-2 for run M-27.
5.3 Effective Stress Analysis
A prediction based on Effective Stress Analyses (ESA) was
not included in Chapter 2 because of difficulties in obtaining
reliable effective stress parameters and pore pressure predic-
tions for Boston Blue Clay. A careful study of these parameters
had never been done and it was not feasible to complete one
before the start of the field test. For example, values of
Henklels "a" parameter back calculated by Ladd (1975) from
field data obtained at station 246 during the construction
of the original embankment varied by a factor of 4 to 6.
After the embankment failed, analyses were performed with
the probable failure surfaces. soil properties which had been
used previously at the site and field pore pressure rneasure-
ments. The pore pressuremeasurernents before and after failure
are shown in table 5-3. The increase in pore pressures during
failure was very large particularly under the embankment center-
line. The last pore pressure readings before f~ilure were taken
17 hours before failure, shortly after the last lift of fill
was placed. These readings, plotted in Figure 5-3 were used
in the stability analyses depicted in Figure 5-4. The pore
pressure at any point within the clay is taken as the distance
between that point and the corresponding piezometric line.
-97-With a = and a ¢ specified, the analysis is similar to the
undrained analysis described in Chapter 2
The same sand properties as'in all other post-failure
analyses were specified and two different sets of clay
properties were used. Guertin (1967) suggested that values of
C =660 lb/ft 2 and ~ = 21.1° for the over consolidated clay
- - 0and c =0 with ~=26 for N.C. were appropriate based on CIU
tests. Kirby & Lambe (1972) used 0=0 and ¢=26° as reasonable
values for both the o.c. and N.C. strata.
The results of the ESA are presented in table 5-4.
- lb 2 - 0Although analyses with c = 6~O Iff and ¢ = 21 give a F.S.
that is too high, those using ¢=26° with no cohesion compare
reasonably well with the Field Vane and SHANSEP post failure
analyses. Factors of safety are greater than one for all the
effective stress analyses but this is reasonable since the pore
pressure used are only ~ lower bound to the actual pressure
before failure. The ESA and TSA should yield the same factor
of safety along the same failure surface. However, the difficulty......
involved in evaluating the parameters required c make the ESA,
Effective Stress Analysis a less powerful tool for the undrained
stability analyses of embankments.
5.4 Effectivness of Field Measurements as Indication of Impending Failure
One of the objectives of the instrumentation installed at
the station 263 test section was to provide an advance warning
of impending failure. As mentioned before, the failure was
sudden and unexpected. In the paragraphs below, the field data
•
-98is .examined for a possible warning of instability which might
have been missed during the progress of the field test.
5.4.1 Pore Pressures
A common warning of impending failure obtained from
piezometer data is a sudden, marked increase in pore pressure
or a change in slope of the excess pore pressure v.s. embank-
ment elevation relationship. Hoeg, et al (1969) mrlD'Appolonia
et al (1971) attribute the change in slope to the local
yielding that occurs when the maximum shear stress in the soil
reaches the undrained shear strength, with the possible
exception of P-7 and P-lS (Fig. 3-9) no change in slope of
the excess pore pressure v.s. embankment elevation plots were
observed. In P-7 a possible break point is detected at eleva-
tion +49 feet and similarly at elevation +52 feet for P-lS.
Since these piezometers are far away from the embankment
(see figure 3-2) the indication of local yielding in their
vecinity is significant. The soil at the toe of the potential
failure surface will keep the mass from sliding, while the soil
near the embankment has already failed (a clear indication that
the factor of safety is not the same along the circle). When
yielding occurs in the remaining intact soil, failure will take
place. The location of the actual failure surface will be
determined by the inclination of the failure planes at the toe
of the sliding mass. Near the embankment, where shear stresses
have exceeded the shear strength on all planes, the failure
surface will follow a mechanism compatible with movements
along the failure planes formed at the toe. -99--
Determination of the break point in the plots of P-7 and
P-15 during construction was difficult due to the considerable
scatter in the data and rapid dissipation of pore pres-
sures. Therefore, whatever indication of failure
they provided, if any, was not identified at the time.
Construction proceeded for one more week and an additional 6.5
feet of fill were placed before failure occured. For the
station 263 test embankment pore pressure data did not provide
a clear indication impending failure.
5.4.2 Settlements and Heave
The plot of settlement v.s. embankment elevation presented
in figure 3-10 shows a change in the rate of movement of all
the instruments at an embankment elevation of 49 feet. The
change in slope of the settlement plots occurrs at about the
same elevation as the change in slope of the piezometer data
from P-7 and P-1S. Measurements obtained from the grid of
surface stakes do not give any indication of instability.
Initially, as shown in Fig. 3-11 for H-l and H-2, a settle
ment was measured. The small magnitude of the reading however,
falls within the margin of error of + 0.02" considered reason
able for the optical survey. The magnitude of the subsequent
heave was small (less than 3 inches) and did not show any
revealing trends.
Horizontal movements during loading might also be used
to indicate whether failure was about to occurr. Horizontal
movement data were obtained during loading on 4 slope indicator
-100casings installed in the east side of the embankment. But
data could not be processed quickly enough to use to control
construction Hawkes (1975) presents a full discussion of
these measurements and how they compare with predicted values.
5.4.3 Summary
The best indication of instability is given by the plots
of the settlement plate data. However, the change in slope
of the settlement v.s. embankment elevation plot is a con
servative sign of impending failure. An additional 8 feet
of fill were required to cause failure after the elevation at
which the changes in slope occurred was reached. In an
actual highway embankment project, where future deformations
and loss in strength due to creep could be significant, this
first sign of instability should indicate a stop of construction
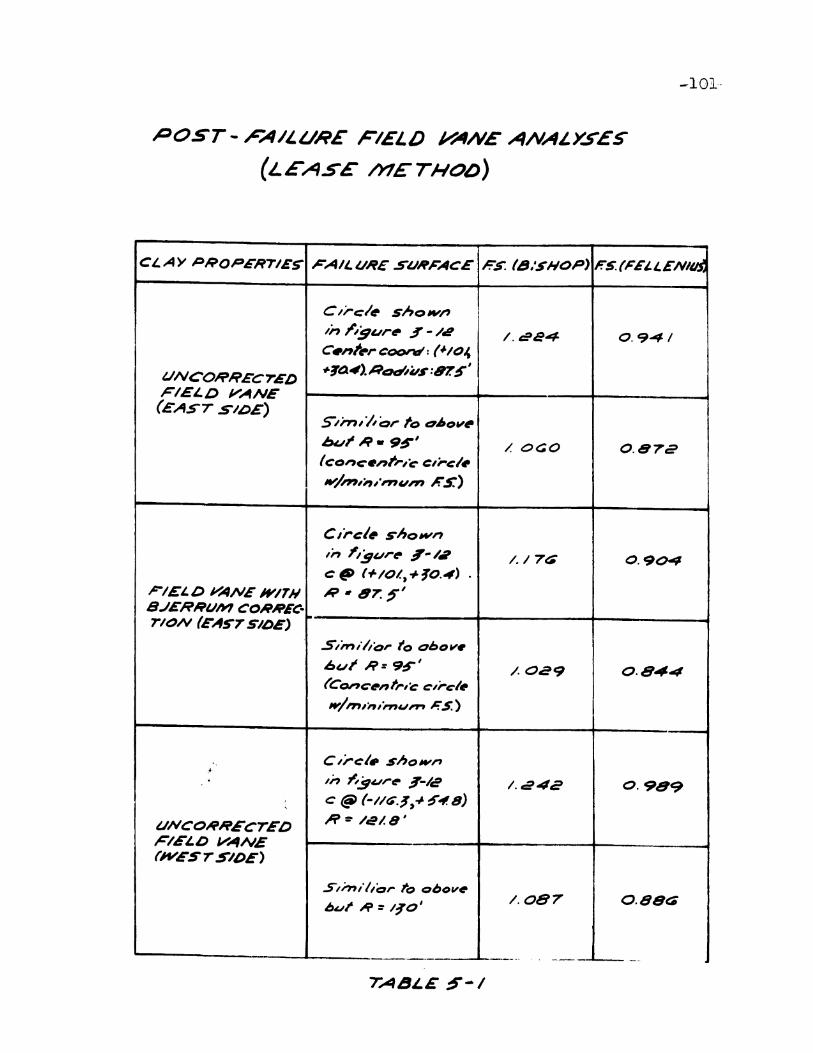
--1011.--
POST ~ rAII.UR£ FIELD V'ANE ANAI.Y5£S
(LEASE' METHOD)
CLAy PIi'OPGRTIES- FAILURE SUHFACE Frs: (a/SHOP) 1:5.(FGJ.I.EN/~
I.INCOli'REC7EDF/££D ~ANE
(EAST SIC>E)
c Irc/~ show"I;' ;igur~ ~-/.e
c."/~,.c~:(<#/t:J"
.,.~(J.4).R~~s:gr~'
S/m,1'Qr to DJJO"'~
bul' R- 9~'
(cone."t,.,;:- t:1;-t:/~
w/"""'-n'lU'" /rS:)
/. OGO
0.94/
0.872
0.904/. I 7(1;
c ,rcl. shown
/n 'I!1U"~ '-/1c t!J (+IOl,+JO.4) .
~. 87.~';:-/££D YAIVE WITHS..IERRtlN'I CORA'Ec.7/0N (CAS-7 SIDE) ~--------~-----.....--------
.s~in'·/'Q" to ahcv.bu;,I;'= 9~'
(ConCtI'"t,..,c e/rcl.
w/""",,",,," 1IrS.)
/.029 0.844
UNCOHRGCTEO~/GLD VANE(JIVES r SIDE)
C Irel. shownI;' ~.9ur~ §-Ie
c @J (-I/t$.~,~ ~~S)R=/,g1.8'
1. .:242 0.989
S,m/I,or to o"ov~
/J~I' ~ =I~O'/.087 O.SSG
-------------JL-- ._I0000-..__.__ '. ~ _
TABLE ~~/
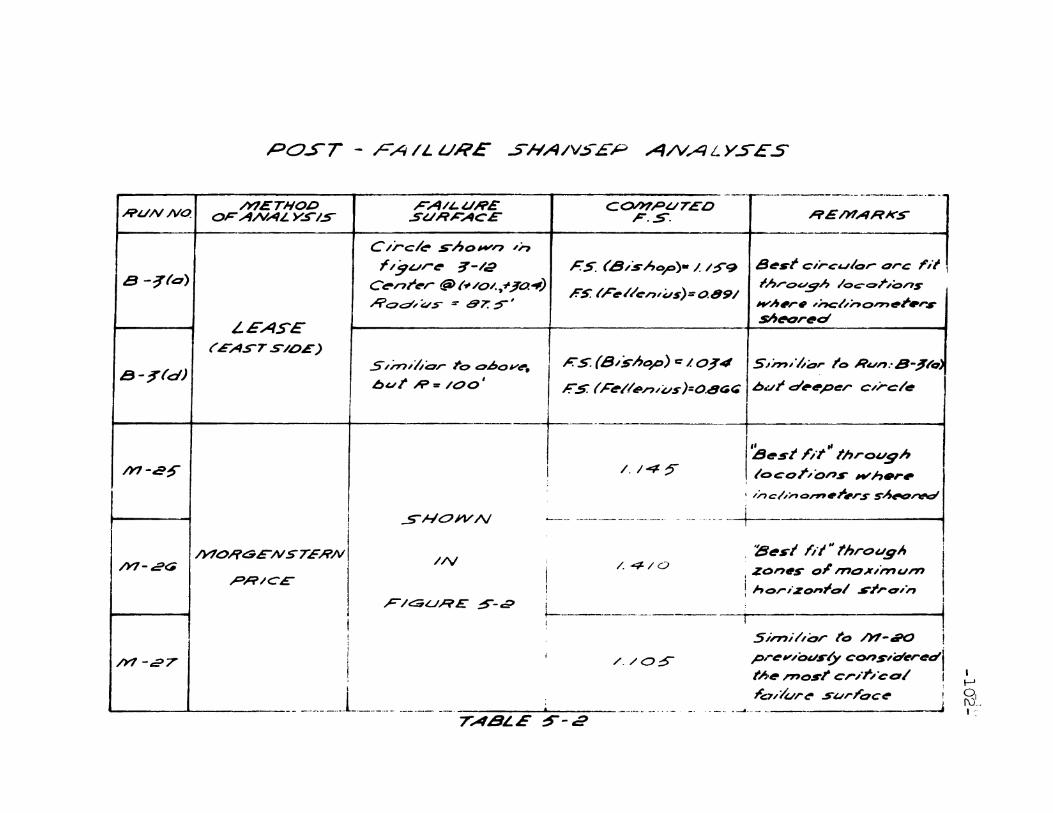
•
POST - FA/LURE SHA/vS£P ANALYSES
...------......---------------...-------------------.r----------------- -.-.........------------- -"-_._-~ -~._~ ..H/./NNQ h1ETHOD
OFA/\/AL. V.5I-S~A/LUHE
SUR,c-ACECOh?.;DU7£O
F.S. ~£/YIARKS
;&:5 (B~shD'p)c: LO~4 I S~;"'~·6Q" to R4J".·B-~l't:I)
Fs: (F~//en/us)=O.8Gfl; hur dt!-.p~r c/;-c/~
B -~(D)
B-~{d)
LEASE('EAST S/D£)
c /rc/~ s-ho".,n ~n
;/!7~r~ ~-/2
C~n~~r@> ("/O/..,~7a4)
~ad~us = 87: ~I
S/m~'hQr 1'0 o.6o,.,~.
but' JIP =' /00'
FS. (8/shop)- 11::>9
,l:S.IF~//~n,us)=a891
8~st c'",cl.Jlor orc ,,.tthrou.9h /oc:-t::7r,ons
H'h,r, ,nc-/,no,."~~.,,s
~l!!'Or~a
I I I I • I
/Y1-C'~
SHO;-V/V
/. /4:F" "8~st h-r through
locor~o"s I4J1'h.,..~
I /ncl,nonJ7.I',rs s~n:!*d---- -+-- I
I~
°1f\)--I:"._--..~ ... - .._- j
/./05
&J~sl ,il" througllj /. -4/0 I zan.$" Q; /T7o,xi/T7un'I
: !hor;zo";o/ srro,,, I
t---.------ i i5i",i//or 1'0 /W-ao r
pr~ .......Ov"'& con.s'dC"r~dltA·~ ,"osr c,.~·r~ca/ I
~7,.4IGlr~ .s~r;QC~ ~
//\/
~/C;;L/~£ ~-C'
TA8L.E ~-2
'&>A'/CE
/Y10fl6~NSTERN
/'Y1-~G
/Y1-~7
t
. . .__...1__.._..__ .__. . . ... ...._..

rA81. E $-~
".4~/EZ0h1ETER WATER ELEVATIONBE;:-ORE AND AFTER FAILURE
PIEZ. S£AI_t:10R il'VATc-R £LEJ/A7/0/V /N P/EZO/Y/:!:.--;-£'R ~ ,--7:
/VO. £L. EV 6~f'ore 17hr:s. Mforp Ihl: o;lt:'r 7hr'.s: o,r~r(Fr) loading ;Q,,'/urt!' 'a/lur~ ;Qi/~r~
,D-/ - S-C.§ -I-/9.c; +eO~. / 4J.I 47.:!
~ -cP -~ff·.? reP 9 . / +4/ .j' fJie.O p~'~8 I
I II
(,
I,&J-? -?'?7f -f-c:?9.7 f44.~ /o,s-r lostI
I '&>-4 -p-,~~ -f48.p r 7~.1 ;::,11/'9 ~~119
iI p.~ -79.~ "'49.9 r 7"~O ~/19 ~119II p - C; -40.~ +~O.7 r~/·F ~94
I
~c;;.8I
It ,i=J-7" -~8.~ +78 +9.7 74 I /8·0;
IP-8 -:'8.8 -f-~2. I -.f~9. I 7~.,J 71.8
1 ,&J - 9 I -~4. l' +a4./ +;;'9.0 47.9 FO.($
P-/o -cPt::. 7 ~8.4 +/9.4 /9·0 18.:;-
p -/1 - :!J9. 8 -,'~4. I t-~9.9 G7.8 7:s-,4-.,
P -112 -yp,8 1-cEJI· ~ -1-40·8
I/8. "7 a-=-. ~
~--/~ ~ 1)/.7 .,L4~.1 +7/.4 I /O~# 4- '78.0
P-/4f -r~'1 +~:T.' -r7c?O I (i7. 2! ~4.0
P-~5 -a~.~ r7·S +9.1 I/. G /~o
---~. -
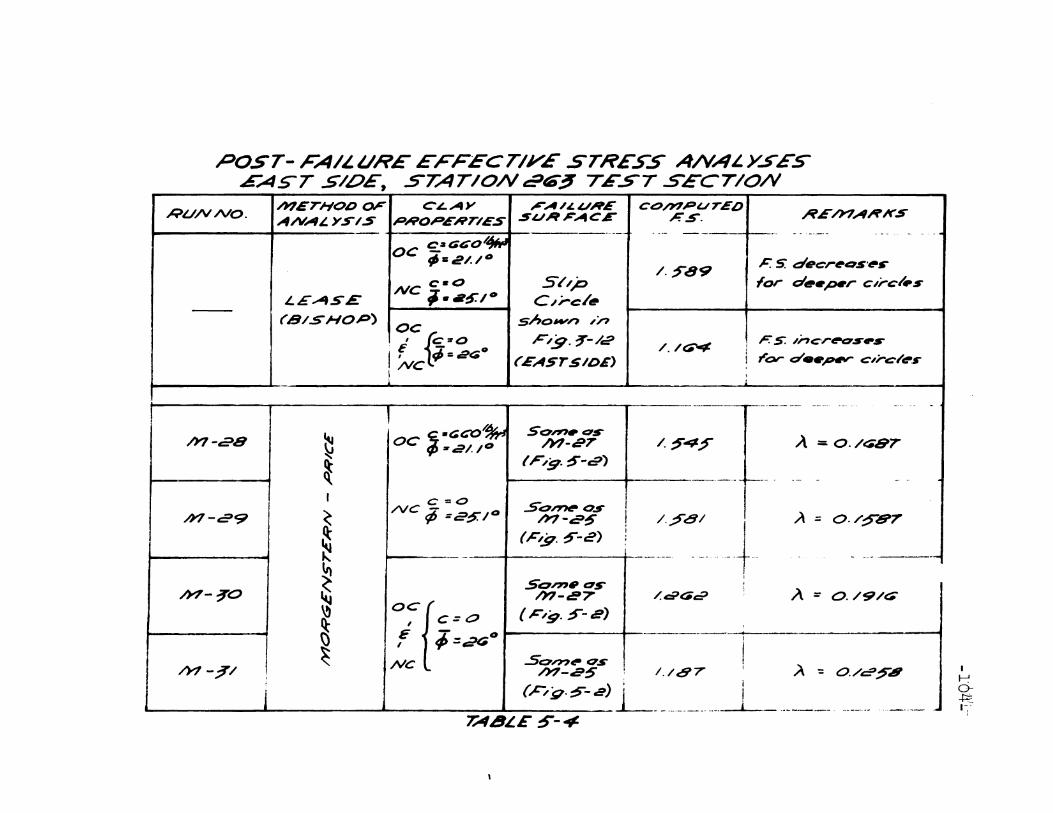
•
POST- FAIL.URE EFFECTIYE STRESS ANALYSESEAST S/DE, STATION e:9t&~ TGST SECTION
AtE/YIARKS
P. s: decr.os·.sfor c:I••ptrr c ~rc/.s
I P:s: /;'cr~s.si Tor d ••ptIV""' <::,rc~trsI
/./~
/.:Y89
. -- -- I -". - - -------
CO/Y7PU TED,I:;'s .
S~'PCtl;-e/~
sholA''' ,;"F/9·~-/~
('EASTS IDG)
c-oNC 1 .•~/ooc
. i [<:.#0I NC1«;6 =2<';°
1
'-E~S£
(B/-SJ-IOP)
RLI./VIVO. METHOD OFl C,AY L:~A.I.£UREI I ANAL. YS/,S'PHOPEHT/ES .suR;-AC~_~
C:aGGO~OC "'=2/./0
7;48LE ~-4
IJ-:I0~....
J
A = 0./<;"87/.~4~
~:8:__ + A = o._/~e7__~
I
/.CJG~ ! 1\ = o. /9/t:#'
Sonn.as/YI-er
(F'9·~-c9)
So~osM-~~
(Flj;. ~-e)
I • .- -+------.. .
c=o/Vc ¢ =2:$:/0
M-C>8
/Y!-C'9
h?-~O
I I IOC ~.c:t:D~ -- ~---" ., 2/. /0 -.. ..
~~
~I
~~~~ SQn7.as~ M-e7
~ o~ ( c::: 0 (.I="'9- ~-e) ,
~ f ~ i =G'G0 --'I
~ NC .sOn7(!8 os/'Y1-?'/ I .. h?-25 : /./87 I A :: O./c.?~8
I ~ t I
. 1 (N9·~-2 L .. 1._~_- .. .. ~ .. _. __..~_ ....
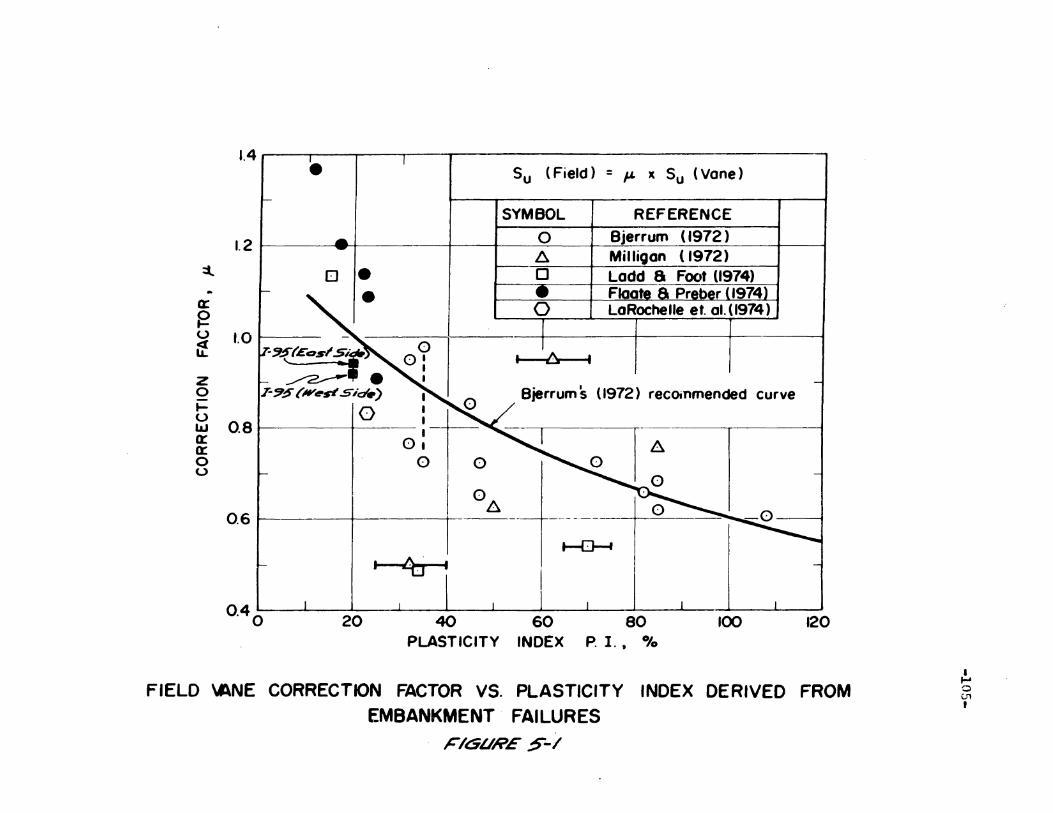
1.4. i i t i --,
e Su ( Field) = JL x Su (Vane)
SYMBOL REFERENCE
8
Bjerrum ( 1972 )Milligan (1972)Ladd 8 Foot (1974)
LaRochelle et. 01.(1974)Flaate 8 Preber (1974
~
o
o8
o
Bjerrum 5 (1972) recOinmended curve
~
t--- I t ---+----- _.- ---~.f-------
1.2
:l I(J ,-
et: I
'" -~u 1.0:. lr"{fEos-':rzr~ -0 .T-'~(~~!ds;o'c-)..- 10u
LtJ 0.80:a:0
~ I0
I0
<..)
08
0.6
II I~
0.40 20 40 60 80
PLASTICITY INDEX P. I., °/0100 120
FIELD \ANE CORRECTION FACTOR VS. PLASTICITY INDEX DERIVED FROMEMBANKMENT FAILURES
FIGURE :!i-I
I....'0U1I
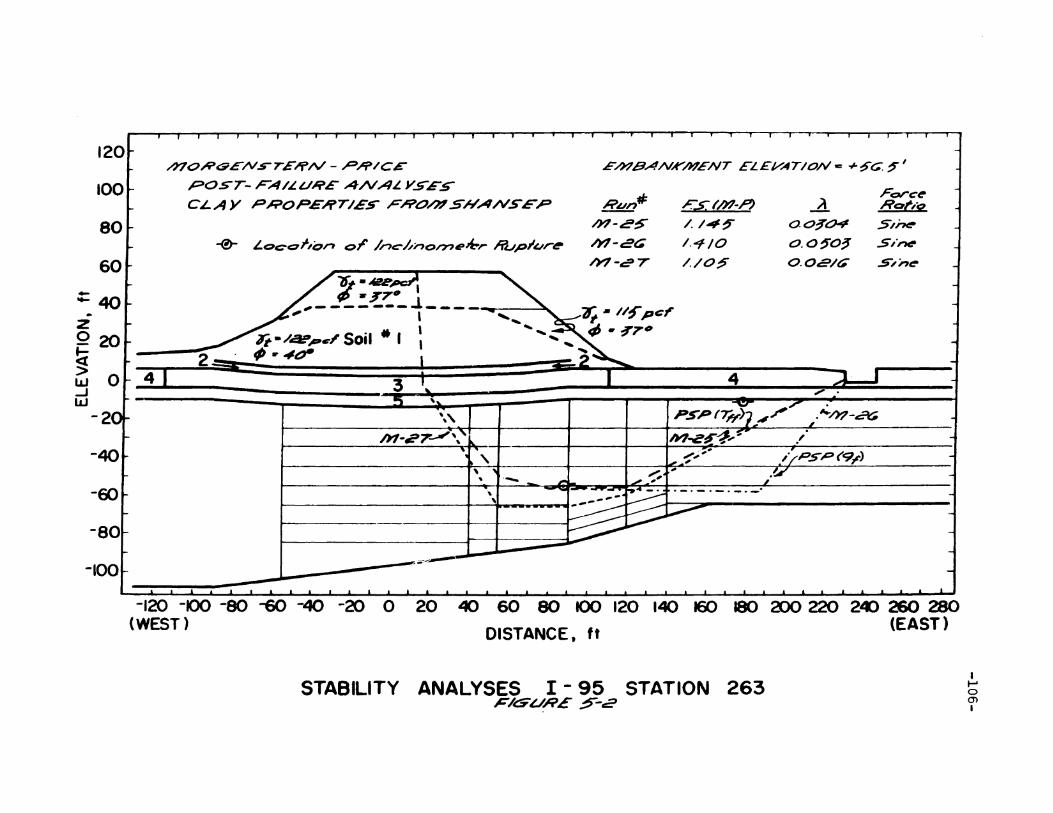
......M-~
.',-/PSP(9,),
E/J?BA/VA"~ENT ELEt/ATIO/v-= +1>~~'
Run#Forc:~
F.s;-f/YI-P) ..Ll Rot'"/YI-e~ /.14~ o.o~~ S/~
/YI-e~ 1.4-/0 O.O~O~ S~'rH!'
h1-c?T /./O~ 0.02/(1 .5"~;'~
",\
'"h'!-t2I7...A' "
-0- L.QcQ!,On or /nt:'h;,on?e~rIilJp/~r~
/J'7oR~EI\/.s-rEIIPA/- r:';?/CE
POST- P-A/LU~EA/VAL Y.5,ES
CLA Y P~OPERTIES F,lPO/J?SNANS£'F'
60
80
120
100
-60
-40
-80
~
-"'40~
z°20.....et t 2-: ~ F -;:::.~ 0 41 '2 i r.......----4----.:L-J-'w
-2
-100
-120 -100 -eo -6() -40 -20 0(WEST)
20 40 60 80 100 120 140 16() 180 200 220 24:> 260 280DISTANCE t ft (EAST)
STABILITY ANALYSES I - 95 STATION 263F/GUHE :!,-,£J
ItooenI
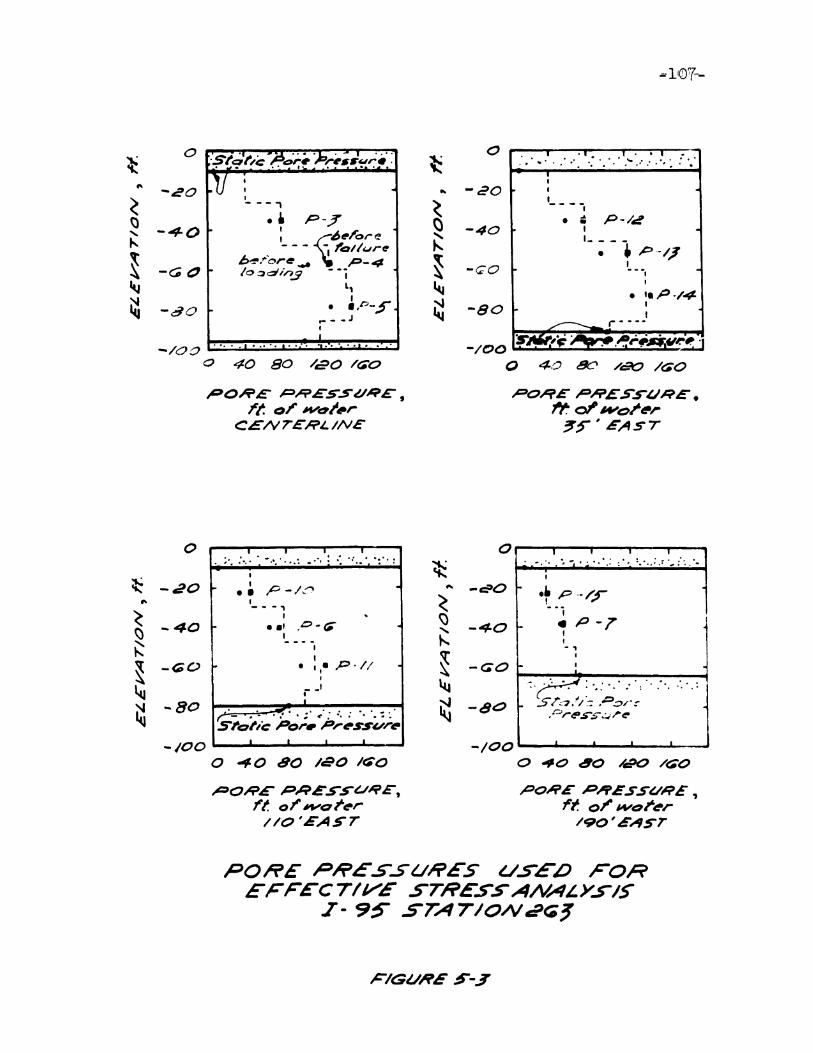
o ......~...-- ..........---................--.~......,.--........' ...... ' ". .:. a •• ' ..... 0' : .'.: .a ".'~
0~
•" -'cO ,
~I---,
~ •• P-f-4-0 I
"-I ~~t!'l"ore~ - - - - l'olliJr~
~h" I
-G t:1~,ro,.~ .... P-4
/0 ~din.9 --i~ L,
~I
-80 • .,p-~... __ J
•..... /00 ' la •••
o 40 80 /C'o /~o
-/00
o
II1- _
I
• , P-/~tI. _
• ~ P-"/~I---,,• '.P·/4,
Ii - ---
. .~;'iJS«fI~t1!. 'J
41:;J 8C:' /ct::' /<:;0
POHE ~;:j'ESSU~E,
rt. oJ' W'elt~,.CEN'TEHJ..INE
,QO~EPHESS-URE.1't: d I+'cr6'r~~6 GAS'
" , , , ,• , a : a,' " - 0.. . . ." ~ • 0" I : .: ••0 ...' .. : '. ~
.. . ... . ... .. .. ... ... .. .. .. : .
·t p ··/r- ..... P-7
f,- ,I,.
".,
o 1 .. ' eo 1 --..:... -.. -. , -- ...:, ..... :", :.... :.': .., ;...... -.
- /00~_.....--I.--------I..........~o 40 40 ~ /t;O
-GO ~
t----....-----......
-40 ~
.
,I• I,· P·II
t
- -'II
I
• ~ P -/~~,- - -,,• _, .o-(#",
-/00 '--__I ...-....Ia..----I. ._~
o .".0 80 leo 11$0
.... 80
~O~E~RES'S-Gl~E,
't. o~IIVQr~r//o'EAsr
PORE PRESSUHE,rf: 01" ""Dr~r
/90'£AST
PORE PRESSURES I../S£.o FOREFFECT///'£ STRESS-ANA~Y.s-IS
J- 9S- STATIONttPf;1
,t/GI./H£ ~-.T
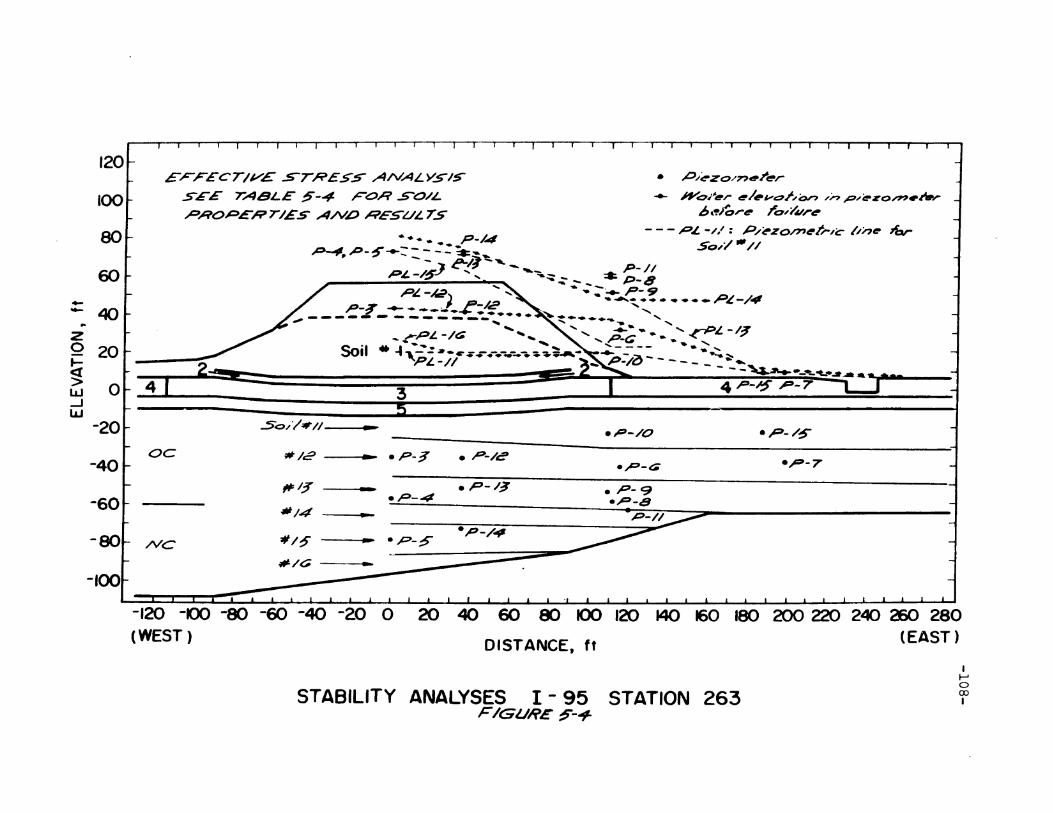
•
• P/~zo/nd'r-~r
.... ~oJ~4!tr ~/~v~;/o", /;, P/~zo,,".liPrb,~~r~ ro,t'vr~
- - - PL -//: P/~zo.rn~rr~c//n~ 1brSO~"/-//
3
•••• P-/4
~.p--S---::-:,:::~j'!:.,_ P_/I
.J.... "'..... - - * P-8P£-/~... --::: P-9 L:J~_/..,"...... -.~ ,.-,p~ -/02) -/2. " ....
--, ----..-~.-•••• ~~"--.-.. .....,-D"' -/.7r- z .... .... _ <.;&. '"
- ---- '......... .... P-C .. 9> ....~PL-/<; .... , .... 9> ..~""---... --- ~oA- - -.::.._____ .....Soil .....,-':a.-r~••-.-.-... '::t_ P-/CJ ~__'"~...... _........ _
PL-/I 4 p_~ P-7
5"0,,·/'-/1.,&:'-/0 ep-/1'
:NIcE' - .p-~ • p-/e·'p-7e"P-G
~/ff ... .P-/~• P-4
.1/1I/4
ep-:s-.p-/-9
~/~ ..#/6
£~FEcrlV'£..s-rRESS A/vALYSIS
SEE TABLE ~-4 r-ORS'O/L
.P.ROPE'~rItEs A/v£) H'ESUL TS
80
120
100
60..-'-40..zo 20I-
~ 01- 4w--Jw
-20
~ oc-40
-60
-80~ NC
-100
DISTANCE, ft
-120 -00 -80 -60 -40 -20 0(WEST)
20 40 60 80 100 120 140 160 180 200 220 240 260 280(EAST)
STABILITY ANALYSES 1-95 STATION 263F /GURE !i--+
If--Io00I
6. CONCLUSIONS-109-
The 1-95 failure study is far from being complete. Large
amounts of valuable data have been obtained and there is more
information to be collected in the field. Nevertheless, several
significant conclusions can be derived from the study presented
in this thesis:
1. The Unconfined Compression and Unconsolidated
Untrained Triaxial tests yield undrained strengths
that are much too low for use in stability analyses in
Boston Blue Clay. The factors of safety computed
from UC and UU strengths are extremely conservative
unless modified by empirical correlations based on
local experience.
2. The field vane shear test is superior to the UC or
UU tests as a strength index test and should be used
for preliminary stability computations whenever feasible
The usefulness of the field vane can be further improved
with the development of more accurate semi-empirical
correlations of the type suggested by Bjerrum (1972) and
shown in figure 2-12. For the 1-95 test embankment
stability prediction based on uncorrected field vane
strengths underestimated the embankment elevation at
failure by only 7.1%. The average field vane correc
tion factor, ~, back calculated from post failure LEASE
analyses was 0.93.
-110-3. SHANSEP yeilded very reasonable stability predictions
for the 1-95 test embankment. The type A prediction over
estimated the elevation at failure by 7.4% and the type C
prediction, for which only the unit weight of the fill was
changed to the in situ value, was only 1.6% over the actual
elevation at failure.
4. The methods of ana.lysis utilized (LEASE and M-P) were
generally satisfactory. However, an improved version of LEASE
with the capability of selecting the correct value of Su
depending on the position along the circular arc, would be
a very worthwhile contribution to the use of computers for the
solution of slope stability problems.
5. Due to the difficulty is working with pore pressures, the
ESA appears to be inferior to the TSA for the undrained stability
analysis of embankments on Boston Blue Clay. Back calculated
pore pressure parameters varied a lot (Chapter 5) and
piezometer data in table 5-3 shows that large changes in
pore pressure occurr during failure making it very difficult
to select a value to input in the ESA.
6. The field instrumentation was not as successful in warning
against impending failure as was expected. The only consistent
but very conservative sign of instability was provided by the
settlement plates. The pore pressure data proved to be an
unreliable indication of impending failure for undrained load
ing on Boston Blue Clay.
In addition to the conclusions mentioned above several
questions remain to be answered:
-111-1. What is the actual failure surface? Based on the
present information the writer believes that the
failure surface is not circular as suggested in
Section 5-2, and that the formation of the large
crack shown in Figs. 1-1 and 3-14 was due to tension
resulting from the shear forces generated along the
bottom at the east toe of the sliding mass.
2. What is the effect of the failure mechanism on the
computed factor of safety? Is a simultaneous failure
to both sides equivalent to two independent failures
to each side? A better understanding of the failure
mechanism could provide some insight into th~
apparent discrespancy between the pre-failure and
post-failure field vane analyses.
In order to completely evaluate the field test ~t would
be necessary to define the failure surface more precisely.
To locate additonal points on the failure surface, several of
the piezometer pipes could be retrieved below the embankment
and between 81-3 and 51-4. In addition, field vane tests
could be performed to locate a zone of low Su since the clay
has a sensitivity of about 3 to 4. However, the field vane data
obtained in this manner will not be easy to evaluate in view of
the very large movements that took place.
•
REFERENCES -112-
1. Bailey, W.A. and Christian, J .T. (1969) "ICES LEASE - I, AProblem - Oriented Language for Slope Stability Analysis" Research Report R69-22, Dept. of Civil Engineering, M.I.T.
2. Bishop, W.A. (1955), "The Use of the Slip Circle in theStability Analysis of Slopes", Geotechnique, Vol. 5,No.4, Dec. 1960, pp. 129-150.
3. Bjerrum, L. (1972), "Discussion Session l'~ Embankments onSoft Ground, Proc. AseE Specialty Conference on Performance of Earth and Earth-Supported Structures,Vol. 2, Purdue University, pp. 1-54.
4. Bromwell, L.G., Ryan, C.R., and Toth, W.E. (1971) "RecordingInclinometer for Measuring Soil Movement", Proc. 4thPanamerican Conference on Soil Mechanics and FoundationEngineering, Vol. 2, San Juan, Puerto Rico, pp. 333-343.
5. D' Appo1onia. O.J., Lambe, T.W. and Poulos, H.G. (1971),"Evaluation of Pore Pressure Beneath an Embankment",ASeE, JSMFD, Vol. 97, No. SM6, pp. 881-897.
6. Duncan, J.M. (1974), Presentation of Prediction, FoundationDeformation Prediction Symposium, M.l.T., Nov., 1974.
7. Flaate, K. and Preber, T. (1974), "Stability ofR·oadEmbankments in Soft Clay", Can. Geot. Journal, Vol. 11, No.1,pp. 78-89.
8. Guertin, J.D. Jr., (1967), "Stability and Settlement Analyses of an Embankment on Clay", S.M. Thesis, Dept. ofCivil Engineeri-.ig, M.I.T.
9. Hawkes W.O. (1975), "L1ndrained Deformation Behavior of Partially Consolidated Boston Blue C~~y-" S.M. Thesis, Dept.of Civil Engineering, M.I.T.
10. Hoeg, K. Andersland, O.B. and Rolfsen, E.N. (1969) "Undrained Behavior of Quick Clay Under Load Test at Asrum" ,Geotechnique, Vol. 19, No.1, March 1969.
11. Kenney, T.e. (1964), "Sea Level Movements and the GeologicHistories of the Post-Glacial Marine Soils at Boston,Nicolet, Ottawa and Oslo", Geotechnique, Vol, 14,pp. 203-230
-113
12. Kirby, R.C. and Lambe, T.W. (1972), "Design of Embankments on Soft Soil", Research Report R72-36, Dept.of Civil Engineering, M.I.T.
13. Ladd, c.c. ·(1971), "Strength Parameters and Stress-StrainBehavior of Saturated Clays" , Research Report R71-23,Dept. of Civil Engineering, M.I.T., Chapter 9.
14. Ladd, c.c. (1975), "Predicted Performance of an Embankmenton Boston Blue Clay" Proc. Foundation DeformationSymposium, M.I.T. (to be published).
15. Lambe, T.W. (1951),Soil Testing for Engineers, John Wileyand Sons, New York, 165 pages.
16. Lambe, T.W., D'Appolonia, D.J., Karlsrud, K. and Kirby,R.C. (1971) "The Performance of the Foundation Undera High Embankment", Research Report F{71-22, Dept.of Civil Engineering, M.I.T.
17. Lambe, T.W. (1973), "Thirteenth Ran-kine Lecture: Predictions in Soil Engineering", Geotechnique, Vol. 23,No.2, June, 1973, pp. 149-202.
18. LaRochelle, P. Trak, B., Travenas, F., and Roy, M. (1974),"Failure of a Test Embankment on a Sensitive Champlain Clay Deposit", Can. Geot. Journal, Vol. 11,No.1, pp. 142-164
19. Litle, A.L. and Price, D.E. (1958), "The Use of an Electronic Computer for Slope Stability Analysis", Geotechnique, Vol. 8, No.3, Sept. 1958, pp. 113-120.
20. Madera, G.A. (1969), "Slope Stability Analysis by Limiting Equilibrium", B.S. Thesis, Dept. of Civil Engineering, M.I.T. 1969.
21. Milligan, V. (1972), "Discussion Session 1, Emban.krnentson Soft Ground", Proc. ASCE Specialty Conf. on Performance of Earth and Earth Supported Structures, Vol.3., Purdue Univ. pp. 41-48.
22. Morgenstern, N.R. and Price, U.E. (1965), "The Analysis ofthe Stability of General Slip Surfaces", Geotechnique,Vol. 15, No.1, March 1965, pp. 79-93.
23. Morgenstern, N.R. and Price, U.E. (1967), "A NumericalMethod for Solving the Equations of Stability ofGeneral Slip Surfaces" rrhe Computer Journal, GreatBritain, Vol. 9, No.4, Feb. 1967, pp. 388-393.
-114-24. Simon, R.M., Ladd, C.C. and Christian, J .T. (1972),
F'inite Element Program FEECON for Undrained Deformation Analyses of Granular Embankments on SoftClay Foundations", Dept. of Civil Engineering Res~arch Report R72-9, M.r.T., 1972.
25. Storch Engineers (1965), "Soils and Foundations Report forInterstate Route 95, Revere-Saugus, Massachusetts",Prepared for Highway Engineers, Inc., Boston, Mass.
26. Whitman, R.V. and Bailey, W.A. (1967) "Use of Computersfor Slope Stability Analysis" AseE JSMFD, Vol. 93,SM4, pp. 475-498.
27. Whittle, J.P. Jr. (1974), "Consolidation Behavior of anEmbankment on Boston Blue Clay", 8M Thesis, Dept.of Civil Engineering, M.I.T.
28. Wissa, A.E.Z. Christian, J.T., Davis, E.H. and Heiberg,S. (1971), "Consolidation at Constant Rate of Strain",ASeE, JSMFD, Vol. 97, SMID, pp. 1393-14J3.
29. Wolfskill, L.A. and Soydemir, C. (1971), "Soil Instrumentation for the I-95 M.I.T.-MDPW Test Ernbankment",Dept.of Civil Engineering Research Report R71-28, M.I.T.
•
APPENDIX A
Morgenstern-Price SHANSEP
Stability Analyses
-115-
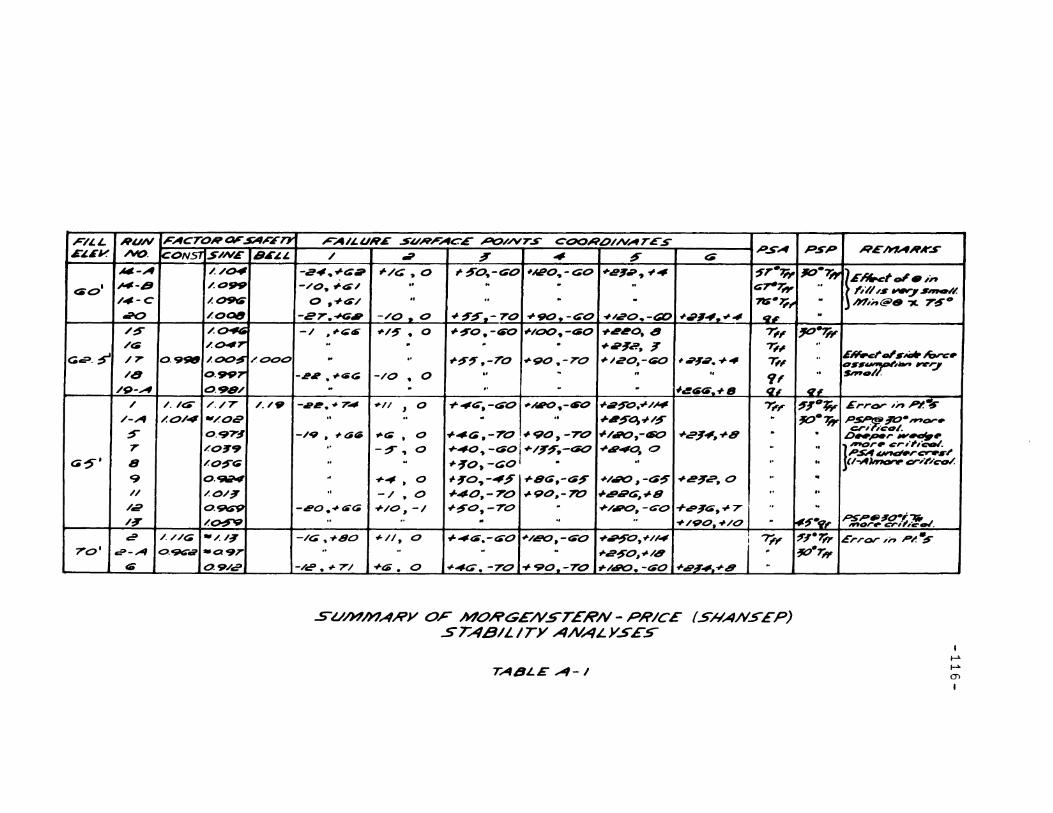
F/~L RUN FACrOR~SA~~" FA/LURE SURFACE ~//Vrs COO,RO/NAT£SPSA PSP R£h'lARKS
E~£V ~. (CON57 S/N£ 8~~~ / .., :' 4 ~ a;
~-A /./~ -24.. ~t:;p "'/6,0 ,.~O~-(;O #/C'O.,-GO ~e~.., .,.- '5'.7;;. ~·T~1£Iiflv:I'oJ• ,,,<60' ~-8 /.oP9 -/0.. #ttS/ .. .. . It cr-7;, ,,'///1 "'-J .I"..~~
/4-C /.09t; o •..,.tS/ " II .. . ?IS-"" h?,;,@6 "X 7~O
;0 ~o~ -e7.~' -/0.0 <t/-~~.-70 ~90" -c:;o .,/,eo. -t:;D #,;'4.... 4 q, ../~ /.~ -/ • ~~di .,./~. 0 ~~O.-tSO "'/OO.. -4S0 +4~O.8 -,;, ~-W/~ /.047 ff .. . .
"""~2, ~ 7;, I'
G.?~ /7 O.9SW /.t::>o:S /.000 .. II.,.~~.-ro ~90 .-70 "'~20J-(;O #;~_.+4 7;, .. £N.c~JINII1' J&,rc.
D"'~bn"''7/8 0.997 -.e,e • ""~G -/0 • 0 II .." ..
if'It Sh'o~.
/9-A 0.98/ .. . .. .. .. "'4tSw.+S q, 'I'/ /. /e:;;- /./7 /. /fi' -I~. '* 74 ~II , 0 +,,~.-wO "'/JiIO,-tSo +_-S-O•..,./~ -r;, ~~oW £',.,-or ,n ~,..
/-A ~O/4 -/Oe' .. tI . .. -J-I:S-o," /§' ..~·W p~~. ""'0'*•
cr, i":O~.~ O.97~ -/9 • "'6($ ...t; • 0 +4(';,-70 1"'"90,-70 ..J-/.ft::),-t60 +2.T"".~8
. . D ..~r.,.~117 ';O~9 I' --;r..,O ,,"40.. -dOOI ~/T~,-dOO ....6~O .. It } 6>Or. C',.,.,,~
PSA~"~"I'G~' 8 ';O-S-tii It ...
""-TO .. -GO •It ,.
" CI-A~er'~;CY:H.
9 O.~.. +4 ) 0 "'~O,-4.? ~8G,-~~ ."./.ti'O # -t:61r "'e~~.o
,. ..// /.O/~ " -/ .0 -1-40.-70 ""90~-70 #ea~~~8
,."
/2 O.~ -eo.-#tSG +/0, -I +~O,-TOII +/JiIO, -t:'O +tt9~e;,~7
t, ..PSP"I~I.../~ ~~
.. .. . f' ff +/90."",/0 II ~::r.¥, "'or~ cr'~,C'~.
c=' /.//G ././~ -/t:; ~+ao oJ-//, 0 ..,..4t6.-t:};"O o#o/4!'O,-t:ii'O "'~O."'//4 I ", ~~.7ff Error,n .P~~70' Ci'-A O.tIfiItt:"Ci' -a97 II ..
""2~O,~/8
~.e'~.+8 I II ~.r"
f6 09/c? -/6£'. ~ 7/ +t'ii • 0 ~4G'. -70 +90.-70 .,./6i"t:'. -('$0 to
.s-Uh?/YIAHY OF MOHGE/vSTEHN-PH/CE (SHAN5EP)STABILITY ANALYSES-
TA8LE A-I
I~
~
mI
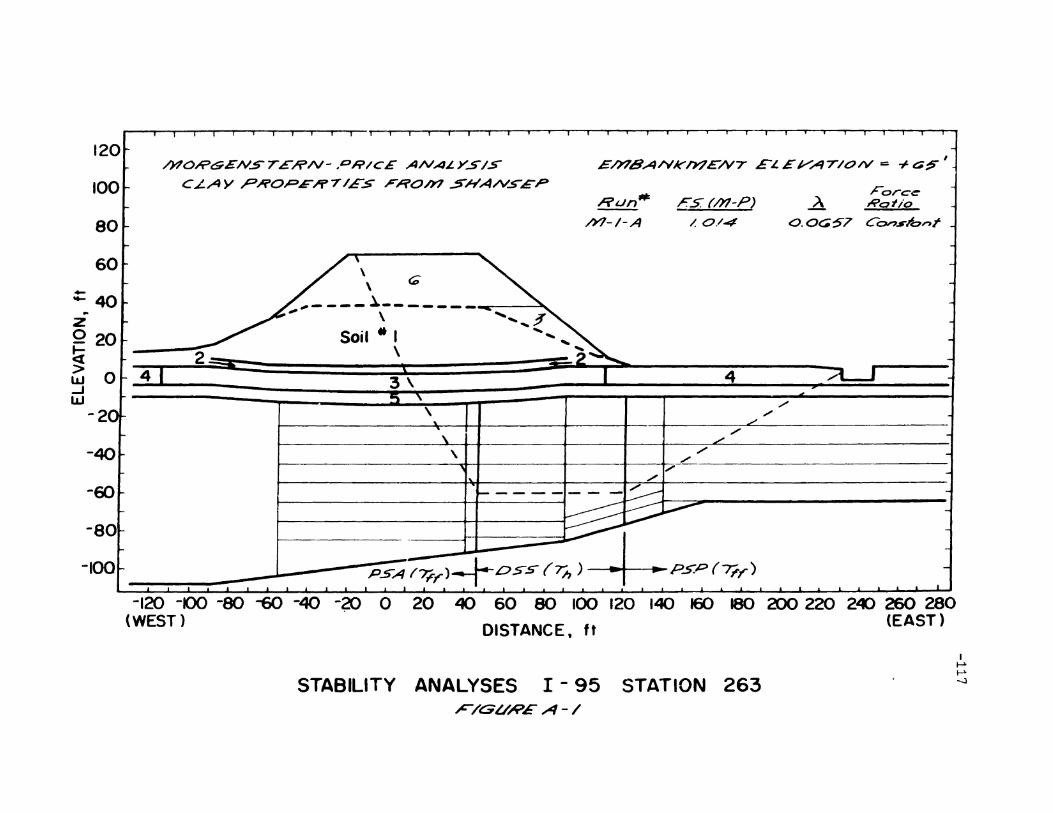
Force.A ,t;'atio
o. OG'57 Consh,.,r
/'.;'
""
4
./
Eh78A/VKM£/V7 EL.£"'AT/O/V ::: ?- G1F I
Run- FS (/YI-P)
h7-/-A /. 0./4
G\\
\
3\
,----~-----------~, \
Soil" I\
I 'aU J L-L//", ----------
2
/YIO/?GEN.srE/?/V- "DR/cE A/\/AL.Y..5IS
CL-AY ,PROPE/lP7/ES F'i'Oh1 Sh'A/V.s-£P
-80
-IOO~ I PSA -(711'">--r-0 ss (7h )~PS:P (7FT)I I , , , , I , , ! , , , , I , 1 t ,
-120 -00 -80 -EiO -40 -20 0 20 40 60 80 100 120 140 160 180 200 220 2«> 260 280(WEST) . DISTANCE. ft (EAST)
120
100
80
60~
'1-40..zo 20~> 01- 4w-Iw
-2
-40
-60
STABILITY ANALYSES I - 95 STATION 263F/~UREA-/
I~
~
~
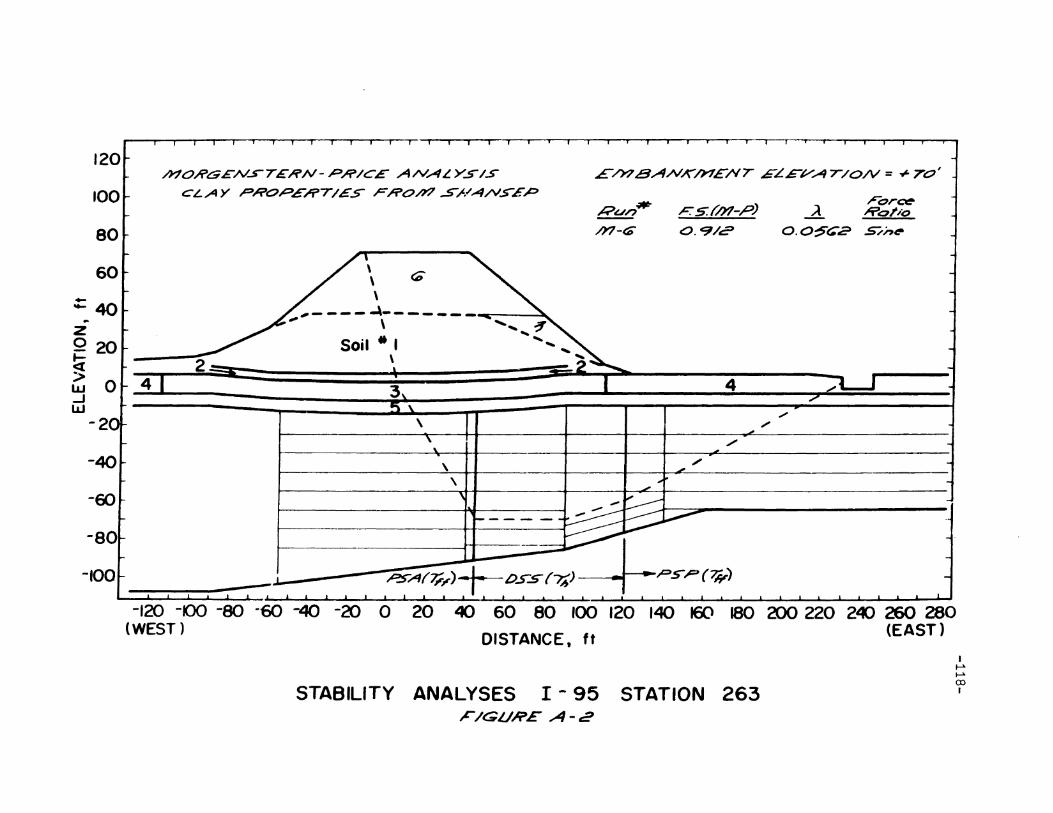
____......~!!!!!II__--.l-..-...lIIIIiH-iill .. 1i
I
For~.Ro}'Jo
S/;,~
.-aO.O~~2
.",",
"""
4
"
FS//YI-p)
O.9/~
Pun'*'/YI-t'$
£/>?BA/VAh7ENT £L~j,/AT/O/V=+70'
~
\
3
,- -- - --'-- ---- -.-.. >, \
Soil • I\
h10/rGEA/.s-T£RN- P/P/CE A/\/ALY5/S
CLAY PROP£';;:''T/ES F;?oH7 -5A./A/V'>£P
-IOO~ ~A(7;.,..)+-O.5"S(7;) ------t--PS.P (-w)• I I I I I I I I I I .L. _ I ... 1 _I. I 1
120
tOO
80
60~
'1-40..z°20I-<[> 01- 4lLJ-Jw
-2
-40
-60
-80
-120 -100 -80 -60 -40 -20 0 20 40 60 80 100 120 140 160 180 200 220 24) 260 280(WEST) DISTANCE, ft (EAST)
STABILITY ANALYSES 1-95 STATION 263F /GUHE A - t:E
If----lr.~
CDI
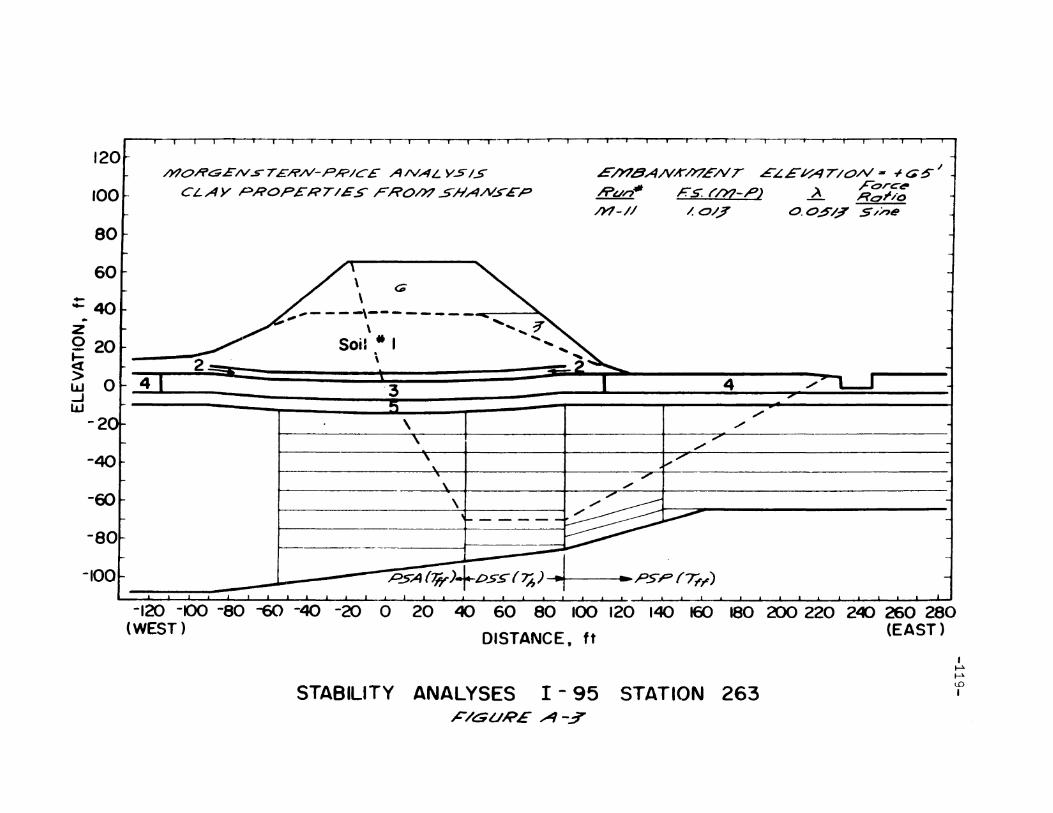
•
\
4
",
",
./
E/Y78A/VKh7ENT .EL£VAT/O/\/-- -I-6S/., Forc~
Run ;::5. rOZ-PJ ~ Ro~/o
h1-// /. 0/; O.O~/.;7 S/ne
G\\
'3
\
Soil" I-\
,,----\-------- .....
/Y70RGE/V..s-7£R/V-P~/C£ A/VAL VS/S
CLAY PROP£RT/£"5 FRO/)? .s#A/V5'EP
120
100
80
60~
'1-40...
zo 20t-«> 01- 4w...Jw
-2
-40
-60
-80
-100
-120 -100 -80 -6() -40 -20 0 20 «> 60 80 100 120 140 160 180 200 220 2«:> 260 280(WEST) DISTANCE. ft (EAST)
STABILITY ANALYSES I - 95 STATION 263,e-/GURE A-.3"
I~
~
lDI
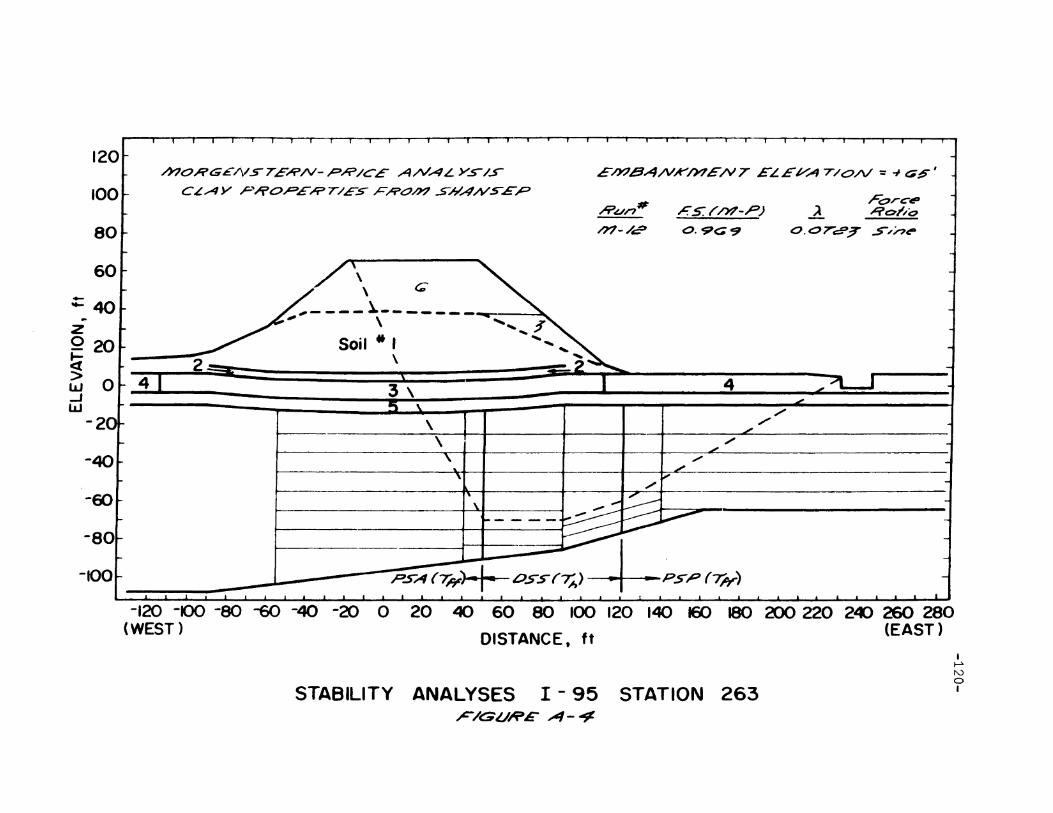
Fort::1!P~ Rol';o
o.or~;r .s-/n~
,/",
",
4
"'"
,&;s: t'/Y/-P)
0.9<;9
~un#
/YI-/~
~/Y.I8A/V.k'h7£NT ELEVA 7/0/\/ = ~ t:;;§'
(;;\\
\\
3 \
,----~------- ., \ ~
Soil" I\
/YIORGE/\/57E;tTI/V- P';>/CE A/\/AL Y.s-/5"
CLAY r'/i'O.PE,I?T/ES FROA'? S"HAA/.s-~~
120
100
80
60....-"'40..z°20~~ 01- 4.Jw
-2
-40
-60
-80
-tOO
-120 -100 -eo -6Q -40 -20 0(WEST)
20 40 60 80 100 120 140 160 180 200 220 24) 260 280DISTANCE, ft (EAST)
STABILITY ANALYSES I - 95 STATION 263F/GURE A-~
I~
~
oI
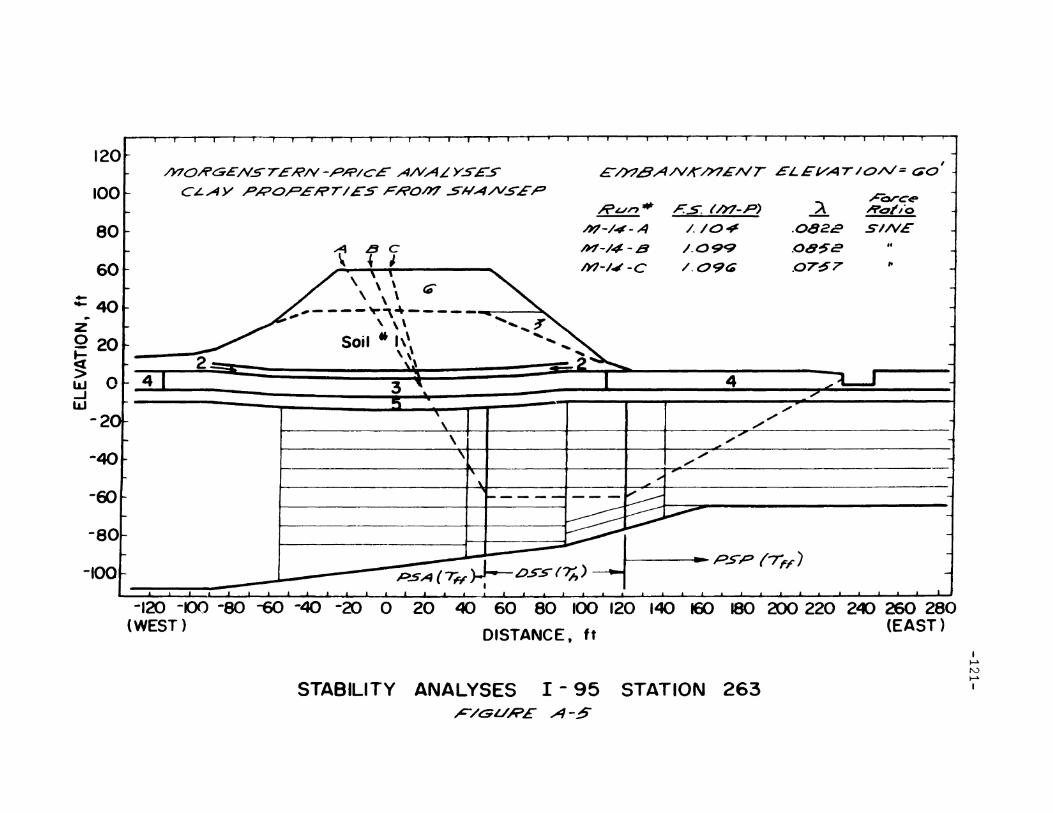
•
""'".",
""
4
lflii'
",",
I
£h7BA/VK'h7£NT EL.EVAT/O/\/= GO
~L/"- ..a ~orc(!!»
Fs: (h7-P) Hol'lo
/Y/-/4- A /./O~ .0822 51/\1£
h'?-/4 -8 /.099 .08~e ../YJ-/J -c /.09(; .07-S7 It
P..sA{7H~.o.5"5(?h)~ I ~ PSP f7i:F)
\
ABC
" , J\ ,\ ~
\ \ \
,----~\~-----~ 3, \ \\
Soil .. 1\'\~
12
/Y70HG£NSTER/V-PA='/cE A/\/ALYSE..5
CLAY p~OPERr/E5r-'f'Oh7 ..5'#A/VSE.P
120
100
80
60~
'1-40..z°20!cl> oJ- 4w-Jw
-2
-40
-60
-80
-100
-120 -100 -80 -6C) -40 -20 0 20 40 60 80 100 120 140 160 180 200 220 241:> 260 280(WEST) DISTANCE, It (EAST)
STABILITY ANALYSES I - 95 STATION 263F/Gl./RE A-S
I~
I\..)
~
I
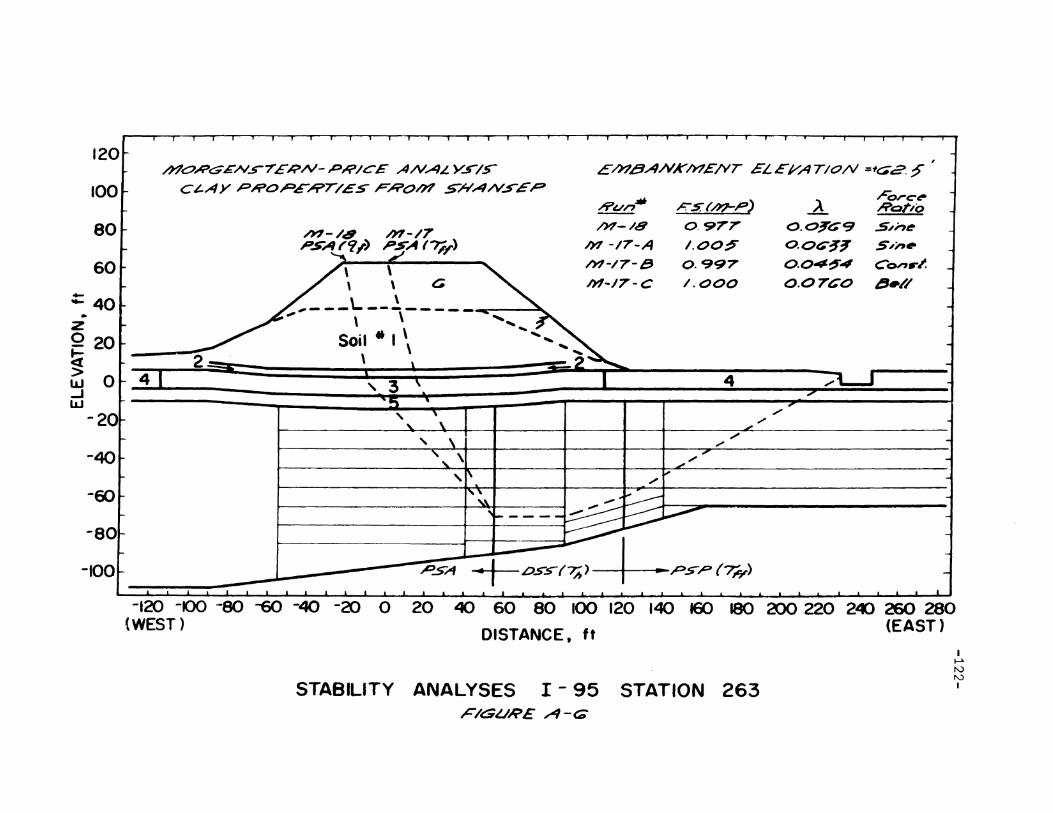
/J?OA'GG/V.s-TE"i>/\/-PH/CE A/vALY.s-/S
C~AY p~O,QE~r/£sr~O/J? Sfi'A/V.s-£,D~orce.RQT/o
.s~;,~
S~n.
Con..~
,!j.//
~O.O~69
O.Ot::~~
O.04~4
0.0 T&'O
";'
"
4
;I'
",
;&:.s:(h?-p)
0.977
1.00:11"
0.997
/.000
Eh7.BANK/YIE/YT £LEJ/AT/ON =162~
~un~
/>?-/8
/YI -17-A
h/-/7-l!!J
M-17-C
/11'7-/8 h7-/7PSAI''l;) PSA (?;y)
, £\ \\ \ G
,---~--~---__~ a
Soil .. I \\ \2
120
100
80
604-
... 40...
zo 20~~ O~ 4-Jw
-2
-40
-60
-80
-100
-120 -100 --eo -6Q -40 -20 0(WEST)
20 40 60 80 100 120 140 160 180 200 220 24:> 260 280DISTANCE, ft (EAST)
STABILITY ANALYSES I - 95 STATION 263F/Gl.I/?E A - G
I~
rvtVI
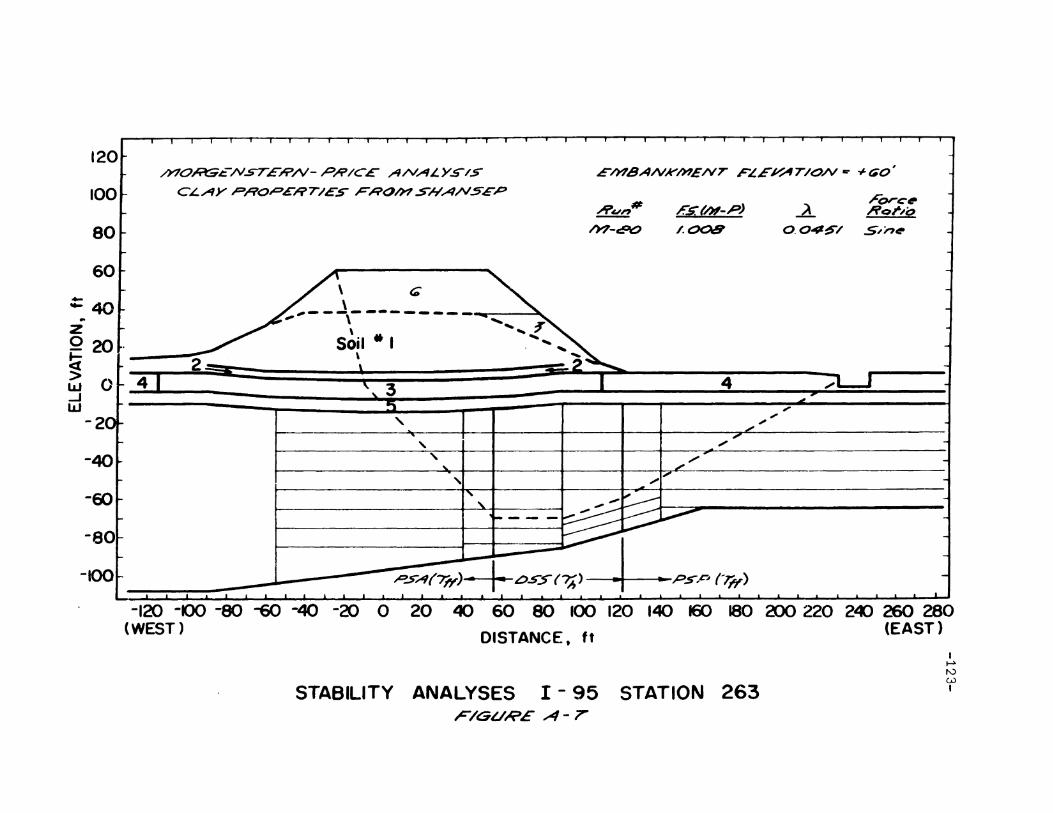
•
F"orC"~Ror~o
.s,"'~
".
...d.O.046~/
".
""
/
4
II"
tFS(/H-p)
/.008
.. .. ps,O (-lj;)
£/Y/8A/VKh?£/VT FLEV,AT/O/\l C" +(;0'
#.Run
/)?-~
~
"
,
"
\
Soil • I\
\,- --\- --------
2
/YIO/it:;;c.-N.sTER/V- PR/C£ A/vALYS/S
CLAY PflOP£197/ES- Fh'Oh? -SNAAISEP
-80
-tOO
120
100
80
60........ 40..zo 20-.!i~ O~ 4....Jw
-2
-40
-60
-120 -100 -eo -6Q -40 -20 0(WEST)
20 40 60 80 100 120 140 160 180 200 220 2«> 260 280DISTANCE. ft (EAST)
STABILITY ANALYSES I - 95 STATION 263F/GURE A-T
I~
rvwI